spectrophotometric and hplc methods for … · hplc vs. spectrophotometric pigment determinations...
TRANSCRIPT
Limnetica, 29 (2): x-xx (2011)Limnetica, 32 (1): 139-158 (2013)c© Asociación Ibérica de Limnología, Madrid. Spain. ISSN: 0213-8409
Spectrophotometric methods for the determination of photosyntheticpigments in stratified lakes: a critical analysis based on comparisonswith HPLC determinations in a model lake
Antonio Picazo, Carlos Rochera, Eduardo Vicente, Maria Rosa Miracle and Antonio Camacho∗
Cavanilles Institute of Biodiversity and Evolutionary Biology & Department of Microbiology and Ecology,University of Valencia, Dr. Moliner 50, E-46100 Burjassot, Valencia, Spain.
∗ Corresponding author: [email protected]
Received: 5/11/12 Accepted: 25/2/13
ABSTRACT
Spectrophotometric methods for the determination of photosynthetic pigments in stratified lakes: a critical analysisbased on comparisons with HPLC determinations in a model lake
High-performance liquid chromatography (HPLC) is an accurate method for photosynthetic pigment analysis; however,spectrophotometric equations are also frequently used for pigment quantification in aquatic systems. Here, we present acritical analysis of the most-used spectrophotometric equations by comparing the results obtained using these equationswith unambiguous HPLC determinations. The study was performed in Lake La Cruz (central Spain). In this meromicticlake with strong thermal stratification, photosynthetic populations occur in different, vertically stratified layers. Eukaryoticalgae and picocyanobacteria are mostly located in oxic layers, whereas purple sulphur bacteria grow at the oxic-anoxicinterface and below, and green sulphur bacteria occur primarily in deeper anoxic layers. This broad diversity of photosyntheticmicroorganisms involves a complex mixture of photosynthetic pigments that often exhibit overlapping absorption spectra. Wetested spectrophotometric equations using samples that represented the entire range of spatial and temporal variability of thelake. For chlorophyll-a, the best correlations with all tested equations were observed for oxic layers. Regardless of wherethe sample was obtained, the best fit for chlorophyll-a was produced by the equation of Overmann & Tilzer, which isspecifically designed to handle mixtures of chlorophyll-a and bacteriochlorophyll-d from green sulphur bacteria. Trichromaticequations for determining chlorophyll-b and -c exhibited strong interferences in anoxic waters, whereas in the upper layers ofthe lake, concentrations of these pigments were usually below the detection limit, restricting the use of these equations.The equations of Takahashi & Ichimura for bacterial pigments slightly overestimated both bacteriochlorophyll-a and -dby approximately 10 % and underestimated bacteriochlorophyll-c by nearly 23 %, although for bacteriochlorophyll-d, thecorrelation was better than those obtained using the dichromatic equations of Parkin & Brock and Overmann & Tilzer,respectively. Total carotenoid abundance can be assessed with the equation designed for this purpose by Strickland & Parsons(1972); however, the accuracy of the results differs with depth and is strongly biased by the presence of the bacterial carotenoidokenone. On the other hand, dual-wavelength carotenoid-to-chlorophyll-a ratios (430/665 and 480/665) only producedacceptable results in the epilimnion, with the occurrence of the bacterial carotenoid okenone in the microaerobic and anoxiclayers again producing significant interference. Additionally, the wide variation with depth of the carotenoid compositionundermined the validity of these dual-wavelength ratios. In conclusion, our findings indicate that a complete and unambiguousstudy of photosynthetic pigments in highly stratified lakes with overlapping populations of phototrophic microorganismsrequires the use of HPLC techniques. Anyway, our results demonstrate that chlorophyll-a and bacteriochlorophyll-a and -dcan be directly measured in oxic and anoxic layers, respectively, using spectrophotometric methods with an error lower than10 %. However, according to our results, chlorophyll-b and -c and bacteriochlorophyll-c cannot be accurately estimated byspectrophotometric methods in stratified lakes.
Key words: Stratified lakes, photosynthetic pigments, chlorophylls, bacteriochlorophylls, spectrophotometry, high perfor-mance liquid chromatography (HPLC), phytoplankton, photosynthetic bacteria.
14665 Limnetica 32(1), pàgina 139, 18/05/2013
140 Picazo et al.
RESUMEN
Determinación de pigmentos fotosintéticos por métodos espectrofotométricos en lagos estratificados: un análisis críticobasado en la comparación con determinaciones por HPLC en un lago modelo
La cromatografía líquida de alta eficacia (HPLC) es un método preciso para el análisis de pigmentos fotosintéticos, sin em-bargo las ecuaciones espectrofotométricas todavía se usan frecuentemente en sistemas acuáticos. En este trabajo mostramosun análisis crítico de algunas de estas ecuaciones comparando los resultados obtenidos con las determinaciones más precisasrealizadas por HPLC. El estudio se realizó tomando como modelo la Laguna de La Cruz (centro de España). En este lagomeromíctico, que además presenta una fuerte estratificación térmica estival, las poblaciones de microorganismos fotosintéti-cos se sitúan verticalmente estratificadas en diferentes capas. Mientras que las algas eucariotas y las picocianobacterias selocalizan en las capas óxicas, las bacterias púrpuras del azufre crecen en la interfase óxico-anóxica y por debajo de esta ylas bacterias verdes del azufre se localizan en capas anóxicas más profundas. Esta amplia diversidad de microorganismosfotosintéticos implica una compleja mezcla de pigmentos fotosintéticos en los extractos, los cuales a menudo muestran espec-tros de absorción que se superponen. Hemos ensayado las ecuaciones espectrofotométricas con muestras que abarcan todala variabilidad espacial y temporal del lago. Para la clorofila-a encontramos buenas correlaciones en las capas óxicas pa-ra la mayoría de las ecuaciones ensayadas. Sin embargo, la ecuación que mejor funciona en general para la determinaciónde la concentración de clorofila-a, independientemente del origen de la muestra, es la dada por Overmann & Tilzer, que estádiseñada específicamente para mezclas de clorofila-a con bacterioclorofila-d de bacterias verdes del azufre. Las ecuacionestricromáticas para la determinación de clorofila-b y c presentaron fuertes interferencias en aguas anóxicas, mientras queen las capas superiores del lago las concentraciones se encontraron normalmente por debajo del límite de detección, loque restringía la posibilidad de uso de estas ecuaciones. Las ecuaciones de Takahashi & Ichimura (1970) para pigmentosbacterianos sobreestimaban tanto la concentración de bacterioclorofila-a como la d, aproximadamente en un 10 %, y subes-timaban la concentración de bacterioclorofila-c casi en un 23 %; si bien para la determinación de bacterioclorofila-d lacorrelación fue mejor que la obtenida por las ecuaciones dicromáticas de Parkin & Brock y de Overmann & Tilzer. La abun-dancia de carotenos totales puede ser estimada por la ecuación de Strickland & Parsons (1972) diseñada para este propósito,sin embargo la precisión en los resultados difiere con la profundidad y se ve tremendamente sesgada por la presencia delcaroteno bacteriano okenona. Por otro lado, las relaciones caroteno/clorofila-a basada en medidas a doble longitud de onda(430/665 y 480/665) solo mostraban resultados aceptables en el epilimnion, ya que en otras capas la aparición de carotenosbacterianos como la okenona produce interferencias significativas. Además, la gran variación en profundidad de la composi-ción de carotenos socava la validez de estas relaciones fundamentadas en medidas a doble longitud de onda. En conclusión,nuestros resultados indican que el estudio de los pigmentos fotosintéticos completo y sin ambigüedades en lagos fuertementeestratificados y con solapamiento de sus poblaciones de organismos fototróficos requiere del uso de HPLC. Sin embargo, nues-tros resultados también demuestran que las concentraciones de clorofila-a y bacterioclorofila-a y d pueden ser directamentemedidas, tanto en profundidades óxicas como anóxicas, usando ecuaciones espectrofotométricas con un error inferior a un10 %. Por el contrario, de acuerdo con nuestros resultados ni la concentración de clorofila-b y c, ni la de bacterioclorofila-cpueden ser estimadas con precisión por métodos espectrofotométricos en lagos estratificados.
Palabras clave: Lagos estratificados, pigmentos fotosintéticos, clorofilas, bacterioclorofilas, espectrofotometría, cro-matografía líquida de alta eficacia (HPLC), fitoplancton, bacterias fotosintéticas.
INTRODUCTION
Since the early days of research in limnology, thecorrect quantification of photosynthetic pigmentshas been a topic of great interest. For manyyears, spectrophotometric methods were the onlymethods available for pigment quantificationand were an important concern in limnology.Despite the more recent appearance of chro-matographic techniques (High PerformanceLiquid Chromatography-HPLC) for quantify-ing pigments, it seems advisable to continueusing spectroscopic techniques and use chro-
matographic techniques to calibrate previouslyobtained results. Questions related to the bestmethods for quantifying pigments have beenraised for a long time, primarily in seawater andin non-stratified systems (Murray et al., 1986;Salinas, 1988; Pinckney et al., 1994; Latasa etal., 1996; Mantoura et al., 1997; Dos Santoset al., 2003; Ritchie, 2008; Jodłowska & Latała,2011). However, there is a lack of informationfor highly stratified systems with a complexmixture of photosynthetic organisms in thevertical profile and marked seasonal changes inthose organisms’ relative abundances.
14665 Limnetica 32(1), pàgina 140, 18/05/2013
HPLC vs. spectrophotometric pigment determinations 141
Conventionally, limnological studies use chlo-rophyll-a concentration, the analysis of whichis faster than cell counting procedures, to es-timate phytoplankton biomass and/or primaryproductivity. Chlorophyll-a concentration is alsoa common and reliable indicator of water qualityand trophic status used in management routines.The analytical differentiation of photosyntheticpigments is valuable for elucidating the compo-sition of phytoplankton communities becausesome pigments are chemotaxonomic biomark-ers (Wright & Jeffrey, 2006). In this context,chlorophyll-a is a universal marker of phyto-plankton abundance, but chlorophyll-b and -c canbe good indicators of the abundance of specificalgal groups such as chlorophytes or bacillario-phytes/chrysophytes, respectively. Accordingly,chlorophyll b/a and c/a ratios have been sug-gested as proxies of the relative dominance ofthese algal groups (MacLulich, 1986). In anoxicwaters such as the anoxic hypolimnion of stratifiedlakes and reservoirs or the monimolimnion ofmeromictic lakes, it is also possible to assess the
biomass and structure of the photosynthetic bac-terial community through the quantification ofthe different bacteriochlorophylls. Furthermore,the total or relative concentration of carotenoids haslong been used to investigate the physiologicalcondition of phytoplankton populations, whichmay vary depending on light conditions (Jodłowska& Latała, 2011) or nutrient availability (Shimu-ra & Fujita, 1975). In this context, the carotenoid-to-chlorophyll-a ratio has been proposed as ameasure of the accumulation of fatty acids infreshwater microalgae, which co-occurs with ni-trogen starvation or light stress (Solovchenko etal., 2009). These simple relationships among pig-ments can thus be considered as tentative proxiesof the physiological status of algal populations,with results that are more practical than thoseof more complex and expensive approaches.
The spectrophotometric methods for quan-tifying photosynthetic pigments in samplescontaining pigments from different sourcesare based on conventional visible absorbancemeasurements of organic extracts. In this case,
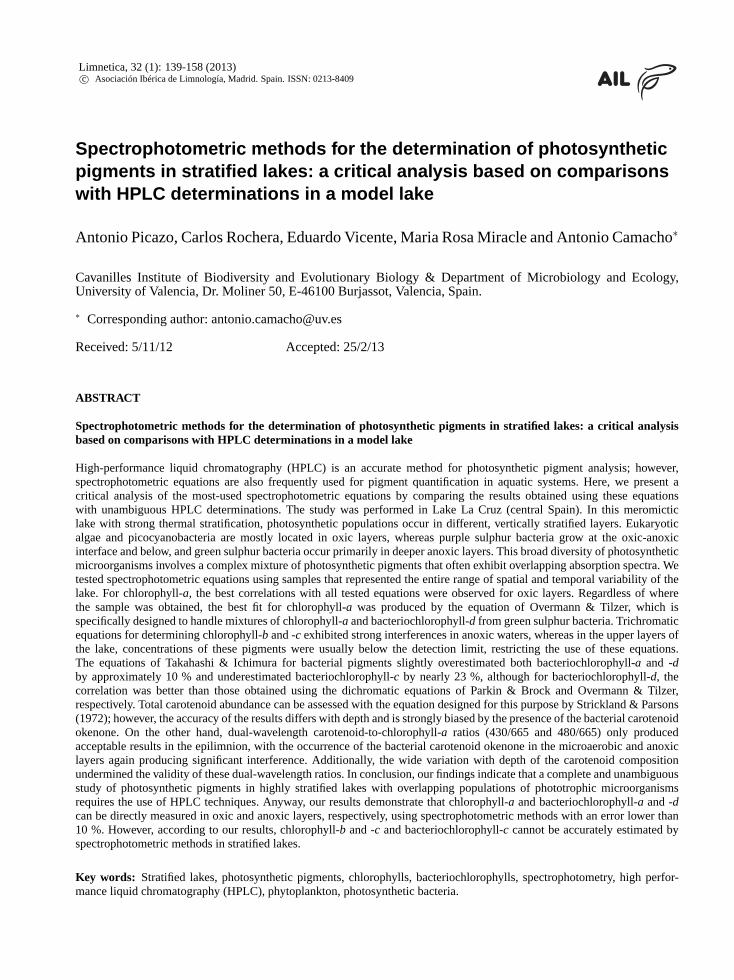
Figure 1. Summary of citations, by year of publication, of the most-used equations in the spectrophotometric determination of thephotosynthetic pigments that were tested in our study (source: ISI -Thomson Reuters, Web of Knowledge). The equations proposedby Parsons & Strickland (1963) are most commonly cited as Strickland & Parsons (1972) from their Seawater Analysis Manual,and consequently, the number of citations in ISI-WOK under represents their usage. Note the differences in scale for the number ofcitations. Informe de citas, por año de publicación, de los métodos de cálculo más utilizados en la determinación espectrofotométricade pigmentos fotosintéticos y analizados en este estudio (fuente: ISI-Thomson Reuters, Web of Knowledge). Las ecuaciones de Parsons& Strickland (1963) se citan normalmente refiriendo el manual de análisis de aguas marinas de Strickland & Parsons (1972), por loque los datos de la cita del artículo de 1963 obtenido del ISI-WOK estarían subestimando el uso real de estas ecuaciones. Nótese lasdiferentes escalas para el número de citaciones.
14665 Limnetica 32(1), pàgina 141, 18/05/2013
142 Picazo et al.
pigments can be extracted from cells using differ-ent organic solvents such as acetone, methanol,ethanol, diethyl ether, dimethyl sulfoxide(DMSO) or dimethyl formamide (DMF). Ace-tone is probably the most-used solvent (Ritchie,2006), as it produces sharper absorption peakscompared to other solvents. On the other hand,it is more volatile and flammable than othersolvents. Acetone is also considered to be lessefficient at extracting pigments compared toother solvents (Ritchie, 2006); however, pigmentrecovery can be improved in different ways, suchas by using sonication (Schagerl & Künzl, 2007).
The methods used for pigment quantificationvary in accuracy and cost-effectiveness. Quan-tification by HPLC allows the discriminationof chlorophyll, its derivatives and carotenoids(Mantoura & Llewellyn, 1983). HPLC further
improves the pigment detection limit in com-parison to other methods, but also requires theuse of expensive instruments and the need forcertain technical capabilities for data process-ing. By contrast, the direct spectrophotometricquantification of samples containing a mixtureof pigments is more affordable and widely usedtoday (Fig. 1). A standardised HPLC protocolfor photosynthetic pigment determination hasalready been compiled in the 21st edition ofthe APHA Standard Methods (2005). However, themanagement agencies responsible for controllingwater quality, such as the US EPA in its Method447.0 (Arar, 1997), still recommend spectropho-tometric methods, for instance, that of Jeffrey& Humphrey (1975). The direct spectrophoto-metric quantification of a mixture of pigmentsrequires the use of equations that utilise molar
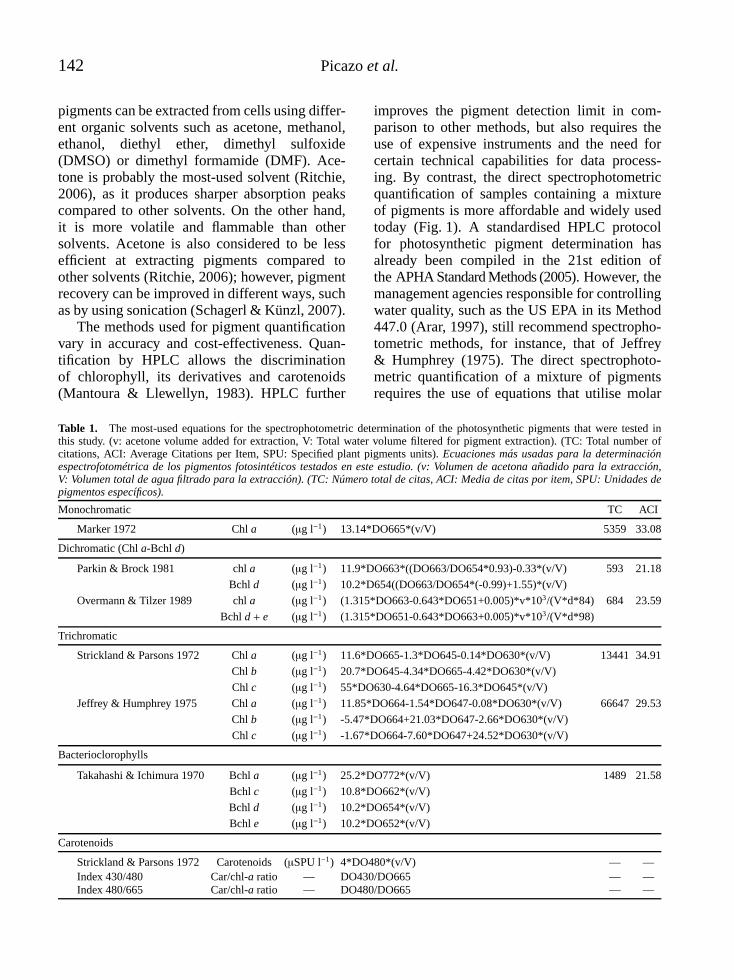
Table 1. The most-used equations for the spectrophotometric determination of the photosynthetic pigments that were tested inthis study. (v: acetone volume added for extraction, V: Total water volume filtered for pigment extraction). (TC: Total number ofcitations, ACI: Average Citations per Item, SPU: Specified plant pigments units). Ecuaciones más usadas para la determinaciónespectrofotométrica de los pigmentos fotosintéticos testados en este estudio. (v: Volumen de acetona añadido para la extracción,V: Volumen total de agua filtrado para la extracción). (TC: Número total de citas, ACI: Media de citas por item, SPU: Unidades depigmentos específicos).
Monochromatic TC ACI
Marker 1972 Chl a (µg l−1) 13.14*DO665*(v/V) 5359 33.08
Dichromatic (Chl a-Bchl d)
Parkin & Brock 1981 chl a (µg l−1) 11.9*DO663*((DO663/DO654*0.93)-0.33*(v/V) 593 21.18
Bchl d (µg l−1) 10.2*D654((DO663/DO654*(-0.99)+1.55)*(v/V)
Overmann & Tilzer 1989 chl a (µg l−1) (1.315*DO663-0.643*DO651+0.005)*v*103/(V*d*84) 684 23.59
Bchl d + e (µg l−1) (1.315*DO651-0.643*DO663+0.005)*v*103/(V*d*98)
Trichromatic
Strickland & Parsons 1972 Chl a (µg l−1) 11.6*DO665-1.3*DO645-0.14*DO630*(v/V) 13441 34.91
Chl b (µg l−1) 20.7*DO645-4.34*DO665-4.42*DO630*(v/V)
Chl c (µg l−1) 55*DO630-4.64*DO665-16.3*DO645*(v/V)
Jeffrey & Humphrey 1975 Chl a (µg l−1) 11.85*DO664-1.54*DO647-0.08*DO630*(v/V) 66647 29.53
Chl b (µg l−1) -5.47*DO664+21.03*DO647-2.66*DO630*(v/V)
Chl c (µg l−1) -1.67*DO664-7.60*DO647+24.52*DO630*(v/V)
Bacterioclorophylls
Takahashi & Ichimura 1970 Bchl a (µg l−1) 25.2*DO772*(v/V) 1489 21.58
Bchl c (µg l−1) 10.8*DO662*(v/V)
Bchl d (µg l−1) 10.2*DO654*(v/V)
Bchl e (µg l−1) 10.2*DO652*(v/V)
Carotenoids
Strickland & Parsons 1972 Carotenoids (µSPU l−1) 4*DO480*(v/V) — —Index 430/480 Car/chl-a ratio — DO430/DO665 — —Index 480/665 Car/chl-a ratio — DO480/DO665 — —
14665 Limnetica 32(1), pàgina 142, 18/05/2013
HPLC vs. spectrophotometric pigment determinations 143
extinction coefficients for each specific pigment(Table 1). These equations may use only oneextinction coefficient (i.e., monochromatic) orinclude several coefficients to minimise theinterference produced by overlapping absorptionspectra (i.e., trichromatic). Spectrophotometricanalyses may yield divergent results depending onwhich equation is used (Mantoura et al., 1997).
Stratified lakes and reservoirs presentingoxic-anoxic interfaces support plankton commu-nities whose composition can notably differ inits content of photosynthetic pigments (Steen-bergen & Korthals 1982). Furthermore, thespatial distributions of different groups of thesediverse phototrophs usually overlap within thewater column (Miracle et al., 1992, Camachoet al., 2001). In deeper water, anoxia and thecharacteristics of the light that penetrates togreater depths in these lakes allow the devel-opment of photosynthetic bacterial populations(Takahashi & Ichimura, 1970), which coexistwith settled senescent epilimnetic phytoplanktonand unicellular picocyanobacteria, forming deep
chlorophyll maxima. All of these factors increasethe pigment complexity of samples, thus intensi-fying the previously addressed impreciseness ofspectrophotometric measures (Stal et al., 1984).
The strength and suitability of some spec-trophotometric algorithms in stratified lakes areconsidered in this study by challenging the re-sults obtained with spectrophotometric equationswith reliable quantifications performed on chro-matographically isolated pigments. The studywas conducted with samples from meromic-tic Lake La Cruz, situated in central Spain,which was selected as a model lake becauseit presents the most possible combinations ofoverlapping microorganisms within its differentvertical gradients. In addition to its permanentmonimolimnion, this lake annually developsa strong thermal stratification and a relativelycomplex distribution of different photosyntheticmicroorganisms along its vertical profile. Fromthe results of this analysis, we provide recom-mendations to be considered before undertakinglimnological studies in this type of multi-layered
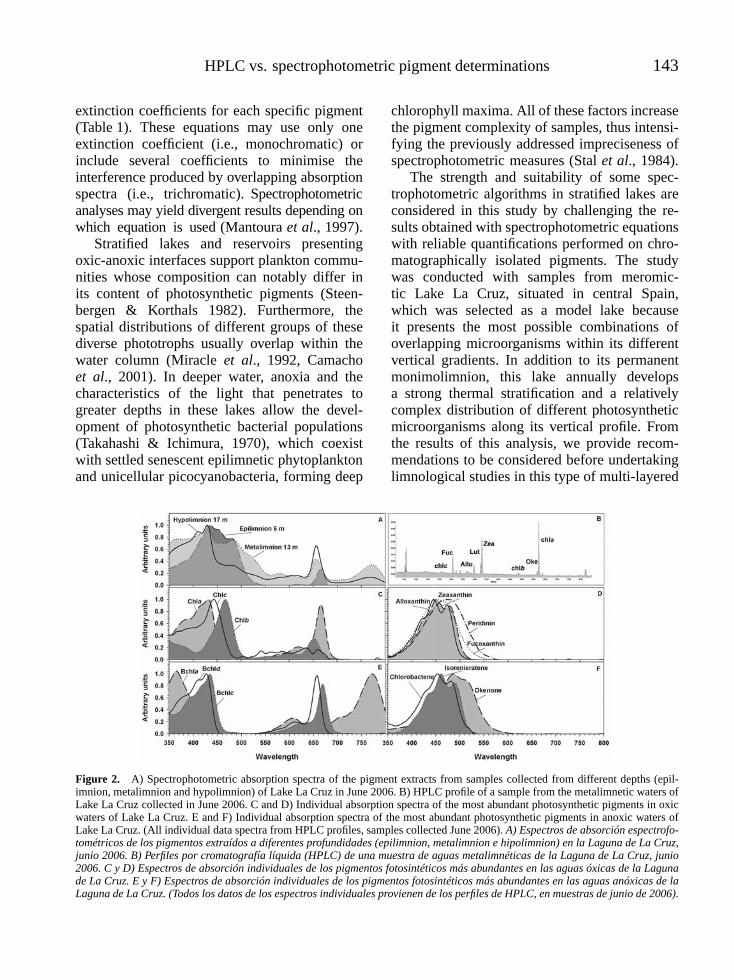
Figure 2. A) Spectrophotometric absorption spectra of the pigment extracts from samples collected from different depths (epil-imnion, metalimnion and hypolimnion) of Lake La Cruz in June 2006. B) HPLC profile of a sample from the metalimnetic waters ofLake La Cruz collected in June 2006. C and D) Individual absorption spectra of the most abundant photosynthetic pigments in oxicwaters of Lake La Cruz. E and F) Individual absorption spectra of the most abundant photosynthetic pigments in anoxic waters ofLake La Cruz. (All individual data spectra from HPLC profiles, samples collected June 2006). A) Espectros de absorción espectrofo-tométricos de los pigmentos extraídos a diferentes profundidades (epilimnion, metalimnion e hipolimnion) en la Laguna de La Cruz,junio 2006. B) Perfiles por cromatografía líquida (HPLC) de una muestra de aguas metalimnéticas de la Laguna de La Cruz, junio2006. C y D) Espectros de absorción individuales de los pigmentos fotosintéticos más abundantes en las aguas óxicas de la Lagunade La Cruz. E y F) Espectros de absorción individuales de los pigmentos fotosintéticos más abundantes en las aguas anóxicas de laLaguna de La Cruz. (Todos los datos de los espectros individuales provienen de los perfiles de HPLC, en muestras de junio de 2006).
14665 Limnetica 32(1), pàgina 143, 18/05/2013
144 Picazo et al.
and complex freshwater environment, attemptingto establish the particular trade-offs that canoccur when using these equations. In this sense,our study aims to facilitate the selection ofsimple spectrophotometric methods in stratifiedwater columns when the application of more ex-pensive procedures such as HPLC is not suitable,primarily by considering that spectrophotomet-ric methods are the most common means ofobtaining certain key limnological data.
METHODS
Study site
Samples for pigment analysis were collectedfrom Lake La Cruz, a meromictic karstic lakesituated in a doline in Cañada del Hoyo (Cuenca,central Spain) (UTM 30 X596163 Y4427009,datum WGS84) with a surface area of 10,100 m2
and a maximum depth of 21 meters. This lakeexhibits a strong thermal stratification thatdevelops each year between April and Octo-ber (Camacho et al. 2003) and a permanentlyanoxic monimolimnion (Vicente & Miracle,1988; Rodrigo et al., 2000, 2001). The watersamples were obtained following the proceduresdescribed in Miracle et al. (1992). The samplesused for the study correspond to 12 limnologicalsurveys conducted between December 2005 andJanuary 2007 and include a total of 235 samplesobtained throughout the vertical profile, 144 and 91from oxic and anoxic layers, respectively (Fig. 2).
Pigment extraction procedure
For pigment extraction, the seston was recoveredby filtering water from each depth layer throughGF/F filters (Whatman 47 mm). After that, thefilters were placed on corning tubes containing5 ml of 90 % acetone (modified from Strick-land & Parsons 1972). To facilitate the extrac-tion, samples were sonicated several times. Sam-ples were later stored at −20 ◦C in the dark forat least 8 hours. After this, the tubes were cen-trifuged (3000× g for 10 min) and the pellet dis-carded. The supernatant was then filtered onto
PTFE 0.2 µm filters (VWR) and processed withinthe following 3 hours. The spectrophotometricand HPLC determinations were made in parallelwith two aliquots from the same extract.
Pigment determination byVIS-spectrophotometry
Spectrophotometric measurements were per-formed with 2 ml of filtered extract in 1 cmquartz cuvettes using a Beckman DU-7 UV-Visible spectrophotometer. The scan spectrafrom 350 to 900 nm, with a resolution of0.5 nm, were digitally recorded and processed.The concentrations of different photosyntheticpigments were obtained using the algorithmscompiled in Table 1.
Pigment determination via high-performanceliquid chromatography (HPLC)
To analyse pigment composition using HPLC, a150 µl aliquot of each extract was injected intoa Waters HPLC system with a Waters 996 pho-todiode Array Detector. To improve the separa-tion of pigments, before injection, the aliquotswere mixed with a volume of ammonium ac-etate (ion pairing agent) to reach a final con-centration of 0.1 mM. The system was equippedwith two columns (Spherisorb S5 ODS2) work-ing in series and running for 95 min at 35 ◦C ina methanol/ammonium acetate/acetone gradientmodified from Pinckney et al. 1996 to improveseparation (see gradient in Table 2). Eluted pig-ments were detected by a photodiode array de-tector at a range of absorbance of 380–800 nm.The peak identities were determined by compar-ing the retention times and spectra with eitherpure standards purchased from DHI R© or chro-matograms acquired from pure algal or sulphurbacterial cultures. The pigment concentrationswere obtained from the curves made with thestandards by integrating the area under the cross-section at the wavelength of maximum absorp-tion of each pigment. In all cases, linear correla-tions were measured with the intercept forced tozero. For some algae carotenoids and all bacte-rial pigments, concentrations were calculated us-
14665 Limnetica 32(1), pàgina 144, 18/05/2013
HPLC vs. spectrophotometric pigment determinations 145
Table 2. Solvent gradient applied for HPLC measurements (after Pinckney et al., 1996). Gradientes de los diferentes solventesaplicados en las medidas por HPLC (según Pinckney et al., 1996).
Time (min) Flow (ml min−1) % Methanol % Ammonium acetate (0.1 M) % Acetone
0 0.8 80 20 0
5 0.8 80 10 10
45 1.25 80 5 15
50 1.5 80 0 20
65 0.8 80 0 20
67 0.8 80 20 0
95 0.8 80 20 0
ing specific extinction coefficients (Foppen, 1971& Jeffrey et al., 1997).
Data analyses
For each studied pigment, the Pearson correlationcoefficient was used to evaluate the agreement
between measures performed by spectrophotom-etry and HPLC. Student t-tests were performed todetermine whether the Pearson correlation coef-ficients were statistically significant, establishinga confidence value of p ≤ 0.05. The slopes of thecorrelations indicated whether the equations un-derestimated or overestimated pigment concen-
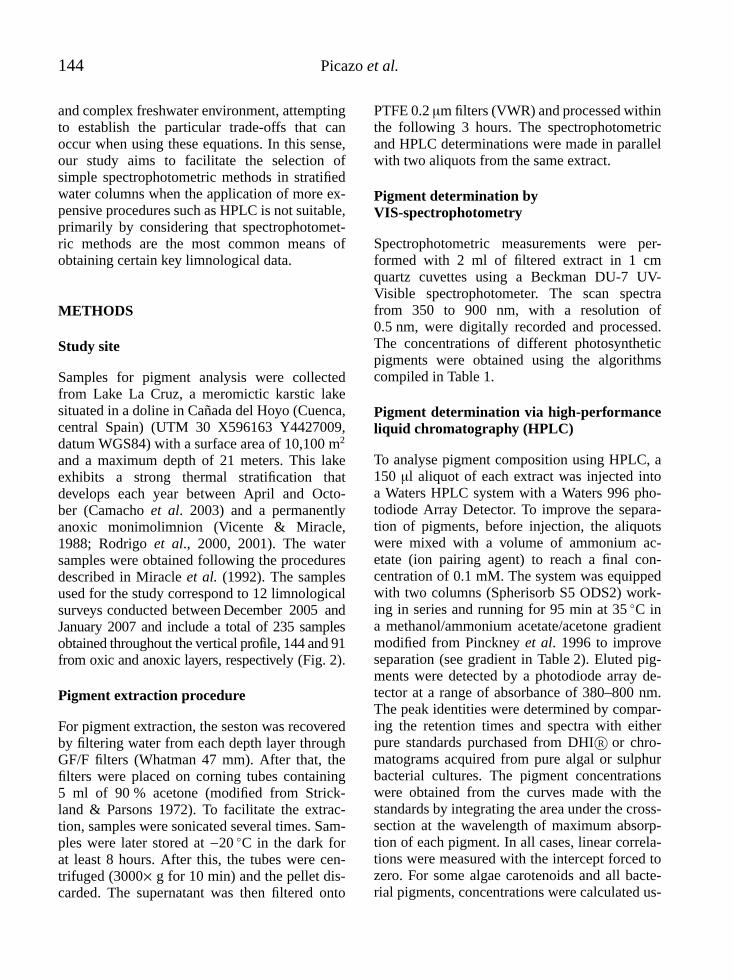
Figure 3. Box-plot distribution (log of concentration, µg l–1)) of the most abundant photosynthetic pigments found in Lake La Cruz.The statistical parameters of the raw data set used in this study are shown. A) Chlorophyll-a, plus derivatives, b and c in all of thesamples. B) Bacteriochlorophyll-a, c and d in the samples from anoxic waters. C) Primary algae or cyanobacterial carotenoids in allof the samples (Zea: Zeaxanthin, Fuc: Fucoxanthin, Alo: Alloxanthin, Lut: Lutein, Per: Peridinin). D) Primary bacterial carotenoidsin samples from anoxic waters (Oke: Okenone, Iso: Isorenieratene, Chloro: Chlorobactene). Diagrama de cajas de la distribución(logaritmo de la concentración (μg l–1)) de los pigmentos fotosintéticos más abundantes encontrados en la laguna de La Cruz.Se muestran los datos estadísticos en bruto usados en el presente estudio. A) Clorofila-a y derivados, b y c en todas las muestrasB) Bacterioclorofilas-a, c y d en muestras de aguas anóxicas. C) Principales carotenos de algas y cianobacterias en todas lasmuestras (Zea: Zeaxantina, Fuc: Fucoxantina, Alo: Alloxantina, Lut: Luteina, Per: Peridinina). D) Principales carotenos bacterianosen muestras de aguas anóxicas (Oke: Okenona, Iso: Isorrenierateno, Chloro: Clorobacteno).
14665 Limnetica 32(1), pàgina 145, 18/05/2013
146 Picazo et al.
trations. All of the data correlations and statisti-cal analyses were performed using University ofValencia-licensed SPSS 17.0 software.
RESULTS
During the studied period, the concentrationsof all of the analysed photosynthetic pigmentsshowed high variability (Fig. 3). In the entirewater column, the concentration of chlorophyll-avaried from 0.5 to 85 µg · l−1 and its deriva-tives (primarily chlorophyllide and pheophytin)represented between 3 and 60 % of the totalchlorophyll-a concentration, with a high degree ofvariability within the vertical profile and over time.We observed pigment concentrations below thedetection limit of the spectrophotometric method(i.e., 0.5 µg · l−1) in 89 % of the samples forchlorophyll-b and in 61 % for chlorophyll-c. Thehighest measured concentrations of chlorophyll-b and -c were 3.2 and 15.7 µg · l−1, respectively.In the anoxic layers, bacteriochlorophylls alsovaried widely, with an average of 20 µg · l−1
and maximum values of approximately 200 µg ·l−1 in a narrow layer of the lake just around thedeep chlorophyll maximum (DCM). Figure 3Cpresents the most abundant taxon-specificcarotenoids observed in the lake. More than15 different carotenoids were recovered in thechromatographic analysis for Lake La Cruz. Themore relevant carotenoids detected from chloro-phytes were zeaxanthin, lutein, violaxanthin, andantheroxanthin. Other relevant carotenoids werezeaxanthin and myxoxantophyll in cyanobacteria,alloxanthin from cryptophytes and fucoxanthinand diatoxanthin from bacillariophytes. Otherubiquitous carotenoids, such as β-carotene,were also regularly observed in samples. Amongbacterial carotenoids, okenone was the mostabundant; this carotenoid is characteristic ofsome purple sulphur bacteria (PSB), with Lam-procystis purpurea being the dominant species inLake La Cruz. Also observed in the samples werethe signature carotenoids of green sulphur bac-teria (GSB), isorenieratene and chlorobactene.
The relationships between the chlorophyll-aconcentrations measured using HPLC and the
estimates made with different spectrophotomet-ric equations are shown in figure 4 and Table 3.The HPLC data are expressed as either the totalamount of native chlorophyll-a (Fig. 4, plots onleft column) or the sum of the native form andderivatives (plots on right column), which wereprimarily chlorophyllide-a and pheophytin-a,although small amounts of pheophorbides we-re also present and taken into account. Therewere important differences in the responses of theequations studied in relation to the depth ofthe lake, which implies an important componentof spatial variability in the water column thatyields different accuracies depending on whethersamples are from oxic or anoxic water.
The correlations between the spectrophoto-metric determinations of chlorophyll-a (nativeplus derivate forms) and the HPLC measure-ments (Table 3), made for all data in the verticalprofile (oxic and anoxic samples), showed thatthe overall monochromatic and trichromaticequations (Marker, 1972; Strickland & Parsons1972; Jeffrey & Humphrey 1975), althoughsignificantly correlated, had low Pearson valuesand high errors (approximately 25 %) withslopes that strongly underestimate the concen-tration of chlorophyll-a (with respect to HPLC)when all samples were jointly considered. Thespectrophotometric equations with a correctionfor bacteriochlorophyll (Parkin & Brock, 1981and Overmann & Tilzer, 1989) showed bettercorrelations (higher Pearson values). However,the equation of Parkin & Brock (1981) had asimilar % error than the monochromatic andtrichromatic equations but, in this case, a highoverestimation of chlorophyll-a concentration(slope 1.235). Overall, the equation whose pre-dictions best fit all of the data was that given byOvermann & Tilzer (1989), showing a low error(1.9 %) and no considerable deviation of the esti-mated chlorophyll-a concentration (slope 1.019).
For oxic samples, all equations overestimatedthe spectrophotometric chlorophyll-a concen-tration with respect to the native chlorophyll-avalues (Figs. 4 A, C, E, G, I) measured byHPLC. However, when derivative forms arealso considered, as all equations do, monochro-matic and trichromatic equations (Marker, 1972;
14665 Limnetica 32(1), pàgina 146, 18/05/2013
HPLC vs. spectrophotometric pigment determinations 147
Figure 4. Relationship between the chlorophyll-a concentrations (µg l–1) obtained using different spectrophotometric equationsand through HPLC. In the left column (A, C, E, G, and I), correlations are shown between the concentrations obtained by thespectrophotometric equations and the concentrations of native chlorophyll-a determined by HPLC (including allomer and epimer)for both oxic and anoxic samples. The right column (B, D, F, H, and J) plots the correlations between the concentrations obtainedby spectrophotometric equations and the total chlorophyll-a concentrations determined by HPLC (native plus derivate pigments,chlorophyllide-a, pheophytin-a and pheophorbide-a). Anoxic samples have been excluded for equations that do not include acorrection for bacteriochlorophylls and have been maintained only for the equations of Parkin & Brock (1981) and Overmann &Tilzer (1989). (Solid line: correlation of oxic samples; dotted line: confidence intervals; dash-dot line: prediction intervals; dash line:correlation of anoxic samples). Relación entre las concentraciones de clorofila-a (μg l–1) obtenidas mediante las diferentes ecuacionesespectrofotométricas estudiadas respecto a las obtenidas por HPLC. En la columna de la izquierda (A, C, E, G, e I) se muestran lascorrelaciones entre las concentraciones estimadas por las ecuaciones espectrofotométricas y la concentración de clorofila-a nativamedida por HPLC (sumando su alomero y epimero). En la columna derecha (B, D, F, H, y J) se muestran las correlaciones entre lasconcentraciones estimadas por ecuaciones espectrofotométricas y la concentración total de clorofila-a medida por HPLC (sumandoa la nativa los pigmentos derivados como clorofilida-a, feofitina-a y feoforbido-a). Las muestras anóxicas han sido excluidas paralas ecuaciones sin corrección para bacterioclorofilas y mantenidas solo para Parkin & Brock (1981) y Overmann & Tilzer (1989)(Línea continua: Correlación de las muestras óxicas. Línea de puntos: intervalos de confianza. Línea de rayas y puntos: intervalo depredicción. Línea de rayas: correlación de las muestras de anoxia).
14665 Limnetica 32(1), pàgina 147, 18/05/2013
Mar
ker
1972
Jeff
rey
&H
umph
rey
1975
Stri
ckla
nd&
Pars
ons
1972
Park
in&
Bro
ck19
81O
verm
ann
&T
ilzer
1989
Taka
hash
i &Ic
him
ura
1970
Lay
ern
Pigm
ent
pear
son
slop
e%
erro
rpe
arso
nsl
ope
%er
ror
pear
son
slop
e%
erro
rpe
arso
nsl
ope
%er
ror
pear
son
slop
e%
erro
rpe
arso
nsl
ope
%er
ror
Tota
l23
5ch
l a0.
462
0.73
6−
26.4
0.48
60.
724
−27
.60.
516
0.75
4−
24.6
0.94
61.
235
23.5
0.92
41.
019
1.9
235
chl b
−0.
217
−18
.4−
1935
.4−
0.21
4−
12.9
−13
91.0
235
chl c
0.08
10.
019
−98
.10.
081
0.04
3−
95.7
118
Car
oten
oids
0.24
31.
492
49.2
Oxi
c14
4ch
l a0.
972
0.93
6−
6.4
0.97
30.
910
−9.
00.
980
0.93
3−
6.7
0.95
41.
257
25.7
0.97
20.
944
–5.6
144
chl b
0.32
40.
875
–12.
50.
377
0.63
2−
36.8
144
chl c
0.65
50.
362
−63
.80.
689
0.83
4–1
6.6
93C
arot
enoi
ds0.
919
1.62
062
.0
Ano
xic
91ch
l a0.
447
2.96
319
6.3
0.45
52.
772
177.
20.
459
2.55
715
5.7
0.46
50.
467
−53
.30.
630
0.95
2–4
.8
91ch
l b—
——
——
—
91ch
l c—
——
-—
——
91bc
hla
0.98
71.
090
9.0
25bc
hld
0.98
51.
124
12.4
0.94
90.
440
−56
.00.
983
1.10
210
.2
25bc
hlc
0.97
90.
774
–22.
6
25C
arot
enoi
ds0.
970
3.22
422
2.4
Tab
le3.
Sum
mar
yof
the
stat
isti
cal
dat
a(P
ears
on’s
corr
elat
ion
coef
fici
ent,
slope
and
%er
ror)
on
the
corr
elat
ions
bet
wee
nth
edif
fere
nt
spec
trophoto
met
ric
equat
ions
test
edan
dth
eH
PL
Cre
sult
sfo
ral
lsa
mple
sas
wel
las
for
oxic
and
anoxic
layer
sse
par
atel
y.T
he
equat
ions
resu
ltin
gin
the
low
est
dis
agre
emen
t(l
ow
est
%er
ror)
wit
hth
eH
PL
Cm
easu
rem
ents
are
mar
ked
inbold
and
are
thus
the
most
reco
mm
endab
lefo
rth
ere
spec
tive
case
.T
he
%er
ror
indic
ates
the
dif
fere
nce
bet
wee
nth
eval
ues
calc
ula
ted
wit
hth
esp
ectr
ophoto
met
ric
form
ula
ean
dth
eH
PL
Cm
easu
rem
ents
,w
her
eneg
ativ
eer
rors
repre
sent
anunder
esti
mat
ion
of
val
ues
by
the
spec
trophoto
met
ric
det
erm
inat
ions
com
par
edto
the
HP
LC
val
ues
,w
her
eas
posi
tive
erro
rsin
dic
ate
over
esti
mat
ion.
Corr
elat
ions
refe
rto
all
form
sof
each
pig
men
t(e
.g.,
chlo
rophyll
-aplu
sder
ivat
ive
conce
ntr
atio
ns
for
chlo
rophyll
-a).
Res
um
ende
los
dato
ses
tadís
tico
s(c
oefi
cien
tede
corr
elaci
ón
de
Pea
rson,
pen
die
nte
y%
de
erro
r)de
las
corr
elaci
ones
entr
ela
sdif
eren
tes
ecuaci
ones
espec
trofo
tom
étri
cas
pro
badas
yla
sdet
erm
inaci
ones
por
HP
LC
para
todas
las
mues
tras,
asi
com
opara
las
mues
tras
óxi
cas
yanóxi
cas
por
separa
do.
Se
mues
tran
enneg
rita
,para
laapli
caci
ón
de
dis
tinta
sec
uaci
ones
,aquel
las
que
pre
senta
nuna
men
or
dis
crep
anci
aco
nla
det
erm
inaci
ón
por
HP
LC
(%er
ror)
,si
endo
enco
nse
cuen
cia
las
más
reco
men
dable
spara
elca
sopart
icula
r.E
l%
de
erro
rto
ma
valo
res
neg
ati
vos
cuando
sepro
duce
una
subes
tim
aci
ón
por
part
ede
las
det
erm
inaci
ones
espec
trofo
tom
étri
cas
enco
mpara
ción
con
las
med
idas
por
HP
LC
,m
ientr
as
que
tom
ava
lore
sposi
tivo
scu
ando
seda
una
sobre
esti
maci
ón.L
as
corr
elaci
ones
sere
fier
ena
todas
las
form
as
de
cada
pig
men
to(p
.ej.
conce
ntr
aci
ones
de
cloro
fila
-ay
sus
der
ivados
enel
caso
de
lacl
oro
fila
-a).
14665 Limnetica 32(1), pàgina 148, 18/05/2013
HPLC vs. spectrophotometric pigment determinations 149
Figure 5. A to D) Relationships between the chlorophyll-b concentrations (µg l–1) obtained using the spectrophotometric equationsproposed by Strickland & Parsons (A and B) and by Jeffrey & Humphrey (C and D) and the concentrations measured using HPLC.E-H) Relationships between the chlorophyll-c concentrations (µg l–1) obtained using the equations of Strickland & Parsons (E and F)and Jeffrey & Humphrey (G and H) and the concentrations measured using HPLC. Note the change of scale in chlorophyll-b plotsA-B compared to C-D. (Solid line: correlation of oxic samples; dotted line: confidence intervals; dash-dot line: prediction intervals).No correlation was found when all samples (oxic and anoxic) were included (left plots). The right plots include only oxic samples.A-D) Relación entre las concentraciones (μg l–1) de clorofila-b obtenidas mediante las ecuaciones espectrofotométricas de Strickland& Parsons (A y B) y Jeffrey & Humphrey (C y D) respecto a las obtenidas por HPLC. E-H) Relación entre las concentraciones (μgl–1) de clorofila-c obtenidas mediante las ecuaciones espectrofotométricas de Strickland & Parsons (E y F) y Jeffrey & Humphrey(G y H) respecto a las obtenidas por HPLC. Nótese el cambio de escala para las figuras de la clorofila-b, A-B, respecto a las C-D,(Línea continua: Correlación de las muestras óxicas. Línea de puntos: intervalos de confianza. Línea de rayas y puntos: intervalode predicción). Cuando se incluyeron todas las muestras (óxicas y anóxicas, gráficas de la izquierda) no se encontró ningunacorrelación, en las gráficas de la derecha se incluyen solo las muestras óxicas.
14665 Limnetica 32(1), pàgina 149, 18/05/2013
150 Picazo et al.
Figure 6. Plots include only the anoxic samples. A) Relationship between the bacteriochlorophyll-a concentrations (µg l–1)obtained by Takahashi & Ichimura’s spectrophotometric equation and those obtained by HPLC. B) Relationship between thebacteriochlorophyll-c concentrations (µg l–1) obtained by Takahashi & Ichimura’s spectrophotometric equation and those obtainedby HPLC. C-D-E) Relationship between the bacteriochlorophyll-d concentrations (µg l–1) obtained using the spectrophotometricequations of Takahashi & Ichimura (C) Parkin & Brock (D) and Overmann & Tilzer (E) and those obtained using HPLC. (Solid line:correlation of anoxic samples; dotted line: confidence intervals; dash-dot line: prediction intervals). Incluye solo muestras anóxicas. A)Relación entre las concentraciones de bacterioclorofila-a (μg l–1) obtenidas mediante la ecuación espectrofotométrica de Takahashi& Ichimura respecto a las obtenidas por HPLC. B) Relación entre las concentraciones de bacterioclorofila-c (μg l–1) obtenidasmediante la ecuación espectrofotométrica de Takahashi & Ichimura respecto a las obtenidas por HPLC. C-D-E) Relación entre lasconcentraciones de bacterioclorofila-d (μg l–1) obtenida mediante las ecuaciones espectrofotométricas de Takahashi & Ichimura (C)Parkin & Brock (D) y Overmann & Tilzer (E) respecto a las obtenidas por HPLC. (Línea continua: Correlación de las muestrasanóxicas. Línea de puntos: intervalos de confianza; línea de rayas y puntos: intervalo de predicción).
Strickland & Parsons 1972; Jeffrey & Humphrey1975) underestimated chlorophyll-a (plus deriva-tives) concentrations (Figs. 4 B, H, J). Becausespectrophotometric equations include the deter-
mination of all forms (native plus derivatives),Table 3, which synthesises the results of theapplication of the different equations, wasmade by considering the correlations of spec-
14665 Limnetica 32(1), pàgina 150, 18/05/2013
HPLC vs. spectrophotometric pigment determinations 151
trophotometric determinations with the HPLCconcentrations of native plus derivate forms ofchlorophyll-a. Concerning the equations that cor-rect chlorophyll-a concentration for the presenceof bacteriochlorophyll-d (d + e), that of Parkin& Brock (1981) exhibited a high error (25.7 %),overestimating chlorophyll-a. Although for oxicsamples all but Parkin & Brock’s equation forchlorophyll-a produced relatively low errors (un-der 10 %), the best values were again providedby the Overmann & Tilzer (1989) equation,with an error of 5.6 %, whereas the most-usedJeffrey & Humphrey (1975) equation producedan error of 9.0 %.
Concerning the anoxic samples, no significantcorrelation was found for the monochromaticand trichromatic equations that did not include abacteriochlorophyll-d correction for chlorophyll-a concentration (dashed line in Figs. 4 A, C, E,G, I), which resulted in large errors (Table 3).Those equations are thus unsuitable for determin-ing chlorophyll-a in anoxic waters presenting
green photosynthetic bacteria. For the equa-tions with a bacteriochlorophyll-d correction(Figs. 4 D, F), that of Parkin & Brock (1981)exhibited a low Pearson correlation (r = 0.465),low slope (0.467), and high error (53 %), witha strong underestimation with respect to HPLCvalues. Again, Overmann & Tilzer’s (1989)equation showed the best correlation (r = 0.630),with a good slope (0.952) and low error (4.8 %).
Figure 5 presents the relationship between thetwo analytical methods, but in this case forthe measurement of chlorophyll-b and -c, forwhich only the trichromatic equations of Strick-land & Parsons (1972) and Jeffrey & Humphrey(1975) had previously been proposed. As withchlorophyll-a, the trichromatic equations wereinadequate in predicting the concentrationsof these pigments in the anoxic layers, wherechlorophyll-b and -c likely represent settlingalgae. When all samples were jointly considered(Fig. 5, plots on left, Table 3), there was again nocorrelation between the spectrophotometric and
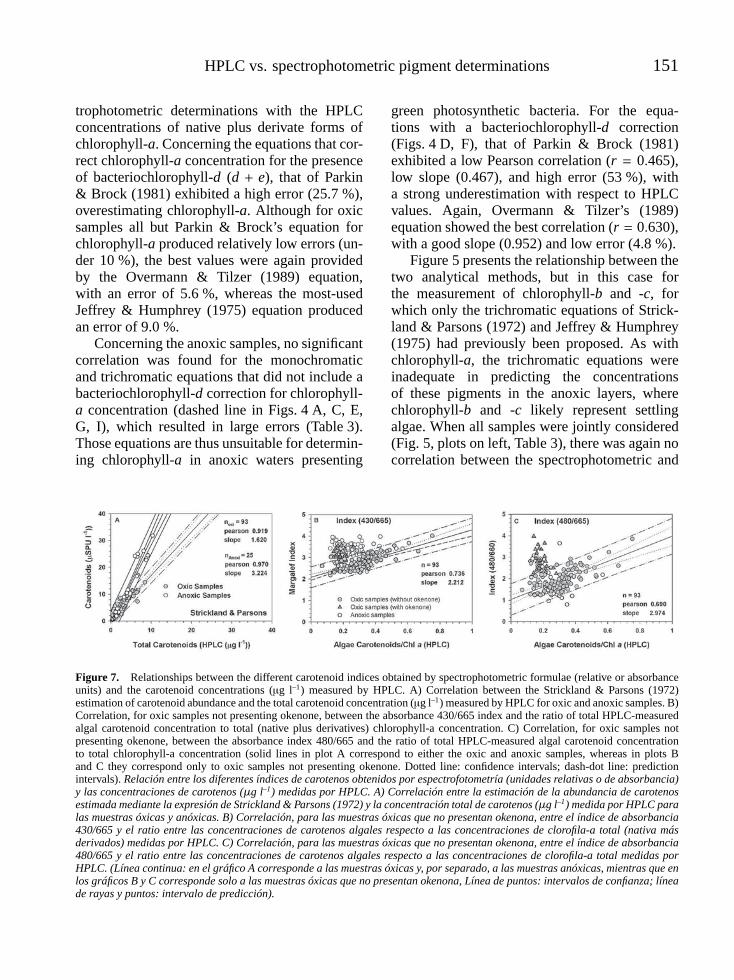
Figure 7. Relationships between the different carotenoid indices obtained by spectrophotometric formulae (relative or absorbanceunits) and the carotenoid concentrations (µg l–1) measured by HPLC. A) Correlation between the Strickland & Parsons (1972)estimation of carotenoid abundance and the total carotenoid concentration (µg l–1) measured by HPLC for oxic and anoxic samples. B)Correlation, for oxic samples not presenting okenone, between the absorbance 430/665 index and the ratio of total HPLC-measuredalgal carotenoid concentration to total (native plus derivatives) chlorophyll-a concentration. C) Correlation, for oxic samples notpresenting okenone, between the absorbance index 480/665 and the ratio of total HPLC-measured algal carotenoid concentrationto total chlorophyll-a concentration (solid lines in plot A correspond to either the oxic and anoxic samples, whereas in plots Band C they correspond only to oxic samples not presenting okenone. Dotted line: confidence intervals; dash-dot line: predictionintervals). Relación entre los diferentes índices de carotenos obtenidos por espectrofotometría (unidades relativas o de absorbancia)y las concentraciones de carotenos (μg l–1) medidas por HPLC. A) Correlación entre la estimación de la abundancia de carotenosestimada mediante la expresión de Strickland & Parsons (1972) y la concentración total de carotenos (μg l–1) medida por HPLC paralas muestras óxicas y anóxicas. B) Correlación, para las muestras óxicas que no presentan okenona, entre el índice de absorbancia430/665 y el ratio entre las concentraciones de carotenos algales respecto a las concentraciones de clorofila-a total (nativa másderivados) medidas por HPLC. C) Correlación, para las muestras óxicas que no presentan okenona, entre el índice de absorbancia480/665 y el ratio entre las concentraciones de carotenos algales respecto a las concentraciones de clorofila-a total medidas porHPLC. (Línea continua: en el gráfico A corresponde a las muestras óxicas y, por separado, a las muestras anóxicas, mientras que enlos gráficos B y C corresponde solo a las muestras óxicas que no presentan okenona, Línea de puntos: intervalos de confianza; líneade rayas y puntos: intervalo de predicción).
14665 Limnetica 32(1), pàgina 151, 18/05/2013
152 Picazo et al.
HPLC measures. Even when considering onlythe oxic samples (Fig. 5, plots on the right, andTable 3), the accuracy of the spectrophotometricdeterminations was very low, as the concentra-tions of these pigments in the lake were also low.
Concerning bacteriochlorophylls, (Fig. 6), Ta-kahashi & Ichimura (1970) provided an equa-tion for the calculation of bacteriochlorophyll-athat fits well with HPLC determinations,showing a high correlation coefficient. Thiscorrelation is facilitated by the higher numberof samples for the analysis compared to thelower number for other bacteriochlorophylls.The equations of Takahasi & Ichimura (1970),which are the most extensively used to es-timate bacterial pigments, slightly overesti-mated both bacteriochlorophyll−a and bacterio-chlorophyll−d by approximately 10 %, whereasbacteriochlorophyll−c was underestimated byapproximately 23 %. A lower accuracy wasobserved for the calculation of bacteriochlo-rophyll−d by means of the Parkin & Brock(1981) equation, which overestimated concen-trations by 12 %. By contrast, the equationof Overmann & Tilzer (1989) greatly underes-timated bacteriochlorophyll−d concentrationsby more than 50 %.
The comparison between carotenoid quan-tifications performed on non-purified extractsusing the Strickland & Parsons (1972) equa-tions and through HPLC determinations areshown in figure 7. Both direct quantificationsand absorbance ratios were also sensitive tothe samples’ origin. Although a statisticallysignificant correlation was observed when com-paring the total carotenoids measured with theequation of Strickland & Parsons (1972) withthe measures obtained by HPLC, the differentslopes of 1.62 for oxic layers and 3.22 for anoxiclayers indicate that the response of Strickland& Parsons’ equations is different when bacterialcarotenoids are involved. Thus, these equationsare not suitable to be used indistinctly for oxicand anoxic samples. On the other hand, the twodual-wavelength absorbance ratios (i.e., 430/665and 480/665) (Margalef, 1983) exhibited moder-ately good correlations for only the epilimneticsamples, whereas the metalimnetic and hy-
polimnetic samples (that include the bacterialcarotenoid okenone) did not show any significantrelationships with the carotenoid/chlorophyll-aratios estimated from the HPLC measures.
DISCUSSION
Although HPLC analyses provide higher pre-cision and improve pigment characterisationcompared to routine spectrophotometric methods(Wright & Jeffrey, 2006), the former are alsomore expensive and time-consuming. Thus, formany applications, direct spectrophotometricmeasures may offer a high enough level ofprecision to obtain optimum results. Our exam-ination of cited works in the Thomson Reuters(formerly ISI) Web of Knowledge reveals thatat present, spectrophotometric equations are ex-tensively used (Fig. 1). The number of citationsis continuously increasing for some of theseequations, such as those proposed by Jeffrey& Humphrey (1975) and Strickland & Parsons(1972) in the mid-1970s. This preference forspectrophotometric methods is evident becauseroutine spectrophotometric procedures avoidcost and time compared to HPLC, but the inher-ent inaccuracies of the method require cautionwhen applying the different formulae and wheninterpreting the results, particularly when thestudy involves stratified water columns. Severalstudies, including ours, demonstrate that the va-lidity of some equations depends on the origin ofthe samples and that the presence or absenceof certain pigment forms may cause the accu-racy of the determination to vary. For example,the absorption characteristics of chlorophyll-aderivatives introduce some bias into the quan-tification of native chlorophyll-a (Salinas, 1988;Rowan 1989; Jacobsen & Rai, 1990; Pinckneyet al., 1994; Ritchie 2008). To explore thisissue, we compared the linear correlations ofquantifications obtained by both considering andnot considering these chlorophyll-a derivatives.When chlorophyll-a derivatives were excludedfrom the HPLC addition of pigment forms(Fig. 4, left plots), all equations overestimatedthe native chlorophyll-a concentrations due to
14665 Limnetica 32(1), pàgina 152, 18/05/2013
HPLC vs. spectrophotometric pigment determinations 153
the presence of these degradation derivatives,although the overestimates were generally lessthan 10 %. However, upon the consideration ofderivative forms in the HPLC measurements, allequations other than dichromatic ones (those ofParkin & Brock, 1981, and Overmann & Tilzer,1989) underestimated the HPLC measurements.It has previously been suggested that the use ofspectrophotometric methods can be acceptable ifdegraded forms represent less than 5 % of totalchlorophyll-a (Jodłowska & Latała, 2011). Theerror of our estimates was commonly less than10 % (Fig. 4), which could be explained by thepresence of these derivatives, except for the caseof the Parkin & Brock’s equation that consis-tently and greatly overestimates chlorophyll-aconcentrations.
There are also spectrophotometric protocols,not tested in this study, that allow the correctionof chlorophyll-a concentrations with respect totheir degraded compounds through a previousacidification step (Lorenzen, 1967). By means ofthis acidification, native chlorophyll-a is trans-formed into phaeophytin-a. Chlorophyllide-a isthe result of the loss of the phytol chain andis a common degraded form of chlorophyll-awhose occurrence has been associated withcell senescence due to the enzymatic activityof chlorophyllases (Louda et al., 1998, 2002)and/or disruption produced by predation (Barlowet al., 1988). In Lake La Cruz, high concentra-tions of this pigment are usually associated withthe metalimnetic deep chlorophyll maximum,which invalidates the use of such methods for thestudied lake, as the presence of high quantitiesof chlorophyllide-a in the extracts detracts fromthe validity of the results even after acidification(Plante-Cuny et al., 1993). For that reason, wedid not evaluate such methods.
In highly stratified lakes, additional inter-ference in the quantification of chlorophyll-ais generated by spectral overlap with bacteri-ochlorophylls. These pigments occur primarilyin the anoxic and microaerobic layers, wherephotosynthetic sulphur bacteria thrive. Thiswould explain why neither the monochromatic(Marker, 1972) nor the trichromatic (Strickland& Parsons, 1972; Jeffrey & Humphrey, 1975)
equations that we tested produced good estimatesof chlorophyll-a for the anoxic layers of the lake.In the early 1980s, Parkin & Brock (1981)proposed a dichromatic equation to estimatechlorophyll-a concentrations in the presence ofbacteriochlorophyll-d, which is the main sourceof interference for chlorophyll-a concentrationestimations. Since then, this equation has beenwidely used in these types of lakes. The effec-tiveness of this equation was later challenged byOvermann & Tilzer (1989), who proposed analternative algorithm. In our study, the equationof Parkin & Brock (1981) did not correctlyapproximate chlorophyll-a concentrations whenbacteriochlorophyll-d was present, and we do notrecommend its use in such cases. The equation ofOvermann & Tilzer (1989), however, offered thebest results in measuring chlorophyll-a concen-trations regardless of the sample’s origin (oxic oranoxic water), and it was the only equation thatproduced good estimations for anoxic samples.In contrast, for the oxic samples, no equationsexcept that of Parkin & Brock (1981) deviatednotably from the linear distribution, thus indi-cating a high measurement accuracy of theseequations compared to the results of HPLC andmaking any of these equations suitable for thedetermination of chlorophyll-a in oxic waters.
Trichromatic equations are widely used inspectrophotometric procedures for the determi-nation of chlorophyll-b and -c (Jeffrey et al.,1997), which provide chemotaxonomic infor-mation concerning phytoplankton communitycomposition. The two most-used equations weredefined by Parsons & Strickland (1963) (usuallyreported by Strickland & Parsons, 1972 and lateralmost identically assumed by SCOR-UNESCO,1966) and by Jeffrey & Humphrey (1975).The equation of Jeffrey & Humphrey (1975) isused even more often, most likely because itis the equation recommended by the US EPA.However, a critical aspect of these trichromaticequations is that they are not accurate in estimat-ing pigments at low concentrations. Unicellularpicocyanobacteria and photosynthetic bacteriadominate the phytoplankton community of themeromictic Lake La Cruz (Rodrigo et al., 2001;Camacho et al., 2003). By contrast, algal groups
14665 Limnetica 32(1), pàgina 153, 18/05/2013
154 Picazo et al.
containing chlorophyll-b (i.e., chlorophytes) orchlorophyll-c (i.e., bacillariophytes and chrys-ophytes) regularly exhibit lower abundances inthe studied lake, which implies that the possibleuse of these equations is complicated by thesepigment concentrations being near or below theequations’ resolution limit. This appears to par-ticularly affect the estimation of chlorophyll-b,which in our case produced the worst statisticalresults, contrasting with Ritchie’s (2008) obser-vations of a lower accuracy of these equationsfor the calculation of chlorophyll-c compared tochlorophyll-b. Moreover, in lake layers wheregreen photosynthetic bacteria occur, such as themetalimnion and hypolimnion of Lake La Cruz,bacteriochlorophylls are likely producing thisbias because of the spectra overlap, which canbe observed in figure 2. In our case, chlorophyll-b estimation is more sensitive to this biascompared to chlorophyll-c.
To assess bacteriochlorophyll (a, c and d) con-centrations, we applied the equations of Taka-hashi & Ichimura (1970), which are the mostcommonly utilised in freshwater ecosystems.We also assessed the dichromatic equationsof Parkin & Brock (1981) and Overmann &Tilzer (1989), which were designed for thecalculation of chlorophyll-a concentrationwhen bacteriochlorophyll-d is present andalso allow for the estimation of the concen-trations of bacteriochlorophyll-d and -e. Bac-teriochlorophyll-e was not present in samplesfrom Lake La Cruz, as confirmed by the HPLCanalysis; under these circumstances, we assumethat the equation of Overmann & Tilzer (1989)could be used to measure the concentrationof bacteriochlorophyll-d. During the mixingperiod, photosynthetic sulphur bacteria in LakeLa Cruz might incidentally occur in oxic layersdue to the lack of control of buoyancy and theformation of aggregates that can remain for along time in the mixolimnion; however, suchbacteria naturally develop in the anoxic mon-imolimnion and hypolimnion when sufficientlight reaches these sulphide-containing depths(Casamayor et al., 2011). It is for this reasonthat correlations were only explored for theanoxic layers of the lake (Fig. 6). In contrast
with chlorophyll-a, the derivatives of thesebacterial pigments are present only in very lowamounts, making any correction unnecessary.Bacteriochlorophyll-a is found in purple sulphurbacteria (PSB). In Lake La Cruz, Lamprocystispurpurea dominates among other PSB species(Casamayor et al., 2011). The correlationsobtained for this pigment between the equa-tions of Takahashi & Ichimura (1970) and theHPLC determinations are in our case statisticallysatisfactory, indicating an underestimation ofthe bacteriochlorophyll-a concentration by only8 %. Concerning bacteriochlorophyll-c and -d,which occur in green sulphur bacteria (GSB),among which Chlorobium clathratiforme isabundant in Lake La Cruz, the results obtainedwith the equations of Takahashi & Ichimura(1970) show a better fit for bacteriochlorophyll-d. In this case, bacteriochlorophyll-c was hereunderestimated by approximately 23 %. Con-cerning the other equations, that of Parkin &Brock (1981) produced a good correlation forbacteriochlorophyll-d, whereas the equation ofOvermann & Tilzer (1989) appears to notablyunderestimate the concentration of this pigment.For this last result, it should be noted thatOvermann & Tilzer’s equation was designed toassess mixtures of bacteriochlorophyll-d and -e,which is not our case.
There are several analytical approaches toassess the carotenoid-to-chlorophyll ratios inphytoplankton. These include simple ratios ofabsorbance among specific wavelengths (e.g.,480/665 nm or 430/665 nm) that assess thecarotenoid-to-chlorophyll-a relationship (Marga-lef, 1983), as well as quantitative methods suchas HPLC determination. The former are rarelyreported in the scientific literature; however,they are still formally used in management andtechnical studies. One of the first attempts tospectrophotometrically quantify carotenoid con-centrations was made by Richards & Thomson(1952), but this produced inadequate resultswhen diatoms and/or chrysophytes occurred insamples. Strickland & Parsons (1972) proposedan equation that partially solved this problem;however, it assumed that the relationship amongthe concentrations of different carotenoids re-
14665 Limnetica 32(1), pàgina 154, 18/05/2013
HPLC vs. spectrophotometric pigment determinations 155
mains somewhat constant throughout the watercolumn, which is not true for highly strati-fied lakes such as Lake La Cruz. Althoughthe wavelengths used in these equations arewithin the ranges of maximum absorption ofall carotenoids, a notable variation in the rel-ative composition of carotenoids with depth,such as would be expected for highly stratifiedlakes, can introduce an important bias. In anycase, carotenoid-to-chlorophyll-a ratios can besuitable for qualitative analyses and representreadily obtainable optical signatures that can beused as proxies for some phytoplankton com-munity properties. However, our results indicatethat only epilimnetic waters can be accuratelyanalysed in this way due to the interference ofsome bacterial carotenoids such as okenone inmicroaerophilic and anoxic waters.
In summary, our results demonstrate thatin highly stratified aquatic systems, the con-centrations of only some algal and bacterialphotosynthetic pigments can be estimated withan appropriate accuracy using spectrophoto-metric algorithms. Furthermore, the use of onlyone of these types of equations is not alwaysrecommended for the entire water column,but the change from one equation to anotherdepends on the mixture and relative abundanceof the different photosynthetic microorganisms.In any case, for chlorophyll-a determinations,we found the equation by Overmann & Tilzer(1989) to perform the best under all circum-stances; thus, we recommend its use for stratifiedwater columns showing vertical stratificationof photosynthetic microorganisms. Concerningbacteriochlorophylls, the formulae by Takahahi& Ichimura perform well in anoxic waters, wherephototrophic bacteria thrive. Similar considera-tions for other pigments, such as chlorophyll-band –c, and carotenoid concentrations or ratioscan be made by reviewing the informationsynthesised in Table 3. This table summarisesthe strength of each equation when applied toa stratified system such as our model lake andcould serve as a reference for the selection ofthe most appropriate equation when spectropho-tometric methods are used for photosyntheticpigment determinations.
ACKNOWLEDGEMENTS
The research of AC, AP, and CR is currentlysupported by Project CGL2012-38909 (ECO-LAKE) of the Spanish Ministerio de Economia yCompetitividad. AP received a scholarship fromCaja de Ahorros del Mediterraneo-ProyectoAgua (CAM). We thank Esther Dominguez forher helpful assistance with the laboratory work.
REFERENCES
APHA–AWWA–WEF. 2005. Standard methods forthe examination of water and watershed. 21th
edition. American public health association.Washington DC, USA. 1200 pp.
ARAR, E. J. 1997. Determination of chlorophylls aand b and identification of other pigments of in-terest in marine and freshwater algae using highperformance liquid chromatography with visiblewavelength detection. Method 447.0, U.S. Envi-ronmental Protection Agency.
BARLOW, R. G., P. H. BURKILL & R. F. C. MAN-TOURA. 1988. Grazing and degradation of algalpigments by marine protozoan Oxyrrhis marina.Journal of Experimental Marine, 119: 119–129.
CAMACHO, A., J. PEREZ, A. CHICOTE, M.FLORIN, M. M. SQUIRES, C. LEHMANN & R.BACHOFEN. 2001. Microbial microstratification,inorganic carbon photoassimilation and dark car-bon fixation at the chemocline of the meromicticLake Cadagno (Switzerland) and its relevance tothe food web. Aquatic Sciences, 63: 91–106.
CAMACHO, A., A. PICAZO, M. R. MIRACLE & E.VICENTE. 2003. Spatial distribution and tempo-ral dynamics of picocyanobacteria in a meromictickarstic lake. Archiv für Hydrobiologie Supplement-band, 148: 171–184.
CASAMAYOR, E. O., M. LLIROS, A. PICAZO, A.BARBERÁN, C. M. BORREGO & A. CAMA-CHO. 2011. Contribution of deep dark fixationprocesses to overall CO2 incorporation and largevertical changes of microbial populations in strati-fied karstic lakes. Aquatic Sciences, 74: 61–75.
DOS SANTOS, A. C. A., M. C. CALIJURI, E. M.MORAES, M. A. T. ADORNO, P. B. FALCO,D. P. CARVALHO, G. L. B. D. P., DEBERDT,G. L. B. & BENASSI, S. F. 2003. Comparison ofthree methods for chlorophyll determination: spec-
14665 Limnetica 32(1), pàgina 155, 18/05/2013
156 Picazo et al.
trophotometry and fluorimetry in samples contain-ing pigment mixtures and spectrophotometry insamples with separate pigments through High Per-formance Liquid Chromatography. Acta Limnolog-ica Brasiliensia, 15: 7–18.
FOPPEN, F. H. 1971. Tables for identification ofcarotenoid pigments. Chromatographic Reviews,14: 133–298.
JACOBSEN, T. R. & H. RAI. 1990. Comparison ofspectrophotometric, fluorometric and High Perfor-mance Liquid Chromatography Methods for De-termination of chlorophyll a in aquatic samples:Effects of solvent and extraction procedures. In-ternationale Revue gesamten Hydrobiologie, 75:207–217.
JEFFREY, S. W. & G. F. HUMPHREY. 1975. Newspectrophotometric equations for determiningchlorophylls a, b, c1 and c2 in higher plants,algae and natural phytoplankton. Biochemie undPhysiologie der Pflanzen, 167: 191–194.
JEFFREY, S. W., MANTOURA, R. F. C. & S.W.WRIGHT. 1997. Phytoplankton pigments inoceanography: guidelines to modern methods.UNESCO, Paris, 661 pp.
JODŁOWSKA, S. & A. LATAŁA. 2011. The compar-ison of spectrophotometric method and high per-formance liquid chromatography in photosyntheticpigments analysis. Online Journal of BiologicalSciences, 11: 63–69.
LATASA, M., R. R. BIDIGARE, M. E. ONDRUSEK,AND M. C. KENNICUTT II. 1996. HPLC anal-ysis of algal pigments: a comparison exerciseamong laboratories and recommendations for im-proved analytical performance. Marine Chemistry,51: 315–324.
LORENZEN, C. J. 1967. Determination of chloro-phyll and pheopigments: spectrophotometric equa-tions. Limnology & Oceanography, 12: 343–346.
LOUDA, J. W., J. L. LEI LIU, M. N. WINFREE & E.W. BAKER. 1998. Chlorophyll-a degradation dur-ing cellular senescence and death. Organic Geo-chemistry, 29: 1233–1251.
LOUDA, J. W., LIU, L., & E. W. BAKER. 2002.Senescence and deathrelated alteration of chloro-phylls and carotenoids in marine phytoplankton.Organic Geochemistry, 33: 1635–1653.
MACLULICH, J. H. 1986. Experimental evaluationof methods for sampling and assaying intertidalepilithic microalgae. Marine Ecology Progress Se-ries, 34: 275–280.
MANTOURA, R. F. C., & C. A. LLEWELLYN.1983. The rapid determination of algal chlorophylland carotenoid pigments and their breakdownproducts in natural waters by reverse-phase high-performance liquid chromatography. AnalyticaChimica Acta, 151: 297–314.
MANTOURA, R. F. C., S. W. JEFFREY, C.A. LLEWELLYN, H. CLAUSTRE, & C. E.MORALES. 1997. Comparison between spec-trophotometric, fluorometric and HPLC methodsfor chlorophyll analysis. In Phytoplankton pig-ments in oceanography: guidelines to modernmethods. S. W. Jeffrey et al. (eds.). 361–380.UNESCO, Paris.
MARGALEF, R. 1983. Limnologia. Ediciones Ome-ga, S.A., Barcelona, Spain.
MARKER, A. F. H. 1972. The use of acetone andmethanol in the estimation of chlorophyll in thepresence of phaeophytin. Freshwater Biology, 2:361–385.
MIRACLE, M. R., E. VICENTE & C. PEDRÓS-ALIÓ. 1992. Biological studies of Spanishmeromictic and stratified karstic lakes. Limnetica,8: 59–77.
MURRAY, A. P., C. F. GIBBS, A. R. LONGMORE &D. J. FLETT. 1986. Determination of chlorophyllin marine waters: intercomparison of a rapid HPLCmethod with full HPLC, spectrophotometric andfluorometric methods. Marine Chemistry, 19: 211–227.
OVERMANN, J. R. & M. M. TILZER. 1989. Con-trol of primary productivity and the significance ofphotosynthetic bacteria in a meromictic kettle lake.Mittlerer Buchensee, West-Germany. Aquatic Sci-ences, 51: 261–278.
PARKIN, T. & T. BROCK. 1981. Photosyntheticbacterial production and carbon mineralization ina meromictic lake. Archiv für Hydrobiologie, 91:366–382.
PARSONS, T. R. & J. D. H. STRICKLAND. 1963.Discussion of spectrophotometric determination ofmarine-plant pigments, with revised equations forascertaining chlorophylls and carotenoids. Journalof Marine Research, 21: 155–163.
PINCKNEY, J., R. PAPA & R. ZINGMARK.1994. Comparison of high-performance liquidchromatographic, spectrophotometric, and fluo-rometric methods for determining chlorophyll aconcentrations in estuarine sediments. Journal ofMicrobiological Methods, 19: 59–66.
14665 Limnetica 32(1), pàgina 156, 18/05/2013
HPLC vs. spectrophotometric pigment determinations 157
PINCKNEY, J. L., D. F. MILLIE, K. E. HOWE, H.W. PAERL & J. P. HURLEY.1996. Flow scintilla-tion counting of 14C-labeled microalgal photosyn-thetic pigments. Journal of Plankton Research, 18:1867–1880.
PLANTE-CUNY, M. R., C. BARRANGUET, D.BONIN & C. GRENZ. 1993. Does chlorophyllidea reduce reliability of chlorophyll a measurementsin marine coastal sediments? Aquatic Sciences,55: 19–30.
RICHARDS, F. A. & T. G. THOMPSON. 1952. Theestimation and characterization of plankton pop-ulations by pigment analysis. II. A spectrophoto-metric method for the estimation of plankton pig-ments. Journal of Marine Research, 11: 156–172.
RITCHIE, R. J. 2006. Consistent sets of spectrophoto-metric chlorophyll equations for acetone, methanoland ethanol solvents. Photosynthesis Research, 89:27–41.
RITCHIE, R. J. 2008. Universal chlorophyll equa-tions for estimating chlorophylls a, b, c, and d andtotal chlorophylls in natural assemblages of pho-tosynthetic organisms using acetone, methanol, orethanol solvents. Photosynthetica, 46: 115–126.
RODRIGO, M. A., E. VICENTE & M. R. MIRACLE.2000. The role of light and concentration gradientsin the vertical stratification and seasonal develop-ment of phototrophic bacteria in a meromictic lake.Archiv für Hydrobiologie, 148: 533–548.
RODRIGO, M. A., M. R. MIRACLE & E. VI-CENTE. 2001. The meromictic Lake La Cruz(Central Spain). Patterns of stratification. AquaticSciences, 63: 406–416.
ROWAN, K. 1989. Photosynthetic Pigments of Algae.Cambridge University Press.
SALINAS, J. T. 1988. A critical comparison ofmethods for the determination of phytoplank-ton chlorophyll. Ph.D. Thesis. Oregon StateUniversity, U.S.A.
SCHAGERL, M., & G. KÜNZL. 2007. Chlorophylla extraction from freshwater algae a reevaluation.Biologia, 62: 270–275.
SCOR-UNESCO. 1966. Determination of photosyn-
thetic pigments in seawater. Monographs onOceanographic Methodology, UNESCO, Paris,vol. 1, p.11–18.
SHIMURA, S. & Y. FUJITA. 1975. Changes in the ac-tivity of fucoxanthin-excited photosynthesis in themarine diatom Phaeodactylum tricornutum grownunder different culture conditions. Marine Biology,33: 185–194.
SOLOVCHENKO, A. E., I. KHOZIN-GOLDBERG,Z. COHEN & M. N. MERZLYAK. 2009.Carotenoid-to-chlorophyll ratio as a proxy forassay of total fatty acids and arachidonic acid con-tent in the green microalga Parietochloris incise.Journal of Applied Phycology, 21: 361–366.
STAL, L. J., H. VAN GEMERDEN & W. E.KRUMBEIN. 1984. The simultaneous assay ofchlorophyll and bacteriochlorophyll in natural mi-crobial communities. Journal of MicrobiologicalMethods, 2: 295–306.
STEENBERGEN, C. L. M. & H. J. KORTHALS.1982. Distribution of phototrophic microorgan-isms in the anaerobic and microaerophilic strata ofLake Vechten (The Netherlands). Pigment analysisand the role of primary production. Limnology &Oceanography, 27: 883–895.
STRICKLAND, J. D. H. & T. R. PARSONS. 1972. APractical Handbook of Seawater Analysis. 2nd ed.,Bull. Fish. Res. Bd. Can. No. 167, 310 pp.
TAKAHASHI, M. & S. ICHIMURA. 1970. Photo-synthetic properties and growth of photosyntheticsulfur bacteria in lakes. Limnology & Oceanogra-phy, 15: 929–944.
VICENTE, E. & M. R. MIRACLE. 1988. Physico-chemical and microbial stratification in a meromic-tic karstic lake of Spain. Verhandlungen Interna-tionale Vereinigung für Theoretische und Ange-wandte Limnologie, 23: 522–529.
WRIGHT, S. W. & S. W. JEFFREY. 2006. Pigmentmarkers for phytoplankton production. In: Thehandbook of environmental chemistry Volume2. Marine organic matter: Biomarkers, isotopesand DNA. J. K. Volkman (ed.): 71–104. SpringerVerlag, Basel.
14665 Limnetica 32(1), pàgina 157, 18/05/2013