chapter iv spectrophotometric and ultra performance liquid...
TRANSCRIPT

CHAPTER IV
SPECTROPHOTOMETRIC AND ULTRA PERFORMANCE LIQUID CHROMATOGRAPHIC ASSAY OF CLOMIFENE CITRATE

106
Section 4.0
DRUG PROFILE AND LITERATURE SURVEY
4.0.1 DRUG PROFILE
Clomifene citrate (CMC) is chemically known as 2-[p-(2chloro-1,2-
diphenylvinyl)phenoxy] triethylamine citrate (1:1) [1]. CMC is a white crystalline
solid. It has the molecular formula of C26H28ClNO • C6H8O7 and its molecular
mass is 598.10 g mol-1. The chemical structure of CMC is as shown below:
CMC is slightly soluble in water and alcohol, practically insoluble in
diethyl ether, and is freely soluble in glacial acetic acid, methanol, acetonitrile,
dichloromethane. It was first synthesized in 1956 by Frank Palopoli et al., of
Merrell chemistry department and approved for clinical use in 1967.
Clomifene is a non-steroidal compound which has both estrogenic and
antiestrogenic effect. It is a mixture of the Z isomer and E isomer and contains not
less than 30 % and not more than 50% of the Z isomer [2]. CMC is primarily used
for the treatment of anovulatory infertility [3]. It has also been used in the
treatment of male infertility [4], pubertal gynecomastia and seizure disorders [5].
Other uses of Clomifene are: as an adjunct in in-vitro fertilization, embryo transfer
and intrauterine insemination [6]. Clomifene exerts its therapeutic effects by
increasing the output of pituitary gonadotrophic hormones by blocking the binding
of endogenous estrogen to hypothalamic and pituitary estrogen receptors [7].

107
4.0.2 LITERATURE SURVEY OF ANALYTICAL METHODS FOR
CLOMIFENE CITRATE
The drug is official in the United States Pharmacopeia [2] and British
Pharmacopeia [8], which describes high performance liquid chromatographic
methods for its assay.
4.0.2.1 Spectrophotometric methods
Not many methods are found in the literature for the determination of
CMC in pharmaceuticals. Hewala [9] has reported three methods one by
derivative UV-spectrophotometry and the two by visible spectrophotometry. In
the first visible spectrophotometric method, the colored ion-pair formed with
methyl orange was extracted in to chloroform and absorbance measured at 420
nm; the second is based on the reaction of CMC with citric acid and acetic
anhydride in CHCl3 forming a blue colored chromogen measurable at 605 nm.
CMC is found to react with I2, ammonium molybdate or phosphomolybdic acid to
form molecular complex, the latter serving as a basis for the determination of drug
by three indirect methods [10]. A method based on the formation of a colored
radical anion (λmax: 460 nm) when CMC is treated with 2,3-dichloro-5,6-dicyano-
p-benzoquinone (DDQ) in chloroform medium has been reported by Mallikarjuna
Rao et al [11]. Ammonium reineckate is reported to form an insoluble ion-pair
complex with CMC [12]. The precipitate after washing with water and filtering
was dissolved in acetonitrile and absorbance measured at 509 nm offering a
method for the determination of CMC in the 0.2-1.8 mg ml-1 range.
4.0.2.2 Chromatographic methods
A close examination of the chromatographic methods for CMC reveals
that the reported methods deal with either separation of the E and Z isomers,
determination in body fluids or some interactions. A normal phase HPLC method
was used to separate cis and trans- isomers by Harman et al [13]. The
determination of CMC in biological matrices by liquid-phase extraction combined
with photochemical fluorescence HPLC has recently been reported by Xiaohong
et al [14]. A few more HPLC methods have been reported for the analysis of the
two clomifene isomers in biological matrices [15-18]. A sensitive and selective
LC-MS method [19] has been reported for the simultaneous determination of Z
and E isomers in plasma of patients undergoing treatment for the induction of
ovulation. In addition, high performance affinity chromatography [20] has been
108
used to examine the binding interaction of the isomers of CMC with human serum
albumin (HSA). In a similar study by the same authors [21], interactions of cis and
trans-clomifene with HAS in the presence of β-cyclodextrin has also been
reported.
4.0.2.3 Other techniques
Several other techniques including nmr spectroscopy [22], resonance Rayleigh
scattering spectrometry [23, 24], conductometry [12], potentiometry [25] and
capillary electrophoresis [26] are found in the literature for the assay of drug in
pharmaceuticals.
The only UV-spectrophotometric method [9] reported is applicable to
combined dosage form. The method based on ion-pair formation [9] requires strict
pH control and extraction step. Six procedures [10, 12] are cumbersome and
involve precipitation and filtration steps and are prone to loss of analyte there by
affecting the accuracy of the methods. The method based on charge-transfer
complexation reaction and involving the use of DDQ is handicapped by longer
contact time, narrow linear dynamic range and poor sensitivity. It is also apparent
from the literature survey that no chromatographic method has ever been applied
to determine CMC in pharmaceutical dosage forms.
Keeping the above points in view, the author has developed two UV and
five visible spectrophotometric methods, the latter being based on ion-pair
reaction without extraction, and charge-transfer complexation reactions. Also,
ultra performance liquid chromatography (UPLC) has been applied for the first
time to the determination of CMC in pharmaceuticals. The details about the
method development and validation of these methods are presented in this chapter.

109
Section 4.1
SIMPLE UV-SPECTROPHOTOMETRIC METHODS FOR THE
DETERMINATION OF CLOMIPHENE CITRATE IN
PHARMACEUTICALS
4.1.1 INTRODUCTION
A smart profile and utilization of UV-spectrometry in different assay have
been presented in Section 3.2. From the literature survey presented Section 4.0 it
is evident that one derivative UV-spectrophotometric method [9] has been
reported for the quantification of CMC.
In the literature, no stability-indicating UV-spectrophotometric methods
have ever been reported for the assay of CMC. In the present Section (4.1), two
simple, inexpensive, accurate, reproducible, and stability-indicating UV-
spectrophotometric methods for CMC are described. The methods are based on
the measurement of absorbance of CMC solution either in 0.1 M H2SO4 at 290 nm
in method A, or 0.1 M HCl at 289 nm in method B. Besides, the methods were
used to study the degradation of the drug under stress conditions as per the ICH
guidelines [27].
4.1.2 EXPERIMENTAL
4.1.2.1 Apparatus
The instrument used for absorbance measurement is the same as
described in Section 3.2.2.1.
4.1.2.2 Materials
All chemicals used were of analytical reagent grade. Doubly-distilled
water was used to prepare solutions wherever required. Hydrogen peroxide
(H2O2), sulphuric acid (H2SO4), hydrochloric acid (HCl) and sodium hydroxide
(NaOH) were purchased from Merck (Mumbai, India). Pure CMC
(Pharmaceutical grade) sample was kindly provided by Jubiliant Life Sciences,
Ltd. Nanjangud, Mysore, India, as a gift and used as received. Two brands of
tablets, namely, Siphene-25 and Siphene-100 (both from Maneesh
Pharmaceuticals Ltd., Mumbai) were obtained from the commercial sources.
Sulphuric acid (H2SO4, 0.1 M): Prepared by diluting concentrated acid (Merck,
Mumbai, India. Sp.gr.1.84) with water.
Hydrochloric acid, hydrogen peroxide, sodium hydroxide solutions
required for degradation study were prepared as described under Section 3.2.2.

110
Standard drug solution
Standard drug solutions of 100 µg ml-1 CMC were prepared by dissolving
accurately weighed 10 mg of pure drug in 0.1 M H2SO4 in method A, and 0.1 M
HCl in method B, separately.
4.1.2.3 General procedures
Method A
Varying aliquots (0.2, 0.5, 1.0, 2,0, 3.0, 4.0, 5.0 and 6.0 ml) of working
standard solution corresponding to 2-60 µg ml-1 CMC were taken in a series of 10
ml volumetric flasks and volume was made upto mark with 0.1 M H2SO4. The
absorbance of each solution was measured at 290 nm against 0.1 M H2SO4.
Method B
Into a series of 10 ml calibration flasks, aliquots of CMC standard solution
(100 µg ml-1) equivalent to 2-60 µg ml-1 CMC were accurately transferred and
volume was made upto mark with 0.1 M HCl. The absorbance of each solution
was measured at 289 nm versus 0.1 M HCl.
In both the cases, calibration curves were prepared and the concentration of
the unknown was read from the respective calibration curve or computed from the
regression equation derived using the Beer’s law data.
4.1.2.4 Procedure for tablets
Weighed amount of tablet powder equivalent to 10 mg of CMC was
transferred into a 100 ml volumetric flask. The content was shaken well with
about 50 ml of 0.1 M H2SO4/ 0.1 M HCl for 20 min. The mixture was diluted to
the mark with the respective acid. It was filtered using Whatman No 42 filter
paper. First 10 ml portion of the filtrate was discarded and a subsequent portion
was subjected to analysis by following the procedure described earlier.
Placebo blank analysis
A placebo blank of the composition: talc (75 mg), starch (85 mg), acacia
(80 mg), methyl cellulose (90 mg), sodium citrate (80 mg), magnesium stearate
(90 mg) and sodium alginate (75 mg) was made. By taking 20 mg, its solution
was prepared as described under “procedure for tablets” and then subjected to
analysis.
Procedure for synthetic mixture analysis
To 20 mg of the placebo blank of the composition described above, 10 mg
of CMC was added and homogenized, transferred to 100 ml calibrated flask and

111
the solution was prepared as described under “procedure for tablets” Then the
resulting solution were subjected to analysis using the procedures described
above. The analysis was done to study the interferences of excipients such as talc,
starch, acacia, methyl cellulose, sodium citrate, magnesium stearate and sodium
alginate in the assy.
Forced degradation study (Stability study)
In both the methods, a 3 ml aliquot of 100 µg ml-1 CMC was taken (in
triplicate) in a 10 ml volumetric flask and mixed with 5 ml of 5 M HCl (acid
hydrolysis) or 5 M NaOH (alkaline hydrolysis) or 5% H2O2 (oxidative
degradation) and boiled for 2 h at 80 °C in a hot water bath. The solution was
cooled to room temperature and diluted to the mark with 0.1 M HCl after
neutralization with base/acid. In thermal degradation, solid drug was kept in Petri
dish in oven at 100 °C for 24 h. After cooling to room temperature, 100 µg ml-1
CMC solutions in 0.1 M HCl/H2SO4 were prepared separately and absorbance
measured. For UV degradation study, the stock solutions of the drug (100 µg ml-1)
were exposed to UV radiation of wavelength 254 nm and of 1.2K flux intensity
for 48 h in a UV chamber. The solutions after dilution with either 0.1 M HCl or
0.1 M H2SO4 were assayed as described above.
4.1.3 RESULTS AND DISCUSSION
4.1.3.1 Spectral characteristics
The absorption spectra of 10 µg ml-1 CMC solution in 0.1 M H2SO4
(method A) and 30 µg ml-1 CMC solution in 0.1 M HCl (method B) were recorded
between 200 and 400 nm and showed absorption maxima at 290 and 289 nm, for
method A and method B, respectively. At these wavelengths, 0.1 M H2SO4 and
0.1 M HCl had insignificant absorbance. Therefore, the analysis of CMC was
carried out at 290 and 289 nm, for method A and method B, respectively (Figure
4.1.1).
4.1.3.2 Forced degradation study
The absorption spectra of the CMC solutions in 0.1 M H2SO4 and 0.1 M
HCl treated with acid, base hydrolysis, hydrogen peroxide, dry heat and UV
radiation were run in the range of (200-400 nm). The degradation was evaluated
based on the comparison of the UV spectra of “stressed CMC samples” with that
of the “standard CMC solution” [28].

112
The UV-spectra of 30 µg ml-1 CMC each in 0.1 M H2SO4 and 0.1 M HCl
after forced degradation are shown in Figure 4.1.2 to Figure 4.1.6. The drug was
found to undergo slight degradation in method B and remained intact in method A
after acid hydrolysis (Figure 4.1.2). Base hydrolysis resulted in significant
degradation in both methods (Figure 4.1.3). The absorption spectra of CMC
solution subjected to H2O2 showed that the drug experienced slight degradation in
method A and significant degradation in method B (Figure 4.1.4) The drug did
not undergo degradation after exposure to heat and light as revealed by the
absorption spectra which are similar to that of unstressed CMC solution (Figure
4.1.5 and Figure 4.1.6).The results of this are presented in Table 4.1.0.
(a) (b)
Figure 4.1.1 Absorption spectra of 10 µg ml-1 CMC; (a) in 0.1 M H2SO4; (b) in 0.1 M HCl.
4.1.3.3 Method validation
Linearity and sensitivity
The regression parameters calculated from the calibration graphs data, are
presented in Table 4.1.2. Beer’s law was obeyed over the concentration ranges
shown in Table 4.1.2, and the linearity of calibration graphs (Figure 4.1.7) was
demonstrated by the high values of the correlation coefficient (r) and the small
values of the y-intercepts of the regression equations The molar absorptivity,
Sandell sensitivity values of both methods are also shown in Table 4.1.2.The
limits of detection and quantification were calculated as per the current ICH
guidelines [27] and are presented in Table 4.1.2.

113
Table 4.1.1 Results of degradation study
Degradation condition % Degradation Method A Method B
No degradation ( control) Zero Zero
Acid hydrolysis (5 M HCl , 80°C, 2 hours)
Zero 4.4
Base hydrolysis (5 M NaOH , 80°C, 2 hours)
Total Total
Oxidation (5% H2O2 , 80°C, 2 hours) 11.1 Total
Water hydrolysis (water , 80°C, 2 hours)
Thermal (105°C, 4 hours) Zero Zero
Photolytic (1.2 K flux, 48 hours) Zero Zero
(a) (b)
Figure 4.1.2 Absorption spectra of 30 µg ml-1CMC after acid hydrolysis (5M HCl)(a) in 0.1 M H2SO4;(b)in 0.1 M HCl .
(a)

114
(b)
Figure 4.1.3 Absorption spectra of 30 µg ml-1CMC after base hydrolysis (5M NaOH)(a) in 0.1 M H2SO4;(b)in 0.1 M HCl .
(a)
(b)
Figure 4.1.4 Absorption spectra of 30 µg ml-1CMC after oxidative degradation
(5% H2O2) a) in 0.1 M H2SO4;(b)in 0.1 M HCl .

115
(a)
(b)
Figure 4.1.5 Absorption spectra of 30 µg ml-1CMC after thermal degradation
(105 oC for 4 hours)(a) in 0.1 M H2SO4;(b)in 0.1 M HCl.
Precision and accuracy
Accuracy was evaluated as percentage relative error between the
measured and taken concentrations of CMC (RE %). The results, compiled in
Table 4.1.3, show that the accuracy is good for both methods. Precision of the
methods was calculated in terms of intermediate precision (intra-day and inter-
day). Three different concentration of CMC (within the working limits) were
analyzed in seven replicates during the same day (intra-day precision) and five
consecutive days (inter-day precision). RSD (%) values (Table 4.1.3) of the intra-
day and inter-day studies showed that the precision was good for the both
methods.

116
(a)
(b)
Figure 4.1.6 Absorption spectra of 30 µg ml-1CMC after photo degradation (1200
flux hours)(a) in 0.1 M H2SO4;(b)in 0.1 M HCl .
Selectivity
A systematic study was performed to determine the effect of matrix by
analyzing the placebo blank and synthetic mixture containing CMC. A placebo
blank was prepared by following the procedure described in Section 4.1.2.3 and
then subjected to analysis. The absorbance of the placebo solution in each case
was almost equal to the absorbance of the blank which revealed no interference.
To assess the role of the inactive ingredients on the assay of CMC, a synthetic
mixture was separately prepared by adding 10 mg of CMC to the placebo. The

117
drug was extracted and solution prepared as described under the general procedure
for tablets. The solutions were analyzed by following the recommended
procedures. The percentage recovery values of CMC obtained from this study
were in the range from 99.32 to 102.54. This unequivocally demonstrated the non-
interference of the inactive ingredients in the assay of CMC. Further, the slopes of
the calibration plots prepared from the synthetic mixture solutions were about the
same as those prepared from pure drug solutions.
Method A Method B
Figure 4.1.7. Calibration curves.
Table 4.1.2. Sensitivity and regression parameters
Parameter Method A (0.1 M H2SO4)
Method B (0.1 M HCl)
max, nm 290 289 Linear range, µg ml-1 2.0 – 60.0 2.0 – 60.0
Molar absorptivity(ε), l mol-1 cm-1 1.0 × 10⁴ 1.0 × 10⁴
Sandell sensitivity, µg cm-2 0.0592 0.0568 Limit of detection (LOD), g ml-1 0.80 0.94 Limit of quantification (LOQ), g ml-1 2.42 2.84 Regression equation, Y* Intercept (a) 0.0104 0.0012 Slope (b) 0.0178 0.0178 Standard deviation of a (Sa) 0.1262 0.0441 Standard deviation of b (Sb) 0.0070 0.0025 Regression coefficient (r) 0.9998 0.9999
*Y=a+bX, Where Y is the absorbance; X is concentration in µg ml-1; a intercept and b slope.
0
0.2
0.4
0.6
0.8
1
1.2
0 10 20 30 40 50 60
Abso
rban
ce
concentration of CMC, µg ml-1
0
0.2
0.4
0.6
0.8
1
1.2
0 10 20 30 40 50 60
Abso
rban
ce
Concentration of CMC, µml-1

118
Table 4.1.3. Results of intra-day and inter-day accuracy and precision study
%RE. Percent relative error, %RSD. Relative standard deviation
Ruggedness
Method ruggedness was demonstrated having the analysis done by four
analysts, and also by a single analyst performing analysis with four different
cuvettes in the same laboratory. Intermediate RSD (%) in both instances were in
the range 1.28-2.85% indicating acceptable ruggedness. The results are presented
in Table 4.1.4.
Table 4.1.4 Results of method ruggedness study expressed as intermediate
precision, RSD (%)
Method CMC taken, µg ml-1
Inter-analysts RSD (%) (n=4)
Inter-cuvettes RSD (%) (n=4)
A 20.0 30.0 40.0
1.28 2.06 1.62
2.85 2.46 2.06
B 20.0 30.0 40.0
1.75 1.98 2.05
2.25 2.33 2.10
Analysis of tablets
The proposed methods were applied for the quantification of CMC in
commercial tablets. The results were compared with those of official method [2]
in which the sample was chromatographed on a column (4.6 mm × 25 cm)
Method CMC taken, µg ml-1
Intra-day accuracy and precision
(n=7)
Inter-day accuracy and precision
(n=5) CMC found, µg ml-1
%RE %RSD CMC found
µg ml-1 %RE %RSD
A
20.0 30.0 40.0
20.37 30.30 39.48
1.76 1.01 1.29
0.97 1.53 1.16
20.46 30.35 39.62
1.84 1.66 1.32
1.84 1.55 1.87
B 20.0 30.0 40.0
20.31 30.49 40.27
0.88 1.10 1.73
1.54 1.63 0.70
20.42 30.53 40.22
1.12 1.33 1.92
1.18 1.60 1.46

119
containing packing L26 with a mobile phase consisting of methanol, water and
triethylamine (55:45:0.3), at a flow rate of 1.0 ml min-1 and the UV-detection
being set at 233 nm. The assay was performed for two different brands of tablets
containing 25 and 100 mg of active ingredient (Siphene-25 and Siphene-100) as
described earlier. Statistical analysis of the results did not detect any significant
difference between the performance of the proposed methods and reference
method with respect to accuracy and precision as revealed by the Student’s t-value
and variance ratio F-value [29]. The results of this study are presented in Table
4.1.5.
Table 4.1.5 Results of analysis of tablets by the proposed methods and statistical
comparison of the results with the official method
*Mean value of five determinations.
Recovery study
To further assess the accuracy of the methods, recovery experiments were
performed by applying the standard-addition technique. The recovery was
assessed by determining the agreement between the measured standard
concentration and added known concentration to the sample. The test was done by
spiking the pre-analyzed tablet powder with pure CMC at three different levels
(50, 100 and 150 % of the content present in the tablet powder (taken) and the
total was found by the proposed methods. Each test was repeated three times. In
all the cases, the recovery percentage values ranged between 99.06 and 100.76%
with relative standard deviation in the range 0.58-1.72%. Closeness of the results
to 100% showed the fairly good accuracy of the methods. The results are shown in
Table 4.1.6.
Tablet brand Name#
Nominal amount (mg/tablet)
Found* (Percent of label claim ± SD) Official method Method A Method B
Siphene
25
99.36±0.68
100.2±1.17 t=2.25 F=2.96
99.65±1.46 t=1.03 F=4.60
Siphene 100 100.92±0.72 100.1±0.89 t=2.52 F=1.52
99.96±0.89 t=2.34 F=2.82

120
Table 4.1.6. Results of recovery study via standard-addition method.
*Mean value of three determinations
Tablets studied
Method A Method B
CMC in tablet, µg ml-1
Pure CMC added, µg ml-1
Total found, µg ml-1
Pure CMC recovered (Percent±SD*)
CMC in tablet, µg ml-1
Pure CMC added, µg ml-1
Total found, µg ml-1
Pure CMC recovered (Percent±SD*)
Siphene-25
20.04 20.04 20.04
10.0 20.0 30.0
29.95 40.10 49.66
99.17±1.72 100.33±0.98 98.76±1.06
19.93 19.93 19.93
10.0 20.0 30.0
29.96 39.77 49.64
100.37±0.83 99.23±1.30 99.06±0.78
Siphene-100
20.02 20.02 20.02
10.0 20.0 30.0
30.07 40.17 49.86
100.50±0.72 100.76±1.38 99.46±1.06
19.96 19.96 19.96
10.0 20.0 30.0
29.86 39.94 50.08
99.09±0.58 99.92±1.30 100.43±0.65

121
Section 4.2
APPLICATION OF EXTRACTION-FREE ION-PAIR COMPLEXATION
REACTION FOR THE SPECTROPHOTOMETRIC DETERMINATION
OF CLOMIPHENE CITRATE IN PHARMACEUTICALS
4.2.1 INTRODUCTION
According to IUPAC [30] ion-pair is a pair of oppositely charged ions held
together by coulombic attraction without formation of a covalent bond. Modern
pharmaceutical analysis demands analytical methods for the determination of
desired component when it is present in a complex dosage formulation followed
by its instrumental determination. Extractive spectrophotometry is placed at the
top for such type of analysis because it can be applied to the determination of an
individual component in the presence of routine excipients and filling materials.
This aspect of spectrophotometric analysis is of great interest since it offers
distinct possibilities for the assay of a particular component in a complex dosage
formulation [31].
In an extractive spectrophotometric analysis, ion-association is a chemical
reaction whereby ions of opposite electrical charge come together in solution to
form a distinct chemical entity. Ion-pairs are formed when a cation and anion,
present in aqueous phase (aq), combine together [32-35] and these complexes are
coloured when extracted into a organic solvent (org).
An+(aq) + Bm-
(aq) AB(n-m)+(org)
A hypothesis based on the possible role of solvated ion pair species in enhancing
the extractive process, proposed by Hull [36] and Higuchi [37], assumes that the
free energy involved in the transference of the ionic components from the water
phase to form simple ion pairs in the organic phase is predominant. Many ion-pair
extractive spectrophotometric methods have earlier been used in the assay of
many pharmaceutically important substances and include tilidine [38], doxazosine
mesylate [39], cyproheptadine hydrochloride [40], enoxacine [41], enrofloxacin
and pefloxacin [42], promethazine theoclate [43], maprotilin hydrochloride [44],
berberine and benzethonium [45], lamotrigine [46, 47], quetiapine fumarate [48]
and alfuzosin hydrochloride [49], to mention a few. In these cases, an ion-pair is
formed between a protonated basic compound and an anionic dye. At a specific
pH, the ion-pair, which is immiscible with water, is extracted into an organic
solvent and the concentration of the drug is determined spectrophotometrically.

122
Though, ion-pair extractive spectrophotometry has several advantages, it has some
difficulties and inaccuracies arising from incomplete extraction or the formation
of emulsions between the organic solvent and the basic compound containing
solution. In response to this problem, extraction-free ion-pair spectrophotometry is
gaining importance in the field of pharmaceutical analysis. Few articles were
published for the analysis of pharmaceutical compounds through ion-pair
formation without involving extraction [50-55].
In the literature survey presented in Section 4.0.2, an extractive
spectrophotometric method for the determination of CMC through the ion pair
complex formation with methyl orange as a reagent [9] has been reported. The
method requires strict pH control, tedious and time-consuming extraction step and
is prone to inaccuracy due to incomplete extraction of the analyte. In this Section
(4.2), three simple extraction-free spectrophotometric methods using three
sulphonthalein dyes are described. The methods are based on formation of yellow
ion-pairs between clomiphene and three sulphonthalein dyes; bromothymol blue
(BTB) (method A), bromocresol green (BCG) (method B), and bromocresol
purple (BCP) (method C), in dichloromethane medium followed by absorbance
measurement at 420, 415 and 425 nm, respectively. The method development,
validation and its applications are presented in this Section (4.2).
4.2.2 EXPERIMENTAL
4.2.2.1 Instrument
The instrument is the same that was described in Section 2.2.2.1.
4.2.2.2 Reagents and materials
All reagents were of analytical reagent grade and HPLC grade organic solvents
were used throughout the investigation.
Bromothymol Blue (0.1%), Bromocresol green (0.05%) and Bromocresol
purple (0.1%): The solutions of bromothymol blue (BTB, Loba Chemie, Mumbai,
India), bromocresol green (BCG, Merck, Mumbai, India) bromocresol purple
(BCP, Loba Chemie, Mumbai, India) were prepared in dichloromethane (Merck,
Mumbai, India, Sp. gr. 1.32).
Standard CMC solution: A stock standard CMC solution (100 µg ml-1) was
prepared by dissolving 10 mg of pure CMC in dichloromethane and diluting to the
mark in a 100 ml calibrated flask with dichloromethane. The working standard
solutions of 50 µg ml-1 (for method A) and 40 µg ml-1 (for method B and method

123
C) were then prepared by suitable dilution of the stock solution with
dichloromethane.
The pharmaceutical preparations used in this study were the same mentioned in
previous section.
4.2.2.3 Assay procedures
Method A (using bromothymol blue)
Different aliquots (0.2-3.5 ml) of a standard CMC solution (50 µg ml-1)
were transferred into a series of 5 ml calibrated flasks using a micro burette and to
each flask was added 1 ml of 0.1% BTB solution. The mixture was diluted to the
volume with dichloromethane and mixed well. The absorbance of each solution
was measured at 420 nm against a reagent blank after 5 min.
Method B (using bromocresol green)
Different aliquots (0.2-3.5 ml) of a standard CMC (40 µg ml-1) solution
were transferred into a series of 5 ml calibrated flasks, as described above. To
each flask was added 1 ml of 0.05% BCG solution and diluted to the volume with
dichloromethane and mixed well. The absorbance of each solution was measured
at 415 nm against a reagent blank after 5 min.
Method C (using bromocresol purple)
Different aliquots (0.2-3.5 ml) of a standard CMC (40 µg ml-1) solution
were transferred into a series of 5 ml calibrated flasks, as described above. To
each flask was added 1 ml of 0.1% BCP solution and diluted to the volume with
dichloromethane and mixed well. The absorbance of each solution was measured
at 425 nm against a reagent blank after 5 min.
Procedure for tablets
Ten tablets were weighed accurately and ground into fine powder. An
amount of the powder equivalent to 10 mg of CMC was weighed into a 100 ml
calibrated flask containing about 60 ml of dichloromethane. The solution was
shaken thoroughly for about 15-20 min, diluted to the mark with dichloromethane,
and filtered using a Whatman No. 42 filter paper. First 10 ml portion of filtrate
was discarded and subsequent portions were subjected to analysis by the
procedure described above after dilution to 50 and 40 µg ml-1 CMC with
dichloromethane.

124
Placebo blank analysis
A placebo blank of the composition: talc (75 mg), starch (85 mg), acacia
(80 mg), methyl cellulose (90 mg), sodium citrate (80 mg), magnesium stearate
(90 mg) and sodium alginate (75 mg) was made. By taking 20 mg of it, solution
was prepared as described under “Procedure for tablets”. The analyses were
performed using the procedures described above.
Procedure for synthetic mixture analysis
To 20 mg of placebo blank of the composition described above, 10 mg of
CMC was added and homogenized, transferred to 100 ml calibrated flask and the
solution was prepared as described under “Procedure for tablets”. Then the
resulting solution after appropriate dilution was subjected to analysis using the
procedure described above.
4.2.3 RESULTS AND DISCUSSION
4.2.3.1 Absorption spectra
The absorption spectra of the ion-pair complexes, formed between CMC
and each of BTB, BCG and BCP recorded at 360-500 nm against the respective
blank solution are shown in Figure 4.2.1. The yellow ion-pair complexes showed
maximum absorbance at 420, 415 and 425 nm for CMC-BTB, CMC-BCG and
CMC-BCP, respectively. The measurements were thus made at these wavelengths.
4.2.3.2 Reaction pathway
Chemically, the structure of CMC features its basic nature. This structure
suggests the possibility of utilizing an anionic dye as chromogenic reagent. In
dichloromethane, CMC does not absorb in the visible region. The dyes employed
have insignificant absorbance at the wavelength of measurement. In contrast,
when a solution of BTB/BCG/BCP in dichloromethane, was added to the drug
solution, an intense yellow coloured product measurable at 420, 415 or 425 nm, in
method A, method B and in method C respectively, was produced immediately
(Fig. 4.2.1). This is due to an opening of lactoid ring and subsequent formation of
quinoid group [56]. It is supposed that the two tautomers are present in
equilibrium but due to strong acidic nature of the sulphonic acid group, the
quinoid body must predominate.

125
Figure 4.2.1 Absorption spectra of: a. CMC-BTB ion-pair complex (20.0 µg ml-1 CMC), b. blank (method A), c. CMC-BCG ion-pair complex (16.0 µg ml-1 CMC), d. blank (method B), e. CMC-BCP ion-pair complex (16.0 µg ml-1 CMC) and f. blank (method C).
Finally, protonated CMC forms ion-pair with the dye. The possible
reaction pathways are shown in Scheme 4.2.1, Scheme 4.2.2 and Scheme 4.2.3.
Anionic dye such as BTB/BCG/BCP forms ion pair complex with positively
charged drug. Each drug-dye ion-pair complex molecule, with two oppositely
charged ions, behaves as a single unit held together by an electrostatic force of
attraction.
4.2.3.3 Method development
Effect of solvent
In order to select the suitable solvent for the formation of ion-pair
complex, the reaction of CMC with BTB, BCG or BCP was studied in different
solvents. Better results were obtained when CMC was dissolved dichloromethane
in all the three methods than other solvents like chloroform, 1,2-dichloroethane,
0
0.1
0.2
0.3
0.4
0.5
0.6
360 380 400 420 440 460 480 500
Abso
rban
ce
Wavelength, nm
a
b0
0.1
0.2
0.3
0.4
0.5
0.6
360 380 400 420 440 460 480 500
Abso
rban
ce
Wavelength, nm
c
d
0
0.1
0.2
0.3
0.4
0.5
0.6
360 380 400 420 440 460 480 500
Abso
rban
ce
Wavelength, nm
e
f

126
acetonitrile or carbon tetrachloride. In the case of dyes, dichloromethane was
preferred to chloroform, acetone, acetonitrile, 2-propanol, 1,2-dichloroethane, 1,4-
dioxane, methanol and ethanol because, as the complex formed in these solvents
had very low sample absorbance values or higher blank absorbance values.
Therefore, dichloromethane was chosen as solvent. C3H7
HO
BrCH3
SO2
O
C3H7OH
Br
C3H7HO
BrCH3
SO3H
C3H7O
Br
C3H7HO
BrCH3
SO3-
C3H7O
Br+ H+
BTB(lactoid ring) (quinoid ring)
C3H7HO
BrH3C SO3
-
C3H7O
Br+ H+
Cl O N
HOO
HO
O OH
OHO
+
CMC
Cl O N
HOO
HO
O OH
OHO
H+ C3H7
HO
BrH3C SO3
C3H7O
Br-
1:1 CMC-BTB complex Scheme 4.2.1. The possible reaction pathway for the formation of CMC-BTB ion-
pair complex.
OHBrBr
HOBr Br
SO2O
(lactoid ring)BCG
OBrBr
HOBr Br
SO3H
(quinoid ring)
OBrBr
HOBr Br
SO3-
+ H+
Cl O N
HOO
OH
O OH
OHO
+
CMC
OBrBr
HOBr Br
SO3-
+ H+Cl O N
HOO
HO
O OH
OHO
H+
OBrBr
HOBr Br
SO3-
1:1 CMC-BCG complexScheme 4.2.2. The possible reaction pathway for the formation of CMC-BCG ion-
pair complex.

127
Cl O N
HOO
HO
O OH
OHO
Cl O N
HOO
HO
O OH
OHO
H+
BrHO
H3C
SO2
O
CH3OH
Br
BrHO
H3C
SO3H
CH3O
Br
BrHO
H3C
SO3-
CH3O
Br+ H+
+
BrHO
H3C
SO3-
CH3O
Br+ H+
BrHO
H3C
SO3
CH3O
Br-
BCP
(lactoid ring) (quinoid ring)
CMC1:1 CMC-BCP complex
Scheme 4.2.3. The possible reaction pathway for the formation of CMC-BCP ion-
pair complex.
Effect of volume of dye and reaction time, and stability of the ion-pair
complex
In order to find out the optimum amount of dye required to obtain
maximum absorbance, experiments were performed separately by measuring the
absorbance of the final solution resulting from the reaction mixture containing a
fixed concentration of CMC and various amounts of the dye. It was found that 1
ml of dye solution (0.1% BTB in method A, 0.05% BCG in method B and 0.1%
BCP in method C) was sufficient to produce maximum and reproducible
absorbance (Fig. 4.2.2). The reaction time or standing time after the addition of
dye was also examined. A 5 min standing time was sufficient for the complete
formation of ion-pair complex. The absorbance of the resulting ion-pair complex
was found to be stable for at least 2 h in method A, 3h in method B and 2.5 h in
method C at room temperature (28±2 °C).
Investigation of composition of ion-pair complex
The composition of the ion-pair complex formed between CMC and
BTB/BCG/BCP was established by applying Job’s method of continuous
variations [57] using equimolar concentrations of CMC and the dye. In method A,
CMC and dye concentration used were 6.79 ×10⁻⁵M, 4.20×10⁻⁵ M each in method
B, where as 5.61 × 10⁻⁵ M each in method C. The experiments were performed by
mixing equimolar solutions of the drug and dye by maintaining the total volume at
5.0 ml. In all the cases, the plot reached a maximum value at a mole fraction of
0.5 which indicated the formation of 1:1 (CMC:dye) complex (Figure 4.2.3), and

128
the results revealed that the formation of ion -pair complex between drug and
reagent followed a 1:1 reaction stoichiometry.
The log Kf values were found to 5.432, 7.562 and 6.225 for method A,
method B, and method C, respectively.
(a) (b)
(c)
Figure 4.2.2 Effect of dye concentration on the formation of ion-pair complex
(a) Method A (20 µg ml-1 CMC, (b) Method B (16.0 µg ml-1 CMC),
and (c) Method C (16.0 µg ml-1 CMC)
4.2.3.4 Method validation
Linearity and sensitivity
Under optimum experimental conditions for CMC determination, the
standard calibration curves for CMC with BTB, BCG and BCP were constructed
by plotting absorbance versus concentration (Figure 4.2.4). The regression
parameters calculated from the calibration graphs data, are presented in Table
4.2.1. Beer’s law was obeyed over the concentration ranges given in Table 4.2.1
and the linearity of calibration graphs was demonstrated by the high values of the
correlation coefficient (r) and the small values of the y-intercepts of the regression
00.10.20.30.40.50.6
0 0.5 1 1.5 2 2.5 3Volume of 0.1% BTB, ml
Abso
rban
ce
0
0.1
0.2
0.3
0.4
0.5
0.6
0 0.5 1 1.5 2 2.5 3
Abso
rban
ce
Volume of 0.05% BCG, ml
00.10.20.30.40.50.6
0 0.5 1 1.5 2 2.5 3
Abso
rban
ce
Volume of 0.1% BCP, ml

129
equations. The apparent molar absorptivities of the resulting colored ion-pair
complexes, Sandell sensitivities, detection and quantification limits were
calculated and shown in Table 4.2.1.
(a) (b)
(c)
Figure 4.2.3 Job’s plots obtained for ion-pair complexes from equimolar
solutions of; (a) CMC & BTB (b) CMC & BCG and (c) CMC &
BCP
Method A Method B
0
0.1
0.2
0.3
0.4
0.5
0.6
0 0.2 0.4 0.6 0.8 1
Abso
rban
ce
Mole ratioVCMC/(VCMC+VBTB)
00.10.20.30.40.50.6
0 0.2 0.4 0.6 0.8 1
Abso
rban
ce
Mole ratioVCMC/(VCMC+VBCG)
0
0.1
0.2
0.3
0.4
0.5
0 0.2 0.4 0.6 0.8 1
Abs
orba
nce
Mole ratio VCMC/(VCMC+VBCP)
0
0.2
0.4
0.6
0.8
1
0 5 10 15 20 25 30 35
Abso
rban
ce
Concentration of CMC, µg ml-1
0
0.2
0.4
0.6
0.8
1
0 5 10 15 20 25 30
Abso
rban
ce
Concentration of CMC, µg ml-1

130
Method C
Figure 4.2.4 Calibration curves
Table 4.2.1.Sensitivity and regression parameters
Parameter Method A Method B Method C
max, nm 420 415 425
Linear range, µg ml-1 2-35 1.6-28 1.6-28
Color stability, hrs 2 3 2.5
Molar absorptivity(ε), l mol-1 cm-1 1.5× 10⁴ 1.8 × 10⁴ 1.8 × 10⁴
Sandell sensitivitya, µg cm-2 0.0383 0.0318 0.0329 Limit of detection (LOD), g ml-1 0.33 0.51 0.62 Limit of quantification (LOQ), g ml-1 0.99 1.55 1.89 Regression equation, Yb
Intercept (a) 0.0016 0.0063 0.0205 Slope (b) 0.0262 0.0307 0.0345 Standard deviation of a (Sa) 0.0326 0.0917 0.0923
Standard deviation of b (Sb) 0.0013 0.0042 0.0048 Regression coefficient (r) 0.9988 0.9997 0.9978
a Limit of determination as the weight in µg ml-1 of solution, which corresponds to an absorbance ofA = 0.001 measured in a cuvette of cross-sectional area 1 cm2 and l = 1 cm.b Y=a+bX, Where Y is the absorbance, X is concentration in µg ml-1. Precision and accuracy
The precision of the proposed methods was calculated in terms of
intermediate precision (intra-day and inter-day). Three different concentration of
CMC (within the working limits) were analyzed in seven replicates during the
same day (intra-day precision) and five consecutive days (inter-day precision).
The RSD (%) values of intra-day and inter-day studies showed that the precision
was good for all the three methods (Table 4.2.2). The accuracy of the methods
was evaluated as percentage relative error between the measured concentrations
0
0.2
0.4
0.6
0.8
1
0 5 10 15 20 25 30
Abso
rban
ce
Concentration of CMC, µg ml-1

131
and taken concentrations for CMC (Bias %). The results, compiled in Table 4.2.2,
show that the accuracy is good for all the three methods.
Table.4.2.2. Results of intra-day and inter-day accuracy and precision study
Method
CMC taken
µg ml-1
Intra-day accuracy and precision
(n=5)
Inter-day accuracy and precision
(n=5) CMC found
µg ml-1 %RE %RSD
CMC found
µg ml-1 %RE %RSD
A
10.0 10.20 1.78 1.11 10.25 1.65 1.18
20.0 20.31 1.58 2.53 20.38 1.72 2.48
30.0 30.35 1.19 0.91 30.46 1.59 1.41
B
8.0 7.86 1.66 1.87 7.92 2.06 1.76 16.0 16.07 0.47 1.45 16.04 1.47 2.05
24.0 24.27 1.14 0.63 24.35 1.84 1.23
C
8.0 8.08 1.08 1.41 8.13 1.38 1.38 16.0 15.89 0.63 1.28 15.78 1.43 1.42
24.0 23.52 1.95 1.74 23.67 1.90 1.66 RE- Relative error and RSD- Relative standard deviation
Selectivity
A systematic study was performed to determine the effect of matrix by
analyzing the placebo blank and synthetic mixture containing CMC. Placebo
blank and synthetic mixtures were prepared as described under Section 4.1.3.3.
The results obtained from placebo blank and synthetic mixture analyses revealed
that the inactive ingredients used in the preparation did not interfere in the assay
of active ingredient. The absorbance values obtained from the placebo blank
solution were almost equal to the absorbance of the blank which revealed no
interference from the adjuvants. To study the role of additives added to the
synthetic sample, 2 ml of the resulting solution prepared by using synthetic
mixture (50 µg ml-1 in CMC from method A and 40 µg ml-1 from method B and
method C) was assayed (n = 4). The percentage recoveries of 97.84 – 102.75 with
RSD (%) values in the range 1.09 – 2.43 demonstrated the accuracy as well as the
precision of the proposed methods and complement the findings of the placebo
blank analysis with respect to selectivity.

132
Robustness and ruggedness
The robustness of the methods was evaluated by making small incremental
changes in the volume of dye and contact time, and the effect of the changes was
studied on the absorbance of the ion-pair complex systems. The changes had
negligible influence on the results as revealed by small intermediate precision
values expressed as % RSD (≤ 1.82%). Method ruggedness was demonstrated by
having the analysis done by four analysts, and also by a single analyst performing
analysis on four different instruments in the same laboratory. Intermediate
precision values (%RSD) in both instances were in the range 1.64 – 3.27%
indicating acceptable ruggedness. The results are presented in Table 4.2.3.
Table 4.2.3. Results of robustness and ruggedness expressed as intermediate
precision (%RSD)
a Dye (BTB, BCG and BCP) volumes used were 0.9, 1.0 and 1.1 ml.
b Reaction time were 4.0, 5.0 and 6.0 min Application
The proposed methods were applied for the quantification of CMC in
commercial tablets. The results obtained were compared with those obtained using
official method [2].Statistical analysis of the results did not detect any significant
difference in the performance of the proposed method to the reference method
with respect to accuracy and precision as revealed by the Student’s t-value and
variance ratio F-value. The results of this study are given in Table 4.2.4
Method
CMC taken,
µg ml-1
Method robustness Method ruggedness Parameters altered
Dye, mla
RSD, % (n = 3)
Time, minb RSD,% (n=3)
Inter-analysists’ RSD, % (n = 4)
Inter-cuvettes’ RSD, % (n = 3)
A
10.0 1.13 1.28 1.46 2.86 20.0 1.19 1.54 0.92 3.27
30.0 1.26 1.31 0.84 1.64
B
8.0 1.34 1.82 0.76 2.66
16.0 1.28 1.12 1.26 3.25 24.0 1.23 1.64 1.01 3.12
8.0 1.26 1.42 1.56 2.83
C 16.0 1.21 1.17 0.84 2.46 24.0 1.17 1.29 1.16 3.14

133
Table 4.2.4. Results of analysis of tablets by the proposed methods and
comparison with the reference method
*mg/tablet in tablets .a Mean value of five determinations.
Recovery study
To further assess the accuracy of the proposed methods, recovery
experiment was performed by applying the standard-addition technique. The
recovery was assessed by determining the agreement between the measured
standard concentration and added known concentration to the sample. The test
was done by spiking the pre-analysed tablet powder with pure CMC at three
different levels (50, 100 and 150 % of the content present in the tablet powder
(taken) and the total was found by the proposed method. Each test was repeated
three times. From this test the percentage recovery values were found in the range
of 98.85 to 102.55 with standard deviation values from 0.62 – 2.51%. Closeness
of the results to 100% showed the fairly good accuracy of the method. These
results are shown in Table 4.2.5.
Tablet Brand nameb
Label claim*
Founda (Percent of label claim ±SD)
Reference method
Proposed methods A B C
Siphene-25
25
99.36±0.68
98.81±1.19 t =1.53 F=3.06
100.46±14 t =2.29 F =3.88
98.97±1.12 t =0.64 F =2.71
Siphene-100 100
100.92±0.72
99.60±1.37 t=2.76 F=3.62
100.24±1.2 t =1.75 F=3.16
100.76±1.3 t =0.82 F =2.52

134
Table 4.2.5. Results of recovery study by standard addition method
aMean value of three determinations.
Tablets
studied
Method A Method B Method C
CMC in
tablets,
µg ml-1
Pure
CMC
added,
µg ml-1
Total
found,
µg ml-1
Pure CMC
recovered*,
Percent±SD
CMC in
tablets,
µg ml-1
Pure
CMC
added,
µg ml-1
Total
found,
µg ml-1
Pure CMC
recovered*,
Percent±SD
CMC
in
tablets
µg ml-1
Pure
CMC
added,
µg ml-1
Total
found,
µg ml-1
Pure CMC
recovered*,
Percent±SD
Siphene
25
9.88
9.88
9.88
5
10
15
14.97
21.51
24.59
101.92±1.70
99.24±1.15
99.07±2.25
8.03
8.03
8.03
4
8
12
12.06
16.00
20.30
100.92±1.68
99.65±1.11
102.27±2.54
7.91
7.91
7.91
4
8
12
11.88
15.95
19.89
99.44±2.24
100.49±1.47
99.90±0.81
Siphene
100
9.96
9.96
9.96
5
10
15
14.94
21.63
24.76
99.77±1.25
100.47±0.62
98.85±0.75
8.01
8.01
8.01
4
8
12
12.11
16.09
20.10
102.55±2.51
101.02±1.11
100.76±0.50
8.06
8.06
8.06
4
8
12
12.12
16.18
19.94
101.69±1.72
101.58±1.50
99.01±1.14

135
Section 4.3
SIMPLE SPECTROPHOTOMETRIC ASSAY OF CLOMIPHENE CITRATE
IN PHARMACEUTICALS THROUGH CHARGE-TRANSFER
COMPLEXATION REACTION
4.3.2 INTRODUCTION
The chemistry and analytical utility of charge transfer complexation reaction
in spectrophotometric assay of organic compounds of pharmaceutical importance has
been reviewed in Section 2.3.1. The literature survey presented in Section 4.0.2.1
reveals a spectrophotometric method [11] based on charge transfer complexation
reaction, where DDQ is used as a chromogenic agent in chloroform medium. The
method involves the conversion of CMC to free base through base treatment followed
by extraction in to chloroform before reacting with DDQ in the same medium. This
looks tedious, prone to loss of analyte and seems less sensitive. By employing
dioxane-acetonitrole medium, the performance characteristics were greatly improved
by the author where extraction step is completely eliminated. Besides DDQ, p-
chloranilic acid (p-CAA) was also employed thus leading to two methods based on C-
T complex formation reactions, where CMC serves as n-donor and p-CAA in method
A and DDQ in method B as π-acceptors. The details are present in this Section, 4.3.
4.3.2 EXPERIMENTAL
4.3.2.1 Apparatus
The instrument used for absorbance measurements was the same as described
in Section 2.2.2.1.
4.3.2.2 Materials
1,4-Dioxane and acetonitrile (spectroscopic grade) were purchased from
Merck, Mumbai, India. All other chemicals used were of analytical reagent grade.
The pure CMC and its tablets used were the same as described in Section 4.1.
4.3.2.3 Reagents
p-Chloranilic Acid (0.1 %, w/v): The solution was prepared by dissolving 0.10 g of
p-chloranilic acid (Rolex lab reagents, India) in 100 ml of dioxane.
DDQ (0.1 %, w/v): The solution was prepared by dissolving 0.10 g of DDQ (Merck,
Mumbai, India) in 100 ml of 1,4-dioxane (Merck, Mumbai, India).
136
Standard CMC stock solution
For method A, a 200 µg ml-1 CMC stock solution was prepared by dissolving
20 mg of pure drug in acetonitrile in a 100 ml volumetric flask and the solution was
diluted to the mark with the same solvent, and the above 200 µg ml-1 CMC stock
solution was diluted with acetonitrile to get 100 µg ml-1 and used for the assay in
method B.
2.3.2.4 General procedures
Method A
Varying aliquots (0.2, 0.5, 1.0, 2.0, 3.0 and 4.0 ml) of CMC solution (200 µg ml-1)
were accurately measured into a series of 5 ml calibrated flasks by means of micro
burette. To each flask was added 1 ml of 0.1 % p-CAA, diluted to the mark with
acetonitrile and mixed well. Then, the absorbance was measured at 530 nm against
reagent blank treated similarly
Method B
Aliquots of 0.2, 0.5, 1.0, 2.0, 3.0 and 4.0 ml CMC standard solution (100 µg ml-1)
were transferred into a series of 5 ml calibrated flask. To each flask 1 ml of 0.1 %
DDQ solution was added, diluted to the mark with acetonitrile and mixed well. Then,
the absorbance was measured at 580 nm against reagent blank treated similarly.
A calibration graph was prepared by plotting the increasing absorbance values
versus concentration of CMC. The concentration of CMC was read from the
calibration graph or computed from the respective regression equation derived using
the Beer’s law data.
Procedure for tablets
An amount of tablet powder equivalent to 20 mg CMC was transferred into a
100 mL volumetric flask and about 60 ml of acetonitrile was added to the flask. The
content was shaken well for 20 min and diluted to the mark with the same solvent.
The resulting solution was filtered through Whatmann No 42 filter paper and used for
the assay by following the general procedure described for method A. This tablet
extract (200 µg ml-1) was diluted to 100 µg ml-1 with acetonitrile and suitable aliquot
was used for the assay in method B.

137
Procedure for the analysis of placebo blank and synthetic mixture
Placebo blank and synthetic mixtures were prepared as described in Section
4.1.2.4. A 20 mg of the placebo blank was accurately weighed and its solution was
prepared as described under ‘tablets’, and then subjected to analysis by following the
general procedures.
An amount of synthetic mixture equivalent containing 20 mg CMC was
accurately weighed and transferred into a 100 ml volumetric flask and the extract
equivalent to 200 µg ml-1 CMC was prepared as described under the general
procedure for tablets and used in method A. Required volume of the above extract
was diluted to 100 µg ml-1 with acetonitrile and used for method B by following the
general recommended procedure.
4.3.3 RESULTS AND DISCUSSION
π-acceptors like p-CAA and DDQ are known to yield radical ions via charge
transfer complexation reaction with a variety of n-donors including amines, iodide ion
and metallic salts [58-62]. The structural formula of CMC features an amino group;
therefore, attempts were made to determine CMC based on the formation of charge-
transfer complex with p-CA and DDQ as reagents.
Spectral characteristics and reaction pathway
CMC, a nitrogenous base acting as n-donor was made to react with two π-
acceptors, namely, p-CA and DDQ, to produce coloured charge transfer complexes in
1,4-dioxane-acetonitrile solvent system according to the following equation:
CMC + A CMC-A CMC+
+ A. -
C-T complex Radical anion In the method A, CMC reacts with the reagent and gives a red chromogen that
exhibits a strong absorption maximum at 530 nm in dioxane-acetonitrile medium
(Figure 4.3.1). This can be attributed to the formation of charge-transfer complex
between CMC and p-CAA followed by the formation of radical ions which probably
was due to the dissociation of the original (CMC-p-CAA) complex promoted by the
high ionizing power of the acetonitrile solvent [63].
In the second method, the interaction of CMC with DDQ in dioxane-
acetonitrile medium at room temperature gave a purple colored chromogen with

138
strong absorption maxima at 460, 540 and 580 nm due to the formation of the free
radical anion [64] and the wavelength 580 was selected for further studies because of
higher sample absorbance and lower blank absorbance readings (Figure 4.3.1).
Figure 4.3.1 Absorption spectra of: a. CMC-p-CAA C-T complex, b. blank (Method
A); c. CMC-DDQ C-T complex and d. blank. (Method B).
4.3.3.1 Method development
Optimum conditions were established by measuring the absorbance of C-T
complexes at 530 and 580 nm, for method A and method B, respectively, by varying
one parameter and keeping other parameters fixed.
Effect of reagent concentration
To establish optimum concentration of the reagents for the sensitive and rapid
formation of the CMC charge transfer complexes, the drug (CMC) was allowed to
react with different volumes of the reagents (0.5 – 2.5 ml of 0.1% p-CA and 0.5 - 3
ml of 0.1% DDQ). In both the cases, maximum and minimum absorbance values
were obtained for sample and blank, respectively, only when 1 ml of the reagent was
used. Therefore, 1 ml of reagent in a total volume of 5 ml was used throughout the
investigation.
Choice of solvent to dissolve drug and reagents
To dissolve CMC, acetonitrile was preferred to chloroform, dichloromethane,
acetone, 2-propanol, 1,2-dichloroethane, 1,4-dioxane, methanol and ethanol, because
as the complex formed in these solvents either had very low absorbance values or
precipitated upon dilution. Where as in the case of reagents, highly intense coloured
products were formed when 1,4-dioxane medium was maintained as solvent to
00.10.2
0.30.40.5
0.60.7
400 440 480 520 560 600 640 680 720
Abso
rban
ce
Wavelength, nm
a
b0
0.10.20.30.40.50.60.7
400 440 480 520 560 600 640 680 720
Abso
rban
ce
Wavelength, nm
c
d

139
dissolve p-CAA and DDQ. Therefore, acetonitrile and 1,4-dioxane were chosen as
solvents to dissolve CMC and the reagents, respectively.
Effect of reaction time and stability of the C-T complexes
The optimum reaction times were determined by measuring the absorbance of
the formed complex upon the addition of reagent solution to CMC solution at room
temperature. In both the methods the formation of C-T complex was complete within
5 min and the absorbance values of CMC-p-CAA and CMC-DDQ complexes were
stable for 2 h and 30 min, respectively.
Investigation of composition of C-T complexes
The composition of the C-T complexes with either p-CAA or DDQ was
evaluated by following the Job’s continuous variations method [57]. The experiments
were performed by preparing and mixing equimolar solutions of drug and reagent
(method A: 3.48 × 10⁻⁴ M CMC and p-CAA; method B: 1.67 × 10⁻⁴ M each) by
maintaining the total volume at 2.5 ml. The plots of the molar ratio between drug and
reagent versus the absorbance values were prepared (Figure 4.3.2a and 2b), and the
results revealed that the formation of C-T complex between drug and reagent
followed a 1:1 reaction stoichiometry. This finding was anticipated by the presence of
one basic electron donating center (nitrogen atom) in the CMC structure. Based on
this fact the following reaction pathway for the formation of C-T complex is proposed
and sown in Scheme 4.3.1.
(a) (b)
Figure 4.3.2 Job’s plots obtained for: (a) CMC-p-CAA C-T complex and (b)
CMC-DDQ C-T complex
0
0.1
0.2
0.3
0.4
0.5
0 0.2 0.4 0.6 0.8 1
Abso
rban
ce
Mole ratioVCMC/(VCMC+Vp-CA)
0
0.1
0.2
0.3
0.4
0.5
0 0.2 0.4 0.6 0.8 1
Abso
rban
ce
Mole ratioVCMC/(VCMC+VDDQ)

140
CMC+. + p-CAA-.
p-CAA C-T complex (1:1)
p-CAA radical anion measured at 530 nm
CMC+. DDQ-.
DDQ radical anion measured at 580 nm
CN
C N
O
O
Cl
Cl
DDQ
Cl O N
HO
O
OH
O OH
OH
O
Cl O N
HO
O
OH
O OH
OH
O
O
O
Cl
OHCl
HOCl O N
HO
O
OH
O OH
OH
O
O
O
Cl
OHCl
HO
Cl O N
HO
O
OH
O OH
OH
O
CMC
CMC
CN
C N
O
O
Cl
Cl
C-T complex (1:1) Scheme 4.3.1. Proposed reaction pathways for the formation of C-T complexes
between CMC and p-CAA/DDQ.
4.3.3.2 METHOD VALIDATION
The proposed methods were validated for linearity, sensitivity, precision, accuracy,
robustness, ruggedness, selectivity and recovery according to the International
Conference on Harmonization (ICH) [27] guidelines.
Linearity, sensitivity, limits of detection and quantification
Under optimum experimental conditions for CMC determination, the standard
calibration curves for CMC with p-CAA and DDQ were constructed by plotting
absorbance versus concentration (Fig. 4.3.3). A linear correlation between absorbance
at max and concentration values regression analysis of the Beer’s law data, optical
characteristics such as Beer’s law limits, molar absorptivity and Sandell sensitivity
values, limits of detection (LOD) and quantitation (LOQ) values of both the methods
are evaluated and they are presented in Table 4.3.1. The moderate values of ε and
Sandell sensitivity and LOD indicate the sensitivity of the proposed methods.

141
Method A Method B
Figure 4.3.3 Calibaration curves
Table 4.3.1.Sensitivity and regression parameters
Parameter Method A Method B
max, nm 530 580
Linear range, µg ml-1 8.0-160 4.0-80
Color stability, min 120 30
Molar absorptivity(ε), l mol-1 cm-1 3.4 × 10³ 7.5 × 10³
Sandell sensitivity, µg cm-2 0.1714 0.0790
Limit of detection (LOD), g ml-1 2.90 1.23
Limit of quantification (LOQ), g ml-1 8.77 3.71
Regression equation
Intercept (a) 0.0059 0.0070
Slope (b) 0.0056 0.0132 Standard deviation of a (Sa) 0.0436 0.0577 Standard deviation of b (Sb) 0.0024 0.0053
Regression coefficient (r) 0.9998 0.9993 a Limit of determination as the weight in µg ml-1 of solution, which corresponds to an absorbance ofA = 0.001 measured in a cuvette of cross-sectional area 1 cm2 and l = 1 cm.b Y=a+bX, Where Y is the absorbance, X is concentration in µg ml-1. Precision and accuracy
The intra and inter-day accuracy and precision of the proposed methods were
evaluated. The results of this study are summarized in Table 4.3.2. The percentage
relative standard deviation (RSD, %) values were ≤ 0.94% (intra-day) and ≤ 2.32%
0
0.2
0.4
0.6
0.8
1
0 20 40 60 80 100 120140 160
Abso
rban
ce
Concentration of CMC, µg ml-1
0
0.2
0.4
0.6
0.8
1
1.2
0 20 40 60 80
Abso
rban
ce
Concentration of CMC, µg ml-1

142
(inter-day) indicating high precision of the methods. Accuracy was evaluated as
percentage relative error (RE, %) between the measured mean concentrations and
taken concentrations for CMC. The percentage relative error was calculated at each
concentration and these results are also presented in Table 4.3.2. Percent relative
error (RE, %) values of ≤ 1.86% demonstrates the high accuracy of the proposed
methods.
Table.4.3.2. Results of intra-day and inter-day accuracy and precision study
Method
CMC taken
µg ml-1
Intra-day accuracy and precision
(n=5)
Inter-day accuracy and precision
(n=5) CMC found
µg ml-1 %RE %RSD
CMC found
µg ml-1 %RE %RSD
A
40.0 40.26 0.65 0.94 40.44 0.99 1.42 80.0 80.82 1.02 0.74 80.97 1.86 1.78
120.0 121.26 1.05 0.51 121.52 1.72 1.64
B 20.0 19.73 1.08 0.72 19.89 1.33 1.94 40.0 40.98 1.45 0.37 41.06 1.85 1.64 60.0 60.46 0.76 0.68 60.78 0.94 2.32
RE- Relative error and RSD- Relative standard deviation
Selectivity
The results obtained from placebo blank and synthetic mixture analyses
revealed that the inactive ingredients used in the preparation did not interfere in the
assay of active ingredient. The absorbance values obtained from the placebo blank
solution were almost equal to the absorbance of the blank which revealed no
interference from the adjuvants. To study the role of additives added to the synthetic
sample, 2 ml of the resulting solution prepared using synthetic mixture (200 and 100
µg ml-1 in CMC from method A and method B) was assayed (n = 4). The percentage
recoveries of 98.63-102.38 with %RSD values in the range 1.08-1.95 demonstrated
the accuracy as well as the precision of the proposed method and complement the
findings of the placebo blank analysis with respect to selectivity.

143
Robustness and ruggedness
The robustness of the methods was evaluated by making small incremental
changes in the volume of reagent and contact time, and the effect of the changes was
studied on the absorbance of the complex systems. The changes had negligible
influence on the results as revealed by small intermediate precision values expressed
as RSD (≤ 1.36%). Method ruggedness was demonstrated by having the analysis done
by four analysts, and also by a single analyst performing analysis on four different
instruments in the same laboratory. Intermediate precision values (RSD, %) in both
instances were in the range 0.54-3.42% indicating acceptable ruggedness. The results
are presented in Table 4.3.2.
Table 4.3.2 Results of robustness and ruggedness expressed as intermediate precision
study (% RSD).
Method CMC taken,
µg ml-1
Robustness (%RSD)
Ruggedness
Inter-analysts (%RSD), (n=4)
Inter-instruments (%RSD),
(n=4)
Parameters altered* Volume Reaction
o of dye time
A 40.0 80.0 120.0
1.26 0.96 1.21 1.28 1.17 0.72
1.56 0.84 1.72
2.63 3.42 2.84
B 20.0 40.0 60.0
1.36 1.06 1.28 0.85 1.23 1.14
0.76 1.26 1.01
3.12 2.46 3.42
*The volumes of p-CAA or DDQ added were 1±0.2 ml; reaction time were 4,5 and 6 min.
Application to tablets
The proposed methods were successfully applied to the determination of CMC
in commercial tablets. The results obtained by the proposed methods were compared
to those of the reference method [2] by applying Student’s t-test for accuracy and F-
test for precision. The results (Table 4.3.4) show that the Student’s t- and F-values at
95 % confidence level are less than the theoretical values, which confirmed that there
is a good agreement between the results obtained by the proposed methods and the
reference method with respect to accuracy and precision.

144
Table 4.3.4. Results of analysis of tablets by the proposed methods and statistical
comparison of the results with the official method.
#Mean value of five determinations Recovery study
The accuracy and validity of the proposed methods were further ascertained by
performing recovery studies. Pre-analyzed tablet powder was spiked with pure CMC
at three concentration levels (50, 100 and 150 % of that in tablet powder) and the total
was found by the proposed methods. In both the cases, the added CMC recovery
percentage values ranged of 99.00-102.28 % with standard deviation of 0.62-2.71
(Table 4.3.5) indicating that the recovery was good, and that the co-formulated
substances did not interfere in the determination.
Tablets brand name
Labeled amount
(mg)
Found# (Percent of label claim ± SD) Official method
Method A Method B
Siphene-25
25
99.36±0.68
99.33±1.65 t = 0.53 F = 5.88
99.66±0.95 t =1.19 F =1.96
Siphene-100
100
100.92±0.72
99.52±1.52 t = 2.69 F =4.45
100.64±1.05 t = 1.14 F =2.23

145
Table 4.3.5. Results of recovery study via standard-addition method with tablets.
*Mean value of three determinations
Tablets
studied
Method A Method B
CMC
in
tablet,
µg ml-1
Pure
CMC
added,
µg ml-1
Total
found,
µg ml-1
Pure CMC
recovered
(Percent±SD*)
CMC
in tablet,
µg ml-1
Pure
CMC
added,
µg ml-1
Total
found,
µg ml-1
Pure CMC
recovered
(Percent±SD*)
Siphene -
25
59.75
59.75
59.75
30.0
60.0
90.0
76.54
101.02
127.35
102.03±1.28
101.61±0.62
100.03±0.90
29.90
29.90
29.90
15.0
30.0
45.0
45.16
59.63
74.57
101.79±2.64
99.10±2.07
99.28±1.24
Siphene-
100
59.60
59.60
59.60
30.0
60.0
90.0
99.29
101.36
124.40
101.41±0.83
102.28±1.30
99.60±1.57
30.2
30.2
30.2
15.0
30.0
45.0
45.52
59.90
75.78
102.15±2.71
99.00±1.04
101.30±1.55

146
Section 4.4
A STABILITY -INDICATING UPLC METHOD FOR THE
DETERMINATION OF CLOMIPHENE CITRATE IN PHARMACEUTICALS
4.4.1 INTRODUCTION
The utility and importance of UPLC was discussed in Section 3.3.1. The
reported chromatographic methods as seen from the literature survey presented in
Section 4.0. deal with either separation of the E and Z isomers, determination in body
fluids or some interactions, and no assay method has ever been reported
To the best of the author’s knowledge, no UPLC method has been ever
reported for the determination of CMC in pharmaceuticals, Thus, a need for a rapid,
precise, accurate and validated stability-indicating UPLC method for the
determination of CMC in bulk and tablets was felt. This was accomplished with a
Waters Acquity UPLC system and Acquity BEH column (C18, 100mm, 2.1mm and
1.7 µm). The stability indicating power of the method was established by comparing
the chromatograms obtained under optimized conditions before forced degradation
with those after degradation via acidic, basic, hydrolytic, oxidative, thermal and
photolytic stress conditions. The optimization parameters and the validation results in
detail are presented in this Section (4.4).
4.4.2 EXPERIMENTAL
4.4.2.1 Materials
All the reagents used were of analytical grade. Doubly distilled water was
used throughout the investigation. Pure CMC and tablets used were the same as
described in Section 4.1. HPLC grade acetonitrile was purchased from Merck India
.Pvt. Ltd, Mumbai, India.
4.4.2.2 Reagents and solutions
Hydrochloric acid (2M) was prepared by appropriate dilution of the concentrated acid
(Merck, Mumbai, India, Sp. gr. 1.18) with water. Sodium hydroxide (2M) was
prepared by dissolving accurately weighed sodium hydroxide pellets (Merck,
Mumbai, India) in water. H2O2 (5%) was prepared as described in Section 3.3.2.

147
Preparation of stock solution
A 800 µg ml-1 CMC stock standard solution was prepared by dissolving
accurately weighed 80 mg of pure CMC in mobile phase and diluted to mark in a 100
ml standard flask with the mobile phase.
4.4.2.3 Mobile phase preparation
Dissolved 1.0 g of potassium dihydrogenorthophosphate (Merck, Mumbai,
India) in 1000 ml of water and the pH was adjusted to 3.5 using NaOH and
triethylamine (Merck, Mumbai, India). A 650 ml portion of this resulting buffer was
mixed with 350 ml of acetonitrile, shaken well and filtered using 0.22 µm Nylon
membrane filter. This solution was also used as diluent in all subsequent preparations
of the sample.
3.4.2.4 Chromatographic conditions and equipments
Chromatographic analysis was performed on a Waters Acquity UPLC™
system (Waters, Manchester, UK) using an Acquity BEH column (C-18 100 mm, 2.1
mm and 1.7 µm; Waters, Manchester, UK) equipped with binary solvent delivery
pump, auto sampler and tunable UV (TUV) detector. The column oven temperature
was maintained at 35 °C and the autosampler was maintained at ambient temperature.
Gradient mobile phase flow was carried out throughout the run. Total cycle time was
5 min with a flow rate of 0.2 ml min-1 and an injection volume of 2 µl using partial
loop mode. The output signal was monitored and processed using Empower-2
software.
4.4.2.5 Instrumental parameters
The isocratic flow rate of mobile phase was maintained at 0.2 ml min-1. The
column temperature was adjusted to 35 °C. The injection volume was 2.0 µl. The
sample run was monitored at 230 nm and the run time was 5.0 min. The retention
time of the sample was observed at about 2.2 min.
4.4.2.4 Stress study
All stress decomposition studies were performed at an initial drug
concentration of 80 µg ml-1 in mobile phase. Acid hydrolysis was performed in 2 M
HCl at 80 °C for 2 h. The study in alkaline condition was carried out in 2 M NaOH at
80 °C for 2 h. Oxidative studies were carried out at 80 °C in 5% hydrogen peroxide

148
for 2 h. For photolytic degradation studies, pure drug in solid state was exposed to 1.2
million flux hours in a photo stability chamber. Additionally, the drug powder was
exposed to dry heat at 105 °C for 3 h. Samples were withdrawn at appropriate time,
cooled and neutralized by adding base or acid and subjected to UPLC analysis after
suitable dilution.
4.4.3 General procedures
Procedure for preparation of calibration curve
Working standard solutions containing 0.5-200 µg ml-1 CMC were prepared
by serial dilutions of aliquots of the stock solution. Aliquots of 2 µl were injected (six
injections) and eluted with the mobile phase under the reported chromatographic
conditions. The average peak area versus the concentration of CMC in µg ml-1 was
plotted. Alternatively, the regression equation was derived using mean peak area-
concentration data and the concentration of the unknown was computed from the
regression equation.
Preparation of tablet extracts and assay procedure
Ten Siphene (25 and 100 mg CMC) tablets were accurately weighed and
ground into a fine powder. Powder equivalent to 8 mg CMC was transferred into a
100 ml volumetric flask and 60 ml of the mobile phase was added. The mixture was
sonicated for 20 min to achieve complete dissolution of CMC, and the content was
then diluted to volume with the mobile phase to yield a concentration of 80 µg ml-1
CMC, and filtered through a 0.22 µm nylon membrane filter. The tablet extract was
injected to the UPLC column.
Procedure for method validation
Accuracy and Precision
Six injections, of three different concentrations (60, 80 and 100 µg ml-1), were
given on the same day and the values of relative standard deviation (%RSD) were
calculated to determine intra-day precision. These studies were also repeated on
different days to determine inter-day precision. The same results were also used to
assay the accuracy of the method also.

149
Limits of detection (LOD) and quantification (LOQ)
Signal to noise (S/N) ratio method was adopted to obtain the limit of
quantification (LOQ) and limit of detection (LOD). Series of dilutions of the CMC
stock solution was made to attain LOQ and LOD in acceptable values.
Linearity
Seven-point calibration curves were obtained in a concentration range from
0.5 to 200 µg ml−1 (0.5, 50, 100, 150 and 200 µg ml-1 levels) for CMC; three
independent determinations were performed at each concentration.
Robustness and Ruggedness
To determine the robustness of the method, experimental conditions were
deliberately changed. The flow rate of the mobile phase (0.2±0.05 ml min-1), column
oven temperature (35±5 ºC), mobile phase composition (60:40, 65:35 and 70:30
buffer: solvent mixture v/v) and detection wavelength (230±1 nm) were the varied
parameters. In each case, the RSD (%) values were calculated for the obtained peak
area and retention time. The number of theoretical plates and tailing factors were
compared with those obtained under the optimized conditions. Three different
columns of same dimensions were used for the analyses. The study was performed on
the same day and on three different days by three different analysts for three different
concentrations of CMC (triplicate injections). The area obtained from each
concentration was compared with that obtained under optimized conditions. The
percent relative standard deviation values were evaluated for each concentration.
Solution stability and mobile phase stability
Stability of CMC solution was studied by injecting the sample into the
chromatographic system at different time intervals. The peak area was recorded in the
time intervals of 0, 12 and 24 hrs and the RSD values were calculated. Freshly
prepared solution was injected at the same time intervals for mobile phase stability (0,
12 and 24 hours) and RSD values of the peak areas were calculated.
4.4.3 RESULTS AND DISCUSSION
4.4.3.1 Method development
Different chromatographic conditions were experimented to achieve better
efficiency of the chromatographic system. Parameters such as mobile phase

150
composition, wavelength of detection, column, column temperature, pH of mobile
phase and diluents were optimized. Several proportions of buffer, and solvents (water,
methanol and acetonitrile) were evaluated in-order to obtain suitable composition of
the mobile phase. Choice of retention time, tailing, theoretical plates and run time
were the major tasks while developing the method. Acquity BEH C18, 50 mm × 2.1
mm, 1.7 µm column used for the elution, but the peak eluted before 1.5 minutes with
a tailing factor of 2. The following gradient conditions were experimented; the cycle
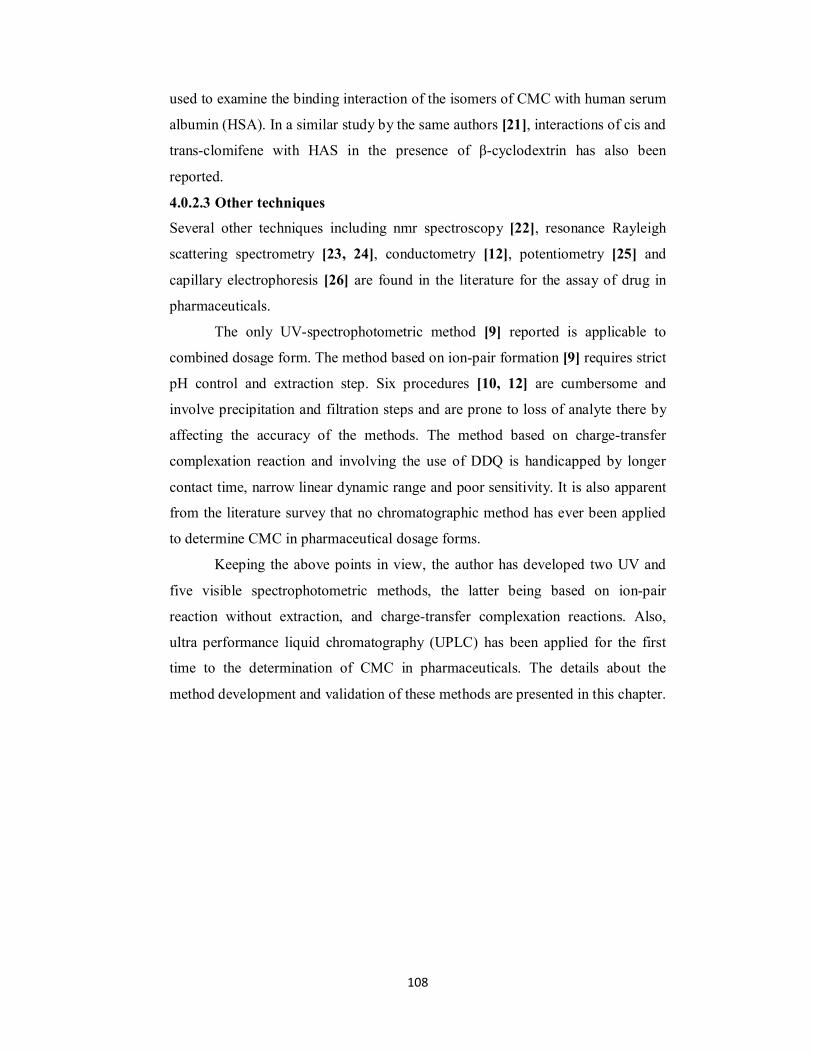
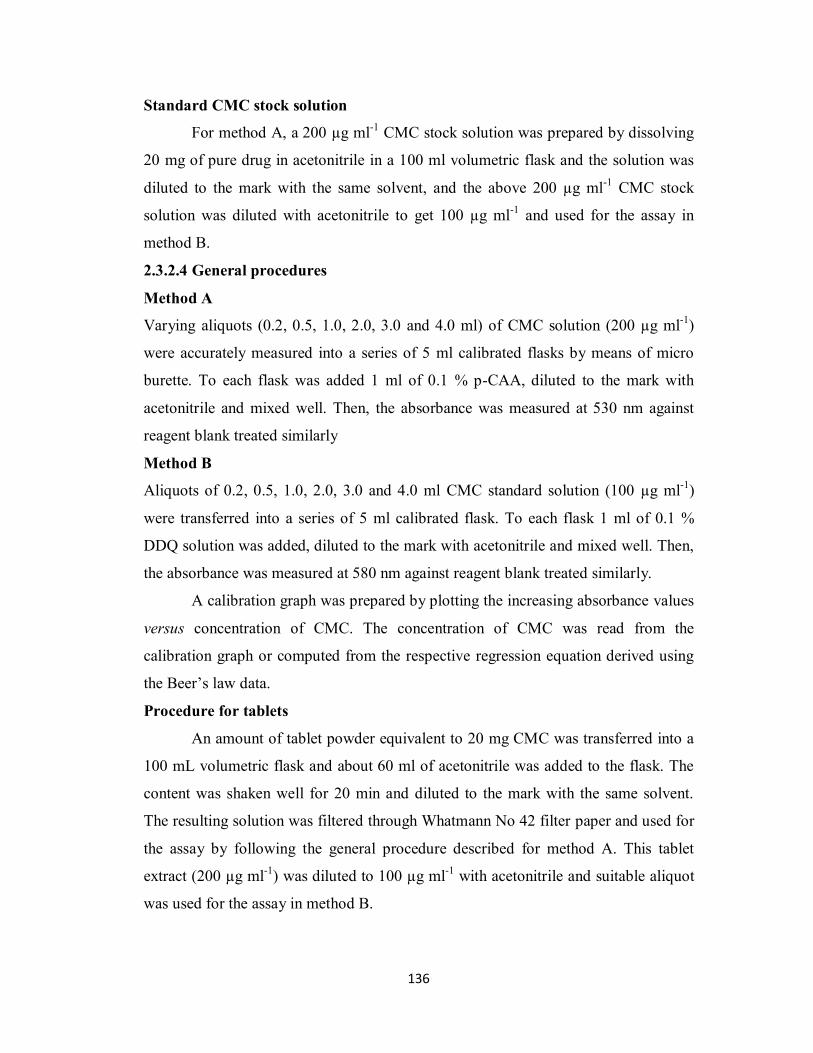
time was set at 5 min, 10 min, 15 min or 20 min while the flow rate was set at either
0.2 ml min-1 or 0.6 ml min-1. Except for the 5 min cycle time, all gradients began with
100% buffer for 0.5 min and maintained for 1 min at the end of each cycle for
equilibration. For a cycle time of 5-min , conditions started with 100% buffer for 0.5
min, then proceeded with a linear gradient to 100% acetonitrile for 3 min, then
returned to initial conditions and maintained upto 5 min. The gradient method was
successful in giving good peak shape of drug. The effect of different elution gradients
was assessed under either linear (described above), curve or step gradient which was
controlled by the Waters Empower-2 software. At 65: 35 ratio of the mobile phase in
the linear gradient program, a perfect peak was eluted. Thus the mobile phase ratio
was fixed at 65:35 (buffer: solvent) in an isocratic mobile phase flow rate. The typical
chromatograms obtained for blank and pure CMC in final optimized UPLC
conditions are depicted in Figure 4.4.1.
(a)
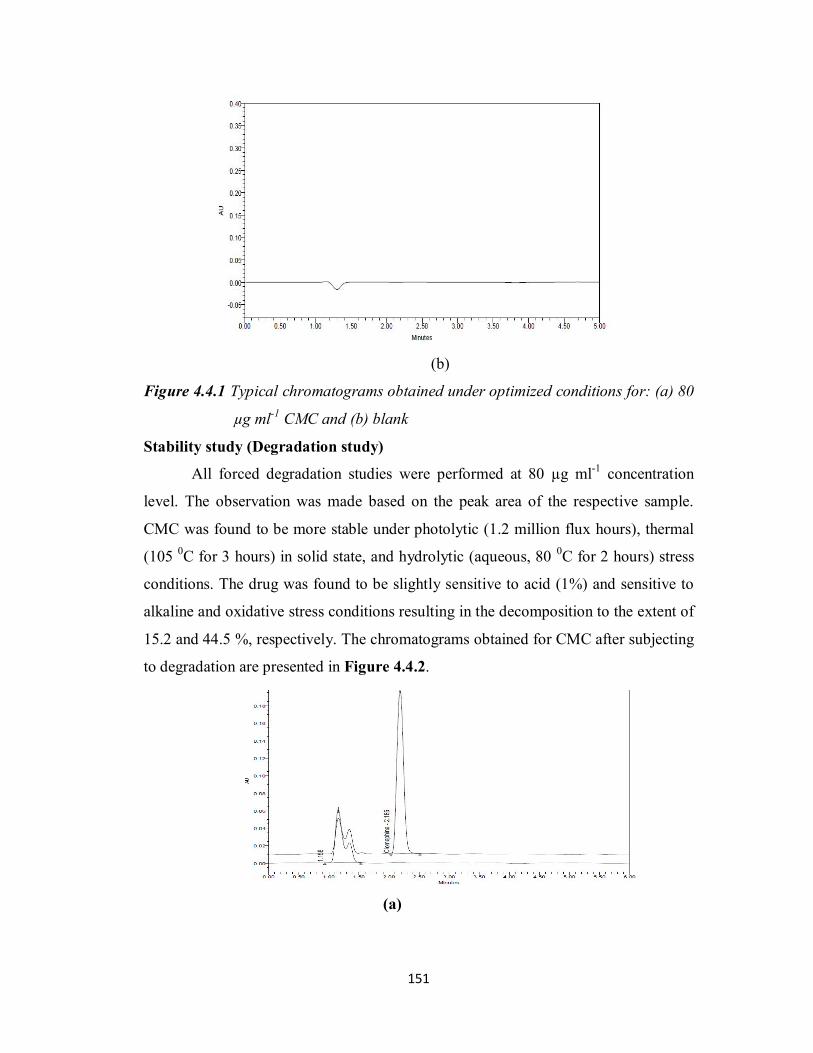
151
(b)
Figure 4.4.1 Typical chromatograms obtained under optimized conditions for: (a) 80
µg ml-1 CMC and (b) blank
Stability study (Degradation study)
All forced degradation studies were performed at 80 µg ml-1 concentration
level. The observation was made based on the peak area of the respective sample.
CMC was found to be more stable under photolytic (1.2 million flux hours), thermal
(105 0C for 3 hours) in solid state, and hydrolytic (aqueous, 80 0C for 2 hours) stress
conditions. The drug was found to be slightly sensitive to acid (1%) and sensitive to
alkaline and oxidative stress conditions resulting in the decomposition to the extent of
15.2 and 44.5 %, respectively. The chromatograms obtained for CMC after subjecting
to degradation are presented in Figure 4.4.2.
(a)

152
(b)
(c)
(d)

153
(e)
(f)
Figure 4.4.2 Chromatograms obtained for CMC after subjecting to stress studies by: (a) acid degradation, (b) base degradation, (c) photo degradation, (d) thermal degradation (e )oxidative degradation and (f) control.
4.4.3.2 Method validation
Analytical parameters
A linear correlation was obtained between the peak area and the concentration
in the range of 0.5 – 200 µg ml-1 CMC from which the linear regression equation was
computed and found to be:
y = 30,620x + 19,330, r² = 0.9999
where y is the mean peak area, x is the concentration of CMC in µg ml-1 and r is the
correlation coefficient. The LOD and LOQ values, slope (m), y-intercept (a) and their
standard deviations are evaluated and presented in Table 4.4.1. These results confirm

154
the linear relation between concentration of CMC and the peak areas as well as the
sensitivity of the method.
Table 4.4.1 Linearity and regression parameters with precision data
Parameter Value Linear range, µg ml-1 0.5 -200 Limits of quantification, (LOQ), µg ml-1 0.5 Limits of detection, (LOD), µg ml-1 0.1 Regression equation Slope (b) 30620.1 Intercept (a) 19330.0 Correlation coefficient (r) 0.9999
Accuracy and precision
The percent relative error which is an indicator of accuracy is ≤1.0% and is
indicative of high accuracy. The calculated percent relative standard deviation (RSD,
%) can be considered to be satisfactory. The peak area based and retention time based
RSD values were <1%. The results obtained for the evaluation of accuracy and
precision of the method are compiled in Tables 4.4.2 and 4.4.3.
Table 4.4.2 Results of accuracy study (n=5)
Table 4.4.3 Results of precision study (n=5)
Concentration of CMC injected, µg ml-1
Intra-day Inter-day
Concentration of CMC found, µg ml-1
RE (%)
Concentration of CMC found, µg ml-1
RE (%)
60.0 60.32 0.64 60.49 0.98
80.0 79.58 0.42 88.97 0.88 100.0 99.44 0.37 99.12 0.85
Concentration injected, µg ml1
Intra-day precision Inter-day precision Mean area± SD RSDa
(%) RSDb (%)
Mean area±SD RSDa (%)
RSDb (%)
60.0 1676974±9012 0.29 0.38 1689372±9012 0.42 0.29 80.0 2235731±10694 0.84 0.26 2198192±10694 0.76 0.17 100.0 2794663±9715 0.65 0.41 2804321±9715 0.57 0.68 a Relative standard deviation based on peak area; bRelative standard deviation based on retention time.

155
Selectivity
The chromatogram of the placebo blank did not yield any peak. The
chromatogram of the synthetic mixture solution equivalent to100 µg ml-1 CMC
yielded a chromatogram containing a peak with an area equal to that of pure drug
solution of the same concentration (100 µg ml-1). These studies indicate that the
method is highly selective.
Robustness and ruggedness
The robustness of an analytical procedure is a measure of its capacity to
remain unaffected by small, but deliberate variations in method parameters, and
provides an indication of its reliability during normal usage. At the deliberate varied
chromatographic conditions (flow rate, temperature, and mobile phase composition),
the analyte peak RSD (%), tailing factor and theoretical plates remained closer to the
actual values. The RSD values ranged from 0.1 to 1.3% resumes the robustness of the
proposed method. In method ruggedness, different columns (same lot), on different
days were used and analyses were performed by different analysts. The results are
summarized in Tables 4.4.4 and 4.4.5.
Solution stability and mobile phase stability
At the specified time interval, RSD (%) for the peak area obtained from drug
solution stability and mobile phase stability were within 1%. This shows no
significant change in the elution of the peak and its system suitability criteria (RSD,
tailing factor, theoretical plates). The results also confirmed that the standard solution
of drug and mobile phase were stable for at least for 24 hours during the assay
performance.
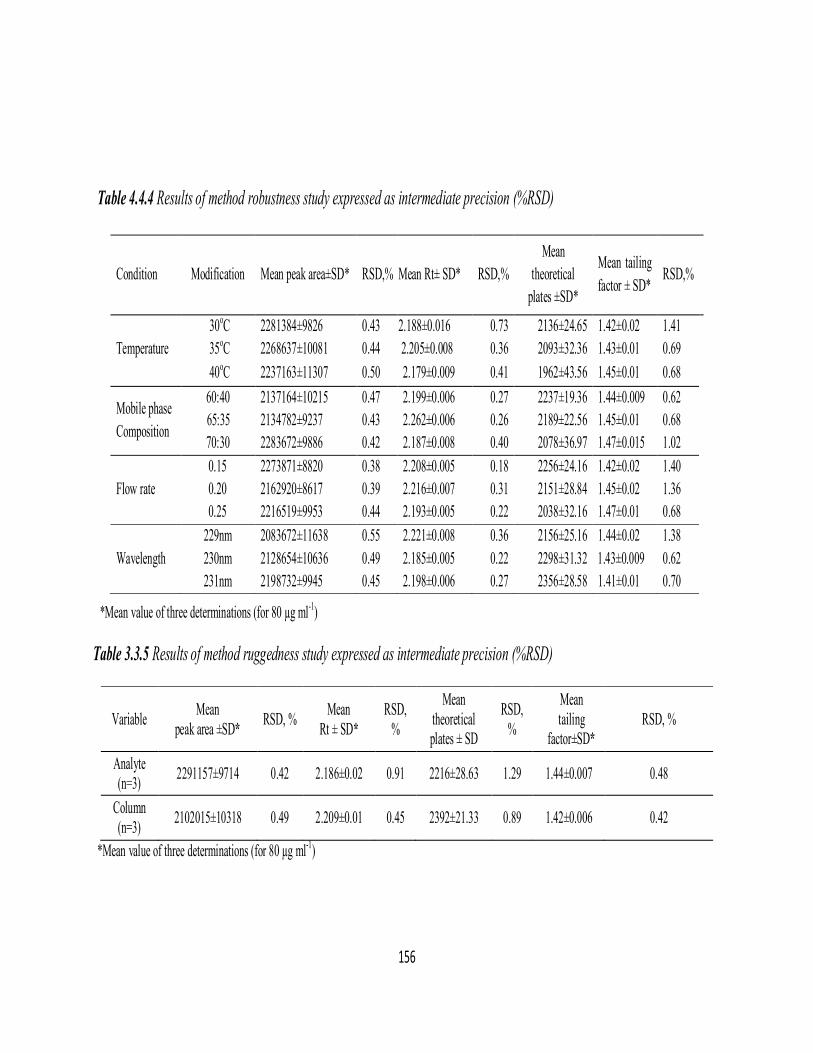
156
Table 4.4.4 Results of method robustness study expressed as intermediate precision (%RSD)
*Mean value of three determinations (for 80 µg ml-1)
Table 3.3.5 Results of method ruggedness study expressed as intermediate precision (%RSD)
Variable Mean peak area ±SD* RSD, % Mean
Rt ± SD* RSD,
%
Mean theoretical plates ± SD
RSD, %
Mean tailing
factor±SD* RSD, %
Analyte (n=3) 2291157±9714 0.42 2.186±0.02 0.91 2216±28.63 1.29 1.44±0.007 0.48
Column (n=3) 2102015±10318 0.49 2.209±0.01 0.45 2392±21.33 0.89 1.42±0.006 0.42
*Mean value of three determinations (for 80 µg ml-1)
Condition Modification Mean peak area±SD* RSD,% Mean Rt± SD* RSD,% Mean theoretical
plates ±SD*
Mean tailing factor ± SD*
RSD,%
30oC 2281384±9826 0.43 2.188±0.016 0.73 2136±24.65 1.42±0.02 1.41 Temperature 35oC 2268637±10081 0.44 2.205±0.008 0.36 2093±32.36 1.43±0.01 0.69
40oC 2237163±11307 0.50 2.179±0.009 0.41 1962±43.56 1.45±0.01 0.68
Mobile phase Composition
60:40 2137164±10215 0.47 2.199±0.006 0.27 2237±19.36 1.44±0.009 0.62 65:35 2134782±9237 0.43 2.262±0.006 0.26 2189±22.56 1.45±0.01 0.68
70:30 2283672±9886 0.42 2.187±0.008 0.40 2078±36.97 1.47±0.015 1.02 0.15 2273871±8820 0.38 2.208±0.005 0.18 2256±24.16 1.42±0.02 1.40
Flow rate 0.20 2162920±8617 0.39 2.216±0.007 0.31 2151±28.84 1.45±0.02 1.36 0.25 2216519±9953 0.44 2.193±0.005 0.22 2038±32.16 1.47±0.01 0.68 229nm 2083672±11638 0.55 2.221±0.008 0.36 2156±25.16 1.44±0.02 1.38
Wavelength 230nm 2128654±10636 0.49 2.185±0.005 0.22 2298±31.32 1.43±0.009 0.62 231nm 2198732±9945 0.45 2.198±0.006 0.27 2356±28.58 1.41±0.01 0.70

157
Analysis of tablets
The described method was successfully applied to the determination of CMC
in its pharmaceutical tablet formulation. The results obtained (Table 4.4.6) were
statistically compared with those of reference method [2]. The results obtained by the
proposed methods agreed well with those of reference method and with the label
claim. The results were also compared statistically by a Student’s t-test for accuracy
and by a variance F-test for precision at 95 % confidence level as summarized in
Table 4.4.6 which reveals no significant difference between the proposed method and
the reference method with respect to accuracy and precision.
Table 4.4.6. Results of analysis of tablets by the proposed method and statistical comparison of the results with the official method.
#Mean value of five determinations
Recovery study
A standard addition procedure was followed to further evaluate the accuracy
of the method. The solutions were prepared by spiking pure drug into a pre-analyzed
tablet powder at three different levels and injected to chromatographic column. The
recovery of the known amount of added analyte was computed. The percentage
recovery of CMC from pharmaceutical dosage forms ranged from 99.07% - 101.32%.
The results given in Table 4.4.7 reveal good accuracy of the proposed method.
Tablet name Label
claim, mg
Found# (Percent of label claim ± SD) Official method
Proposed method
Siphene-25
25
99.36±0.68
99.43±1.65 t = 0.63 F = 3.88
Siphene-100
100
100.92±0.72
99.82±1.52 t = 1.29 F =4.45

158
Table 4.4.7 Results of recovery study by standard addition method
#Mean value of three determinations
Tablet studied
CMC in tablet,
µg ml-1
Pure CMC added, µg ml-1
Total found, µg ml-1
Pure CMC recovered* (%CMC±SD)
Siphene 25 49.71 49.71 49.71
25.0 50.0 75.0
75.05 100.51 124.38
101.32±1.28 100.82±0.85 99.69±0.97
Siphene 100 49.91 49.91 49.91
25.0 50.0 75.0
74.21 100.39 123.99
99.07±0.80 100.48±0.47 99.27±0.64

159
Section 4.5
SUMMARY AND CONCLUSIONS - Assessment of the methods
To sum up, two UV- and five visible spectrophotometric and one UPLC
methods were developed and validated for the determination of clomifene citrate in
bulk drug and in tablets. The UV-spectrophotometric and UPLC technique were
additionally used to evaluate the behavior of the drug towards several stress
conditions such as acid and base hydrolysis, peroxide oxidation, light and heat.
The performance characteristics of the proposed spectrophotometric methods
in comparison with the existing/reported methods are presented in Table 4.5.1. The
UV- spectrophotometric methods are simple and cost-effective in terms of the media
employed (HCl and H2SO4). Wide linear dynamic ranges (2-60 µg ml-1), high
sensitivity (=1×10⁴) and low LOQ values (< 3 µg ml-1) are the features of the
proposed UV-spectrophotometric methods.

160
Table 4.5.1 Comparison of performance characteristics of proposed spectrophotometric methods with the existing methods Sl. No
Reagent/s used Methodology max (nm)
Linear range (µg ml-1) ( in l mol-1 cm-1)
LOQ (µg ml-1)
Remarks Ref
1 a)Methyl orange Measurement of chloroform extractable ion-pair complex
420 - Time-consuming extraction step is involved
9
b)Citricacid-acetic anhydride
Measurement of green
colored complex
605 - -
2 a)Iodine
b)Ammoniummolybdate
c)Phosphomolybdic acid
Measurement of molecular complex formed
Measurement of molecular
complex formed
Measurement of molecular complex formed
- 2-24
- Multistep reaction, time consuming, involves
precipitation, filtration steps.
10
3 DDQ Measurement of chloroform extractable
C-T complex
460 10-70 (4.61×10³)
- The method involves conversion of the drug to base, extraction of the complex in to CHCl3 before measurement
11
4 Ammonium reineckate Measurement of ion-associate complex after
precipitation, washing and dissolution in acetone
509 200-1800 (2.6×10²)
- Less sensitive and time consuming. is multi-step method
12
5
a) 0.1 M H2So4
Absorbance measured in either 0.1 M H2SO4 or 0.1 M HCl
290 2-60 1.0 × 10⁴
2.42 Simple, sensitive, easy to perform
Present work
b) 0.1 M HCl
289 2-60 (1.0 ×10⁴)
2.84

161
6 a) Bromothymol blue
Measurement of ion-pair complex formed in dichloromethane without extraction
420 2-35 (1.5× 10⁴)
0.99 No extraction step, simple and sensitive with wide linear dynamic ranges
Present work
b) Bromocresol green 415 1.6-28 (1.8 × 10⁴)
1.55
c) Bromocresol purple 425 1.6-28 (1.8 × 10⁴)
1.89
7. a)p-CAA Measurement of C-T complex in acetonitrile-dioxane medium
530 8-160 (3.4 × 10³)
8.77 Free from extraction step, sensitive with wide dynamic linear ranges, precise and accurate
Present work
c) DDQ 580 4-80 (7.5 × 10³)
3.71
p-CAA- p-chloranilic acid, DDQ-2,3-dichloro 5,6-dicyano, p-benzoquinone.
The published visible spectrophotometric method [9] employing methyl orange as an ion-pair agent requires manipulation of several
experimental variables such as pH, aqueous-organic phase ratio, extraction time, equilibration time besides the laborious extraction
step. The C-T complex method [11] using DDQ requires the conversion of the drug to base form followed by extraction in to CHCl3
before absorbance measurement. The ammonium reineckate method [12] is a multi step process involving precipitation, filtration, and
dissolution of the precipitate in acetone before measuring the absorbance of the complex, thus leading to inaccuracy and imprecision.
These drawbacks are totally absent in the methods developed by the author. Both ion-pair and C-T complex methods are the simplest
in terms of ease of operation since they involve simple mixing of the drug and reagent solutions in appropriate solvents and
measurement of the absorbance. The absence of the manipulation of the experimental variables unlike in methods [8-12] renders the
proposed methods highly accurate and precise. Of the proposed five visible spectrophotometric (Table 4.5.1, Sl. No. 6 and 7),

162
procedures based on ion-pair reaction seem sensitive ( ˜ 2×10⁴) compared those
based C-T complexation ( < 104). All the five methods are applicable over wide
linear dynamic ranges and found to be unaffected by the inactive ingredients added to
tablets as shown by the results of tablet analysis apart from placebo blank and
synthetic mixture analyses. The only limitation of these methods is the use of organic
solvent as the reaction medium. However, the use has been scaled down to the barest
minimum. With the exception of USP [2] and BP [8] methods, no other
chromatographic method is currently available for the clomifene citrate. The reported
chromatographic methods [13-21] deal with either separation of isomers or
determination of the drug in divergent matrices. The proposed UPLC method fills this
void since it essentially concerns with the assay of drug in pharmaceuticals and more
importantly the method is stability-indicating. The method has a wide linear dynamic
range (0.5 -200 µg ml-1), small LOD and LOQ values (0.1 and 0.5 µg ml-1) besides
being robust and rugged. The method looks highly specific as seen from the absence
of any peak from the placebo blank and any additional peak from synthetic
mixture/tablet chromatograms. High accuracy and precision are the other hallmarks
of the developed UPLC method.

163
REFERENCES
1. The Merck Index: An Encyclopedia of Chemicals, Drugs, and Biologicals, 14th
Edn., Merck & Co., Inc., Whitehouse Station, New Jersey, USA, 2006, p.
1175.
2. “The United States Pharmacopoeia”, XXIV Revision, the National Formulary
XIX Rockville, USP Convention, 2000.
3. P.M.F. Bishop, Br. Med. Bull., 1970, 26, 22.
4. P.J. Sorbie, R. Perez-Marrero, J. Urol., 1984, 131, 425.
5. A.G. Herzog, Arch. Neurol. (Chicago), 1988, 45, 209.
6. E. Loumaye, J.M. Billion, J.M. Mine, I. Psalti, M. Pensis, K. Thomas, Fertil.
Steril., 1990,53, 295.
7. C.F. Baustian, T.J. Mikkelson, J. Pharm. Biomed. Anal., 1986, 4,171.
8. “British Pharmacopoeia”, volume I and II, Her Majesty’s Stationery Office
London, 2009.
9. I.I. Hewala, Anal. Lett., 1993,26,625.
10. G.P.V. Mallikarjuna Rao, A.P. Devi, K.M.M. Krishna Prasad, C.S.P. Sastry,
Indian Drugs, 2002, 39, 395.
11. G.P.V. Mallikarjuna Rao, P. Aruna Devi, K.M.M. Krishna Prasad, C.S.P.
Sastry, J. Ind. Chem. Soc,. 2002, 79, 848.
12. S. Wafaa, Hassan, M.M. Hosny, E-J Chem., 2008, 5, 1069.
13. P.J. Harman, G.L. Blackman, G. Phillipou, J. Chrom. B: Biomed Sci. Appl.,
1981, 225, 131.
14. B. Xiaohong, Li Jianwei, Chen, Xuan , Yaowu Fenxi Zazhi, 2008, 28, 49.
15. C.L. Baustian, T.J. Mikkelson, J. Pharm. Biomed. Anal., 1986, 4, 237.
16. M.S.F. Ross, H. Judelman. J. Chromatogr., 1984, 298, 172.
17. R.G. Frith , G. Phillipou, J. Chromatogr., 1986, 367, 260.
18. I. Urmos, S.M. Benko, I. Kelbovich, J. Chromatogr., 1993, 617, 168.
19. H.K. Crewe, C. Ghobadi, A. Gregory, A. Rostami-Hodjegan, M.S. Lennard, J.
Chromatogr., 2007, 847, 296.
20. Arundhati Sengupta, David S. Hage, Anal. Chem., 1999, 71, 3821.
21. D.S. Hage, Arundhati Sengupta, Anal. Chem., 1998, 70, 4602..

164
22. B. Lindgreen, J.R. Martin, Pharmeuropa, 1993, 5, 51.
23. Feng Suling, GuoLimin, Zhongguo Fuyou Baojian, 2009, 24, 2989.
24. Suling Feng, Limin Guo, J. Anal. Chem., 2009, 64, 910.
25. M.M. Hosny, H.M. Elsaid, Alex. J. Pharm. Sci., 2007, 21, 25.
26. J. Incezdy Analytical Applications of Complex Equilibria, Ellis Horwood Ltd.,
England, 1976, 137.
27. International Conference on Hormonisation of Technical Requirements for
Registration of Pharmaceuticals for Human Use, ICH Harmonised Tripartite
Guideline, Validation of Analytical Procedures: Text and Methodology Q2(R
1),Complementary Guideline on Methodology dated 06 November 1996,
incorporated in November 2005, London.
28. S.K. Motwani, R.K. Khar, F.J. Ahmed, S. Chopra, K. Kohli, S. Talegaonkar,
Anal. Chim. Acta, 2007, 582, 75.
29. Inczedy, T. Lengyel, A. M. Ure, IUPAC Compendium of Analytical
Nomenclature: Definitive Rules, Blackwell Science Inc., Boston. 1998.
30. http://www.iupac.org/goldbook/I03231.pdf.
31. A. Bhandage, A. Bhosale, A. Kasture, V. P. Godse1, Tropical J. Pharm. Res.
2009, 8(5), 449.
32. G. Schill, Acta. Pharm. Suecica, 1964, 1, 101.
33. G. Schill, Acta. Pharm. Suecica, 1964, 1, 169.
34. G. Schill, Acta. Pharm. Suecica, 1965, 2, 13.
35. G. Schill, Acta. Pharm. Suecica, 1965, 2, 99.
36. L.R. Hull, J.A. Biles, J. Pharm. Sci., 1964, 53, 869.
37. T. Higuchi, E. Roubal, Division of Analytical Chemistry, ACS, Abstracts of
Papers, 149th Meeting, 28 B (April 1965).
38. Z.S. Dobrila, S. Ljiljana, Z. Ljiljana, Acta Pharm. Hung. 1990, 60(5-6), 179.
39. Z. Aydoğmuş, A. Barla, J AOAC Int. 2009, 92(1), 131.
40. K. Basavaiah, V.S. Charan, ScienceAsia, 2004, 30, 163.
41. I. Süslü, A. Tamer, J. Pharm. Biomed. Anal. 2002, 29(3), 545.
42. S. Mostafa, M. El-Sadek, E.A. Alla, J. Pharm. Biomed. Anal. 2002, 28(1), 173.
43. K. Basavaiah, V.S. Charan, Bulgarian Chem. Comm., 2003, 35(1), 43.

165
44. E. Kepekçi, A. Öztunç, Acta Pharm. Sci., 2005, 47(1), 65.
45. T. Sakai, Analyst, 1983, 108, 608.
46. N. Rajendraprasad, K. Basavaiah, K.B. Vinay. Indian J Chem. Tech., 2010, 17,
220.
47. N. Rajendraprasad, K. Basavaiah, K.B. Vinay. Ecletica Quimica, 2010, 35(1),
55.
48. N. Rajendraprasad, K. Basavaiah, K.B. Vinay. Chem. Ind. Chem. Eng. Q. 2011,
17(3), 259.
49. S. Ashour, M.F. Chehna, R. Bayram, Int. J. Biomed. Sci., 2006, 2(3), 273.
50. M.M. El-Kerdawy, M.A. Moustafa, S.M. El-Ashry, D.R. El-Waseef, Anal Lett.
1993, 26, 1669.
51. H.H. Abdine, Alex. J. Pharm. Sci. 2000, 14, 75.
52. H. Abdine, F. Belal, N. Zoman, IL Farmaco 2002, 57, 267.
53. D.H. Manjunatha, S.M.T. Shaikh, K. Harikrishna, R. Sudhirkumar, P.B.
Kandagal, J. Seetharamappa, Ecl. Quim. Sao. Paulo. 2008, 33, 37.
54. N. Rajendraprasad, K. Basavaiah, K.B. Vinay. J. Preclin. Clin. Res. 2010, 4(1),
24
55. K. Basavaiah, A.M.A. Sameer K.B. Vinay. J. Food Drug Anal., 2009, 17(6),
434.
56. S. Ashour, M.F. Chehna, R. Bayram. Int. J. Biomed. Sci. 2006, 2, 273.
57. J. Rose, Advanced Physico-Chemical Experiments, Pitman, London, 1964.
58. R.R. Krishnan, C.S.P. Sastry, Talanta, 1979,26, 861.
59. M. Walash, EI-Din Sharaf, S. Metwalli, M. Redashabana, Arch. Pharm. Res.,
2004, 27, 720.
60. R. Rama Krishna, C.S.P. Sastry, Talanta, 1979,26, 861.
61. C.S.P. Sastry, M.V. Suryanarayana, A.S.R.P. Tipirneri, A. Sailaja, East.
Pharm., 1989, 32, 129.
62. G. Ramana Rao, S.S.N. Murthy, I.R.K. Raju, Talanta, 1989, 26, 417.
63. N.A. El-Ragehy, S.S. Abbas, S.Z. El-Khateeb. Anal. Lett., 1997, 30, 2045.
64. E. Khaled. Talanta, 2008, 75, 1167.