spectroelectrochemistry, the future of visualizing
TRANSCRIPT

Analyst
CRITICAL REVIEW
Cite this: Analyst, 2020, 145, 2482
Received 21st October 2019,Accepted 13th January 2020
DOI: 10.1039/c9an02105a
rsc.li/analyst
Spectroelectrochemistry, the future ofvisualizing electrode processes by hyphenatingelectrochemistry with spectroscopic techniques
Jasper J. A. Lozeman, † Pascal Führer, † Wouter Olthuis andMathieu Odijk *
The combination of electrochemistry and spectroscopy, known as spectroelectrochemistry (SEC), is an
already established approach. By combining these two techniques, the relevance of the data obtained is
greater than what it would be when using them independently. A number of review papers have been
published on this subject, mostly written for experts in the field and focused on recent advances. In this
review, written for both the novice in the field and the more experienced reader, the focus is not on the
past but on the future. The scope is narrowed down to four techniques the authors claim to have the
most potential for the future, namely: infrared spectroelectrochemistry (IR-SEC), Raman spectroelectro-
chemistry (Raman-SEC), nuclear magnetic resonance spectroelectrochemistry (NMR-SEC) and, perhaps
slightly more controversial but certainly promising, electrochemistry mass-spectrometry (EC-MS).
1 Introduction1.1 Spectroelectrochemistry (SEC)
Spectroelectrochemistry is an established technique whichhyphenates electrochemistry with spectroscopy. Electrochemistry
by itself is a technique that can be used in order to determineconcentrations of known compounds or to obtain informationconcerning reaction kinetics. However, it is less suitable forelucidating unknown reaction intermediates or products.1 Bycombining electrochemistry with an optical technique, morequalitative and quantitative information about the processesoccurring at the electrodes can be obtained.
It is generally accepted in the SEC field that the work ofKuwana et al.2 in 1964 is the first true SEC experiment. This
Jasper J. A. Lozeman
Jasper Jeroen André Lozemangraduated for his BSc inAnalytical Chemistry in 2013 atthe HU University of AppliedSciences Utrecht (theNetherlands). In 2015 he com-pleted his MSc in Chemistry,Analytical Sciences at the VrijeUniversiteit Amsterdam (theNetherlands). Currently, he is aPhD researcher at the BIOS Lab-on-a-Chip group of the MESA+Institute of Nanotechnology, atthe University of Twente (the
Netherlands). His current project is titled “surface enhancedvibrational spectroscopy in a flow-through microfluidic chip”funded by the Netherlands Center for Multiscale Catalytic EnergyConversion (MCEC).
Pascal Führer
Pascal Führer finished his coop-erative studies in Chemistry andBiotechnology at the NiederrheinUniversity of Applied Sciences inKrefeld, Germany, in 2015 witha BSc. degree. He then studiedChemistry at the University ofMünster, Germany, with a focuson analytical and inorganicchemistry, obtaining an MScdegree in 2017 while investi-gating the synthesis and reactiv-ity of amido-substituted silico-noid clusters. Currently, he is
developing a new generation of microfluidic chips for the spectro-electrochemical investigation of human drug metabolism mimicryand protein cleavage as a PhD researcher in the BIOS Lab-on-a-Chip group at the University of Twente in the Netherlands.
†Equal contribution.
BIOS Lab-on-a-Chip Group, MESA+ Institute, University of Twente, 7522 NB
Enschede, The Netherlands. E-mail: [email protected]
2482 | Analyst, 2020, 145, 2482–2509 This journal is © The Royal Society of Chemistry 2020
Ope
n A
cces
s A
rtic
le. P
ublis
hed
on 1
5 Ja
nuar
y 20
20. D
ownl
oade
d on
12/
12/2
021
6:39
:58
AM
. T
his
artic
le is
lice
nsed
und
er a
Cre
ativ
e C
omm
ons
Attr
ibut
ion-
Non
Com
mer
cial
3.0
Unp
orte
d L
icen
ce.
View Article OnlineView Journal | View Issue

early work on spectroelectrochemistry has resulted in a fieldcontaining a large variety of spectroscopic methods.Nowadays, a number of reviews exist concerning spectroelec-trochemistry. For example the work by Dunsch from 2011, cov-ering a wide range of multi-spectroelectrochemistry tech-niques.3 In 2013, Oberacher et al. published a paper on massspectrometric methods in electrochemical cells.4 Wain andO’Connel wrote a paper in 2017 about surface-enhancedvibrational spectroelectrochemistry.5 Also in 2017, work byTong on nuclear magnetic resonance spectroelectrochemistryfocused on the challenges and prospects was published.6 Thework by León and Mozo, published in 2018, describes in detailhow to design a spectroelectrochemical cell.7 In 2018, Zhaiet al. wrote a review in which they describe the recent advancesin spectroelectrochemistry.8 Finally, in the work by Gazor-Ruizet al. from 2019, the recent trends and challenges of spectro-electrochemistry are described.9
1.2 Visualizing the future of SEC
Most of the papers mentioned above are addressed towardsexperts in the fields, with a strong focus on recent advance-ments. This review tries to add to these existing review papers,firstly by focussing on the future of spectroelectrochemistryand secondly by writing a review paper in an accessible way fornewcomers to the field. To be concise, the current review isfocused on the four techniques that, in the opinion of theauthors, have the biggest potential to undergo major improve-ments in the coming decades. The techniques covered in thisreview are infrared spectroelectrochemistry (IR-SEC), Ramanspectroelectrochemistry (Raman-SEC), nuclear magnetic reso-nance spectroelectrochemistry (NMR-SEC) and, perhapsslightly more controversial but certainly promising, electro-chemistry mass-spectrometry (EC-MS). These techniques willeach be discussed in their own sections in the aforementioned
order. The basic principle of every technique is first explained,followed by the current state of the art in the field. To con-clude, every chapter ends with a future perspective, based onthe developments in the separate fields of the SEC techniqueand the substantiated opinion of the authors. The authorshope that this review will inform both the newcomers as wellas the experts concerning the future of SEC. At best, we aim togive an overview of how the future of SEC may look like and atworst, to initiate a scientific discussion on the subject.
2 Infrared spectroelectrochemistry(IR-SEC)2.1 Introduction IR-SEC
2.1.1 IR spectroscopy. In the most basic sense of the tech-nique, infrared (IR) spectroscopy can be described as a tech-nique where IR radiation is absorbed by molecules. Theabsorption of the infrared light occurs when the frequency ofthe absorbed radiation is equal to the vibrational frequency ofthe molecule. The resulting absorption spectrum providesinformation about the identity of the elements and structuralcomposition of the molecule. Only vibrational modes showinga change in dipole moment are visible in the IR spectra. As aresult molecules such as N2 cannot be detected with this tech-nique. IR spectroscopy operates over a wide spectral windowbetween 2.5–25 µm (4000–400 cm−1). The most commonlyused IR technique is Fourier transform infrared spectroscopy(FTIR) (Fig. 1).
When considering IR spectroscopy, there are some keydrawbacks associated with the technique. Most importantly, IRinstruments often use a silicon carbide rod (such as a Globar),heated to 1000 °C or above, as a light source. Although thesesources can cover a large spectral window, their power outputis relatively low. This results in a relatively high detection limit
Wouter Olthuis
Wouter Olthuis received his MSc.degree in electrical engineeringfrom the University of Twente,Enschede, the Netherlands.Then, he joined the Center forMicroElectronics, Enschede(CME). After that, he started hisPhD project and received his doc-toral degree in 1990. Since1991 he has been working as anAssistant Professor in theLaboratory of Biosensors of theUniversity of Twente on physicaland (bio)chemical sensors.
Currently, he is Associate Professor in the BIOS Lab-on-Chip groupof the MESA+ Institute of Nanotechnology. He has (co-)authoredover 180 papers (h = 40) and 7 patents. From 2006 until 2011 hehas also been the Director of the Educational Programme ofElectrical Engineering at the University of Twente.
Mathieu Odijk
Mathieu Odijk (1981) is a pro-fessor leading research inMicrodevices for ChemicalAnalysis, as part of the BIOSLab-on-a-Chip group at theUniversity of Twente. Hisresearch team currently consistsof 10 PhD students and 1 post-doc, with a shared aim to pushexisting boundaries in analyticsusing micro- and nanofabricateddevices. He received an MScdegree in electrical engineeringin 2007, and a PhD in electro-
chemical microreactors in 2011. He has been nominated as tech-nological top talent in 2012, and awarded a prestigious personalVENI award in 2014 by the Dutch research council (NWO).
Analyst Critical Review
This journal is © The Royal Society of Chemistry 2020 Analyst, 2020, 145, 2482–2509 | 2483
Ope
n A
cces
s A
rtic
le. P
ublis
hed
on 1
5 Ja
nuar
y 20
20. D
ownl
oade
d on
12/
12/2
021
6:39
:58
AM
. T
his
artic
le is
lice
nsed
und
er a
Cre
ativ
e C
omm
ons
Attr
ibut
ion-
Non
Com
mer
cial
3.0
Unp
orte
d L
icen
ce.
View Article Online

compared to other analytical techniques. Another seriousdrawback is that water has strong absorbance bands in the IRregion, which complicates measuring in aqueous solutions. Inorder to prevent the water bands from dominating the spec-trum, Lambert–Beer law (eqn (1)) offers a practical solution.
A ¼ ε � c � l ð1Þwhere A is the absorbance (arbitrary units), ε is the molarattenuation coefficient (m2 mol−1), c is the concentration (molm−3) and l is the path length (m). In order to reduce the absor-bance effect of water, the path length is the only factor thatcan be changed when measuring in aqueous solutions.Meaning that in practice, the path length in FTIR of aqueoussamples is kept in the order of 15 µm or lower.11 This shorterpath length also effects the analyte. The concentrations of ana-lytes required for adequate signal strengths is therefore rela-tively high compared to other spectroscopic techniques,forming an obvious disadvantage of IR spectroscopy.
2.1.2 IR-SEC spectroscopy. As explained above, the require-ment of a small cell volume is seen as a disadvantage, bothdue to the high sample concentration needed and difficultiesin sample handling with such small volumes. However, it canbe seen as an advantage when combining FTIR with EC. Whenthe cell height is smaller than the diffusion length, totalelectrochemical conversion is more easily achieved.11,12
Due to the requirement of such a small path length, anoften used cell design in IR-SEC is the so called “thin-layer”configuration. This configuration is used as follows: thesample with electrolyte is applied on an electrode and awindow of IR-transparent material (such as CaF2) is pushedagainst the electrode. As a result the layer of liquid analyte issandwiched between the electrode and the transparent IRwindow, with a thickness of several µm. A drawback of thismethod is that the exact thickness of the thin-layer is not asreproducible as with a fixed cell size, making the process oftaking a background reference spectrum more difficult. Thethickness of the layer can be calculated by measuring theabsorbance of the bulk water vibration,13 potassium ferricya-nide,14 or any other substance with a known concentrationand molar attenuation coefficient and applying the Lambert–Beer law. This determination of the path length is not necess-arily done using IR spectroscopy. De Lacey et al.15 used UV/Vis
spectroscopy of 8 mM cytochrome c to determine the pathlength of their thin-layer cell. Once the path length of both thesample and the background measurement is known, a back-ground correction can be performed.
An alternative way to make a background correction whenusing the thin-layer configuration is by difference spec-troscopy. In difference spectroscopy, a background referencemeasurement is performed at one potential and then sub-tracted from the measurement taken at a different potential.In this way, the contribution of the bulk solution is cancelledout and a spectrum is produced showing only the changescaused by the variation of the potential. There are, however,drawbacks to this technique, as adsorption and desorption ofthe analyte on the electrode changes the concentration of themeasured analyte.16
2.1.3 Surface enhanced infrared absorption spectroscopy(SEIRAS). In order to increase the signal to noise ratio (S/N) ofthe measurements, researchers have been using surfaceenhanced infrared absorption spectroscopy (SEIRAS). After thesuccesses in the 1970s in obtaining large enhancement factorsin surface enhanced Raman spectroscopy (SERS), intereststarted to grow to apply similar concepts in infrared spec-troscopy. The first SEIRAS experiments were reported in the1980s by Hartstein et al.,17 although the term SEIRAS was onlycoined later.18–20 Since the 1990s early pioneering work in thefield of SEIRAS was mostly done in the group of Osawa.21,22
Although not as powerful as in SERS, where local enhance-ment factors of up to 1010 have been reported,23,24 SEIRAS isstill a valuable technique with enhancement factors of 101–103
being reported.25 SEIRAS is performed on metallic surfaces,either in the form of roughened surfaces or arrays of nano-structures. A simplified explanation of SEIRAS is as follows:electromagnetic interactions between the IR light and themetallic structures can cause a phenomenon called plasmonresonance. Plasmon resonance amplifies the electromagneticfield, resulting in the enhancement. This enhancement onlyoccurs close to the surface, and is negligible at distancesbigger than 10 nm. SEIRAS is a complex phenomenon and theexplanation above is simplified, excluding effects such as“chemical” enhancement. Therefore, the authors of this reviewrecommend that, for an in-depth explanation of SEIRAS, thereader reads the following literature: Osawa,18 Aroca26 andNeubrech.27 In IR-SEC, SEIRAS is performed in combinationwith reflection spectroscopy and ATR spectroscopy, which willbe discussed in the paragraphs below.
2.2 State of the art of IR-SEC
2.2.1 Transmission IR-SEC. In transmission IR-SEC, lightemitted from the source is directed towards the sample. Thesample, contained in an electrochemical cell, absorbs part ofthe IR radiation and the rest is transmitted through the celltowards the detector. The resulting difference between theemitted light and the detected light creates the IR spectrum.The electrochemical cell in transmission IR-SEC most fre-quently uses a mesh electrode configuration.11,15,28–31 Thisconfiguration was first reported by Murray et al.32 for the use
Fig. 1 Schematic diagram by Pavia et al.10 of an FTIR instrument. FromPavia/Lampman/Kriz/Vyvyan. Introduction to Spectroscopy, 4E. © 2009Brooks/Cole, a part of Cengage, Inc. Reproduced by permission. http://www.cengage.com/permissions.
Critical Review Analyst
2484 | Analyst, 2020, 145, 2482–2509 This journal is © The Royal Society of Chemistry 2020
Ope
n A
cces
s A
rtic
le. P
ublis
hed
on 1
5 Ja
nuar
y 20
20. D
ownl
oade
d on
12/
12/2
021
6:39
:58
AM
. T
his
artic
le is
lice
nsed
und
er a
Cre
ativ
e C
omm
ons
Attr
ibut
ion-
Non
Com
mer
cial
3.0
Unp
orte
d L
icen
ce.
View Article Online

in UV/Vis-SEC and later adapted by Moss et al.11 for the use inIR-SEC.
The design by Moss et al.11 is shown in Fig. 2. As illus-trated, a working electrode (WE) in the form of a Au mesh issandwiched between two IR-transparent windows (CaF2),creating a thin-layer configuration. A Teflon body keeps thecell together. The width of the cell and the WE is in the sameorder of magnitude as the width of the IR-light beam, allow-ing for the analysis of the entire cell. The design by Mosset al.11 has been used by several researchers over the past fewyears with little change in the design.15,28–31,33 Most changesare small, such as changing the WE material into a platinummesh instead of a Au mesh.30,31,33 One notable setup thatdoes not use the above-mentioned mesh configuration is thework done in the group of Swain,34–36 where boron dopeddiamond (BDD) deposited on undoped silicon is used astransparent electrode material. This has as benefit over themesh configuration that light is not blocked by the electrode.Among the large number of applications found in literature,some common applications for transmission IR-SEC areinvestigations of proteins, such as their oxidation, reductionand folding properties.11,15,28,29 Another application is thestudy of porphyrins.30,31,33
2.2.2 Reflection IR-SEC2.2.2.1 Basic principles reflection IR-SEC. The basic prin-
ciples for IR reflection spectroscopy are as follows: the IR lightis emitted by the light source. The IR light propagates throughan IR-transparent window (often CaF2) into the electro-chemical cell. Next the light beam hits the electrode, an IRreflective material, and is reflected out of the cell, as shown inFig. 3. The reflected beam passes back through the samewindow into the detector. In Fig. 3 a typical schematic repre-sentation of a reflectance cell by Alwis et al.14,37 is shown. TheWE is on top of a CaF2 window creating a thin-layer configur-ation. The reference electrode (RE) is separated from the cellby a Luggin capillary and the counter electrode (CE) is loopedaround the WE.
Drawbacks of reflectance IR-SEC compared to transmit-tance IR-SEC mostly come from the somewhat more complexsetup. When using a reflection setup it is necessary to intro-duce extra mirrors into the IR-spectrometer in order to focusthe incident beam onto the electrode and focus the reflectedbeam onto the detector. Aligning these mirrors can be a time-consuming process, more labour intensive compared to trans-mission spectroscopy. The use of extra mirrors also introducesextra losses due to part of the light being absorbed instead ofbeing reflected. An advantage of using reflection compared totransmission spectroscopy is that no light is blocked by theelectrode material.
2.2.2.2 Fibre optic reflection IR-SEC. An alternative for thestandard reflection setup is fibre optic reflectance spec-troscopy. First developed by Shaw et al.38 and used over thepast decade primarily in, or in collaboration with, the group ofRichter-Addo.38–41 The advantage of this specific configurationcompared to reflection systems such as those by Alwis et al.14,37
is the ease of alignment of the source with the sample and elec-trode, allowing for smaller configuration of the setup. With thesmall thin-layer setup they claim better control over the appliedpotential than transmittance and ATR cells.38 This particularconfiguration is mostly applied to the study of porphyrins,39–41
although it should be noted that it can also be used for appli-cations where reflection IR is currently used.
2.2.2.3 SNIFTIRS and PM-IRRAS. As mentioned in section2.1.2, IR-SEC often operates with a thin-layer configuration. Inreflection mode there are two different methods in order toperform background corrections. The first method, based ondifference spectroscopy and most often reported in literature,is subtractive normalized interfacial Fourier transforminfrared reflection spectroscopy (SNIFTIRS). Alternatively,polarization modulation infrared reflection absorption spectro-
Fig. 2 Schematic representation of the IR-SEC cell. The arrow rep-resents the propagation of the IR-light beam (a) IR-transparent CaF2window mounted onto a (b) Plexiglas ring, (c) Teflon body, (d) steel sur-round, (e) Pt counter electrode, (f ) the mesh working electrode, (g)O-ring, (h) capillary connection to the reference electrode. Reprintedfrom the original work by Moss et al.,11 Copyright 1990, with permissionfrom John Wiley and Sons.
Fig. 3 Schematic representation of a reflection setup. Republished withpermission of Journal of The Electrochemical Society, original byAlwis et al.,14 Copyright 2013; permission conveyed through CopyrightClearance Center, Inc.
Analyst Critical Review
This journal is © The Royal Society of Chemistry 2020 Analyst, 2020, 145, 2482–2509 | 2485
Ope
n A
cces
s A
rtic
le. P
ublis
hed
on 1
5 Ja
nuar
y 20
20. D
ownl
oade
d on
12/
12/2
021
6:39
:58
AM
. T
his
artic
le is
lice
nsed
und
er a
Cre
ativ
e C
omm
ons
Attr
ibut
ion-
Non
Com
mer
cial
3.0
Unp
orte
d L
icen
ce.
View Article Online

scopy (PM-IRRAS) is used. SNIFTIRS is an IR-SEC reflectiontechnique first introduced in the early 1980s by Pons.42 Theauthors would like to note that the use of the term SNIFTIRSseems to be used inconsistently throughout literature. Severalpapers use the acronym SNIFTIRS,14,37,42–44 while otherpapers, seemingly using SNIFTIRS, don’t make use of theterm.13,45–50 SNIFITRS is a technique used for a number ofdifferent applications, such as the study of the oxidation ofsmall organic molecules (such as ethanol and ethyleneglycol)13,45,48,49 and metal ions.14,37,43 SNIFTIRS is also per-formed in combination with SEIRAS, for example for thestudies of proteins.46,47
PM-IRRAS, an alternative for SNIFTIRS, was first performedby Golden et al.51 in 1981. After this initial work, furthernotable improvements on the technique were done by Faguyet al.,52,53 the group of Corn54,55 and the group ofLipkowski.56–59 PM-IRRAS is most often used in cases wherethe potential modulation necessary for SNIFTIRS coulddamage the analyte of interest.16 Additional advantages ofPM-IRRAS over SNIFTIRS, as proven by Faguy et al.,52,53
include that PM-IRRAS is very insensitive to atmospheric waterand carbon species and has an increased signal to noiseratio.59,60 PM-IRRAS is especially suitable for measurements ofsamples adsorbed on metal surfaces, such as electrodes.Explained in a simplified manner, in PM-IRRAS the polariz-ation of the reflected light is modulated and the reflectiontakes place under a grazing angle of incidence. Under s-polar-ization (perpendicular to the plain of incidence) there is nointeraction between the light and electrode surface. However,when using p-polarization (parallel to the plain of incidence),constructive interference takes place at the electrode surface.By cycling the polarization of the light, a difference spectrumof the bulk (s-polarization) and at the electrode surface(p-polarization) can be obtained. PM-IRRAS has been reportedin literature as, among others, a method for the study of self-assembled monolayers61,62 and lipid bilayers.56–59
For a more in-depth description of SNIFTIRS andPM-IRRAS the authors recommend reading the work ofGuidelli,16 Bard63 and Alkire et al.59
2.2.2.4 Electrode material and SEIRAS in reflection IR-SEC.Concerning SEIRAS in reflection IR-SEC, electrode materialsused are Ni,14,37,43 Pt,13,38–41,50,64 Pd45,48,49 and Au.46,47,62,65,66
While only Liu et al. report on using the reflecting electrodesfor surface enhanchement,46,47 it is unlikely that the Au elec-trodes used by Hosseini et al.,62 Su et al.65 and Villalba et al.66
don’t report any enhancement. For Pt, Pd and Ni, SEIRAS hasbeen reported in the past,67 but none of the papers above men-tioned FTIR-SEC papers report this effect. This might bebecause it is not relevant for their application or that theSEIRAS effect is negligible.
2.2.3 Attenuated total reflection (ATR) IR-SEC2.2.3.1 Basic principles of ATR-IR-SEC. Attenuated total
reflection infrared spectroscopy (ATR-IR) operates under thefollowing principle: IR light is coupled into an internal reflec-tion element (IRE), as shown in Fig. 4. When the light hits thesample interface at an angle higher than the critical angle
(θcrit), total internal reflection occurs, reflecting the light andcreating an evanescence wave. This evanescence wave pene-trates into the sample for several micrometres, with the elec-tric field decaying at an exponential rate away from thesurface. This has the advantage that the effective path lengthin ATR-IR is always in the order of several µm, and thusremoves the need for a thin-layer configuration. In order to geta good estimation of the penetration depth in ATR-IR-SEC thefollowing formula can be used:68
de ¼ λ
2π
ffiffiffiffiffiffiffiffiffiffiffiffiffiffiffiffiffiffiffiffiffiffiffiffiffiffiffiffiffiffiffisin2θ � n2
n1
� �2s
ð2Þ
In this equation de is defined as the penetration depth (m)at which the intensity of the wave is reduced to 1/e of its orig-inal value, or approximately 37%. Furthermore λ is the wave-length (m) used, n1 is the refractive index of the IRE, n2 therefractive index of the sample and θ is the angle of incidence(°).68 This formula can give a good estimation of the pene-tration depth and the effect of the IRE material on the pene-tration depth of the system. It can consequently be used to getan estimate of the path length through the sample.
2.2.3.2 IRE material ATR-IR-SEC. Penetration depth is onereason to choose for a certain ATR material, other reasons areavailability, hardness and inertness. In Table 1, three differentmaterials used for the IRE in ATR-IR-SEC are shown: diamond,ZnSe and Si. Diamond is more expensive than ZnSe or Si, butits large spectral window68,69 (2–25 µm), its chemical inertnessand the high hardness are clear advantages. ZnSe is cheaperthan diamond and has a similar spectral window68,69
(1–25 µm) but is relatively soft and can only be used betweenpH 5–9. Finally, and also cheaper than diamond, there is Siwhich is harder than ZnSe and somewhat more inert, butsuffers from a reduced spectral window68,69 (2–7 µm).Surprisingly, Ge, a commonly used ATR material, does notseem to be used in ATR-IR-SEC. A possible reason for this isthe fact that Ge is more conductive than diamond, ZnSe and Siand therefore could potentially cause interference with thesimultaneous operation of the electrochemical cell.
Another variable in Table 1 is the configuration of the beampath through the IRE. As shown in the table, a single bounceor a multi bounce configuration can be used. Reasons tochoose a certain configuration include the law of Lambert-
Fig. 4 Internal reflection element. Reprinted and adapted from theoriginal work by Schadle and Mizaikoff,68 Copyright 2016, with per-mission from SAGE Publications.
Critical Review Analyst
2486 | Analyst, 2020, 145, 2482–2509 This journal is © The Royal Society of Chemistry 2020
Ope
n A
cces
s A
rtic
le. P
ublis
hed
on 1
5 Ja
nuar
y 20
20. D
ownl
oade
d on
12/
12/2
021
6:39
:58
AM
. T
his
artic
le is
lice
nsed
und
er a
Cre
ativ
e C
omm
ons
Attr
ibut
ion-
Non
Com
mer
cial
3.0
Unp
orte
d L
icen
ce.
View Article Online
Beer (eqn (1)), since a multi bounce configuration, where thelight interacts more often with the sample, effectively has alonger path length.
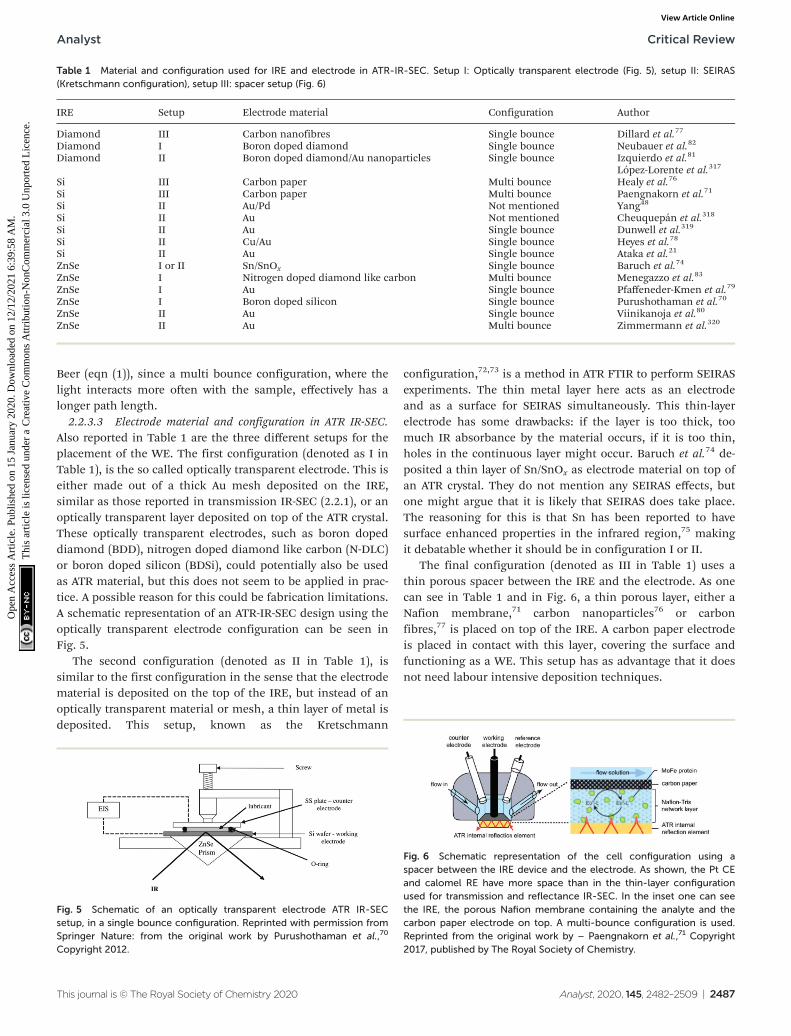
2.2.3.3 Electrode material and configuration in ATR IR-SEC.Also reported in Table 1 are the three different setups for theplacement of the WE. The first configuration (denoted as I inTable 1), is the so called optically transparent electrode. This iseither made out of a thick Au mesh deposited on the IRE,similar as those reported in transmission IR-SEC (2.2.1), or anoptically transparent layer deposited on top of the ATR crystal.These optically transparent electrodes, such as boron dopeddiamond (BDD), nitrogen doped diamond like carbon (N-DLC)or boron doped silicon (BDSi), could potentially also be usedas ATR material, but this does not seem to be applied in prac-tice. A possible reason for this could be fabrication limitations.A schematic representation of an ATR-IR-SEC design using theoptically transparent electrode configuration can be seen inFig. 5.
The second configuration (denoted as II in Table 1), issimilar to the first configuration in the sense that the electrodematerial is deposited on the top of the IRE, but instead of anoptically transparent material or mesh, a thin layer of metal isdeposited. This setup, known as the Kretschmann
configuration,72,73 is a method in ATR FTIR to perform SEIRASexperiments. The thin metal layer here acts as an electrodeand as a surface for SEIRAS simultaneously. This thin-layerelectrode has some drawbacks: if the layer is too thick, toomuch IR absorbance by the material occurs, if it is too thin,holes in the continuous layer might occur. Baruch et al.74 de-posited a thin layer of Sn/SnOx as electrode material on top ofan ATR crystal. They do not mention any SEIRAS effects, butone might argue that it is likely that SEIRAS does take place.The reasoning for this is that Sn has been reported to havesurface enhanced properties in the infrared region,75 makingit debatable whether it should be in configuration I or II.
The final configuration (denoted as III in Table 1) uses athin porous spacer between the IRE and the electrode. As onecan see in Table 1 and in Fig. 6, a thin porous layer, either aNafion membrane,71 carbon nanoparticles76 or carbonfibres,77 is placed on top of the IRE. A carbon paper electrodeis placed in contact with this layer, covering the surface andfunctioning as a WE. This setup has as advantage that it doesnot need labour intensive deposition techniques.
Table 1 Material and configuration used for IRE and electrode in ATR-IR-SEC. Setup I: Optically transparent electrode (Fig. 5), setup II: SEIRAS(Kretschmann configuration), setup III: spacer setup (Fig. 6)
IRE Setup Electrode material Configuration Author
Diamond III Carbon nanofibres Single bounce Dillard et al.77
Diamond I Boron doped diamond Single bounce Neubauer et al.82
Diamond II Boron doped diamond/Au nanoparticles Single bounce Izquierdo et al.81
López-Lorente et al.317
Si III Carbon paper Multi bounce Healy et al.76
Si III Carbon paper Multi bounce Paengnakorn et al.71
Si II Au/Pd Not mentioned Yang48
Si II Au Not mentioned Cheuquepán et al.318
Si II Au Single bounce Dunwell et al.319
Si II Cu/Au Single bounce Heyes et al.78
Si II Au Single bounce Ataka et al.21
ZnSe I or II Sn/SnOx Single bounce Baruch et al.74
ZnSe I Nitrogen doped diamond like carbon Multi bounce Menegazzo et al.83
ZnSe I Au Single bounce Pfaffeneder-Kmen et al.79
ZnSe I Boron doped silicon Single bounce Purushothaman et al.70
ZnSe II Au Single bounce Viinikanoja et al.80
ZnSe II Au Multi bounce Zimmermann et al.320
Fig. 5 Schematic of an optically transparent electrode ATR IR-SECsetup, in a single bounce configuration. Reprinted with permission fromSpringer Nature: from the original work by Purushothaman et al.,70
Copyright 2012.
Fig. 6 Schematic representation of the cell configuration using aspacer between the IRE device and the electrode. As shown, the Pt CEand calomel RE have more space than in the thin-layer configurationused for transmission and reflectance IR-SEC. In the inset one can seethe IRE, the porous Nafion membrane containing the analyte and thecarbon paper electrode on top. A multi-bounce configuration is used.Reprinted from the original work by – Paengnakorn et al.,71 Copyright2017, published by The Royal Society of Chemistry.
Analyst Critical Review
This journal is © The Royal Society of Chemistry 2020 Analyst, 2020, 145, 2482–2509 | 2487
Ope
n A
cces
s A
rtic
le. P
ublis
hed
on 1
5 Ja
nuar
y 20
20. D
ownl
oade
d on
12/
12/2
021
6:39
:58
AM
. T
his
artic
le is
lice
nsed
und
er a
Cre
ativ
e C
omm
ons
Attr
ibut
ion-
Non
Com
mer
cial
3.0
Unp
orte
d L
icen
ce.
View Article Online

A large number of applications regarding ATR-IR-SEC arereported in literature. Some examples are the study ofmetalloproteins,71,76 the study of CO2 reduction without74 andwith the combination of SEIRAS,78 the reduction of grapheneoxide,79,80 technique development81–83 and practical appli-cations such as observing lubricant degradation.70
2.2.4 IR-SEC microscopy. In IR microscopy, the light froman IR light source is coupled into an IR microscope. Just aswith conventional microscopy, the spatial resolution is limitedby the diffraction limit of the light. Since IR light has a rela-tively large wavelength compared to visible light, the spatialresolution is, at its lowest, in the order of about 5 µm.Nowadays, infrared microscopes with focal plane arrays areavailable, allowing not only IR microscopy but also imagingthe sample. The combination of IR microscopy and SEC hasfound some limited applications by using either a convention-al source or synchrotron radiation.
2.2.4.1 Conventional source. The most notable work inusing IR-SEC spectroscopy with a conventional source comesfrom the group of Sun,84 who developed their own IR-SECmicroscope in the late 1990s. They further developed thisinstrument in the last two decades for a variety of differentapplications regarding electrode interface reactions.85–87 Sunand Zhou also wrote a paper in which they further explain theuse of FTIR microscopy for electrochemical applications.88
2.2.4.2 Synchrotron source. Next to IR microscopy using con-ventional IR sources, instruments using synchrotron radiationhave also been reported. The first experiments regarding theuse of synchrotron radiation with electrochemistry werereported by Melendres et al.89 in 1995, although the IR fre-quency used was in the far infrared. The first experiment thatcoupled mid infrared synchrotron radiation with electro-chemistry was the work by the group of Burgess90 in 2011 wherethey proved that, when using small aperture settings, synchro-tron radiation has a better signal to noise ratio than convention-al sources. Further notable work with synchrotron IR micro-scopy combined with electrochemistry was done by the group ofBurgess on spatial mapping of methanol oxidation on a PtNialloy,91 femtomole detection of ferrocyanide on ultra-microelec-trodes92 and quantitative analysis of electrochemical diffusionlayers.93 Other notable work regarding synchrotron radiation incombination with electrochemistry was done by Ash et al.94 onsynchrotron based infrared microscopy to study biological redoxprocesses under electrochemical control. In this paper theyshow that they can observe changes in the Flavin mononucleo-tide active site of a flavoenzyme with synchrotron radiation.
Although the power of synchrotron radiation is proven bythe work done by researchers mentioned above, it has to benoted that the need of synchrotron radiation is a major draw-back to using synchrotron based IR spectroscopy. Access to asynchrotron source is limited and will stay so in the foresee-able future.
2.3 Future perspective
The fields of IR and SEC are ever increasingly combined andadvanced. Recently, a three-electrode electrochemical ATR cell
from Pike Technologies called the Jackfish SEC Cell hasappeared on the market. The J1W version of this device usescommercially available disposable IRUBIS ATR-SEIRAS devices,making IR-SEC suitable for a broader audience.95
It can be postulated that further improvements in the fieldof IR-SEC are linked to the advancements made in the fields ofIR spectroscopy and electrochemistry. These advancementswill take some time to be implemented into IR-SEC, but it islogical to assume that any advancement improving the separ-ate fields, will eventually be implemented in IR-SEC.
2.3.1 New sources for IR-SEC. One of the major drawbacksof IR spectroscopy is the low intensity of the light source. Highpower sources are available in the form of optical parametricamplifiers (OPA) and optical parametric oscillators (OPO) butthese systems are expensive and labour intensive to bothoperate and construct. A more affordable, user friendly andcompact option is a quantum cascade laser system (QCL).Some QCL instruments such as IRSweep’s Iris-f1 are completespectrometers, making IR-laser systems more available. InFig. 7, a comparison between the output of a QCL by DaylightSolutions, a synchrotron and a Globar source is made byWeida and Yee.96
The comparison as shown in Fig. 7 is made when passingthe light through a 10 µm pinhole. Subsequent spot sizes ofthe three techniques are normalized. This comparison high-lights the strength of QCLs in IR-microscopes, yet for normalspectroscopy this graph is skewed somewhat in favour of theQCL device. Nonetheless, the main message stays the same,being that a higher source power can be obtained with QCLs.Due to the higher power output of the QCLs, a shortermeasurement time compared to regular IR instruments can be
Fig. 7 Comparison of Weida and Yee of three different IR sources ofthe signal through a 10 µm pinhole.96 Reprinted and adapted from theoriginal work by Weida and Yee,96 Copyright 2011, with permission fromSPIE and M. Weida.
Critical Review Analyst
2488 | Analyst, 2020, 145, 2482–2509 This journal is © The Royal Society of Chemistry 2020
Ope
n A
cces
s A
rtic
le. P
ublis
hed
on 1
5 Ja
nuar
y 20
20. D
ownl
oade
d on
12/
12/2
021
6:39
:58
AM
. T
his
artic
le is
lice
nsed
und
er a
Cre
ativ
e C
omm
ons
Attr
ibut
ion-
Non
Com
mer
cial
3.0
Unp
orte
d L
icen
ce.
View Article Online

achieved. A commercially available QCL system from IRsweep,using optical heterodyne detection, even further improves thistime resolution. This IRsweep instrument can take a spectrumwith a spectral width in the order of 100 cm−1 within 4 µs.This allows for a more accurate understanding of the dynamicprocesses occurring at the electrode interface.
A drawback of QCLs is the shorter wavelength coveragecompared with standard IR sources. The wavelength range of asingle QCL is usually somewhere in the order of a micrometre.This can be compensated to some extent by having severallasers in a system. QCLs have already been used for several IRtechniques,97,98 and therefore could be implemented inIR-SEC in the near future.
2.3.2 From IRE to (single mode) waveguides. When havingaccess to laser based sources the use of waveguides instead ofIREs also becomes more attractive. A simplified explanation ofwaveguides can be found in Fig. 8. In Fig. 8a and b an IRE isshown, while Fig. 8c displays a single mode waveguide. Thefigure illustrates that reducing the size of the IRE increases theamount of bounces the light makes through the device, effec-tively increasing the path length. In Fig. 8c the thickness ofthe device has been reduced to such an extent that it cannotbe considered an IRE anymore, but a waveguide with a con-tinuous evanescent field along the length of the device.68 Anadded benefit of making the IRE smaller is that the losses dueto the absorption of the IRE material are reduced, since theeffective path length through the IRE decreases. While makingthe IRE smaller can improve the signal to noise ratio, it canalso make it more difficult to couple light into the device. Byusing a source with a higher power and small beam size, suchas the aforementioned QCLs, these losses might be mitigated.According to literature, a waveguide might lead to significantlyincreased sensitivity compared to an IRE device.68,69 Several
works on infrared waveguides99–106 have already been pub-lished and it is therefore not unthinkable that the first IR-SECwaveguide will be published in the near future.
2.3.3 Novel electrode material. An interesting material forIR-SEC to be used as a (true) transparent electrode in trans-mission mode or as waveguide material is BDD. BDD is opti-cally transparent for infrared light and can be used as an elec-trode. BDD has already been used as transparent electrodematerial on top of an IRE82 and as an optical electrode in thetransmission configuration.34–36 However, it might be possibleto use the diamond layer as IRE/waveguide and electrode sim-ultaneously. This would make it possible to measure as closeto the electrode as physically possible. A drawback of usingBDD as a waveguide are the extra losses the boron dopingcauses at wavenumbers of 1800 cm−1 and higher.34–36,107
When the already small waveguide also functions as elec-trode, a device with a small footprint can be created. This wayit can be easily combined with microfluidics in order to makelab-on-a-chip systems.
2.3.4 Microfluidics and lab-on-a-chip systems. Thehyphenation of electrochemistry and microfluidics and lab-on-a-chip systems is already well established. For a review regard-ing this subject the authors recommend to read the paper byOdijk et al.108
Although less established than electrochemistry, the combi-nation of IR with microfluidics is also a developing field, forexample: an ATR-IR device for the study of electric field-drivenprocesses,109 reaction monitoring110 and the analysis of chemi-cal reaction intermediates.111 A recent review written on spec-troscopic microreactors for heterogeneous catalysis by Rizkinet al. also includes a section about IR.112
The combination of IR-SEC and microfluidics is not anestablished field yet, although some work has been done byFührer et al.113 It is expected that in the near future more workregarding IR-SEC is published.
2.3.5 Improving spatial resolution. As mentioned insection 2.2.4, the optical IR microscopy imaging is limited to aspatial resolution in the order of 5 µm. Two different atomicforce microscopy (AFM) based techniques can improve thespatial resolution of IR techniques, namely photothermalinduced resonance (PTIR) and Nano-FTIR.
2.3.5.1 PTIR. PTIR is a technique that combines AFM withinfrared spectroscopy. This hyphenated technique has theoptical resolution of the AFM technique and the ability toobtain the chemical information usually obtained with IR. InPTIR, the probe tip of an AFM microscope is positioned closeto the region of interest. Next, a tuneable IR laser is focused onthe region close to the probe tip. If the sample has avibrational frequency that corresponds to the wavelengthemitted by the laser, absorption will take place. This absorp-tion results in a thermal expansion of the sample, which thenwill be measured by the AFM cantilever.114,115 The resultingspatial resolutions for commercially available instruments arein the order of 20 nm, at least two orders of magnitude lowercompared to optical microscopy.114,115 To our knowledge, thistechnique has not yet been combined with SEC. One possible
Fig. 8 Schematic representation of the evanescent wave/field with anever decreasing IRE thickness. As one can see in (a) and (b), the smallerIRE has more reflections than the bigger IRE. When the size is smallenough, as one can see in (c), a waveguide is created with a continuousevanescent field. Reprinted from the original work by Schadle andMizaikoff,68 Copyright 2016, with permission from SAGE Publications.
Analyst Critical Review
This journal is © The Royal Society of Chemistry 2020 Analyst, 2020, 145, 2482–2509 | 2489
Ope
n A
cces
s A
rtic
le. P
ublis
hed
on 1
5 Ja
nuar
y 20
20. D
ownl
oade
d on
12/
12/2
021
6:39
:58
AM
. T
his
artic
le is
lice
nsed
und
er a
Cre
ativ
e C
omm
ons
Attr
ibut
ion-
Non
Com
mer
cial
3.0
Unp
orte
d L
icen
ce.
View Article Online

explanation could be that SEC introduces too much heat in thesample, which could interfere with the AFM measurement.
2.3.5.2 Nano-FTIR. In Nano-FTIR, FTIR and scattering-typescanning near-field optical microscopy (s-SNOM) are com-bined. IR light from a conventional IR laser source or a syn-chrotron source is focused on a conductive AFM probe tip.This probe tip acts as an antenna for the IR light and focusesand enhances it. The near field interaction between the probetip and the sample influences how the light is being scattered.Recording the scattered light results in a spectrum of thesample. While imaging the surface, a map with special resolu-tion as small as 10 nm can be obtained.114,116,117 One appli-cation of Nano-FTIR combined with SEC was reported by Luet al.116 where they study the molecular structure of graphene-liquid interfaces, allowing new possibilities for the characteriz-ation of graphene-electrolyte interfaces.
2.3.6 Advanced SEIRAS structures. Finally, SEIRAS couldbe improved by replacing rough metal films with nanofabri-cated structured SEIRAS arrays or slits. Nanofabricated plas-monic nanoantennas have shown to be promising for theuse in SEIRAS.118 These devices have been reported to havean improved SEIRAS effect, although they usually onlyoperate at a small wavelength range. This however wouldmake them a suitable to be used with QCLs, as they can betuned to the same wavelength as the relatively narrow-bandQCL laser.
3 Raman spectroelectrochemistry(Raman-SEC)3.1 Introduction Raman-SEC
3.1.1 Raman spectroscopy. Just like IR spectroscopy,Raman spectroscopy is a technique used to get informationfrom the vibrations of molecule. In short, Raman spectroscopyoperates based on the Raman scattering effect. A light source,often a laser with a wavelength in the near infrared, visible ornear ultraviolet, is directed at the sample. When the lightinteracts with the sample, photon scattering takes place. Mostof the light is elastically scattered from the sample, alsoknown as Rayleigh scattering, and has the same wavelength asthe incoming light. A small percentage of the light is inelasti-cally scattered, also known as Raman scattering, resulting in ashift in wavelength corresponding to the frequency of a mole-cular vibration. The shift can be to higher wavelengths (Stokesshift) or lower wavelengths (anti-Stokes shift).
Raman is often considered to be complementary to IR spec-troscopy. The reason for this is that, in order to be visible inRaman spectroscopy, the vibration has to experience a changein polarizability. In other words, a change in how easy it isto distort the electron cloud around the molecule. As men-tioned in the previous section, IR active molecules require achange in dipole moment in order to be visible in IR spec-troscopy. Often vibrations that are polarizable do not havea dipole moment and vice versa, making the techniquescomplementary.
A typical setup used in Raman spectroscopy is shown inFig. 9, as reported by Schmid and Dariz.119 It consists of alight source, most often a laser, focused on the sample using amicroscope objective. The scattered light is guided back intothe instrument and a filter removes the Rayleigh scatteredlight. The Raman scattered light is guided onto the grating ofa monochromator and eventually reaches the detector, whereit records the resulting spectrum.
3.1.2 Surface enhanced Raman spectroscopy (SERS).Fleischmann et al.120 made the first observation of SERS in1974. Since then the work by the group of Van Duyne,121,122
the group of Moskovits,123–125 Otto129 and Schlücker126 furtherpioneered the field of SERS. In a simplified explanation, SERSis a technique that is used to enhance a Raman signal, similarto SEIRAS. This is primarily done through the electromagneticinteraction of the incident Raman light beam with the metalsurfaces.19,24 This results in a phenomenon called plasmonresonance which amplifies the laser field.24 This phenomenononly occurs very close to the surface of the metal substrate.Typically, the analyte is required to be relatively close to thesubstrate, not further away than 10 nm.19,24 The substrate,most often Ag or Au, should contain microstructures, eitherperiodically nanofabricated or randomly orientated as encoun-tered in roughened surfaces, to increase the intensity of theenhancement.
A second factor for enhancement that should be discussedis the “chemical” enhancement. Unlike the well-definedelectrochemical enhancement, the term “chemical” enhance-
Fig. 9 Schematic representation of a Raman setup. Reprinted from theoriginal work by Schmid and Dariz,119 Copyright 2019, with permissionfrom Creative Commons. Licensed under CC BY 4.0.
Critical Review Analyst
2490 | Analyst, 2020, 145, 2482–2509 This journal is © The Royal Society of Chemistry 2020
Ope
n A
cces
s A
rtic
le. P
ublis
hed
on 1
5 Ja
nuar
y 20
20. D
ownl
oade
d on
12/
12/2
021
6:39
:58
AM
. T
his
artic
le is
lice
nsed
und
er a
Cre
ativ
e C
omm
ons
Attr
ibut
ion-
Non
Com
mer
cial
3.0
Unp
orte
d L
icen
ce.
View Article Online

ment describes more of a collection of different phenom-ena.127 Simplified, the chemical enhancement mostlydescribes phenomena due to the charge transfers between theanalyte molecule and the metal substrate and other metal sub-strate/analyte molecule interactions. The chemical enhance-ment is significantly lower than the electrochemical enhance-ment, and much harder to theoretically explain and predict.126
In practice, distinctions can be made between threedifferent kinds of SERS substrate. The first are randomly orien-tated enhancement surfaces, such as roughened (electrode)surfaces and randomly orientated nanoparticles deposited orgrown on a surface, which are relatively easy to fabricate.Second are the so called structured arrays, which can exist of aself-assembled array nanoparticles deposited on a substrate ornanofabricated arrays. These structured arrays can obtainhigher enhancement factors than the roughened surfaces butare more difficult to fabricate. Finally, in order to improvemeasuring in liquid samples, metallic particles can be used inorder to create SERS active colloidal solutions.24 This lastform, using colloidal particles, cannot be used in SERS-SEC,since it cannot function as or be in contact with the WE easily.With the right combination of SERS substrate material andconfiguration of the structures, enhancement factors of up to1010 can be achieved, depending on the used definition ofSERS enhancement.24
One important note on working with nanoparticles is theneed for proper cleaning of the particles in order to maximizethe SERS effect. The recent work of Montiel et al. describessome of the methods that can be used for the cleaning ofthese particles.128
SERS is a complex field with persistent misconceptions.124
Therefore a complete review on the subject is beyond thescope of this study. The authors of this review recommendthat the reader reads the work cited for a more in-depth expla-nation of SERS.24,67,120–126,129
3.1.3 Raman-SEC. In Raman-SEC, a Raman instrument,often a Raman confocal microscope, is coupled to an electro-chemical cell. Compared to FTIR SEC, a Raman setup is some-what more versatile in the cell design. Since Raman is a scat-tering technique, it is not limited to transparent electrodes asis the case with transmission IR-SEC. Measurements usuallytake place at the electrode surface, so the laser is most oftenused in a configuration where it is focused on the electrode.Even compared to reflection and ATR IR-SEC, the setup of thecell can be considered more user friendly. The optical windowof the cell can be made out of standard materials since avisible light source can be used. The thin-layer configuration isnot necessary, as water does not have strong absorptions intypical wavelengths used for Raman spectroscopy. Moreover,confocal lenses are often used. Once access to a Raman instru-ment is available, combining it with SEC is therefore relativelystraightforward.
3.1.4 SERS-SEC. As written above, the first report of theobservation of the SERS phenomenon is considered to bemade by Fleischmann et al.120 In this experiment, SERS wasobserved by studying pyridine on a Ag electrode. This experi-
ment highlights the good synergy between SEC and Raman.The metallic electrodes used for the electrochemistry are natu-rally suited to perform SERS measurements, and adapting anelectrode to be more SERS active usually does not negativelyinterfere with the electrode behaviour. For this reason, Raman-SEC measurements will experience the SERS effect to someextent, which can be either negligible or indeed the sellingpoint of a certain configuration.
3.2 State of the art of Raman-SEC
3.2.1 Cell configuration and electrodes. There is a largevariety of different materials for Raman electrodes. Reportsrange from standard metallic electrodes such as Au electrodes,to cells made by 3D printing,130 screen-printedelectrodes131–138 and even electrodes on fabric.139
In the literature, several different cell configurations aredescribed. Most commonly used is the stationary electrodeconfiguration. Other configurations include the rotating cell,the linearly moving cell or the flow through cell. Two impor-tant reasons to choose a certain cell are the ease of use andthe balance of fabrication versus potential photo-degradation.Photo-degradation of samples can be a severe problem inRaman spectroscopy. Constant illumination of a substrate canheat up the sample and eventually cause burning or evapor-ation of the sample or matrix. In the next section, we willdiscuss the different cells, their advantages and disadvantages,and how they deal with photo degradation.
3.2.1.1 Stationary electrode. The stationary electrode, asshown in Fig. 10 is the most commonly used configuration.Since the laser is stationary with respect to the electrode,alternatives should be considered in order to reduce damagedue to the laser beam. Depending on how susceptible thesample is to photo degradation, one should limit the laserpower and the exposure time of the sample.
3.2.1.2 Linearly moving electrodes and cells. In order toreduce photo degradation, several setups have been designedto limit the time the Raman laser remains on a single spot onthe substrate. One such a device operates by moving the entirecell and its electrode as can be seen in Fig. 11. The cell moves
Fig. 10 Example of a stationary electrochemical cell used for Ramanexperiments. Reprinted from the original work by Fleischmann et al.,120
Copyright 1974, with permission from Elsevier.
Analyst Critical Review
This journal is © The Royal Society of Chemistry 2020 Analyst, 2020, 145, 2482–2509 | 2491
Ope
n A
cces
s A
rtic
le. P
ublis
hed
on 1
5 Ja
nuar
y 20
20. D
ownl
oade
d on
12/
12/2
021
6:39
:58
AM
. T
his
artic
le is
lice
nsed
und
er a
Cre
ativ
e C
omm
ons
Attr
ibut
ion-
Non
Com
mer
cial
3.0
Unp
orte
d L
icen
ce.
View Article Online

together with the electrode in a linear path with respect to theRaman light source, reducing the time for which a single spoton the electrode is exposed to the Raman source. The linearmoving electrode was first developed by Niaura et al.140 and ismostly used by Mažeikienė et al. to study polyaniline,141–146
dyes147–150 and hexacyanoferrates.151,152
3.2.1.3 Rotating electrodes and cells. Next to the movingelectrode system, a rotating Raman system has been first devel-oped by Kiefer and Bernstein153 in 1971. One of the first rotat-ing Raman-SEC setups was reported by Yamada et al.154 in1978, as shown in Fig. 12. An advantage from an electro-chemical point of view for both the rotating electrode and themoving electrode is that there are no mass transport limit-ations due to the added convection. Some use of the rotating
electrode has been reported in the 70’s and 80’s,154–158 but,despite the potential of the rotating electrode, little mention ofits use is reported in recent literature. An alternative to therotating electrode configuration is the rotating cell configur-ation, in which instead of the electrode the entire cell is beingrotated. This device was first used by Kavan et al.159 in 2009.The WE is positioned at the centre of the motor axis while thesample rotates. Despite the potential for this setup, it is onlymentioned once more in literature, for Fullerene C60 in anaqueous medium.160
3.2.1.4 Flow through cell. Another way to reduce the chanceof photo-degradation is a flow through cell, which is easy touse for non-viscous liquids, but not applicable for solidsamples. Most commonly, a flow through cell either operatesby having a constant flow of fresh liquid flowing overthe WE161,162 or by continuous mixing of the electrolytesolution.163
3.2.1.5 Alternative designs. A special configuration that isworth mentioning is the setup by Ibañez et al.,164 using a4-electrode system in order to study the charge transfer at apolarisable liquid/liquid interface. Another interesting designis the Raman spectroscopy of a carbon super capacitor byBonhomme et al.165
3.2.2 Application Raman-SEC3.2.2.1 Materials. Raman-SEC is used in a multitude of
research fields and for different applications. An importantresearch field for Raman-SEC is material science to investigatenovel materials. One example is the research done on carbonnanotubes. Most of this extensive research comes from thegroups of Dunsch and Kavan,166–177 although some work hasbeen performed elsewhere.178–183 A related field is the investi-gation of graphene.162,163,184–190 Another popular applicationof Raman-SEC within material science is to get more insighton conductive polymers, studied by the group ofMalinauskas141–146,191 and others.192–202 A number of appli-cations are reported on the investigation of dyes,147–150,203,204
small organic molecules that can form monolayers on the elec-trode material205–209 and protein/cell studies.140,210–212
3.2.2.2 Sensing applications and point of care. Researchaimed towards real world applications is also present inRaman-SEC, although underrepresented and almost solely per-formed by the group of Brosseau. Some interesting appli-cations include a portable SERS-SEC device for the detectionof melanine in milk,136 the detection of DNA biomarkers insynthetic urine,137 the detection of 6–thiouric acid in syntheticurine,213 the quantitative detection of uric acid in syntheticurine138 and a point of care device based on SERS-SEC on afabric substrate.139
3.3 Future perspective
Raman-SEC is already a more mature technique than forexample IR-SEC. This does not mean, however, that the tech-nique has stopped to progress. The authors of this review areof opinion that most future development will take place on theSERS substrates and the development of new applications forRaman-SEC, especially towards real world applications.
Fig. 11 Schematic of a moving electrode cell. Ne is the Neon lamp andD is the rotating disk rotating around the axis represented by the blackdot. Reprinted from the original work by Niaura et al.,140 Copyright 1997,with permission from John Wiley and Sons.
Fig. 12 Rotating Raman-SEC device. Reprinted from the original workby Yamada et al.,154 Copyright 1978, with permission from Elsevier.
Critical Review Analyst
2492 | Analyst, 2020, 145, 2482–2509 This journal is © The Royal Society of Chemistry 2020
Ope
n A
cces
s A
rtic
le. P
ublis
hed
on 1
5 Ja
nuar
y 20
20. D
ownl
oade
d on
12/
12/2
021
6:39
:58
AM
. T
his
artic
le is
lice
nsed
und
er a
Cre
ativ
e C
omm
ons
Attr
ibut
ion-
Non
Com
mer
cial
3.0
Unp
orte
d L
icen
ce.
View Article Online

3.3.1 Nanofabricated SERS structures. Further develop-ments towards structured nano arrays for SERS applicationsare expected. As is shown in Fig. 13 by Yuan et al.,214 highlystructured nano arrays consisting of thin Au lines can be usedas SERS substrate, resulting in high enhancement factorswhile still functioning as electrode. New lithographic tech-niques make the wafer-scale fabrication of such substrateseasier,215 while novel methods to improve the adhesion ofthese Au structures on silicon216 have also been developed inrecent years.
Compared to, for instance, Au islands and randomly dis-tributed particles, these nanostructured arrays can achieve ahigher reliability, since the enhancement is higher and equalover the entire surface. This makes these structures more suit-able for quantitative measurements compared to the randomlyorganized substrates.
3.3.2 Electrochemical-surface oxidation enhanced Ramanscattering (EC-SOERS). EC-SOERS is a relatively new techniquethat was first introduced by Perales-Rondon et al.217,218
According to Perales-Rondon et al., EC-SOERS cannot be easilyexplained using the classical models of SERS.217,218 InEC-SOERS, enhancement is only observed when the Ag WE isundergoing anodic oxidation. They postulate that during thisprocess nanostructures are formed that are favourable forSERS enhancement. Garoz-Ruiz claims that this techniquemight be an alternative for molecules that are usually not verysensitive in SERS. Several question need to be answered todetermine the potential of this SOERS techniques for thefuture, such as elucidating the enhancement mechanism anddetermining suitable applications.
3.3.3 Improving time and spatial resolution3.3.3.1 Time resolved Raman spectroscopy. Most commonly,
Raman-SEC is performed using the so-called steady statemethod. In the steady state method, the electrode potential is
set to a desired value and given time to stabilize.219,220 Afterthis stabilization period, a Raman spectrum is acquired. Thissteady state method has the benefit of being highly reproduci-ble in obtaining data. However, information is lost when oper-ating in this steady state configuration, such as information onreactive intermediates. Several experiments have been done inthe 1990s regarding time resolved Raman spectroscopy.221–226
Van den Beld et al. have recently used an in-house developedgraphene spectroelectrochemical cell to study the adsorptionbehaviour of simple redox couples in a more dynamic fashion,i.e. acquiring real-time Raman spectra while recording cyclicvoltammograms at a scan rate of 25 mV s−1.190 Also recently,Zong et al.220 published on a transient SERS-SEC instrumentthat can acquire data at millisecond time resolution withoutthe need to repetitively cycle the data acquisition. Furtherimprovements in the field of time-resolved Raman-SEC mightlead to a better understanding of reaction intermediates at theelectrode surface.
3.3.3.2 Spatial resolution. One method in Raman spec-troscopy that can be used in order to improve the spatialresolution is tip-enhanced Raman spectroscopy (TERS). Firstproposed by Wessel227 in 1985 and first independently devel-oped by Stöckle et al.,228 Anderson,229 Hayazawa et al.230 andPettinger231 in 2000. In short, a metal or metal-coated tip isilluminated with a laser. The metal tip acts as a substrate forsurface enhancement and can therefore be used for sensingpurposes. In general, TERS achieves an enhancement factor ofabout 103 to 106, and has a spatial resolution between10–80 nm,232 much smaller than the diffraction limit of light.The combination of SEC and TERS is a relatively new field,first introduced in 2015 by Kurouski et al.233 and Zeng et al.234
As an emerging field, we expect that TERS-SEC will find moreinterest in the future.
3.3.4 Real world applications. As shown in paragraph 3.2.2,most of the research done with Raman-SEC is on fundamentalresearch for material sciences. Recently, a paper was publishedon compact Raman-SEC for a portable point-of-care device,136
as well as a paper on a low-cost portable device for the study ofcarbon nanotubes.182 These advancements might makeRaman-SEC more accessible, possibly enabling a break-through towards more real-world applications.
3.3.5 Shell-isolated-enhanced-Raman-spectroscopy parti-cles (SHINERS) and catalysis. Another new developmentrelated to SERS are so called SHINERS. SHINERS, developed bythe group of Tian,235 are promising SERS particles coated withan inert layer for the use of catalyst monitoring. This both pro-tects the typically Au nanoparticles from the high temperatureand pressure conditions required for catalysis and at the sametime prevents the Au to act as a catalyst, while the particlesstill exhibit the SERS effect.235 The group of Tian also per-formed notable work on combining SHINERS with electro-chemistry. In the work Li et al.236 they combine SHINERS withelectrochemical methods (EC-SHINERS) in order to monitorthe pyridine absorption on single crystal Au surfaces in situ.The structured nanowires mentioned before (Fig. 13) couldalso be made into SHINERS-like structures by coating them
Fig. 13 In situ SERS-SEC system by Yuan et al.214 (a) Schematic repre-sentation of the Raman SEC analysis system, (b) SEC-cell composed of aSEC-chip directly bonded to a small-volume microfluidic samplechamber with an optical interface to a microscope objective, (c) SEC-cell consisting of a Pt CE and nanostructured Au WE patterned on the SiSEC-chip and an external Ag/AgCl RE, and (d) representative SEM imageof the Nanostructures Au WE. Reprinted with permission from Yuanet al.214 Copyright 2015 American Chemical Society.
Analyst Critical Review
This journal is © The Royal Society of Chemistry 2020 Analyst, 2020, 145, 2482–2509 | 2493
Ope
n A
cces
s A
rtic
le. P
ublis
hed
on 1
5 Ja
nuar
y 20
20. D
ownl
oade
d on
12/
12/2
021
6:39
:58
AM
. T
his
artic
le is
lice
nsed
und
er a
Cre
ativ
e C
omm
ons
Attr
ibut
ion-
Non
Com
mer
cial
3.0
Unp
orte
d L
icen
ce.
View Article Online
with Si. Although these SHINERS-like nanowires would nolonger be suitable for use as electrodes, they could find appli-cations in the field of e.g. elucidating photoelectrocatalyticreaction mechanisms.
4 Nuclear magnetic resonancespectroelectrochemistry (NMR-SEC)4.1 Introduction NMR
Nuclear magnetic resonance (NMR) spectroscopy is a tech-nique which is often used to obtain structural data about ana-lytes. It typically operates within radio frequencies in the rangeof 60 to 1000 MHz (wavelengths of ca. 5 to 0.3 m). These low-energy waves can interact with nuclei that possess a magneticspin, for example the isotopes 1H and 13C. For NMR spec-troscopy, the different spin states of the nuclei get separatedwith a powerful magnetic field. The surrounding atoms andfunctional groups in a molecule influence how strongly theoutside magnetic field affects the target nucleus locally. As aconsequence, NMR spectroscopy is able to obtain comprehen-sive structural information of the molecule.
The sample can be manipulated and analysed withradio frequency radiation generated with a transmitter insidethe spectrometer and the NMR probe around the sample.Nowadays, there are many different pulse patterns being usedfor sample excitation under varying experimental conditions.
For more detailed information, the authors refer the readerto a recent review paper by Colnago et al.237 and the referencestherein, explaining the fundamentals and challenges of NMRspectroscopy.
4.2 State of the art of NMR-SEC
NMR spectroscopy is a versatile tool to identify molecules non-destructively and accurately. It is most commonly used for theanalysis of organic compounds, although there are also manyapplications which involve metals or metalorganic com-pounds. This versatility makes NMR spectroscopy a good coup-ling partner to EC, which can e.g. struggle to attribute signalscorrectly in the presence of side reactions. By combining thetwo techniques, however, mechanistic and kinetic informationcan be obtained in situ accurately and in a much more flexibleway than e.g. with UV/Vis or IR spectroscopy, which can belimited by the functional groups present in the analyte.
However, because of the strong dependency of NMRmeasurements on the electromagnetic environment of anucleus and the involvement of a strong outside magneticfield, NMR-SEC is not trivial. Combining EC with NMR leadsto interference between the electrical and the magnetic fields,often caused by the electrode configuration, which can worsenthe signal to noise ratio and signal resolutions in general.Additionally, instrumental failure upon simultaneous use ofboth systems has been reported, making real-time in situmeasurements challenging.238 Pioneering work on NMR-SECwas performed by Wieckowski and associates. Many of theirreported approaches were based on transferring the reaction
products from an EC-cell into an NMR tube and then ana-lysing them with an NMR spectrometer in an offlinemanner.239–249 Other works included dedicated SEC-NMRcells250,251 or placing an EC-cell into an NMR spectrometer.252
A simple way to avoid possible interference between the twomethods is to use an online technique which separates theelectrochemical and the NMR-spectroscopic steps. However,this leads to much longer response times than is necessary toobserve electrochemical intermediates and short-lived reactionproducts and is difficult to automate. To our knowledge,online EC-NMR methods are rarely being reported.
In this review paper, we instead focus on the liquid samplein situ EC-NMR methods reported in recent years and brieflymention their respective applications. For information onNMR applications in battery research, Hu et al. have recentlypublished a review paper.254
4.2.1 Three-electrode cells as NMR tube insert. Because ofthe small confines imposed by standard NMR spectrometers,most of the recently reported in situ NMR-SEC approaches forliquid samples rely on integrating a homemade EC cell into astandard NMR test tube. An integral part of this kind ofsetup is the use of chokes to reduce the encountered inter-ference between the NMR spectrometer and the potentio-stat, which was specifically characterized in some recentpublications.255,256
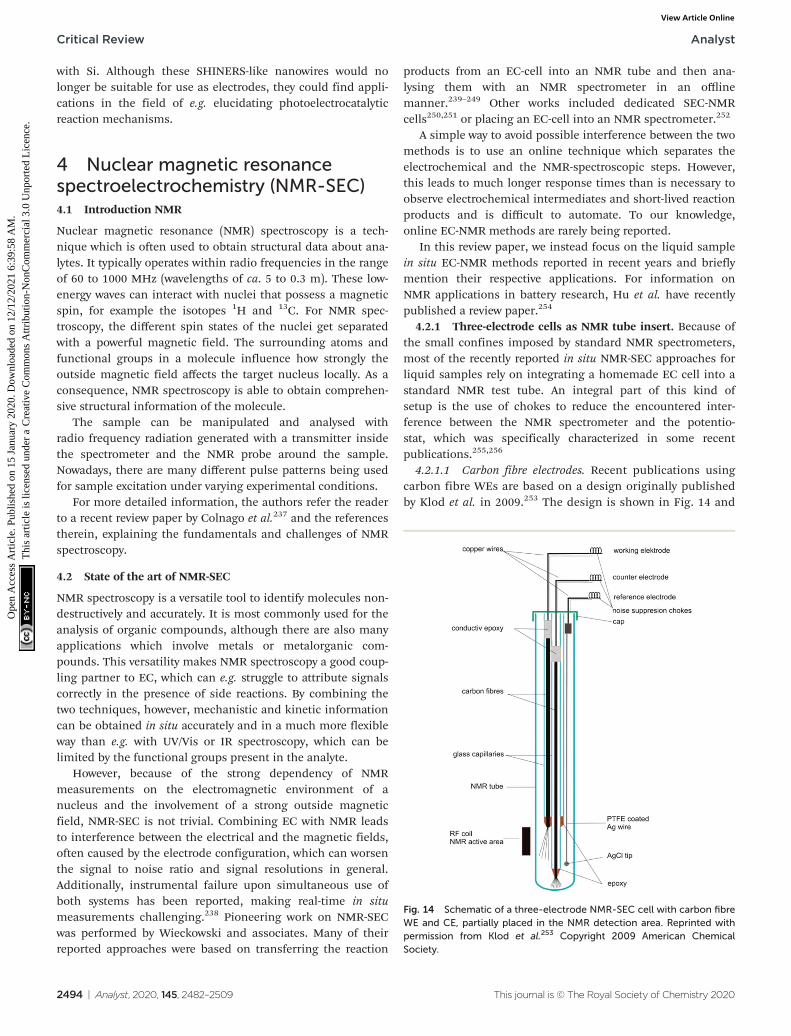
4.2.1.1 Carbon fibre electrodes. Recent publications usingcarbon fibre WEs are based on a design originally publishedby Klod et al. in 2009.253 The design is shown in Fig. 14 and
Fig. 14 Schematic of a three-electrode NMR-SEC cell with carbon fibreWE and CE, partially placed in the NMR detection area. Reprinted withpermission from Klod et al.253 Copyright 2009 American ChemicalSociety.
Critical Review Analyst
2494 | Analyst, 2020, 145, 2482–2509 This journal is © The Royal Society of Chemistry 2020
Ope
n A
cces
s A
rtic
le. P
ublis
hed
on 1
5 Ja
nuar
y 20
20. D
ownl
oade
d on
12/
12/2
021
6:39
:58
AM
. T
his
artic
le is
lice
nsed
und
er a
Cre
ativ
e C
omm
ons
Attr
ibut
ion-
Non
Com
mer
cial
3.0
Unp
orte
d L
icen
ce.
View Article Online

incorporated three electrodes. The WE and CE both con-sisted of carbon fibre filaments in sealed glass capillariesand the pseudo-RE was a PTFE-covered Ag wire with a AgCltip. Only the active region of the WE was placed in the NMRdetection area. The motivation to use carbon fibres was thehigher possible reaction rate to obtain enough electrolysisproduct for 1H and 13C NMR measurements in loweramounts of time. Recent applications of this cell includedthe analysis of p-benzoquinone,253,257 2-diphenylaminothio-phene based compounds258 and a perfluoroalkylated fuller-ene.259 In the last case, 19F NMR spectroscopy was performedas opposed to the more common 1H and 13C experiments.The measurements in all of the applications just mentionedwere performed over large timeframes of up to 17 hours ofelectrolysis with periodic NMR spectroscopy sampling.Nunes et al. used a very similar configuration with the REplaced above the NMR detection area in a 10 mm NMR tubefor the reduction of 9-chloroanthracene.238 They used asteady-state free precession (SSFP) pulse sequence to obtaina strong enough signal for 13C experiments in the span of11 minutes while halting the 150 minutes long electrolysisprocess during the measurement. Huang et al. used adifferent variation of the three-electrode design in which theWE carbon fibres just above the NMR detection area wereloaded with a commercial electrocatalyst and a Pt gauzeserved as CE.260 They reported successful 13C measurementsof the electrocatalytic oxidation of 13C-labeled ethanol byaveraging 128 scans.
In 2013, Bussy et al. reported a slightly different three-elec-trode configuration in which carbon microfibres were againused as WE and CE.261 The RE was replaced with a Pd wire. Inthis iteration, shown in Fig. 15, the electrodes were interfacedwith the glass capillaries slightly differently and placed indifferent positions. The CE was still placed beneath the NMRdetection area while the WE and the pseudo-RE were placedabove it. Using this design, the oxidation of phenacetin wasmonitored periodically over the span of 6 hours.261 Anotherapplication of this NMR-SEC cell was reported by Boisseauet al. when they performed ultrafast 2D COSY experiments on9-chloroanthracene.262 Periodic NMR samples were taken every3 minutes in a chronoamperometric experiment over a time-frame of 80 minutes.
While the previously described cell designs focused onplacing the WE close to or in the NMR detection area FerreiraGomes et al. reported an NMR-SEC cell with three-electrodesetup where all electrodes were deliberately placed above theNMR detection area. They used a carbon fibre WE, a platinizedPt CE, and a Ag/AgCl pseudo-RE.263 By moving the electrodesoutside of the detection area, Ferreira Gomes et al. investigatedthe influence of the interference between the magnetic and theelectric fields on mass transport within the cell. They reportedthat, by exploiting the resulting magnetoelectrolysis effect,264–266
which causes the solution to be stirred by a magnetohydrody-namic force, the electrochemical reaction rate for the electro-chemical reduction of p-benzoquinone was greatly increased.The reaction was monitored via 1H NMR spectroscopy.
4.2.1.2 Thin film electrodes. While carbon microfibreapproaches could aim to improve the electrochemical conver-sion inside the NMR-SEC cell, thin films with large surfaceareas hold the advantage of being near transparent to radiofrequency radiation if they are thinner than their respectiveskin depth.267 This makes it possible to move the WE andpossibly CE further into the NMR detection area to bettermonitor the electrochemical reaction close to the electrodes.One of the older approaches to introduce electrodes into anNMR tube based on a metal film was published by Zhang andZwanziger in 2011.256 They used a thin Au film deposited on a3 mm glass tube with small bored holes for ion exchange thatserved as WE and extended into the NMR detection area. Apseudo-RE was positioned inside of the WE glass tube and acurved platinized Pt-foil CE was placed between the NMR tubewall and the WE. With this metal film-based setup, Zhang andZwanziger investigated the spectroelectrochemistry of p-benzo-quinone, caffeic acid and 9-chloroanthracene in mechanisticapproaches and with sampling times of up to two minutes.Cao et al. reported a similar NMR-SEC cell in which a Aucoated glass tube sealed with a Nafion membrane to allow ion-exchange was used.268 Additionally, a Pt wire CE was placedinside the WE tube and a Pt foil pseudo-RE was placedbetween the NMR tube wall and the WE tube. Only the WEreached into the NMR detection area. They performed real-time 1H NMR-SEC in situ measurements on quinone.
In more recent publications, Sorte et al. constructed anNMR-SEC cell with an interdigitated Au WE and CE (IGEs)in the NMR detection area and a Ag/AgCl pseudo-RE above
Fig. 15 Schematic of a three-electrode NMR-SEC cell with carbonmicrofibre WE and CE placed above and below the NMR detection area.Reprinted by permission from Springer Nature: from the original workby Bussy et al.,261 Copyright 2012.
Analyst Critical Review
This journal is © The Royal Society of Chemistry 2020 Analyst, 2020, 145, 2482–2509 | 2495
Ope
n A
cces
s A
rtic
le. P
ublis
hed
on 1
5 Ja
nuar
y 20
20. D
ownl
oade
d on
12/
12/2
021
6:39
:58
AM
. T
his
artic
le is
lice
nsed
und
er a
Cre
ativ
e C
omm
ons
Attr
ibut
ion-
Non
Com
mer
cial
3.0
Unp
orte
d L
icen
ce.
View Article Online
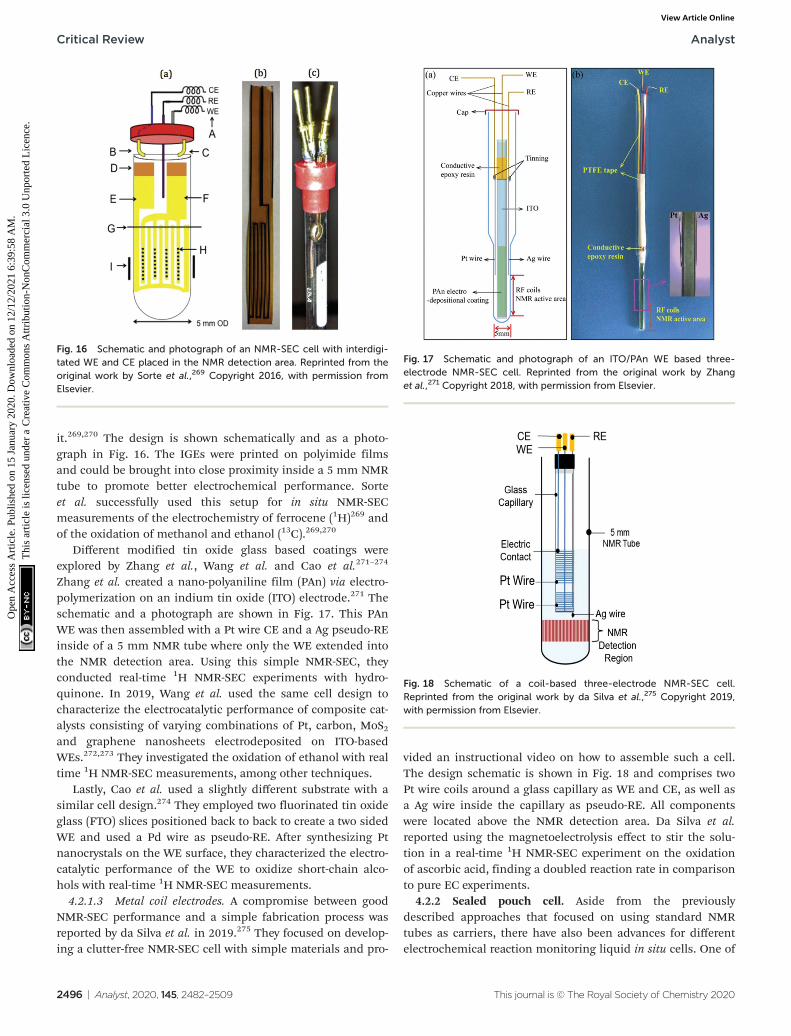
it.269,270 The design is shown schematically and as a photo-graph in Fig. 16. The IGEs were printed on polyimide filmsand could be brought into close proximity inside a 5 mm NMRtube to promote better electrochemical performance. Sorteet al. successfully used this setup for in situ NMR-SECmeasurements of the electrochemistry of ferrocene (1H)269 andof the oxidation of methanol and ethanol (13C).269,270
Different modified tin oxide glass based coatings wereexplored by Zhang et al., Wang et al. and Cao et al.271–274
Zhang et al. created a nano-polyaniline film (PAn) via electro-polymerization on an indium tin oxide (ITO) electrode.271 Theschematic and a photograph are shown in Fig. 17. This PAnWE was then assembled with a Pt wire CE and a Ag pseudo-REinside of a 5 mm NMR tube where only the WE extended intothe NMR detection area. Using this simple NMR-SEC, theyconducted real-time 1H NMR-SEC experiments with hydro-quinone. In 2019, Wang et al. used the same cell design tocharacterize the electrocatalytic performance of composite cat-alysts consisting of varying combinations of Pt, carbon, MoS2and graphene nanosheets electrodeposited on ITO-basedWEs.272,273 They investigated the oxidation of ethanol with realtime 1H NMR-SEC measurements, among other techniques.
Lastly, Cao et al. used a slightly different substrate with asimilar cell design.274 They employed two fluorinated tin oxideglass (FTO) slices positioned back to back to create a two sidedWE and used a Pd wire as pseudo-RE. After synthesizing Ptnanocrystals on the WE surface, they characterized the electro-catalytic performance of the WE to oxidize short-chain alco-hols with real-time 1H NMR-SEC measurements.
4.2.1.3 Metal coil electrodes. A compromise between goodNMR-SEC performance and a simple fabrication process wasreported by da Silva et al. in 2019.275 They focused on develop-ing a clutter-free NMR-SEC cell with simple materials and pro-
vided an instructional video on how to assemble such a cell.The design schematic is shown in Fig. 18 and comprises twoPt wire coils around a glass capillary as WE and CE, as well asa Ag wire inside the capillary as pseudo-RE. All componentswere located above the NMR detection area. Da Silva et al.reported using the magnetoelectrolysis effect to stir the solu-tion in a real-time 1H NMR-SEC experiment on the oxidationof ascorbic acid, finding a doubled reaction rate in comparisonto pure EC experiments.
4.2.2 Sealed pouch cell. Aside from the previouslydescribed approaches that focused on using standard NMRtubes as carriers, there have also been advances for differentelectrochemical reaction monitoring liquid in situ cells. One of
Fig. 16 Schematic and photograph of an NMR-SEC cell with interdigi-tated WE and CE placed in the NMR detection area. Reprinted from theoriginal work by Sorte et al.,269 Copyright 2016, with permission fromElsevier.
Fig. 17 Schematic and photograph of an ITO/PAn WE based three-electrode NMR-SEC cell. Reprinted from the original work by Zhanget al.,271 Copyright 2018, with permission from Elsevier.
Fig. 18 Schematic of a coil-based three-electrode NMR-SEC cell.Reprinted from the original work by da Silva et al.,275 Copyright 2019,with permission from Elsevier.
Critical Review Analyst
2496 | Analyst, 2020, 145, 2482–2509 This journal is © The Royal Society of Chemistry 2020
Ope
n A
cces
s A
rtic
le. P
ublis
hed
on 1
5 Ja
nuar
y 20
20. D
ownl
oade
d on
12/
12/2
021
6:39
:58
AM
. T
his
artic
le is
lice
nsed
und
er a
Cre
ativ
e C
omm
ons
Attr
ibut
ion-
Non
Com
mer
cial
3.0
Unp
orte
d L
icen
ce.
View Article Online

those was reported in 2019 by Richter et al.276 who assembledelectrocatalyst-coated carbon paper electrodes separated by aglass fibre film into a sealed plastic pouch cell, based on apouch design for capacitor characterization by Wang et al.277
The design schematic as well as photographs inside thesolid state NMR spectrometer are shown in Fig. 19. With thiscell and a solid state instrument, Richter et al. quantitativelymonitored the oxidation of ethanol in real-time 13C NMR-SECin situ experiments with a time-resolution in the order of10 minutes and during a total electrolysis time of 100 hours.The cell had to be punctured due to the evolution of CO2 asreaction product.
4.3 Future perspective
The integration of the EC cell into a standard NMR tube is asimple and affordable approach. Since it is always done manu-ally, however, it may be difficult to reproduce a cell exactly, evenif an instructional video is provided.275 Creating a standardizedelectrochemical cell insert for NMR tubes could make NMR-SECmore accessible and allow for more comparable researchbetween different research groups and experimental setups. Onthe other hand, creating more specialized equipment might leadto instrumentational improvements in further avoiding negativeinterference between the two systems and making NMR-SECmethods more robust for real applications. An example of theinfluence of the instrumentation has very recently been given byFerreira Gomes et al. in a review about the application of lowmagnetic field strengths for NMR-SEC.278
Especially 13C NMR-SEC currently suffers from poor time-resolution. Underlying causes are low electrochemical reactionrates and the low natural occurrence of the isotope, often
leading to both very long electrolysis times of tens of hoursand long measurement times of tens of minutes to achievespectra of good enough quality.
There are general NMR spectroscopy advancements such asextra sample preparation steps or specific pulse sequences thatcan help to improve the sensitivity and reduce the timeframeof experiments. Specific pulse techniques like e.g. SSFP arealready being investigated for applications in NMR-SEC,238
but, to our knowledge, sample preparation techniques are stillnot being investigated. One example is dynamic nuclear polar-ization (DNP),6,238,254 where a solidified sample can be polar-ized much more strongly in the solid state and then getquickly dissolved and analysed while retaining this hyperpolar-ization, leading to improved signal intensities.
A different approach to increase the reaction yield andreduce the time necessary for 13C measurements could rely onthe previously introduced NMR-SEC exclusive magnetoelectro-lysis effect.263–266 Many cell designs rely on diffusion to movethe reaction products into the NMR detection area. By investi-gating the exact influence of cell and electrode geometries onthe stirring induced by the magnetoelectrolysis effect and opti-mizing them, the sensitivity limitations imposed by electro-chemical reaction rates and product diffusion could be greatlyalleviated. One approach to do this in the three-electrode celltype could for example focus on micromachining electrodes.By designing them in such a way that they induce defined non-uniformities in the magnetic field, the magnetoelectrolysiseffect could be further investigated on a more fundamentallevel. Additionally, the possibilities of high-surface area elec-trodes to improve the conversion speed should be furtherinvestigated, since the larger currents can lead to moreproduct but also to complications in the NMR-SEC setups.
To conclude, there are many promising areas for NMR-SECdevelopments to take place in the near future as it still is verymuch a developing technique with great potential.
5 Mass spectroelectrochemistry(EC-MS)5.1 Introduction EC-MS
Mass spectrometry (MS) is a powerful and versatile techniqueto identify and quantify various kinds of analytes almost uni-versally. The general MS process consists of the ionization ofthe analyte followed by the mass selection of the ions for theirmass to charge ratio m/z and finally, the detection of the ionsin a universal ion detector. There are many ionization andmass selector techniques with their respective advantages anddrawbacks, varying for example in the ionization success fordifferent kinds of molecules and the mass resolution that isachievable. Additionally, tandem mass spectrometry is theintentional fragmentation of the ions, for example via collisionwith an inert gas. The fragments can then be mass selectedand detected or fragmented again for more complex experi-ments. More detailed information about mass spectrometrycan be found in the literature.279,280
Fig. 19 (A) schematic of a plastic pouch NMR-SEC cell and (B and C)photographs thereof. Reprinted from the original work by Richteret al.,276 Copyright 2019, with permission from Creative Commons.Licensed under CC BY 3.0.
Analyst Critical Review
This journal is © The Royal Society of Chemistry 2020 Analyst, 2020, 145, 2482–2509 | 2497
Ope
n A
cces
s A
rtic
le. P
ublis
hed
on 1
5 Ja
nuar
y 20
20. D
ownl
oade
d on
12/
12/2
021
6:39
:58
AM
. T
his
artic
le is
lice
nsed
und
er a
Cre
ativ
e C
omm
ons
Attr
ibut
ion-
Non
Com
mer
cial
3.0
Unp
orte
d L
icen
ce.
View Article Online

While MS is not generally regarded as a spectroscopicmethod,281 its universal capabilities to generate qualitative aswell as quantitative data make it an excellent method to pairwith EC. However, three precautions need to be kept in mind:firstly, the analyte needs to be successfully ionized. Secondly,MS requires a high-vacuum environment for the mass selector.And thirdly, MS generally uses a destructive detection method,making the analyte unavailable for follow-up procedures.Because of these precautions, in situ MS measurements arenot possible in the same way as with, for example, the pre-viously described IR spectroscopy. This also means that almostno surface-related data can be obtained. However, MS is anexcellent method to quantify and identify reaction productsand intermediates in online approaches. The qualitative infor-mation about reaction products and their structure gainedcomplements the electrochemical information that can beobtained, especially for more complex reactions.
In the following sections, we will present often used as wellas novel and innovative experimental setups used for EC-MSmeasurements as well as discuss future prospects. We focuson coupling mechanisms for liquid samples and not on theelectrochemical and mass spectrometric instrumentation.
5.2 State of the art of EC-MS
Liquid EC-MS can only be realized as an online method. Sincethe lifetime of intermediates and unstable products is limitedby definition, the method needs to have a low response timebetween these two steps to be able to detect them. In the fol-lowing sections, we present a selection of recently reportedonline EC-MS methods to achieve low response times and suc-cessful intermediate detection. Methods with coupled chrom-atography steps will be excluded since they strictly raise theresponse time between product generation and detection. Inresearch questions, where no intermediates need to bedetected, online EC inductively coupled plasma (ICP) MS canbe used, since it destroys species information. In 2019, Kasianet al.282 reviewed EC-ICP-MS as a technique for catalystresearch in an online configuration with reported responsetimes 30–40 s.283,284
5.2.1 Coupled electrospray ionization (ESI) techniques. Avery useful ionization technique for liquid samples is electro-spray ionization (ESI). For this technique, the analyte solutionis introduced into a capillary-like device which is electricallyconnected to the MS inlet interface. By applying a high poten-tial of several kV, a Taylor cone can be created that emitscharged droplets towards the MS inlet. These charged dropletsdisintegrate into smaller and smaller droplets to finally formionized molecules.285 The high potential necessary for thisprocess can be dangerous to the equipment and the user.Therefore, special care has to be taken to decouple the EC reac-tion from the ionization. In combined systems, the ESI poten-tial can be applied to the EC system as a floating potential.286
5.2.1.1 Commercial thin-layer EC-MS flow cells. As has beenmentioned previously,11,12 thin-layer cells and microfluidicdevices can hold several advantages over bigger cell geometriesfor better electrochemical performance. Over the last decade,
there have been many applications of commercial thin-layerflow cells for EC-MS, often but not always coupled to liquidchromatography (LC). In a review from 2014, Faber et al.covered the principal designs and flow charts of thesesetups,288 focusing on applications in metabolism studies. Ina more recent publication, Zabel and Weber reported the useof a thin-layer flow cell setup with a response time of ∼25 s forthe study of sulphuric amino acid and glutathione oxi-dation.289 As using thin-layer flow cells is a very establishedand commercialized approach, the authors do not go intofurther detail here.
5.2.1.2 Microfluidic EC-MS flow cells. As described pre-viously, microfluidic EC methods can hold many advantagesover methods with larger reactors. Since EC-MS methods areonline techniques, a microfluidic EC cell generally does notneed to be specifically designed for coupling to MS.
In 2012, Odijk et al.290 reported an EC chip coupled to amicrochip-ESI, which was previously developed by Qiaoet al.291 They investigated the oxidation of mitoxantrone aswell as the influence of frit channels on the EC performance ofthe chip. As a special precaution to separate the electrical cir-cuits, a grounded transfer tubing with high resistance wasused to transfer the EC products to the microchip-ESI. Usingthe same chip design as Odijk et al., van den Brink et al. inte-grated a commercially available ESI emitter to couple the chipto an MS system287 (Fig. 20). Van den Brink had less issueswith circuit separation, as the ESI needle itself was groundedwhile the orifice of the MS was set to high voltage. Using thislatter setup, response times of ∼4.5 s were achieved.
5.2.1.3 EC-MS droplet in front of MS-interface. A couplingmethod with a very simple configuration was employed by Yuet al. in 2018,292 as shown in Fig. 21. They used a droplet-approach in which a microscopy glass cover slide served as acarrier. This setup was developed from a previously reportedpure MS approach with a glass carrier from Jiang et al.293
Fig. 20 Photographs of a microfluidic EC cell integrated with a com-mercially available ESI needle in an EC-MS setup. Reprinted with per-mission from van den Brink et al.287 Copyright 2015 American ChemicalSociety.
Critical Review Analyst
2498 | Analyst, 2020, 145, 2482–2509 This journal is © The Royal Society of Chemistry 2020
Ope
n A
cces
s A
rtic
le. P
ublis
hed
on 1
5 Ja
nuar
y 20
20. D
ownl
oade
d on
12/
12/2
021
6:39
:58
AM
. T
his
artic
le is
lice
nsed
und
er a
Cre
ativ
e C
omm
ons
Attr
ibut
ion-
Non
Com
mer
cial
3.0
Unp
orte
d L
icen
ce.
View Article Online

The glass carrier was operated with a sample volume of80 µL forming a droplet in one corner. In that corner, therewas also a three-electrode setup consisting of a Pt WE and CEas well as a Ag/AgCl RE. In addition to the electrochemicalreaction, the WE and CE were also used to form the electro-spray together with the MS inlet. The authors do not specify aresponse time between the reaction and subsequent detection,but demonstrate real-time behaviour of the setup system toobtain mechanistic EC reaction data.
As a droplet-based approach, this setup is very small andsimple to use. A disadvantage is the non-continuity of theexperiment. The droplet is gradually desaturated of the analyteand saturated with reaction products over the course of theexperiment which limits the versatility of this method.Additionally, the electrospray removes more and more liquid,slightly changing the entire system over time. The exact posi-tioning and amount of the liquid in the droplet is also difficultto exactly reproduce. As a consequence, this setup is wellsuited for qualitative mechanistic studies but not for quantitat-ive investigations.
5.2.1.4 Thin liquid layer double-barrel capillary. Qiu et al.294
and later Guo et al.295 reported a homemade capillary devicewhere the EC reaction takes place inside a thin liquid layerformed just outside the tip of a hydrophilic double-barrelcapillary. One of the two barrels is capped with previouslyin situ generated carbon while the other barrel contains theanalyte solution as well as a AgCl/Ag wire. Primary ions for theformation of an electrospray are generated with a piezoelectricpistol at the beginning of the capillary.
By positioning the EC reaction at the tip outside of thecapillary at a distance of 2 mm to the MS inlet, the responsetime is reduced greatly. While the authors don’t give an exactvalue, they succeeded in detecting a diamine intermediateformed by the oxidation of uric acid with a reported half-life ofabout 23 ms (ref. 296) which makes this method an excellentonline EC-MS technique with a very low response time. Later,Guo et al. applied this technique to detect intermediates inorganometallic Ru- and Ir-based chemiluminescenceexperiments.
Qiu et al.294 have created a powerful online EC-MS methodwith a small footprint, as shown in Fig. 22. Their setup needscareful preparation to form the carbon electrode, but shows an
excellent response time. The ionization process is unusual,however, and probably the most variable part betweendifferent experiments. In addition to this drawback, there is noRE, further complicating the use of this setup. With carefulcalibration, however, this method can serve as a great tool toinvestigate short-lived reaction products and intermediates.
5.2.2 Differential electrochemical mass spectrometry(DEMS). A different approach to ionize quickly transport reac-tion products is the differential electrochemical mass spec-trometry (DEMS) method, where volatile compounds inside aliquid evaporate through a membrane or porous frit into theMS. This technique is inherently restricted by the vaporpressure of the analyte and was first mentioned as a dedicatedtechnique by Wolter and Heitbaum in 1984.298,299 The maincomponent of DEMS is a non-wetting porous membrane thatallows volatile compounds to evaporate into a two-step vacuumas a function of their formation rate, hence the name“differential”.300
5.2.2.1 Thin-layer DEMS cells. Modern DEMS systems, asdescribed by Abd-El-Latif et al.,300 are generally built in a thin-layer configuration, where an electrode is placed on one sideand a porous membrane on the other side. The electro-chemical reaction products have to cross from the electrode tothe other side of the cell to pass the membrane, causingresponse times of up to 2 s.
One example of a thin-layer cell still in use at present withmodifications was published by Jusys et al. in 1999, and isdepicted in Fig. 23.297 It was originally designed for a combi-nation of DEMS and an electrochemical quartz crystal micro-balance (EQCM) in two separate chambers. The membraneused in this instance is a porous Teflon membrane, placed ontop of a stainless steel frit that leads to an MS inlet. In 2007,Heinen et al. slightly changed the cell to include a Pt thin-filmlayer on a Si prism instead of an EQCM302 to allow a combinedEC-IR-MS method. These two designs have been used in mul-tiple recent publications with applications ranging from COoxidation and desorption on nanocrystals,303 ethylene glycoloxidation,304,305 methanol oxidation306 to the oxygen evolutionreaction.307 The reported response time of the setups lies inthe range of 1–2 s.297,304
A simpler one chamber thin-layer cell was reported byTrimarco et al. in 2018.301 Here, they used a previouslyreported microfabricated Si membrane with supporting SiO2
Fig. 21 D Schematic of the droplet-based EC-MS approach. Reprintedwith permission from Yu et al.292 Copyright 2018 American ChemicalSociety.
Fig. 22 Schematic of the thin-layer double-barrel capillary setup.Reprinted from the original work by Qiu et al.,294 Copyright 2016, withpermission from Creative Commons. Licensed under CC BY 3.0.
Analyst Critical Review
This journal is © The Royal Society of Chemistry 2020 Analyst, 2020, 145, 2482–2509 | 2499
Ope
n A
cces
s A
rtic
le. P
ublis
hed
on 1
5 Ja
nuar
y 20
20. D
ownl
oade
d on
12/
12/2
021
6:39
:58
AM
. T
his
artic
le is
lice
nsed
und
er a
Cre
ativ
e C
omm
ons
Attr
ibut
ion-
Non
Com
mer
cial
3.0
Unp
orte
d L
icen
ce.
View Article Online

pillars and an integrated sampling chamber to separate theliquid phase from the gaseous phase.308 The thin-layer cellhad a simple one chamber geometry with a WE directly abovethe membrane chip, allowing for low response times. A CE andRE were positioned in slanted side channels. The membranechip itself was mounted onto a vacuum system to enableDEMS, shown schematically in Fig. 24. Using this setup, Royet al. investigated the oxidation evolution reaction catalysed bynanoparticle catalysts.309 Additionally, Winiwarter et al. investi-gated the mechanisms of partial propene oxidation.310
5.2.2.2 Microfluidic DEMS. In a similar fashion to the ESImethod, a microfluidic approach for DEMS has recently beenreported. In 2015, Trimarco et al. reported a “sniffer chip”assembly that uses the previously mentioned microfabricatedmembrane.308 The microfabrication process is illustrated inFig. 25. The Si and SiO2 based membrane was incorporated intoa microfluidic chip with integrated electrodes a small totalinternal volume of ca. 31 nL and a low response time about0.5 s. Trimarco et al. made proof of principle measurements ofhydrogen and oxygen evolution reactions in an aqueous solvent.An envisioned application is to use the chip as a dip-in probethat immediately saturates with the gasses in the solution toprovide a quick qualitative readout of the sample.
5.2.3 Microfluidic EC-SIMS (secondary ion mass spec-trometry). A different ionization approach based on a micro-fluidic chip was recently reported by Liu et al.,311 Wanget al.312 and Yu et al.313 They were using microfluidic EC cellswith a silicon nitride (SiN) membrane on the backside of athin Au WE, as shown in Fig. 26. In SIMS, a primary ion beamis used to ionize the analyte molecules as secondary ions. Inthis device, the primary ion beam was used to drill a holethrough the SiN membrane and the WE, exposing the liquid tothe vacuum of the mass spectrometer in a ∼2 µm wide spot.For sequential mechanistic measurements, new holes could bedrilled to capture the current state close to the electrode in theinstant the hole is created. All of the publications cited abovefocused on imaging the electrode/electrolyte interface, byusing KI311,313 or ascorbic acid312 as analytes with a response
Fig. 23 DEMS cell; A: exploded sideview; B: top view. Image repub-lished and modified with permission of Journal of The ElectrochemicalSociety, from the original work by Jusys et al.297 Copyright 1999, per-mission conveyed through Copyright Clearance Center, Inc.
Fig. 24 Membrane DEMS setup for thin-layer cell; (a) membrane chipphotograph; (b) scanning electron microscope image of the membranechip; (c) schematic of the membrane chip; (d) schematic of the setup.Image reprinted and modified with permission from Trimarco et al.301
Copyright 2018 American Chemical Society.
Fig. 25 Membrane fabrication scheme. Reprinted from the original workby Trimarco et al.,308 Copyright 2015, with the permission of AIP Publishing.
Fig. 26 Schematic of an EC-SIMS cell. Reprinted from the original work byLiu et al.,311 Copyright 2014 – Published by The Royal Society of Chemistry.
Critical Review Analyst
2500 | Analyst, 2020, 145, 2482–2509 This journal is © The Royal Society of Chemistry 2020
Ope
n A
cces
s A
rtic
le. P
ublis
hed
on 1
5 Ja
nuar
y 20
20. D
ownl
oade
d on
12/
12/2
021
6:39
:58
AM
. T
his
artic
le is
lice
nsed
und
er a
Cre
ativ
e C
omm
ons
Attr
ibut
ion-
Non
Com
mer
cial
3.0
Unp
orte
d L
icen
ce.
View Article Online
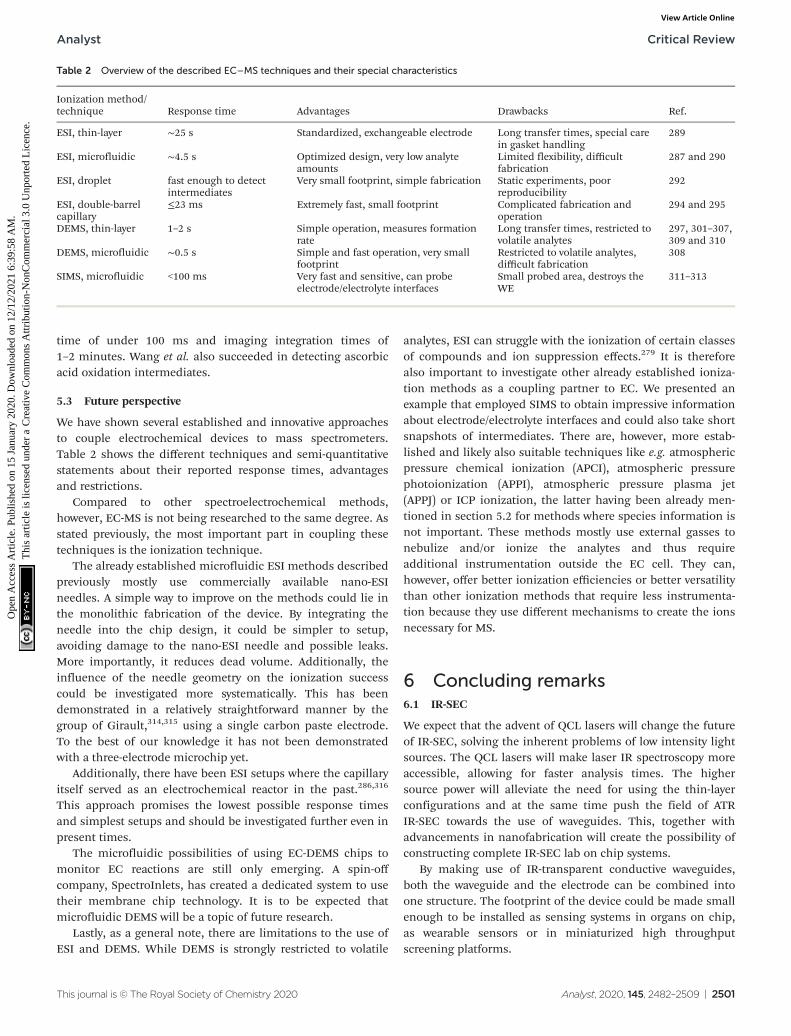
time of under 100 ms and imaging integration times of1–2 minutes. Wang et al. also succeeded in detecting ascorbicacid oxidation intermediates.
5.3 Future perspective
We have shown several established and innovative approachesto couple electrochemical devices to mass spectrometers.Table 2 shows the different techniques and semi-quantitativestatements about their reported response times, advantagesand restrictions.
Compared to other spectroelectrochemical methods,however, EC-MS is not being researched to the same degree. Asstated previously, the most important part in coupling thesetechniques is the ionization technique.
The already established microfluidic ESI methods describedpreviously mostly use commercially available nano-ESIneedles. A simple way to improve on the methods could lie inthe monolithic fabrication of the device. By integrating theneedle into the chip design, it could be simpler to setup,avoiding damage to the nano-ESI needle and possible leaks.More importantly, it reduces dead volume. Additionally, theinfluence of the needle geometry on the ionization successcould be investigated more systematically. This has beendemonstrated in a relatively straightforward manner by thegroup of Girault,314,315 using a single carbon paste electrode.To the best of our knowledge it has not been demonstratedwith a three-electrode microchip yet.
Additionally, there have been ESI setups where the capillaryitself served as an electrochemical reactor in the past.286,316
This approach promises the lowest possible response timesand simplest setups and should be investigated further even inpresent times.
The microfluidic possibilities of using EC-DEMS chips tomonitor EC reactions are still only emerging. A spin-offcompany, SpectroInlets, has created a dedicated system to usetheir membrane chip technology. It is to be expected thatmicrofluidic DEMS will be a topic of future research.
Lastly, as a general note, there are limitations to the use ofESI and DEMS. While DEMS is strongly restricted to volatile
analytes, ESI can struggle with the ionization of certain classesof compounds and ion suppression effects.279 It is thereforealso important to investigate other already established ioniza-tion methods as a coupling partner to EC. We presented anexample that employed SIMS to obtain impressive informationabout electrode/electrolyte interfaces and could also take shortsnapshots of intermediates. There are, however, more estab-lished and likely also suitable techniques like e.g. atmosphericpressure chemical ionization (APCI), atmospheric pressurephotoionization (APPI), atmospheric pressure plasma jet(APPJ) or ICP ionization, the latter having been already men-tioned in section 5.2 for methods where species information isnot important. These methods mostly use external gasses tonebulize and/or ionize the analytes and thus requireadditional instrumentation outside the EC cell. They can,however, offer better ionization efficiencies or better versatilitythan other ionization methods that require less instrumenta-tion because they use different mechanisms to create the ionsnecessary for MS.
6 Concluding remarks6.1 IR-SEC
We expect that the advent of QCL lasers will change the futureof IR-SEC, solving the inherent problems of low intensity lightsources. The QCL lasers will make laser IR spectroscopy moreaccessible, allowing for faster analysis times. The highersource power will alleviate the need for using the thin-layerconfigurations and at the same time push the field of ATRIR-SEC towards the use of waveguides. This, together withadvancements in nanofabrication will create the possibility ofconstructing complete IR-SEC lab on chip systems.
By making use of IR-transparent conductive waveguides,both the waveguide and the electrode can be combined intoone structure. The footprint of the device could be made smallenough to be installed as sensing systems in organs on chip,as wearable sensors or in miniaturized high throughputscreening platforms.
Table 2 Overview of the described EC–MS techniques and their special characteristics
Ionization method/technique Response time Advantages Drawbacks Ref.
ESI, thin-layer ∼25 s Standardized, exchangeable electrode Long transfer times, special carein gasket handling
289
ESI, microfluidic ∼4.5 s Optimized design, very low analyteamounts
Limited flexibility, difficultfabrication
287 and 290
ESI, droplet fast enough to detectintermediates
Very small footprint, simple fabrication Static experiments, poorreproducibility
292
ESI, double-barrelcapillary
≤23 ms Extremely fast, small footprint Complicated fabrication andoperation
294 and 295
DEMS, thin-layer 1–2 s Simple operation, measures formationrate
Long transfer times, restricted tovolatile analytes
297, 301–307,309 and 310
DEMS, microfluidic ∼0.5 s Simple and fast operation, very smallfootprint
Restricted to volatile analytes,difficult fabrication
308
SIMS, microfluidic <100 ms Very fast and sensitive, can probeelectrode/electrolyte interfaces
Small probed area, destroys theWE
311–313
Analyst Critical Review
This journal is © The Royal Society of Chemistry 2020 Analyst, 2020, 145, 2482–2509 | 2501
Ope
n A
cces
s A
rtic
le. P
ublis
hed
on 1
5 Ja
nuar
y 20
20. D
ownl
oade
d on
12/
12/2
021
6:39
:58
AM
. T
his
artic
le is
lice
nsed
und
er a
Cre
ativ
e C
omm
ons
Attr
ibut
ion-
Non
Com
mer
cial
3.0
Unp
orte
d L
icen
ce.
View Article Online

6.2 Raman-SEC
Unlike IR-SEC, Raman-SEC is already a mature technique.However, especially the field of SERS-SEC can be further devel-oped by combining it with new advancements in the field ofnanofabrication. These advancements will possibly lead todevelopments where SERS enhancement structures can givemore reliable and uniform enhancements and at the sametime increase the area of the enhancement structures and sim-ultaneously decrease the cost.
At the moment Raman-SEC is mostly used for a largenumber of applications in material sciences, but as of yet doesnot have a large number of real world applications, somenotable exceptions are for instance the work by the group ofBrosseau.136–139 When the advancements of SERS-SEC as high-lighted above take place, the technique will likely becomemore attractive for real world applications.
6.3 NMR-SEC
NMR spectroscopy is a very versatile technique that still hasmuch potential to grow and mature. As a consequence,NMR-SEC is also still in its infancy and will benefit fromgeneral NMR improvements. There are, however, certainNMR-SEC specific recommendations that can be made.
Because of the unique restrictions caused by the inter-ference between NMR and EC systems, dedicated NMR-SECinstruments should be investigated. Also, standardizing ormaking the often used three-electrode cell type commerciallyavailable would be beneficial to make research from differentgroups both more comparable and reliable.
NMR-SEC can already be used for real-time 1H measure-ments, but especially real-time 13C measuring methods stillneed to be improved. Research approaches could be based onsample preparation techniques or the exploitation ofNMR-SEC specific effects like magnetoelectrolysis to reducethe time needed for an NMR-SEC experiment.
6.4 EC-MS
Although research towards EC-MS is not being performed tothe same degree as the SEC techniques covered in this review,clear paths for future advancements can be discussed. Anyimprovements on EC-MS regarding the response timebetween reactions at the electrodes and the ionization of thesample would make the technique more attractive. Directlycombining the ionization mechanism, e.g. ESI, with a micro-fluidic system via new microfabrication techniques couldresult in monolithic devices with very short response times.Additional ionization techniques that are used for MS butcould also be of interest for EC-MS are SIMS, APCI, APPI,APPJ and ICP, as partly already mentioned previously. Theseother ionization techniques could help to increase the ioniza-tion efficiency of certain analytes while also mostly notsuffering from the same coupling problems of EC with MS asis the case with ESI. Some of them have their own applicationrestrictions, however, making a careful selection all the moreimportant.
6.5 Hyphenation
Hyphenation of the (already hyphenated) SEC techniques, alsoknown as multi-spectroelectrochemistry, is quite common inliterature. In 2011 Dunsh wrote a review paper on this verytopic.3
As the field of SEC advances, so will the number ofhyphenation of different techniques. Already in 2011 Dunschpredicted a greater variety in triple multi-spectroelectrochemis-try. In order to get more information from a system, we expectthat more and more techniques will be combined into multi-spectroelectrochemistry in the future.
Author contributions
Authors J. J. A. Lozeman and P. Führer contributed equally tothis review paper. J. J. A. Lozeman was responsible for IR-SECand Raman-SEC, P. Führer had the responsibility for NMR-SECand EC-MS. M. Odijk and W. Olthuis supervised and managedthe review and edited the final version of the paper.
Conflicts of interest
There are no conflicts to declare.
Acknowledgements
This work was supported by the Netherlands Center forMultiscale Catalytic Energy Conversion (MCEC), theNetherlands Organisation for Scientific Research (NWO)Gravitation programme funded by the Ministry of Education,Culture and Science of the government of the Netherlands andthe NWO Open Technology Research Programme with projectnumber 15230.
The authors would like to thank Esther Tanumihardja andElsbeth G.B.M. Bossink (BIOS lab-on-a-Chip Group, Universityof Twente) for their discussions about electrochemistry.
References
1 W. Kaim and J. Fiedler, Chem. Soc. Rev., 2009, 38, 3373–3382.
2 T. Kuwana, R. K. Darlington and D. W. Leedy, Anal. Chem.,1964, 36, 2023–2025.
3 L. Dunsch, J. Solid State Electrochem., 2011, 15, 1631–1646.4 H. Oberacher, F. Pitterl, R. Erb and S. Plattner, Mass
Spectrom. Rev., 2015, 34, 64–92.5 A. J. Wain and M. A. O’connell, Adv. Phys.: X, 2017, 2, 188–
209.6 Y. Y. J. Tong, Curr. Opin. Electrochem., 2017, 4, 60–68.7 L. León and J. D. Mozo, TrAC, Trends Anal. Chem., 2018,
102, 147–169.8 Y. Zhai, Z. Zhu, S. Zhou, C. Zhu and S. Dong, Nanoscale,
2018, 10, 3089–3111.
Critical Review Analyst
2502 | Analyst, 2020, 145, 2482–2509 This journal is © The Royal Society of Chemistry 2020
Ope
n A
cces
s A
rtic
le. P
ublis
hed
on 1
5 Ja
nuar
y 20
20. D
ownl
oade
d on
12/
12/2
021
6:39
:58
AM
. T
his
artic
le is
lice
nsed
und
er a
Cre
ativ
e C
omm
ons
Attr
ibut
ion-
Non
Com
mer
cial
3.0
Unp
orte
d L
icen
ce.
View Article Online

9 J. Garoz-Ruiz, J. V. Perales-Rondon, A. Heras andA. Colina, Electroanalysis, 2019, 1254–1278.
10 D. L. Pavia, G. M. Lampman, G. S. Kriz and J. A. Vyvyan,Introduction to Spectroscopy, Cengage Learning, 2008.
11 D. Moss, E. Nabedryk, J. Breton and W. Mantele,Eur. J. Biochem., 1990, 187, 565–572.
12 F. T. G. van den Brink, W. Olthuis, A. van den Berg andM. Odijk, TrAC, Trends Anal. Chem., 2015, 70, 40–49.
13 P. A. Christensen and S. W. M. Jones, J. Phys. Chem. C,2014, 118, 29760–29769.
14 K. H. K. L. Alwis, M. R. Mucalo and B. Ingham,J. Electrochem. Soc., 2013, 160, 803–812.
15 A. L. De Lacey, E. C. Hatchikian, A. Volbeda, M. Frey,J. C. Fontecilla-Camps and V. M. Fernandez, J. Am. Chem.Soc., 1997, 119, 7181–7189.
16 R. Guidelli, Bioelectrochemistry of Biomembranes andBiomimetic Membranes, 2016.
17 A. Hartstein, J. R. Kirtley and J. C. Tsang, Phys. Rev. Lett.,1980, 45, 201–204.
18 M. Osawa, in Near-Field Optics and Surface PlasmonPolaritons, ed. S. Kawata, Springer Berlin Heidelberg,Berlin, Heidelberg, 2001, pp. 163–187.
19 R. Aroca, Surface-Enhanced Vibrational Spectroscopy, JohnWiley & Sons, Ltd, Chichester, UK, 2006.
20 Y. Hu, Á. I. López-Lorente and B. Mizaikoff, ACS Photonics,2019, 6, 2182–2197.
21 K. I. Ataka, T. Yotsuyanagi and M. Osawa, J. Phys. Chem.,1996, 100, 10664–10672.
22 M. Osawa, K. Ataka, K. Yoshii and T. Yotsuyanagi,J. Electron Spectrosc. Relat. Phenom., 1993, 64–65, 371–379.
23 H. Im, K. C. Bantz, N. C. Lindquist, C. L. Haynes andS. H. Oh, Nano Lett., 2010, 10, 2231–2236.
24 E. C. Le Ru and P. G. Etchegoin, Principles of Surface-Enhanced Raman Spectroscopy, Elsevier, 2009.
25 K. Ataka and J. Heberle, Anal. Bioanal. Chem., 2007, 388,47–54.
26 R. Aroca, Surface-Enhanced Vibrational Spectroscopy, Wiley,2006.
27 F. Neubrech, C. Huck, K. Weber, A. Pucci and H. Giessen,Chem. Rev., 2017, 117, 5110–5145.
28 C. Di Bari, N. Mano, S. Shleev, M. Pita and A. L. De Lacey,J. Biol. Inorg. Chem., 2017, 22, 1179–1186.
29 Y. Kato and T. Noguchi, Biochemistry, 2014, 53, 4914–4923.30 F. Tutunea and M. D. Ryan, J. Electroanal. Chem., 2012,
670, 16–22.31 F. Tutunea, A. Atifi and M. D. Ryan, J. Electroanal. Chem.,
2015, 744, 17–24.32 R. W. Murray, W. R. Heineman and G. W. O’Dom, Anal.
Chem., 1967, 39, 1666–1668.33 Z. Wei and M. D. Ryan, Inorg. Chem., 2010, 49, 6948–6954.34 Y. Dai, D. A. Proshlyakov, J. K. Zak and G. M. Swain, Anal.
Chem., 2007, 79, 7526–7533.35 J. K. Zak, J. E. Butler and G. M. Swain, Anal. Chem., 2001,
73, 908–914.36 J. Stotter, J. Zak, Z. Behler, Y. Show and G. M. Swain, Anal.
Chem., 2002, 74, 5924–5930.
37 K. H. K. L. Alwis, M. R. Mucalo and J. R. Lane, RSC Adv.,2015, 5, 31815–31825.
38 M. J. Shaw, R. L. Henson, S. E. Houk, J. W. Westhoff,M. W. Jones and G. B. Richter-Addo, J. Electroanal. Chem.,2002, 534, 47–53.
39 N. Xu, J. Lilly, D. R. Powell and G. B. Richter-Addo,Organometallics, 2012, 31, 827–834.
40 M. A. El-Attar, N. Xu, D. Awasabisah, D. R. Powell andG. B. Richter-Addo, Polyhedron, 2012, 40, 105–109.
41 D. Awasabisah, N. Xu, K. P. S. Gautam, D. R. Powell,M. J. Shaw and G. B. Richter-Addo, Eur. J. Inorg. Chem.,2016, 2016, 509–518.
42 S. Pons, J. Electroanal. Chem., 1983, 150, 495–504.43 D. Aurbach and O. Chusid, J. Electrochem. Soc., 1993, 140,
L155–L157.44 M. R. Mucalo and Q. Li, J. Colloid Interface Sci., 2004, 269,
370–380.45 X. Fang, L. Wang, P. K. Shen, G. Cui and C. Bianchini,
J. Power Sources, 2010, 195, 1375–1378.46 L. Liu, L. Zeng, L. Wu and X. Jiang, Anal. Chem., 2017, 89,
2724–2730.47 L. Liu, L. Zeng, L. Wu and X. Jiang, J. Phys. Chem. C, 2015,
119, 3990–3999.48 Y. Y. Yang, J. Ren, H. X. Zhang, Z. Y. Zhou, S. G. Sun and
W. Bin Cai, Langmuir, 2013, 29, 1709–1716.49 L. Wang, H. Meng, P. K. Shen, C. Bianchini, F. Vizza and
Z. Wei, Phys. Chem. Chem. Phys., 2011, 13, 2667–2673.50 Q. Zhang, W. L. Song, A. M. Showkot Hossain, Z. Di Liu,
G. J. Hu, Y. P. Tian, J. Y. Wu, B. K. Jin, H. P. Zhou,J. X. Yang and S. Y. Zhang, Dalton Trans., 2011, 40, 3510–3516.
51 W. G. Golden, D. S. Dunn and J. Overend, J. Catal., 1981,71, 395–404.
52 P. W. Faguy and W. N. Richmond, J. Electroanal. Chem.,1996, 410, 109–113.
53 P. W. Faguy, W. N. Richmond, R. S. Jackson, S. C. Weibel,G. Ball and J. H. Payer, Appl. Spectrosc., 1998, 52, 557–564.
54 M. J. Green, B. J. Barner and R. M. Corn, Rev. Sci. Instrum.,1991, 62, 1426–1430.
55 B. J. Barner, M. J. Green, E. I. Sáez and R. M. Corn, Anal.Chem., 1991, 63, 55–60.
56 V. Zamlynny, I. Zawisza and J. Lipkowski, Langmuir, 2003,19, 132–145.
57 I. Zawisza, X. Bin and J. Lipkowski, Langmuir, 2007, 23,5180–5194.
58 N. Garcia-Araez, C. L. Brosseau, P. Rodriguez andJ. Lipkowski, Langmuir, 2006, 22, 10365–10371.
59 R. C. Alkire, D. M. Kolb, J. Lipkowski and P. N. Ross,Diffraction and Spectroscopic Methods in Electrochemistry,Wiley, 2009.
60 E. A. Monyoncho, V. Zamlynny, T. K. Woo andE. A. Baranova, Analyst, 2018, 143, 2563–2573.
61 T. Wang, J. Bai, X. Jiang and G. U. Nienhaus, ACS Nano,2012, 6, 1251–1259.
62 P. Hosseini, G. Wittstock and I. Brand, J. Electroanal.Chem., 2018, 812, 199–206.
Analyst Critical Review
This journal is © The Royal Society of Chemistry 2020 Analyst, 2020, 145, 2482–2509 | 2503
Ope
n A
cces
s A
rtic
le. P
ublis
hed
on 1
5 Ja
nuar
y 20
20. D
ownl
oade
d on
12/
12/2
021
6:39
:58
AM
. T
his
artic
le is
lice
nsed
und
er a
Cre
ativ
e C
omm
ons
Attr
ibut
ion-
Non
Com
mer
cial
3.0
Unp
orte
d L
icen
ce.
View Article Online

63 A. J. Bard, Electroanalytical Chemistry: A Series of Advances,Taylor & Francis, 1986.
64 G. Neophytides, L. Quaroni, F. N. Büchi, A. Orfanidi,S. G. Neophytides and T. J. Schmidt, Electrochem.Commun., 2013, 34, 200–203.
65 P. Su, V. Prabhakaran, G. E. Johnson and J. Laskin, Anal.Chem., 2018, 90, 10935–10942.
66 M. Villalba, L. P. M. De Leo and E. J. Calvo,ChemElectroChem, 2014, 1, 195–199.
67 R. Aroca, D. Ross and C. Domingo, Appl. Spectrosc., 2004,58, 324A–338A.
68 T. Schadle and B. Mizaikoff, Appl. Spectrosc., 2016, 70,1625–1638.
69 M. Sieger and B. Mizaikoff, Anal. Chem., 2016, 88, 5562–5573.
70 B. K. Purushothaman, M. Pelsozy, P. W. Morrison,V. F. Lvovich and H. B. Martin, J. Appl. Electrochem., 2012,42, 111–120.
71 P. Paengnakorn, P. A. Ash, S. Shaw, K. Danyal, T. Chen,D. R. Dean, L. C. Seefeldt and K. A. Vincent, Chem. Sci.,2017, 8, 1500–1505.
72 A. Hatta, Y. Suzuki, T. Wadayama and W. Suëtaka, Appl.Surf. Sci., 1991, 48–49, 222–226.
73 E. Kretschmann, Z. Phys., 1971, 241, 313–324.74 M. F. Baruch, J. E. Pander, J. L. White and A. B. Bocarsly,
ACS Catal., 2015, 5, 3148–3156.75 R. Aroca and B. Price, J. Phys. Chem. B, 1997, 101, 6537–
6540.76 A. J. Healy, P. A. Ash, O. Lenz and K. A. Vincent, Phys.
Chem. Chem. Phys., 2013, 15, 7055–7059.77 C. Dillard, A. Singh and V. Kalra, J. Phys. Chem. C, 2018,
122, 18195–18203.78 J. Heyes, M. Dunwell and B. Xu, J. Phys. Chem. C, 2016,
120, 17334–17341.79 M. Pfaffeneder-Kmen, I. F. Casas, A. Naghilou,
G. Trettenhahn and W. Kautek, Electrochim. Acta, 2017,255, 160–167.
80 A. Viinikanoja, J. Kauppila, P. Damlin, M. Suominen andC. Kvarnström, Phys. Chem. Chem. Phys., 2015, 17, 12115–12123.
81 J. Izquierdo, B. Mizaikoff and C. Kranz, Phys. Status SolidiA, 2016, 213, 2056–2062.
82 D. Neubauer, J. Scharpf, A. Pasquarelli, B. Mizaikoff andC. Kranz, Analyst, 2013, 138, 6746–6752.
83 N. Menegazzo, M. Kahn, R. Berghauser, W. Waldhauserand B. Mizaikoff, Analyst, 2011, 136, 1831–1839.
84 S. Sun, S. Hong, S. Chen, G. Lu, H. Dai and X. Xiao, Sci.China, Ser. B: Chem., 1999, 42, 261–267.
85 J. T. Li, S. R. Chen, F. S. Ke, G. Z. Wei, L. Huang andS. G. Sun, J. Electroanal. Chem., 2010, 649, 171–176.
86 J. T. Li, Q. S. Chen and S. G. Sun, Electrochim. Acta, 2007,52, 5725–5732.
87 H. Gong, S. G. Sun, Y. J. Chen and S. P. Chen, J. Phys.Chem. B, 2004, 108, 11575–11584.
88 S.-G. Sun and Z.-Y. Zhou, in In-situ Spectroscopic Studies ofAdsorption at the Electrode and Electrocatalysis, ed. S.-G.
Sun, P. A. Christensen and A. Wieckowski, ElsevierScience B.V., Amsterdam, 2007, pp. 139–178.
89 C. A. Melendres, B. Beden and G. A. Bowmaker,J. Electroanal. Chem., 1995, 383, 191–193.
90 S. M. Rosendahl, F. Borondics, T. E. May, T. M. Pedersenand I. J. Burgess, Anal. Chem., 2011, 83, 3632–3639.
91 K. Tu, M. J. Lardner, T. A. Morhart, S. M. Rosendahl,S. Creighton and I. J. Burgess, J. Phys. Chem. C, 2016, 120,23640–23647.
92 S. M. Rosendahl, F. Borondics, T. E. May and I. J. Burgess,Anal. Chem., 2013, 85, 8722–8727.
93 M. J. Lardner, K. Tu, B. C. Barlow, S. M. Rosendahl,F. Borondics and I. J. Burgess, J. Electroanal. Chem., 2017,800, 184–189.
94 P. A. Ash, H. A. Reeve, J. Quinson, R. Hidalgo, T. Zhu,I. J. McPherson, M. W. Chung, A. J. Healy, S. Nayak,T. H. Lonsdale, K. Wehbe, C. S. Kelley, M. D. Frogley,G. Cinque and K. A. Vincent, Anal. Chem., 2016, 88, 6666–6671.
95 J. A. Sigrist, E. S. Lins, T. A. Morhart, J. L. Briggs andI. J. Burgess, Appl. Spectrosc., 2019, 73, 1394–1402.
96 M. J. Weida and B. Yee, Imaging Manip. Anal. Biomol. CellsTissues IX, 2011, 7902, 79021C.
97 J. M. Ramirez, V. Vakarin, C. Gilles, J. Frigerio, A. Ballabio,P. Chaisakul, X. Le Roux, C. Alonso-Ramos, G. Maisons,L. Vivien, M. Carras, G. Isella and D. Marris-Morini, Opt.Lett., 2017, 42, 105.
98 P. Wägli, Y. C. Chang, A. Homsy, L. Hvozdara,H. P. Herzig and N. F. De Rooij, Anal. Chem., 2013, 85,7558–7565.
99 P. G.-Q. Lo, A. A. Bettiol, A. E.-J. Lim, K.-W. Ang andU. Younis, IEEE Photonics Technol. Lett., 2016, 28, 2447–2450.
100 C. B. E. Gawith, A. Z. Khokhar, C. Littlejohns,G. S. Murugan, J. S. Penades, V. Mittal, M. Nedeljkovic,J. S. Wilkinson, G. Z. Mashanovich and L. G. Carpenter,Opt. Express, 2017, 25, 27431.
101 N. Singh, A. Casas-Bedoya, D. D. Hudson, A. Read,E. Mägi and B. J. Eggleton, Opt. Lett., 2016, 41, 5776.
102 V. Mittal, J. S. Wilkinson and G. S. Murugan, High-contrastGeTe4 waveguides for mid-infrared biomedical sensing appli-cations, ed. J. E. Broquin and G. Nunzi Conti, InternationalSociety for Optics and Photonics, 2014, p. 89881A.
103 Z. Cheng, X. Chen, C. Y. Wong, K. Xu and H. K. Tsang,IEEE Photonics J., 2012, 4, 1510–1519.
104 Y. C. Chang, P. Wägli, V. Paeder, A. Homsy, L. Hvozdara,P. Van Der Wal, J. Di Francesco, N. F. De Rooij andH. Peter Herzig, Lab Chip, 2012, 12, 3020–3023.
105 M. Malmström, M. Karlsson, P. Forsberg, Y. Cai,F. Nikolajeff and F. Laurell, Opt. Mater. Express, 2016, 6,1286.
106 A. Osman, A. Z. Khokhar, M. Nedeljkovic, Y. Wu,G. Z. Mashanovich, K. Debnath, Z. Qu and J. SolerPenades, Opt. Lett., 2018, 43, 5997.
107 Y. Tzeng, Diamond Films Technol., 1991, 1, 31.108 M. Odijk and A. van den Berg, Annu. Rev. Anal. Chem.,
2018, 11, 421–440.
Critical Review Analyst
2504 | Analyst, 2020, 145, 2482–2509 This journal is © The Royal Society of Chemistry 2020
Ope
n A
cces
s A
rtic
le. P
ublis
hed
on 1
5 Ja
nuar
y 20
20. D
ownl
oade
d on
12/
12/2
021
6:39
:58
AM
. T
his
artic
le is
lice
nsed
und
er a
Cre
ativ
e C
omm
ons
Attr
ibut
ion-
Non
Com
mer
cial
3.0
Unp
orte
d L
icen
ce.
View Article Online

109 A. Susarrey-arce, R. M. Tiggelaar, M. Morassutto,J. Geerlings and R. G. P. Sanders, Sens. Actuators, B, 2015,220, 13–21.
110 R. Hersig-Marx, K. T. Queeney, R. J. Jackman,M. A. Schmidt and K. F. Jensen, Anal. Chem., 2004, 76,6476–6483.
111 E. Karabudak, B. L. Mojet, S. Schlautmann, G. Mul andH. J. G. E. Gardeniers, Anal. Chem., 2012, 84, 3132–3137.
112 B. A. Rizkin, F. G. Popovic and R. L. Hartman, J. Vac. Sci.Technol., A, 2019, 37, 050801.
113 P. Führer, J. J. A. Lozeman, H. L. de Boer, J. G. Bomer,W. Olthuis and M. Odijk, 22nd Int. Conf. MiniaturizedSyst. Chem. Life Sci. μTAS, 2018, vol. 2018, pp. 2127–2130.
114 E. Gross, Nano Res., 2019, 12, 2200–2210.115 A. Dazzi and C. B. Prater, Chem. Rev., 2017, 117, 5146–
5173.116 Y. H. Lu, J. M. Larson, A. Baskin, X. Zhao, P. D. Ashby,
D. Prendergast, H. A. Bechtel, R. Kostecki andM. Salmeron, Nano Lett., 2019, 19, 5388–5393.
117 F. Huth, A. Govyadinov, S. Amarie, W. Nuansing,F. Keilmann and R. Hillenbrand, Nano Lett., 2012, 12,3973–3978.
118 R. Adato, S. Aksu and H. Altug, Biochem. Pharmacol., 2015,18, 436–446.
119 T. Schmid and P. Dariz, Heritage, 2019, 2, 1662–1683.120 M. Fleischmann, P. J. Hendra and A. J. McQuillan, Chem.
Phys. Lett., 1974, 26, 163–166.121 D. L. Jeanmaire and R. P. Van Duyne, J. Electroanal.
Chem., 1977, 84, 1.122 P. L. Stiles, J. A. Dieringer, N. C. Shah and R. P. Van
Duyne, Annu. Rev. Anal. Chem., 2008, 1, 601–626.123 M. Moskovits, Rev. Mod. Phys., 1985, 57, 783–826.124 M. Moskovits, Phys. Chem. Chem. Phys., 2013, 15, 5301–
5311.125 M. Moskovits, J. Raman Spectrosc., 2005, 36, 485–496.126 S. Schlücker, Angew. Chem., Int. Ed., 2014, 53, 4756–4795.127 J. Kim, Y. Jang, N. J. Kim, H. Kim, G. C. Yi, Y. Shin,
M. H. Kim and S. Yoon, Front. Chem., 2019, 7, 1–7.128 M. A. Montiel, F. J. Vidal-Iglesias, V. Montiel and J. Solla-
Gullón, Curr. Opin. Electrochem., 2017, 1, 34–39.129 A. Otto, J. Raman Spectrosc., 1991, 22, 743–752.130 M. F. dos Santos, V. Katic, P. L. dos Santos, B. M. Pires,
A. L. B. Formiga and J. A. Bonacin, Anal. Chem., 2019, 91,10386–10389.
131 D. Martín-Yerga, A. Pérez-Junquera, D. Hernández-Santosand P. Fanjul-Bolado, Electroanalysis, 2018, 30, 1095–1099.
132 O. J. R. Clarke, G. J. H. St Marie and C. L. Brosseau,J. Electrochem. Soc., 2017, 164, B3091–B3095.
133 C. N. Hernández, D. Martín-Yerga, M. B. González-García,D. Hernández-Santos and P. Fanjul-Bolado, Talanta, 2018,178, 85–88.
134 D. Martín-Yerga, A. Pérez-Junquera, M. B. González-García, J. V. Perales-Rondon, A. Heras, A. Colina,D. Hernández-Santos and P. Fanjul-Bolado, Electrochim.Acta, 2018, 264, 183–190.
135 T. P. Lynk, O. J. R. Clarke, N. Kesavan and C. L. Brosseau,Sens. Actuators, B, 2018, 257, 270–277.
136 A. M. Robinson, S. G. Harroun, J. Bergman andC. L. Brosseau, Anal. Chem., 2012, 84, 1760–1764.
137 R. A. Karaballi, A. Nel, S. Krishnan, J. Blackburn andC. L. Brosseau, Phys. Chem. Chem. Phys., 2015, 17, 21356–21363.
138 L. Zhao, J. Blackburn and C. L. Brosseau, Anal. Chem.,2015, 87, 441–447.
139 S. D. Bindesri, D. S. Alhatab and C. L. Brosseau, Analyst,2018, 143, 4128–4135.
140 G. Niaura, A. K. Gaigalas and V. L. Vilker, J. RamanSpectrosc., 1997, 28, 1009–1011.
141 R. Mažeikiená, G. Niaura and A. Malinauskas, Chemija,2018, 29, 81–88.
142 R. Mažeikiene, G. Niaura and A. Malinauskas, Synth. Met.,2010, 160, 1060–1064.
143 R. Mažeikienė, G. Niaura and A. Malinauskas, J. SolidState Electrochem., 2019, 23, 1631–1640.
144 R. Mažeikienė, G. Niaura and A. Malinauskas, Synth. Met.,2019, 248, 35–44.
145 R. Mažeikienė, G. Niaura and A. Malinauskas, Synth. Met.,2018, 243, 97–106.
146 R. Mažeikienė, G. Niaura and A. Malinauskas,Spectrochim. Acta, Part A, 2019, 221, 117147.
147 R. Mažeikiene, G. Niaura, O. Eicher-Lorka andA. Malinauskas, J. Colloid Interface Sci., 2011, 357, 189–197.
148 R. Mažeikien, G. Niaura and A. Malinauskas,J. Electroanal. Chem., 2011, 660, 140–146.
149 R. Mažeikiene, G. Niaura and A. Malinauskas, Chemija,2017, 28, 28–32.
150 R. Mažeikienė, G. Niaura and A. Malinauskas, J. SolidState Electrochem., 2019, 2307–2316.
151 R. Mažeikienė, G. Niaura and A. Malinauskas,Spectrochim. Acta, Part A, 2017, 181, 200–207.
152 R. Mažeikiene, G. Niaura and A. Malinauskas,J. Electroanal. Chem., 2014, 719, 60–71.
153 W. Kiefer and H. J. Bernstein, Appl. Spectrosc., 1971, 25,609–613.
154 H. Yamada, T. Amamiya and H. Tsubomura, Chem. Phys.Lett., 1978, 56, 591–594.
155 P. Hildebrandt, K. A. Macor and R. S. Czernuszewicz,J. Raman Spectrosc., 1988, 19, 65–69.
156 A. J. McQuillant and R. E. Hester, J. Raman Spectrosc.,1984, 15, 15–19.
157 J. E. Pemberton and R. P. Buck, Appl. Spectrosc., 1981, 35,571–576.
158 J. E. Pemberton and R. P. Buck, J. Electroanal. Chem.Interfacial Electrochem., 1982, 136, 201–208.
159 L. Kavan, P. Janda, M. Krause, F. Ziegs and L. Dunsch,Anal. Chem., 2009, 81, 2017–2021.
160 L. Pospíil, M. Gál, M. Hromadová, J. Bulíková, V. Kolivoka,J. Cvaka, K. Nováková, L. Kavan, M. Zukalová andL. Dunsch, Phys. Chem. Chem. Phys., 2010, 12, 14095–14101.
Analyst Critical Review
This journal is © The Royal Society of Chemistry 2020 Analyst, 2020, 145, 2482–2509 | 2505
Ope
n A
cces
s A
rtic
le. P
ublis
hed
on 1
5 Ja
nuar
y 20
20. D
ownl
oade
d on
12/
12/2
021
6:39
:58
AM
. T
his
artic
le is
lice
nsed
und
er a
Cre
ativ
e C
omm
ons
Attr
ibut
ion-
Non
Com
mer
cial
3.0
Unp
orte
d L
icen
ce.
View Article Online

161 P. Damlin, C. Kvarnström, A. Petr, P. Ek, L. Dunsch andA. Ivaska, J. Solid State Electrochem., 2002, 6, 291–301.
162 A. Viinikanoja, J. Kauppila, P. Damlin, M. Suominen andC. Kvarnström, Phys. Chem. Chem. Phys., 2015, 17, 12115–12123.
163 M. L. McGlashen, M. E. Blackwood and T. G. Spiro, J. Am.Chem. Soc., 1993, 115, 2074–2075.
164 D. Ibañez, D. Plana, A. Heras, D. J. Fermín and A. Colina,Electrochem. Commun., 2015, 54, 14–17.
165 F. Bonhomme, J. C. Lassègues and L. Servant,J. Electrochem. Soc., 2001, 148, 450–458.
166 L. Kavan and L. Dunsch, ChemPhysChem, 2003, 4, 944–950.
167 M. Kalbáč, L. Kavan, S. Gorantla, T. Gemming andL. Dunsch, Chem. – Eur. J., 2010, 16, 11753–11759.
168 M. Kalbac, L. Kavan, M. Zukalová and L. Dunsch, J. Phys.Chem. C, 2007, 111, 1079–1085.
169 M. Kalbac, Y. P. Hsieh, H. Farhat, L. Kavan, M. Hofmann,J. Kong and M. S. Dresselhaus, Nano Lett., 2010, 10, 4619–4626.
170 M. Kalbáč, V. Vales, L. Kavan and L. Dunsch,Nanotechnology, 2014, 25, 485706.
171 M. Kalbac, L. Kavan and L. Dunsch, Diamond Relat.Mater., 2009, 18, 972–974.
172 L. Kavan, P. Rapta and L. Dunsch, Chem. Phys. Lett., 2000,328, 363–368.
173 J. Tarábek, L. Kavan, L. Dunsch and M. Kalbac, J. Phys.Chem. C, 2008, 112, 13856–13861.
174 L. Kavan, O. Frank, A. A. Green, M. C. Hersam, J. Koltai,V. Zólyomi, J. Kürti and L. Dunsch, J. Phys. Chem. C, 2008,112, 14179–14187.
175 L. Kavan, L. Dunsch and H. Kataura, Chem. Phys. Lett.,2002, 361, 79–85.
176 M. Kalbáč, L. Kavan and L. Dunsch, Anal. Chem., 2007, 79,9074–9081.
177 M. Kalbáč, L. Kavan, M. Zukalová and L. Dunsch, Adv.Funct. Mater., 2005, 15, 418–426.
178 C. S. L. Koh, H. K. Lee, G. C. Phan-Quang, X. Han,M. R. Lee, Z. Yang and X. Y. Ling, Angew. Chem., Int. Ed.,2017, 56, 8813–8817.
179 L. Zhang, V. Liao and Z. Yu, Carbon, 2010, 48, 2582–2589.
180 D. Ibañez, E. C. Romero, A. Heras and A. Colina,Electrochim. Acta, 2014, 129, 171–176.
181 M. Tominaga, N. Watanabe and Y. Yatsugi, J. Electroanal.Chem., 2017, 800, 156–161.
182 A. Colina, V. Ruiz, A. Heras, E. Ochoteco, E. Kauppinenand J. López-Palacios, Electrochim. Acta, 2011, 56, 1294–1299.
183 R. V. Salvatierra, L. G. Moura, M. M. Oliveira,M. A. Pimenta and A. J. G. Zarbin, J. Raman Spectrosc.,2012, 43, 1094–1100.
184 M. Kalbac, H. Farhat, J. Kong, P. Janda, L. Kavan andM. S. Dresselhaus, Nano Lett., 2011, 11, 1957–1963.
185 O. Frank, M. S. Dresselhaus and M. Kalbac, Acc. Chem.Res., 2015, 48, 111–118.
186 J. Binder, J. M. Urban, R. Stepniewski, W. Strupinski andA. Wysmolek, Nanotechnology, 2016, 27, 045704.
187 M. Bousa, O. Frank and L. Kavan, Electroanalysis, 2014,26, 57–61.
188 M. Bouša, O. Frank, I. Jirka and L. Kavan, Phys. StatusSolidi B, 2013, 250, 2662–2667.
189 S. Gupta, S. B. Carrizosa, J. Jasinski and N. Dimakis, AIPAdv., 2018, 8, 065225.
190 W. T. E. van den Beld, M. Odijk, R. H. J. Vervuurt,J. W. Weber, A. A. Bol, A. van den Berg and J. C. T. Eijkel,Sci. Rep., 2017, 7, 1–8.
191 R. Mažeikienė, G. Niaura and A. Malinauskas,J. Electroanal. Chem., 2018, 808, 228–235.
192 O. L. Gribkova, O. D. Iakobson, A. A. Nekrasov,V. A. Cabanova, V. A. Tverskoy, A. R. Tameev andA. V. Vannikov, Electrochim. Acta, 2016, 222, 409–420.
193 B. Zanfrognini, A. Colina, A. Heras, C. Zanardi, R. Seeberand J. López-Palacios, Polym. Degrad. Stab., 2011, 96,2112–2119.
194 A. Blacha-Grzechnik, K. Piwowar, P. Zassowski, R. Motykaand J. Zak, Electrochim. Acta, 2017, 245, 902–911.
195 S. Bilal, A. A. Shah and R. Holze, Vib. Spectrosc., 2010, 53,279–284.
196 S. Shreepathi and R. Holze, Langmuir, 2006, 22, 5196–5204.
197 A. A. Nekrasov, O. L. Gribkova, O. D. Iakobson,I. N. Ardabievskii, V. F. Ivanov and A. V. Vannikov, Chem.Pap., 2017, 71, 449–458.
198 Z. Morávková and E. Dmitrieva, J. Raman Spectrosc., 2017,48, 1229–1234.
199 Z. Morávková and E. Dmitrieva, ChemistrySelect, 2019, 4,8847–8854.
200 M. Grzeszczuk, A. Kepas, C. Kvarnstrom and A. Ivaska,Synth. Met., 2010, 160, 636–642.
201 K. Crowley and J. Cassidy, J. Electroanal. Chem., 2003, 547,75–82.
202 L. M. C. Ferreira, D. Grasseschi, M. S. F. Santos,P. R. Martins, I. G. R. Gutz, A. M. C. Ferreira, K. Araki,H. E. Toma and L. Angnes, Langmuir, 2015, 31, 4351–4360.
203 A. J. Wilson and K. A. Willets, Analyst, 2016, 141, 5144–5151.
204 C. Xu, H. Geng, R. Bennett, D. A. Clayton and S. Pan,J. Phys. Chem. C, 2013, 117, 1849–1856.
205 P. Song, X. Guo, Y. Pan, Y. Wen, Z. Zhang and H. Yang,J. Electroanal. Chem., 2013, 688, 384–391.
206 T. Shegai, A. Vaskevich, I. Rubinstein and G. Haran, J. Am.Chem. Soc., 2009, 131, 14392–14398.
207 T. Itoh and R. L. McCreery, J. Am. Chem. Soc., 2002, 124,10894–10902.
208 W. F. Paxton, S. L. Kleinman, A. N. Basuray, J. F. Stoddartand R. P. Van Duyne, J. Phys. Chem. Lett., 2011, 2, 1145–1149.
209 M. B. Pomfret, J. J. Pietron and J. C. Owrutsky, Langmuir,2010, 26, 6809–6817.
Critical Review Analyst
2506 | Analyst, 2020, 145, 2482–2509 This journal is © The Royal Society of Chemistry 2020
Ope
n A
cces
s A
rtic
le. P
ublis
hed
on 1
5 Ja
nuar
y 20
20. D
ownl
oade
d on
12/
12/2
021
6:39
:58
AM
. T
his
artic
le is
lice
nsed
und
er a
Cre
ativ
e C
omm
ons
Attr
ibut
ion-
Non
Com
mer
cial
3.0
Unp
orte
d L
icen
ce.
View Article Online

210 R. A. Karaballi, S. Merchant, S. R. Power and C. L. Brosseau,Phys. Chem. Chem. Phys., 2018, 20, 4513–4526.
211 K. E. R. McLeod, T. P. Lynk, C. S. Sit and C. L. Brosseau,Anal. Methods, 2019, 11, 924–929.
212 D. Ibañez, A. Santidrian, A. Heras, M. Kalbáč andA. Colina, J. Phys. Chem. C, 2015, 119, 8191–8198.
213 B. H. C. Greene, D. S. Alhatab, C. C. Pye andC. L. Brosseau, J. Phys. Chem. C, 2017, 121, 8084–8090.
214 T. Yuan, L. Le Thi Ngoc, J. Van Nieuwkasteele, M. Odijk,A. van Den Berg, H. Permentier, R. Bischoff andE. T. Carlen, Anal. Chem., 2015, 87, 2588–2592.
215 H. Le-The, J. J. A. Lozeman, M. Lafuente, P. Muñoz,J. G. Bomer, H. Duy-Tong, E. Berenschot, A. van den Berg,N. R. Tas, M. Odijk and J. C. T. Eijkel, Nanoscale, 2019, 11,12152–12160.
216 H. Le-The, R. M. Tiggelaar, E. Berenschot, A. van den Berg,N. Tas and J. C. T. Eijkel, ACS Nano, 2019, 13, 6782–6789.
217 J. V. Perales-Rondon, S. Hernandez, A. Heras andA. Colina, Appl. Surf. Sci., 2019, 473, 366–372.
218 J. V. Perales-Rondon, S. Hernandez, D. Martin-Yerga,P. Fanjul-Bolado, A. Heras and A. Colina, Electrochim.Acta, 2018, 282, 377–383.
219 A. J. Bard and M. Stratmann, Encyclopedia of electro-chemistry, 2007, ISBN: 9783527610426, DOI: 10.1002/9783527610426.
220 C. Zong, C. J. Chen, M. Zhang, D. Y. Wu and B. Ren, J. Am.Chem. Soc., 2015, 137, 11768–11774.
221 C. Shi, W. Zhang, R. L. Birke and J. R. Lombardi,J. Electroanal. Chem., 1997, 423, 67–81.
222 D. H. Murgida and P. Hildebrandt, J. Am. Chem. Soc.,2001, 123, 4062–4068.
223 D. H. Murgida and P. Hildebrandt, Angew. Chem., Int. Ed.,2001, 40, 728–731.
224 C. Shi, W. Zhang, J. R. Lombardi and R. L. Birke, J. Phys.Chem., 1992, 96, 10093–10096.
225 W. Zhang, A. Vivoni, J. R. Lombardi and R. L. Birke,J. Phys. Chem., 1995, 99, 12846–12857.
226 C. Shi, W. Zhang, R. L. Birke and J. R. Lombardi, J. Phys.Chem., 1990, 94, 4766–4769.
227 J. Wessel, J. Opt. Soc. Am. B, 1985, 2, 1538–1541.228 R. M. Stöckle, Y. D. Suh, V. Deckert and R. Zenobi, Chem.
Phys. Lett., 2000, 318, 131–136.229 M. S. Anderson, Appl. Phys. Lett., 2000, 76, 3130–3132.230 N. Hayazawa, Y. Inouye, Z. Sekkat and S. Kawata, Opt.
Commun., 2000, 183, 333–336.231 B. Pettinger, G. Picardi, R. Schuster and G. Ertl,
Electrochemistry, 2000, 68, 942–949.232 F. Shao and R. Zenobi, Anal. Bioanal. Chem., 2019, 411,
37–61.233 D. Kurouski, M. Mattei and R. P. Van Duyne, Nano Lett.,
2015, 15, 7956–7962.234 Z. C. Zeng, S. C. Huang, D. Y. Wu, L. Y. Meng, M. H. Li,
T. X. Huang, J. H. Zhong, X. Wang, Z. L. Yang and B. Ren,J. Am. Chem. Soc., 2015, 137, 11928–11931.
235 J. F. Li, Y. F. Huang, Y. Ding, Z. L. Yang, S. B. Li,X. S. Zhou, F. R. Fan, W. Zhang, Z. Y. Zhou, D. Y. Wu,
B. Ren, Z. L. Wang and Z. Q. Tian, Nature, 2010, 464, 392–395.
236 J. F. Li, Y. J. Zhang, A. V. Rudnev, J. R. Anema, S. B. Li,W. J. Hong, P. Rajapandiyan, J. Lipkowski, T. Wandlowskiand Z. Q. Tian, J. Am. Chem. Soc., 2015, 137, 2400–2408.
237 L. A. Colnago, F. D. Andrade, A. A. Souza, R. B. V. Azeredo,A. A. Lima, L. M. Cerioni, T. M. Osán and D. J. Pusiol,Chem. Eng. Technol., 2014, 37, 191–203.
238 L. M. Silva Nunes, T. B. Moraes, L. L. Barbosa, L. H. Mazoand L. A. Colnago, Anal. Chim. Acta, 2014, 850, 1–5.
239 T. Kobayashi, P. K. Babu, J. H. Chung, E. Oldfield andA. Wieckowski, J. Phys. Chem. C, 2007, 111, 7078–7083.
240 P. K. Babu, J. H. Chung, E. Oldfield and A. Wieckowski,Electrochim. Acta, 2008, 53, 6672–6679.
241 P. K. Babu, H. S. Kim, J. H. Chung, E. Oldfield andA. Wieckowski, J. Phys. Chem. B, 2004, 108, 20228–20232.
242 J. B. Day, P. A. Vuissoz, E. Oldfield, A. Wieckowski andJ. P. Ansermet, J. Am. Chem. Soc., 1996, 118, 13046–13050.
243 P. K. Babu, H. S. Kim, E. Oldfield and A. Wieckowski,J. Phys. Chem. B, 2003, 107, 7595–7600.
244 Y. Y. Tong, S. K. Hee, P. K. Babu, P. Waszczuk,A. Wieckowski and E. Oldfield, J. Am. Chem. Soc., 2002,124, 468–473.
245 Y. Y. Tong, C. Rice, A. Wieckowski and E. Oldfield, J. Am.Chem. Soc., 2000, 122, 1123–1129.
246 Y. Y. Tong, C. Rice, A. Wieckowski and E. Oldfield, J. Am.Chem. Soc., 2000, 122, 11921–11924.
247 Y. Tong, C. Rice, N. Godbout, A. Wieckowski andE. Oldfield, J. Am. Chem. Soc., 1999, 121, 2996–3003.
248 C. Rice, Y. Tong, E. Oldfield and A. Wieckowski,Electrochim. Acta, 1998, 43, 2825–2830.
249 H. Yano, J. Inukai, H. Uchida, M. Watanabe, P. K. Babu,T. Kobayashi, J. H. Chung, E. Oldfield and A. Wieckowski,Phys. Chem. Chem. Phys., 2006, 8, 4932–4939.
250 Y. Y. Tong, A. Wieckowski and E. Oldfield, J. Phys. Chem.B, 2002, 106, 2434–2446.
251 P. A. Vuissoz, J. P. H. Ansermet and A. Wieckowski, Phys.Rev. Lett., 1999, 83, 2457–2460.
252 P. J. Slezak and A. Wieckowski, J. Electroanal. Chem., 1992,339, 401–410.
253 S. Klod, F. Ziegs and L. Dunsch, Anal. Chem., 2009, 81,10262–10267.
254 J. Z. Hu, N. R. Jaegers, M. Y. Hu and K. T. Mueller, J. Phys.:Condens. Matter, 2018, 30, 463001.
255 R. D. Webster, Anal. Chem., 2004, 76, 1603–1610.256 X. Zhang and J. W. Zwanziger, J. Magn. Reson., 2011, 208,
136–147.257 S. Klod and L. Dunsch, Magn. Reson. Chem., 2011, 49,
725–729.258 P. Rapta, K. Haubner, P. Machata, V. Lukeš,
M. Rosenkranz, S. Schiemenz, S. Klod, H. Kivelä,C. Kvarnström, H. Hartmann and L. Dunsch, Electrochim.Acta, 2013, 110, 670–680.
Analyst Critical Review
This journal is © The Royal Society of Chemistry 2020 Analyst, 2020, 145, 2482–2509 | 2507
Ope
n A
cces
s A
rtic
le. P
ublis
hed
on 1
5 Ja
nuar
y 20
20. D
ownl
oade
d on
12/
12/2
021
6:39
:58
AM
. T
his
artic
le is
lice
nsed
und
er a
Cre
ativ
e C
omm
ons
Attr
ibut
ion-
Non
Com
mer
cial
3.0
Unp
orte
d L
icen
ce.
View Article Online

259 M. Zalibera, P. Machata, T. T. Clikeman, M. Rosenkranz,S. H. Strauss, O. V. Boltalina and A. A. Popov, Analyst,2015, 140, 7209–7216.
260 L. Huang, E. G. Sorte, S. G. Sun and Y. Y. J. Tong, Chem.Commun., 2015, 51, 8086–8088.
261 U. Bussy, P. Giraudeau, V. Silvestre, T. Jaunet-Lahary,V. Ferchaud-Roucher, M. Krempf, S. Akoka, I. Tea andM. Boujtita, Anal. Bioanal. Chem., 2013, 405, 5817–5824.
262 R. Boisseau, U. Bussy, P. Giraudeau and M. Boujtita, Anal.Chem., 2015, 87, 372–375.
263 B. Ferreira Gomes, P. Ferreira da Silva, C. M. Silva Lobo,M. da Silva Santos and L. A. Colnago, Anal. Chim. Acta,2017, 983, 91–95.
264 E. J. Kelly, J. Electrochem. Soc., 1977, 124, 987–994.265 B. Ferreira Gomes, L. M. Silva Nunes, C. M. Silva Lobo,
L. F. Cabeça and L. A. Colnago, Anal. Chem., 2014, 86,9391–9393.
266 L. M. A. Monzon and J. M. D. Coey, Electrochem. Commun.,2014, 42, 38–41.
267 D. W. Mincey, M. J. Popovich, P. J. Faustino, M. M. Hurstand J. A. Caruso, Anal. Chem., 1990, 62, 1197–1200.
268 S. H. Cao, Z. R. Ni, L. Huang, H. J. Sun, B. Tang, L. J. Lin,Y. Q. Huang, Z. Y. Zhou, S. G. Sun and Z. Chen, Anal.Chem., 2017, 89, 3810–3813.
269 E. G. Sorte and Y. J. Tong, J. Electroanal. Chem., 2016, 769,1–4.
270 E. G. Sorte, S. Jilani and Y. Y. J. Tong, Electrocatalysis,2017, 8, 95–102.
271 X. P. Zhang, W. L. Jiang, S. H. Cao, H. J. Sun, X. Q. You,S. H. Cai, J. L. Wang, C. Sen Zhao, X. Wang, Z. Chen andS. G. Sun, Electrochim. Acta, 2018, 273, 300–306.
272 J. Wang, X. Cao, L. Fang, X. You, K. Wong, S. Cao, C. Xiao,S. Cai, Y. Huang, X. Zhang and Z. Chen, Int. J. HydrogenEnergy, 2019, 44, 16411–16423.
273 J. Wang, X. You, C. Xiao, X. Zhang, S. Cai, W. Jiang, S. Guo,S. Cao and Z. Chen, Appl. Catal., B, 2019, 259, 118060.
274 S. H. Cao, S. Liu, H. J. Sun, L. Huang, Z. R. Ni, W. L. Jiang,M. Zhan, Z. Y. Zhou, S. G. Sun and Z. Chen, Anal. Chem.,2019, 91, 1686–1691.
275 P. Ferreira da Silva, B. Ferreira Gomes, C. M. Silva Lobo,L. H. K. Queiroz Júnior, E. Danieli, M. Carmo, B. Blümichand L. A. Colnago, Microchem. J., 2019, 146, 658–663.
276 J. B. Richter, C. Eßbach, I. Senkovska, S. Kaskel andE. Brunner, Chem. Commun., 2019, 55, 6042–6045.
277 H. Wang, T. K. J. Köster, N. M. Trease, J. Ségalini,P. L. Taberna, P. Simon, Y. Gogotsi and C. P. Grey, J. Am.Chem. Soc., 2011, 133, 19270–19273.
278 B. Ferreira Gomes, C. M. Silva Lobo and L. A. Colnago,Appl. Sci., 2019, 9, 498.
279 A. P. Bruins, TrAC, Trends Anal. Chem., 2015, 70, 14–19.280 C. Dass, Fundamentals of Contemporary Mass Spectrometry,
Wiley, 2007.281 W. Plieth, G. S. Wilson and C. Gutiérrez De La Fe, Pure
Appl. Chem., 1998, 70, 1395–1414.282 O. Kasian, S. Geiger, K. J. J. Mayrhofer and S. Cherevko,
Chem. Rec., 2019, 19, 2130–2142.
283 S. O. Klemm, A. A. Topalov, C. A. Laska and K. J. J. Mayrhofer,Electrochem. Commun., 2011, 13, 1533–1535.
284 S. O. Klemm, A. Karschin, A. K. Schuppert, A. A. Topalov,I. Katsounaros and K. J. J. Mayrhofer, J. Electroanal.Chem., 2013, 693, 127.
285 E. M. Yuill and L. A. Baker, ChemElectroChem, 2017, 4,806–821.
286 X. Xu, W. Lu and R. B. Cole, Anal. Chem., 1996, 2700,4244–4253.
287 F. T. G. van den Brink, L. Büter, M. Odijk, W. Olthuis,U. Karst and A. van den Berg, Anal. Chem., 2015, 87, 1527–1535.
288 H. Faber, M. Vogel and U. Karst, Anal. Chim. Acta, 2014,834, 9–21.
289 R. Zabel and G. Weber, Anal. Bioanal. Chem., 2016, 408,1237–1247.
290 M. Odijk, W. Olthuis, A. van den Berg, L. Qiao andH. Girault, Anal. Chem., 2012, 84, 9176–9183.
291 L. Qiao, Y. Lu, B. Liu and H. H. Girault, J. Am. Chem. Soc.,2011, 133, 19823–19831.
292 K. Yu, H. Zhang, J. He, R. N. Zare, Y. Wang, L. Li, N. Li,D. Zhang and J. Jiang, Anal. Chem., 2018, 90, 7154–7157.
293 J. Jiang, H. Zhang, M. Li, M. T. Dulay, A. J. Ingram, N. Li,H. You and R. N. Zare, Anal. Chem., 2015, 87, 8057–8062.
294 R. Qiu, X. Zhang, H. Luo and Y. Shao, Chem. Sci., 2016, 7,6684–6688.
295 W. Guo, H. Ding, C. Gu, Y. Liu, X. Jiang, B. Su andY. Shao, J. Am. Chem. Soc., 2018, 140, 15904–15915.
296 J. L. Owens, H. A. Marsh and G. Dryhurst, J. Electroanal.Chem., 1978, 91, 231–247.
297 Z. Jusys, H. Massong and H. Baltruschat, J. Electrochem.Soc., 1999, 146, 1093–1098.
298 O. Wolter and J. Heitbaum, Ext. Abstr., Meet. – Int. Soc.Electrochem., 1984, 6, 454–456.
299 O. Wolter and J. Heitbaum, Phys. Chem. Chem. Phys.,1984, 88, 6–10.
300 A. A. Abd-El-Latif, C. J. Bondue, S. Ernst, M. Hegemann,J. K. Kaul, M. Khodayari, E. Mostafa, A. Stefanova andH. Baltruschat, TrAC, Trends Anal. Chem., 2015, 70, 4–13.
301 D. B. Trimarco, S. B. Scott, A. H. Thilsted, J. Y. Pan,T. Pedersen, O. Hansen, I. Chorkendorff andP. C. K. Vesborg, Electrochim. Acta, 2018, 268, 520–530.
302 M. Heinen, Y. X. Chen, Z. Jusys and R. J. Behm,Electrochim. Acta, 2007, 52, 5634–5643.
303 S. Brimaud, Z. Jusys and R. Jürgen Behm, Beilstein J.Nanotechnol., 2014, 5, 735–746.
304 J. Schnaidt, M. Heinen, Z. Jusys and R. J. Behm, J. Phys.Chem. C, 2012, 116, 2872–2883.
305 J. Schnaidt, M. Heinen, Z. Jusys and R. J. Behm, Catal.Today, 2013, 202, 154–162.
306 R. Reichert, J. Schnaidt, Z. Jusys and R. J. Behm,ChemPhysChem, 2013, 14, 3678–3681.
307 M. Gorlin, J. F. De Araujo, H. Schmies, D. Bernsmeier,S. Dresp, M. Gliech, Z. Jusys, P. Chernev, R. Kraehnert,H. Dau and P. Strasser, J. Am. Chem. Soc., 2017, 139,2070–2082.
Critical Review Analyst
2508 | Analyst, 2020, 145, 2482–2509 This journal is © The Royal Society of Chemistry 2020
Ope
n A
cces
s A
rtic
le. P
ublis
hed
on 1
5 Ja
nuar
y 20
20. D
ownl
oade
d on
12/
12/2
021
6:39
:58
AM
. T
his
artic
le is
lice
nsed
und
er a
Cre
ativ
e C
omm
ons
Attr
ibut
ion-
Non
Com
mer
cial
3.0
Unp
orte
d L
icen
ce.
View Article Online

308 D. B. Trimarco, T. Pedersen, O. Hansen, I. Chorkendorffand P. C. K. Vesborg, Rev. Sci. Instrum., 2015, 86, 075006.
309 C. Roy, B. Sebok, S. B. Scott, E. M. Fiordaliso,J. E. Sørensen, A. Bodin, D. B. Trimarco, C. D. Damsgaard,P. C. K. Vesborg, O. Hansen, I. E. L. Stephens,J. Kibsgaard and I. Chorkendorff, Nat. Catal., 2018, 1,820–829.
310 A. Winiwarter, L. Silvioli, S. B. Scott, K. Enemark-Rasmussen, M. Sariç, D. B. Trimarco, P. C. K. Vesborg,P. G. Moses, I. E. L. Stephens, B. Seger, J. Rossmeisl andI. Chorkendorff, Energy Environ. Sci., 2019, 12, 1055–1067.
311 B. Liu, X. Y. Yu, Z. Zhu, X. Hua, L. Yang and Z. Wang, LabChip, 2014, 14, 855–859.
312 Z. Wang, Y. Zhang, B. Liu, K. Wu, S. Thevuthasan,D. R. Baer, Z. Zhu, X. Y. Yu and F. Wang, Anal. Chem.,2017, 89, 960–965.
313 J. Yu, Y. Zhou, X. Hua, S. Liu, Z. Zhu and X. Y. Yu, Chem.Commun., 2016, 52, 10952–10955.
314 T. C. Rohner, J. S. Rossier and H. H. Girault, Anal. Chem.,2001, 73, 5353–5357.
315 T. C. Rohner, J. S. Rossier and H. H. Girault, Electrochem.Commun., 2002, 4, 695–700.
316 G. J. Van Berkel, J. M. E. Quirke, R. A. Tigani, A. S. Dilleyand T. R. Covey, Anal. Chem., 1998, 70, 1544–1554.
317 Á. I. López-Lorente, J. Izquierdo, C. Kranz andB. Mizaikoff, Vib. Spectrosc., 2017, 91, 147–156.
318 W. Cheuquepán, J. M. Pérez, J. M. Orts and A. Rodes,J. Phys. Chem. C, 2014, 118, 19070–19084.
319 M. Dunwell, X. Yang, Y. Yan and B. Xu, J. Phys. Chem. C,2018, 122, 24658–24664.
320 A. Zimmermann, U. Künzelmann and L. Dunsch, Synth.Met., 1998, 93, 17–25.
Analyst Critical Review
This journal is © The Royal Society of Chemistry 2020 Analyst, 2020, 145, 2482–2509 | 2509
Ope
n A
cces
s A
rtic
le. P
ublis
hed
on 1
5 Ja
nuar
y 20
20. D
ownl
oade
d on
12/
12/2
021
6:39
:58
AM
. T
his
artic
le is
lice
nsed
und
er a
Cre
ativ
e C
omm
ons
Attr
ibut
ion-
Non
Com
mer
cial
3.0
Unp
orte
d L
icen
ce.
View Article Online