spectro reprint (poa sep-oct 02) - keystroke studioskeystrokestudios.com/ toolbox.pdf · and...
TRANSCRIPT


M ost professionals require tools in the practice of their trade.For a doctor it may be a stethoscope, for the baseball player
a glove, or for the carpenter a hammer and saw. The one thing thatthey have in common is that as a professional, the quality of thetool is important to the ability to practice the trade. To cut costs atthe expense of quality or capability is seldom an option if success isto be met.
The same is true for the professional predictive maintenanceengineer. In this case, the tools are analytical instruments used togather information that reflects the mechanical health of a system.However, no single tool provides all the information necessary foran effective predictive maintenance program. Just like a carpenterwith a big toolbox, full of different tools, the professional reliabilityengineer carries a big box of tools, which include vibration analysis,oil analysis, thermography and other technologies vital to effectivecondition monitoring.
For machine condition monitoring based on oil analysis, thetools of choice include atomic emission spectroscopy (AES) forelemental analysis, Fourier transform infrared spectroscopy (FTIR)and viscosity for analyzing a lubricant’s physical and chemicalproperties. Preferred tools also include various techniques for theanalysis of particles, particle counters to determine the number ofparticles and their size distribution, and other tools such as ferrousdensity and analytical ferrography to detect active machine wear.
Unfortunately, no single particle analysis technique is completelysatisfactory in providing both qualitative and quantitative data. Forexample, screening techniques that use magnetism either directlyor indirectly by the magnetic Hall effect can be sensitive, but arelimited to ferrous materials. Analytical ferrography and filtergramtechniques, while powerful, are extremely time consuming, aresubjective and require highly skilled technicians for interpretation.Conventional particle counters have proven useful for cleansamples such as hydraulic fluids, but they provide no shape classifi-cation information and can run into problems with dark oils,samples with free or emulsified water droplets, or in situationswhere particle concentrations are high, such as heavily loaded gearsor engine oil samples. Pore blockage particle counters overcomesome of these difficulties, but particle shape is still unknown.
Other methods have been used to quantify large wear particlesincluding X-ray fluorescence spectroscopy (XRF), microwave oracid digestion in conjunction with emission spectroscopy (ICP orRDE) and rotrode filter spectroscopy (RFS).
All of these methods make the elemental analysis of large particles possible, but they still do not provide information on aparticle’s size or its morphology. A scanning electron microscopywith energy dispersive X-ray (SEM-EDX) gives size, shape andelemental analysis. However, high instrument acquisition costs,along with low sample throughput, make this a costly and imprac -tical option for most maintenance programs, except for detailedfailure analysis investigations.
LaserNet FinesTM
A New Tool for the Oil Analysis Toolbox
LaserNet FinesTM
A New Tool for the Oil Analysis Toolbox
BY MALTE LUKAS AND D ANIEL P. ANDERSON OF SPECTRO INC. AND
THOMAS SEBOK AND D AVID FILICKY OF LOCKHEED MARTIN
Figure 1. LaserNet Fines Particle Shape Classifier and Particle Counter
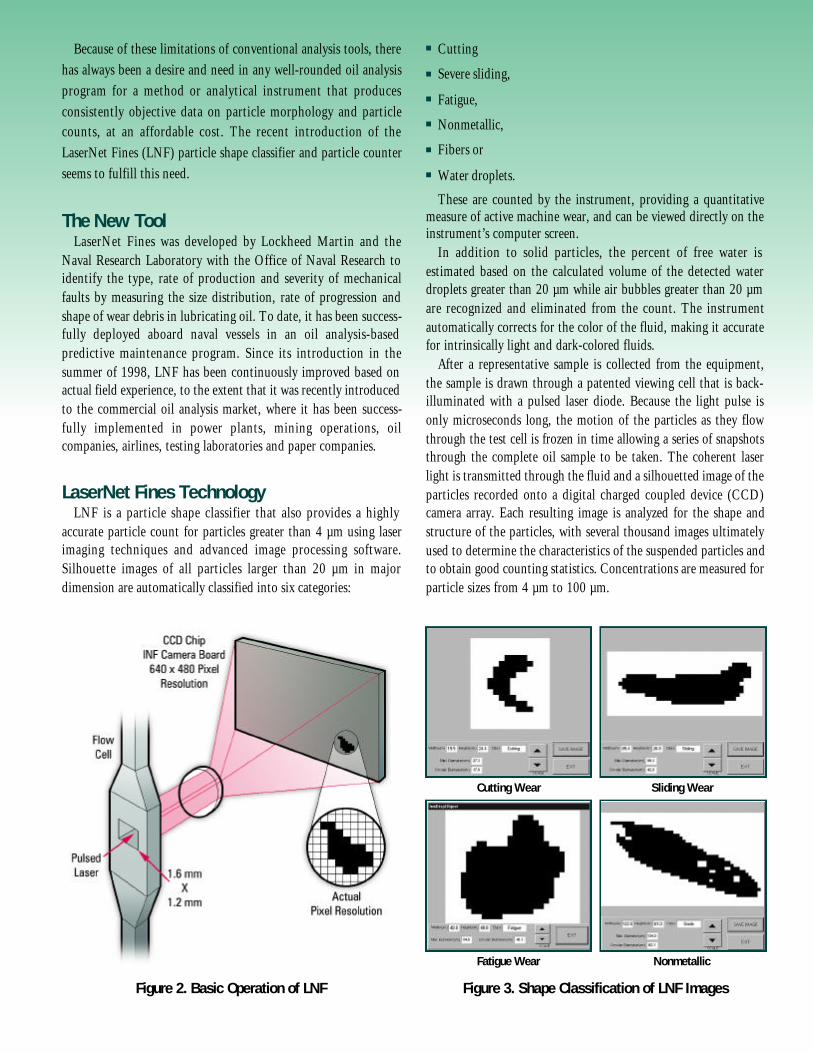
Figure 3. Shape Classification of LNF Images
Cutting Wear Sliding Wear
Fatigue Wear Nonmetallic
Because of these limitations of conventional analysis tools, therehas always been a desire and need in any well-rounded oil analysisprogram for a method or analytical instrument that producesconsistently objective data on particle morphology and particlecounts, at an affordable cost. The recent introduction of theLaserNet Fines (LNF) particle shape classifier and particle counterseems to fulfill this need.
The New Tool LaserNet Fines was developed by Lockheed Martin and the
Naval Research Laboratory with the Office of Naval Research toidentify the type, rate of production and severity of mechanicalfaults by measuring the size distribution, rate of progression andshape of wear debris in lubricating oil. To date, it has been success-fully deployed aboard naval vessels in an oil analysis-basedpredictive maintenance program. Since its introduction in thesummer of 1998, LNF has been continuously improved based onactual field experience, to the extent that it was recently introducedto the commercial oil analysis market, where it has been success-fully implemented in power plants, mining operations, oilcompanies, airlines, testing laboratories and paper companies.
LaserNet Fines TechnologyLNF is a particle shape classifier that also provides a highly
accurate particle count for particles greater than 4 µm using laserimaging techniques and advanced image processing software.Silhouette images of all particles larger than 20 µm in majordimension are automatically classified into six categories:
n Cutting
n Severe sliding,
n Fatigue,
n Nonmetallic,
n Fibers or
n Water droplets.
These are counted by the instrument, providing a quantitativemeasure of active machine wear, and can be viewed directly on theinstrument’s computer screen.
In addition to solid particles, the percent of free water is estimated based on the calculated volume of the detected waterdroplets greater than 20 µm while air bubbles greater than 20 µmare recognized and eliminated from the count. The instrumentautomatically corrects for the color of the fluid, making it accuratefor intrinsically light and dark-colored fluids.
After a representative sample is collected from the equipment,the sample is drawn through a patented viewing cell that is back-illuminated with a pulsed laser diode. Because the light pulse isonly microseconds long, the motion of the particles as they flowthrough the test cell is frozen in time allowing a series of snapshotsthrough the complete oil sample to be taken. The coherent laserlight is transmitted through the fluid and a silhouetted image of theparticles recorded onto a digital charged coupled device (CCD)camera array. Each resulting image is analyzed for the shape andstructure of the particles, with several thousand images ultimatelyused to determine the characteristics of the suspended particles andto obtain good counting statistics. Concentrations are measured forparticle sizes from 4 µm to 100 µm.
Figure 2. Basic Operation of LNF

LNF reports particle size in terms of the maximum chord andalso calculates equivalent spherical diameter for compatibility withthe ISO 11171 calibration standards used to calibrate opticalparticle counters. In addition, the shape characteristics are calculated for particles greater than 20 µm, and the particle is classified into either a wear category or contaminant category.Classification is achieved with an artificial neural network developed specifically for the LNF system. Shape features werechosen to give optimal distinction between the assigned classes offatigue, cutting, severe sliding, nonmetallic, fibers, water bubblesand air bubbles based on the overall shape of the particle, as well asthe minor to major chord ratios. An illustration of some of thecommon wear particle categories is shown in Figure 3. An extensivelibrary of particles, identified by human experts using conventionalferrographic techniques, was used to train the artificial neuralnetwork to recognize common wear particle types.
The LNF-C Fines analyzes the outline shapes of particles, that is,their “silhouettes.” Because the optical system within LNF-C usestransmitted light (back lighting), it is not possible for LNF todistinguish particle color, texture or surface attributes. Sometimesthese are important attributes to be considered when making animportant diagnosis. Hence, the results obtained for each wearcategory are only those typical of that type of particle when viewedas a silhouette. It is thus recommended that if the size or quantityof particles in the abnormal wear particle categories (severe, fatigue or cutting) increases over a period of time, a microscopicexamination should be carried out to validate the particle classifications made by the LNF-C. Ferrography (traditionalFerrography or Rotary Particle Deposition) or membrane filtration(filtergram) are possible follow-up techniques. Other types of particles such as molybdenum disulfide, carbon flakes, seal materialand dark metallo-oxides, should they be present in a sample, will beclassified in one of the wear categories of severe, fatigue or cuttingdepending upon their shape. This is because these particles blocklight and thus present a solid silhouette that the shape-recognitionsoftware will categorize as one of the solid particle types, that is, assliding, fatigue or cutting.
The LNF instrument was designed primarily as an automaticwear particle shape classifier and trending tool to assist in condition-monitoring programs. However, because of its directimaging capability, it is also an extremely accurate and reliable particle counter and is configured to comply with thecurrent ISO 4406:99 reporting standards.
However, a major advantage of the LNF instrument is thatunlike conventional particle counters, it does not require calibration using NIST SRM 2806 because it directly images theparticles. To achieve the required accuracy, the LNF instrument’sCCD array is calibrated to known linear dimensions during
manufacture. Unlike normal particle counters, this negates theneed to perform an annual calibration, which usually requires theinstruments to be sent back to the factory - a big advantage foronsite labs and commercial labs alike.
Data Output FormatBecause LNF is actually two instruments in one, a particle shape
classifier and a particle counter, it provides a vast amount of information on each oil sample and all previous samples stored inits memory. Data analysis outputs are selected with a click of themouse on the desired presentation screen. The choices available tothe data analysts include:
n ISO particle count data (including ISO 4406:87, 4406:99, NAS, SAE and NAVAIR standards),
n Wear particle data summary,
n Wear particle image maps and
n Numerous trending and diagnosis graphs.
The Wear Summary screen is shown in Figure 4. In this mode,statistical information on the various wear patterns, based onparticle size and shape, is given as both actual particle counts as well as graphically. The wear mode data can also be filtered by selecting the appropriate tab to view cutting wear, sliding wear, fatigue wear or nonmetallic particles as desired. Similargraphical information for the current and all past stored samples is available with the selection of the Trend/Diagnosis tab on thebottom of the screen.
The Wear Images screen is probably the most exciting for thedata analyst and illustrates the similarities of LNF with analyticalferrography. The Wear Particle Image Map shown in Figure 5shows silhouettes for each particle detected in the sample greaterthan 20 µm in size. The particles can be selectively viewed with thesoftware filtering capability to view the selected particle types. Theimages in Figure 5 have been filtered to show only those particlesthat have been classified as fatigue particles. The characteristicpattern of minor and major chords of similar size clearly identifiesthese particles as fatigue-type particles.
Case StudiesThe LNF is a new and innovative analytical instrument that
provides invaluable information in a relatively short period of timecompared to existing technologies. Although it is new to themarket, in a short time it has already demonstrated the additionalanalytical power it brings to the market of machine conditionmonitoring through oil analysis. The LNF can be used as a complementary technique to other oil analysis instruments, or byitself as a particle shape classifier and particle counter.
Two case studies are presented to demonstrate the capabilities of the LNF.

Case I - Engine Test CellThis example is a used oil sample taken from an engine during
its break-in period and shows the synergy between LNF and moreconventional techniques such as spectrometric wear metal analysisand analytical ferrography. The LNF results clearly show the typicaland expected high levels of large wear particles during break-in.The large number of particles less than 15 µm in size is shown inthe bar graph of the wear summary screen in Figure 6 and thenumber of particles that were greater than 20 µm are shown in thecutting, severe sliding, fatigue and nonmetallic wear categories.The LNF image map of particle silhouettes for this sample isshown in Figure 7. The majority of large particles are identified byLNF and quantified in the wear summary as severe sliding andfatigue particles. This fact was confirmed by conventional analytical ferrography shown in Figure 8. Spectrometric oil analysis of this sample also showed a high level of wear metals includingaluminum, copper and silicon.
In this case, LNF confirmed that the particles were due to theengine break-in process and thus normal wear. The close agreementbetween spectrometric, ferrographic and LNF data in this caseclearly illustrates the potential for LNF at identifying activemachine wear, without the expense or subjectivity of complete ferrographic analysis.
Case II - Gearbox Accelerated Failure TestPerhaps the clearest example of the potential benefits of LNF
comes from test trials conducted at Pennsylvania State University.
Accelerated gearbox failure tests were conducted at its MechanicalDiagnostic Test Bed (MDTB) Facility under the ONR CBMprogram. These tests were conducted on single-reduction 10 hpgearboxes. The gearboxes were run-in for approximately four daysat maximum normal load provided by an electric generator on theoutput shaft. After the run-in period, a 3X overtorque was appliedand the system then run to failure. The system was stopped approx-imately every two hours for bore site inspection and oil sampling.
LNF results from one run are shown in Figure 9. In Figure 9a,histograms of the total particle concentrations are shown fordifferent particle size ranges. Corresponding bars in the four sizeranges are from the same sample. Oil samples were drawn atsuccessive times during the test as indicated in the figures. A similarset of data for the particles classified as fatigue, severe sliding andcutting wear are shown in Figures 9b, 9c and 9d, respectively. Allparticle concentrations are corrected for fluid dilution as thegearbox lubrication level was topped off with clean oil to replaceeach extracted sample.
The first sample in Figure 9 was taken at the end of the run-in period, with successive samples taken during overtorqueoperation. The sample location was changed between the 2 p.m.and 4 p.m. samples, accounting for the change in total particlescounted at those two sample times. Near the end of the test, severalteeth on the output gear broke before the 5 a.m. sample.
In Figure 9a, the total particle concentration in the 5 to 15 µm size range shows a general decrease during the run, whichwas due to gradual removal of debris generated during the run-inperiod as samples were drawn and replaced with clean fluid.
Comparison to FerrographyFerrography has long been a standard method for deter-
mining the type of wear mechanisms and severity of faultsin lubricated machinery. The drawbacks of ferrography havebeen threefold: First, the test is time consuming; second, formeaningful results a trained analyst is required; and third,the ultimate result is strictly qualitative. Each analyst has hisown methodology and preferences for analyzing a preparedslide. Even though most oil analysis labs diligently train theiranalysts to think the same, the inconsistencies are still
present and even more obvious from lab to lab. Analysts donot have time to characterize and count all the large wearand debris particles that are on a typical slide. This is whereLNF bridges the gap, providing insight into wear mecha-nisms and fault severity in a fraction of the time and withoutthe need for a highly trained analyst. LNF counts and classi-fies all particles in its viewing cell to provide quantitative,repeatable measurements useful for trending and the earlyassessment of machine condition.
Automation
Not Available
OptionalSampleChanger
Results
SubjectiveQualitative
Qualitative(Wear Particle
Counts)
OperatorSkill Level
High(Analyst)
Same asParticleCounter
Free Water
Not Detectable
IDs Separate
Ferrous /Nonferrous
ID
Color /HotplateChanges
None
Debris ID
Morphologyand Surface
Features
Morphology
AnalysisTime
5 to 15Minutes
2.3 Minutes
Prep Time
20 Minutes
2.5 Minutes
AnalyticalFerrography
LaserNetFines
Table 1. LNF Compared to Ferrography

Figure 7. Image Map for Engine Test Cell Sample
Figure 5. Sample Wear Images Screen
Figure 4. Sample Wear Summary Screen
Figure 6. Wear Summary Screen

Figure 9. Gearbox Particle Concentration DistributionsFigure 8. Ferrograms Showing Severe Sliding
Wear and Copper Particle During Break-in
In Figure 9b, however, an increasing concentration of fatigueparticles are seen in several of the size ranges after the 3X over -torque was applied. This behavior is apparent well in advance of theultimate failure and is probably related to the excess wear conditionsthat lead to failure. Similar increases in the concentration of severesliding and cutting wear particles were not seen in any of the sizeranges (Figures 9c and 9d). An increase of fatigue particles wouldbe expected in such an overtorque situation where excessive force isconcentrated along the gear pitch line where rolling action occurs.
While this case involves laboratory-based studies, fatigue failurein gear applications is an all-too-familiar problem frequentlyencountered in heavily loaded equipment. Based on the Penn Stateresults, there is no reason why LNF could not be used to routinelydiagnose similar problems in the field.
The LNF is a unique analytical instrument and method thatcombines automatic particle shape classification and particlecounting, two essential functions of used oil particle analysis.
As the case studies illustrate, by combining these two function-alities, early signs of potential problems can be detected throughincreases in overall particle concentrations, and at the same time,the possible root cause of the problem can be diagnosed from theshape classifications. Similar in nature to complete analyticalferrography, LNF offers a unique insight into active machine wear,without the qualitative subjectivity and potential cost of compre -hensive ferrographic analysis.
