ferrography wear particles image recognition based...
TRANSCRIPT
Research ArticleFerrography Wear Particles Image Recognition Based onExtreme Learning Machine
Qiong Li, Tingting Zhao, Lingchao Zhang, Wenhui Sun, and Xi Zhao
College of Computer Science and Information Engineering, Tianjin University of Science and Technology, Tianjin 300457, China
Correspondence should be addressed to Xi Zhao; [email protected]
Received 25 November 2016; Accepted 13 February 2017; Published 21 March 2017
Academic Editor: Hui Cheng
Copyright © 2017 Qiong Li et al.This is an open access article distributed under the Creative Commons Attribution License, whichpermits unrestricted use, distribution, and reproduction in any medium, provided the original work is properly cited.
The morphology of wear particles reflects the complex properties of wear processes involved in particle formation. Typically, themorphology of wear particles is evaluated qualitatively based on microscopy observations. This procedure relies upon the experts’knowledge and, thus, is not always objective and cheap. With the rapid development of computer image processing technology,neural network based on traditional gradient training algorithm can be used to recognize them. However, the feedforward neuralnetwork based on traditional gradient training algorithms for image segmentation creates many issues, such as needing multipleiterations to converge and easy fall into local minimum, which restrict its development heavily. Recently, extreme learningmachine(ELM) for single-hidden-layer feedforward neural networks (SLFN) has been attracting attentions for its faster learning speedand better generalization performance than those of traditional gradient-based learning algorithms. In this paper, we propose toemploy ELM for ferrography wear particles image recognition. We extract the shape features, color features, and texture featuresof five typical kinds of wear particles as the input of the ELM classifier and set five types of wear particles as the output of the ELMclassifier. Therefore, the novel ferrography wear particle classifier is founded based on ELM.
1. Introduction
Wear particle analysis for machine condition monitoringand fault diagnosis is not a new topic in tribology. Roy-lance et al. [1] pioneered computer wear pattern recogni-tion research direction by establishing the computer aidedvisual engineering (CAVE) to extract the wear particles’Fourier factor, roundness factor, and edge details. Then, theyused these features to classify portion wear particles [2–7]. Hamblin and Stachowiak proposed the spike parameterto extract characteristics of abrasive particles via adequatedescription of wear debris boundary in multiscale [8]. Xuet al. [9] developed a set of wear particle image analysissystem through the integration of neural network and expertsystem, which can realize the interactive wear particles imageautomatic recognition. Tian et al. [10] and Peng and Kirk[11] employed laser scanning confocal microscopy to acquirethree-dimensional particle images. The scanning methodprovides surface information from the analysis of wearsurfacemorphology, which facilitates better understanding of
wear features and wear level. Stachowiak et al. [12] utilizedan automated classification system to analyze and identifyfatigue, abrasive, and adhesive wear particles. Such analysisand identification operations were fulfilled mainly based onthe analyses of the area perimeter, elongation parameters,convexity, and surface texture. van Otterlo [13] distinguisheddifferent points on the curve of an object boundary by meansof the proposed parameters, which might represent pointswith respect to a reference position in polar coordinatesystem. This approach provided a unified theoretical basisfor analyzing shape similarity according to the proposedparametric contour representations. Laghari and Memondeveloped an automatic analysis system, KBWPAS, to reducethe dependence on domain experts [14]. Wang combinedprincipal component analysis and gray relational analysisto optimize the parameters of features of wear particles[15]. Wang and Yin used wear particle shape, color, andsurface texture parameters as input vectors and introducedradial basis function neural network to conduct automaticclassification and identification on wear particle [16]. Gu
HindawiJournal of Electrical and Computer EngineeringVolume 2017, Article ID 3451358, 6 pageshttps://doi.org/10.1155/2017/3451358
2 Journal of Electrical and Computer Engineering
applied support vector machine to ferrography wear par-ticle pattern recognition and built wear particle classifierbased on supper vector machine [17]. Yuan and Yan tooksurface texture and surface roughness as the importantindicators of three-dimensional surface characteristic andadopted artificial intelligent neural network method to iden-tify wear particle type, which efficiently improved accuracyof wear particle classification [18]. Luo et al. proposed touse principal component analysis to extract characteristicparameters of wear particles and then introduced BP neuralnetwork to conduct automatic classification onwear particles.This method optimized parameters firstly, which yieldedbetter classification rate compared to traditional BP neuralnetwork [19]. Zhou et al. used the same method to optimizeparameters of wear particle features and applied the improvedgenetic algorithms to the LS-SVM’s parameter optimization,thus improving wear particle recognition rate [20].
At present, a lot of image classification algorithms havebeen proposed, among which the neural network basedimage classification algorithms are widely used. However, thetraditional feedforward neural networks need many itera-tions to converge and are easy to fall into the local optimumin the procession of image classification, which seriouslylimit its development and application. On the other hand,the extreme learning machine as a new machine learningalgorithm has become more and more popular due to itsfew adjustable parameters, fast learning speed, and goodgeneralization performance. However, the effectiveness of theapplication of ELM to the field of image processing of ironspectrum abrasive particles is open to be investigated. In thispaper, we present the method to apply the extreme learningmachine to the recognition of wear particles.
The rest of the paper is organized as follows. Section 2introduces principles and methods used in this paper. InSection 3, we describe the proposedmethod. In Section 4, wedescribe the experiments. Section 5 finalizes the paper withthe conclusions.
2. Principle and Method
2.1. Characteristic Parameters of Wear Particles. Generally,characteristic parameters play important role in the finalresult of wear particles recognition. Although the obtainedferroscope images of wear particles are not three-dimen-sional, the size, texture, and color features are enough fortypical wear particles recognition.
Among the shape and size factors of wear particles, area,perimeter, equivalent circle diameter, circularity, aspect ratio,concavity, and so on are commonly used features to beextracted from the color images, which are captured via themicroscope. These shape and size parameters can be furtherapproximated by converting the sample color image intobinary image with the values of 0 and 1.
Besides the shape and size parameters, texture is also veryimportant in image analysis. The texture is the description ofthe pixel distribution of a picture in gray space. Machines orequipment with a pair of relatively moving contact surfacesfor long-time operation tends to produce wear particles.Usually, the surface texture provides statistical information of
the wear state in the machinery operation process. Texturalfeatures are investigated by using the distribution functionto analyze the gray level of the characteristic region ofwear particles. Among the parameters of wear particles, twoof the characteristic features are employed to distinguishthe surface texture, namely, roughness and directivity. Graylevel cooccurrence matrix (GLCM) [21] is commonly usedto describe the surface textural factors of wear particles.The textural features, including energy, entropy, dependency,inertia moment, and stability, can be extracted by employingthe GLCM. However, the connection between the obtainedtextural features and human vision perceptual system has notbeen established. Based on the psychological representationof human vision perception to the texture, Tamura et al. pro-posed the expression of the textural feature, Tamura texturalfeature [22], which can be used to extract six properties ofthe textural features, contrast ratio, roughness, direction level,regularity, linearity, and coarseness.Moreover, we have foundthat HoG gives a good simulation of the variation of theparticle images [23]. The histogram of oriented gradient forthe local region of the wear particle images can be calculatedby using HoG.
Color feature is another kind of significant properties toanalyze wear particle images.The color factor is important forthe identification of the red oxides, black oxides, and fatiguedcopper wear particles. By analyzing the color of the wearparticles, mechanical abrasion degree can be predicted. Theimage commonly consisted of three-primary colors of red(R), green (G), and blue (B). In the RGB space, the three-colorfactors of R(�푖, �푗), G(�푖, �푗), and B(�푖, �푗) denote the color featuresof wear particles. After the images of wear particles areprocessed, the first-order and second-order statistical values(mean and variance) of R(�푖, �푗), G(�푖, �푗), and B(�푖, �푗) and thethird-order color matrix of the HSV color space are extractedas the color characteristic parameters.
2.2. Extreme Learning Machine. The extreme learning ma-chine (ELM) algorithm was originally proposed by Huanget al. [24–27]. The method is proved to be a universalapproximator given enough hidden neurons [28]. It works asfollows.
Consider a set of�푁 distinct samples (�푥𝑖, �푡𝑖) with �푥𝑖 ∈ �푅𝑑and �푡𝑖 ∈ �푅𝑐. Then a single layer feedforward network with �퐿hidden neurons is modeled as
𝐿∑𝑖=1
�훽𝑖�휙 (wixj + �푏𝑖) , �푗 ∈ [1,�푁] (1)
with �휙 being an activation function, wi the input weights, �푏𝑖the biases, and �훽𝑖 the output weights.
In the case where the single layer feedforward networkwould perfectly approximate the data, the errors betweenthe estimated outputs �푦𝑖 and the targets �푡𝑖 are zero, and therelation between inputs, weights, and targets is
𝐿∑𝑖=1
�훽𝑖�휙 (wixj + �푏𝑖) = �푡𝑖, �푗 ∈ [1,�푁] (2)
Journal of Electrical and Computer Engineering 3
Database
Preprocessing
Preprocessing
Feature extraction
Feature extraction
Train the ELM classi�er
Recognition
Train samples
Test samples
Figure 1: Wear particles recognition based on ELM
which can be written compactly asH�훽 = T, withH = (�휙 (w1x1 + �푏1) ⋅ ⋅ ⋅ �휙 (w𝐿x1 + �푏𝐿)... d
...�휙 (w1x𝑁 + �푏1) ⋅ ⋅ ⋅ �휙 (w𝐿x𝑁 + �푏𝐿))�훽 = (�훽𝑇1 ⋅ ⋅ ⋅ �훽𝑇𝐿) ,�푇 = (�푡𝑇1 ⋅ ⋅ ⋅ �푡𝑇𝑁) .(3)
Finding the output weights �훽 from the hidden layeroutputs H and targets is a linear regression problem. In thegeneral case of�푁 ̸= �푑, a minimum �퐿2-norm solution is givenby the Moore-Penrose generalized inverse, or pseudoinverse,of the matrix H denoted as H† [29]. The training of ELMrequires no iterations, and the most computational efficientpart is the calculation of the pseudoinverse of the matrixH(𝑁𝑠𝐿), which makes ELM an extremely fast artificial neuralnetworks method.
3. Proposed Method
Extreme learning machine (ELM) is a new machine learningalgorithm. It is increasingly favored by many researchersdue to its simple structure, fast learning speed, and goodgeneralization performance.This part will introduce extremelearning machine (ELM) method into the wear particlesimage recognition.The specific flow chart is shown in Figure 1
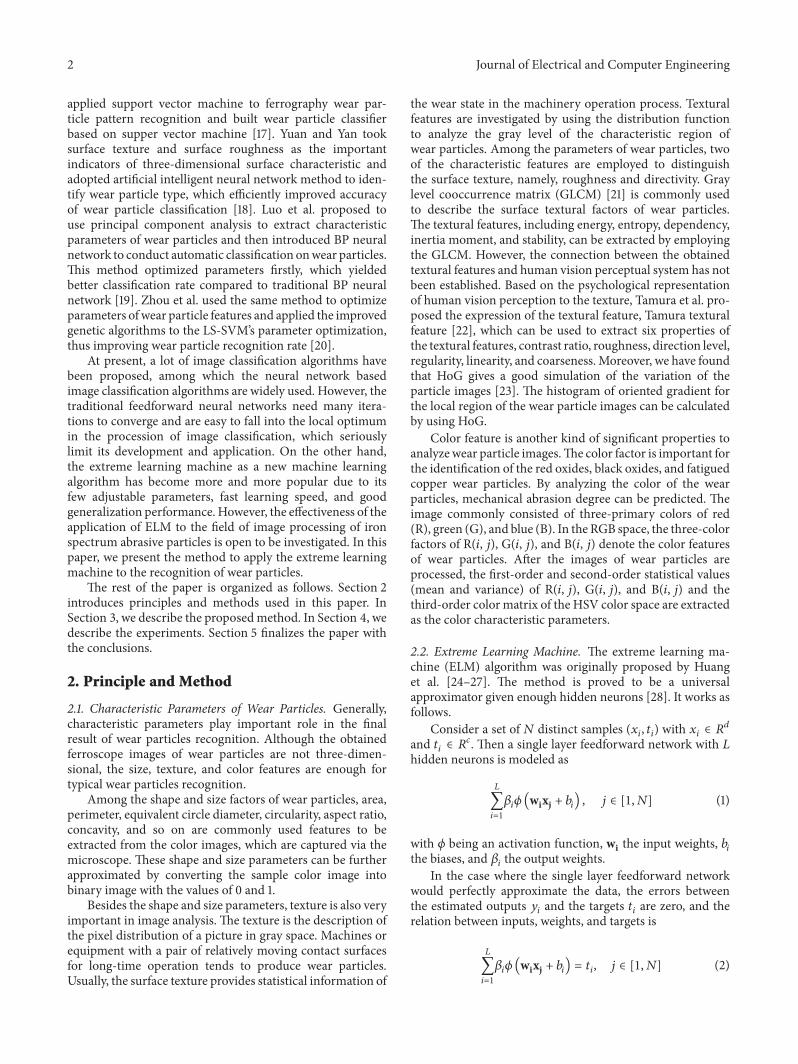
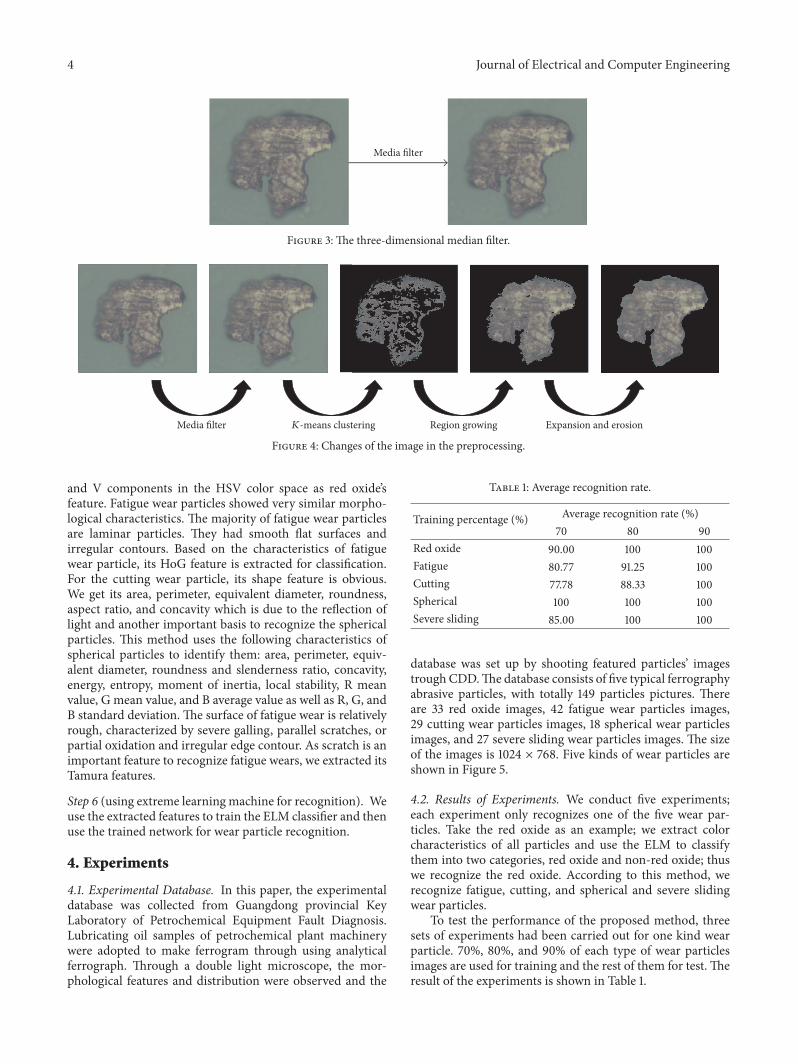
The exact procedures are as follows:Thefirst four steps areimage preprocessing as shown in Figure 2, which include thesteps of 3D media filter, �퐾-means clustering segmentation,region growing,morphology expansion, and erosion; the fifthstep is feature extraction and the last step is recognition.
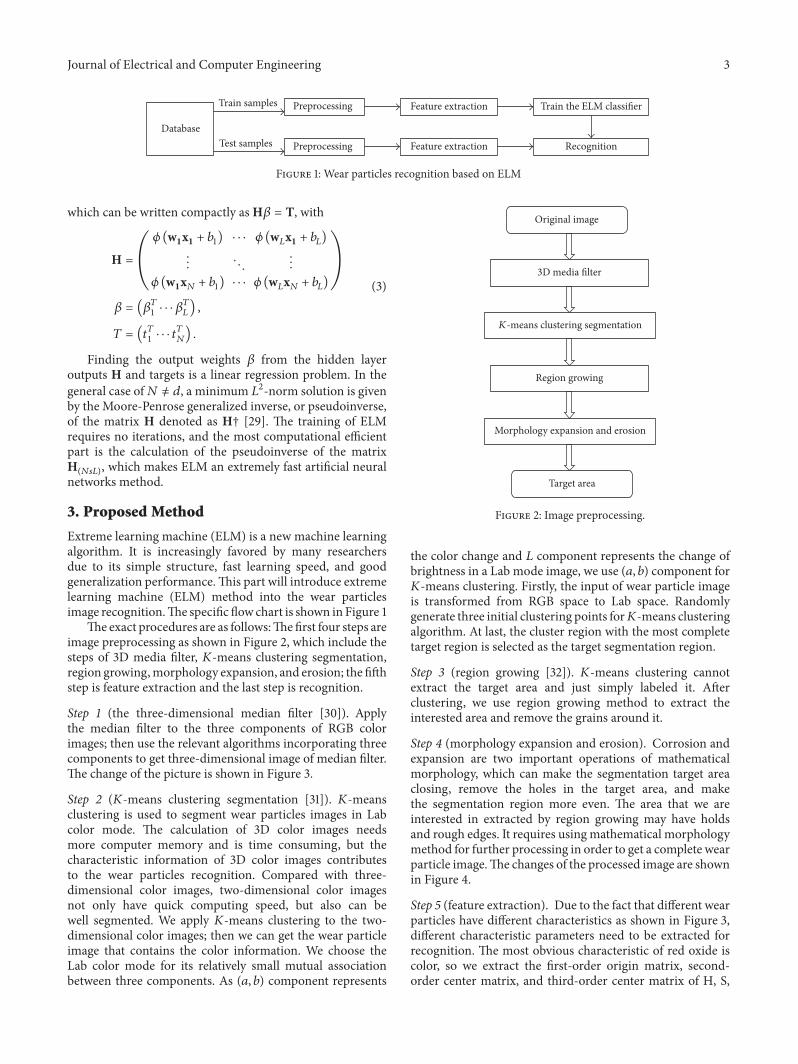
Step 1 (the three-dimensional median filter [30]). Applythe median filter to the three components of RGB colorimages; then use the relevant algorithms incorporating threecomponents to get three-dimensional image of median filter.The change of the picture is shown in Figure 3.
Step 2 (�퐾-means clustering segmentation [31]). �퐾-meansclustering is used to segment wear particles images in Labcolor mode. The calculation of 3D color images needsmore computer memory and is time consuming, but thecharacteristic information of 3D color images contributesto the wear particles recognition. Compared with three-dimensional color images, two-dimensional color imagesnot only have quick computing speed, but also can bewell segmented. We apply �퐾-means clustering to the two-dimensional color images; then we can get the wear particleimage that contains the color information. We choose theLab color mode for its relatively small mutual associationbetween three components. As (�푎, �푏) component represents
Original image
3D media �lter
K-means clustering segmentation
Region growing
Morphology expansion and erosion
Target area
Figure 2: Image preprocessing.
the color change and �퐿 component represents the change ofbrightness in a Lab mode image, we use (�푎, �푏) component for�퐾-means clustering. Firstly, the input of wear particle imageis transformed from RGB space to Lab space. Randomlygenerate three initial clustering points for�퐾-means clusteringalgorithm. At last, the cluster region with the most completetarget region is selected as the target segmentation region.
Step 3 (region growing [32]). �퐾-means clustering cannotextract the target area and just simply labeled it. Afterclustering, we use region growing method to extract theinterested area and remove the grains around it.
Step 4 (morphology expansion and erosion). Corrosion andexpansion are two important operations of mathematicalmorphology, which can make the segmentation target areaclosing, remove the holes in the target area, and makethe segmentation region more even. The area that we areinterested in extracted by region growing may have holdsand rough edges. It requires using mathematical morphologymethod for further processing in order to get a complete wearparticle image.The changes of the processed image are shownin Figure 4.
Step 5 (feature extraction). Due to the fact that different wearparticles have different characteristics as shown in Figure 3,different characteristic parameters need to be extracted forrecognition. The most obvious characteristic of red oxide iscolor, so we extract the first-order origin matrix, second-order center matrix, and third-order center matrix of H, S,
4 Journal of Electrical and Computer Engineering
Media �lter
Figure 3: The three-dimensional median filter.
Media �lter K-means clustering Region growing Expansion and erosion
Figure 4: Changes of the image in the preprocessing.
and V components in the HSV color space as red oxide’sfeature. Fatigue wear particles showed very similar morpho-logical characteristics. The majority of fatigue wear particlesare laminar particles. They had smooth flat surfaces andirregular contours. Based on the characteristics of fatiguewear particle, its HoG feature is extracted for classification.For the cutting wear particle, its shape feature is obvious.We get its area, perimeter, equivalent diameter, roundness,aspect ratio, and concavity which is due to the reflection oflight and another important basis to recognize the sphericalparticles. This method uses the following characteristics ofspherical particles to identify them: area, perimeter, equiv-alent diameter, roundness and slenderness ratio, concavity,energy, entropy, moment of inertia, local stability, R meanvalue, G mean value, and B average value as well as R, G, andB standard deviation. The surface of fatigue wear is relativelyrough, characterized by severe galling, parallel scratches, orpartial oxidation and irregular edge contour. As scratch is animportant feature to recognize fatigue wears, we extracted itsTamura features.
Step 6 (using extreme learning machine for recognition). Weuse the extracted features to train the ELM classifier and thenuse the trained network for wear particle recognition.
4. Experiments
4.1. Experimental Database. In this paper, the experimentaldatabase was collected from Guangdong provincial KeyLaboratory of Petrochemical Equipment Fault Diagnosis.Lubricating oil samples of petrochemical plant machinerywere adopted to make ferrogram through using analyticalferrograph. Through a double light microscope, the mor-phological features and distribution were observed and the
Table 1: Average recognition rate.
Training percentage (%) Average recognition rate (%)70 80 90
Red oxide 90.00 100 100Fatigue 80.77 91.25 100Cutting 77.78 88.33 100Spherical 100 100 100Severe sliding 85.00 100 100
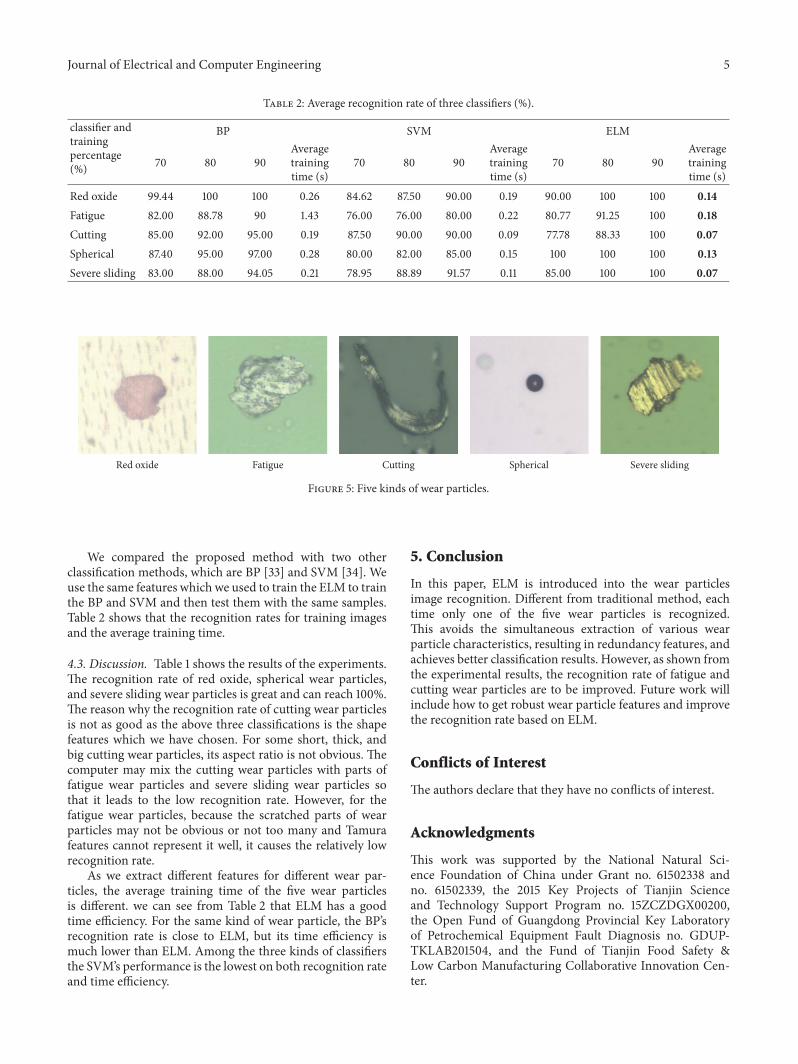
database was set up by shooting featured particles’ imagestrough CDD.The database consists of five typical ferrographyabrasive particles, with totally 149 particles pictures. Thereare 33 red oxide images, 42 fatigue wear particles images,29 cutting wear particles images, 18 spherical wear particlesimages, and 27 severe sliding wear particles images. The sizeof the images is 1024 × 768. Five kinds of wear particles areshown in Figure 5.
4.2. Results of Experiments. We conduct five experiments;each experiment only recognizes one of the five wear par-ticles. Take the red oxide as an example; we extract colorcharacteristics of all particles and use the ELM to classifythem into two categories, red oxide and non-red oxide; thuswe recognize the red oxide. According to this method, werecognize fatigue, cutting, and spherical and severe slidingwear particles.
To test the performance of the proposed method, threesets of experiments had been carried out for one kind wearparticle. 70%, 80%, and 90% of each type of wear particlesimages are used for training and the rest of them for test. Theresult of the experiments is shown in Table 1.
Journal of Electrical and Computer Engineering 5
Table 2: Average recognition rate of three classifiers (%).
classifier andtrainingpercentage(%)
BP SVM ELM
70 80 90Averagetrainingtime (s)
70 80 90Averagetrainingtime (s)
70 80 90Averagetrainingtime (s)
Red oxide 99.44 100 100 0.26 84.62 87.50 90.00 0.19 90.00 100 100 0.14Fatigue 82.00 88.78 90 1.43 76.00 76.00 80.00 0.22 80.77 91.25 100 0.18Cutting 85.00 92.00 95.00 0.19 87.50 90.00 90.00 0.09 77.78 88.33 100 0.07Spherical 87.40 95.00 97.00 0.28 80.00 82.00 85.00 0.15 100 100 100 0.13Severe sliding 83.00 88.00 94.05 0.21 78.95 88.89 91.57 0.11 85.00 100 100 0.07
Red oxide Fatigue Cutting Spherical Severe sliding
Figure 5: Five kinds of wear particles.
We compared the proposed method with two otherclassification methods, which are BP [33] and SVM [34]. Weuse the same features which we used to train the ELM to trainthe BP and SVM and then test them with the same samples.Table 2 shows that the recognition rates for training imagesand the average training time.
4.3. Discussion. Table 1 shows the results of the experiments.The recognition rate of red oxide, spherical wear particles,and severe sliding wear particles is great and can reach 100%.The reason why the recognition rate of cutting wear particlesis not as good as the above three classifications is the shapefeatures which we have chosen. For some short, thick, andbig cutting wear particles, its aspect ratio is not obvious. Thecomputer may mix the cutting wear particles with parts offatigue wear particles and severe sliding wear particles sothat it leads to the low recognition rate. However, for thefatigue wear particles, because the scratched parts of wearparticles may not be obvious or not too many and Tamurafeatures cannot represent it well, it causes the relatively lowrecognition rate.
As we extract different features for different wear par-ticles, the average training time of the five wear particlesis different. we can see from Table 2 that ELM has a goodtime efficiency. For the same kind of wear particle, the BP’srecognition rate is close to ELM, but its time efficiency ismuch lower than ELM. Among the three kinds of classifiersthe SVM’s performance is the lowest on both recognition rateand time efficiency.
5. Conclusion
In this paper, ELM is introduced into the wear particlesimage recognition. Different from traditional method, eachtime only one of the five wear particles is recognized.This avoids the simultaneous extraction of various wearparticle characteristics, resulting in redundancy features, andachieves better classification results. However, as shown fromthe experimental results, the recognition rate of fatigue andcutting wear particles are to be improved. Future work willinclude how to get robust wear particle features and improvethe recognition rate based on ELM.
Conflicts of Interest
The authors declare that they have no conflicts of interest.
Acknowledgments
This work was supported by the National Natural Sci-ence Foundation of China under Grant no. 61502338 andno. 61502339, the 2015 Key Projects of Tianjin Scienceand Technology Support Program no. 15ZCZDGX00200,the Open Fund of Guangdong Provincial Key Laboratoryof Petrochemical Equipment Fault Diagnosis no. GDUP-TKLAB201504, and the Fund of Tianjin Food Safety &Low Carbon Manufacturing Collaborative Innovation Cen-ter.
6 Journal of Electrical and Computer Engineering
References
[1] B. J. Roylance, I. A. Albirdewi, and M. S. Laghari, “Computer-aided vision engineering (CAVE): quantification of wear parti-cle morphology,” Lubrication Engineering, vol. 50, no. 2, pp. 111–116, 1994.
[2] S. Raadnui and B. J. Roylance, “The classification of wearparticle shape,” Lubrication Engineering, vol. 51, no. 5, pp. 432–437, 1995.
[3] K. K. Yeung, A. J. McKenzie, D. Liew, and G. A. Luoma,“Development of computer-aided image analysis for filter debrisanalysis,” Lubrication Engineering, vol. 50, no. 4, pp. 293–299,1994.
[4] F. T. Barwell, “The contribution of particle analysis to the studyof wear of metals,”Wear, vol. 90, no. 1, pp. 167–181, 1983.
[5] A. D. H. Thomas, T. Davies, and A. R. Luxmoore, “Computerimage analysis for identification of wear particles,” Wear, vol.142, no. 2, pp. 213–226, 1991.
[6] T. Pancewicz and I. Mruk, “Holographic contouring for deter-mination of three-dimensional description of surface rough-ness,”Wear, vol. 199, no. 1, pp. 127–131, 1996.
[7] T. B. Kirk, G. W. Stachowiak, and A. W. Batchelor, “Fractalparameters and computer image analysis applied to wearparticles isolated by ferrography,”Wear, vol. 145, no. 2, pp. 347–365, 1991.
[8] M.G.Hamblin andG.W. Stachowiak, “Amulti-scalemeasure ofparticle abrasivity, and its relation to two-body abrasive wear,”Wear, vol. 190, no. 2, pp. 190–196, 1995.
[9] K. Xu, A. R. Luxmoore, L. M. Jones, and F. Deravi, “Integrationof neural networks and expert systems for microscopic wearparticle analysis,” Knowledge-Based Systems, vol. 11, no. 3-4, pp.213–227, 1998.
[10] Y. Tian, J. Wang, Z. Peng, and X. Jiang, “A new approach tonumerical characterisation of wear particle surfaces in three-dimensions for wear study,”Wear, vol. 282-283, pp. 59–68, 2012.
[11] Z. Peng and T. B. Kirk, “Computer image analysis of wear par-ticles in three-dimensions for machine condition monitoring,”Wear, vol. 223, no. 1-2, pp. 157–166, 1998.
[12] G. P. Stachowiak, G. W. Stachowiak, and P. Podsiadlo, “Auto-mated classification of wear particles based on their surfacetexture and shape features,” Tribology International, vol. 41, no.1, pp. 34–43, 2008.
[13] P. J. van Otterlo, A Contour Oriented Approach to Digital ShapeAnalysis, Kluver, Amsterdam, The Netherlands, 1988.
[14] M. S. Laghari and Q. A. Memon, “Knowledge based wear par-ticle analysis,” International Journal of Information Technology,vol. 1, no. 3, pp. 91–95, 2004.
[15] J. Q. Wang and X. L. Wang, “A wear particle identificationmethod by combining principal component analysis and greyrelational analysis,”Wear, vol. 304, no. 1-2, pp. 96–102, 2013.
[16] W.H.Wang andY.H. Yin, “Abrasive identification system basedon radial basis function neural network,” Tribology, vol. 123, no.4, pp. 340–343, 2003.
[17] D. Q. Gu, “Ferrography wear pattern recognition based onsupport vector machine,” ChinaMechanical Engineering, vol. 17,no. 13, pp. 1391–1394, 2006.
[18] C. Q. Yuan and X. P. Yan, “Recognition of the type of abrasive,”Lubrication, vol. 32, no. 3, pp. 21–23, 2007.
[19] B. H. Luo, Y. W. Huang, and Y. F. Liu, “Wear particles iden-tification based PCA-BP neural network,” Lubrication, vol. 35,no. 6, pp. 117–120, 2010.
[20] W. Zhou, B. Jing, and S. Deng, “Aeroengine abrasive identifica-tion based on IGA and LS-SVM,” Lubrication, vol. 38, no. 1, pp.14–18, 2013.
[21] R. M. Haralick, I. Dinstein, and K. Shanmugam, “Texturalfeatures for image classification,” IEEE Transactions on Systems,Man and Cybernetics, vol. 3, no. 6, pp. 610–621, 1973.
[22] B. H. Tamura, S. Mori, and T. Yamawaki, “Texture featurescorresponding to visual perception,” IEEE Transactions onSystems, Man, and Cybernetics, vol. 8, no. 6, pp. 460–473, 1978.
[23] N. Dalal and B. Triggs, “Histograms of oriented gradients forhuman detection,” in Proceedings of the IEEE Computer SocietyConference on Computer Vision and Pattern Recognition (CVPR’05), vol. 1, pp. 886–893, IEEE, SanDiego, Calif, USA, June 2005.
[24] G.-B. Huang, Q.-Y. Zhu, K. Z. Mao, C.-K. Siew, P. Saratchan-dran, and N. Sundararajan, “Can threshold networks be traineddirectly?” IEEE Transactions on Circuits and Systems II: ExpressBriefs, vol. 53, no. 3, pp. 187–191, 2006.
[25] G.-B. Huang, Q.-Y. Zhu, and C.-K. Siew, “Extreme learningmachine: theory and applications,”Neurocomputing, vol. 70, no.1–3, pp. 489–501, 2006.
[26] Y. Miche, M. van Heeswijk, P. Bas, O. Simula, and A. Lendasse,“TROP-ELM: a double-regularized ELM using LARS andTikhonov regularization,” Neurocomputing, vol. 74, no. 16, pp.2413–2421, 2011.
[27] G.-B. Huang, H. Zhou, X. Ding, and R. Zhang, “Extremelearning machine for regression and multiclass classification,”IEEE Transactions on Systems, Man, and Cybernetics, Part B:Cybernetics, vol. 42, no. 2, pp. 513–529, 2012.
[28] G.-B. Huang, L. Chen, and C.-K. Siew, “Universal approxima-tion using incremental constructive feedforward networks withrandom hidden nodes,” IEEE Transactions on Neural Networks,vol. 17, no. 4, pp. 879–892, 2006.
[29] C. R. Rao and S. K. Mitra, Generalized Inverse of a Matrix andIts Applications, John Wiley & Sons, Berkeley, Calif, USA, 1971.
[30] W. Yu, Y. Ma, L. Zheng et al., “Research of improved adaptivemedian filter algorithm,” in Proceedings of the 2015 InternationalConference on Electrical and Information Technologies for RailTransportation (EITRT ’15), Springer, Hunan Province, China,2016.
[31] J. A. Hartigan and M. A. Wong, “A K-means clustering algo-rithm,” Applied Statistics, vol. 28, no. 1, pp. 100–108, 2013.
[32] S.-Y.Wan andW. E.Higgins, “Symmetric region growing,” IEEETransactions on Image Processing, vol. 12, no. 9, pp. 1007–1015,2003.
[33] D. E. Rumelhart, G. E. Hinton, and R. J. Williams, “Learningrepresentations by back-propagating errors,” in Neurocomput-ing: Foundations of Research, pp. 533–536, MIT Press, Cam-bridge, Mass, USA, 1986.
[34] C. Cortes and V. Vapnik, “Support-vector networks,” MachineLearning, vol. 20, no. 3, pp. 273–297, 1995.

International Journal of
AerospaceEngineeringHindawi Publishing Corporationhttp://www.hindawi.com Volume 2014
RoboticsJournal of
Hindawi Publishing Corporationhttp://www.hindawi.com Volume 2014
Hindawi Publishing Corporationhttp://www.hindawi.com Volume 2014
Active and Passive Electronic Components
Control Scienceand Engineering
Journal of
Hindawi Publishing Corporationhttp://www.hindawi.com Volume 2014
International Journal of
RotatingMachinery
Hindawi Publishing Corporationhttp://www.hindawi.com Volume 2014
Hindawi Publishing Corporation http://www.hindawi.com
Journal ofEngineeringVolume 2014
Submit your manuscripts athttps://www.hindawi.com
VLSI Design
Hindawi Publishing Corporationhttp://www.hindawi.com Volume 2014
Hindawi Publishing Corporationhttp://www.hindawi.com Volume 2014
Shock and Vibration
Hindawi Publishing Corporationhttp://www.hindawi.com Volume 2014
Civil EngineeringAdvances in
Acoustics and VibrationAdvances in
Hindawi Publishing Corporationhttp://www.hindawi.com Volume 2014
Hindawi Publishing Corporationhttp://www.hindawi.com Volume 2014
Electrical and Computer Engineering
Journal of
Advances inOptoElectronics
Hindawi Publishing Corporation http://www.hindawi.com
Volume 2014
The Scientific World JournalHindawi Publishing Corporation http://www.hindawi.com Volume 2014
SensorsJournal of
Hindawi Publishing Corporationhttp://www.hindawi.com Volume 2014
Modelling & Simulation in EngineeringHindawi Publishing Corporation http://www.hindawi.com Volume 2014
Hindawi Publishing Corporationhttp://www.hindawi.com Volume 2014
Chemical EngineeringInternational Journal of Antennas and
Propagation
International Journal of
Hindawi Publishing Corporationhttp://www.hindawi.com Volume 2014
Hindawi Publishing Corporationhttp://www.hindawi.com Volume 2014
Navigation and Observation
International Journal of
Hindawi Publishing Corporationhttp://www.hindawi.com Volume 2014
DistributedSensor Networks
International Journal of