spectral tuning of dichromats to natural sceneschiao/vr2000.pdfspectral tuning of dichromats to...
TRANSCRIPT

Vision Research 40 (2000) 3257–3271
Spectral tuning of dichromats to natural scenes
Chuan-Chin Chiao a,*, Misha Vorobyev a,b, Thomas W. Cronin a, Daniel Osorio c
a Department of Biological Sciences, Uni6ersity of Maryland, Baltimore County, 1000 Hilltop Circle, Baltimore, MD 21250, USAb Institut fur Neurobiologie, Freie Uni6ersitat Berlin, Konigin-Luise-Str. 28-30, 14195 Berlin, Germany
c School of Biological Sciences, Uni6ersity of Sussex, Brighton BN1 9QG, UK
Received 3 January 2000; received in revised form 16 May 2000
Abstract
Multispectral images of natural scenes were collected from both forests and coral reefs. We varied the wavelength position ofreceptors in hypothetical dichromatic visual systems and, for each receptor pair estimated the percentage of discriminable pointsin natural scenes. The optimal spectral tuning predicted by this model results in photoreceptor pairs very like those of forestdwelling, dichromatic mammals and of coral reef fishes. Variations of the natural illuminants in forests have little or no effect onoptimal spectral tuning, but variations of depth in coral reefs have moderate effects on the spectral placement of S and L cones.The ratio of S and L cones typically found in dichromatic mammals reduces the discriminability of forest scenes; in contrast, thetypical ratio of S and L cones in coral reef fishes achieves nearly the optimal discrimination in coral reef scenes. © 2000 ElsevierScience Ltd. All rights reserved.
Keywords: Spectral tuning; Natural scene; Color vision; Dichromacy; Visual ecology
www.elsevier.com/locate/visres
1. Introduction
Color vision systems of animals differ both in thenumber of visual pigments and in their spectral loca-tions. Such differences may reflect adaptations of ani-mals to their current photic environments as well astheir evolutionary history. One might ask which factorscould influence the evolutionary tuning of visual pig-ments, and also how well the pigments of extant ani-mals are tuned for coding colors of the naturalenvironment (Lythgoe, 1979). A minimum of two visualpigments is needed for color vision, producing thesimplest color vision system: dichromacy. Here wemodel the performance of dichromatic visual systemswith respect to their ability to discriminate colors innatural scenes. We compare the performance of hypo-thetical dichromatic systems with the performance ofthose in living dichromatic animals.
Many terrestrial and aquatic animals have dichro-matic vision. Almost all mammals, primates apart, aredichromats (Jacobs, 1981, 1993). Dichromacy is alsofound in some teleost fishes (Lythgoe & Partridge,1991). Many mammals live in forests where they lookpredominantly at leaves, bark, soil and stones. Under-water scenes which shallow-water tropical fishes see aremainly composed of algae and corals. It is tempting tohypothesize that color vision systems of a number ofanimals have been evolutionary adapted for the dis-crimination of these objects (Lythgoe & Partridge,1989, 1991). In this paper, we consider the relativeradiance spectra of objects in forest and coral reefscenes. Terrestrial habitats differ from aquatic onesboth in object reflection and in illumination spectra.Therefore terrestrial and aquatic habitats must be ana-lyzed separately.
Several researchers have used model computations toassess the capacity of color vision with respect to thecolors of natural environment. Lythgoe and Partridge(1991) measured the reflectance spectra of differentcolored algae, and found an optimal dichromatic set ofreceptors for coastal water fishes to discriminate amongthem. Reflectance spectra of leaves and items fromforest litter were also used to model tuning of visual
Abbre6iations: L, long-wavelength-sensitive cones; S, short-wave-length-sensitive cones.
* Corresponding author. Present address: Howard Hughes MedicalInstitute, 50 Blossom Street, Wellman 429, Massachusetts GeneralHospital, Boston, MA 02114, USA. Tel.: +1-617-7263888; fax:+1-617-7265336.
E-mail address: [email protected] (C.-C. Chiao).
0042-6989/00/$ - see front matter © 2000 Elsevier Science Ltd. All rights reserved.PII: S 0 0 4 2 -6989 (00 )00156 -5

C.-C. Chiao et al. / Vision Research 40 (2000) 3257–32713258
pigments in dichromatic forest-dwelling animals (Lyth-goe & Partridge, 1989; Osorio & Vorobyev, 1996) andin trichromatic primates (Osorio & Bossomaier, 1992).Fruit and leaf spectra have been used to assess theadvantage of primate trichromacy for finding food(Osorio & Vorobyev, 1996; Regan et al., 1998). Flowerspectra were analyzed with respect to the question ofevolution of color vision in insects (Chittka & Menzel,1992; Vorobyev & Menzel, 1999).
While it seems reasonable to assume that visualsystems evolve to distinguish objects which animals see,it is difficult to estimate the relative importance ofdifferent objects. Evolutionary questions are often tack-led with the assumption that all reflectance spectra in agiven collection are equally important (Lythgoe & Par-tridge, 1989, 1991; Chittka & Menzel, 1992; Osorio &Vorobyev, 1996; Vorobyev, Osorio, Bennett, Marshall,& Cuthill, 1998; Vorobyev & Menzel, 1999). However,when one must decide in advance which objects tomeasure, it is virtually impossible to avoid a bias incollecting spectra. Here we collect spectra of naturalenvironmental scenes using a multispectral imagingdevice (Osorio, Ruderman, & Cronin, 1998; Ruderman,Cronin, & Chiao, 1998; Chiao, Cronin, & Osorio,2000), which records the spectrum in each point of animage (a total of 164×191 points can be recordedsimultaneously). Our assumption is that it is importantto discriminate points in the image from each other,and all points have equal weight. Since objects vary inarea, this assumption means that we postulate thatweights of objects are proportional to their areas in theimage. Although our method of collecting spectra isfree from a bias within a particular image, the decisionto consider a given scene as being representative re-mains subjective. To reduce this subjective factor, weanalyzed several images in the forest and in coral reefsand checked for the consistency of results.
2. Methods
2.1. Imaging de6ice and collection of multispectralimages
A CCD camera (Electrim EDC-1000TE camera,164×191 elements, 8 bits resolution) coupled to avariable interference filter (OCLI semicircular) was uti-lized to measure many reflectance spectra within thesame imaged scene simultaneously (see Chiao et al.,2000 for details). A portable computer was used withthe camera to control wavelength and exposure time,and to capture and store images. The full width at halfmaximum (FWHM) transmission bandwidth of the in-terference filter of this imaging system is 15 nm. Imageswere sequentially captured at 7–8 nm intervals from403 to 696 nm (40 images). These series of 40 images
are called multispectral (or hyperspectral) images,which contain information in both the spatial andspectral domains. The reliability of the imaging system(e.g. the possibilities of infrared light (IR) contamina-tion, CCD non-linearity, and spatial distortion) wasassessed independently by imaging a known reflectancestandard (MacBeth Color Checker) before collectingdata in the field. No sign of measurable IR contamina-tion, CCD non-linearity, or spatial distortion wasfound in our system. A 16-mm lens and 6.5-mm lenswere used to image the terrestrial scenes and aquaticscenes onto the CCD array, producing an angularresolution of 0.047×0.055 deg per pixel and 0.087×0.102 deg per pixel (horizontal×vertical), respectively.Comparisons among images collected at different wave-lengths showed no evidence of systematic magnificationor registration errors within the resolution of the sys-tem (Osorio et al., 1998).
In order to determine the relative spectrum of eachpixel, a white standard (Spectralon, 100% diffuse reflec-tance material, Labsphere) and a black standard (3%spectrally flat diffuse reflector, MacBeth) were placed inone corner of each imaged scene to serve as compari-sons for the overall range of reflectance (Fig. 1a,b). Foruse underwater, the whole imaging system was put intoan underwater housing and operated remotely from asurface vessel. In each imaged scene, exposure wasindividually determined at each wavelength to adjustthe brightness of the white standard to a level of220–235 (of a possible 255). Typically, exposures were250–5000 ms, and the time for a complete scan was3–5 min. Once the series of 40 images was collected, anopaque shutter was automatically placed in front of thecamera, and an identical sequence of exposures wascollected with no illumination to determine the level ofdark noise for each image under the conditions of eachindividual data set. The image series was then correctedby subtracting each dark frame from each correspond-ing data frame. Before proceeding with further analysis,all pixels in the image were scaled to relative reflectanceby using the values of the white and black standardsmeasured therein.
Notice that the actual reflectance of each pixel in theimage may have varied somewhat from that of thescene as a whole, depending on their local illumination.While we are not measuring the true reflectance spectra,the data for forest scenes closely approximate reflec-tance. The data for coral reef scenes may deviate fromtrue reflectance significantly, depending on objectdepth, distance from the camera, and water quality.Terrestrial images were collected on cloudy days, whichincreases the reliability of reflectance approximation byreducing the effects of shadow. Aquatic images wererecorded on cloudy days or near sunset to remove the‘flicker’ effect (wave induced illumination change), andat close distances (typically less than 1 m) to reduce the

C.-C. Chiao et al. / Vision Research 40 (2000) 3257–3271 3259
effect of water absorption. These precautions help toreduce the error of reflectance approximation.
Multispectral images were collected in terrestrial(temperate woodland: Patapsco State Park, Maryland,USA, April 1996; subtropical rainforest, dry sclerophyllforest, and mangroves at various locations in Queens-land, Australia, October 1996) and aquatic (coral reefs:near Lizard Island Research Station, Australia, August1997) habitats for comparison (Fig. 1a,b). The forest
scenes were selected to be representative of temperatewoodland, subtropical rainforest, sclerophyll forest,and mangroves; they contained trees, rocks, herbs,streams, soils, etc. The coral reef scenes were chosen torepresent a typical tropical coral reef, and included avariety of different species of corals (mainly yellow andbrown) and algae. The depth of coral reef scenes isabout 3–5 m. A total of 12 forest scenes and ten coralreef scenes were used in the following analyses.
Fig. 1. Color images of natural scenes in (a) temperate forest (Patapsco State Park, Maryland, USA), and (b) tropical coral reef (near LizardIsland Research Station, Queensland, Australia). These two images were generated by combining three single frames of multispectral images (452,548 and 649 nm) to illustrate the appearance of these scenes to the human visual system. The black and white standards used for calibrating thereflectance spectra can be seen in the lower left corner of each scene. The dashed square (128×128, pixels) in each image represents the areaanalyzed in this study. (c) & (d) Receptor images (upper rows) and dichromatic images (lower rows) of natural scenes corresponding to the dashedareas in the color images of temperate forest (a) and tropical coral reef (b), respectively. Three S/L cone receptor pairs (430/565, 430/500, 500/565nm; 430/530, 430/480, 480/530 nm) were used for generating the forest (c) and coral reef (d) images, respectively (see text for details). The receptorimages were coded by quantum catches of S and L cones directly. The dichromatic images were coded by removing the brightness informationfrom the receptor images, and leaving only the chromatic information.

C.-C. Chiao et al. / Vision Research 40 (2000) 3257–32713260
Fig. 2. Illuminant spectra, transmission spectra of ocular media, and absorption spectra of visual pigments. (a) Three standard daylight illuminantspectra (Wyszecki & Stiles, 1982), D75 (dotted line), D65 (dashed line), D55 (dot-dashed line), and one natural illuminant spectrum measured intemperate forest (solid line). These irradiance spectra are plotted in quantum units and are normalized to unity for comparison. (b) Computeddownwelling irradiance spectra in coral reefs (Cronin et al., 1994), at depths of 5 m (dashed line), 10 m (solid line), and 20 m (dotted line). Thesespectra are computed with the assumption that the surface illuminant is standard daylight, D65 (dot-dashed line). These spectra are plotted inquantum units and are normalized to unity for comparison. (c) Normalized transmission spectra of the human lens (dashed line; Wyszecki &Stiles, 1982) and of the ocular media of one species of snapper fish, Lutjanus bohar (solid line; Siebeck & Marshall, 2000). (d) Normalizedabsorption spectra of hypothetical visual pigments (Govardovskii, personal communication). Only lmax 410, 450, 500, 550 and 580 nm are shown.
2.2. Model of color discriminability
The method of estimating the discriminability indexis modified from Osorio and Vorobyev (1996). Themain assumptions of the model are: (i) achromaticvision is not used for color discrimination; and (ii)performance is limited by noise originating in the recep-tors. Predictions of the model agree with results ofbehavioral studies from a number of diurnal animals,including dichromatic mammals (Vorobyev & Osorio,1998; Vorobyev, Brandt, Peitsch, Laughlin, & Menzel,2000a).
2.2.1. Cone responses, chromatic signals and colordistance
In vivo cone spectral sensitivities were calculated asthe product of rhodopsin absorption functions (Govar-dovskii, personal communication) and ocular mediatransmittance. Ocular media transmittances of verte-brate eyes fall into two large categories, namely thosewhich transmit UV light, and those which absorb it(Douglas & Marshall, 1999). Diurnal mammals andsome fishes have lenses which absorb practically alllight below 400 nm (Douglas & Marshall, 1999). Herewe consider only eyes equipped with UV absorbinglenses. Such eyes are restricted to a spectral range ofabout 400–700 nm. To model terrestrial eyes, the trans-
mittance of the human lens (Fig. 2c, dashed line;Wyszecki & Stiles, 1982) was used. For aquatic eyes, weused the ocular media transmittance of a snapper fish,Lutjanus bohar (Fig. 2c, solid line; Siebeck & Marshall,2000). The rhodopsin absorption functions were nor-malized to unity at their maximum (Fig. 2d). For aphotoreceptor type k, a relative measure of quantumcatch, Qk, is given by:
Qk=&
I(l)R(l)L(l)Sk(l) dl (1)
where I(l) is the illumination spectrum (Fig. 2a,b; inquantum units), R(l) is the spectrum of a given pixelrelative to the white standard in a natural scene, L(l) isthe ocular media transmittance (Fig. 2c), and Sk(l) isthe rhodopsin absorption function of photoreceptor kat wavelength l (Fig. 2d). The integration is from 400to 700 nm, to which the imaging device is currentlylimited.
In a dichromatic system, the chromatic signal can bedescribed as the difference between responses of twodifferent photoreceptor types. Let PS, PL be the re-sponses of the short- (S) and long- (L) wavelength-sen-sitive cones, respectively, then the chromatic signal, C,is given by:
C=PL−PS (2)

C.-C. Chiao et al. / Vision Research 40 (2000) 3257–3271 3261
We assume that the receptor responses are log-linearfunctions of receptor quantum catches (Vorobyev et al.,1998). Since we are interested only in comparing chro-matic signals corresponding to different points in theimage, the absolute value of the chromatic signal is notimportant here. Thus the chromatic signal can be sim-ply rewritten as:
C=Ln(QL)−Ln(QS) (3)
The logarithmic transform of receptor functions hasthree advantages. First, the chromatic signal will notdepend on light intensity. Second, the code of relativeincrements (given by the logarithmic transform) agreeswith human perception (Weber–Fechner law; Wyszecki& Stiles, 1982). Third, in comparing chromatic signals,the absolute values of receptor quantum catches are notimportant.
According to metric theory (Helmholtz, 1909;Schrodinger, 1920; Wyszecki & Stiles, 1982), the dis-tance between two points (i.e. two different spectra) ina color space is given by a line element. If the distanceis lower than a certain threshold, the colors are indistin-guishable. We assume that only the chromatic signal isused for color discrimination. Since color discrimina-tion is limited by noise, the color distance, DS, betweentwo stimuli 1 and 2 is given by the absolute values ofthe difference of their chromatic signals relative to thenoise:
DS= �C1−C2�/etC (4)
where, etC denotes the standard deviation of the total
noise in the chromatic channel.
2.2.2. Noise estimationTo determine if the distance between two points (1)
and (2) in the color space exceeds threshold, we musttake into account the fact that the chromatic mecha-nisms are noisy. The dispersion of the total noise, (et
C)2,is equal to the sum of the dispersions of the noiseoriginating in the chromatic mechanisms:
(etC)2= (e1
C)2+ (e2C)2 (5)
where e1C refers to point (1) and e2
C refers to point (2).Since the dispersion of noise in the chromatic mecha-
nism is given, in turn, by the sum of the dispersions ofthe noise originating in receptor channels, the disper-sion of the total noise is:
(etC)2= (e1
L)2+ (e1S)2+ (e2
L)2+ (e2S)2 (6)
where indexes S and L correspond to S and L conemechanisms, respectively.
Photoreceptor noise can be reduced by summation ofsignals of individual cones. The standard deviation ofthe noise in this case is decreased by the square root ofthe number of cones whose signals are summed. Let nbe the number of cones within the retina, and gS be the
proportion of S cones, S/(S+L), in the retina. Then thestandard deviations of the noise in the S and L channelsare given by:
eS=dS/(n · gS)
eL=dL/(n · (1−gS)) (7)
where dS and dL denote standard deviations of thenoise in individual cones.
There are two types of noise sources considered inthis study, depending on the intensity range of illumi-nants in which a visual system operates. They are: (i)Weber noise; and (ii) quantum noise (Wyszecki &Stiles, 1982). Above a certain range of light intensities,thresholds are approximately proportional to the signal(Weber–Fechner law), which implies that contrastthresholds of cone types k, vk, is a constant, the Weberfraction. Since we assume that receptor signals aregiven by logarithmic transform of quantum catches,Weber–Fechner law implies that noise in the receptormechanism is a constant:
ek=vk (8)
When the ambient light intensity decreases, the per-formance of a photoreceptor becomes photon-noise-limited. Since the photon capture is a Poisson process,the variance in quantum capture is equal to the mean,which generates photon noise whose relative amplitudeis inverse proportional to the square root of quantumcatch (Rose–de Vries law) (Rose, 1942; de Vries, 1943).
ek81/Qk (9)
The absolute value of receptor noise is not known,nor do we have reliable estimates of the number ofcones within the retina. We overcome this uncertaintyby performing calculations for three different values ofthreshold distances, which is equivalent to consideringthree values of receptor noise. However, we need somerough estimate of the order of magnitude of the noise.As a starting point, we consider the sensitivities ofhuman cone mechanisms. The Weber fractions of hu-man S, M, and L mechanisms are 8.7, 1.9 and 1.8%,respectively (Wyszecki & Stiles, 1982, p. 530). Thus, itseems reasonable to assume that in bright light, whenquantum fluctuations have negligible effect on thenoise, the lowest noise level of the L cone mechanism(eL=vL) may approach 0.01. In the case of quantumfluctuation limited performance, we assume that for aneye viewing a 100% reflecting white surface, the lowestnoise in the L cone mechanism (peak at 565 nm) isequal to 0.01, and this noise increases with the decreaseof the quantum catch (Eq. (9)). To estimate the noise inthe S cone mechanism, we assume that S and L coneshave the same internal noise properties, and, hence, thedifferences in sensitivities between the two cone mecha-nisms can be fully attributed to the differences in the

C.-C. Chiao et al. / Vision Research 40 (2000) 3257–32713262
cone densities. This assumption can be justified by thefact that the differences in the sensitivities between Sand L cone mechanisms in human observers can beexplained by the densities of corresponding cone types(Williams & Roorda, 1999). In a dichromatic mam-malian retina, S cones make up about 5% of the totalcone numbers (Petry, Erichsen & Szel, 1993; Famiglietti& Sharpe, 1995; Szel, Rohlich, Caffe, & van Veen,1996). We thus set gS to 0.05 and vS:0.07. Since manyfish retinas have a square cone mosaic (single S cones inthe center and double L cones in the corners; Ali &Anctil, 1976), we assume that the ratio of S/(S+L) infish is close to 0.33. We also consider eyes with variousratios of S/(S+L).
2.2.3. Discriminability indexFor each point i in a given scene, all points ni whose
distances are below the discriminability threshold areconsidered indiscriminable. The index of discriminabil-ity (p) is then the mean proportion of objects which canbe distinguished from any given object in the scene:
p=1−%N
i=1
ni/(N−1)
N(10)
where N is the total number of points (Osorio &Vorobyev, 1996). We picked randomly 1000 pixels from16384 pixels (128×128, only the central portion ofeach image was used; Fig. 1a,b dashed squares), andthe computation was repeated 100 times.
2.2.4. Effects of illumination changes in forest andcoral reef scenes on the discriminability
To examine the effects of illumination spectralchanges in forests on spectral tuning of photoreceptorpairs, we applied four different types of illuminants,including three CIE standards: daylight D55, D65, D75(Wyszecki & Stiles, 1982), and one natural illuminantmeasured directly in the forest (Fig. 2a) to modellingforest scenes. This forest illuminant is characterized bythe presence of ‘green’ light filtered through leaves,resembling Endler’s (1993) ‘forest shade’ light. Inaquatic environments, illumination changes rapidlywith depth. To model the downwelling irradiance at acertain depth, we used the diffuse attenuation coeffi-cient, k(l), measured in situ near the field site (Cronin,Marshall, Caldwell, & Shashar, 1994). The irradiance atdifferent depths was calculated using the followingequation.
Id(l)=I0(l)e−k(l)d (11)
where I0(l) is the illuminant spectrum at the surface(D65 was used here as standard daylight), d is the depthin meters, and Id(l) is the downwelling illuminantspectrum at that depth. Downwelling light spectra atthree depths (5, 10, 20 m) were computed and used formodelling coral reef scenes (Fig. 2b).
3. Results
A natural scene as seen through the animal’s eyes canbe represented by a set of receptor quantum catchescorresponding to each point of the scene, which we calla ‘receptor image’ (Vorobyev, Marshall, Osorio,Hempel de Ibarra, & Menzel, 2000b). To show thesequantum catches, we use a system in which the quan-tum catches of S cones correspond to the blue frame ofcolor images, and the quantum catches of L cones tothe green and red frames (equivalent to a ‘yellow’frame) of color images. It is important to note that wecannot infer how dichromats perceive colors; the dis-play shows only the information from which the ner-vous system may form color. Generally, the larger thechanges in receptor signals, the larger are the changesin color appearance. Therefore, inspection of imageswhere quantum catches are coded with colors allows usto judge the relative magnitude of color contrast in theimage, but we make no inferences about color appear-ance. The top row of Fig. 1c shows receptor imagescorresponding to the S/L cone pairs of 430/565, 430/500, and 500/565 nm for forest scenes, and the top rowof Fig. 1d shows those for the S/L cone pairs of430/530, 430/480, and 480/530 nm for coral reef scenes.The lmax of the S/L cone pairs are chosen to representtypical cone pairs, as well as pairs in which L conesshift to shorter wavelengths, and S cones shift to longerwavelengths, respectively. The lmax of typical L conesfor forest-dwelling animals is generally longer than forcoral-reef-dwelling animals. Images so coded show bothchromatic and achromatic (brightness) aspects of color.Achromatic vision is greatly affected by the distributionof illumination, and may give unreliable informationabout objects in the scene.
We now will consider only chromatic information,that is, the aspect of color devoid of brightness. The‘chromatic’ images are coded by setting the sum of thequantum catches of S and L cones (S+L) equal toconstants, which is equivalent to removing the bright-ness information, and leaving only the chromatic infor-mation in the images. In both forest and coral reefscenes, well separated S/L cone pairs gave maximumchromatic information (Fig. 1c,d, left column). Whenthe lmax of L cones shifts to shorter wavelengths (500nm in forests, 480 nm in coral reefs), the chromaticinformation is only slightly reduced (Fig. 1c,d, middlecolumn). In contrast, when the lmax of S cones shifts tolonger wavelengths (500 nm in forests, 480 nm in coralreefs), the chromatic information is greatly reduced(Fig. 1c,d, right column). The chromatic information inthe forest image may potentially provide the contrastfor objects, such as rocks in forest scenes (Fig. 1c, lowerrow), and the chromatic information in the coral reefimage may help to distinguish different corals in coralreef scenes (Fig. 1d, lower row).

C.-C. Chiao et al. / Vision Research 40 (2000) 3257–3271 3263
A quantitative evaluate of the efficiency of an eyeviewing a natural scene is given by the discriminabilityindex, i.e. by the proportion of points in the imagediscriminable from each other (see Model). We calcu-lated this index with the assumption that only chro-matic information is used for discrimination, and thatdiscriminability is limited by receptor noise. This as-sumption is consistent with experimental data obtainedin a variety of animals tested in bright light with targetssubtending large visual angles (Vorobyev & Osorio,1998; Vorobyev et al., 2000a). The nature of receptornoise depends on the illumination level: at low light thenoise is set by the fluctuations of the number of ab-sorbed quanta, i.e. Rose–de Vries law (Rose, 1942; deVries, 1943); in bright light the signal to noise ratio isindependent of light intensity, which is described byWeber–Fechner law (Wyszecki & Stiles, 1982). Thefollowing section presents the analysis of the depen-dence of the discriminability index on the wavelengthpositions of cone pigments.
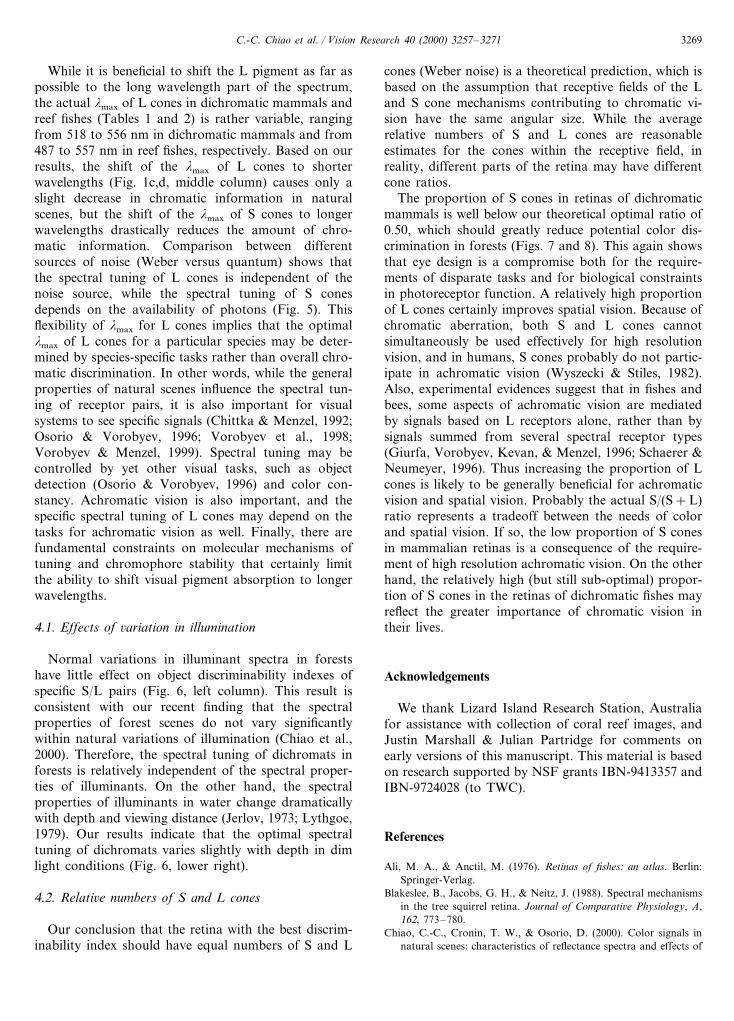
To check the consistency of the results within andbetween various images in forest and coral reef scenes,we examined the variation of results from 100 repeatsin a single image (Fig. 3, upper row), and the variationof results from 12 individual images for forest scenesand ten individual images for coral reef images (Fig. 3,lower row). In each of the plots the wavelength position
of the S cone was kept constant at 430 nm and the Lcones varied; or the position of the L cone was keptconstant at 565 nm (forest scenes) or 530 nm (coral reefscenes) and the S cones varied. Only Weber noise isconsidered here for both habitats, and similar resultsare obtained with the consideration of quantum noise.The variation within images is very small. The variationbetween different images is relatively large, but thetrends of the results are not greatly affected by whichimage is selected. Consequently, throughout the rest ofthis paper, results are averaged over 12 or ten images inforests or coral reefs, respectively.
The discriminability index for all possible S/L conepairs is shown in the contour plots of Fig. 4. The letterson the contour plots of forest scenes (Fig. 4, leftcolumn) and coral reef scenes (Fig. 4, right column)correspond to the known S/L cone pairs of dichromaticmammals (see Table 1) and reef fishes (see Table 2),respectively. We consider two conditions: (i) Webernoise is dominant (Fig. 4, upper row) – valid in brightlight; or (ii) quantum noise is dominant, i.e. Rose–deVries law (Fig. 4, lower row) – valid in dim light. IfWeber noise dominates, it is beneficial to increase thespectral separation between S and L cones (Fig. 4,upper row). However, if quantum noise dominates, itbecomes important to place the cones so that thequantum catch is increased. Because the quantum flux
Fig. 3. Performance measured by the probability that the dichromatic signal will discriminate any two points in a natural scene. In order to showthe variation of discriminability for different S/L cone pairs, either the lmax of S cones was fixed at 430 nm, and the lmax of L cones allowed tovary, or the lmax of L cones was fixed at 565 nm (forest scenes) or 530 nm (coral reef scenes), and the lmax of S cones varied. To calculate thediscriminability index (p), we considered Weber noise (see text for details). The plots in the upper row show p variation within a single image over100 random repeats (scenes in Fig. 1a,b). The plots in the lower row show p variation between 12 images for forest scenes and ten images for coralreef scenes. The error bars in each plot represent the standard deviation. The curve labeled ‘S cone’ in each panel plots the discriminability indexof S/L cone pairs when the lmax of the S cone varies and the lmax of the L cone is held constant. The curve labeled ‘L cone’ in each panel plotsthe discriminability index of S/L cone pairs when the lmax of the L cone varies and the lmax of the S cone is held constant.
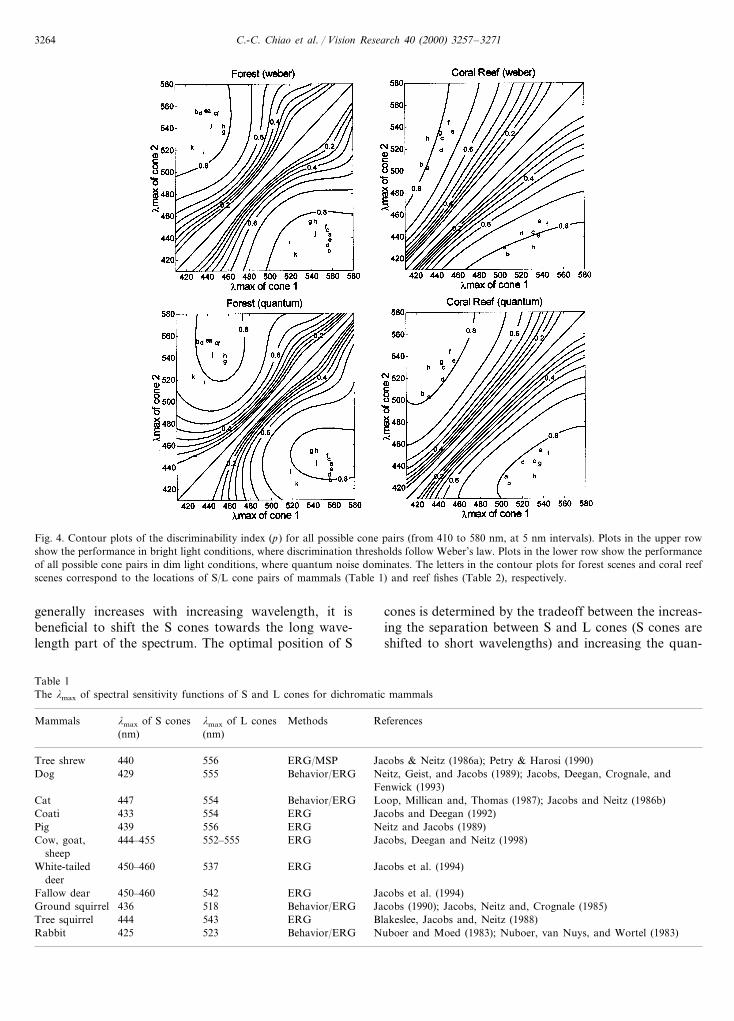
C.-C. Chiao et al. / Vision Research 40 (2000) 3257–32713264
Fig. 4. Contour plots of the discriminability index (p) for all possible cone pairs (from 410 to 580 nm, at 5 nm intervals). Plots in the upper rowshow the performance in bright light conditions, where discrimination thresholds follow Weber’s law. Plots in the lower row show the performanceof all possible cone pairs in dim light conditions, where quantum noise dominates. The letters in the contour plots for forest scenes and coral reefscenes correspond to the locations of S/L cone pairs of mammals (Table 1) and reef fishes (Table 2), respectively.
generally increases with increasing wavelength, it isbeneficial to shift the S cones towards the long wave-length part of the spectrum. The optimal position of S
cones is determined by the tradeoff between the increas-ing the separation between S and L cones (S cones areshifted to short wavelengths) and increasing the quan-
Table 1The lmax of spectral sensitivity functions of S and L cones for dichromatic mammals
ReferencesMammals Methodslmax of L coneslmax of S cones(nm)(nm)
Tree shrew ERG/MSP440 Jacobs & Neitz (1986a); Petry & Harosi (1990)556429Dog 555 Behavior/ERG Neitz, Geist, and Jacobs (1989); Jacobs, Deegan, Crognale, and
Fenwick (1993)Behavior/ERG Loop, Millican and, Thomas (1987); Jacobs and Neitz (1986b)554447CatERGCoati Jacobs and Deegan (1992)433 554
556439 ERG Neitz and Jacobs (1989)PigERG Jacobs, Deegan and Neitz (1998)Cow, goat, 552–555444–455
sheepWhite-tailed ERG Jacobs et al. (1994)537450–460
deerERGFallow dear Jacobs et al. (1994)450–460 542
Ground squirrel 518 Behavior/ERG Jacobs (1990); Jacobs, Neitz and, Crognale (1985)436Tree squirrel ERG444 Blakeslee, Jacobs and, Neitz (1988)543
Nuboer and Moed (1983); Nuboer, van Nuys, and Wortel (1983)Behavior/ERG523Rabbit 425

C.-C. Chiao et al. / Vision Research 40 (2000) 3257–3271 3265
tum catch (S cones are shifted to long wavelengths).Inspection of Fig. 4 allows us to conclude that theactual spectral positions of cone pigments in dichro-matic animals are well suited for color discrimination– increasing the spectral separation will only slightlyimprove the discriminability index, and the wave-length positions of S cones are close to the optimum.
Noise level may vary substantially between animalspecies. To understand how discriminability dependson the assumed noise level, we repeated the calcula-tions for the threshold increased two and three times(Fig. 5). While the absolute value of the discrim-inability index decreases with the increase of noise,the shape of the dependence of the wavelength posi-
tions of cone pigments remains invariant. The latterclearly shows that our conclusions are valid for eyeswith different levels of noise in cone mechanisms.Note that Fig. 5 nicely illustrates the conclusion thatit is beneficial to place the L cone to longer wave-lengths independently of the noise source, while thebest position of the S cone depends on the noisesource. When Weber noise is dominant, discriminabil-ity improves with the shift of S cones to the shortwavelength part of the spectrum; when quantumnoise dominates, the optimal position of the S cone isclose to 450 nm (given that the L cone is at 565 nm;forests) or 430 nm (given that the L cone is at 530nm; coral reefs).
Table 2The lmax of spectral sensitivity functions of S and L cones for reef fishes, Lutjanus (adapted from Lythgoe, Muntz, Partridge, Shand, and Williams(1994))
lmax of S cones (nm) Typical locationlmax of L cones (nm)aReef fishes
L. kasmira Outer reef487/518430424 494/518L. bohar Outer reef
520/540L. quinquelineatus Outer reef444L. adetii 443 511/526 Middle reefL. carponotatus 454 519/552 Middle reef
Middle reef530/557L. russelli 451529/541L. malabaricus Inner reef442
430L. sebae 521/539 Inner reef
a The lmax of L cones includes two values for double cones. Lythgoe et al. (1994) suggested that these double cones might function as a singleclass of L cones.
Fig. 5. The performance of dichromats in discriminating objects in forest and coral reef scenes. The discriminability index (p) is estimated for threedifferent thresholds, for Weberian (upper row) and quantum noise limited (lower row) conditions. The curve labeled ‘1’ plots the analytical resultsfor the minimum reasonable threshold (see text), while those labeled ‘2’ or ‘3’ represent the results for increases of threshold to two or three timesthe first threshold, respectively. The plotting conventions are identical to those used in Fig. 3, showing the discriminability index when either thelmax of the S cone varies and that of the L cone holds constant, or the lmax of the L cone varies and that of the S cone holds constant.

C.-C. Chiao et al. / Vision Research 40 (2000) 3257–32713266
Fig. 6. Left column: The effects of various standard daylights D55, D65, and D75 (dot-dashed, dashed, and dotted lines) and natural forest light,g (solid line) on the discriminabilities of objects by dichromats in forests, for Weberian (upper row) and quantum noise limited (lower row)conditions. Right column: The effects of various downwelling irradiance at depths of 5 m (dashed line), 10 m (solid line), and 20 m (dotted line)on the discriminabilities of objects by dichromats in coral reefs, for Weberian (upper row) and quantum noise limited (lower row) conditions. Theplotting conventions are identical to those used in Fig. 3.
Illuminants in forests may vary over time dependingon passing clouds and the solar angle (Endler, 1993).We used three standard daylight illuminants, D55, D65,and D75 (Wyszecki & Stiles, 1982), along with anilluminant actually measured in a forest (Fig. 2a) toexamine the effects of these different illuminant spectraon the discriminability of forest scenes by S/L conepairs. In water, illuminants change both their intensityand spectral properties with depth. Depending on thewater type, the photon flux at the surface can bereduced 10�100-fold at a depth of 20 m (Jerlov, 1973).In addition to the change of light intensity, the spectraof illuminants become narrower with increasing depth(Fig. 2b). In coral reef scenes performances, as mea-sured by the discriminability of reflectance spectra, werecompared for depths of 5, 10 and 20 m.
Results are illustrated in Fig. 6. The discriminabilityindex of each S/L cone pair in Fig. 6 is the average of12 and ten images for forest and coral reef scenesrespectively. The discriminability index of S/L conepairs under the forest illuminant (solid lines in Fig. 6,left column) and at 10 meters depth (solid lines in Fig.6, right column) are the same as the curves shown inFig. 5 (one threshold), respectively. Overall, four spec-trally distinct illuminant spectra in forests have littleeffect on the discriminability indexes of S/L cone pairs.The trends of spectral tuning of S/L cones are verysimilar for both types of noise source (Fig. 6, leftcolumn). In the bright light condition, in coral reef
scenes (Weber noise dominates), the optimal spectraltuning positions of S/L cone pairs remain those withthe greatest separation (Fig. 6, upper right). Theseresults indicate that the depth in water has little effecton spectral discrimination by particular S/L cone pairswhen available photons are abundant. However, wherequantum noise dominates (i.e. in dim light), in coralreef scenes, which is likely to be common in deeperwater, the optimal spectral positions of S cones slightlyshift to shorter wavelengths with increasing depth (e.g.20 m; Fig. 6, lower right).
The ratio of S/(S+L) cones in the retinas of dichro-matic mammals is close to 1/20 (Petry et al., 1993;Famiglietti & Sharpe, 1995; Szel et al., 1996). Thisinequality makes the S cone channel noisier than the Lcone channel. The noise (measured as dispersion of thesignal) in the S–L channel is given simply by summingnoise values in S and L channels. Our assumption isthat the signal-to-noise ratio is improved by summationof signals of individual cones. If the total number ofcones within the retina remains invariant, the signal-to-noise ratio in the S–L channel can be improved bychanging the S/(S+L) ratio. If the discrimination islimited by Weber noise, the signal-to-noise ratio of thereceptor channel is proportional to the square root ofthe number of cones of the given type. Consequently,the signal-to-noise ratio in the S–L channel reaches itsmaximum when the number of S cones is equal to thenumber of L cones (see Model). If quantum fluctua-

C.-C. Chiao et al. / Vision Research 40 (2000) 3257–3271 3267
tions limit discrimination, the signal-to-noise ratio inreceptor mechanisms is proportional to the number ofabsorbed quanta rather than to the number of cones. Inthis case the signal-to-noise ratio in the S–L mechanismreaches its maximum when the number of quanta ab-sorbed by S cones is equal to that absorbed by L cones,and it is less easy to establish the cone ratio minimizingthe noise. We calculated the dependence of the discrim-inability index on the cone wavelength position forhypothetical eyes with S/(S+L) ratios of 1/20, 1/2, or19/20. As predicted above, in the bright light condition(where Weber noise dominates), the discriminability ismaximal when the S/(S+L) ratio equals 0.50 (dashedline in Fig. 7, upper left). In contrast, in the dim lightcondition (quantum noise dominates), S/(S+L) ratiosof 0.50 and 0.95 both outperform the ratio of 0.05(dashed and dotted lines in Fig. 7, lower left, respec-tively), and the form of the curve varies with theS/(S+L) ratio. Similar patterns exist in the results forcoral reef scenes (Fig. 7, right column). These resultsindicate that the ratio of cones in the retina stronglyaffects reliability of information encoded in a chromaticchannel.
Thus, our analysis predicts that the retina with thebest discriminability index either should have equalnumbers of S and L cones (Weber noise), or that thenumber of S cones should exceed the number of Lcones (quantum noise). In reality, L cones are alwaysmore abundant than S cones. To determine whether ornot the ratios found in real animals may degradediscriminability, we calculated how the discriminability
index depends on the S/(S+L) ratio (Fig. 8). Calcula-tions show that the discriminability index remains prac-tically invariant over a wide range of S/(S+L) ratios.Nevertheless, the typical value for mammals lies outsidethis range, while fishes have a cone ratio which appearsto be well suited for color discrimination.
4. Discussion
Our results show that it is almost always beneficial toincrease the spectral separation between two cone typesfor dichromatic color discriminations. In conditions ofdim light, the performance might be also improved if Scones are shifted towards longer wavelengths, becausesuch a shift increases the quantum catch and thusreduces the noise. While our model concerns onlydichromatic animals equipped with UV absorbinglenses, these conclusions are valid for a variety ofnatural scenes collected in woodlands and coral reefs,for a variety of natural illuminations, and for differentvalues of discrimination thresholds.
Our analysis assumed that it is beneficial to increasethe proportion of discriminable points in the image.The discriminability index used differs from measuresof performance adopted in other studies. Govardovskiiand Vorobyev (1989) assumed that the higher the num-ber of discriminable colors (rather than objects orpoints), the better is color vision. This measure wouldgive results equivalent to those obtained by using thediscriminability index only if object colors in the color
Fig. 7. The effects of the proportion of S cones, S/(S+L), on the discriminabilities of objects by dichromats in forests and coral reefs, forWeberian (upper row) and quantum noise limited (lower row) conditions. Solid line: S/(S+L)=0.05 (forest) or 0.33 (coral reef), dashed line:S/(S+L)=0.50 (forest) or 0.05 (coral reef), dotted line: S/(S+L)=0.95. The plotting conventions are identical to those used in Fig. 3.

C.-C. Chiao et al. / Vision Research 40 (2000) 3257–32713268
Fig. 8. Left column: Effects of various proportions of S cones on the discriminability index (p) of objects viewed by dichromats in forests, withthe lmax of the S cones sets at 430 nm and that of the L cones sets at 565 nm, for Weberian (upper row) and quantum noise limited (lower row)conditions. The dotted lines show the typical S/(S+L) ratio (0.05) in dichromatic mammals. Right column: The effect of S/(S+L) on thediscriminability index (p) of objects viewed by dichromats in coral reefs, with the lmax of the S cones sets at 430 nm and that of the L cones setsat 530 nm, for Weberian (upper row) and quantum noise limited (lower row) conditions. The dotted lines show the typical S/(S+L) ratio (0.33)for reef fishes.
space have a uniform distribution. The standard devia-tion of the difference between the receptor signals (Re-gan et al., 1998) also describes the spread of colors indichromatic receptor space. The latter can be correlatedwith the discriminability index, because as the spread ofcolors increases, the proportion of pairs of objectshaving suprathreshold distance is likely to increase, butthere is no reason to believe that two methods must yieldidentical predictions. Chittka and Menzel (1992) ana-lyzed the spread of flower colors in bee color space, andthey directly considered the distances between pairs ofcolors. They postulated that it is beneficial to increasethe mean square distance between the colors of objects.However, this measure may not be directly related todiscrimination of objects on the basis of their color,because the pairs of objects having long suprathresholdcolor distance have a dominant influence on the averagecolor distance between objects. This implies that thechanges of the mean color distance reflects the changesbetween the objects which are reliably discriminable,whereas the changes of discriminability index in ourmodel is due to the change of the distance between thepairs of objects whose distance is close to threshold.
Although the measures of performance mentionedabove were intended to describe discriminability, thesemeasures are only indirectly related to it, and it isinteresting to compare the conclusions of these earlystudies with the results of calculations where the per-centage of discriminable objects (points) is directly
counted. Such a comparison shows that our conclusionsare generally consistent with results of previous work inthis area (Govardovskii & Vorobyev, 1989; Lythgoe &Partridge, 1989, 1991; Osorio & Vorobyev, 1996;Vorobyev & Menzel, 1999). For forest scenes, the depen-dence of the discriminability index on the spectralpositions of cones is similar to that found by Osorio andVorobyev (1996, Fig. 2a) for discrimination of leaves. Itis important to note that the model used by Osorio andVorobyev (1996) is practically identical to the one usedhere, but their data set was different, including onlyleaves and fruit. Earlier, Govardovskii and Vorobyev(1989) demonstrated that decreasing the spectral overlapof receptor sensitivities increases the number of discrim-inable colors, if all physically realizable reflectance spec-tra are considered. In contrast to the present study,however, their analysis assumed that both chromaticand achromatic cues are used for color discrimination.Vorobyev and Menzel (1999) considered flower reflec-tance spectra and assumed that only chromatic cues areused for color discrimination. They found that theoptimal visual pigment peak positions for maximizingthe number of discriminable colors were similar both forflower spectra and for all physically realizable spectra.Taken together, the results of our study and the previouswork based on less direct measures of discriminabilityshow that it is generally beneficial to increase theseparation between visual pigments, irrespective ofwhich colors are considered.
C.-C. Chiao et al. / Vision Research 40 (2000) 3257–3271 3269
While it is beneficial to shift the L pigment as far aspossible to the long wavelength part of the spectrum,the actual lmax of L cones in dichromatic mammals andreef fishes (Tables 1 and 2) is rather variable, rangingfrom 518 to 556 nm in dichromatic mammals and from487 to 557 nm in reef fishes, respectively. Based on ourresults, the shift of the lmax of L cones to shorterwavelengths (Fig. 1c,d, middle column) causes only aslight decrease in chromatic information in naturalscenes, but the shift of the lmax of S cones to longerwavelengths drastically reduces the amount of chro-matic information. Comparison between differentsources of noise (Weber versus quantum) shows thatthe spectral tuning of L cones is independent of thenoise source, while the spectral tuning of S conesdepends on the availability of photons (Fig. 5). Thisflexibility of lmax for L cones implies that the optimallmax of L cones for a particular species may be deter-mined by species-specific tasks rather than overall chro-matic discrimination. In other words, while the generalproperties of natural scenes influence the spectral tun-ing of receptor pairs, it is also important for visualsystems to see specific signals (Chittka & Menzel, 1992;Osorio & Vorobyev, 1996; Vorobyev et al., 1998;Vorobyev & Menzel, 1999). Spectral tuning may becontrolled by yet other visual tasks, such as objectdetection (Osorio & Vorobyev, 1996) and color con-stancy. Achromatic vision is also important, and thespecific spectral tuning of L cones may depend on thetasks for achromatic vision as well. Finally, there arefundamental constraints on molecular mechanisms oftuning and chromophore stability that certainly limitthe ability to shift visual pigment absorption to longerwavelengths.
4.1. Effects of 6ariation in illumination
Normal variations in illuminant spectra in forestshave little effect on object discriminability indexes ofspecific S/L pairs (Fig. 6, left column). This result isconsistent with our recent finding that the spectralproperties of forest scenes do not vary significantlywithin natural variations of illumination (Chiao et al.,2000). Therefore, the spectral tuning of dichromats inforests is relatively independent of the spectral proper-ties of illuminants. On the other hand, the spectralproperties of illuminants in water change dramaticallywith depth and viewing distance (Jerlov, 1973; Lythgoe,1979). Our results indicate that the optimal spectraltuning of dichromats varies slightly with depth in dimlight conditions (Fig. 6, lower right).
4.2. Relati6e numbers of S and L cones
Our conclusion that the retina with the best discrim-inability index should have equal numbers of S and L
cones (Weber noise) is a theoretical prediction, which isbased on the assumption that receptive fields of the Land S cone mechanisms contributing to chromatic vi-sion have the same angular size. While the averagerelative numbers of S and L cones are reasonableestimates for the cones within the receptive field, inreality, different parts of the retina may have differentcone ratios.
The proportion of S cones in retinas of dichromaticmammals is well below our theoretical optimal ratio of0.50, which should greatly reduce potential color dis-crimination in forests (Figs. 7 and 8). This again showsthat eye design is a compromise both for the require-ments of disparate tasks and for biological constraintsin photoreceptor function. A relatively high proportionof L cones certainly improves spatial vision. Because ofchromatic aberration, both S and L cones cannotsimultaneously be used effectively for high resolutionvision, and in humans, S cones probably do not partic-ipate in achromatic vision (Wyszecki & Stiles, 1982).Also, experimental evidences suggest that in fishes andbees, some aspects of achromatic vision are mediatedby signals based on L receptors alone, rather than bysignals summed from several spectral receptor types(Giurfa, Vorobyev, Kevan, & Menzel, 1996; Schaerer &Neumeyer, 1996). Thus increasing the proportion of Lcones is likely to be generally beneficial for achromaticvision and spatial vision. Probably the actual S/(S+L)ratio represents a tradeoff between the needs of colorand spatial vision. If so, the low proportion of S conesin mammalian retinas is a consequence of the require-ment of high resolution achromatic vision. On the otherhand, the relatively high (but still sub-optimal) propor-tion of S cones in the retinas of dichromatic fishes mayreflect the greater importance of chromatic vision intheir lives.
Acknowledgements
We thank Lizard Island Research Station, Australiafor assistance with collection of coral reef images, andJustin Marshall & Julian Partridge for comments onearly versions of this manuscript. This material is basedon research supported by NSF grants IBN-9413357 andIBN-9724028 (to TWC).
References
Ali, M. A., & Anctil, M. (1976). Retinas of fishes: an atlas. Berlin:Springer-Verlag.
Blakeslee, B., Jacobs, G. H., & Neitz, J. (1988). Spectral mechanismsin the tree squirrel retina. Journal of Comparati6e Physiology, A,162, 773–780.
Chiao, C.-C., Cronin, T. W., & Osorio, D. (2000). Color signals innatural scenes: characteristics of reflectance spectra and effects of
C.-C. Chiao et al. / Vision Research 40 (2000) 3257–32713270
natural illuminants. Journal of the Optical Society of America,A, 17, 218–224.
Chittka, L., & Menzel, R. (1992). The evolutionary adaptation offlower colors and the insect pollinators’ color vision systems.Journal of Comparati6e Physiology, A, 171, 171–181.
Cronin, T. W., Marshall, N. J., Caldwell, R. L., & Shashar, N.(1994). Specialisation of retinal function in the compound eyesof mantis shrimps. Vision Research, 34, 2639–2656.
de Vries, H. L. (1943). The quantum character of light and itsbearing upon threshold of vision, the differential sensitivity andvisual acuity of the eye. Physica, 10, 553–564.
Douglas, R. H., & Marshall, N. J. (1999). A review of vertebrateand invertebrate optical filters. In S. N. Archer, M. B. A.Djamgoz, E. R. Loew, J. C. Partridge, & S. Vallerga, Adapti6emechanisms in the ecology of 6ision (pp. 95–162). Dordrecht:Kluwer Academic.
Endler, J. A. (1993). The color of light in forests and its implica-tions. Ecological Monographs, 63, 1–27.
Famiglietti, E. V., & Sharpe, S. J. (1995). Regional topography ofrod and immunocytochemically characterized ‘blue’ and ‘green’cone photoreceptors in rabbit retina. Visual Neuroscience, 12,1151–1175.
Giurfa, M., Vorobyev, M., Kevan, P., & Menzel, R. (1996). Detec-tion of coloured stimuli by honeybees: minimum visual anglesand receptor specific contrasts. Journal of Comparati6e Physiol-ogy, A, 178, 699–709.
Govardovskii, V. I., & Vorobyev, M. (1989). The role of colouredoil droplets in colour vision (in Russian). Sensornye Systemy(Sensory Systems), 3, 150–159.
Helmholtz, H. L. F. (1909). Hanbuch der physiologischen optik (p.513). Hamburg: Verl. von L. Voss.
Jacobs, G. H. (1981). Comparati6e color 6ision. New York: Aca-demic.
Jacobs, G. H. (1990). Duplicity theory and ground squirrels: link-ages between photoreceptors and visual function. Visual Neuro-science, 5, 311–318.
Jacobs, G. H. (1993). The distribution and nature of colour visionamong the mammals. Biological Re6iew, 68, 413–471.
Jacobs, G. H., & Deegan, J. F. II (1992). Cone photopigments innocturnal and diurnal procyonids. Journal of Comparati6e Phys-iology, A, 171, 351–358.
Jacobs, G. H., Deegan, J. F. II, Crognale, M. A., & Fenwick, J.A. (1993). Photopigments of dogs and foxes and their implica-tions for canid vision. Visual Neuroscience, 10, 173–180.
Jacobs, G. H., Deegan, J. F. II, & Neitz, J. (1998). Photopigmentbasis for dichromatic color vision in cows, goats, and sheep.Visual Neuroscience, 15, 581–584.
Jacobs, G. H., Deegan, J. F. II, Neitz, J., Murphy, B. P., Miller,K. V., & Marchinton, R. L. (1994). Electrophysiological mea-surements of spectral mechanisms in the retinas of two cervids:white-tailed deer (Odocoileus 6irginianus) and fallow deer (Damadama). Journal of Comparati6e Physiology, A, 174, 551–557.
Jacobs, G. H., & Neitz, J. (1986a). Spectral mechanisms and colorvision in the tree shrew (Tupaia belangeri ). Vision Research, 26,291–298.
Jacobs, G. H., & Neitz, J. (1986b). Spectral sensitivity of cat conesto rapid flicker. Experimental Brain Research, 62, 446–448.
Jacobs, G. H., Neitz, J., & Crognale, M. (1985). Spectral sensitivityof ground squirrel cones measured with ERG flicker photome-try. Journal of Comparati6e Physiology, A, 156, 503–509.
Jerlov, N. G. (1973). Optical oceanography. Amsterdam: Elsevier.Loop, M. S., Millican, C. L., & Thomas, S. R. (1987). Photopic
spectral sensitivity of the cat. Journal of Physiology, 382, 537–553.
Lythgoe, J. N. (1979). The ecology of 6ision. Oxford: ClarendonPress.
Lythgoe, J. N., Muntz, W. R. A., Partridge, J. C., Shand, J., &Williams, D. M. (1994). The ecology of the visual pigments ofsnappers (Lutjanidae) on the Great Barrier Reef. Journal ofComparati6e Physiology, A, 174, 461–467.
Lythgoe, J. N., & Partridge, J. C. (1989). Visual pigments and theacquisition of visual information. Journal of Experimental Biol-ogy, 146, 1–20.
Lythgoe, J. N., & Partridge, J. C. (1991). The modelling of optimalvisual pigments of dichromatic teleosts in green coastal waters.Vision Research, 31, 361–371.
Neitz, J., Geist, T., & Jacobs, G. H. (1989). Color vision in thedog. Visual Neuroscience, 3, 119–125.
Neitz, J., & Jacobs, G. H. (1989). Spectral sensitivity of cones inan ungulate. Visual Neuroscience, 2, 97–100.
Nuboer, J. F. W., & Moed, P. J. (1983). Increment-threshold spec-tral sensitivity in the rabbit. Journal of Comparati6e Physiology,A, 151, 353–358.
Nuboer, J. F. W., van Nuys, W. M., & Wortel, J. F. (1983). Conesystems in the rabbit retina revealed by ERG-null-detection.Journal of Comparati6e Physiology, A, 151, 347–351.
Osorio, D., & Bossomaier, T. R. J. (1992). Human cone-pigmentspectral sensitivities and the reflectances of natural surfaces. Bi-ological Cybernetics, 67, 217–222.
Osorio, D., Ruderman, D. L., & Cronin, T. W. (1998). Estimat-ion of errors in luminance signals encoded by primateretina resulting from sampling of natural images with red andgreen cones. Journal of the Optical Society of America, A, 15,16–22.
Osorio, D., & Vorobyev, M. (1996). Colour vision as an adapta-tion to frugivory in primates. Proceedings of the Royal Societyof London, B, 263, 593–599.
Petry, H. M., Erichsen, J. T., & Szel, A. (1993). Immunocytochem-ical identification of photoreceptor populations in the tree shrewretina. Brain Research, 616, 344–350.
Petry, H. M., & Harosi, F. I. (1990). Visual pigments of the treeshrew (Tupaia belangeri ) and greater galago (Galago crasscicau-datus): a microspectrophotometric investigation. Vision Re-search, 30, 839–851.
Regan, B. C., Julliot, C., Simmen, B., Vienot, F., Charles-Do-minique, P., & Mollon, J. D. (1998). Frugivory and colourvision in Alouatta seniculus, a trichromatic platyrrhine monkey.Vision Research, 38, 3321–3327.
Rose, A. (1942). The relative sensitivities of television pick-uptubes, photographic film and the human eye. Proceedings of theInstitute of Radio Engineers, 30, 295–308.
Ruderman, D. L., Cronin, T. W., & Chiao, C.-C. (1998). Statisticsof cone responses to natural images: implications for visualcoding. Journal of the Optical Society of America, A, 15, 2036–2045.
Schaerer, S., & Neumeyer, C. (1996). Motion detection in goldfishinvestigated with the optomotor response is ‘color blind’. VisionResearch, 36, 4025–4034.
Schrodinger, E. (1920). Grundlinien einer Theorie der Farbenmetrikim Tagessehen. Ann. Physik, 63, 397–520.
Siebeck, U., & Marshall, J. (2000). The ocular media of reef fish.Vision Research (in press).
Szel, A., Rohlich, P., Caffe, A. R., & van Veen, T. (1996). Distri-bution of cone photoreceptors in the mammalian retina. Mi-croscopy Research Technique, 35, 445–462.
Vorobyev, M., Brandt, R., Peitsch, D., Laughlin, S. B., & Menzel,R. (2000a). Colour thresholds and receptor noise: behaviourand physiology compared. Vision Research (in press).
C.-C. Chiao et al. / Vision Research 40 (2000) 3257–3271 3271
Vorobyev, M., Marshall, N. J., Osorio, D., Hempel de Ibarra, N., &Menzel, R. (2000b). Colourful objects through animals eyes. ColorResearch and Application (in press).
Vorobyev, M., & Menzel, R. (1999). Flower advertisement for insects:Bees, a case study. In S. N. Archer, M. B. A. Djamgoz, E. R. Loew,J. C. Partridge, & S. Vallerga, Adapti6e mechanisms in the ecologyof 6ision (pp. 537–553). Dorcrecht: Kluwer Academic.
Vorobyev, M., & Osorio, D. (1998). Receptor noise as a determinantof colour thresholds. Proceedings of the Royal Society of London,B, 265, 351–358.
Vorobyev, M., Osorio, D., Bennett, A. T., Marshall, N. J., &Cuthill, I. C. (1998). Tetrachromacy, oil droplets and birdplumage colours. Journal of Comparati6e Physiology, A, 183,621–633.
Williams, D. R., & Roorda, A. (1999). The trichromatic cone mo-saic in the human eye. In K. R. Gegenfurtner, & L. T. Sharpe,Color 6ision: from genes to perception (pp. 113–122). Cam-bridge: Cambridge University Press.
Wyszecki, G., & Stiles, W. S. (1982). Color sciences: concepts andmethods, quantitati6e data and formulae. New York: Wiley.
.