spectral emissivity measurements of mercury's surface indicate mg
TRANSCRIPT
ARTICLE IN PRESS
Planetary and Space Science 57 (2009) 364–383
Contents lists available at ScienceDirect
Planetary and Space Science
0032-06
doi:10.1
� Corr
E-m
journal homepage: www.elsevier.com/locate/pss
Spectral emissivity measurements of Mercury’s surface indicate Mg- andCa-rich mineralogy, K-spar, Na-rich plagioclase, rutile, with possibleperovskite, and garnet
A.L. Sprague a,�, K.L. Donaldson Hanna b, R.W.H. Kozlowski c, J. Helbert d, A. Maturilli d,J.B. Warell e, J.L. Hora f
a Lunar and Planetary Laboratory, University of Arizona, 1629 E. University Blvd., Tucson, AZ 85721-0092, USAb Brown University, Providence, RI 02912, USAc Susquehanna University, Selinsgrove, PA 17870, USAd Institute for Planetary Research, DLR, Rutherfordstrasse 2, 12489 Berlin, Germanye Institutionen for Astronomi och Rymfysik, Uppsala Universitet, Uppsala, Swedenf Harvard-Smithsonian Center for Astrophysics, Cambridge, MA 02138, USA
a r t i c l e i n f o
Article history:
Received 8 October 2008
Received in revised form
14 January 2009
Accepted 15 January 2009Available online 29 January 2009
Keywords:
Mercury
Mercury’s surface composition
Iron-poor mineralogy
Spectroscopy of mercury’s surface
Mercury’s formation
33/$ - see front matter & 2009 Elsevier Ltd. A
016/j.pss.2009.01.006
esponding author. Tel.: 520 621 2282; fax: 52
ail address: [email protected] (A.L. Spr
a b s t r a c t
Mid-infrared 2-D spectroscopic measurements from 8.0 to 12.7mm of Mercury were taken using Boston
University’s Mid-Infrared Spectrometer and Imager (MIRSI) mounted on the NASA Infrared Telescope
Facility (IRTF) on Mauna Kea, Hawaii, 7–11 April 2006. Measurements reported here cover radar bright
region C, a dark plains region west of Caloris Basin, and the interior of Caloris Basin. By use of spectral
deconvolution with a large spectral library composed of many mineral compositions and grain size
separates, we fitted, or ‘‘unmixed’’, the Mercury spectra. We find mineral suites composed of
magnesium-rich orthopyroxene and olivine, Ca-, Mg-, Na-rich clinopyroxene, potassium feldspar, and
Na-bearing plagioclase feldspar. Both Ca- and Mg-rich garnet (pyrope and grossular, respectively) are
apparently present in small amounts. Opaque minerals are required for spectral matching, with rutile
(TiO2) repeatedly providing the ‘‘best fit’’. However, in the case of the radar bright region C, perovskite
also contributed to a very good fit. Caloris Basin infill is rich in both potassium feldspar and Na-rich
plagioclase. There is little or no olivine in the Caloris interior smooth plains. Together with the high
alkali content, this indicates that resurfacing magmas were low to intermediate in SiO2. Data suggest
the dark plains exterior to Caloris are highly differentiated low-iron basaltic magmas resulting in
material that might be classified as oligoclase basalts.
& 2009 Elsevier Ltd. All rights reserved.
1. Introduction
Here we present results of Mercury surface observations usingIRTF on Mauna Kea Hawaii. We used MIRSI (http://www.cfa.harvard.edu/mirsi/) to obtain mid-infrared spectra from three regions onMercury’s surface. It is important to know the composition ofMercury’s surface to build an understanding of the volcanic andthermal history of the planet, infer the composition of its crustand model the composition of the mantle on the assumption thatthe lavas were extracted from it by partial melting. To this end, wediscuss in this manuscript, measurements from radar brightregion C, dark plains west of Caloris Basin, and the interior ofCaloris Basin. The data presented here were obtained in 2006.Data reduction and analysis have been time consuming because
ll rights reserved.
0 6214933.
ague).
we have been pioneering the data analysis procedures which aredescribed here along with some details of the instrumentationused and the observations. First results from analysis of someMercury and lunar data obtained during the same time periodhave been presented previously (e.g. Hanna et al., 2006; Spragueet al., 2008), but this is the first time that a detailed description ofobservations, methods, results, and implications of these datafrom these three specially chosen regions have been presented.
1.1. Brief historical context
Many ground-based observations of Mercury and two NASAspacecraft have made measurements of Mercury. The surfacesuperficially resembles that of the Earth’s Moon, covered withsilicates, heavily cratered over much of the surface, with brightcrater ejecta rays against a darker background (cf. Strom et al.,1975; Davies et al., 1978). Imaging by the Mercury Dual Imaging
ARTICLE IN PRESS
A.L. Sprague et al. / Planetary and Space Science 57 (2009) 364–383 365
System (MDIS) on MESSENGER spacecraft has revealed volcanicvents, pyroclastics, and other evidence of extrusive volcanism(Head et al., 2008; Murchie et al., 2008). Briefly stated, Mercury’ssurface materials are low in FeO which is common in silicates onthe Moon, asteroids, and Earth (cf. Vilas, 1988; Warell et al., 2006.McClintock et al., 2008). Microwave imaging and modeling hasobserved Mercury’s regolith to be more transparent (lower inTi and Fe) than that of the Moon (cf. Mitchell and de Pater, 1994).Previous mid-infrared observations of Mercury’s surface at otherlocations (Sprague et al., 1994, 1997a, 2002; Sprague and Roush,1998; Emery et al., 1998, Cooper et al., 2001), have discerned aheterogeneous surface chemistry based on emissivity maxima,transparency minima and variations in spectral activity in Rest-strahlen bands between 7.7 and 13.5mm. These results arecomplementary to those from the Mercury Atmospheric andSurface Spectrometer (MASCS) (McClintock et al., 2008), MDIS(Robinson et al., 2008) and other data from instruments obtainedduring the first MESSENGER flyby of Mercury because the sameregions on Mercury’s surface were traversed (Solomon et al.,2008). Neither the MDIS nor the MASCS discerned the FeOabsorption band from Mercury’s surface materials at the locationsmeasured. The synergy between the MESSENGER observationsand our ground-based measurements will be discussed in detail inthe sections to follow.
2. Geologic context of three regions measured
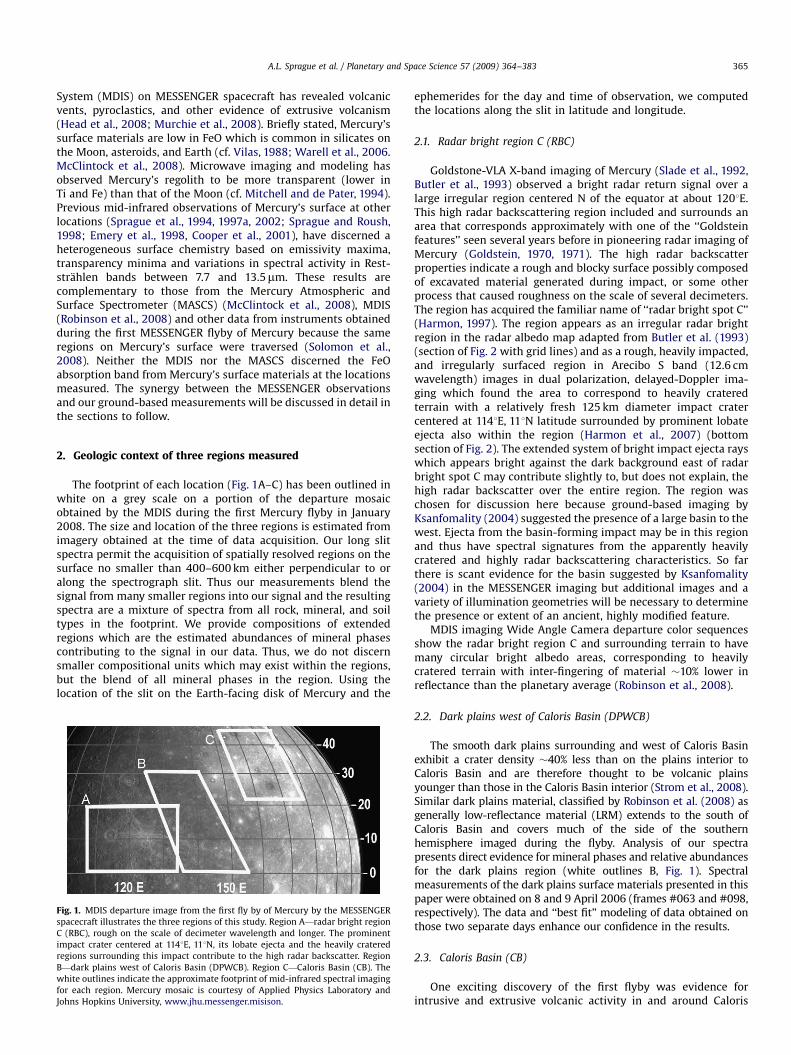
The footprint of each location (Fig. 1A–C) has been outlined inwhite on a grey scale on a portion of the departure mosaicobtained by the MDIS during the first Mercury flyby in January2008. The size and location of the three regions is estimated fromimagery obtained at the time of data acquisition. Our long slitspectra permit the acquisition of spatially resolved regions on thesurface no smaller than 400–600 km either perpendicular to oralong the spectrograph slit. Thus our measurements blend thesignal from many smaller regions into our signal and the resultingspectra are a mixture of spectra from all rock, mineral, and soiltypes in the footprint. We provide compositions of extendedregions which are the estimated abundances of mineral phasescontributing to the signal in our data. Thus, we do not discernsmaller compositional units which may exist within the regions,but the blend of all mineral phases in the region. Using thelocation of the slit on the Earth-facing disk of Mercury and the
Fig. 1. MDIS departure image from the first fly by of Mercury by the MESSENGER
spacecraft illustrates the three regions of this study. Region A—radar bright region
C (RBC), rough on the scale of decimeter wavelength and longer. The prominent
impact crater centered at 1141E, 111N, its lobate ejecta and the heavily cratered
regions surrounding this impact contribute to the high radar backscatter. Region
B—dark plains west of Caloris Basin (DPWCB). Region C—Caloris Basin (CB). The
white outlines indicate the approximate footprint of mid-infrared spectral imaging
for each region. Mercury mosaic is courtesy of Applied Physics Laboratory and
Johns Hopkins University, www.jhu.messenger.misison.
ephemerides for the day and time of observation, we computedthe locations along the slit in latitude and longitude.
2.1. Radar bright region C (RBC)
Goldstone-VLA X-band imaging of Mercury (Slade et al., 1992,Butler et al., 1993) observed a bright radar return signal over alarge irregular region centered N of the equator at about 1201E.This high radar backscattering region included and surrounds anarea that corresponds approximately with one of the ‘‘Goldsteinfeatures’’ seen several years before in pioneering radar imaging ofMercury (Goldstein, 1970, 1971). The high radar backscatterproperties indicate a rough and blocky surface possibly composedof excavated material generated during impact, or some otherprocess that caused roughness on the scale of several decimeters.The region has acquired the familiar name of ‘‘radar bright spot C’’(Harmon, 1997). The region appears as an irregular radar brightregion in the radar albedo map adapted from Butler et al. (1993)(section of Fig. 2 with grid lines) and as a rough, heavily impacted,and irregularly surfaced region in Arecibo S band (12.6 cmwavelength) images in dual polarization, delayed-Doppler ima-ging which found the area to correspond to heavily crateredterrain with a relatively fresh 125 km diameter impact cratercentered at 1141E, 111N latitude surrounded by prominent lobateejecta also within the region (Harmon et al., 2007) (bottomsection of Fig. 2). The extended system of bright impact ejecta rayswhich appears bright against the dark background east of radarbright spot C may contribute slightly to, but does not explain, thehigh radar backscatter over the entire region. The region waschosen for discussion here because ground-based imaging byKsanfomality (2004) suggested the presence of a large basin to thewest. Ejecta from the basin-forming impact may be in this regionand thus have spectral signatures from the apparently heavilycratered and highly radar backscattering characteristics. So farthere is scant evidence for the basin suggested by Ksanfomality(2004) in the MESSENGER imaging but additional images and avariety of illumination geometries will be necessary to determinethe presence or extent of an ancient, highly modified feature.
MDIS imaging Wide Angle Camera departure color sequencesshow the radar bright region C and surrounding terrain to havemany circular bright albedo areas, corresponding to heavilycratered terrain with inter-fingering of material �10% lower inreflectance than the planetary average (Robinson et al., 2008).
2.2. Dark plains west of Caloris Basin (DPWCB)
The smooth dark plains surrounding and west of Caloris Basinexhibit a crater density �40% less than on the plains interior toCaloris Basin and are therefore thought to be volcanic plainsyounger than those in the Caloris Basin interior (Strom et al., 2008).Similar dark plains material, classified by Robinson et al. (2008) asgenerally low-reflectance material (LRM) extends to the south ofCaloris Basin and covers much of the side of the southernhemisphere imaged during the flyby. Analysis of our spectrapresents direct evidence for mineral phases and relative abundancesfor the dark plains region (white outlines B, Fig. 1). Spectralmeasurements of the dark plains surface materials presented in thispaper were obtained on 8 and 9 April 2006 (frames #063 and #098,respectively). The data and ‘‘best fit’’ modeling of data obtained onthose two separate days enhance our confidence in the results.
2.3. Caloris Basin (CB)
One exciting discovery of the first flyby was evidence forintrusive and extrusive volcanic activity in and around Caloris

ARTICLE IN PRESS
Fig. 2. (top) Goldstone-VLA X-band imaging showing RBC as the dark irregular
patch between the equator and 301N and 100–1401E longitude (adapted from
Butler et al., 1993). (bottom) Arecibo S-band dual polarization, delay-Doppler
imaging showing heavily cratered terrain in the same region (adapted from Fig. 7,
Harmon et al., 2007).
Fig. 3. Images, taken in MIRSI’s imaging mode, just prior to the spectral image
integration for (a) RBC, (b) DPWCB, and (c) CB. The location and width of the MIRSI
spectrograph slit at the time of integration is indicated by the parallel black lines.
A.L. Sprague et al. / Planetary and Space Science 57 (2009) 364–383366
Basin. An extensive radial fracture system (Pantheon Fossae) withover 100 graben likely results from stress faulting followingsurface uplift, caused by pressure from upwelling magma into asystem of dikes near the basin center or volcanic vents observed inand around Caloris Basin (cf. Head et al., 2008, Murchie et al.,2008). While fracturing and faulting within Caloris Basin wasknown from Mariner 10 imaging and previously related to aperiod of uplift of the crater floor, possibly caused by eitherexterior loading lateral crustal flow (cf. Thomas et al., 1988,Watters et al., 2005), the MDIS imaging from the flyby haspermitted a much better understanding of the extensive volcanicactivity that has taken place within the Caloris rim material(Murchie et al., 2008). It has been proposed that the extensivefracture system within the basin, along with the high tempera-tures at the longitude of Caloris Basin at perihelion, facilitate thediffusion of potassium (K) into Mercury’s exosphere and cause the
enhanced signal of neutral atmospheric potassium emission(Sprague et al., 1990).
Our observations within Caloris Basin identify mineral phasesconsistent with MDIS imaging that shows a relatively high albedowith a redder slope than the surrounding dark plains. We discussmeasurements of materials in Caloris Basin obtained in twoconsecutive days (8 and 9 April 2006; frames #071 and #080,respectively) and outlined in white Fig. 1C.
3. Observations
Spectral measurements of Mercury and the Moon’s surfaceswere taken using Boston University’s MIRSI mounted on the NASAIRTF on Mauna Kea, Hawaii. Observations were obtained duringdaytime observations on 7–11 April 2006 covering longitudesbetween 1001 and 1841E. Mid-infrared standard stars, b Pegasus(b Peg) and a Bootis (a Boo), were measured in the sameobserving mode as Mercury. At the time of the observations,Mercury was between 7.4 and 7.9 arcsec in diameter, �0.46 AUfrom the Sun, with the sub-Earth longitude varying from 1881 to1621E longitude.
MIRSI is an imaging spectrograph with the 10-mm grismcovering 8–14mm with resolving power (l/Dl) equal to 200 and aslit width of 0.600. The MIRSI detector is a 16-channel 320�240Si:As IBC array developed by Raytheon; each channel measures20�240 pixels. Daytime observations are kept short to keep thedetector response within the linear regime in all 16 channelscharacterized by the same gain. More details about MIRSI can befound in Deutsch et al. (2003) and Kassis et al. (2006, 2008).
3.1. Mercury and standard star observations
Mercury was observed near maximum western elongation inthe early morning as it transited. b Peg (M2.5 II–III spectral typestar) was chosen because of its proximity to Mercury in the skyand its relatively large flux in the mid-infrared. Long slit spectrawere obtained for b Peg prior to and following Mercury obser-vations. Mercury and b Peg spectra were taken in chop/nod modeas is standard technique for mid-infrared observations. Weobtained narrow band filter images of the target (both Mercuryand standard star) at several wavelengths between 7.7 and 13mm(spectral data extend from 8.0 to 12.7mm) for flux calibration. Inaddition, an image shows the extent to which atmosphericturbulence smears the image of Mercury and, by inference, theview of Mercury’s surface in the long slit (see Fig. 3). Note that theregions along the slits in Fig. 3 are reprojected onto an MDISimage with a different geometry in Fig. 1.
The location of the slit on Mercury’s surface can be determinedusing ephemerides for Mercury for the exact time of spectralintegration. A good estimate of the seeing smear can be made bycomparing the observed image of Mercury to a model computedwith no seeing smear. Using both model and image, the location ofthe slit on the disk and the number of distinguishable sectors

ARTICLE IN PRESS
A.L. Sprague et al. / Planetary and Space Science 57 (2009) 364–383 367
along the slit in latitude and longitude can be determined. Thesignal along the portion of the slit that falls over the disk of theplanet, which is typically 6–8 arcsec in diameter, can be dividedinto latitude regions for spatially resolved spectral study. Thespatial extent of the spectrograph slit width and CCD array pixelare 0.6 and 0.3 arcsec. Mercury was 7.7 arcsec in diameter at thetime of measurement. With perfect ‘‘seeing’’ the spectrum wouldbe 26 lines (pixels) from north pole to south pole. Withatmospheric seeing, the spectrum contains more lines and, whenplotted, the flux approximates a Gaussian which is typical for slitspectroscopy of Mercury’s surface (see Sprague et al., 1997b) for adetailed study of this phenomenon and seeing deconvolutionmethod. Typically we use a simple Gaussian fit to the continuumfrom limb to limb along the slit which may fall anywhere on theilluminated disk and is not necessarily subtending a full diameter.For the sake of simplicity we divide the spectrum into four equalregions with the cut off at 2 sigma from the peak. Each frame has aslightly different seeing smear but on average each spatiallydiscrete sector is �600 km mapped along the slit. We name eachspectrum by date of collection, identify the spatial sectors as north(N), north-mid (NM), south-mid (SM), and south (S), respectively,and archive spectra for future analysis. In this paper we presentthe north mid-latitude sector over radar bright C and the darkplains west of Caloris Basin. In the case of Caloris Basin it wasnecessary to extract several lines from our spectral images thatdid not fall into one of the standard four divisions.
4. Data reduction
4.1. Sky removal, dispersion correction, and image rectification
Along with emitted light from Mercury or the standard star,MIRSI spectral images contain signal from the telescope, instru-ment, day sky, and dark current. Signals from the sky and darkcurrent are easily removed through a subtraction of chop and nodframes. Signal from the sky and dark current must be removedfrom a spectral image to increase its signal-to-noise ratio. Whileimages are collected in chop/nod mode, the secondary mirrorchops on target storing a spectral image in frames 0 and 1 of a FITSfile; the telescope then nods to the sky and the secondary mirrorchops on the sky storing a spectral image in frames 2 and 3 of thesame FITS file. Spectral images are dark noise and sky corrected bysubtracting the differenced sky frames from the differenced targetframes ((target 1�sky 1)�(target 2�sky 2)) in the usual fashionfor mid-infrared telescopic observations.
MIRSI images exhibit spectral and spatial distortions, curvaturein both x (wavelength dispersion) and y (spatial dimension)coordinates of the spectrum due to refraction of light as it passesthrough the optics. The correction of spectral and spatialdistortions is done using tools in Image Reduction and AnalysisFacility (IRAF) (Tody, 1986, 1993). A lunar spectrum obtainedduring the same observing period was chosen to fit dispersionfunctions across both lines and columns (320�240 pixels). Thechosen lunar spectrum had several distinct low albedo regions(dark shadows, maria), several rows tall that were used to fit thedispersion function in the y-coordinate. Ozone and water absorp-tion bands were chosen in the lunar image to fit the dispersionfunction in the x-coordinate. IRAF tools were used to fit dispersionfunctions curvatures with polynomials and then pixels were re-binned for linearization in both dimensions. The dispersionfunctions were then applied to all spectra.
Telluric absorptions measured with the MIRSI grism andtelluric absorptions in atmospheric spectra collected with the JetPropulsion Laboratory’s (JPL) MkIV Interferometer were used forcalculating the wavelength dispersion of MIRSI’s 10mm grism. The
JPL MkIV Interferometer is a high-resolution Fourier TransformInfra-Red (FTIR) Spectrometer designed to remotely sense thecomposition of the Earth’s atmosphere by the technique of solarabsorption spectrometry (Toon, 1991). Spectral observations rangefrom low air mass (solar zenith angle ¼ 201) to high air mass(solar zenith angle ¼ 851) under warm and cold conditions (fromplus 101 to negative 15 1C). MkIV spectra were convolved to the slitfunction of the MIRSI instrument to smooth the high-resolutionMkIV spectra to the lower resolution MIRSI spectra. The slitfunction for the 10mm grism is a Gaussian function with a sigmaof 1.6 pixels (or 0.0306mm assuming a linear spectral dispersionof 0.0191mm). A running Gaussian smooth was performed for a2-sigma Gaussian width of 1.0, 1.2, and 1.6 pixels full-width half-maxima. Five telluric features observed in both the MkIV andMIRSI spectra were chosen: an H2O feature at 8.111mm, three O3
features at 9.486, 9.573, and 9.651mm and a CO2 at 12.709mm.Pixel positions in the x-coordinate for the five telluric featureswere found in the MIRSI calibration spectrum and were then fittedwith a polynomial function to map the wavelength scale.
4.2. Correction for telluric absorptions, the stellar spectral shape and
thermal continuum
After the spectral images had been corrected for instrumentaleffects it was necessary to remove telluric absorptions, stellarspectral shape, and the thermal slope of Mercury’s rough surfaceto prepare Mercury spectra for spectral ‘‘unmixing’’ (hereaftercalled UM). We used the standard method for removing telluricabsorptions in telescopic spectral data (taking a ratio of the targetspectrum to a spectrum of a well characterized mid-infraredstandard star collected at the same air mass as the targetspectrum). Stellar spectral images were collected as close aspossible on the sky and in time to Mercury spectra in order toapproximate the same atmospheric depth and opacity. In thecases when the identical air mass was not achieved, we‘‘corrected’’ stellar spectra to the air mass of Mercury. This wasmade possible by computing extinction coefficients from sequen-tial stellar spectra for each MIRSI wavelength and interpolatingthe actual spectrum to the airmass at which the Mercuryspectrum had been obtained. After division of Mercury spectraby standard star spectra to complete telluric corrections, thequotient was corrected for the stellar spectral slope and features.Infrared standard stars’ spectral shapes have been determined byCohen et al. (1995, 1996). Stellar spectra contain absorption bandsdue to SiO and CO fundamentals and a general continuum whoseshape is controlled mainly by effective temperature. Aftercorrection of the Mercury spectra for both stellar shape andtelluric absorptions we divide by a rough surface thermal model(Emery et al., 1998) computed for the exact ephemerides of thetarget during the observation. This division removes the spectralslope introduced by Mercury’s hot rough surface and prepares itfor deconvolution processing (spectral unmixing).
5. Spectral analysis
Our Mercury spectra have been analyzed by spectral UM usingan established spectral deconvolution algorithm based on theprinciple that the emitted or reflected energy from a multi-mineralic surface is a linear combination of the energy radiatedfrom each component in proportion to its areal percentage(Ramsey, 1996; Ramsey and Christensen, 1998). Using thisassumption, computation of the percentage of spectral end-member minerals with known particle size and density approx-imates the abundance of each end-member present. Ramsey andChristensen (1998) generated laboratory mixes with varying

ARTICLE IN PRESS
A.L. Sprague et al. / Planetary and Space Science 57 (2009) 364–383368
abundances of hornblende, microcline, oligoclase, and quartz andperformed a blind retrieval test by selecting all end-members.Results for the blind retrieval test showed that for each mineral inthe mixture differences between the UM abundance and the actualabundance could be as great as 12%, but the average difference was4%. For some of the laboratory mixtures, the UM fitted minerals thatare not present in the laboratory mixture, but these are fitted withabundances of less than 5%. This indicates that the linear spectraldeconvolution method can be used to predict mineral abundancesto within 5% in the cases where the spectral end-members arespectra from the actual sample mineral mixes. An iterative processof comparison of linear combinations of spectra end-members tothe target data is made. A root mean square (RMS) error to the fit tothe target data over the entire spectral range and a residual modelspectrum are generated for each ‘‘best fit model’’ (BFM) spectrum. Ablackbody can also be added to the spectral end-member UM toaccommodate variations in the spectral contrast between the inputspectrum and the best model fit (Hamilton et al., 1997).
For our Mercury spectral fitting, the best model fits aredependent our spectral libraries, built with many mineral composi-tions and different grain size fractions. They are unlikely to have theexact composition and grain size mixture of the regolith on Mercury(which of course we do not know). Thus best fit models areapproximations of what might be present on Mercury’s surface orrepresentative of mineral phases and grain sizes present given theassemblage of spectra used in the spectral library during the UM.Hamilton and Christensen (2000) found that end-members chosenby the deconvolution process for the best model fit will beoverestimated if some spectral end-members of the exact mineralcomposition are absent from the spectral library. Hamilton et al.(1997) demonstrated this with the olivine solid solution (fayalite toforsterite) and cautions that the compositions of the spectral end-members chosen will only approximate those of the actual targetspectrum. Minor and trace constituents usually are not accuratelychosen because their contributions to the bulk spectrum may insome cases be slight and the algorithm will judge their contributionas null. Exceptions to this case occur when the minor constituenthas a distinctive spectral feature that fits a spectral feature in thetarget spectrum. An additional complication that may lead flawedabundance computations is that a spectrum of the correct mineralphase may be present in the spectral library but not measured atthe correct grain size to perfectly match that of the regolith for theregion measured. To our knowledge no good quantitative study ofthese effects has yet been published.
5.1. Previous use of deconvolution algorithm in mid-infrared
analyses
Previous successes interpreting target spectra with thisspectral deconvolution algorithm include: Hamilton et al. (1997)who fitted whole Martian meteorite samples representing the SNCmeteorites, Feely and Christensen (1999) who modeled wholerock samples that had previously been studied using petrographictechniques, Wyatt et al. (2001) who determined the phaseabundances of whole igneous rocks and comparing the resultswith phase abundances determined by electron microprobemapping, and Milam et al. (2007) who modeled complex mixturesof plagioclase sands and other mineral phases. In addition,Donaldson Hanna and Sprague (2009) have identified composi-tions of HED meteorites and Vesta from deconvolution oflaboratory and telescopic mid-infrared spectra, respectively.
5.2. Spectral libraries and spectral library end-members
For our Mercury spectral studies it was necessary to build alarge spectral library of many mineral compositions and for many
grain size separates (a good discussion of the effect of small andhyperfine grain sizes on rock, mineral, and soil spectra can befound in Mustard and Hays, 1997). Mercury’s surface is wellcomminuted from meteoroid impact and its thermal infraredspectrum has been shown to be dominated by small grain sizeparticles from observations in the VISNIR (Dollfus and Auriere,1974; Warell and Blewett, 2004) and in the mid-infrared(cf. Henderson and Jakosky, 1997; Emery et al., 1998). Eventhough evidence suggests there is little or no FeO absorption innear-infrared spectra from Mercury (see Warell et al., 2006) we donot assume any single starting set of rock or mineral spectra thatmight be a priori ‘‘suitable’’ like lunar or martian suites ofminerals, or only minerals low in FeO. Our spectral libraries havespectral end-members (a term used to denote the spectra in thelibrary that may be used to fit the target spectrum during thedeconvolution; from Christensen et al., 2000) with a broad rangeof composition representing rock-forming minerals on Earth, theMoon, asteroids, and meteorites. We use spectra from severallarge spectral libraries including reflectance spectra of plagioclaseglasses and typical lunar samples (Nash, 1991; Nash and Salisbury,1991, respectively) and spectra from the ASTER collection (Hook,1998). The ASTER collection includes laboratory reflectancespectra from two sources: Johns Hopkins University (JHU)(Salisbury et al., 1987, 1988, 1991) and JPL (Grove et al., 1992).JHU end-member samples were sieved into two grain sizefractions (0–74 and 74–250mm) and reflectance measurementswere obtained using a Nicolet* 5 DxB interferometer spectro-meter. JPL end-member samples were sieved into three grain sizefractions (o45, 45–125, and 125–500mm) and reflectancemeasurements were obtained over the 2.2–25.0mm spectral rangeusing a Nicolet interferometer spectrometer. Many more mineralspecies and phases were available to be easily downloaded fromthe Brown University RELAB spectral library (Pieters and Hiroi,2004) where samples are of varying grain size and are measuredover the 2.0–25.0mm spectral range using a Thermo Nicolet Nexus870 spectrometer. We also obtained end-member samples ofvarying grain size fractions from the USGS spectral library (Clarket al., 2007) measured using a Nicolet Fourier Transform Infra-Red(FTIR) interferometer spectrometer covering 1.3–150mm.
We used selected emittance spectra from two sources. (1) TheArizona State University (ASU) spectral library (Ruff et al., 1997,Christensen et al., 2000) where end-member samples availableare mostly of a single grain size (710–1000mm). Thermal emissionspectra are collected under a nitrogen purge at over the2.0–25.0mm spectral range using a Mattson Cygnus 100 inter-ferometric spectrometer. (2) The Planetary Emission Laboratory(PEL) established to support future mid-infrared spectral mea-surements of Mercury’s surface by the Mercury Emission Radio-meter and Spectrometer (MERTIS) (Helbert et al., 2007; Helbertand Maturilli, 2008; Hiesinger et al., 2008; Maturilli et al., 2006,2008) as part of the BepiColombo mission (Benkhoff et al., 2009)to Mercury that is scheduled for a 2014 launch. Laboratorymeasurements are made of many mineral types and of four grainsize fractions: some of them in the o25, 25–63, 63–90, and90–125mm range (Maturilli et al., 2006), others in the o25,25–63, 63–125, and 125–250mm range (Maturilli et al., 2008).Thermal emission spectra are collected over 6.3–22.0mm using aFourier transform infrared spectrometer (Maturilli et al., 2006).Systematic measurements are made at incremental temperaturesappropriate for Mercury’s regolith; 100–700 K (Helbert andMaturilli, 2008). These spectra are accumulated and categorizedin the Berlin Emissivity Database (BED). The chamber for thevacuum measurements has been purchased but the laboratorysetup and the expected spectral library are not yet available.
Our Mercury spectra are emittance spectra emanating fromsurface materials at a wide range of temperatures, mostly hotter

ARTICLE IN PRESS
A.L. Sprague et al. / Planetary and Space Science 57 (2009) 364–383 369
than room temperature, in a vacuum environment. Laboratoryspectra obtained in such conditions are not available. Thus largereflectance and emissivity spectral libraries generated at roomtemperature and one bar pressure are used in our deconvolutionprocess. We inverted the reflectance spectra to emittance usingKirchoff’s law (Emissivity ¼ 1�Reflectance), the well-knownrelationship that is regularly used in remote sensing applications(Salisbury et al., 1994). All of the measurements of the spectrallibraries listed above were made in reflectance at room tempera-ture and at one bar atmosphere. Small differences betweenbiconical reflectance and hemispherical reflectance spectra ofthe same laboratory sample have been thoroughly discussed bySalisbury et al. (1994) and there are slight departures from anexact application of Kirchoff’s Law to the former. The additionaluncertainty in the deconvolution is likely to be commensuratewith the small differences in conversion of the two types ofreflectance spectra. We combined the spectra measured inemittance with the inverted reflectance spectra to form ourworking spectral end-member library. Diagnostic absorptionbands may not be quantitatively reproduced among thesedifferent types of spectra for the same exact mineral phase andgrain size but their use is the best we could do at this time.
Fig. 4. Spectral unmixing of HED meteorites. Figure adapted from Donaldson
Hanna and Sprague (2009). For discussion see Section 6, page 14.
Fig. 5. Mercury spectrum #071 from Caloris Basin is compared to best fit models
computed using three different spectral libraries: (top) minerals found in aubrite
meteorites, (middle) minerals found in HED meteorites, and (bottom) lunar sample
soils. For discussion see Section 6, page 15.
6. Previous results and spectral library comparisons
We have found it instructive to use the same spectral librariesused to successfully model Howardite, Eucrite, and Diogenite(HED) meteorites, aubrite meteorites, Vesta, and the Moon to UMspectra from Mercury. If we restrict ourselves to the same mineralphase end-members for deconvolution of Mercury spectra theresults are not satisfactory. This is an important point because itmay not be obvious that some spectral end-member libraries havemineral suites that are suited for the HED meteorites or aubrites,for example, but not for Mercury. It was not obvious until thesecomparisons were made to the HED library, the Vesta library, andthe lunar library that no good matches over the entire wavelengthrange were possible. This important result is now examined insome detail. Figs. 4–6 illustrate this point. Donaldson Hanna andSprague (2009) found good spectral deconvolution matches tospectra of differentiated meteorites Johnstown (diogenite) andBholghati (howardite) with excellent correspondence to thecorrect mineral suites known to be present in them. The spectraldeconvolution algorithm produces a best fit using the primaryminerals for the Howardite meteorite (low- and high-Ca pyroxeneand plagioclase feldspar) with minor amounts of chromite andolivine (Fo89). The major phase end-members (greater than10 vol%) are plotted in Fig. 4. Major minerals chosen in the bestmodel fit included low-Ca pyroxene, high-Ca pyroxene, andplagioclase. Two low-Ca pyroxenes were chosen: a BED pigeonitewith a grain size fraction of 25–63mm and USGS hypersthene(PYX02) with a grain size fraction of 4250mm. Compositions ofboth the pigeonite and hypersthene end-member samples fitwithin the large phase range measured by Furhman and Papike(1981). The deconvolution algorithm overestimated the modalabundance of low-Ca pyroxene by 6% over the measured range.The high-Ca pyroxene chosen for the best fit model is a RELABZagami pyroxene with a grain size fraction of 0–50mm. The modalabundance of high-Ca pyroxene (24%) determined by thedeconvolution algorithm falls within the measured range andother derived mineral phases and abundances for Bholghati fitwithin the definition of a Howardite meteorite.
Also shown in Fig. 4 is the deconvolution UM for Johnstown,the largest representative by mass of the diogenite class ofmeteorites (Floran et al., 1981). Diogenites are dominated(approximately 84–100 vol%) by orthopyroxene with minor
minerals (approximately 0–5 vol%) chromite and olivine andaccessory minerals (approximately 0–2 vol%) diopside, troilite,metal, a silica phase, and rare phosphates (Mittlefehldt et al.,1998). The spectral deconvolution algorithm produces a best fitusing the primary mineral for the diogenite meteorite (low-Capyroxene) with minor amounts of plagioclase and olivine. The
ARTICLE IN PRESS
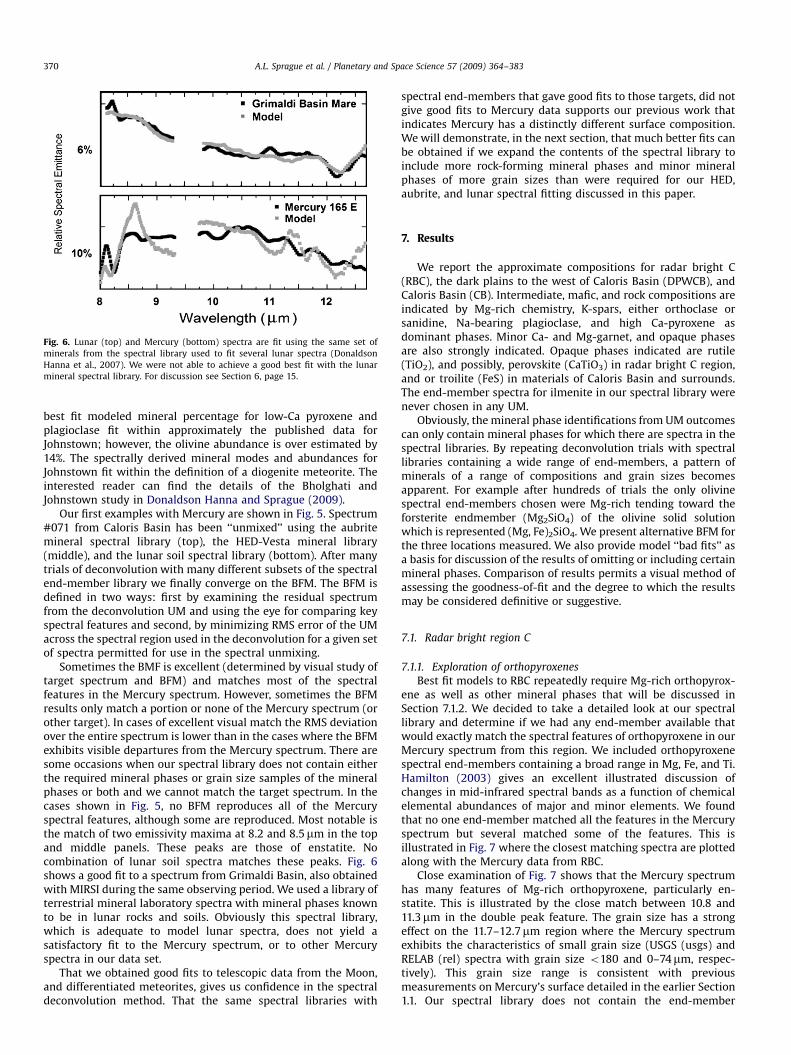
Fig. 6. Lunar (top) and Mercury (bottom) spectra are fit using the same set of
minerals from the spectral library used to fit several lunar spectra (Donaldson
Hanna et al., 2007). We were not able to achieve a good best fit with the lunar
mineral spectral library. For discussion see Section 6, page 15.
A.L. Sprague et al. / Planetary and Space Science 57 (2009) 364–383370
best fit modeled mineral percentage for low-Ca pyroxene andplagioclase fit within approximately the published data forJohnstown; however, the olivine abundance is over estimated by14%. The spectrally derived mineral modes and abundances forJohnstown fit within the definition of a diogenite meteorite. Theinterested reader can find the details of the Bholghati andJohnstown study in Donaldson Hanna and Sprague (2009).
Our first examples with Mercury are shown in Fig. 5. Spectrum#071 from Caloris Basin has been ‘‘unmixed’’ using the aubritemineral spectral library (top), the HED-Vesta mineral library(middle), and the lunar soil spectral library (bottom). After manytrials of deconvolution with many different subsets of the spectralend-member library we finally converge on the BFM. The BFM isdefined in two ways: first by examining the residual spectrumfrom the deconvolution UM and using the eye for comparing keyspectral features and second, by minimizing RMS error of the UMacross the spectral region used in the deconvolution for a given setof spectra permitted for use in the spectral unmixing.
Sometimes the BMF is excellent (determined by visual study oftarget spectrum and BFM) and matches most of the spectralfeatures in the Mercury spectrum. However, sometimes the BFMresults only match a portion or none of the Mercury spectrum (orother target). In cases of excellent visual match the RMS deviationover the entire spectrum is lower than in the cases where the BFMexhibits visible departures from the Mercury spectrum. There aresome occasions when our spectral library does not contain eitherthe required mineral phases or grain size samples of the mineralphases or both and we cannot match the target spectrum. In thecases shown in Fig. 5, no BFM reproduces all of the Mercuryspectral features, although some are reproduced. Most notable isthe match of two emissivity maxima at 8.2 and 8.5mm in the topand middle panels. These peaks are those of enstatite. Nocombination of lunar soil spectra matches these peaks. Fig. 6shows a good fit to a spectrum from Grimaldi Basin, also obtainedwith MIRSI during the same observing period. We used a library ofterrestrial mineral laboratory spectra with mineral phases knownto be in lunar rocks and soils. Obviously this spectral library,which is adequate to model lunar spectra, does not yield asatisfactory fit to the Mercury spectrum, or to other Mercuryspectra in our data set.
That we obtained good fits to telescopic data from the Moon,and differentiated meteorites, gives us confidence in the spectraldeconvolution method. That the same spectral libraries with
spectral end-members that gave good fits to those targets, did notgive good fits to Mercury data supports our previous work thatindicates Mercury has a distinctly different surface composition.We will demonstrate, in the next section, that much better fits canbe obtained if we expand the contents of the spectral library toinclude more rock-forming mineral phases and minor mineralphases of more grain sizes than were required for our HED,aubrite, and lunar spectral fitting discussed in this paper.
7. Results
We report the approximate compositions for radar bright C(RBC), the dark plains to the west of Caloris Basin (DPWCB), andCaloris Basin (CB). Intermediate, mafic, and rock compositions areindicated by Mg-rich chemistry, K-spars, either orthoclase orsanidine, Na-bearing plagioclase, and high Ca-pyroxene asdominant phases. Minor Ca- and Mg-garnet, and opaque phasesare also strongly indicated. Opaque phases indicated are rutile(TiO2), and possibly, perovskite (CaTiO3) in radar bright C region,and or troilite (FeS) in materials of Caloris Basin and surrounds.The end-member spectra for ilmenite in our spectral library werenever chosen in any UM.
Obviously, the mineral phase identifications from UM outcomescan only contain mineral phases for which there are spectra in thespectral libraries. By repeating deconvolution trials with spectrallibraries containing a wide range of end-members, a pattern ofminerals of a range of compositions and grain sizes becomesapparent. For example after hundreds of trials the only olivinespectral end-members chosen were Mg-rich tending toward theforsterite endmember (Mg2SiO4) of the olivine solid solutionwhich is represented (Mg, Fe)2SiO4. We present alternative BFM forthe three locations measured. We also provide model ‘‘bad fits’’ asa basis for discussion of the results of omitting or including certainmineral phases. Comparison of results permits a visual method ofassessing the goodness-of-fit and the degree to which the resultsmay be considered definitive or suggestive.
7.1. Radar bright region C
7.1.1. Exploration of orthopyroxenes
Best fit models to RBC repeatedly require Mg-rich orthopyrox-ene as well as other mineral phases that will be discussed inSection 7.1.2. We decided to take a detailed look at our spectrallibrary and determine if we had any end-member available thatwould exactly match the spectral features of orthopyroxene in ourMercury spectrum from this region. We included orthopyroxenespectral end-members containing a broad range in Mg, Fe, and Ti.Hamilton (2003) gives an excellent illustrated discussion ofchanges in mid-infrared spectral bands as a function of chemicalelemental abundances of major and minor elements. We foundthat no one end-member matched all the features in the Mercuryspectrum but several matched some of the features. This isillustrated in Fig. 7 where the closest matching spectra are plottedalong with the Mercury data from RBC.
Close examination of Fig. 7 shows that the Mercury spectrumhas many features of Mg-rich orthopyroxene, particularly en-statite. This is illustrated by the close match between 10.8 and11.3mm in the double peak feature. The grain size has a strongeffect on the 11.7–12.7mm region where the Mercury spectrumexhibits the characteristics of small grain size (USGS (usgs) andRELAB (rel) spectra with grain size o180 and 0–74mm, respec-tively). This grain size range is consistent with previousmeasurements on Mercury’s surface detailed in the earlier Section1.1. Our spectral library does not contain the end-member

ARTICLE IN PRESS
Fig. 7. Mercury data from RBC are plotted along with a selection of orthopyroxene
spectra from our working spectral library. It is apparent that the double peaked
feature between 10.8 and 11.3mm is that of Mg-rich orthopyroxene, probably
enstatite (compared to enstatite_710_1000_Hamilton_ASU) but we do not have a
perfect match in both grain size and composition.
A.L. Sprague et al. / Planetary and Space Science 57 (2009) 364–383 371
orthopyroxene spectra that can match all of the spectral featureslikely caused by orthopyroxene mineral phase.
Fig. 8. (a) JHU orthoclase and sanidine, 0–74mm grain size fractions; (b) rutile
(TiO2), spectra most often providing best fit for opaque phase; (c) perovskite
(CaTiO3) chosen as opaque in radar bright region C; (d) troilite was chosen when
rutile was not permitted, (e) ilmenite (Fe2TiO3), never chosen, when rutile or other
opaque was permitted.
7.1.2. Other mineral phases
Early in the deconvolution ‘‘unmixing’’ we found that the bestmatches were always from the small grain size mineral separates(0–25mm; 25–63mm; 0–74mm; and so on) even though thecoarse grain size separates of the same compositions wereincluded as end-members. Several mineral phases were repeat-edly chosen, including Mg-rich olivine, Mg- and Ca-rich pyrox-enes, and Mg- and Ca-rich garnets and potassium feldspar(K-spar). However, for K-spar, both orthoclase and sanidine werechosen for different regions. We also found that an opaque phasewas required for the best fits but no one opaque phase was chosenexclusively. We found that rutile was the significant contributingopaque phases to the BFM. Perovskite and troilite were alsochosen. Ilmenite (FeTiO3) was chosen in two cases when spectrafrom no other opaque were available in the spectral unmixing.Plagioclase end-members chosen in the deconvolution arerepeatedly Na-rich trending between bytownite and albite.
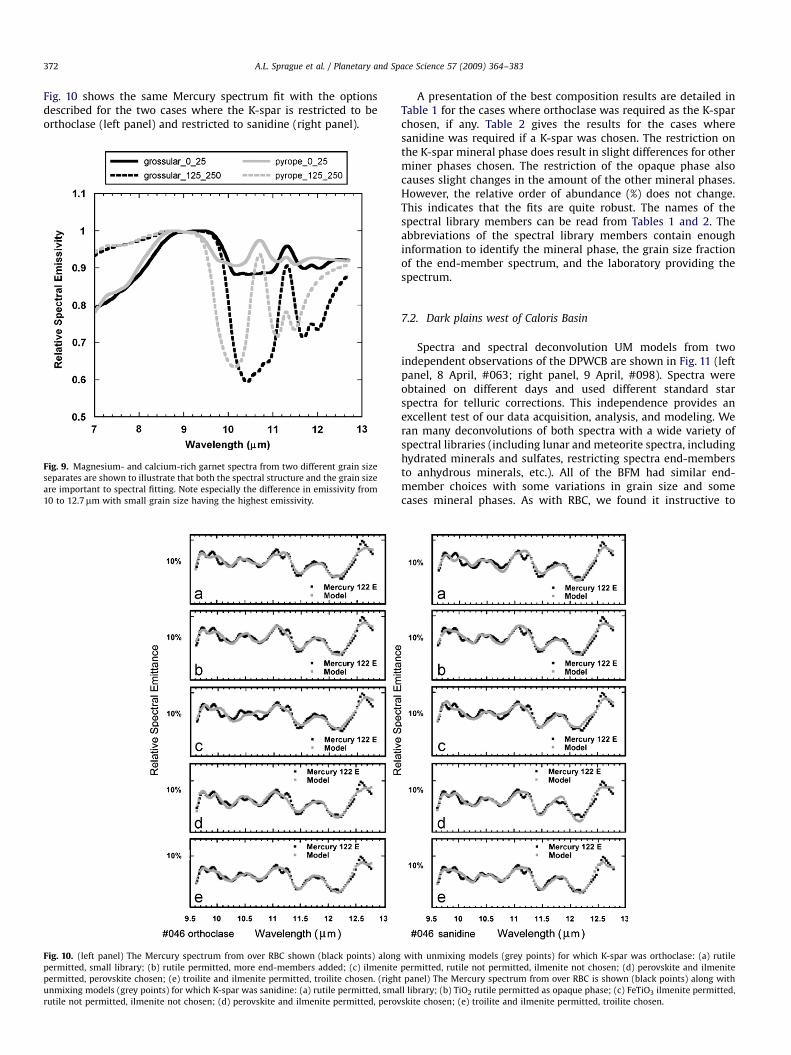
In an effort to determine our uncertainties and to explorecosmochemical differences that might be exhibited by the spectraand the good fits, we ran many models with restricted spectralend-member options for comparison. For example, we mademany deconvolutions where we permitted only orthoclase orsanidine, but not both and found the BFM for each. There are onlyminor visual spectral differences between the orthoclase andsanidine spectra in our library (Fig. 8, top panel). For RBC, the bestUM included orthoclase or sanidine 100% of the time, but thechoice did not seem to have an obvious effect on the best UMspectrum. Orthoclase and sanidine were chosen equally often.This presented serious ambiguity in our ability to identify whichphase was present and prevents discussing the petrologicsignificance of discrimination between the two phases. Alsodifficult to visually determine was the effect on goodness-of-fitcaused by opaque phases that might be present at Mercury andpresent in our library (Fig. 8, bottom three panels). Every
deconvolution that had a satisfactory fit contained minor amountsof garnet. The garnets chosen were always the Mg- (grossular) orCa- (pyrope) phases (Fig. 9). Almandine, the Fe-rich garnet, wasnever chosen although several spectra of different grain sizefractions were in the library.
To explore subtle differences between end-member choices, weran five cases of ‘‘unmixing’’ the Mercury spectrum from RBC withorthoclase as the only permitted K-spar choice. We then repeatedthe same five cases with sanidine as the only K-spar choice. Thefive cases altered which opaque phase was permitted as a possibleend-member in the solution. We include the fits from work donefor a Lunar and Planetary Science Conference poster (Sprague et al.,2008). The spectral deconvolutions for that study were obtainedusing an 89 member spectral library. These BFM are shown incases for each of the sanidine and orthoclase trials. All other UMwere made with a much larger spectral library with 327 members.The choices for opaques were: (a) rutile included, 89 memberspectral library, (b) rutile (TiO2), (c) ilmenite (FeTiO3) (permittedbut not chosen), (d) perovskite (CaTiO3), and (e) troilite (FeS).
ARTICLE IN PRESS
A.L. Sprague et al. / Planetary and Space Science 57 (2009) 364–383372
Fig. 10 shows the same Mercury spectrum fit with the optionsdescribed for the two cases where the K-spar is restricted to beorthoclase (left panel) and restricted to sanidine (right panel).
Fig. 9. Magnesium- and calcium-rich garnet spectra from two different grain size
separates are shown to illustrate that both the spectral structure and the grain size
are important to spectral fitting. Note especially the difference in emissivity from
10 to 12.7mm with small grain size having the highest emissivity.
Fig. 10. (left panel) The Mercury spectrum from over RBC shown (black points) along
permitted, small library; (b) rutile permitted, more end-members added; (c) ilmenite
permitted, perovskite chosen; (e) troilite and ilmenite permitted, troilite chosen. (righ
unmixing models (grey points) for which K-spar was sanidine: (a) rutile permitted, sma
rutile not permitted, ilmenite not chosen; (d) perovskite and ilmenite permitted, perov
A presentation of the best composition results are detailed inTable 1 for the cases where orthoclase was required as the K-sparchosen, if any. Table 2 gives the results for the cases wheresanidine was required if a K-spar was chosen. The restriction onthe K-spar mineral phase does result in slight differences for otherminer phases chosen. The restriction of the opaque phase alsocauses slight changes in the amount of the other mineral phases.However, the relative order of abundance (%) does not change.This indicates that the fits are quite robust. The names of thespectral library members can be read from Tables 1 and 2. Theabbreviations of the spectral library members contain enoughinformation to identify the mineral phase, the grain size fractionof the end-member spectrum, and the laboratory providing thespectrum.
7.2. Dark plains west of Caloris Basin
Spectra and spectral deconvolution UM models from twoindependent observations of the DPWCB are shown in Fig. 11 (leftpanel, 8 April, #063; right panel, 9 April, #098). Spectra wereobtained on different days and used different standard starspectra for telluric corrections. This independence provides anexcellent test of our data acquisition, analysis, and modeling. Weran many deconvolutions of both spectra with a wide variety ofspectral libraries (including lunar and meteorite spectra, includinghydrated minerals and sulfates, restricting spectra end-membersto anhydrous minerals, etc.). All of the BFM had similar end-member choices with some variations in grain size and somecases mineral phases. As with RBC, we found it instructive to
with unmixing models (grey points) for which K-spar was orthoclase: (a) rutile
permitted, rutile not permitted, ilmenite not chosen; (d) perovskite and ilmenite
t panel) The Mercury spectrum from over RBC is shown (black points) along with
ll library; (b) TiO2 rutile permitted as opaque phase; (c) FeTiO3 ilmenite permitted,
skite chosen; (e) troilite and ilmenite permitted, troilite chosen.
ARTICLE IN PRESS
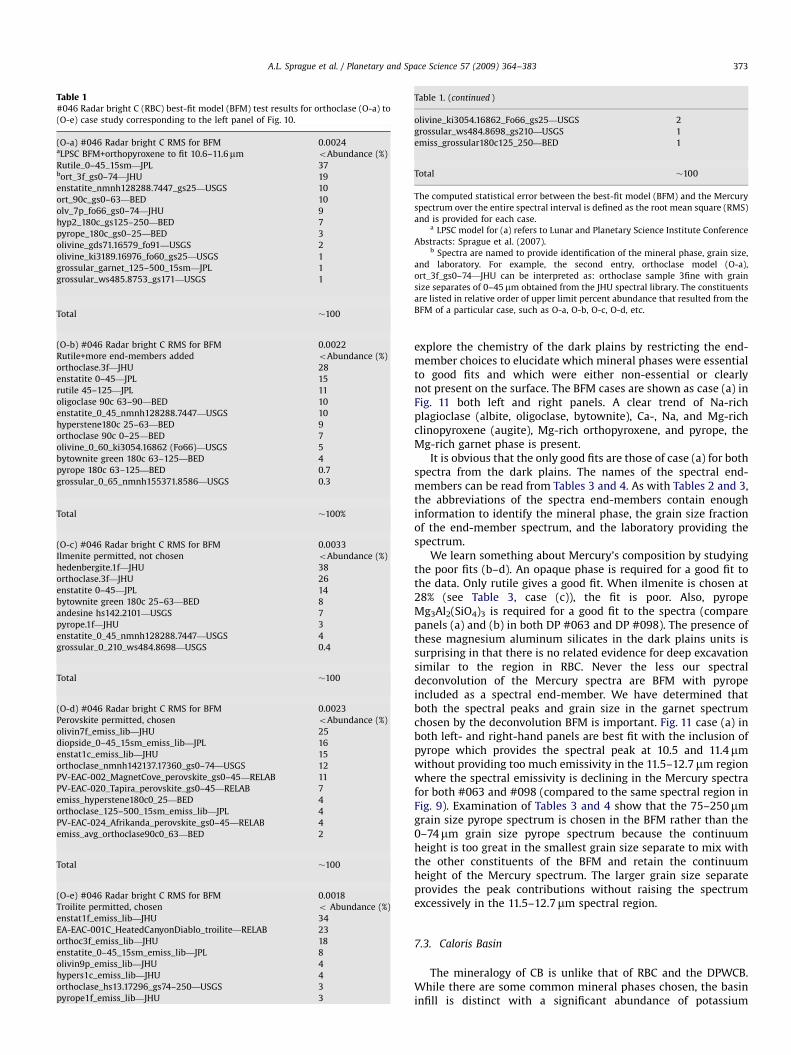
Table 1#046 Radar bright C (RBC) best-fit model (BFM) test results for orthoclase (O-a) to
(O-e) case study corresponding to the left panel of Fig. 10.
(O-a) #046 Radar bright C RMS for BFM 0.0024aLPSC BFM+orthopyroxene to fit 10.6–11.6mm oAbundance (%)
Rutile_0–45_15sm—JPL 37bort_3f_gs0–74—JHU 19
enstatite_nmnh128288.7447_gs25—USGS 10
ort_90c_gs0–63—BED 10
olv_7p_fo66_gs0–74—JHU 9
hyp2_180c_gs125–250—BED 7
pyrope_180c_gs0–25—BED 3
olivine_gds71.16579_fo91—USGS 2
olivine_ki3189.16976_fo60_gs25—USGS 1
grossular_garnet_125–500_15sm—JPL 1
grossular_ws485.8753_gs171—USGS 1
Total �100
(O-b) #046 Radar bright C RMS for BFM 0.0022
Rutile+more end-members added oAbundance (%)
orthoclase.3f—JHU 28
enstatite 0–45—JPL 15
rutile 45–125—JPL 11
oligoclase 90c 63–90—BED 10
enstatite_0_45_nmnh128288.7447—USGS 10
hyperstene180c 25–63—BED 9
orthoclase 90c 0–25—BED 7
olivine_0_60_ki3054.16862 (Fo66)—USGS 5
bytownite green 180c 63–125—BED 4
pyrope 180c 63–125—BED 0.7
grossular_0_65_nmnh155371.8586—USGS 0.3
Total �100%
(O-c) #046 Radar bright C RMS for BFM 0.0033
Ilmenite permitted, not chosen oAbundance (%)
hedenbergite.1f—JHU 38
orthoclase.3f—JHU 26
enstatite 0–45—JPL 14
bytownite green 180c 25–63—BED 8
andesine hs142.2101—USGS 7
pyrope.1f—JHU 3
enstatite_0_45_nmnh128288.7447—USGS 4
grossular_0_210_ws484.8698—USGS 0.4
Total �100
(O-d) #046 Radar bright C RMS for BFM 0.0023
Perovskite permitted, chosen oAbundance (%)
olivin7f_emiss_lib—JHU 25
diopside_0–45_15sm_emiss_lib—JPL 16
enstat1c_emiss_lib—JHU 15
orthoclase_nmnh142137.17360_gs0–74—USGS 12
PV-EAC-002_MagnetCove_perovskite_gs0–45—RELAB 11
PV-EAC-020_Tapira_perovskite_gs0–45—RELAB 7
emiss_hyperstene180c0_25—BED 4
orthoclase_125–500_15sm_emiss_lib—JPL 4
PV-EAC-024_Afrikanda_perovskite_gs0–45—RELAB 4
emiss_avg_orthoclase90c0_63—BED 2
Total �100
(O-e) #046 Radar bright C RMS for BFM 0.0018
Troilite permitted, chosen o Abundance (%)
enstat1f_emiss_lib—JHU 34
EA-EAC-001C_HeatedCanyonDiablo_troilite—RELAB 23
orthoc3f_emiss_lib—JHU 18
enstatite_0–45_15sm_emiss_lib—JPL 8
olivin9p_emiss_lib—JHU 4
hypers1c_emiss_lib—JHU 4
orthoclase_hs13.17296_gs74–250—USGS 3
pyrope1f_emiss_lib—JHU 3
Table 1. (continued )
olivine_ki3054.16862_Fo66_gs25—USGS 2
grossular_ws484.8698_gs210—USGS 1
emiss_grossular180c125_250—BED 1
Total �100
The computed statistical error between the best-fit model (BFM) and the Mercury
spectrum over the entire spectral interval is defined as the root mean square (RMS)
and is provided for each case.a LPSC model for (a) refers to Lunar and Planetary Science Institute Conference
Abstracts: Sprague et al. (2007).b Spectra are named to provide identification of the mineral phase, grain size,
and laboratory. For example, the second entry, orthoclase model (O-a),
ort_3f_gs0–74—JHU can be interpreted as: orthoclase sample 3fine with grain
size separates of 0–45mm obtained from the JHU spectral library. The constituents
are listed in relative order of upper limit percent abundance that resulted from the
BFM of a particular case, such as O-a, O-b, O-c, O-d, etc.
A.L. Sprague et al. / Planetary and Space Science 57 (2009) 364–383 373
explore the chemistry of the dark plains by restricting the end-member choices to elucidate which mineral phases were essentialto good fits and which were either non-essential or clearlynot present on the surface. The BFM cases are shown as case (a) inFig. 11 both left and right panels. A clear trend of Na-richplagioclase (albite, oligoclase, bytownite), Ca-, Na, and Mg-richclinopyroxene (augite), Mg-rich orthopyroxene, and pyrope, theMg-rich garnet phase is present.
It is obvious that the only good fits are those of case (a) for bothspectra from the dark plains. The names of the spectral end-members can be read from Tables 3 and 4. As with Tables 2 and 3,the abbreviations of the spectra end-members contain enoughinformation to identify the mineral phase, the grain size fractionof the end-member spectrum, and the laboratory providing thespectrum.
We learn something about Mercury’s composition by studyingthe poor fits (b–d). An opaque phase is required for a good fit tothe data. Only rutile gives a good fit. When ilmenite is chosen at28% (see Table 3, case (c)), the fit is poor. Also, pyropeMg3Al2(SiO4)3 is required for a good fit to the spectra (comparepanels (a) and (b) in both DP #063 and DP #098). The presence ofthese magnesium aluminum silicates in the dark plains units issurprising in that there is no related evidence for deep excavationsimilar to the region in RBC. Never the less our spectraldeconvolution of the Mercury spectra are BFM with pyropeincluded as a spectral end-member. We have determined thatboth the spectral peaks and grain size in the garnet spectrumchosen by the deconvolution BFM is important. Fig. 11 case (a) inboth left- and right-hand panels are best fit with the inclusion ofpyrope which provides the spectral peak at 10.5 and 11.4mmwithout providing too much emissivity in the 11.5–12.7mm regionwhere the spectral emissivity is declining in the Mercury spectrafor both #063 and #098 (compared to the same spectral region inFig. 9). Examination of Tables 3 and 4 show that the 75–250mmgrain size pyrope spectrum is chosen in the BFM rather than the0–74mm grain size pyrope spectrum because the continuumheight is too great in the smallest grain size separate to mix withthe other constituents of the BFM and retain the continuumheight of the Mercury spectrum. The larger grain size separateprovides the peak contributions without raising the spectrumexcessively in the 11.5–12.7mm spectral region.
7.3. Caloris Basin
The mineralogy of CB is unlike that of RBC and the DPWCB.While there are some common mineral phases chosen, the basininfill is distinct with a significant abundance of potassium
ARTICLE IN PRESS
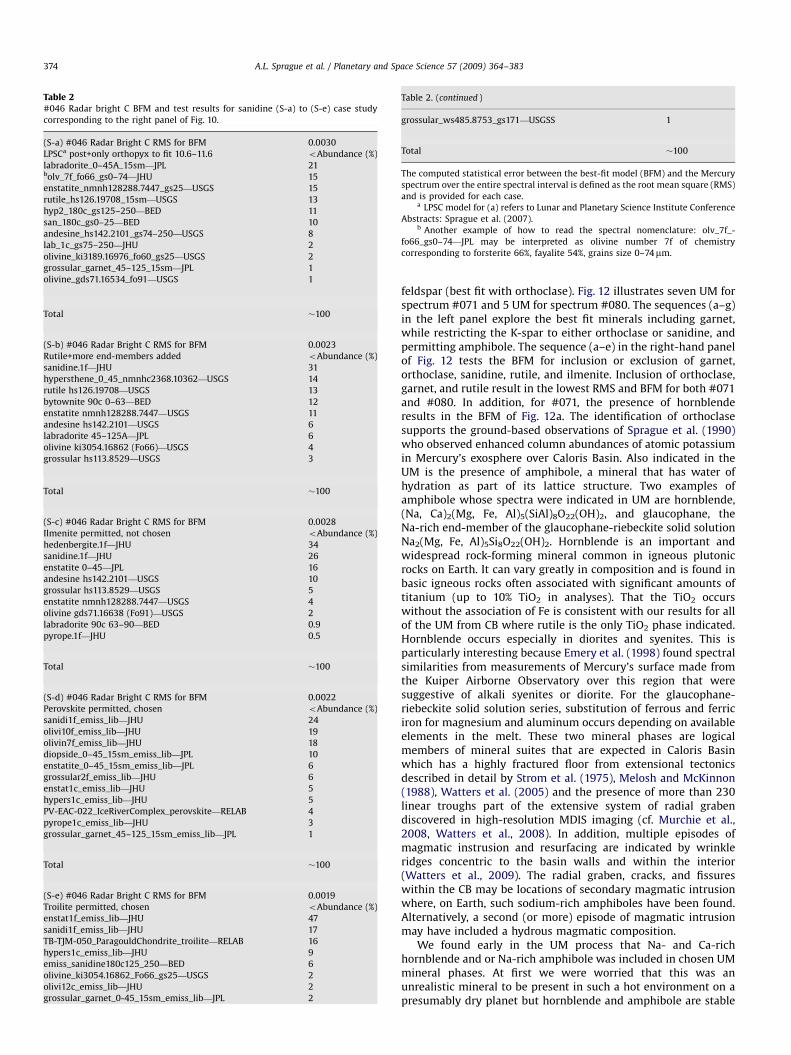
Table 2#046 Radar bright C BFM and test results for sanidine (S-a) to (S-e) case study
corresponding to the right panel of Fig. 10.
(S-a) #046 Radar Bright C RMS for BFM 0.0030
LPSCa post+only orthopyx to fit 10.6–11.6 oAbundance (%)
labradorite_0–45A_15sm—JPL 21bolv_7f_fo66_gs0–74—JHU 15
enstatite_nmnh128288.7447_gs25—USGS 15
rutile_hs126.19708_15sm—USGS 13
hyp2_180c_gs125–250—BED 11
san_180c_gs0–25—BED 10
andesine_hs142.2101_gs74–250—USGS 8
lab_1c_gs75–250—JHU 2
olivine_ki3189.16976_fo60_gs25—USGS 2
grossular_garnet_45–125_15sm—JPL 1
olivine_gds71.16534_fo91—USGS 1
Total �100
(S-b) #046 Radar Bright C RMS for BFM 0.0023
Rutile+more end-members added oAbundance (%)
sanidine.1f—JHU 31
hypersthene_0_45_nmnhc2368.10362—USGS 14
rutile hs126.19708—USGS 13
bytownite 90c 0–63—BED 12
enstatite nmnh128288.7447—USGS 11
andesine hs142.2101—USGS 6
labradorite 45–125A—JPL 6
olivine ki3054.16862 (Fo66)—USGS 4
grossular hs113.8529—USGS 3
Total �100
(S-c) #046 Radar Bright C RMS for BFM 0.0028
Ilmenite permitted, not chosen oAbundance (%)
hedenbergite.1f—JHU 34
sanidine.1f—JHU 26
enstatite 0–45—JPL 16
andesine hs142.2101—USGS 10
grossular hs113.8529—USGS 5
enstatite nmnh128288.7447—USGS 4
olivine gds71.16638 (Fo91)—USGS 2
labradorite 90c 63–90—BED 0.9
pyrope.1f—JHU 0.5
Total �100
(S-d) #046 Radar Bright C RMS for BFM 0.0022
Perovskite permitted, chosen oAbundance (%)
sanidi1f_emiss_lib—JHU 24
olivi10f_emiss_lib—JHU 19
olivin7f_emiss_lib—JHU 18
diopside_0–45_15sm_emiss_lib—JPL 10
enstatite_0–45_15sm_emiss_lib—JPL 6
grossular2f_emiss_lib—JHU 6
enstat1c_emiss_lib—JHU 5
hypers1c_emiss_lib—JHU 5
PV-EAC-022_IceRiverComplex_perovskite—RELAB 4
pyrope1c_emiss_lib—JHU 3
grossular_garnet_45–125_15sm_emiss_lib—JPL 1
Total �100
(S-e) #046 Radar Bright C RMS for BFM 0.0019
Troilite permitted, chosen oAbundance (%)
enstat1f_emiss_lib—JHU 47
sanidi1f_emiss_lib—JHU 17
TB-TJM-050_ParagouldChondrite_troilite—RELAB 16
hypers1c_emiss_lib—JHU 9
emiss_sanidine180c125_250—BED 6
olivine_ki3054.16862_Fo66_gs25—USGS 2
olivi12c_emiss_lib—JHU 2
grossular_garnet_0-45_15sm_emiss_lib—JPL 2
Table 2. (continued )
grossular_ws485.8753_gs171—USGSS 1
Total �100
The computed statistical error between the best-fit model (BFM) and the Mercury
spectrum over the entire spectral interval is defined as the root mean square (RMS)
and is provided for each case.a LPSC model for (a) refers to Lunar and Planetary Science Institute Conference
Abstracts: Sprague et al. (2007).b Another example of how to read the spectral nomenclature: olv_7f_-
fo66_gs0–74—JPL may be interpreted as olivine number 7f of chemistry
corresponding to forsterite 66%, fayalite 54%, grains size 0–74mm.
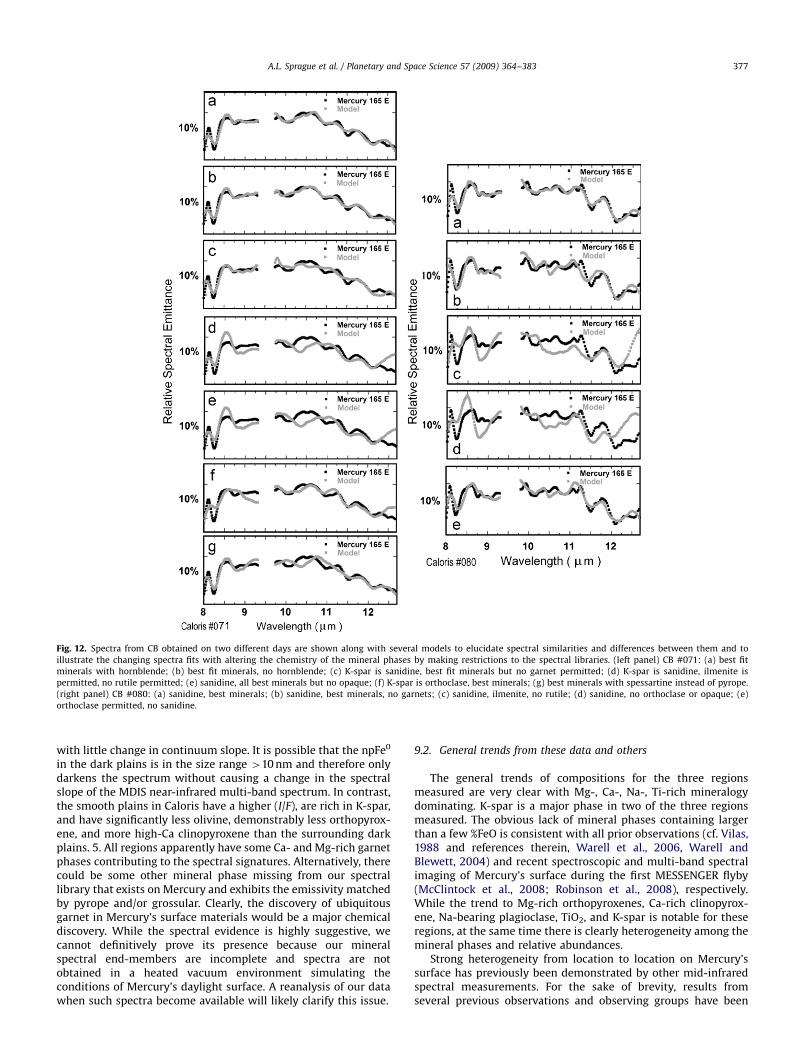
A.L. Sprague et al. / Planetary and Space Science 57 (2009) 364–383374
feldspar (best fit with orthoclase). Fig. 12 illustrates seven UM forspectrum #071 and 5 UM for spectrum #080. The sequences (a–g)in the left panel explore the best fit minerals including garnet,while restricting the K-spar to either orthoclase or sanidine, andpermitting amphibole. The sequence (a–e) in the right-hand panelof Fig. 12 tests the BFM for inclusion or exclusion of garnet,orthoclase, sanidine, rutile, and ilmenite. Inclusion of orthoclase,garnet, and rutile result in the lowest RMS and BFM for both #071and #080. In addition, for #071, the presence of hornblenderesults in the BFM of Fig. 12a. The identification of orthoclasesupports the ground-based observations of Sprague et al. (1990)who observed enhanced column abundances of atomic potassiumin Mercury’s exosphere over Caloris Basin. Also indicated in theUM is the presence of amphibole, a mineral that has water ofhydration as part of its lattice structure. Two examples ofamphibole whose spectra were indicated in UM are hornblende,(Na, Ca)2(Mg, Fe, Al)5(SiAl)8O22(OH)2, and glaucophane, theNa-rich end-member of the glaucophane-riebeckite solid solutionNa2(Mg, Fe, Al)5Si8O22(OH)2. Hornblende is an important andwidespread rock-forming mineral common in igneous plutonicrocks on Earth. It can vary greatly in composition and is found inbasic igneous rocks often associated with significant amounts oftitanium (up to 10% TiO2 in analyses). That the TiO2 occurswithout the association of Fe is consistent with our results for allof the UM from CB where rutile is the only TiO2 phase indicated.Hornblende occurs especially in diorites and syenites. This isparticularly interesting because Emery et al. (1998) found spectralsimilarities from measurements of Mercury’s surface made fromthe Kuiper Airborne Observatory over this region that weresuggestive of alkali syenites or diorite. For the glaucophane-riebeckite solid solution series, substitution of ferrous and ferriciron for magnesium and aluminum occurs depending on availableelements in the melt. These two mineral phases are logicalmembers of mineral suites that are expected in Caloris Basinwhich has a highly fractured floor from extensional tectonicsdescribed in detail by Strom et al. (1975), Melosh and McKinnon(1988), Watters et al. (2005) and the presence of more than 230linear troughs part of the extensive system of radial grabendiscovered in high-resolution MDIS imaging (cf. Murchie et al.,2008, Watters et al., 2008). In addition, multiple episodes ofmagmatic instrusion and resurfacing are indicated by wrinkleridges concentric to the basin walls and within the interior(Watters et al., 2009). The radial graben, cracks, and fissureswithin the CB may be locations of secondary magmatic intrusionwhere, on Earth, such sodium-rich amphiboles have been found.Alternatively, a second (or more) episode of magmatic intrusionmay have included a hydrous magmatic composition.
We found early in the UM process that Na- and Ca-richhornblende and or Na-rich amphibole was included in chosen UMmineral phases. At first we were worried that this was anunrealistic mineral to be present in such a hot environment on apresumably dry planet but hornblende and amphibole are stable

ARTICLE IN PRESS
Fig. 11. Two independent spectra from the DPWCB (#063 and #098, left panel and right panel, respectively) are shown along with four spectral unmixes (panels a–d) to
illustrate best-fit choices and chemical composition at this location are shown above. Remarkably, for both spectra, best unmixed minerals include about 10% pyrope, the
Mg-rich garnet phase. Left and right panels: (a) best-fit case—best unmixed minerals; (b) best unmixed minerals, no pyrope; (c) ilmenite permitted, no rutile; (d) no
opaque.
A.L. Sprague et al. / Planetary and Space Science 57 (2009) 364–383 375
against out gassing or conversion to non-hydrated species atMercury’s highest temperature (Berry and Mason, 1959). Insupport of this identification are the results of the fast ion particle(FIPS) measurements (Zurbuchen et al., 2008) which, by modelingthe ratio of the charge to mass of many ions found strong evidencefor OH+ and other water group ions during the first flyby ofMercury in the vicinity of Caloris Basin. Because no improvementwas shown for Mercury spectrum #080 from Caloris Basin witheither hornblende or spessartine, unlike the case for #071, thereare no corresponding panels (f) and (g) for #080. Whilesuggestive, the evidence for hydrated mineral species is notconclusive. The water group ions observed by the FIPS instrumentcould be explained by surface chemistry in the regolith inducedby solar wind impact on the surface of Mercury (Gibson, 1977).More observations in the mid-infrared and by instruments onMESSENGER and BepiColombo will be required before we candetermine if hydrated minerals are present on Mercury’s surface.If they are, it must be determined if they are present as originalmineral phases or as altered phases following copius andperpetual solar wind H and O ion impact and implantationchemistry (cf. Gibson, 1977) or exogenous material delivered frommeteoroids or comets.
8. Three region summary and brief comments
The results detailed in Section 6 in Figs. 10–12 and Tables 1–6are now summarized in Table 7 for the orthoclase and sanidinecase study for radar bright region C and Table 8 for the two spectrafrom each of the dark plains west of Caloris Basin and CalorisBasin. Because it is unlikely that Mercury’s surface at any of thelocations measured has exactly the chemical composition andgrain size of the library spectra chosen for the BFM listed in Tables1–6, we have summed all similar mineral phases into broadcategories. For example, for each Mercury spectrum and for eachUM case, we summed all plagioclase abundance estimates (all
contained Na) and entered the result in the category ‘‘Na-bearingplagioclase’’. We have retained the UM abundances but point outthat these abundances are upper limits for the reasons discussedin Section 4 and we expect that there are other mineral phases atthe locations measured for which we had no appropriate spectralend-member and thus they are missing from the table. The RMSfor each BFM is provided for easy comparison.
The major similarities and differences among the three regionsare: (1) RBC and CB both have relatively high abundances ofK-spar (polymorph phases of KAlSi3O8). K-spar in the high-temperature crystalline structure of sanidine occurs in volcanicrocks such as rapidly crystallized basalts. This is the preferredphase of K-spar for radar bright C. The spectra of CB are wellmatched with K-spar in the crystalline structure of orthoclase.Orthoclase is found in a wide variety of igneous and metamorphicrocks and has crystallized at intermediate to low temperatures.We suggest both monoclinic K-spars are in the smooth plains ofCaloris Basin—sanidine in rhyolite or other volcanic rocks andorthoclase in the radial dyke system observed by MESSENGER inMDIS imaging (Murchie et al., 2008). There is no indication ofK-spar in the mineral suites of the DPWCB, while it is a majorphase in the smooth plains of the basin interior. The relativelyhigh abundance of K-spar is a likely one cause of the highreflectance (I/F defined as the observed radiance divided by thesolar irradiance from a normally solar-illuminated Lambertiandisk). Caloris Basin smooth plains material are �15% higher thanMercury’s hemispherical average (Murchie et al., 2008). (2) RBChas very high abundances of orthopyroxene and low to no high-Caclinopyroxene. The smooth plains within Caloris Basin havehigh abundances of high-Ca clinopyroxene and lesser amountsof orthopyroxene. (3) The dark plains west of Caloris have moreMg-rich olivine (�10%) than the interior of the basin. The olivinespectral end-members chosen, although Mg-rich, have smallamounts of iron present. The same is true for the orthopyroxenespectral end-members chosen in the BFM cases (a) and (b) for thedark plains (see Tables 3 and 4).

ARTICLE IN PRESS
Table 3#063 Dark plains west of Caloris Basin (DPWCB) BFM and test results
corresponding to the left panel of Fig. 11.
(a) #063 Dark plains west of Caloris Basin RMS for BFM 0.0049
Best unmixed minerals oAbundance (%)
aug_1f_gs0_74—JHU 23
rutile_0–45_15sm—JPL 14
bytownite_0–45_15sm—JPL 11
pyrope_1f_gs0_74—JHU 10
ALBITE_0–45_15sm—JPL 9
hyp2_180c_gs0_25—BED 8
albite_45–125_15sm—JPL 8
aug2_180c_gs125_250—BED 6
rutile_125–500_15sm—JPL 5
olv2_180c_gs0_25—BED 4
oligoclase_hs110.16239_gs74–250—USGS 1
Total �100
(b) #063 Dark plains west of Caloris Basin RMS for BFM 0.0086
Best unmixed minerals, no garnets oAbundance (%)
hyp2_180c_gs0_25—BED 26
rutile_0–45_15sm—JPL 20
albite_0–45_15sm—JPL 17
albite_45–125_15sm—JPL 14
olv2_180c_gs0_25—BED 13
rutile_125–500_15sm—JPL 6
aug_1f_gs0_74—JHU 4
aug2_180c_gs125_250—BED 1
Total �100
(c) #063 Dark plains west of Caloris Basin RMS for BFM 0.0141
Ilmenite permitted, no rutile oAbundance (%)
aug_1f_gs0_74—JHU 32
ilmenite_hs231.11112_gs74–250—USGS 28
ilm_180c_gs25_63—BED 17
bytownite_0–45_15sm—JPL 14
pyrope_1f_gs0_74—JHU 5
albite_45–125_15sm—JPL 4
Total �100
(d) #063 Dark plains west of Caloris Basin RMS for BFM 0.0133
No opaque oAbundance (%)
aug_1f_gs0_74—JHU 61
bytownite_0–45_15sm—JPL 17
pyrope_1f_gs0_74—JHU 13
oligoclase_hs110.16239_gs74–250—USGS 7
hyp2_180c_gs0_25—BED 1
Total �100
The computed statistical error between the best-fit model (BFM) and the Mercury
spectrum over the entire spectral interval is defined as the root mean square (RMS)
and is provided for each case.
Table 4#098 Dark plains west of Caloris Basin (DPWCB) BFM and test results
corresponding to the right panel of Fig. 11.
(a) #098 Dark plains west of Caloris Basin RMS for BFM 0.0059
Best unmixed minerals oAbundance (%)
aug2_180c_gs0_25—BED 22
rutile_0–45_15sm—JPL 15
hyp_1c_gs75_250—JHU 11
rutile_125–500_15sm—JPL 10
albite_0–45_15sm—JPL 10
bytownite_0–45_15sm—JPL 10
pyrope_1c_gs75_250—JHU 10
oligoclase_hs110.16239_gs74–250—USGS 4
olv_9f_fo88_gs0_74—JHU 3
lab_90c_gs0_25—BED 3
olv_12c_fo91_gs75_250—JHU 2
olv_180c_gs63_125—BED 1
olivine_ki3189.16976_Fo60_gs25—USGS 0.04
Total �100
(b) #098 Dark plains west of Caloris Basin RMS for BFM 0.0121
Best unmixed minerals, no garnets oAbundance (%)
olv_9f_fo88_gs0_74—JHU 23
albite_0–45_15sm—JPL 19
hyp_1c_gs75_250—JHU 14
rutile_125–500_15sm—JPL 13
aug2_180c_gs0_25—BED 12
rutile_0–45_15sm—JPL 6
bytownite_0–45_15sm—JPL 5
olivine_ki3189.16976_Fo60_gs25—USGS 3
oligoclase_hs110.16239_gs74–250—USGS 2
olv_12c_fo91_gs75_250—JHU 2
Total �100
(c) #098 Dark plains west of Caloris Basin RMS for BFM 0.0204
Ilmenite permitted, no rutile oAbundance (%)
olv_9f_fo88_gs0_74—JHU 43
bytownite_0–45_15sm—JPL 29
ilmenite_hs231.11112_gs74–250—USGS 13
aug2_180c_gs0_25—BED 11
pyrope_1c_gs75_250—JHU 2
oligoclase_hs110.16239_gs74–250—USGS 1
Total �100
(d) #098 Dark plains west of Caloris Basin RMS for BFM 0.0204
No opaque oAbundance (%)
olv_9f_fo88_gs0_74—JHU 43
bytownite_0–45_15sm—JPL 29
aug2_180c_gs0_25—BED 11
pyrope_1c_gs75_250—JHU 2
oligoclase_hs110.16239_gs74–250—USGS 1
Total �100
The computed statistical error between the best-fit model (BFM) and the Mercury
spectrum over the entire spectral interval is defined as the root mean square (RMS)
and is provided for each case.
A.L. Sprague et al. / Planetary and Space Science 57 (2009) 364–383376
9. Discussion
9.1. Possible presence of microscopic iron metal blebs (npFe0)
Our results indicate more olivine in the dark plains region thanin Caloris Basin. This is consistent with the lower reflectance (I/F)measured by MDIS on MESSENGER during the first flyby(Robinson et al., 2008). Even though the olivine chosen in theBFM is Mg-rich, some olivine sample spectra contained smallamounts of FeO. It is possible that the dark plains west of Calorisare affected by the conversion of FeO in the olivine to npFe0. Nobleet al. (2007) found in detailed laboratory experiments that for thevisible and near-infrared, small amount of npFe0 embedded in
silica gels may cause changes in albedo and spectral slope. Themost important factors in predicting the result is the size of theembedded npFe0 particles and the concentration. Some combina-tions of npFe0 size and concentration only darken the spectrumwith no change in spectral slope; other combinations both reddenand darken the spectrum. Comparison of asteroid, lunar, andMercury spectra showed that darkening and slope effects differed.For Mercury, they found that npFe0 is larger and that Mercuryspectra in the visible and near-infrared are systematically loweredin albedo across the entire visible and near-infrared range but
ARTICLE IN PRESS
Fig. 12. Spectra from CB obtained on two different days are shown along with several models to elucidate spectral similarities and differences between them and to
illustrate the changing spectra fits with altering the chemistry of the mineral phases by making restrictions to the spectral libraries. (left panel) CB #071: (a) best fit
minerals with hornblende; (b) best fit minerals, no hornblende; (c) K-spar is sanidine, best fit minerals but no garnet permitted; (d) K-spar is sanidine, ilmenite is
permitted, no rutile permitted; (e) sanidine, all best minerals but no opaque; (f) K-spar is orthoclase, best minerals; (g) best minerals with spessartine instead of pyrope.
(right panel) CB #080: (a) sanidine, best minerals; (b) sanidine, best minerals, no garnets; (c) sanidine, ilmenite, no rutile; (d) sanidine, no orthoclase or opaque; (e)
orthoclase permitted, no sanidine.
A.L. Sprague et al. / Planetary and Space Science 57 (2009) 364–383 377
with little change in continuum slope. It is possible that the npFe0
in the dark plains is in the size range 410 nm and therefore onlydarkens the spectrum without causing a change in the spectralslope of the MDIS near-infrared multi-band spectrum. In contrast,the smooth plains in Caloris have a higher (I/F), are rich in K-spar,and have significantly less olivine, demonstrably less orthopyrox-ene, and more high-Ca clinopyroxene than the surrounding darkplains. 5. All regions apparently have some Ca- and Mg-rich garnetphases contributing to the spectral signatures. Alternatively, therecould be some other mineral phase missing from our spectrallibrary that exists on Mercury and exhibits the emissivity matchedby pyrope and/or grossular. Clearly, the discovery of ubiquitousgarnet in Mercury’s surface materials would be a major chemicaldiscovery. While the spectral evidence is highly suggestive, wecannot definitively prove its presence because our mineralspectral end-members are incomplete and spectra are notobtained in a heated vacuum environment simulating theconditions of Mercury’s daylight surface. A reanalysis of our datawhen such spectra become available will likely clarify this issue.
9.2. General trends from these data and others
The general trends of compositions for the three regionsmeasured are very clear with Mg-, Ca-, Na-, Ti-rich mineralogydominating. K-spar is a major phase in two of the three regionsmeasured. The obvious lack of mineral phases containing largerthan a few %FeO is consistent with all prior observations (cf. Vilas,1988 and references therein, Warell et al., 2006, Warell andBlewett, 2004) and recent spectroscopic and multi-band spectralimaging of Mercury’s surface during the first MESSENGER flyby(McClintock et al., 2008; Robinson et al., 2008), respectively.While the trend to Mg-rich orthopyroxenes, Ca-rich clinopyrox-ene, Na-bearing plagioclase, TiO2, and K-spar is notable for theseregions, at the same time there is clearly heterogeneity among themineral phases and relative abundances.
Strong heterogeneity from location to location on Mercury’ssurface has previously been demonstrated by other mid-infraredspectral measurements. For the sake of brevity, results fromseveral previous observations and observing groups have been
ARTICLE IN PRESS
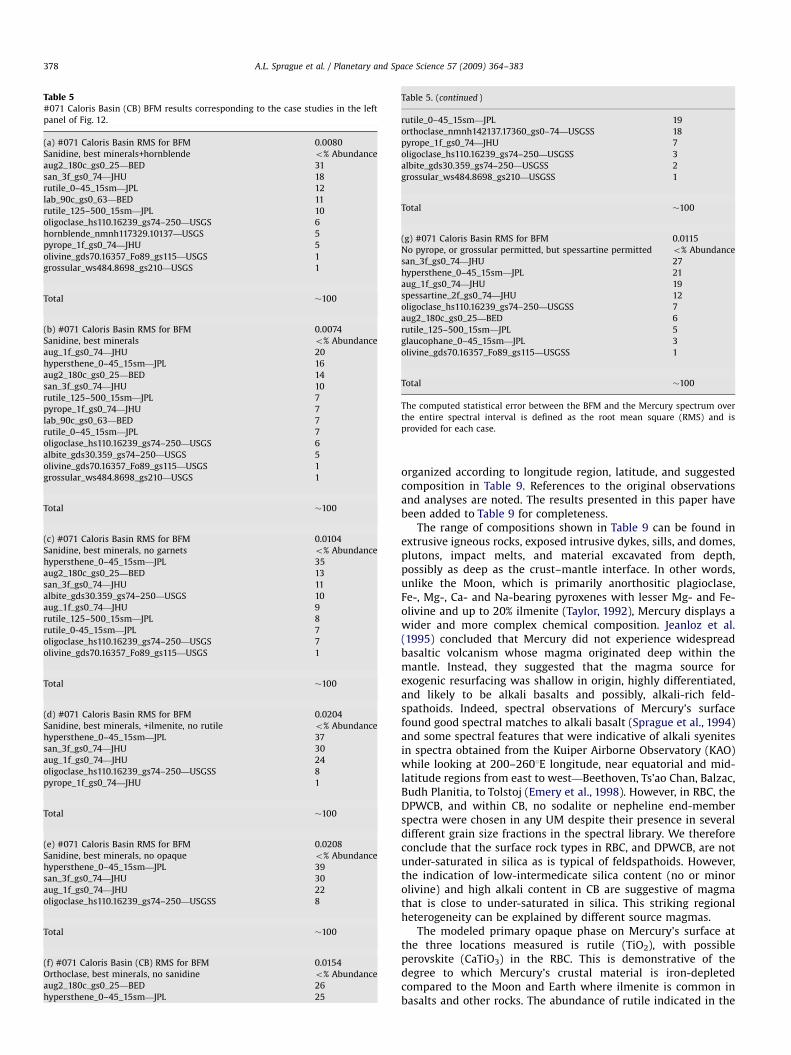
Table 5#071 Caloris Basin (CB) BFM results corresponding to the case studies in the left
panel of Fig. 12.
(a) #071 Caloris Basin RMS for BFM 0.0080
Sanidine, best minerals+hornblende o% Abundance
aug2_180c_gs0_25—BED 31
san_3f_gs0_74—JHU 18
rutile_0–45_15sm—JPL 12
lab_90c_gs0_63—BED 11
rutile_125–500_15sm—JPL 10
oligoclase_hs110.16239_gs74–250—USGS 6
hornblende_nmnh117329.10137—USGS 5
pyrope_1f_gs0_74—JHU 5
olivine_gds70.16357_Fo89_gs115—USGS 1
grossular_ws484.8698_gs210—USGS 1
Total �100
(b) #071 Caloris Basin RMS for BFM 0.0074
Sanidine, best minerals o% Abundance
aug_1f_gs0_74—JHU 20
hypersthene_0–45_15sm—JPL 16
aug2_180c_gs0_25—BED 14
san_3f_gs0_74—JHU 10
rutile_125–500_15sm—JPL 7
pyrope_1f_gs0_74—JHU 7
lab_90c_gs0_63—BED 7
rutile_0–45_15sm—JPL 7
oligoclase_hs110.16239_gs74–250—USGS 6
albite_gds30.359_gs74–250—USGS 5
olivine_gds70.16357_Fo89_gs115—USGS 1
grossular_ws484.8698_gs210—USGS 1
Total �100
(c) #071 Caloris Basin RMS for BFM 0.0104
Sanidine, best minerals, no garnets o% Abundance
hypersthene_0–45_15sm—JPL 35
aug2_180c_gs0_25—BED 13
san_3f_gs0_74—JHU 11
albite_gds30.359_gs74–250—USGS 10
aug_1f_gs0_74—JHU 9
rutile_125–500_15sm—JPL 8
rutile_0-45_15sm—JPL 7
oligoclase_hs110.16239_gs74–250—USGS 7
olivine_gds70.16357_Fo89_gs115—USGS 1
Total �100
(d) #071 Caloris Basin RMS for BFM 0.0204
Sanidine, best minerals, +ilmenite, no rutile o% Abundance
hypersthene_0–45_15sm—JPL 37
san_3f_gs0_74—JHU 30
aug_1f_gs0_74—JHU 24
oligoclase_hs110.16239_gs74–250—USGSS 8
pyrope_1f_gs0_74—JHU 1
Total �100
(e) #071 Caloris Basin RMS for BFM 0.0208
Sanidine, best minerals, no opaque o% Abundance
hypersthene_0–45_15sm—JPL 39
san_3f_gs0_74—JHU 30
aug_1f_gs0_74—JHU 22
oligoclase_hs110.16239_gs74–250—USGSS 8
Total �100
(f) #071 Caloris Basin (CB) RMS for BFM 0.0154
Orthoclase, best minerals, no sanidine o% Abundance
aug2_180c_gs0_25—BED 26
hypersthene_0–45_15sm—JPL 25
Table 5. (continued )
rutile_0–45_15sm—JPL 19
orthoclase_nmnh142137.17360_gs0–74—USGSS 18
pyrope_1f_gs0_74—JHU 7
oligoclase_hs110.16239_gs74–250—USGSS 3
albite_gds30.359_gs74–250—USGSS 2
grossular_ws484.8698_gs210—USGSS 1
Total �100
(g) #071 Caloris Basin RMS for BFM 0.0115
No pyrope, or grossular permitted, but spessartine permitted o% Abundance
san_3f_gs0_74—JHU 27
hypersthene_0–45_15sm—JPL 21
aug_1f_gs0_74—JHU 19
spessartine_2f_gs0_74—JHU 12
oligoclase_hs110.16239_gs74–250—USGSS 7
aug2_180c_gs0_25—BED 6
rutile_125–500_15sm—JPL 5
glaucophane_0–45_15sm—JPL 3
olivine_gds70.16357_Fo89_gs115—USGSS 1
Total �100
The computed statistical error between the BFM and the Mercury spectrum over
the entire spectral interval is defined as the root mean square (RMS) and is
provided for each case.
A.L. Sprague et al. / Planetary and Space Science 57 (2009) 364–383378
organized according to longitude region, latitude, and suggestedcomposition in Table 9. References to the original observationsand analyses are noted. The results presented in this paper havebeen added to Table 9 for completeness.
The range of compositions shown in Table 9 can be found inextrusive igneous rocks, exposed intrusive dykes, sills, and domes,plutons, impact melts, and material excavated from depth,possibly as deep as the crust–mantle interface. In other words,unlike the Moon, which is primarily anorthositic plagioclase,Fe-, Mg-, Ca- and Na-bearing pyroxenes with lesser Mg- and Fe-olivine and up to 20% ilmenite (Taylor, 1992), Mercury displays awider and more complex chemical composition. Jeanloz et al.(1995) concluded that Mercury did not experience widespreadbasaltic volcanism whose magma originated deep within themantle. Instead, they suggested that the magma source forexogenic resurfacing was shallow in origin, highly differentiated,and likely to be alkali basalts and possibly, alkali-rich feld-spathoids. Indeed, spectral observations of Mercury’s surfacefound good spectral matches to alkali basalt (Sprague et al., 1994)and some spectral features that were indicative of alkali syenitesin spectra obtained from the Kuiper Airborne Observatory (KAO)while looking at 200–2601E longitude, near equatorial and mid-latitude regions from east to west—Beethoven, Ts’ao Chan, Balzac,Budh Planitia, to Tolstoj (Emery et al., 1998). However, in RBC, theDPWCB, and within CB, no sodalite or nepheline end-memberspectra were chosen in any UM despite their presence in severaldifferent grain size fractions in the spectral library. We thereforeconclude that the surface rock types in RBC, and DPWCB, are notunder-saturated in silica as is typical of feldspathoids. However,the indication of low-intermedicate silica content (no or minorolivine) and high alkali content in CB are suggestive of magmathat is close to under-saturated in silica. This striking regionalheterogeneity can be explained by different source magmas.
The modeled primary opaque phase on Mercury’s surface atthe three locations measured is rutile (TiO2), with possibleperovskite (CaTiO3) in the RBC. This is demonstrative of thedegree to which Mercury’s crustal material is iron-depletedcompared to the Moon and Earth where ilmenite is common inbasalts and other rocks. The abundance of rutile indicated in the
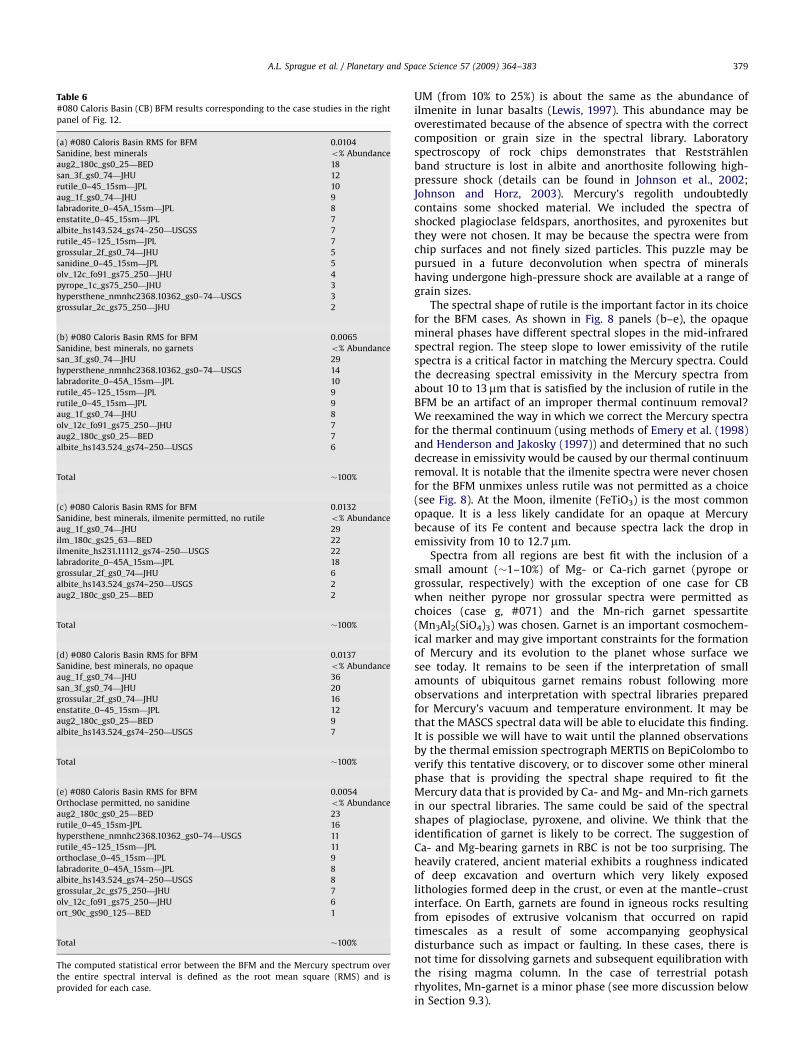
ARTICLE IN PRESS
Table 6#080 Caloris Basin (CB) BFM results corresponding to the case studies in the right
panel of Fig. 12.
(a) #080 Caloris Basin RMS for BFM 0.0104
Sanidine, best minerals o% Abundance
aug2_180c_gs0_25—BED 18
san_3f_gs0_74—JHU 12
rutile_0–45_15sm—JPL 10
aug_1f_gs0_74—JHU 9
labradorite_0–45A_15sm—JPL 8
enstatite_0–45_15sm—JPL 7
albite_hs143.524_gs74–250—USGSS 7
rutile_45–125_15sm—JPL 7
grossular_2f_gs0_74—JHU 5
sanidine_0–45_15sm—JPL 5
olv_12c_fo91_gs75_250—JHU 4
pyrope_1c_gs75_250—JHU 3
hypersthene_nmnhc2368.10362_gs0–74—USGS 3
grossular_2c_gs75_250—JHU 2
(b) #080 Caloris Basin RMS for BFM 0.0065
Sanidine, best minerals, no garnets o% Abundance
san_3f_gs0_74—JHU 29
hypersthene_nmnhc2368.10362_gs0–74—USGS 14
labradorite_0–45A_15sm—JPL 10
rutile_45–125_15sm—JPL 9
rutile_0–45_15sm—JPL 9
aug_1f_gs0_74—JHU 8
olv_12c_fo91_gs75_250—JHU 7
aug2_180c_gs0_25—BED 7
albite_hs143.524_gs74–250—USGS 6
Total �100%
(c) #080 Caloris Basin RMS for BFM 0.0132
Sanidine, best minerals, ilmenite permitted, no rutile o% Abundance
aug_1f_gs0_74—JHU 29
ilm_180c_gs25_63—BED 22
ilmenite_hs231.11112_gs74–250—USGS 22
labradorite_0–45A_15sm—JPL 18
grossular_2f_gs0_74—JHU 6
albite_hs143.524_gs74–250—USGS 2
aug2_180c_gs0_25—BED 2
Total �100%
(d) #080 Caloris Basin RMS for BFM 0.0137
Sanidine, best minerals, no opaque o% Abundance
aug_1f_gs0_74—JHU 36
san_3f_gs0_74—JHU 20
grossular_2f_gs0_74—JHU 16
enstatite_0–45_15sm—JPL 12
aug2_180c_gs0_25—BED 9
albite_hs143.524_gs74–250—USGS 7
Total �100%
(e) #080 Caloris Basin RMS for BFM 0.0054
Orthoclase permitted, no sanidine o% Abundance
aug2_180c_gs0_25—BED 23
rutile_0–45_15sm-JPL 16
hypersthene_nmnhc2368.10362_gs0–74—USGS 11
rutile_45–125_15sm—JPL 11
orthoclase_0–45_15sm—JPL 9
labradorite_0–45A_15sm—JPL 8
albite_hs143.524_gs74–250—USGS 8
grossular_2c_gs75_250—JHU 7
olv_12c_fo91_gs75_250—JHU 6
ort_90c_gs90_125—BED 1
Total �100%
The computed statistical error between the BFM and the Mercury spectrum over
the entire spectral interval is defined as the root mean square (RMS) and is
provided for each case.
A.L. Sprague et al. / Planetary and Space Science 57 (2009) 364–383 379
UM (from 10% to 25%) is about the same as the abundance ofilmenite in lunar basalts (Lewis, 1997). This abundance may beoverestimated because of the absence of spectra with the correctcomposition or grain size in the spectral library. Laboratoryspectroscopy of rock chips demonstrates that Reststrahlenband structure is lost in albite and anorthosite following high-pressure shock (details can be found in Johnson et al., 2002;Johnson and Horz, 2003). Mercury’s regolith undoubtedlycontains some shocked material. We included the spectra ofshocked plagioclase feldspars, anorthosites, and pyroxenites butthey were not chosen. It may be because the spectra were fromchip surfaces and not finely sized particles. This puzzle may bepursued in a future deconvolution when spectra of mineralshaving undergone high-pressure shock are available at a range ofgrain sizes.
The spectral shape of rutile is the important factor in its choicefor the BFM cases. As shown in Fig. 8 panels (b–e), the opaquemineral phases have different spectral slopes in the mid-infraredspectral region. The steep slope to lower emissivity of the rutilespectra is a critical factor in matching the Mercury spectra. Couldthe decreasing spectral emissivity in the Mercury spectra fromabout 10 to 13mm that is satisfied by the inclusion of rutile in theBFM be an artifact of an improper thermal continuum removal?We reexamined the way in which we correct the Mercury spectrafor the thermal continuum (using methods of Emery et al. (1998)and Henderson and Jakosky (1997)) and determined that no suchdecrease in emissivity would be caused by our thermal continuumremoval. It is notable that the ilmenite spectra were never chosenfor the BFM unmixes unless rutile was not permitted as a choice(see Fig. 8). At the Moon, ilmenite (FeTiO3) is the most commonopaque. It is a less likely candidate for an opaque at Mercurybecause of its Fe content and because spectra lack the drop inemissivity from 10 to 12.7mm.
Spectra from all regions are best fit with the inclusion of asmall amount (�1–10%) of Mg- or Ca-rich garnet (pyrope orgrossular, respectively) with the exception of one case for CBwhen neither pyrope nor grossular spectra were permitted aschoices (case g, #071) and the Mn-rich garnet spessartite(Mn3Al2(SiO4)3) was chosen. Garnet is an important cosmochem-ical marker and may give important constraints for the formationof Mercury and its evolution to the planet whose surface wesee today. It remains to be seen if the interpretation of smallamounts of ubiquitous garnet remains robust following moreobservations and interpretation with spectral libraries preparedfor Mercury’s vacuum and temperature environment. It may bethat the MASCS spectral data will be able to elucidate this finding.It is possible we will have to wait until the planned observationsby the thermal emission spectrograph MERTIS on BepiColombo toverify this tentative discovery, or to discover some other mineralphase that is providing the spectral shape required to fit theMercury data that is provided by Ca- and Mg- and Mn-rich garnetsin our spectral libraries. The same could be said of the spectralshapes of plagioclase, pyroxene, and olivine. We think that theidentification of garnet is likely to be correct. The suggestion ofCa- and Mg-bearing garnets in RBC is not be too surprising. Theheavily cratered, ancient material exhibits a roughness indicatedof deep excavation and overturn which very likely exposedlithologies formed deep in the crust, or even at the mantle–crustinterface. On Earth, garnets are found in igneous rocks resultingfrom episodes of extrusive volcanism that occurred on rapidtimescales as a result of some accompanying geophysicaldisturbance such as impact or faulting. In these cases, there isnot time for dissolving garnets and subsequent equilibration withthe rising magma column. In the case of terrestrial potashrhyolites, Mn-garnet is a minor phase (see more discussion belowin Section 9.3).

ARTICLE IN PRESS
Table 7Upper limits for categories of mineral phases summed from BFM spectral choices listed in Tables 1 and 2 at radar bright region C (RBC) for orthoclase and sanidine cases
with different options for opaque phase. RMS�102 vales are given.
Radar Bright C (RBC) #046 orthoclase cases Radar Bright C (RBC) #046 sanidine cases
a b c d e a b c d e
102�RMS of BFM 0.24 0.22 0.33 0.23 0.18 0.30 0.23 0.28 0.22 0.19
Na-bearing Plagioclase 0 14 15 0 0 31 24 11 0 0
High Ca-clinopyroxene 0 0 38 16 0 0 0 34 10 0
high Mg-orthopyroxene 17 34 18 19 46 26 25 20 16 56
High Mg-olivine 12 5 0 25 6 18 4 2 37 4
K-spar 29 35 26 18 21 10 31 26 24 23
Garnet 5 1 3 0 5 1 3 6 10 3
Hornblende 0 0 0 0 0 0 0 0 0 0
Opaque phases below
Rutile 37 11 0 0 0 13 13 0 0 0
Perovskite 0 0 0 22 0 0 0 0 4 0
Troilite 0 0 0 0 23 0 0 0 0 16
Cases a, b, c, d, e, correspond to the cases in the left and right panels of Fig. 9.
Table 8Upper limits for categories of mineral phases for a and b cases of BFM for dark
plains west of Caloris Basin (DPWCB) summed from Tables 3 and 4, and for Caloris
Basin (CB) summed from Tables 5 and 6.
Region Dark plains (DPWCB) Caloris Basin (CB)
Mercury file # #063 #098 #071 #080
BFM cases a b a b a b a b
102�RMS of BFM 0.49 0.86 0.59 1.2 0.80 0.74 0.39 0.65
Na-bearing Plagioclase 29 31 27 26 17 18 15 16
High Ca-clinopyroxene 29 5 22 12 31 34 27 15
High Mg-orthopyroxene 8 26 11 14 0 16 10 14
High Mg-olivine 4 13 6 28 1 1 4 7
K-spar 0 0 0 0 18 10 17 29
Garnet 10 0 10 0 6 8 10 0
Hornblende 0 0 0 0 5 0 0 0
Opaque phases below
Rutile 19 26 25 19 22 14 17 18
Perovskite 0 0 0 0 0 0 0 0
Troilite 0 0 0 0 0 0 0 0
Results from two spectra for each region are shown. RMS�102 values are given.
Cases correspond to top two cases from left and right panels of Figs. 10 and 11.
Table 9Comparison of results presented in this manuscript to historical mid-infrared
spectral observations.
Reference East longitude
region
Reported result
1 3201, 3141 Feldspathic, intermediate rock types
2 338–3481 Alkali basalt
2501 Labradorite
3 240–2501 Labradorite, 52–61 wt% SiO2;
3301 90% Feldspar and 10% Mg-pyroxene
4 295–3501 Not modeled
200–2601 Possible alkali syenite
5a 240–2501 90% Labradorite and 10% enstatite
6 201S–201N
27517101 �44 wt% SiO2
18017101,17017101 �45–57 wt% SiO2
35017101, 21517101 �50 and �42 wt% SiO2
7 201S–201N 52–61 wt% SiO2
275–3151 Labradorite and clinopyroxene
252–2921 Pyroxene (unspecified)
8 0–301N
150–1601 46–60 wt% SiO2
125–1351 46–60 wt% SiO2
9b 50–751N, 1101 No FeO
50–751S, 166–2501 Orthopyroxene 52–61 wt% SiO2
50–751N, 166–2501 Clinopyroxene 52–61 wt% SiO2
10 Radar
bright C
0–301N Enstatite, forsterite, K-spar, labradorite
100–1401 Ca- and Mg-garnet, rutile/perovskite
10 Dark plains 0–301N Na-plagioclase (albite, oligoclase), K-spar,
enstatite, Mg-rich hypersthene, Ca-, Na-, Al-
clinopyroxene (augite)
124–1551
10 Caloris
Basin
20–451N High Ca-, Na-, Mg-clinopyroxene, K-spar,
Na-plagioclase, minor Mg-rich
orthopyroxene, Mg-garnet, possible
amphibole
152–1801
1Tyler et al. (1988), 2Sprague et al. (1994), 3Sprague et al. (1997a, b), 4Emery et al.
(1998), 5Sprague and Roush (1998), 6Cooper et al. (2001), 7Sprague et al. (2002),8Sprague et al. (2007), 9Warell et al. (2006), 10This manuscript.
a Improved modeling of Sprague et al. (1994, 1997a, b).b 0.8–5mm SpeX observations.
A.L. Sprague et al. / Planetary and Space Science 57 (2009) 364–383380
9.3. Suggested rock types and formation conditions
Gillis-Davis et al. (2009) have given considerable evidence forvolcanic vents and rocks over large portions of Mercury’s surface.Most notable are the vents and volcanic features within andaround CB. Thus, it is of interest to discuss examples of rock typesthat result from differentiated primary Mg-rich olivine basaltmagmas. Some examples of those differentiated in volcanicprovinces are trachybasalts and oligoclase basalts. If theprimary low-Fe olivine basalt magma is differentiated andundergoes plutonic crystallization, alkali gabbros and dioritesmay result. Rocks expected from primary granidiorite form, bydifferentiation and volcanic crystallization, dacites, latites ande-sites, and rhyolites.
Given the possibilities described above, we examine thespecifics of Tables 7 and 8 and the summary of historicalobservations in Table 9. Tyler et al. (1988) obtained mid-infraredspectral measurements of Mercury and found a Christiansenfeature at 7.8mm, a wavelength for an emissivity maximum that isconsistent with intermediate rock types such as rhyolite (Logan
and Hunt, 1970). In fact potash rhyolites are good candidates forMercury’s surface based on the typical presence of eitherorthoclase or sanidine and soda-rich amphibole and Mg-richpyroxene. Potash rhyolites also have green diopside augite andmanganese garnet in the linings of lithophysae (Williams et al.,1955). Manganese is an effective darkening agent and may explainthe dark plains exterior to Caloris Basin and dark albedo layers in
ARTICLE IN PRESS
A.L. Sprague et al. / Planetary and Space Science 57 (2009) 364–383 381
surface materials imaged by MESSENGER (Robinson et al., 2008).While we cannot be certain of the identity of the exact rock typeson Mercury, we have narrowed the possible and likely rock typesto dacite, latite, trachybasalts, tonalites, possible rhyolitic pyr-oclastics and oligoclase basalts. We consider both extrusive andintrusive rocks. This is especially justified by the recent discoveryof Pantheon Fossae within Caloris Basin and the implications offormation by upwelling magma beneath the basin.
9.4. Cosmochemical implications of observations
Taken together, the body of mid-infrared and visible, near-infraredspectral observations demonstrates that Mercury’s surface, andprobably its crust, is depleted in iron. The results described heremake it possible to answer the question ‘‘has space weathering beenthe primary reason ground-based observations in the vis and near-irdo not see the FeO absorption band?’’ That answer is ‘‘no, Mercury’ssurface is covered in very low-iron Mg- Ca- Na- K- silicates andalumino silicates’’. The semi-volatile abundance is significant, asdemonstrated by the presence of 14–28% Na- and K-bearing feldsparsin RBC, the DPWCB, and CB. These results are consistent with Warelland Blewett (2004) from Hapke modeling and Robinson et al. (2008)who found most Fe to be bound in opaques and not in silicates.Opaques such as FeS are chemically consistent with iron-free rutile.
Iron differentiation to the core must have been thoroughlycompleted by the time of the freezing of the magma ocean if oneexisted. If our observations included any primary crust producedby crystallization from an early magma ocean (cf. Taylor, 1982), wesuggest it would be in the RBC region. If an ancient huge basin isfound to be as large as ground-based observations indicate(Ksanfomality, 2004), it would lend support to giant impacttheory for an explanation of the large fraction of volume occupiedby Mercury’s presumed iron core (Cameron, 1985, Benz et al.,1988). This catastrophic event is also consistent with the fact thatMercury’s surface has retained its semi-volatiles Na, K, discoveredin Mercury’s exosphere by Potter and Morgan (1985, 1986),respectively. In addition, Na+ and K+, S+ and water group ions werediscovered by Zurbuchen et al. (2008) during the first MESSENGERfly by. Impact and recondensation models have shown much of allbut the most volatile material (H2O, FeO) will be retained andrecondensed following a large impact where debris is captured inorbit around Mercury. These details are thoroughly described andmodeled by Benz et al. (2007) who examine the fractionationinduced by a giant impact on the proto Mercury having roughlychondritic elemental abundances. Some ejected material will bereaccreted. This accretion, which includes semi-volatile inventory,can account for the anomalously high mean density of the planet.
It may be that we now have samples of Mercury in ourmeteorite collections. Such meteorites will be characterized byFeO content o1%, Mg-rich orthopyroxene, and olivine, if present.Plagioclase will be 4Ab10 in modal chemistry. Mg- and/orCa- garnet may be present as will be potassium feldspar andpossibly sulfides. These are not entirely new ideas, Love and Keil(1995) and Burbine et al. (2002) outlined somewhat differentexpectations also including low-Fe chemistry, a reducing environ-ment conducive to the formation of sulfides. We suggest that newsearches among our sample stores should look for meteoritescontaining high Mg- and Ca-pyroxenes, Mg- and Ca- and possiblyMn-garnets, Na-rich plagioclase, K-spar, and enstatite or very Mg-rich olivine if olivine is present.
10. Caveats
Spectral end-members used in this analysis were primarilyreflectance spectra converted to emissivity by standard techni-
ques discussed in detail in Section 4.2 and some emissivity spectrafrom the PEL and BED library as well as pyroxenes from ASU. Allspectra were obtained at Earth’s atmospheric pressure. Somesystems were under a N2 purge, or other purging system. Mostspectra were obtained in spectrometers operating with laboratoryair. Logan and Hunt (1970) demonstrated that the wavelength ofthe Christainsen feature (emissivity maximum near 7–9mm) waschanged in shape and possibly in wavelength if spectra wereobtained in a near vacuum rather than at 1 bar atmosphere.
Two of the authors of this paper, (Helbert and Maturilli, 2008)have shown that some differences exist between spectra obtainedfrom the same sample at different temperatures, especially in theregion of the Reststrahlen bands. Differences in spectral signatureat temperatures relevant for Mercury, 300–725 K need to bequantified and characterized. Helbert and Maturilli are in theprocess of doing so. In addition, a new vacuum chamber, suitablefor housing the sample for induction heating is under fabricationand assembly. Already, they have obtained the first spectra in theinduction heating experiments and have observed importantchanges spectral activity. For example, in stepwise heating of finegrained quartz separates, an emissivity peak systematicallyshifted from 14.4 to 14.5mm as the temperature was increasedfrom 200 C to 500 C. For the peak near 12.3mm, a region wheretransparency features are very important in Mercury spectra, thepeak shifted less than 0.05mm. The central wavelength of thetransparency minimum in a very low FeO labradorite sample(FeOo0.08%) shifted from 12.1 to 12.2mm over the sametemperature range. The central wavelength of the transparencyminimum is predictably related to overall bulk SiO2 content in arock or mineral powder. Thus, the SiO2% given in Table 9 areconsidered approximate given as a range of values based on thespectral data from Mercury and from the laboratory. However, thecentral wavelengths of the transparency minima fall well withinthe range of intermediate to mafic rocks. Spectral emissivitymaxima at the Christiansen frequency and in the Reststrahlenregion did not shift in wavelength over the same change intemperature. Therefore, we conclude that our identifications ofthe Na-bearing plagioclase feldspars based on the maximumwavelength and shape of the Christiansen feature is robust. Weexpect that our identifications of orthopyroxene, clinopyroxene,and olivine will also remain valid. There will probably be slightchanges in compositions and relative abundances. We cannotpredict if the differentiation we see between sanidine andorthoclase will remain robust. Nor can we predict if each BFMwill require pyrope or grossular. However, despite these deficien-cies in our present analysis, we believe we have done the best thatwe could do in the present era. We look forward to the futureopportunity to test the results in this paper. Once the new PELfacility is available with its new spectral library of spectra of manygrain sizes, measured while heated to Mercury temperatures andobtained in a vacuum environment, we will reanalyze theseMercury spectra and others called out in Table 9. We anticipatethat there will be some new discoveries, some of which maydemonstrate that what we have done here withstand the newanalysis and others do not.
11. Conclusions
1.
Mercury’s surface is clearly heterogeneous in composition withminerals formed from highly differentiated magma comingfrom more than one extrusive event. The heterogeneitystrongly argues for more than one source magma. Spectralunmixing indicates volcanic rocks ranging from trachytes (CB)to Mg-rich oligoclase basalts (DPWCB) indicative of highlyevolved Mg-rich primary magmas. In both Caloris Basin and
ARTICLE IN PRESS
A.L. Sprague et al. / Planetary and Space Science 57 (2009) 364–383382
the dark plains west of Caloris Basin, the possibility of garnetsuggests rapid magma flow which carried garnets fromplutonic rocks in timescales that did not permit equilibration,dissolving of the garnets before reaching the surface.
2.
Evidence for intrusive igneous rocks is indicated by the mineralsuites Caloris Basin. K-spar in orthoclase crystalline structure,and Ca-, Mg-, Na- pyroxene are characteristic of intrusive dykeswhere slower cooling and retention of some water of hydrationmay occur resulting in the presence of amphiboles (hornblendeand or glaucophane) as suggested in one case within our data.3.
At the three locations measured in this study there is littleevidence for feldspathoid-bearing rocks and thus magmaunder-saturated in silica. However, the low abundance ofolivine and the high abundance of both orthoclase and Na-richplagioclase feldspar indicate magma at or close to the lowsilica boundary.4.
The dark plains west of Caloris and generally forming anannulus around the Caloris perimeter are younger than thesmooth plains interior to Caloris (Strom et al., 2008) butsystematically darker and their visible and near-infraredspectra are bluer in slope than those of Caloris (based onspectra composed of multi-band I/F measurements by MDIS(Robinson et al., 2008). They provide a counter example to thelunar space weathering style of ‘‘older is darker and redder’’.Our measurements indicate that the albedo and slopedifferences apparent in the visible and near-infrared are causedby differences in the mineral content of the regolith. Wesupport the conclusions of Noble et al. (2007) who concludethat not all solar system regoliths have the same spaceweathering characteristics. They compare laboratory spectraof npFe0 in silica gels to telescopic Mercury spectra at the samewavelengths and conclude that npFe0 Mercury’s regolith islarger in size and lower in concentration than in the lunar soiland thus direct application of lunar space weathering analysisis inappropriate for Mercury.5.
Reanalysis of the same and other data sets with the PELspectral library populated by spectra obtained at temperaturesappropriate for Mercury’s surface and cyclical heating andcooling cycle in a vacuum environment may result in differentBFM. Our goal is to repeat the analysis exclusively using thosedata when they become available.Acknowledgements
The authors of this paper were Visiting Astronomers at theNASA Infrared Telescope Facility which is operated by theUniversity of Hawaii under contract from the National Aeronauticsand Space Administration. We are especially grateful to AlanTokunaga and Eric Tollestrop for useful engineering time on thetelescope and Don Hunten for helpful discussions. Support forSprague, Kozlowski, and Donaldson Hanna was provided by NSFGrant AST-0406796. Warell received travel support from theSwedish Science foundation (VR).
References
Benkhoff, J., Fujimoto, M., Laakso, H., 2009. Science Goals of BepiColombo. SpecialIssue of Planetary and Space Science, in press.
Benz, W., Slattery, W.L., Cameron, A.G.W., 1988. Collisional stripping of Mercury’smantle. Icarus 74, 516–528.
Benz, W., Anic, A., Horner, J., Whitby, J.A., 2007. The origin of mercury. Space Sci.Rev. 132, 189–202.
Berry, L.G., Mason, B., 1959. Mineralogy, Concepts, Descriptions, Determinations.W.H. Freeman and Company, San Francisco, p. 630.
Burbine, T.H., McCoy, T.J., Nittler, L.R., Benedix, G.K., Cloutis, E.A., Dickinson, T.L.,2002. Spectra of extremely reduced assemblages: implications for mercury.Meteor. Planet. Sci. 37, 1233–1244.
Butler, B., Muhleman, D., Slade, M., 1993. Mercury: full-disk radar images and thedetection and stability of ice at the north pole. J. Geophys. Res. 98,15,003–15,023.
Cameron, A., 1985. The partial vaporization of Mercury. Icarus 64, 285–294.Christensen, P.R., Bandfield, J.L., Hamilton, V.E., Howard, D.A., Lane, M.D., Piatek,
J.L., Ruff, A.W., Stefanov, W.L., 2000. A thermal emission spectral library of rock-forming minerals. J. Geophys. Res. 105, 9735–9739.
Clark, R.N., Swayze, G.A., Wise, R., Livo, E., Hoefen, T., Kokaly, R., Sutley, S.J., 2007.USGS digital spectral library splib06a: US Geologic Survey, Digital Data Series231. /http://speclab.cr.usgs.gov/spectral-lib.htmlS.
Cohen, M., Witteborn, F.C., Walker, R.G., Bregman, J.D., Wooden, D.H., 1995. Spectralirradiance calibration in the infrared. IV. 1.2–35mm spectra of six standardstars. Astron. J. 110 (1), 275–289.
Cohen, M., Witteborn, F.C., Carbon, D.F., Davies, J.K., Wooden, D.H., Bregman, J.D.,1996. Spectral irradiance calibration in the infrared. VII. New compositespectra, comparison with model atmospheres, and far-infrared extrapolations.Astron. J. 112 (5), 2274–2285.
Cooper, B., Potter, A., Killen, R., Morgan, T., 2001. Mid-infrared spectra of Mercury.J. Geophys. Res. 106 (E12), 32803–32814.
Davies, M.E., Gault, De E., Dwornik, S.E., Strom, R.G., 1978. Atlas of Mercury. NASASP-423. NASA Scientific and Technical Information Office.
Deutsch, L.K., Hora, J.L., Adams, J.D., Kassis, M., 2003. MIRSI: a mid-infraredspectrometer and imager. Proc. SPIE 4841, 106–116.
Dollfus, A., Auriere, M., 1974. Optical polarimetry of planet Mercury. Icarus 23,465–482.
Donaldson Hanna, K., Sprague, A.L., 2009. Vesta and the HED meteorites: mid-infrared modeling of minerals and their abundances. Meteor. Planet. Sci.,in press.
Donaldson Hanna, K.L., Sprague, A.L., Kozlowski, R.W.H., Boccafolo, K., Warell, J.,2007. Mercury and the Moon: initial findings from mid-infrared spectroscopicmeasurements of the surface. In: Lunar and Planetary Institute ConferenceAbstracts, p. 2291.
Emery, J.P., Sprague, A.L., Witteborn, F.C., Colwell, J.E., Kozlowski, R.W.H., Wooden,D.H., 1998. Mercury: thermal modeling and mid-infrared (5–12mm) observa-tions. Icarus 136, 104–123.
Feely, K.C., Christensen, P.R., 1999. Quantitative compositional analysis usingthermal emission spectroscopy: application to igneous and metamorphicrocks. J. Geophys. Res. 104, 24,195–24,210.
Floran, R.J., Prinz, M., Hlava, P.F., Keil, K., Spettel, B., Wanke, H., 1981. Mineralogy,petrology, and trace element geochemistry of the Johnstown meteorite: abrecciated orthopyroxenite with siderophile and REE-rich components.Geochemica 45, 2385–2391.
Furhman, M., Papike, J.J., 1981. Howardites and polymict eucrites: regolith samplesfrom the eucrite parent body. Petrology of Bholghati, Bununu, Kapoeta, andALHA76006. In: Proceedings, 12th Lunar and Planetary Science Conference,pp. 1257–1279.
Gibson, E.K., 1977. Production of simple molecules on the surface of Mercury. Phys.Earth Planet. Inter. 15, 303–3112.
Gillis-Davis, J., Blewett, D.T., Gaskell, R., Denevi, B.W., Robinson, M., Strom, B.,Sprague, A., Solomon, S., The MESSENGER Team, 2009. Pit-floor craters onMercury: evidence of near-surface igneous activity. Earth Planet. Sci. Lett., inpress.
Goldstein, R.M., 1970. Mercury: surface features observed during radar studies.Science 168, 467–468.
Goldstein, R.M., 1971. Radar observations of Mercury. Astron. J. 76, 1152–1154.Grove, C.I., Hook, S.J., Paylor II, E.D., 1992. Laboratory Reflectance Spectra of 160
Minerals, 0.4–2.5mm. NASA, Pasadena, CA.Hamilton, V.E., 2003. Thermal infrared emission spectroscopy of titanium-
enriched pyroxenes. J. Geophys. Res. 108 (E8), 5095.Hamilton, V.E., Christensen, P.R., 2000. Determining the modal mineralogy of mafic
and ultramafic igneous rocks using thermal emission spectroscopy. J. Geophys.Res. 105, 9717–9733.
Hamilton, V.E., Christensen, P.R., McSween Jr., H.Y., 1997. Determination of Martianmeteorite lithologies and mineralogies using vibrational spectroscopy.J. Geophys. Res. 102, 25593–25603.
Hanna, K., Sprague, A., Kozlowski, R., Hunten, D., Boccafolo, K., Warell, J., 2006.Mid-infrared 2-D long-slit spectroscopy and filter imaging of Mercury and theMoon using MIRSI. In: Lunar and Planetary Science Conference XXXIII, Abs.
Harmon, J.K., 1997. Mercury radar studies and lunar comparisons. Adv. Space Res.19, 1487–1496.
Harmon, J.K., Slade, M.A., Butler, B.J., Head, J.W., Rice, M.S., Campbell, D.B., 2007.Mercury: radar images of the equatorial and mid-latitude zones. Icarus 187,374–405.
Head, J.W., Murchie, S.L., Prockter, L.M., Robinson, M.S., Solomon, S.S., Strom, R.G.,Chapman, C.R., Watters, T.R., McClintock, W.E., Blewett, D.T., Gillis-Davis, J.J.,The MESSENGER Team, 2008. Volcanism on Mercury: evidence from the firstMESSENGER flyby. Science 321, 69–71.
Helbert, J., Maturilli, A., 2008. The heat is on—in the Planetary EmissivityLaboratory (PEL) at DLR Berlin. In: Lunar and Planetary Science Conference Abs,p. 2408.
Helbert, J., Moroz, L.V., Maturilli, A., Bischoff, A., Warell, J., Sprague, A., Palomba, E.,2007. A set of laboratory analogue materials for the MERTIS instrument on theESA BepiColombo mission to Mercury. Adv. Space Res. 40, 272–279.
Henderson, B.G., Jakosky, B.M., 1997. Near-surface thermal gradients and mid-IRemission spectra: a new model including scattering and application to realdata. J. Geophys. Res. 102 (E3), 6567–6580.
ARTICLE IN PRESS
A.L. Sprague et al. / Planetary and Space Science 57 (2009) 364–383 383
Hiesinger, H., Helbert, J., The MERTIS Co-I Team, 2008. The Mercury Radiometerand Thermal Infrared Spectrometer (MERTIS) for the BepiColombo Mission.Planet. Space Sci., in press, doi:10.1016/pss.2008.09.019.
Hook, S.J., 1998. ASTER spectral library, /http://speclib.jpl.nasa.govS.Jeanloz, R., Mitchell, D.L., Sprague, A.L., de Pater, I., 1995. Evidence for a basalt-free
surface on Mercury and implications for internal heat. Science 268, 1455–1457.Johnson, J.R., Horz, F., 2003. Visible/near-infrared spectra of experimentally
shocked plagioclase feldspars. J. Geophys. Res. 108.Johnson, J.R., Horz, F., Lucey, P.G., Christensen, P.R., 2002. Thermal infrared
spectroscopy of experimentally shocked anorthosite and pyroxenite: implica-tions for remote sensing on Mars. J. Geophys. Res. 107.
Kassis, M., Adams, J.D., Campbell, M.F., Deutsch, L.K., Hora, J.L., Jackson, J.M.,Tollestrup, E.V., 2006. Mid-infrared emission at photodissociation regions inthe Orion nebula. Astron. J. 637 (2), 823–837.
Kassis, J., Adams, J.D., Hora, J.L., Deutsch, L.K., Tollestrup, E.V., 2008. MIRSI, a mid-infrared spectrometer and imager: performance results from the IRTF. Pub.Astron. Soc. Pacific 120 (874), 1271–1281.
Ksanfomality, L.V., 2004. A huge basin in the unknown portion of Mercury in the250deg;–290deg; W Longitude Range. Sol. System Res. 38, 21–27.
Lewis, J.S., 1997. Physics and chemistry of the solar system. In: Physics andChemistry of the Solar System. Academic Press, San Diego.
Logan, L., Hunt, G.R., 1970. Emission spectra of particulate silicates under simulatedlunar conditions. J. Geophys. Res. 75, 6539–6548.
Love, S.G., Keil, K., 1995. Recognizing mercurian meteorites. Meteor. Planet. Sci. 30,269.
Maturilli, A., Helbert, J., Witzke, A., Moroz, L., 2006. Emissivity measurements ofanalogue materials for the interpretation of data from PFS on Mars Express andMERTIS on Bepi-Colombo. Planet. Space Sci. 54, 1057–1064.
Maturilli, A., Helbert, J., Moroz, L., 2008. The Berlin emissivity database (BED).Planet. Space Sci. 56, 420–425.
McClintock, W.E., Izenberg, N.R., Holsclaw, G.M., Blewett, D.T., Domingue, D.L.,Head, J.W., Helbert, J., McCoy, T.J., Murchie, S.L., Robinson, M.S., Solomon, S.C.,Sprague, A.L., Vilas, F., 2008. Spectroscopic observations of Mercury’s surfacereflectance during MESSENGER’s first mercury flyby. Science 321, 62–65.
Melosh, H.J., McKinnon, W.B., 1988. The tectonics of Mercury. In: Vilas, F.,Chapman, C.R., Matthews, M.S. (Eds.), Mercury. University of Arizona Press,Tucson, pp. 374–400.
Milam, K.A., McSween Jr., H.Y., Christensen, P.R., 2007. Plagioclase compositionsderived from thermal emission spectra of compositionally complex mixtures:implications for Martian feldspar mineralogy. J. Geophys. Res. 112, E10005.
MIRSI /http://www.cfa.harvard.edu/mirsi/S.Mitchell, D., dePater, I., 1994. Microwave imaging of Mercury’s thermal emission at
wavelengths from 0.3 to 20.5 cm. Icarus 110, 2–32.Mittlefehldt, D.W., McCoy, T.J., Goodrich, C.A., Kracher, A., 1998. Non-chondritic
meteorites from asteroidal bodies. In: Papike, J.J. (Ed.), Planetary Materials,vol. 36. Mineralogical Society of America, Washington, DC, pp. 4-1–4-195.
Murchie, S.L., Watters, T.R., Robinson, M.S., Head, J.W., Strom, R.G., Chapman, C.R.,Solomon, S.C., McClintock, W.E., Procter, L.M., Domingue, D.L., Blewett, D.T., TheMESSENGER Team, 2008. Geology of the caloris basin, Mercury: a new viewfrom MESSENGER. Science 321, 69–71.
Mustard, J.F., Hays, J.E., 1997. Effects of hyperfine particles on reflectance spectrafrom 0.3 to 25 mm. Icarus 125, 145–163.
Nash, D.B., 1991. Infrared reflectance spectra (4–12mm) of typical lunar samples.Geophys. Res. Lett. 18 (11), 2145–2147.
Nash, D.B., Salisbury, J.W., 1991. Infrared reflectance spectra (4–12mm) ofplagioclase feldspars. Geophys. Res. Lett. 18 (6), 1151–1154.
Noble, S.K., Pieters, C.M., Keller, L.P., 2007. An experimental approach tounderstanding the optical effects of space weathering. Icarus 192, 629–642.
Pieters, C.M., Hiroi, T., 2004. RELAB (Reflectance Experiment Laboratory): a NASAmultiuser spectroscopy facility. In: Proceedings, 35th Lunar and PlanetaryScience Conference. Abstract no. 1720.
Potter, A.E., Morgan, T.H., 1985. Discovery of sodium in the atmosphere of Mercury.Science 229, 651–653.
Potter, A.E., Morgan, T.H., 1986. Potassium in the atmosphere of Mercury. Icarus 67,336–340.
Ramsey, M.S., 1996. Quantitative analysis of geological surfaces: a deconvolutionalgorithm for mid-infrared remote sensing data. Ph.D. Dissertation, ArizonaState University.
Ramsey, M.S., Christensen, P.R., 1998. Mineral abundance determination: quanti-tative deconvolution of thermal infrared spectra. J. Geophys. Res. 103, 577–596.
Robinson, M.W., Murchie, S.L., Blewett, D.T., Domingue, D.L., Edward Hawkins, I.S.,Head, J.W., Holsclaw, G.M., McClintock, W.E., McCoy, T.J., Procter Jr., L.M., Solomon,S.C., Watters, T.R., 2008. Reflectance and color variations on mercury: indicators ofregolith processes and compositional heterogeneity. Science 321, 66–69.
Ruff, S.W., Christensen, P.R., Barbera, P.W., Anderson, D.L., 1997. Quantitativethermal emission spectroscopy of minerals: a laboratory technique formeasurement and calibration. J. Geophys. Res. 102, 14899–14913.
Salisbury, J.W., Walter, L.S., Vergo, N., 1987. Mid-infrared (2.1–25mm) spectra ofminerals, first ed. Open-File Report 87-263. USGS, Greenbelt, MD.
Salisbury, J.W., Walter, L.S., D’Aria, D., 1988. Mid-infrared (2.5–13.5mm) spectra ofigneous rocks. Open-File Report 88-686, US Geological Survey, Reston, VA.
Salisbury, J.W., D’Aria, D.M., Jarosewich, E., 1991. Midinfrared (2.5–13.5mm)reflectance spectra of powdered stony meteorites. Icarus 92, 280–297.
Salisbury, J.W., Wald, A., D’Aria, D.M., 1994. Thermal-infrared remote sensing andKirchoff’s Law 1. Laboratory measurements. J Geophys. Res. 99, 11897–11911.
Slade, M., Butler, B., Muhleman, D., 1992. Mercury radar imaging: evidence forpolar ice. Science 258, 635–640.
Solomon, S.C., McNutt, R.L., Watters, T.R., Lawrence, D.J., Feldman, W.C., Head, J.W.,Krimigis, S.M., Murchie, S.L., Phillips, R.J., Slavin, J.A., Zuber, M.T., 2008. Returnto Mercury: a global perspective on MESSENGER’s first Mercury flyby. Science321, 59–61.
Sprague, A.L., Roush, T.L., 1998. Comparison of laboratory emission spectra withMercury telescopic data. Icarus 133, 174–183.
Sprague, A.L., Kozlowski, R.W.H., Hunten, D.M., 1990. Caloris basin: an enhancedsource for potassium in Mercury’s atmosphere. Science 249, 1140–1143.
Sprague, A.L., Kozlowski, R.W.H., Witteborn, F.C., Cruikshank, D.P., Wooden, D.H.,1994. Mercury: evidence for anorthosite and basalt from mid-infrared(7.3–13.5mm) spectroscopy. Icarus 109, 156–167.
Sprague, A.L., Nash, D.B., Witteborn, F.C., Cruikshank, D.P., 1997a. Mercury’sfeldspar connection: mid-ir measurements suggest plagioclase. Adv. Space Res.19, 1507–1510.
Sprague, A.L., Kozlowski, R.W.H., Hunten, D.M., Schneider, N.M., Domingue, D.L.,Wells, W.K., Schmitt, W., Fink, U., 1997b. Distribution and abundance of sodiumin Mercury’s atmosphere, 1985–1988. Icarus 129, 506–527.
Sprague, A.L., Emery, J.P., Donaldson, K.L., Russell, R.W., Lynch, D.K., Mazuk, A.L.,2002. Mercury: mid-infrared (3–13.5mm) observations show heterogeneouscomposition, presence of intermediate and basic soil types, and pyroxene.Meteor. Planet. Sci. 37, 1255–1268.
Sprague, A.L., Donaldson Hanna, K.L., Kozlowski, R.W.H., Helbert, J., Maturilli, A.,Izenberg, N.R., 2008. Mercury: Mg-rich mineralogy with K-spar and garnet. In:Lunar and Planetary Institute Conference Abstracts, p. 1320.
Strom, R.G., Trask, N.J., Guest, J.E., 1975. Tectonism and volcanism on Mercury.J. Geophys. Res. 80, 2478.
Strom, R.G., Chapman, C.R., Merline, W.J., Solomon, S.C., Head, J.W. III, 2008.Mercury cratering record viewed from MESSENGER’s first flyby. Science 321,79–81.
Taylor, S.R., 1982. Planetary Science: a Lunar Perspective. In: Lunar and PlanetaryInstitute, Houston, TX 77058, p. 479.
Taylor, L.A., 1992. Resources for a lunar base: rocks, minerals, and soil of the Moon.In: The Second Conference on Lunar Bases and Space Activities of the 21stCentury, vol. 2, NASA, Johnson Space Center, pp. 361–377.
Thomas, P.G., Masson, P., Fleitout, L., 1988. Tectonic history of Mercury. In: Vilas,C.R.C.F., Matthews, M.S. (Eds.), Mercury. University of Arizona Press, Tucson,AZ, pp. 401–428.
Tody, D., 1986. The IRAF data reduction and analysis system. In: Crawford, D.L.(Ed.), Proceedings of the SPIE Instrumentation in Astronomy VI, vol. 627, p. 733.
Tody, D., 1993. IRAF in the nineties. In: Hanisch, R.J., Brissenden, R.J.V., Barnes, J.,(Eds.), Astronomical Data Analysis Software and Systems II, A.S.P. ConferenceSeries V52, p. 173.
Toon, G.C., 1991. The JPL MkIV interferometer. Opt. Photon. News 2 (10), 19–21.Tyler, A.L., Kozlowski, R.W.H., Lebofsky, L., 1988. Determination of rock type on
Mercury and the Moon through remote sensing in the thermal infrared.Geophys. Res. Lett. 15, 808–811.
Vilas, F., 1988. Surface composition of Mercury from reflectance spectrophoto-metry. In: Vilas, F., Chapman, C.R., Matthews, M.S. (Eds.), Mercury. University ofArizona Press, Tucson, AZ, pp. 59–76.
Warell, J., Blewett, D.T., 2004. Properties of the Hermean regolith: V. New opticalreflectance spectra, comparison with lunar anorthosites, and mineralogicalmodelling. Icarus 168, 257–276.
Warell, J., Sprague, A.L., Emery, J., Kozlowski, R.W., Long, A., 2006. The 0.7–5.3mmrIR spectra of Mercury and the Moon: evidence for high-Ca clinopyroxene onMercury. Icarus 180 (2), 281–291.
Watters, T.R., Nimmo, F., Robinson, M.S., 2005. The origin of polygonal troughs inthe Caloris Basin of Mercury. In: 36th Annual Lunar and Planetary ScienceConference, Lunar and Planetary Institute, Houston, TX, p. 1449.
Watters, T.R., Solomon, S.C., Robinson, M.S., Prockter, L.M., Strom, R.G., Head, J.W.,Chapman, C.R., Murchie, S.L., 2008. The tectonics of Mercury: a new view fromMESSENGER. In: Lunar and Planetary Institute Conference Abstracts, p. 1300.
Watters, T.R., Murchie, S.L., Robinson, M.S., Solomon, S.C., Denevi, B., Andre, S., theMESSENGER Team, 2009, Geology and tectonics of Caloris Basin, Mercury.EPSL, review.
Williams, H., turner, F.J., Gilbert, C.M., 1955. Petrography, an Introduction to theStudy of Rocks and Thin Sections. W.H. Freeman and Company, San Francisco,p. 406.
Wyatt, M.B., Hamilton, V.E., McSween Jr., H.Y., Christensen, P.R., Taylor, L.A., 2001.Analysis of terrestrial and Martian volcanic compositions using thermalemission spectroscopy: 1. Determination of mineralogy, chemistry, andclassification strategies. J. Geophys. Res. 106, 14711–14732.
Zurbuchen, T.H., Raines, J.M., Gloeckler, G., Krimigis, S.M., Slavin, J.A., Koehn, P.L.,Killen, R.M., Sprague, A.L., McNutt Jr., R.L., Solomon, S.C., 2008. MESSENGERobservations of the composition of Mercury’s ionized exosphere and plasmaenvironment. Science 321, 90–92.