comparisons of the spectral emissivity measurements at ... · spectro/radio/photometer then we...
TRANSCRIPT

Comparisons of the spectral emissivity measurements at high temperatures of
stainless steel AISI 310S
SFERA II Project
Solar Facilities for the European Research Area — Second Phase
Grant agreement
number: 312643
Start date of project: 01/01/2014
Duration of project: 48 months
WP13 – Task 2.B Deliverable 13.3
Due date: 12/2016
Submitted 02/2018
File name: WP13 – Deliverable 13.3
Version 1
Partner responsible CNRS
Person responsible Emmanuel Guillot
Author(s): Jean-Louis Sans, Jesus Ballestrin, Emmanuel Guillot
Dissemination Level PU
FP7-INFRA-312643
WP13-T2.B — Deliverable D13.3
2
List of content
1. Introduction ........................................................................................................................................... 4 2. Measurement method of emissivity in Odeillo ..................................................................................... 4
2.1. General principle ....................................................................................................................... 4
2.2. Instrumentation setup .............................................................................................................. 5
2.3 Calibration with a blackbody ...................................................................................................... 9
2.4. Experimental measurements with the radiometer .................................................................. 9
2.5. Processed results from the radiometer .................................................................................. 10
2.6. Measurements and processed results from the spectro/radio/photometer......................... 18
3. Comparison with measures from CIEMAT ......................................................................................... 22 3.1. CIEMAT method and experimental campaign ........................................................................ 22
3.2. Comparison ............................................................................................................................. 22
4. Conclusion .......................................................................................................................................... 23

FP7-INFRA-312643
WP13-T2.B — Deliverable D13.3
3
Executive Summary The EU-funded research project SFERA2 – grant agreement 312643 – aims to boost
scientific collaboration among the leading European research institutions in solar
concentrating systems, offering European research and industry access to the best research
and test infrastructures and creating a virtual European laboratory.
This deliverable is part of the results of the task 1 of the workpackage 13 Determination of
physical properties of CSP materials under concentrated solar irradiation within the Joint
Research Activities.
This workpackage 13 aims to provide a better evaluation of the material behaviour for CSP
applications and other fields with similar thermal stress, such as high temperature steels or
SiC ceramics, thanks to better or new experimental tests bed and associated theoretical
models. These results will lead to help users developing higher performance materials for
higher process efficiency.
The task 2 of workpackage 13 is focused on two targets regarding optical properties:
A. Improving an existing experimental setup at CNRS to allow the unique feature of
determining the spectral directional emissivity of materials at high temperature,
B. Comparing where possible the emissivity measures achieved within the SFERA-II
consortium on reference test materials.
This document presents the comparison of emissivity measurements for AISI310S
conducted by CIEMAT and CNRS by 3 different setups.
The improved spectral directional emissivity determination of materials at thigh temperature
is described in deliverable 13.4.

FP7-INFRA-312643
WP13-T2.B — Deliverable D13.3
4
Comparisons of the spectral emissivity measurements
at high temperatures of stainless steel AISI 310 S
1. Introduction
2. Measurement method of emissivity in Odeillo
2.1. General principle
The method used is a direct method: measurement of the sample temperature and
measurement of its monochromatic directional luminance.
The spectral directional emissivity of the material is the ratio of the measured luminance to
the luminance of the black body under the same conditions of temperature and wavelength:
oLL ''
The temperature measurements are made using a pyroreflectometer equipped with a fiber
optic probe. These temperature values will help us to know 0L using the calibration
functions of the device.
The hemispheric emissivity can be calculated by integrating the interpolated data of the
directional values extrapolated to zero for the 90 degree incidence:
𝜀𝜆∩ = ∫ 𝜀𝜆
′𝜋2
0sin 2𝜃 𝑑𝜃
Using integration over different spectral ranges, we can then calculate the emissivities 144.0
and 8.24.0 which will be used to determine the solar factor of material
144.08.24.0 / .

FP7-INFRA-312643
WP13-T2.B — Deliverable D13.3
5
2.2. Instrumentation setup
The instruments to get the emissivity through the measurement of radiances are radiometers
and spectroradiometers.
With the radiometer, measurements are obtained over wide spectral or monochromatic
bands. With the spectro/photo/radiometer, they provide continuous measurements of
discrete wavelengths, allowing a finer analysis of the behavior of materials such as, for
example, hot oxidation of metals.
At Odeillo, using the MEDIASE setup in its emissivity configuration, measurements are made
at different viewing angles (up to 11) to allow to calculate the hemispheric emissivity.
The temperatures of the material can be varied from 800 to 2200 °C using the concentrated
solar energy of Odeillo’s Big Solar Furnace, the MWSF.
Since these materials are heated using a solar concentrator, the measurements can be very
fast for example to avoid or limit material changes such as oxidation. As they are solar
heated, the measurements need to be fast in order to reject atmospheric perturbation:
typically 45 s for all the angular measurements, and we include a quick pretreatment in real
time to check the correct operation of the instrumental chain and operating conditions during
the experimental campaign.
The sample is introduced into the MEDIASE chamber (French for Test and Diagnosis Device
in Extreme Space Ambience) (photo n °1) via the cover on which there is a set of three
mirrors (photo n °2) allowing the angular measurements radiances.
The distance between the entrance of the spectro/photo/radiometer or radiometer telescope
and the sample is fixed at 1.3 m. We have a measuring spot of 9 mm diameter for both
instruments.

FP7-INFRA-312643
WP13-T2.B — Deliverable D13.3
6
Photo n°1: MEDIASE chamber

FP7-INFRA-312643
WP13-T2.B — Deliverable D13.3
7
Photo n°2: The 3 mirrors from the MEDIASE cover for angular measurements.
The spectroradiometer (photo n °3) has a spectral range that starts at 1.3 μm and ends at 14
μm. Its detector is cooled by the Peltier effect and is of the photoconductive type (MCT), it
has a detectivity of the order of 1.9.109 cm.Hz1/2 / W and is calibrated in radiance (W / m3.sr).
The photometer part of this instrument (0.4 – 1µm) is under modifications for proper
operation. Refer to SFERA-II D13.4 for further details.

FP7-INFRA-312643
WP13-T2.B — Deliverable D13.3
8
Photo n°3: Spectroradiometer SR5000N during laboratory calibration
The radiometer (photo n ° 4) is equipped with an uncooled bolometer sensitive to
wavelengths from 0.6 to 40 μm, it has a detectivity of the order of 1.108 cm. Hz1/2 / W and is
calibrated in radiance (W / m3.sr).
Photo n°4: The radiometer (on left, in blue) in front of the MEDIASE chamber
FP7-INFRA-312643
WP13-T2.B — Deliverable D13.3
9
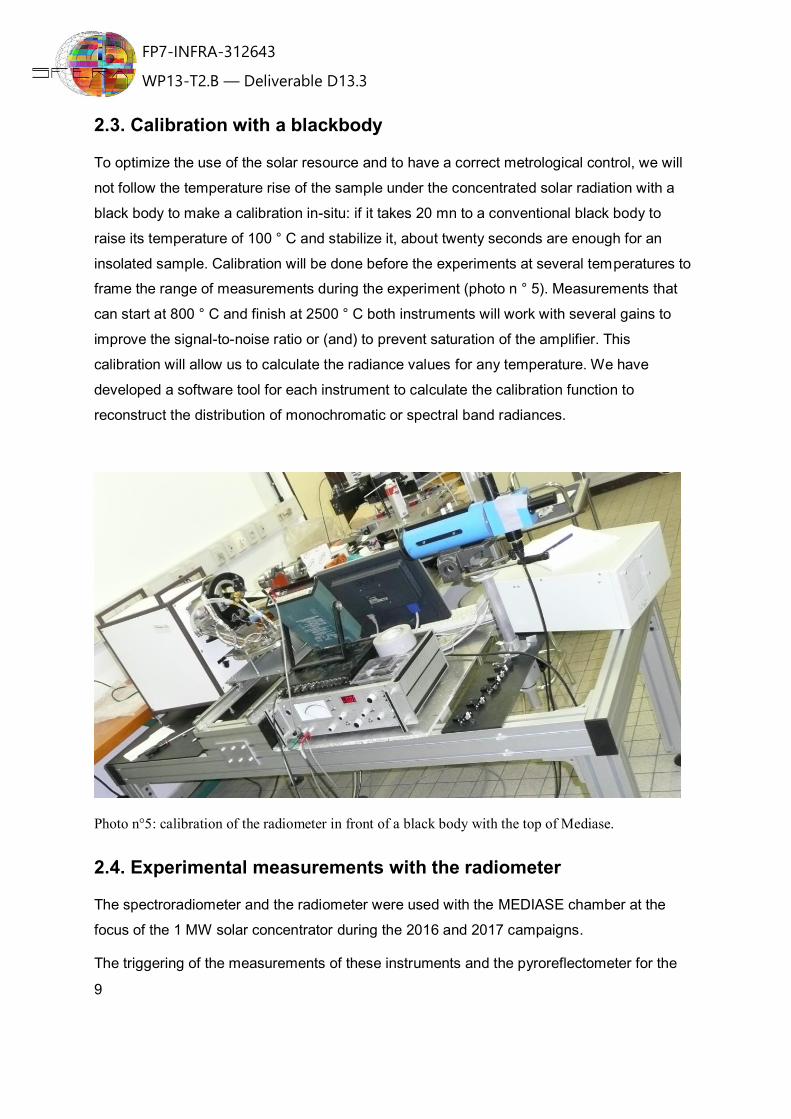
2.3. Calibration with a blackbody
To optimize the use of the solar resource and to have a correct metrological control, we will
not follow the temperature rise of the sample under the concentrated solar radiation with a
black body to make a calibration in-situ: if it takes 20 mn to a conventional black body to
raise its temperature of 100 ° C and stabilize it, about twenty seconds are enough for an
insolated sample. Calibration will be done before the experiments at several temperatures to
frame the range of measurements during the experiment (photo n ° 5). Measurements that
can start at 800 ° C and finish at 2500 ° C both instruments will work with several gains to
improve the signal-to-noise ratio or (and) to prevent saturation of the amplifier. This
calibration will allow us to calculate the radiance values for any temperature. We have
developed a software tool for each instrument to calculate the calibration function to
reconstruct the distribution of monochromatic or spectral band radiances.
Photo n°5: calibration of the radiometer in front of a black body with the top of Mediase.
2.4. Experimental measurements with the radiometer
The spectroradiometer and the radiometer were used with the MEDIASE chamber at the
focus of the 1 MW solar concentrator during the 2016 and 2017 campaigns.
The triggering of the measurements of these instruments and the pyroreflectometer for the

FP7-INFRA-312643
WP13-T2.B — Deliverable D13.3
10
measurement of the temperatures of the sample are managed by the same computer which
also controls the positions of the mirrors.
The measured samples are the same grade of stainless steel: AISI 310S. They have the
shape of a disk 40 mm in diameter and 3 mm thick. They were provided and put in shape by
the CIEMAT colleagues from PSA.
We started using the Heimann model KT4 radiometer with different filters:
• 0.6-40 μm,
• 0.6-2.8 μm,
• 3-5 μm,
• 8-14 μm,
• 2.7 μm,
• 5 μm,
• 5.5 μm.
2.5. Processed results from the radiometer
The processed results are shown in fig. 1 to 7. The measurements, distributed over 5
temperature levels, start at about 1000 K and end at about 1390 K. Emissivities at the
highest temperature were measured twice within 5 minutes to verify the stability of the
oxidized layer.

FP7-INFRA-312643
WP13-T2.B — Deliverable D13.3
11
Fig. 1: Total directional emissivities of stainless steel (AISI 310S)
FP7-INFRA-312643
WP13-T2.B — Deliverable D13.3
12
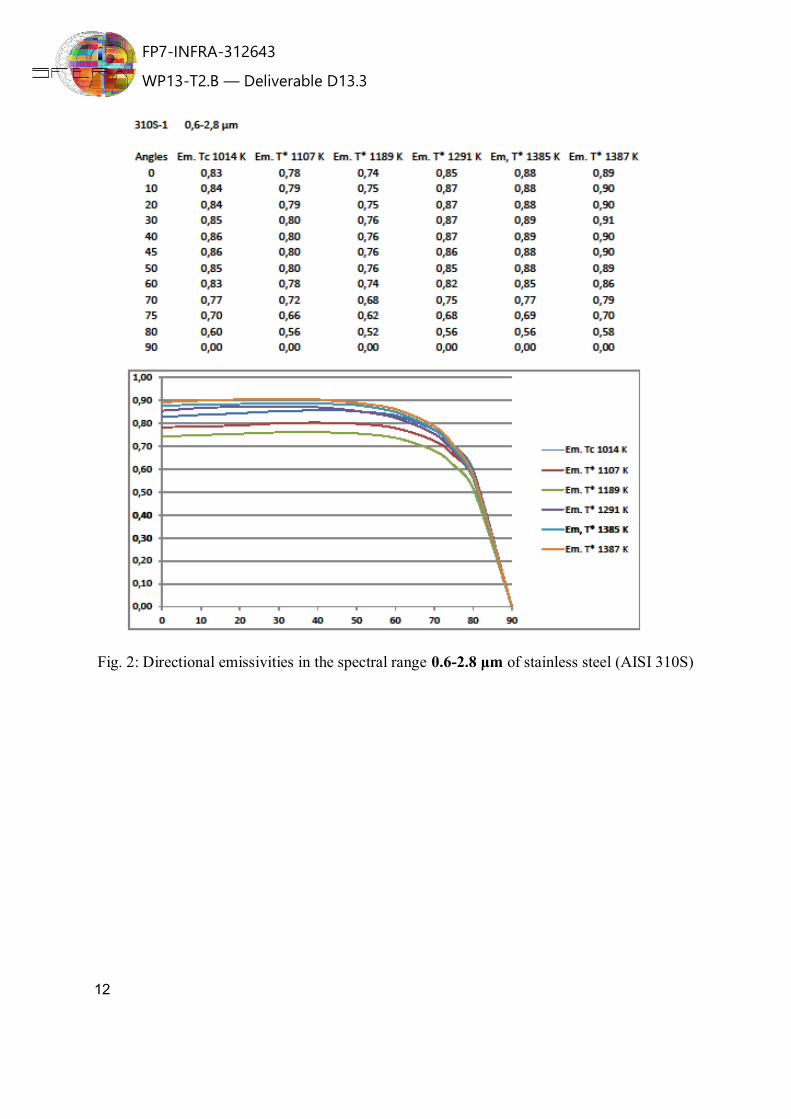
Fig. 2: Directional emissivities in the spectral range 0.6-2.8 μm of stainless steel (AISI 310S)

FP7-INFRA-312643
WP13-T2.B — Deliverable D13.3
13
Fig. 3: Directional emissivities in the spectral range 3-5 μm of stainless steel (AISI 310S)
FP7-INFRA-312643
WP13-T2.B — Deliverable D13.3
14
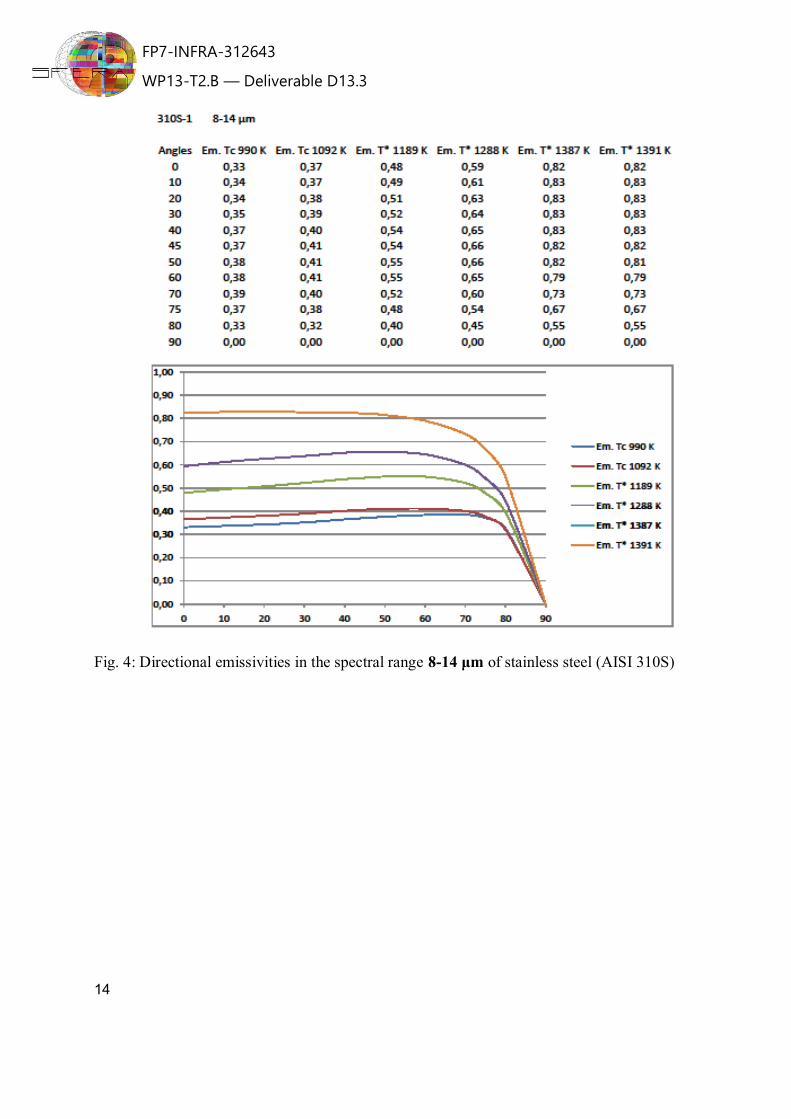
Fig. 4: Directional emissivities in the spectral range 8-14 μm of stainless steel (AISI 310S)

FP7-INFRA-312643
WP13-T2.B — Deliverable D13.3
15
Fig. 5: Monochromatic directional emissivities at 2.7 μm of stainless steel (AISI 310S)

FP7-INFRA-312643
WP13-T2.B — Deliverable D13.3
16
Fig. 6: Monochromatic directional emissivities at 5 μm of stainless steel (AISI 310S)

FP7-INFRA-312643
WP13-T2.B — Deliverable D13.3
17
Fig. 7: Monochromatic directional emissivities at 5.5 μm of stainless steel (AISI 310S)
FP7-INFRA-312643
WP13-T2.B — Deliverable D13.3
18
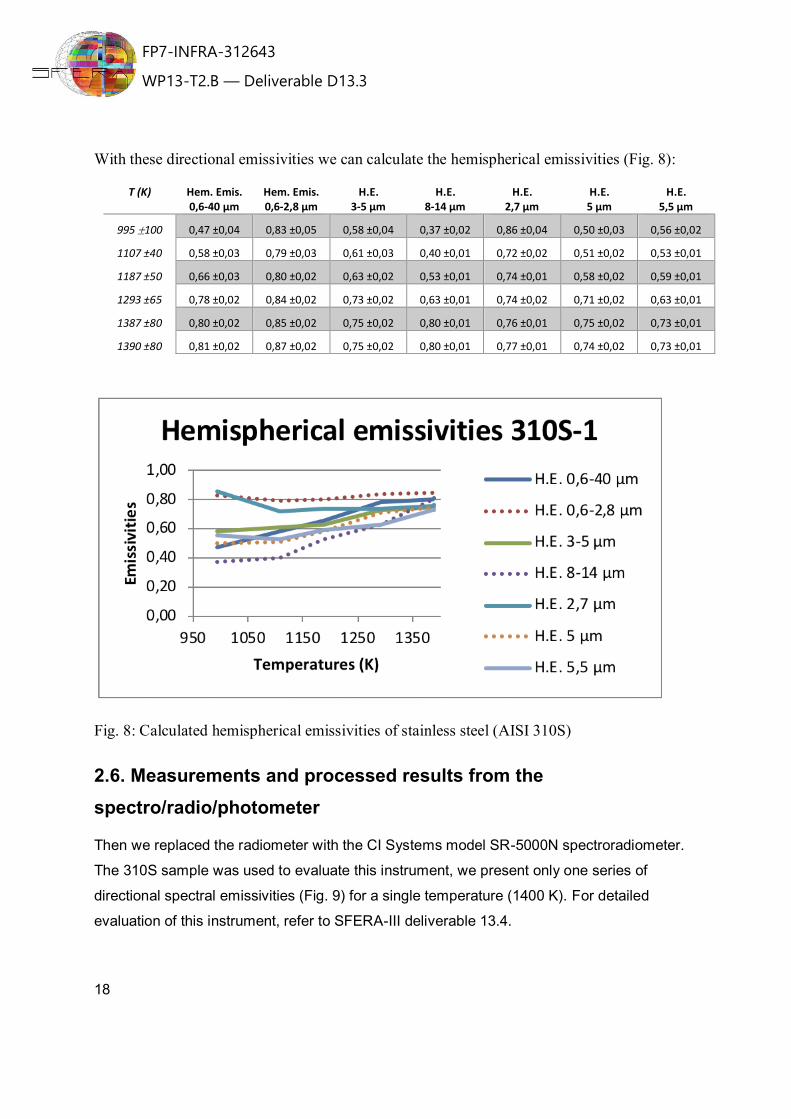
With these directional emissivities we can calculate the hemispherical emissivities (Fig. 8):
T (K) Hem. Emis. 0,6-40 µm
Hem. Emis. 0,6-2,8 µm
H.E. 3-5 µm
H.E. 8-14 µm
H.E. 2,7 µm
H.E. 5 µm
H.E. 5,5 µm
995 100 0,47 ±0,04 0,83 ±0,05 0,58 ±0,04 0,37 ±0,02 0,86 ±0,04 0,50 ±0,03 0,56 ±0,02
1107 ±40 0,58 ±0,03 0,79 ±0,03 0,61 ±0,03 0,40 ±0,01 0,72 ±0,02 0,51 ±0,02 0,53 ±0,01
1187 ±50 0,66 ±0,03 0,80 ±0,02 0,63 ±0,02 0,53 ±0,01 0,74 ±0,01 0,58 ±0,02 0,59 ±0,01
1293 ±65 0,78 ±0,02 0,84 ±0,02 0,73 ±0,02 0,63 ±0,01 0,74 ±0,02 0,71 ±0,02 0,63 ±0,01
1387 ±80 0,80 ±0,02 0,85 ±0,02 0,75 ±0,02 0,80 ±0,01 0,76 ±0,01 0,75 ±0,02 0,73 ±0,01
1390 ±80 0,81 ±0,02 0,87 ±0,02 0,75 ±0,02 0,80 ±0,01 0,77 ±0,01 0,74 ±0,02 0,73 ±0,01
Fig. 8: Calculated hemispherical emissivities of stainless steel (AISI 310S)
2.6. Measurements and processed results from the spectro/radio/photometer
Then we replaced the radiometer with the CI Systems model SR-5000N spectroradiometer.
The 310S sample was used to evaluate this instrument, we present only one series of
directional spectral emissivities (Fig. 9) for a single temperature (1400 K). For detailed
evaluation of this instrument, refer to SFERA-III deliverable 13.4.

FP7-INFRA-312643
WP13-T2.B — Deliverable D13.3
19

FP7-INFRA-312643
WP13-T2.B — Deliverable D13.3
20
Fig. 9: Directional spectral emissivities without absorption bands of stainless steel (AISI 310S)
Water absorption bands around 1.9 μm and 2.7 μm and carbon dioxide around 4.3 μm have
been removed using interpolation. They appear in the form of emissivity peaks sometimes
greater than 1 and are not a characteristic of the behavior of the material. They represent the
difference of atmospheric conditions between the time when the calibration was performed
and the moment when the measurements were performed. When the spectral emissivities of
the material evolve monotonously around these peaks, the points removed are replaced by
interpolated values. This will not be the case for the zone around 6.3 μm (absorption due to
water) where there are large variations in values.
The hemispherical emissivities calculated with and without the absorption bands are given in
Tables 1 and 2.
Spectral bands (µm)
Calculated hemispherical emissivities without absorption bands
1,41 – 13,95 0,81
1,41 – 2,41 0,75
3,01 – 4,98 0,78
8,03 – 13,95 0,82
2,71 0,77
5,02 0,78
5,52 0,83
Table 1: Hemispherical emissivities excluding absorption bands of stainless steel (AISI 310S)

FP7-INFRA-312643
WP13-T2.B — Deliverable D13.3
21
Spectral bands (µm)
Calculated hemispherical emissivities with absorption bands
1,41 – 13,95 0,82
1,41 – 2,41 0,78
3,01 – 4,98 0,80
8,03 – 13,95 0,82
2,71 0,90
5,02 0,78
5,52 0,83
Table 2: Hemispherical emissivities with absorption bands of stainless steel (AISI 310S)
We immediately see the effect of absorptions especially when they are included in the
spectral bands that interest us or worse on the wavelength that corresponds to an
absorption. At 2.7 μm it causes a 17% increase in the emissivity value. The comparison of
the radiometric and spectroradiometric measurements gives some remarks: we have quasi-
identical results for the broad spectral bands, they are little impacted by the absorption zones
whereas the measurements of the two instruments are separated by a time interval of a
month.

FP7-INFRA-312643
WP13-T2.B — Deliverable D13.3
22
3. Comparisonn with measures from CIEMAT
3.1. Method and experimental campaign
The method used is described in detail in the article "Pyrometric Method for Measuring
Emissions at High Temperatures" SolarPACES 2015, AIP Conf. Proc. 1734, 130003-1-
130003-8; doi: 10.1063/1.4949213.
3.2. Comparison
The following emissivities are extracted from the data used for the article, they are given at
1273 K.
Spectral bands (µm) Calculated hemispherical emissivities
1,40 0,90
1,90 0,97
3,32 0,85
4,72 0,83
1,50-5,00 0,90
We can extract the same spectral bands from the CNRS spectroradiometer data and
calculate the hemispherical emissivities:
Spectral bands
(µm)
Hemispheric emissivities calculated from spectroradiometer data with absorption bands
1,39 0,75
1,90 0,78
3,32 0,78
4,73 0,79
1,50-5,00 0,79

FP7-INFRA-312643
WP13-T2.B — Deliverable D13.3
23
We observe a notable shift in the values that can be explained by the different measurement
methods used: at Ciemat the measurements are made on the insolated face of the material,
also there are detected parasitic reflectivities, at Promes these parasitic reflectivities are
avoided by making the measurements on the back side of the material in a close chamber.
We obtain the greatest differences in absorption lengths at 1.4 and 1.9 μm (more than 20%),
then the difference is reduced to 3.32 and 4.73 μm respectively 9 and 5%, probably due to
the weak transmission of glass for these wavelengths.
4. Conclusion
A reference material has been characterized for its emissivity by three methods, 2 at CNRS
and 1 at CIEMAT. The data has been processed in order to compare it at one temperature
(1273 K), 5 spectral bands, hemispherical emissivity. The measurements are similar but do
differ significantly, by 5 to 20%. The source of these shift is probably a combination of
parasitic reflections on the setup and uncorrected atmospheric issues, but also possible
change in the actual oxidation state of the tested samples.
Further work is required and may include the following:
• Other measures are needed to test solutions for all methods to correct the effects of
absorptions, such as isolate the path of thermal radiation of their influences or model
the corrections to be made according to the humidity rate of the air for example.
• Then we must characterize the samples to control the parameters influencing the
emissivity measurements: roughness, homogeneity of its temperature on the
measured surface.
• And finally, we should establish a common oxidation protocol: for example to heat the
material at 1400 K for 15 minutes then to make measurements at 1200 or 1300 K to
reduce possible evolutions of oxides on the surface.
These updated protocols should also be confirmed with different materials.

Pyrometric method for measuring emittances at high temperaturesJ. Ballestrín, J. Rodríguez, M. E. Carra, I. Cañadas, M. I. Roldan, J. Barbero, and A. Marzo Citation: AIP Conference Proceedings 1734, 130003 (2016); doi: 10.1063/1.4949213 View online: http://dx.doi.org/10.1063/1.4949213 View Table of Contents: http://scitation.aip.org/content/aip/proceeding/aipcp/1734?ver=pdfcov Published by the AIP Publishing Articles you may be interested in Improvement to a bench top instrument for measuring spectral emittance at high temperatures Rev. Sci. Instrum. 74, 3130 (2003); 10.1063/1.1575923 Temperature measurement of high performance radiant emitters AIP Conf. Proc. 401, 189 (1997); 10.1063/1.53280 Pyrometric temperature measurement method and apparatus for measuring particle temperatures in hotfurnaces: Application to reacting black liquor Rev. Sci. Instrum. 67, 1976 (1996); 10.1063/1.1146954 Pulverized solid injection system. Application to laboratory burners and pyrometric temperature measurements Rev. Sci. Instrum. 66, 4041 (1995); 10.1063/1.1146440 Thermal radiation from laser heated silicon and pyrometric temperature measurements Appl. Phys. Lett. 45, 159 (1984); 10.1063/1.95153
Reuse of AIP Publishing content is subject to the terms at: https://publishing.aip.org/authors/rights-and-permissions IP: 193.146.147.230 On: Wed, 01 Jun 2016 08:52:07

Pyrometric Method for Measuring Emittances at High Temperatures
J. Ballestrín1, a), J. Rodríguez1, M. E. Carra1, I. Cañadas1, M. I. Roldan1, J. Barbero2, A. Marzo3
1CIEMAT – Plataforma Solar de Almería, Aptdo. 22, E-04200 Tabernas, Almería, Spain. 2Departamento de Física Aplicada, Universidad de Almería, Spain.
3Universidad de Antofagasta, Centro de Desarrollo Energético Antofagasta, Chile.
a) Corresponding author: [email protected]
Abstract. In this work an alternative method for emittance determination based on pyrometric measurements is presented. The measurement procedure has been applied to AISI 310S steel samples in the Plataforma Solar de Almería vertical axis solar furnace SF5. The experimental results show that emittance increases with increasing temperature and decreases with increasing wavelength. This behaviour is in agreement with experimental results obtained by other authors. Analysis of tests has revealed a good repeatability (1%) and accuracy (< 2%) of this measurement procedure.
INTRODUCTION
Many industrial and scientific applications need to know the effectiveness of material surfaces in emitting energy as thermal radiation. Quantitatively, emittance (emissivity) is the ratio of the thermal radiation from a surface to the radiation from an ideal black body at the same temperature as given by the Stefan–Boltzmann law. The terms emittance and emissivity are often used interchangeably. There is, however, a technical distinction. Emissivity refers to the properties of a material; emittance to the properties of a particular object. The total thermal radiant energy emitted by an ideal black body is a function only of its absolute temperature. On the contrary, thermal radiant energy emitted by real material surfaces depends on many factors such as temperature, surface roughness, wavelength and viewing angle [1]. Emittance therefore depends on the same factors and may theoretically range from 0 to 1 but in real material surfaces usually varies from approximately 0.1 to 0.95.
In the last years, both experimental and analytical studies on the emittance measurement at low temperatures have been done and nowadays different approaches are possible [2, 3, 4]. Unfortunately many of these approaches are not applicable when working at high temperatures. In this case, there are more sophisticated methods based on the measurements of the temperature and the total or spectral radiance of the sample [5, 6].
In this work, an alternative method for emittance determination based on pyrometric measurements is presented. The measurement procedure has been applied to steel samples AISI 310S in the Plataforma Solar de Almería (PSA) vertical axis solar furnace SF5 [7].
METHOD FOR EMITTANCE MEASUREMENT
Pyrometers and infrared cameras are non-contacting devices intercepting and measuring, in a certain wavelength band, thermal radiation emitted from an object to determine surface temperature. Emittance of a real surface in this wavelength band is:
ε∆ T
(1)
SolarPACES 2015AIP Conf. Proc. 1734, 130003-1–130003-8; doi: 10.1063/1.4949213
Published by AIP Publishing. 978-0-7354-1386-3/$30.00
130003-1 Reuse of AIP Publishing content is subject to the terms at: https://publishing.aip.org/authors/rights-and-permissions IP: 193.146.147.230 On: Wed, 01 Jun 2016 08:52:07

Where Lbλ is the black body spectral radiance, Lλ is the spectral radiance from the real surface and σ is the Stefan–Boltzmann constant. FBAND(T) is the fraction of the total emissive thermal power emitted at a given temperature T in a spectral band 'λ=λ1-λ2:
F T ≡
(2)
Setting the emissivity value of the pyrometric device at a constant value ελ(T) = εap, and assuming that Tap and T
are very close:
ε∆ T (3)
Where Tap is the apparent temperature supplied by the pyrometric device when an apparent emittance εap is fixed
and T is the true or real temperature of the sample surface. Some simulations of C(Tap, T)=FBAND(Tap)/FBAND(T) reveal how this relationship may differ slightly from 1
under certain conditions and equation 3 then only would be an approximation.
FIGURE 1. Factor C(Tap, T) versus T-Tap. Spectral range (1500-5000) nm
In the case to be described in this work, the temperature difference (T-Tap) is always less than 30 Celsius degrees
and the deviation of the factor C from the unit is less than 1%, then equation 3 can be applied properly (Fig. 1).
PSA VERTICAL AXIS SOLAR FURNACE SF5
The highest energy levels possible with a solar concentrating system are reached in solar furnaces, where concentrations of over 10000X have been attained. A solar furnace essentially consists of a flat solar-tracking heliostat, a parabolic collector mirror, an attenuator or shutter and the test zone located in the concentrator focus (Fig. 2). The flat collector mirror, or heliostat, reflects the solar beams on the parabolic dish, which in turn reflects them on the test area in its focus. The amount of incident light is regulated by the shutter located between the concentrator and the heliostat. A test table movable in three directions (East-West, North-South, up and down) places the test samples in the focus with great precision. The main advantage of vertical axis solar furnaces is that the samples are deposited, without the need of any fixation, on a horizontal plane where they can be treated directly in the focus.
This PSA vertical axis solar furnace SF5 is able to deliver up to 5 kW power at peak concentration ratios exceeding 7000 and focus size 25 mm diameter approximately. This solar furnace [7] has one 25 m2 heliostat. The reflective surface of the heliostat, which is made up of 25 non-concentrating flat facets of 1 m2 with reflectivity higher than 0.95 %, continuously tracks the solar disk and reflects its parallel vertical beams onto the concentrator.
130003-2 Reuse of AIP Publishing content is subject to the terms at: https://publishing.aip.org/authors/rights-and-permissions IP: 193.146.147.230 On: Wed, 01 Jun 2016 08:52:07

FIGURE 2. Solar Furnace SF5 diagram
The concentrator dish, which concentrates the incident light from the heliostat, multiplying the radiant energy in the focal zone, is the main component of the solar furnace (Fig. 2). Its optical properties especially affect the irradiance distribution at the focus. It consists of 54 hexagonal, 25 cm radius facets of 1623.78 cm2 surface. Its contour is quasi circular with 3.5 m diameter and a total area of 8.77 m2. For economic reasons, the facets are all identical, spherical curvature with a focal distance of 2 m and radius of curvature 4 m, double the focal distance.
The total energy in the focus is proportional to the radiation that passes through the louvered shutter, which is made up of 11 slats of 4 m long and 0.5 m wide under the test table, at 14 m above ground level. The slats are driven by a gear motor assembly which transmits its rotary movement to them through the straps, with a regulation accuracy of 0.1°. In the closed position the blades form an angle of 47.5° with the vertical, while fully open the angle is 0°. The attenuator can be operated manually from the control panel and in automatic mode from the control computer Data Acquisition System (DAS).
EXPERIMENTAL SET-UP AND RESULTS
A commercial pyrometer based on an InGaAs photo diode infrared detector and a narrow band-pass filter allows working on 1400 nm [8]. A commercial IR camera based on an InSb detector works in the 1500-5000 nm spectral range and a software-controlled filter wheel enables the centered band-pass filters to be used on three additional narrow wavelength bands 1900, 3320 and 4720 nm [9].
Narrow bands centered on 2700 and 4300 nm should be excluded from this study as they represent strong atmospheric absorption bands of radiance which will distort the pyrometric temperature measurement and will cause a miscalculation of the emittance. The absorption band centered on 2700 nm is caused by the environment humidity and carbon dioxide, and the other one centered on 4300 nm is due to the single action of carbon dioxide.
Both instruments are perpendicularly placed at a distance of 1.5 m from the steel sample, intercepting and measuring thermal radiation emitted in the normal direction from a circle of approximately 10 mm diameter in the center of the sample surface (Fig. 3).
IR camera and pyrometer have been previously calibrated in front of a blackbody for the different filters at the same set-up distance and temperature range. A sample (40 x 40 mm, 3 mm height) of austenitic stainless steel for high temperatures, AISI 310S, is embedded in an alumina block (200 x 200 mm, 100 mm height) to achieve stationarity in thermodynamic variables. A group of first class type K thermocouples, 1.5 mm diameter x 500 mm long metallic sheath, allow measuring temperatures of alumina block and sample with an accuracy of σI = ± 0.004 T
130003-3 Reuse of AIP Publishing content is subject to the terms at: https://publishing.aip.org/authors/rights-and-permissions IP: 193.146.147.230 On: Wed, 01 Jun 2016 08:52:07

(375 ºC ≤ T ≤ 1000 ºC), according to the standard. Two of these thermocouples are embedded in the center of the back face of the sample at 0.8 mm of the interesting front face surface and separated 5 mm. The average temperature supplied by these two thermocouples is assumed as the real temperature of the sample surface in stationary conditions. This temperature measurement has an associated standard uncertainty σav.
FIGURE 3. Overview of the experimental setup A Testo® 608-H2 thermohygrometer allows continuous measurement of relative humidity (± 2%) and ambient
temperature (± 0.5 ºC) close to the test table while a pressure transducer GMDU® measures the atmospheric pressure (± 0.2 %).
This set-up is placed at the focus of the 5 kW PSA vertical axis solar furnace SF5 in order to reach very high temperatures in a few seconds on samples. After reaching the desired maximum temperature of 1100 ºC, the shutter closes totally to prevent solar influence and cool the sample. Moreover, the ambient radiation reflected from the sample can be considered negligible due to the high temperature of the sample. Measurements performed during cooling of the sample are considered for determining the emittance. Assuming a fixed value of 1 for the apparent emittance of pyrometric devices as a close value to the real emittance, tests have been performed using equation 3. The summary of results obtained for different tests is presented in the figures 4 and 5.
Figure 4 shows the high repeatability (1%) of the measurement procedure. Figure 5 is obtained by selecting tests performed with different band-pass filters and taking emittance values at the same temperature but with different wavelengths. The data show that AISI 310S emittance increases with increasing temperature (Fig. 4 and 5) and decreases with increasing wavelength (Fig. 5). Would expect a change in the position of the peak in the spectral emittance changing temperature but low spectral resolution does not allow this. These results are consistent with the limited data available in the literature [6].
FIGURE 4. Emittance vs. Temperature
130003-4 Reuse of AIP Publishing content is subject to the terms at: https://publishing.aip.org/authors/rights-and-permissions IP: 193.146.147.230 On: Wed, 01 Jun 2016 08:52:07
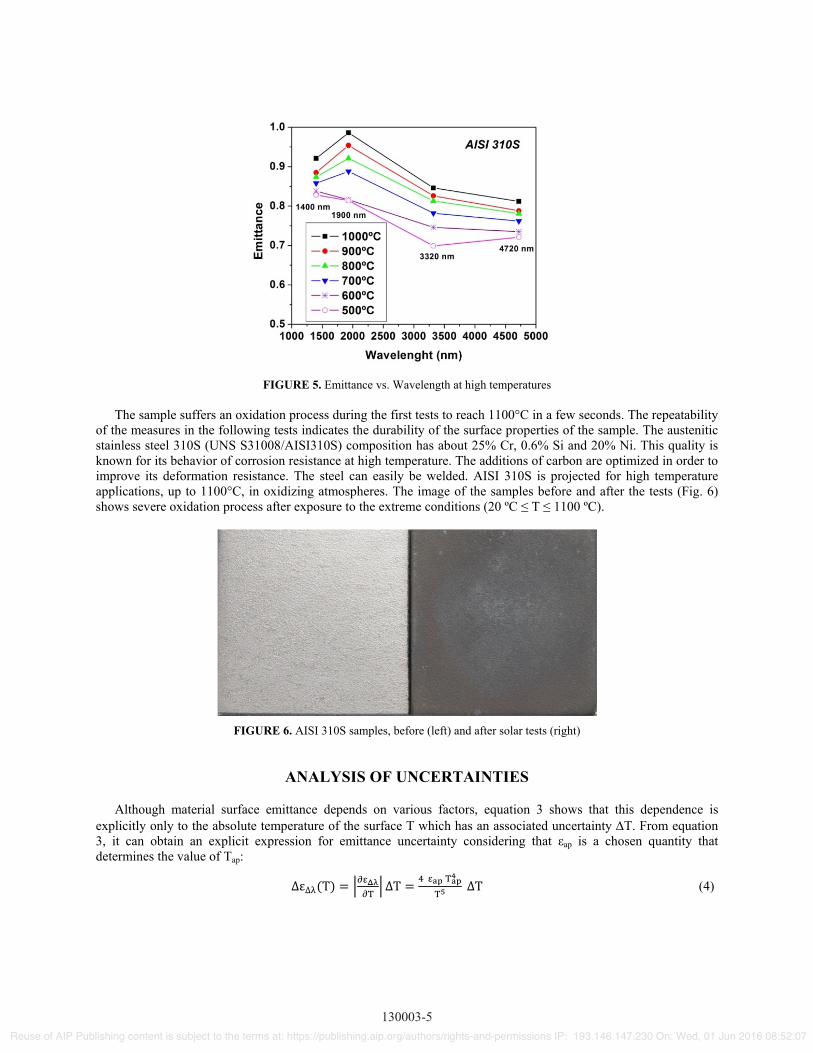
FIGURE 5. Emittance vs. Wavelength at high temperatures
The sample suffers an oxidation process during the first tests to reach 1100°C in a few seconds. The repeatability
of the measures in the following tests indicates the durability of the surface properties of the sample. The austenitic stainless steel 310S (UNS S31008/AISI310S) composition has about 25% Cr, 0.6% Si and 20% Ni. This quality is known for its behavior of corrosion resistance at high temperature. The additions of carbon are optimized in order to improve its deformation resistance. The steel can easily be welded. AISI 310S is projected for high temperature applications, up to 1100°C, in oxidizing atmospheres. The image of the samples before and after the tests (Fig. 6) shows severe oxidation process after exposure to the extreme conditions (20 ºC ≤ T ≤ 1100 ºC).
FIGURE 6. AISI 310S samples, before (left) and after solar tests (right)
ANALYSIS OF UNCERTAINTIES
Although material surface emittance depends on various factors, equation 3 shows that this dependence is explicitly only to the absolute temperature of the surface T which has an associated uncertainty 'T. From equation 3, it can obtain an explicit expression for emittance uncertainty considering that εap is a chosen quantity that determines the value of Tap:
∆ε∆ T ∆T ∆T (4)
130003-5 Reuse of AIP Publishing content is subject to the terms at: https://publishing.aip.org/authors/rights-and-permissions IP: 193.146.147.230 On: Wed, 01 Jun 2016 08:52:07
The measurement of this temperature has three sources of uncertainty due to the location of the thermocouples and their properties:
1. Instrumental uncertainty σI: The thermocouples used are first class type K which means their measurements have an uncertainty of σI = ± 0.004 T (375 ºC ≤ T ≤ 1000 ºC), according to the current standard.
2. Standard uncertainty σav: When considering surface temperature, T, as the average of two temperature measurements made with two nearby thermocouples, the average temperature is associated with a standard uncertainty. ∆T σ σ (5)
3. Systematic uncertainty 'Tsys: Two thermocouples are embedded in the center of the back face of the sample at 0.8 mm of the interesting front face surface and separated 5 mm. The average temperature supplied by these two thermocouples is assumed as the real temperature of the sample surface in stationary conditions despite being a measurement on the back of the sample which means a systematic uncertainty associated to the surface temperature to be determined and corrected.
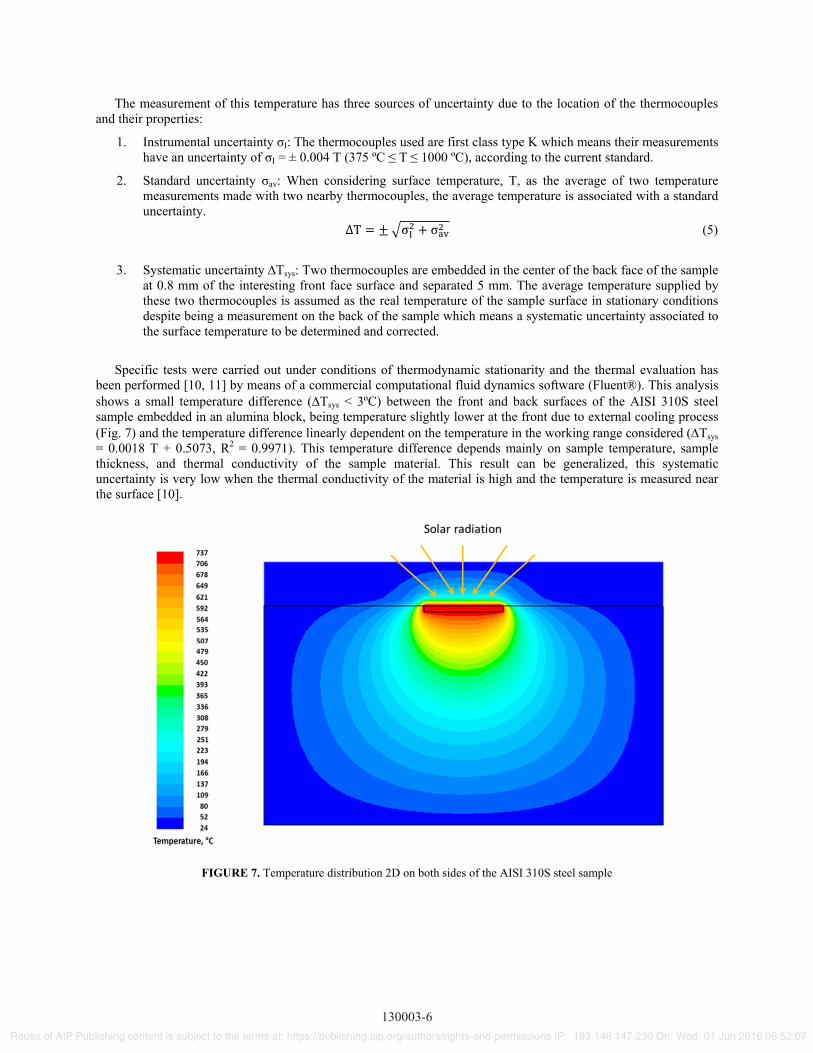
Specific tests were carried out under conditions of thermodynamic stationarity and the thermal evaluation has
been performed [10, 11] by means of a commercial computational fluid dynamics software (Fluent®). This analysis shows a small temperature difference ('Tsys < 3ºC) between the front and back surfaces of the AISI 310S steel sample embedded in an alumina block, being temperature slightly lower at the front due to external cooling process (Fig. 7) and the temperature difference linearly dependent on the temperature in the working range considered ('Tsys = 0.0018 T + 0.5073, R2 = 0.9971). This temperature difference depends mainly on sample temperature, sample thickness, and thermal conductivity of the sample material. This result can be generalized, this systematic uncertainty is very low when the thermal conductivity of the material is high and the temperature is measured near the surface [10].
FIGURE 7. Temperature distribution 2D on both sides of the AISI 310S steel sample
130003-6 Reuse of AIP Publishing content is subject to the terms at: https://publishing.aip.org/authors/rights-and-permissions IP: 193.146.147.230 On: Wed, 01 Jun 2016 08:52:07
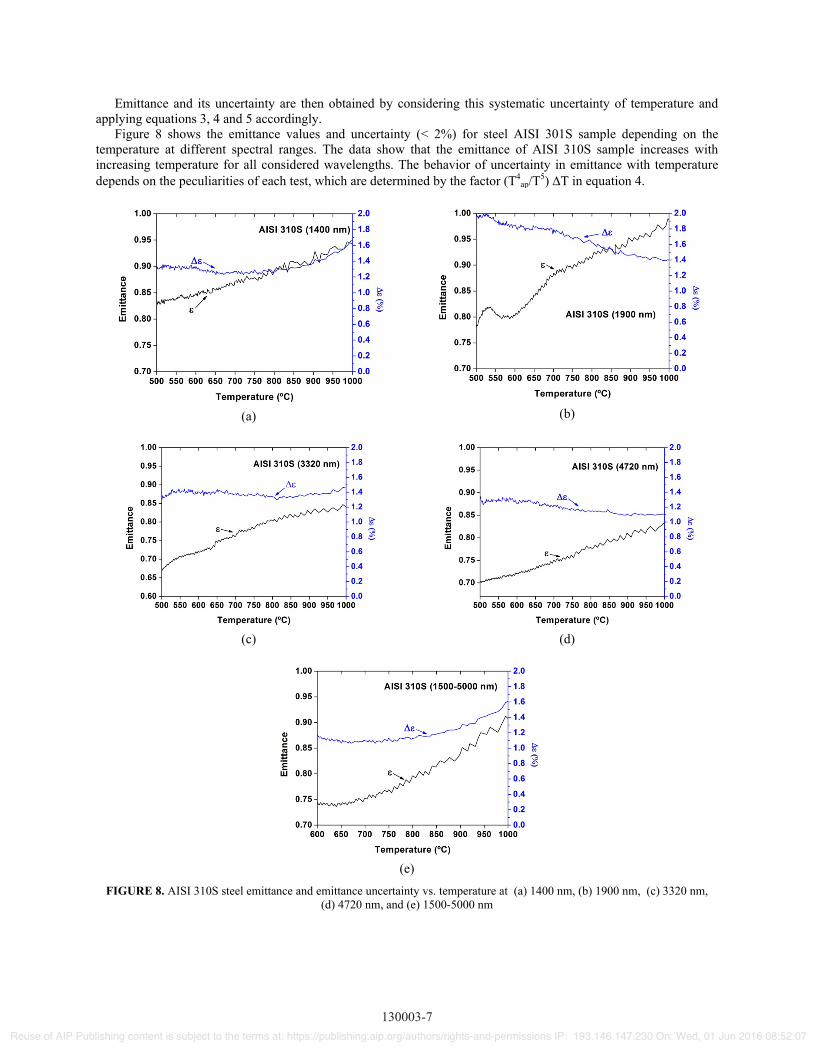
Emittance and its uncertainty are then obtained by considering this systematic uncertainty of temperature and applying equations 3, 4 and 5 accordingly.
Figure 8 shows the emittance values and uncertainty (< 2%) for steel AISI 301S sample depending on the temperature at different spectral ranges. The data show that the emittance of AISI 310S sample increases with increasing temperature for all considered wavelengths. The behavior of uncertainty in emittance with temperature depends on the peculiarities of each test, which are determined by the factor (T4
ap/T5) 'T in equation 4.
(a)
(b)
(c)
(d)
(e)
FIGURE 8. AISI 310S steel emittance and emittance uncertainty vs. temperature at (a) 1400 nm, (b) 1900 nm, (c) 3320 nm, (d) 4720 nm, and (e) 1500-5000 nm
130003-7 Reuse of AIP Publishing content is subject to the terms at: https://publishing.aip.org/authors/rights-and-permissions IP: 193.146.147.230 On: Wed, 01 Jun 2016 08:52:07

CONCLUSIONS AND OUTLOOK
In this work an alternative method for emittance determination based on pyrometric measurements is presented. The measurement procedure has been applied to AISI 310S steel samples in the PSA vertical axis solar furnace SF5, which has proved to be an ideal scenario for this purpose. The data show that emittance increases with increasing temperature and decreases with increasing wavelength, which is in agreement with experimental results obtained by other authors. Analysis of tests has revealed a good repeatability (1%) and accuracy (< 2%) of this measurement procedure.
It should be mentioned the oxidation process that suffers the sample during the first tests to reach 1100 °C in a few seconds. The repeatability of the measures in the following tests indicates the good response of the surface properties of the sample. Tests could be performed in vacuum atmosphere to avoid oxidation of the sample. In this case, it could be obtained emittance of the sample at wavelengths compatible with the transmittance of the enclosure.
ACKNOWLEDGEMENTS
Financial support by the SFERA-II project (Grant Agreement no. 312643, WP12: Pyrometric temperature measurement methods for high-concentration solar facilities and solar simulators; WP13: Determination of physical properties of CSP materials under concentrated solar irradiation) from the Research Infrastructures Activity in the 7th Framework Programme of the European Union is gratefully acknowledged http://sfera2.sollab.eu. We also thank J. Galindo from PSA for their help and contribution during assembly work and operation. Financial support provided by the Education Ministry of Chile Grant PMI ANT 1201 and CONICYT/ FONDAP/ 15110019 "Solar Energy Research Center" SERC-Chile as well.
REFERENCES
1. R. Siegel and J. Howell, “Thermal Radiation Heat Transfer“, Third Edition, CRC Press, (1992) 2. S. Marinetti, P.G. Cesartto, “Emissivity estimation for accurate quantitative thermography”. NDT&E
International 51,127-134, (2012). 3. K. Schurer, “A method for measuring infrared emissivities of near-black surfaces at ambient temperatures“,
Infrared Physics 16, 157-163, (1976). 4. T. Walach, “Emissivity measurements on electronic microcircuits“, Measurement 41, 503-515, (2008). 5. M. Balat-Pichelin, J.F. Robert, J.L. Sans, “Emissivity measurements on carbon–carbon composites at high
temperature under high vacuum“, Applied Surface Science 253, 778–783, (2006). 6. Ch. Wen, “Investigation of steel emissivity behaviors: Exmination of Multiespectral Radiation Thermometry
(MRT)“, International Journal of Heat and Mass Transfer 53, 2035-2043, (2010). 7. J. Rodríguez, I. Cañada, E. Zarza, “PSA vertical axis solar furnace SF5”, Energy Procedia 49, 1511-1522,
(2014). 8. J. Ballestrín, A. Marzo, I. Cañadas and J. Rodríguez , “Testing a Solar-Blind Pyrometer”, Metrologia 47, 646-
651, (2010). 9. A. Marzo, J. Ballestrín, J. Barbero, I. Cañadas, J. Rodríguez, “Solar blind pyrometry not relying on
atmospheric absorption bands”. Solar Energy 107, 415–422, (2014). 10. M. I. Roldán, “Estudio de la incertidumbre en la medida de temperatura superficial de materiales mediante
sensores de contacto“, SFERAII-SC-QA-02, (2015). 11. Ansys Fluent 16.0, Ansys Fluent User's Guide. ANSYS, Inc., (2015).
130003-8 Reuse of AIP Publishing content is subject to the terms at: https://publishing.aip.org/authors/rights-and-permissions IP: 193.146.147.230 On: Wed, 01 Jun 2016 08:52:07