speckle noise characterization and filtering in polsar data · speckle noise characterization and...
TRANSCRIPT

09/01/2013
1
Speckle Noise CharacterizationSpeckle Noise Characterization and Filtering in Polarimetric SAR Data
Carlos López‐Martínez
Universitat Politècnica de Catalunya – UPCSignal Theory and Communications Department – TSCRemote Sensing Laboratory - RSLab., Barcelona, Spain
Speckle Noise in SAR Data
OutlineOutline
PolSAR Data Statistical Characterization
PolSAR Information Estimation
PolSAR Data Speckle Noise Characterization
Remote Sensing Lab.Signal Theory and Communications Dept.Universitat Politècnica de Catalunya
PolSAR Data Speckle Noise Filtering
2
09/01/2013
2
Synthetic Aperture Radar ImagingSynthetic Aperture Radar Imaging
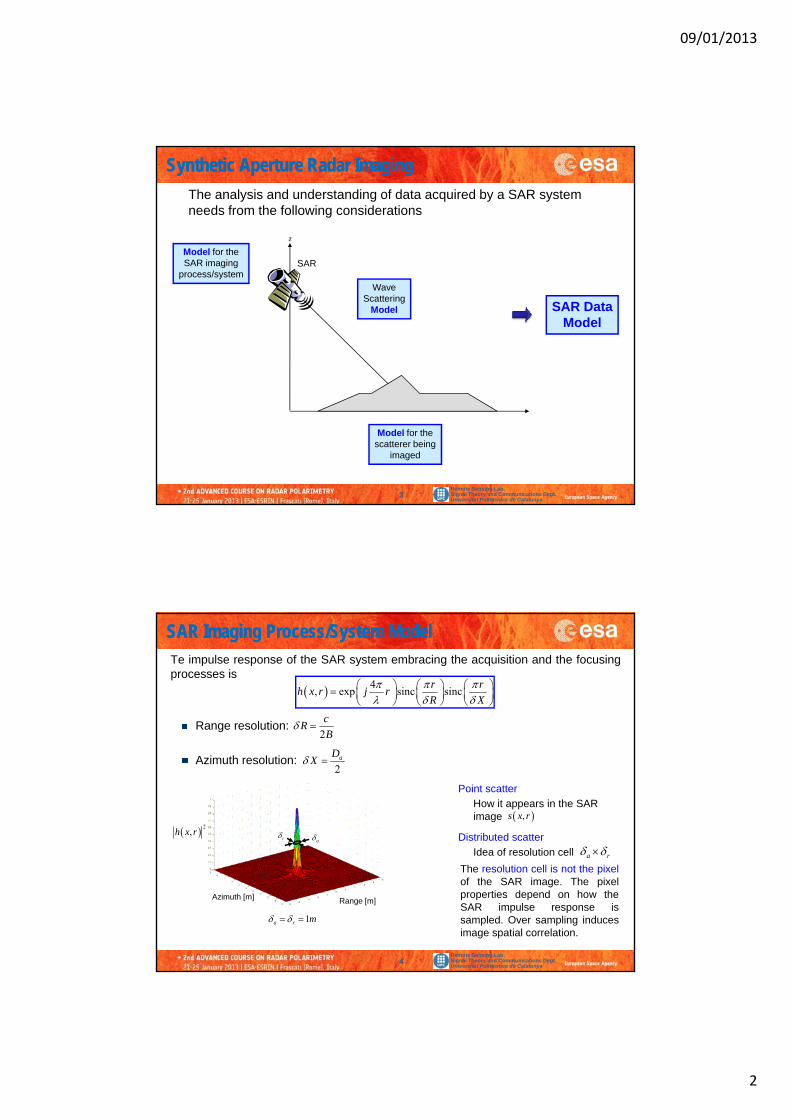
The analysis and understanding of data acquired by a SAR system needs from the following considerations
SAR
z
Model for theSAR imaging SARSAR imaging
process/system
WaveScattering
Model SAR DataModel
Remote Sensing Lab.Signal Theory and Communications Dept.Universitat Politècnica de Catalunya
3
Model for thescatterer being
imaged
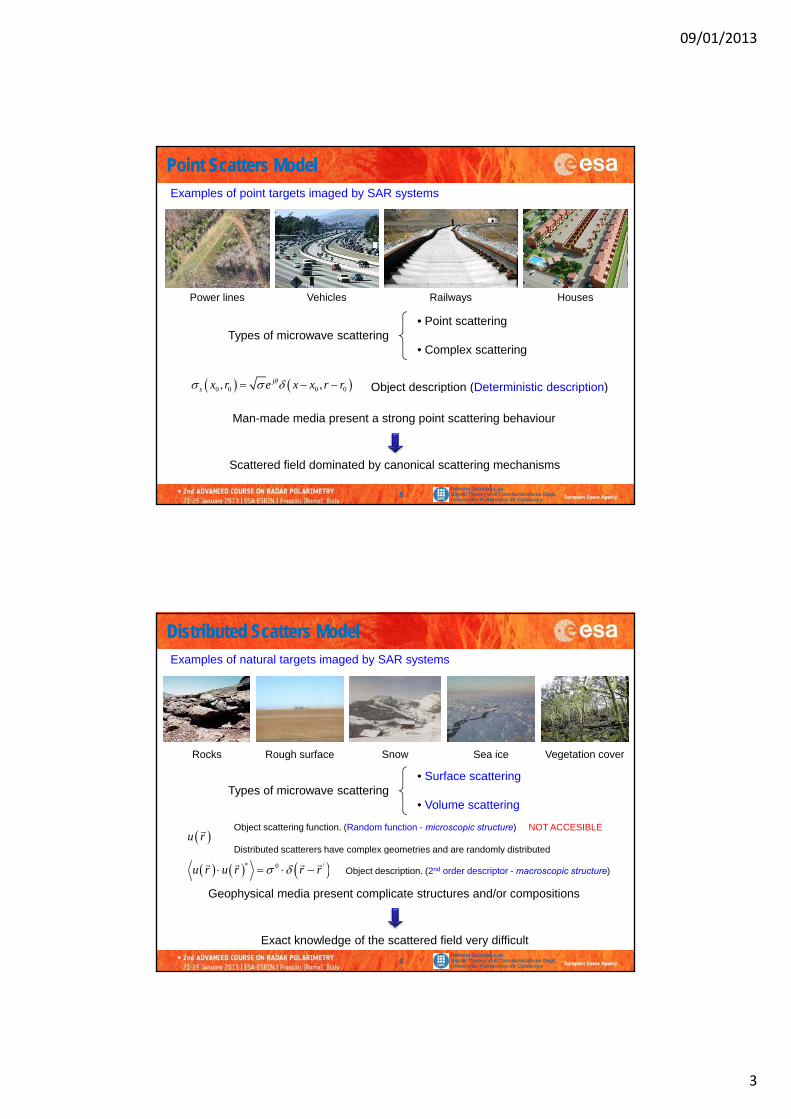
Te impulse response of the SAR system embracing the acquisition and the focusingprocesses is
Range resolution:
SAR Imaging Process/System ModelSAR Imaging Process/System Model
4, exp sinc sinc
r rh x r j r
R X
2
cR
B
Azimuth resolution:
2B
2aD
X
Point scatter
Distributed scatter
How it appears in the SARimage ,s x r
Idea of resolution cell
2,h x r
r a
Remote Sensing Lab.Signal Theory and Communications Dept.Universitat Politècnica de Catalunya
Idea of resolution cell a r
Range [m]Azimuth [m]
1a r m
The resolution cell is not the pixelof the SAR image. The pixelproperties depend on how theSAR impulse response issampled. Over sampling inducesimage spatial correlation.
4
09/01/2013
3
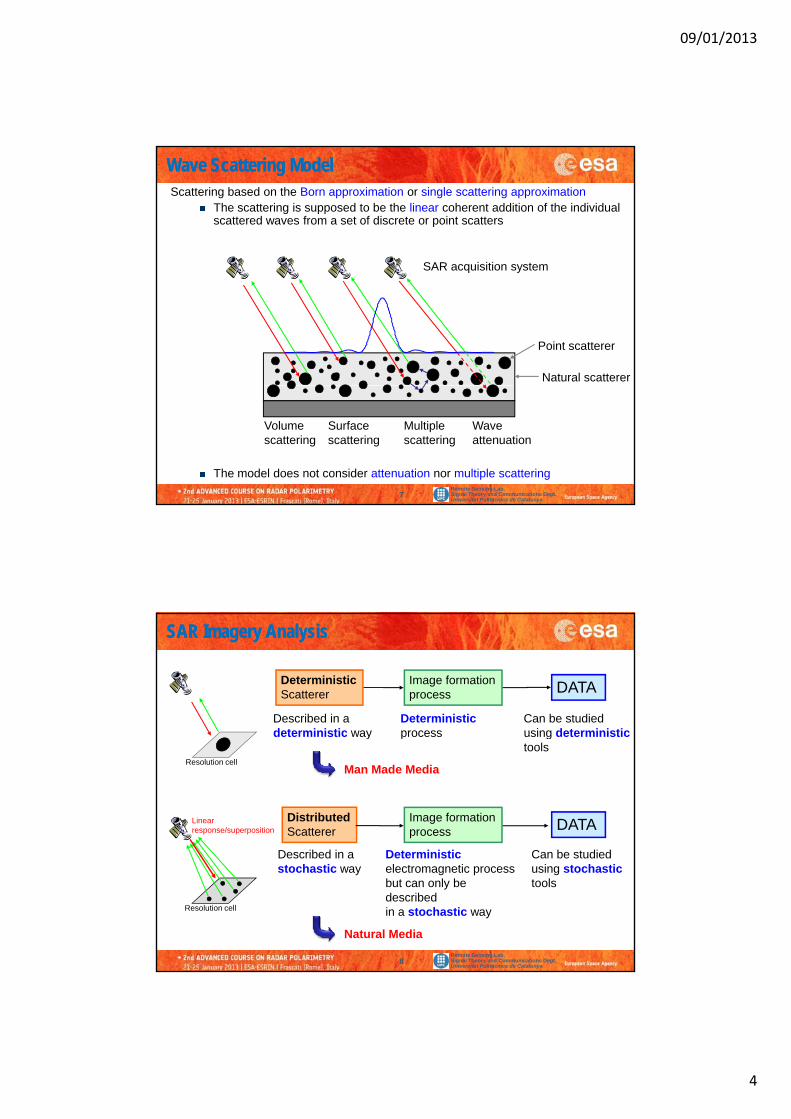
Point Scatters ModelPoint Scatters ModelExamples of point targets imaged by SAR systems
Power lines Vehicles Railways Houses
Types of microwave scattering• Point scattering
• Complex scattering
Object description (Deterministic description) jx r e x x r r
Remote Sensing Lab.Signal Theory and Communications Dept.Universitat Politècnica de Catalunya
Man-made media present a strong point scattering behaviour
Scattered field dominated by canonical scattering mechanisms
Object description (Deterministic description) 0 0 0 0, ,s x r e x x r r
5
Distributed Scatters ModelDistributed Scatters ModelExamples of natural targets imaged by SAR systems
Rocks Rough surface Snow Sea ice Vegetation cover
Types of microwave scattering• Surface scattering
• Volume scattering
u r Object scattering function. (Random function - microscopic structure) NOT ACCESIBLE
Distributed scatterers have complex geometries and are randomly distributed
Remote Sensing Lab.Signal Theory and Communications Dept.Universitat Politècnica de Catalunya
Geophysical media present complicate structures and/or compositions
Exact knowledge of the scattered field very difficult
0 'u r u r r r
Object description. (2nd order descriptor - macroscopic structure)
Distributed scatterers have complex geometries and are randomly distributed
6
09/01/2013
4
Wave Scattering ModelWave Scattering ModelScattering based on the Born approximation or single scattering approximation
The scattering is supposed to be the linear coherent addition of the individual scattered waves from a set of discrete or point scatters
SAR acquisition systemSAR acquisition system
Natural scatterer
Point scatterer
Remote Sensing Lab.Signal Theory and Communications Dept.Universitat Politècnica de Catalunya
The model does not consider attenuation nor multiple scattering
Volumescattering
Surfacescattering
Waveattenuation
Multiplescattering
7
SAR Imagery AnalysisSAR Imagery Analysis
DeterministicScatterer
Described in a deterministic way
Image formationprocess
Deterministicprocess
DATA
Can be studiedusing deterministicdeterministic way process using deterministictools
Resolution cellMan Made Media
DistributedScatterer
Described in a
Image formationprocess
Deterministic
DATA
Can be st died
Linear response/superposition
Remote Sensing Lab.Signal Theory and Communications Dept.Universitat Politècnica de Catalunya
Natural Media
Described in a stochastic way
Deterministicelectromagnetic processbut can only be describedin a stochastic way
Can be studiedusing stochastictools
Resolution cell
8
09/01/2013
5
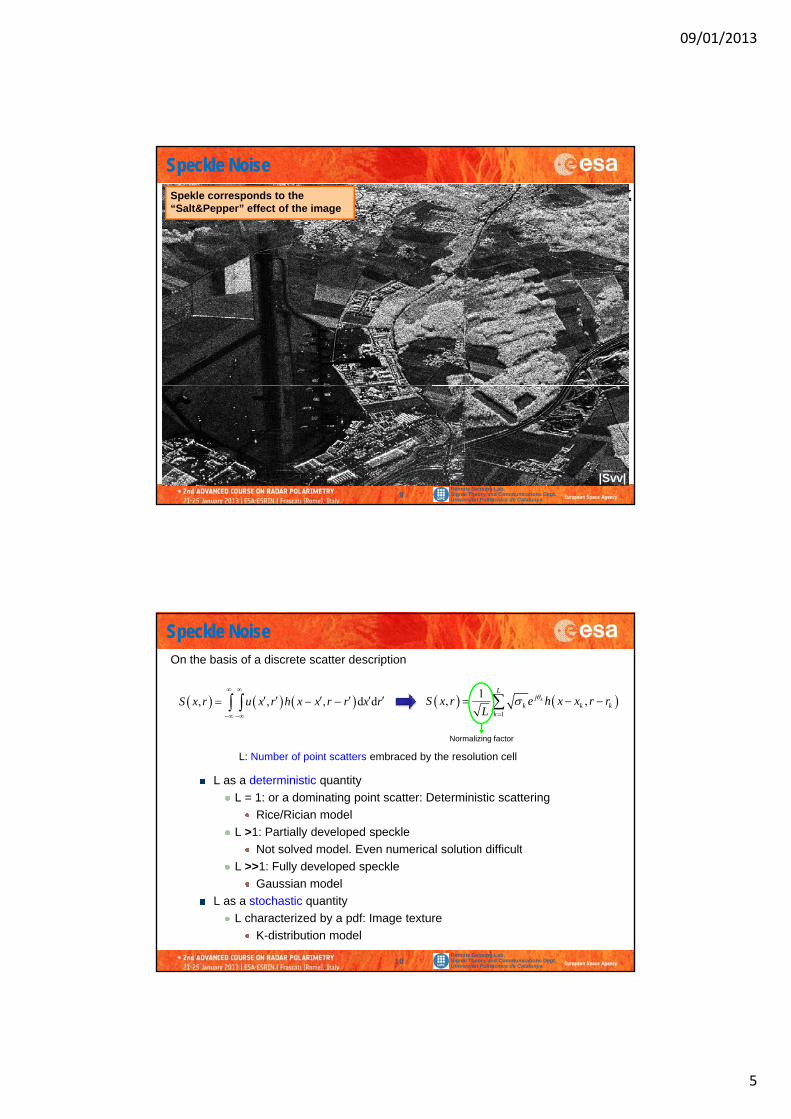
Speckle NoiseSpeckle Noise
|Shh| |Shv| |Svv|Spekle corresponds to the “Salt&Pepper” effect of the image
L-band (1.3 GHz) fully PolSAR dataE-SAR system. Oberpfaffenhofen test area (D)
Optical ImageOberpfaffenhofen test area (D)
Remote Sensing Lab.Signal Theory and Communications Dept.Universitat Politècnica de Catalunya
9
|Svv|
Speckle NoiseSpeckle NoiseOn the basis of a discrete scatter description
, , , d dS x r u x r h x x r r x r
1
1, ,k
Lj
k k kk
S x r e h x x r rL
L as a deterministic quantity
L = 1: or a dominating point scatter: Deterministic scattering
Rice/Rician model
L >1: Partially developed speckle
Not solved model. Even numerical solution difficult
L: Number of point scatters embraced by the resolution cell
Normalizing factor
Remote Sensing Lab.Signal Theory and Communications Dept.Universitat Politècnica de Catalunya
Not solved model. Even numerical solution difficult
L >>1: Fully developed speckle
Gaussian model
L as a stochastic quantity
L characterized by a pdf: Image texture
K-distribution model
10
09/01/2013
6
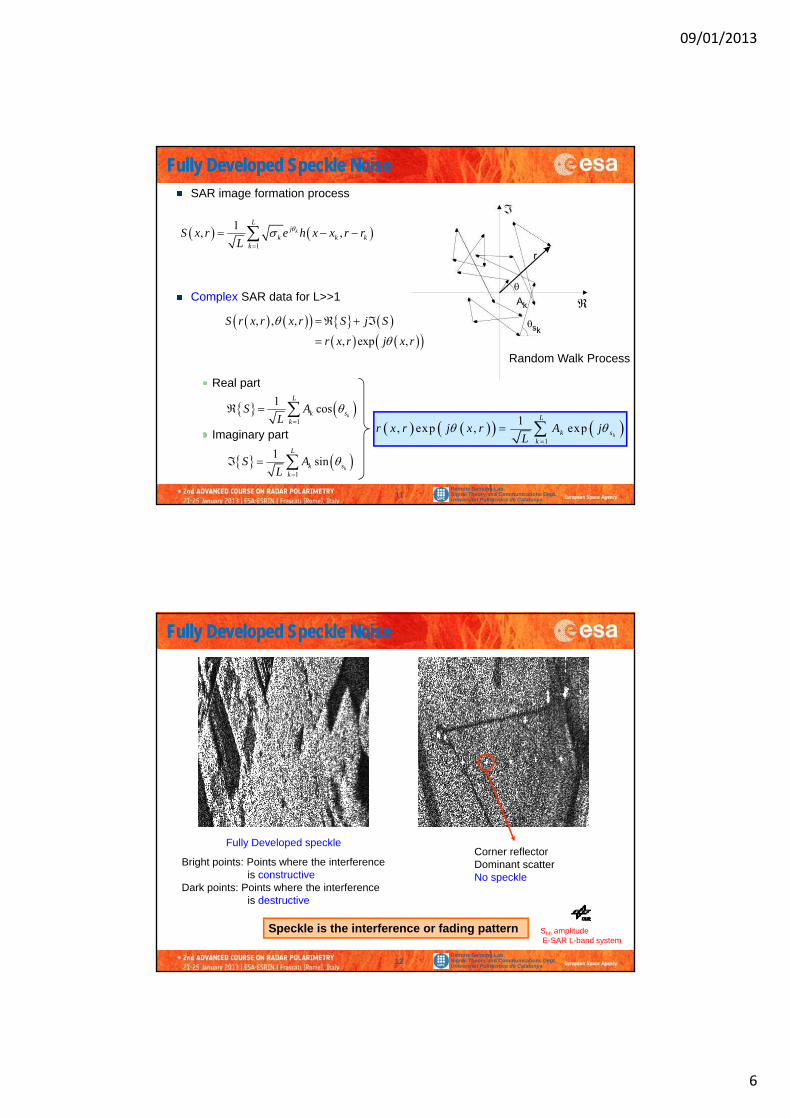
Fully Developed Speckle NoiseFully Developed Speckle NoiseSAR image formation process
1
1, ,k
Lj
k k kk
S x r e h x x r rL
Complex SAR data for L>>1
Real part
Random Walk Process
, , ,
, exp ,
S r x r x r S j S
r x r j x r
Remote Sensing Lab.Signal Theory and Communications Dept.Universitat Politècnica de Catalunya
Real part
Imaginary part 1
1, exp , exp
k
L
k sk
r x r j x r A jL
1
1cos
k
L
k sk
S AL
1
1sin
k
L
k sk
S AL
11
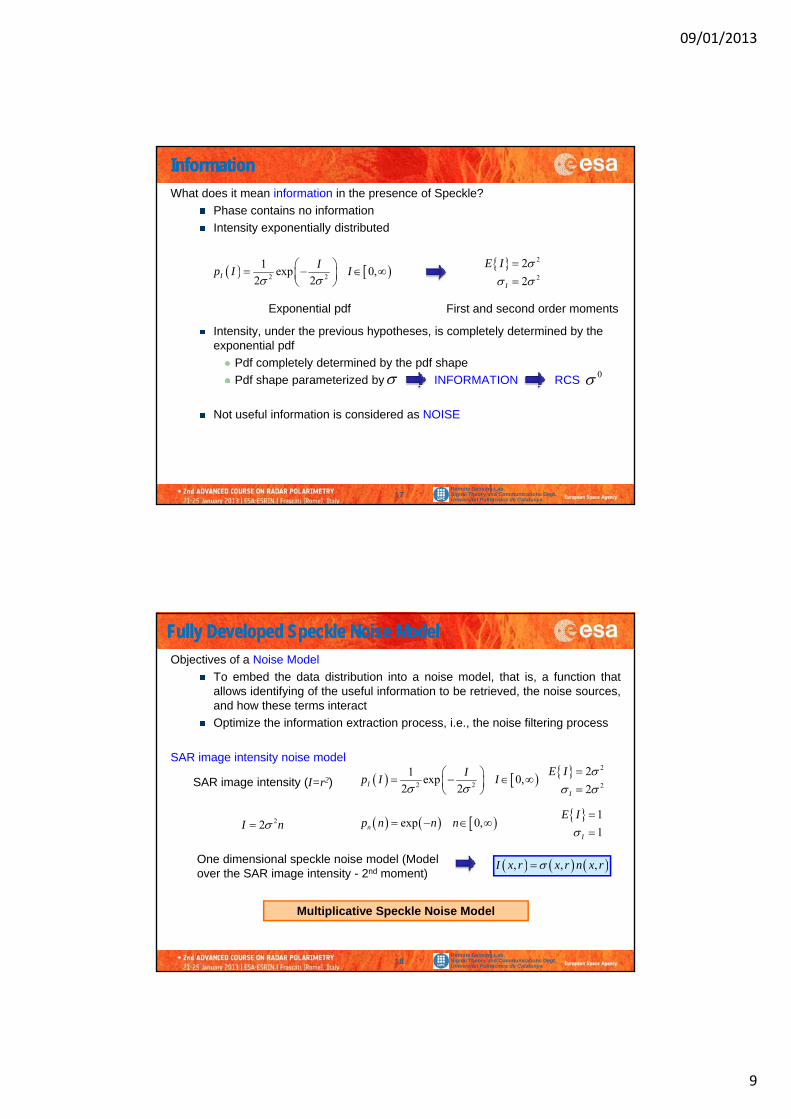
Fully Developed Speckle NoiseFully Developed Speckle Noise
Corner reflectorFully Developed speckle
Remote Sensing Lab.Signal Theory and Communications Dept.Universitat Politècnica de Catalunya
Corner reflectorDominant scatterNo speckle
Bright points: Points where the interferenceis constructive
Dark points: Points where the interferenceis destructive
Speckle is the interference or fading pattern Shh amplitudeE-SAR L-band system
12

09/01/2013
7
Fully Developed Speckle NoiseFully Developed Speckle NoiseCompletely developed Speckle (large L and no dominant scatter)
Hypotheses
The amplitude Ak and the phase of the kth scattered wave arestatistically independent of each other and from the amplitudes andphases of all other elementary waves (Uncorrelated point scatters)
ks
The phases of the elementary contributions are equally likely to lieanywhere in the primary interval [-π, π)
Central Limit Theorem
Real Part
ks
2
1exp
Sp S S
Gaussian pdf
2
20, 2C
S N
Remote Sensing Lab.Signal Theory and Communications Dept.Universitat Politècnica de Catalunya
Imaginary Part
Real and imaginary parts are uncorrelated
2
exp ,Sp S S
2
2
1exp ,S
Sp S S
Gaussian pdf
Gaussian pdf
0E S S
13
Fully Developed Speckle NoiseFully Developed Speckle NoiseAmplitude: Rayleigh pdf
2
2
2exp 0,r
r rp r r
2 2
2 2 2 2
2
1
E r
E r
Intensity (I=r2): Exponential pdf
2 2
1exp 0,I
Ip I I
2 2 2 214r E r E r
2
22 2
2 2 2 2
2
I
E I
E I
E I E I
Remote Sensing Lab.Signal Theory and Communications Dept.Universitat Politècnica de Catalunya
Phase: Uniform pdf. Contains NO information
Amplitude and phase are uncorrelated
1,
2p
14

09/01/2013
8
Fully Developed Speckle NoiseFully Developed Speckle Noise
Amplitude: Rayleigh pdf Intensity (I=r2): Exponential pdf
Remote Sensing Lab.Signal Theory and Communications Dept.Universitat Politècnica de Catalunya
15
Phase: Uniform pdf
Fully Developed Speckle NoiseFully Developed Speckle NoiseImportant considerations
Speckle is a deterministic electromagnetic effect, but due to the complexityof the image formation process, it must be analysed statistically
Considering completely developed speckle, a SAR image pixel does not giveinformation about the target. Only statistical moments can describe thetarget or the process
Remote Sensing Lab.Signal Theory and Communications Dept.Universitat Politècnica de Catalunya
16
09/01/2013
9
InformationInformationWhat does it mean information in the presence of Speckle?
Phase contains no information
Intensity exponentially distributed
1 I 22E I
Intensity, under the previous hypotheses, is completely determined by the exponential pdf
Pdf completely determined by the pdf shape
Pdf shape parameterized by INFORMATION RCS
2 2
1exp 0,
2 2I
Ip I I
Exponential pdf First and second order moments
2
2
2I
E I
0
Remote Sensing Lab.Signal Theory and Communications Dept.Universitat Politècnica de Catalunya
p p y
Not useful information is considered as NOISE
17
Fully Developed Speckle Noise ModelFully Developed Speckle Noise ModelObjectives of a Noise Model
To embed the data distribution into a noise model, that is, a function thatallows identifying of the useful information to be retrieved, the noise sources,and how these terms interact
Optimize the information extraction process, i.e., the noise filtering process
SAR image intensity noise model
SAR image intensity (I=r2)
22I n exp 0,np n n n 1
1I
E I
2 2
1exp 0,
2 2I
Ip I I
2
2
2
2I
E I
Remote Sensing Lab.Signal Theory and Communications Dept.Universitat Politècnica de Catalunya
One dimensional speckle noise model (Modelover the SAR image intensity - 2nd moment)
, , ,I x r x r n x r
Multiplicative Speckle Noise Model
18
09/01/2013
10
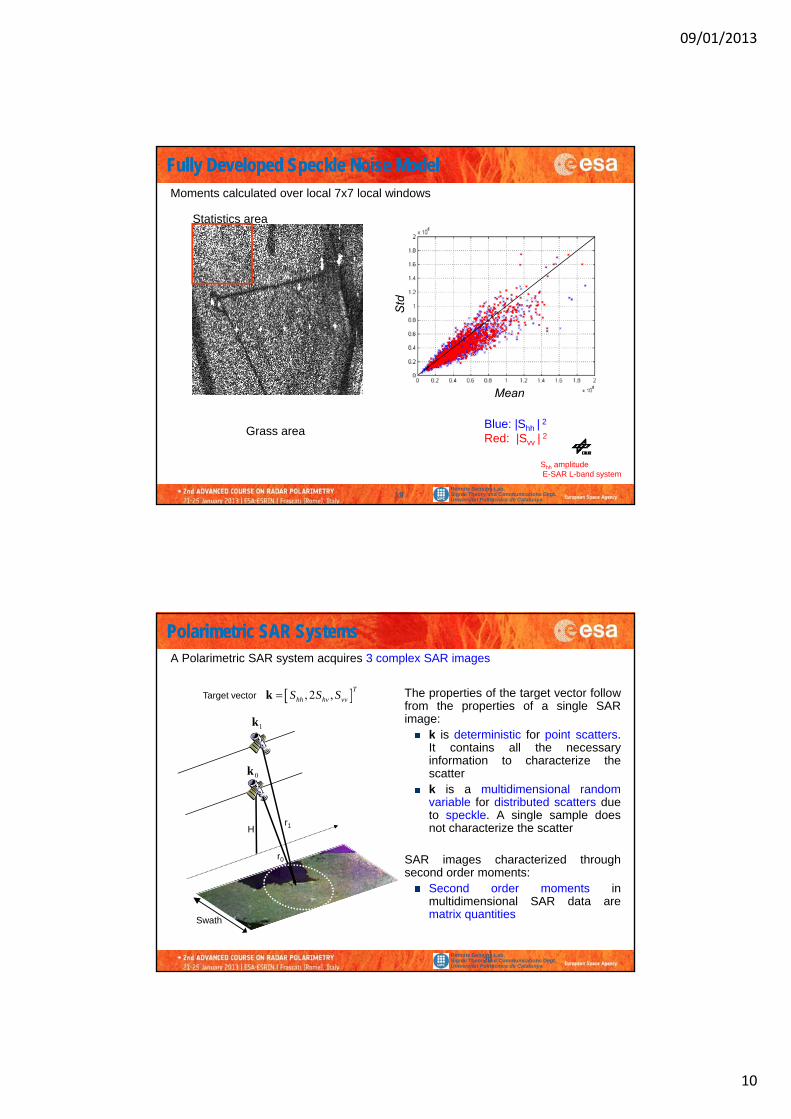
Fully Developed Speckle Noise ModelFully Developed Speckle Noise ModelMoments calculated over local 7x7 local windows
Statistics area
Std
Remote Sensing Lab.Signal Theory and Communications Dept.Universitat Politècnica de Catalunya
Grass areaBlue: |Shh | 2
Red: |Svv | 2
Mean
Shh amplitudeE-SAR L-band system
19
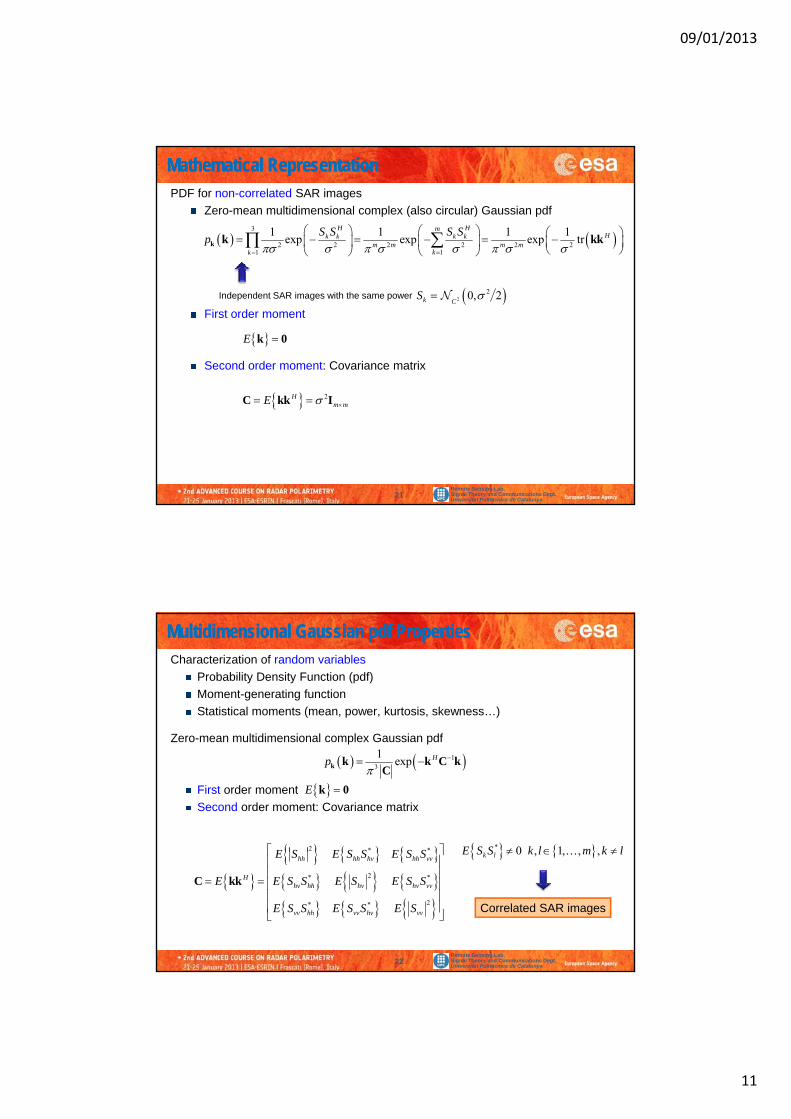
PolarimetricPolarimetric SAR SystemsSAR Systems
The properties of the target vector followfrom the properties of a single SARimage:
k is deterministic for point scatters
, 2 ,T
hh hv vvS S SkTarget vector
1k
A Polarimetric SAR system acquires 3 complex SAR images
k is deterministic for point scatters.It contains all the necessaryinformation to characterize thescatterk is a multidimensional randomvariable for distributed scatters dueto speckle. A single sample doesnot characterize the scatterH
r1
0k
Remote Sensing Lab.Signal Theory and Communications Dept.Universitat Politècnica de Catalunya
SAR images characterized throughsecond order moments:
Second order moments inmultidimensional SAR data arematrix quantities
Swath
r0
20
09/01/2013
11
PDF for non-correlated SAR images
Zero-mean multidimensional complex (also circular) Gaussian pdf
Mathematical RepresentationMathematical Representation
3
2 2 2 2 2 211
1 1 1 1exp exp exp tr
H HmHk k k k
m m m mkk
S S S Sp
k k kk
First order moment
Second order moment: Covariance matrix
Independent SAR images with the same power
E k 0
220, 2k C
S
Remote Sensing Lab.Signal Theory and Communications Dept.Universitat Politècnica de Catalunya
2Hm mE C kk I
21
Characterization of random variables
Probability Density Function (pdf)
Moment-generating function
Statistical moments (mean, power, kurtosis, skewness…)
Multidimensional Gaussian pdf PropertiesMultidimensional Gaussian pdf Properties
Zero-mean multidimensional complex Gaussian pdf
First order moment
Second order moment: Covariance matrix
13
1exp Hp
k k k C k
C
2 * *E S E S S E S S
E k 0
* 0 1E S S k l m k l
Remote Sensing Lab.Signal Theory and Communications Dept.Universitat Politècnica de Catalunya
2* *
2* *
hh hh hv hh vv
Hhv hh hv hv vv
vv hh vv hv vv
E S E S S E S S
E E S S E S E S S
E S S E S S E S
C kk
0 , 1, , ,k lE S S k l m k l
Correlated SAR images
22
09/01/2013
12
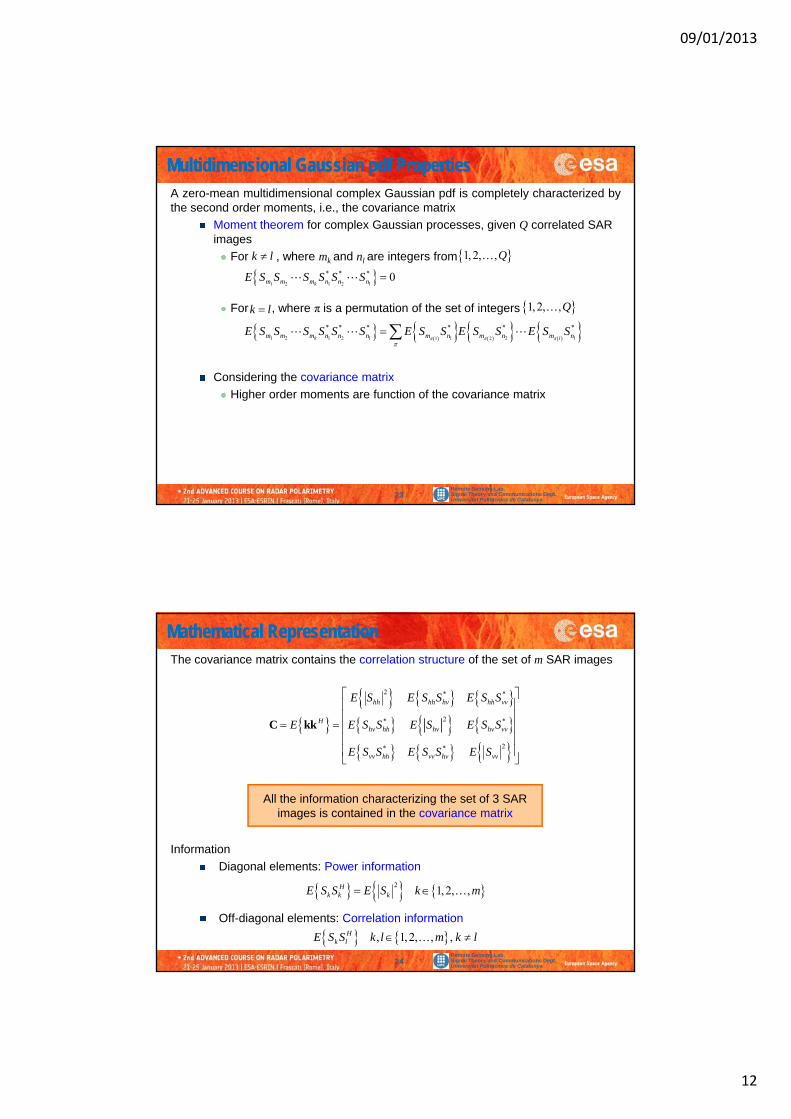
A zero-mean multidimensional complex Gaussian pdf is completely characterized bythe second order moments, i.e., the covariance matrix
Moment theorem for complex Gaussian processes, given Q correlated SAR images
For , where mk and nl are integers from
Multidimensional Gaussian pdf PropertiesMultidimensional Gaussian pdf Properties
k l 1, 2, ,Q
For , where π is a permutation of the set of integers
Considering the covariance matrix
1 2 1 2
* * * 0k lm m m n n nE S S S S S S
1 2 1 2 1 21 2
* * * * * *
k l llm m m n n n m n m n m nE S S S S S S E S S E S S E S S
k l 1, 2, ,Q
Remote Sensing Lab.Signal Theory and Communications Dept.Universitat Politècnica de Catalunya
Higher order moments are function of the covariance matrix
23
The covariance matrix contains the correlation structure of the set of m SAR images
Mathematical RepresentationMathematical Representation
2 * *
2* *
hh hh hv hh vv
Hhv hh hv hv vv
E S E S S E S S
E E S S E S E S S
C kk
Information
2* *
vv hh vv hv vvE S S E S S E S
All the information characterizing the set of 3 SARimages is contained in the covariance matrix
Remote Sensing Lab.Signal Theory and Communications Dept.Universitat Politècnica de Catalunya
Information
Diagonal elements: Power information
Off-diagonal elements: Correlation information
21,2, ,H
k k kE S S E S k m
, 1, 2, , ,Hk lE S S k l m k l
24
09/01/2013
13
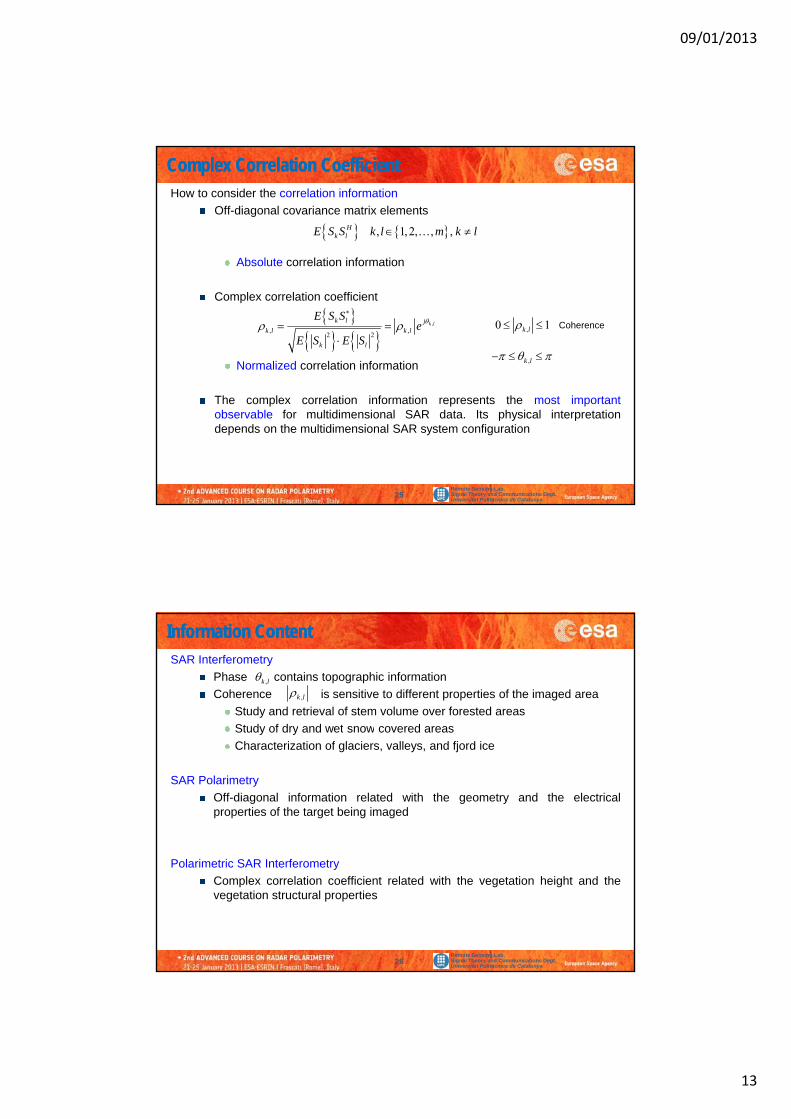
How to consider the correlation information
Off-diagonal covariance matrix elements
Absolute correlation information
Complex Correlation CoefficientComplex Correlation Coefficient
, 1, 2, , ,Hk lE S S k l m k l
Absolute correlation information
Complex correlation coefficient
Normalized correlation information
,
, ,2 2
k lk l jk l k l
k l
E S Se
E S E S
,0 1k l
,k l
Coherence
Remote Sensing Lab.Signal Theory and Communications Dept.Universitat Politècnica de Catalunya
The complex correlation information represents the most importantobservable for multidimensional SAR data. Its physical interpretationdepends on the multidimensional SAR system configuration
25
SAR Interferometry
Phase contains topographic information
Coherence is sensitive to different properties of the imaged area
Study and retrieval of stem volume over forested areas
Study of dry and wet snow covered areas
Information ContentInformation Content
,k l,k l
Study of dry and wet snow covered areas
Characterization of glaciers, valleys, and fjord ice
SAR Polarimetry
Off-diagonal information related with the geometry and the electricalproperties of the target being imaged
Remote Sensing Lab.Signal Theory and Communications Dept.Universitat Politècnica de Catalunya
Polarimetric SAR Interferometry
Complex correlation coefficient related with the vegetation height and thevegetation structural properties
26

09/01/2013
14
Mathematical RepresentationMathematical Representation
First order moment Second order momentMultidimensional SAR data
descriptors for distributed scatterers
hh hv
H
S S S
2
2 2 2
H H Hhh hh hh hv hh vv
H H H H
S S S S S S
S S S S S S
kkH
hv vvS S
S
Scattering matrix
2 2 2
2
H H H Hhv hh hv hv hv vv
H H Hvv hh vv hv vv vv
S S S S S S
S S S S S S
kk
Covariance matrix
1 2, , ,T
mS S Sk Target vector
1 1 1 2 1
2 1 2 2 2
1 2
H H Hm
H H HH m
H H Hm m m m
S S S S S S
S S S S S S
S S S S S S
kk
Description forPolSAR data
Description forgeneralized multidimensional
SAR data
Point scattererscharacterization
Remote Sensing Lab.Signal Theory and Communications Dept.Universitat Politècnica de Catalunya
Characterizes completelythe data distribution
Distributed scattererscharacterization
27
E k 0
11exp H
mp
k k k C kC
HE kk C
Covariance matrix
For multidimensional SAR data, under the hypothesis of Gaussian scattering, all theinformation is contained in the covariance matrix
Information Estimation/FilteringInformation Estimation/Filtering
2 * *
2* *
hh hh hv hh vv
H
E S E S S E S S
E E S S E S E S S
C kk
This matrix must be estimated from the available information
The scattering vector for each pixel/sample of the SAR data
2* *
hv hh hv hv vv
vv hh vv hv vv
E E S S E S E S S
E S S E S S E S
C kk
, 2 ,T
hh hv vvS S Sk
Remote Sensing Lab.Signal Theory and Communications Dept.Universitat Politècnica de Catalunya
The estimation process reduces to estimate the ensemble average(expectation operator) E{·}
The estimation process also receives the name of data filtering process
28
09/01/2013
15
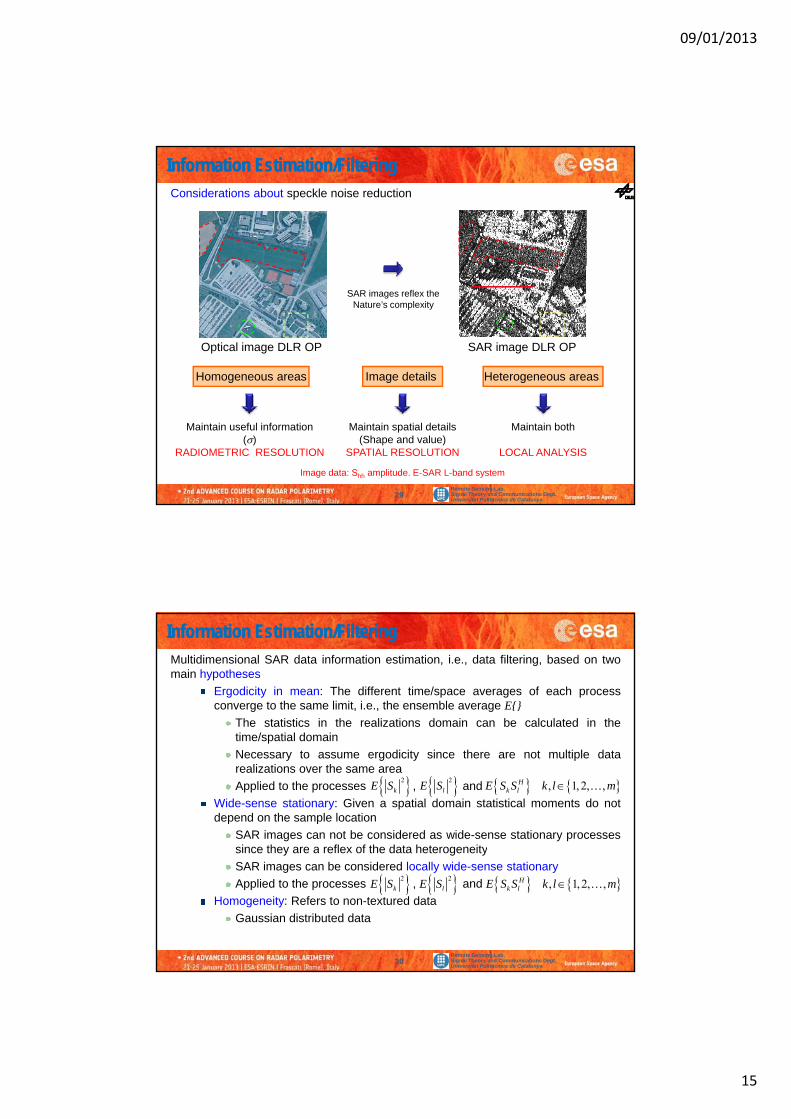
Considerations about speckle noise reduction
Information Estimation/FilteringInformation Estimation/Filtering
Optical image DLR OP SAR image DLR OP
SAR images reflex the Nature’s complexity
Homogeneous areas Image details Heterogeneous areas
Remote Sensing Lab.Signal Theory and Communications Dept.Universitat Politècnica de Catalunya
Maintain spatial details(Shape and value)
SPATIAL RESOLUTION
Maintain useful information()
RADIOMETRIC RESOLUTION
Maintain both
LOCAL ANALYSIS
Image data: Shh amplitude. E-SAR L-band system
29
Multidimensional SAR data information estimation, i.e., data filtering, based on twomain hypotheses
Ergodicity in mean: The different time/space averages of each processconverge to the same limit, i.e., the ensemble average E{}
The statistics in the realizations domain can be calculated in the
Information Information Estimation/FilteringEstimation/Filtering
time/spatial domain
Necessary to assume ergodicity since there are not multiple datarealizations over the same area
Applied to the processes , and
Wide-sense stationary: Given a spatial domain statistical moments do notdepend on the sample location
SAR images can not be considered as wide-sense stationary processessince they are a reflex of the data heterogeneity
2
kE S , 1, 2, ,Hk lE S S k l m 2
lE S
Remote Sensing Lab.Signal Theory and Communications Dept.Universitat Politècnica de Catalunya
since they are a reflex of the data heterogeneity
SAR images can be considered locally wide-sense stationary
Applied to the processes , and
Homogeneity: Refers to non-textured data
Gaussian distributed data
2
kE S , 1,2, ,Hk lE S S k l m 2
lE S
30
09/01/2013
16
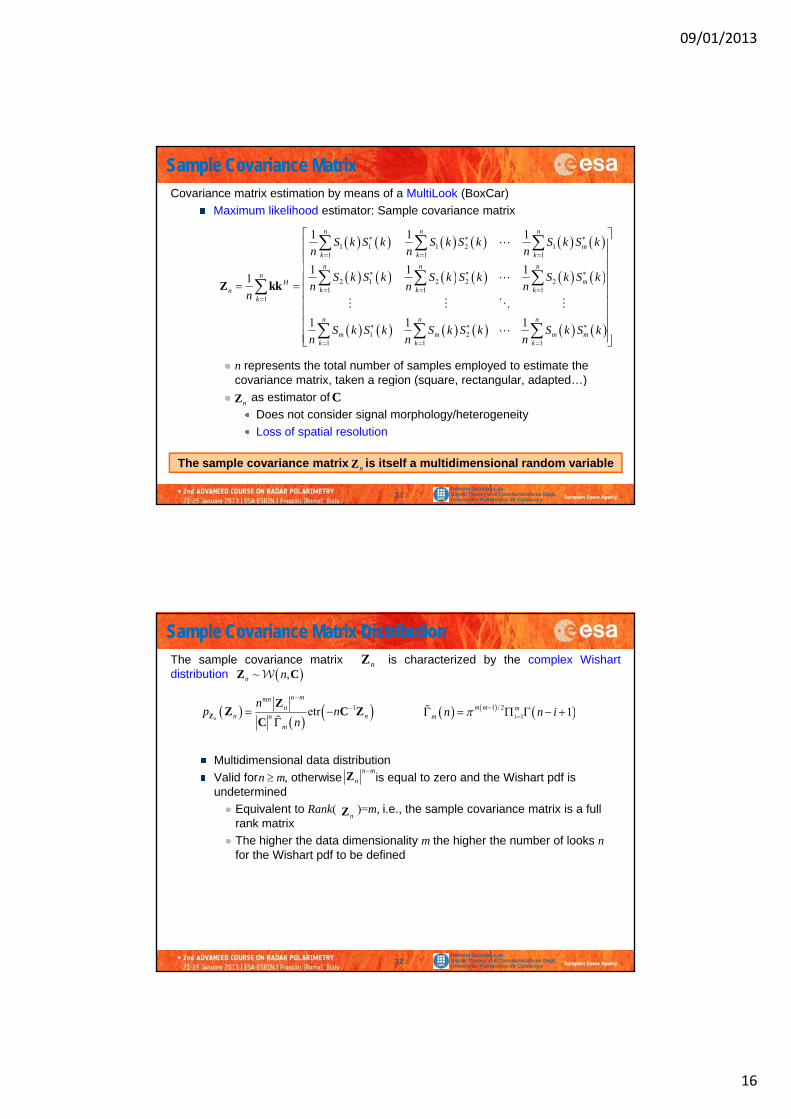
Covariance matrix estimation by means of a MultiLook (BoxCar)
Maximum likelihood estimator: Sample covariance matrix
Sample Covariance MatrixSample Covariance Matrix
1 1 1 2 11 1 1
1 1 1
1 1 1
n n n
mk k k
n n n
S k S k S k S k S k S kn n n
n represents the total number of samples employed to estimate the covariance matrix, taken a region (square, rectangular, adapted…)
2 1 2 2 21 1 1
1
1 21 1 1
1 1 11
1 1 1
n n nn
mHk k kn
k
n n n
m m m mk k k
S k S k S k S k S k S kn n n
n
S k S k S k S k S k S kn n n
Z kk
Remote Sensing Lab.Signal Theory and Communications Dept.Universitat Politècnica de Catalunya
g ( q g p )
as estimator of
Does not consider signal morphology/heterogeneity
Loss of spatial resolution
nZ C
The sample covariance matrix is itself a multidimensional random variablenZ
31
The sample covariance matrix is characterized by the complex Wishartdistribution
Sample Covariance Matrix DistributionSample Covariance Matrix Distribution
nZ
1etrn
n mmnn
n nn
m
np n
n
Z
ZZ C Z
C 1 / 21 1m m m
m in n i
~ ,n nZ C
Multidimensional data distribution
Valid for , otherwise is equal to zero and the Wishart pdf is undetermined
Equivalent to Rank( )=m, i.e., the sample covariance matrix is a full rank matrix
The higher the data dimensionality m the higher the number of looks n f th Wi h t df t b d fi d
n mn m
n
Z
nZ
Remote Sensing Lab.Signal Theory and Communications Dept.Universitat Politècnica de Catalunya
for the Wishart pdf to be defined
32
09/01/2013
17
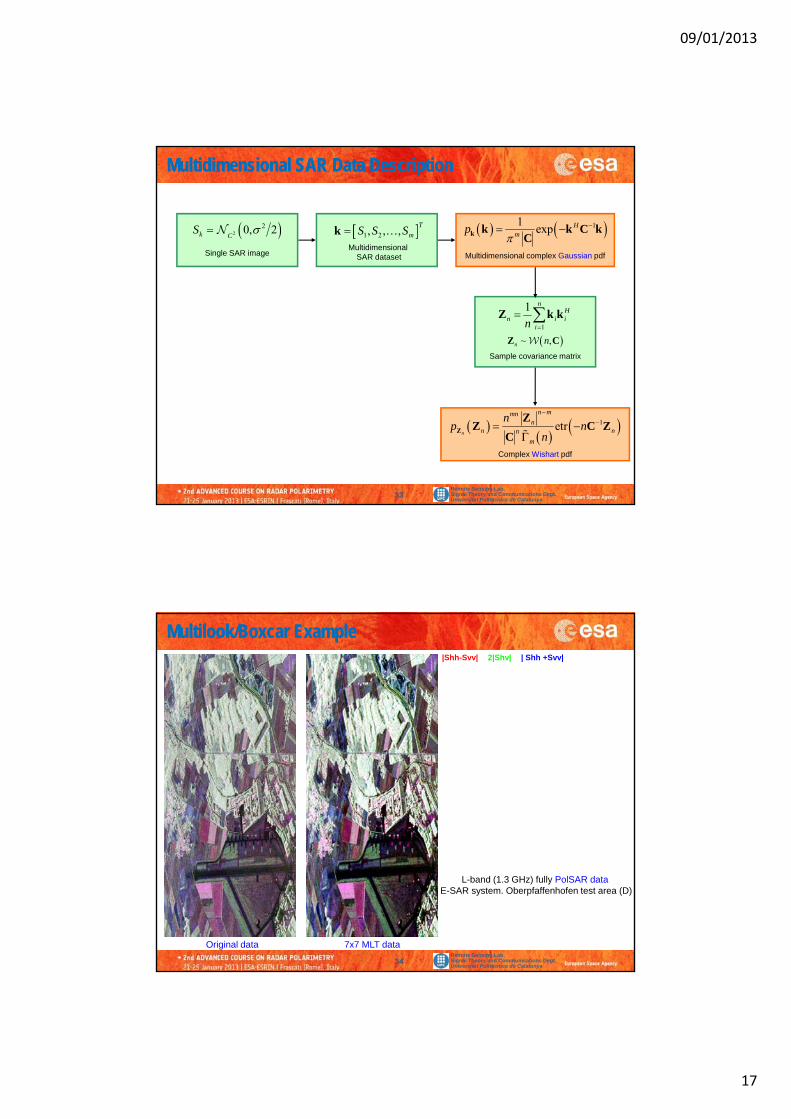
Multidimensional SAR Data DescriptionMultidimensional SAR Data Description
11exp H
mp
k k k C kC
Multidimensional complex Gaussian pdf
220, 2k C
S
Single SAR image
1 2, , ,T
mS S Sk Multidimensional
SAR dataset
1
1 nH
n i iin
Z k k
Sample covariance matrix
~ ,n nZ C
Remote Sensing Lab.Signal Theory and Communications Dept.Universitat Politècnica de Catalunya
33
1etrn
n mmnn
n nn
m
np n
n
Z
ZZ C Z
C Complex Wishart pdf
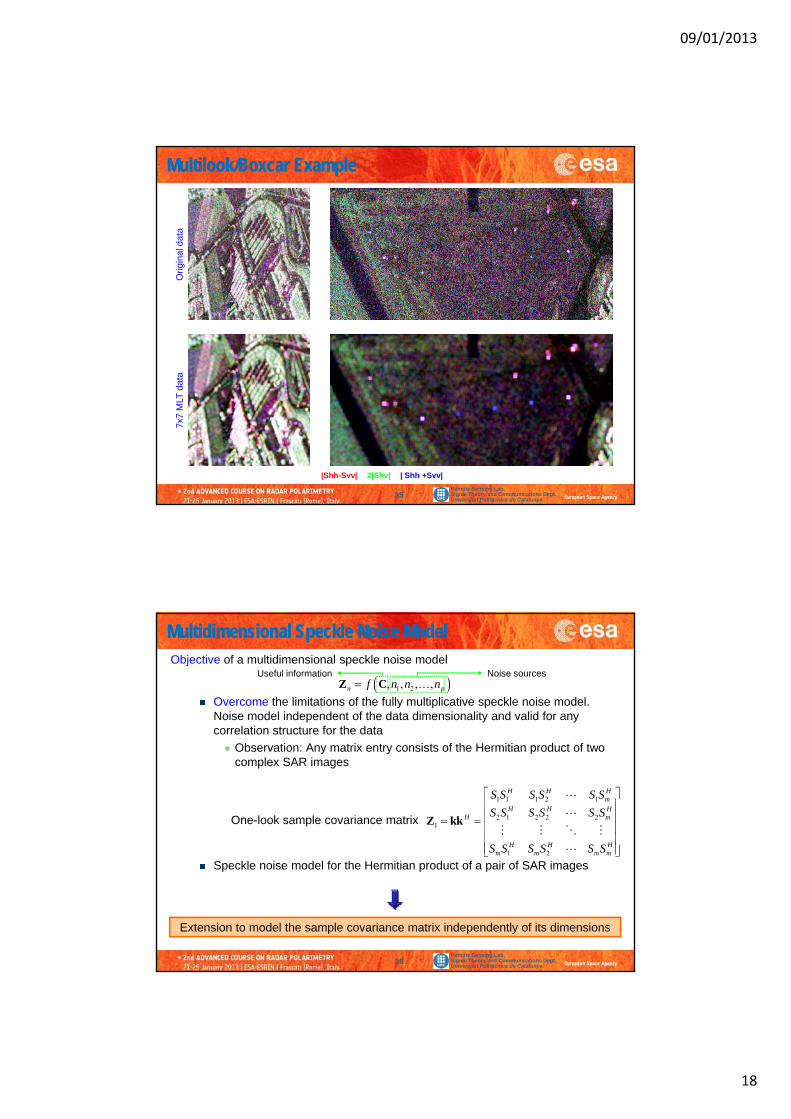
MultilookMultilook/Boxcar Example/Boxcar Example|Shh-Svv| 2|Shv| | Shh +Svv|
Remote Sensing Lab.Signal Theory and Communications Dept.Universitat Politècnica de Catalunya
34
Original data 7x7 MLT data
L-band (1.3 GHz) fully PolSAR dataE-SAR system. Oberpfaffenhofen test area (D)
09/01/2013
18
gina
l dat
aMultilookMultilook/Boxcar Example/Boxcar Example
Orig
ata
Remote Sensing Lab.Signal Theory and Communications Dept.Universitat Politècnica de Catalunya
|Shh-Svv| 2|Shv| | Shh +Svv|
7x7
MLT
d
35
Objective of a multidimensional speckle noise model
Overcome the limitations of the fully multiplicative speckle noise model. Noise model independent of the data dimensionality and valid for any correlation structure for the data
Multidimensional Speckle Noise ModelMultidimensional Speckle Noise Model
1 2, , , ,n pf n n nZ C Useful information Noise sources
correlation structure for the data
Observation: Any matrix entry consists of the Hermitian product of two complex SAR images
One-look sample covariance matrix
1 1 1 2 1
2 1 2 2 21
1 2
H H Hm
H H HH m
H H H
S S S S S S
S S S S S S
S S S S S S
Z kk
Remote Sensing Lab.Signal Theory and Communications Dept.Universitat Politècnica de Catalunya
Speckle noise model for the Hermitian product of a pair of SAR images
Extension to model the sample covariance matrix independently of its dimensions
1 2m m m mS S S S S S
36
09/01/2013
19
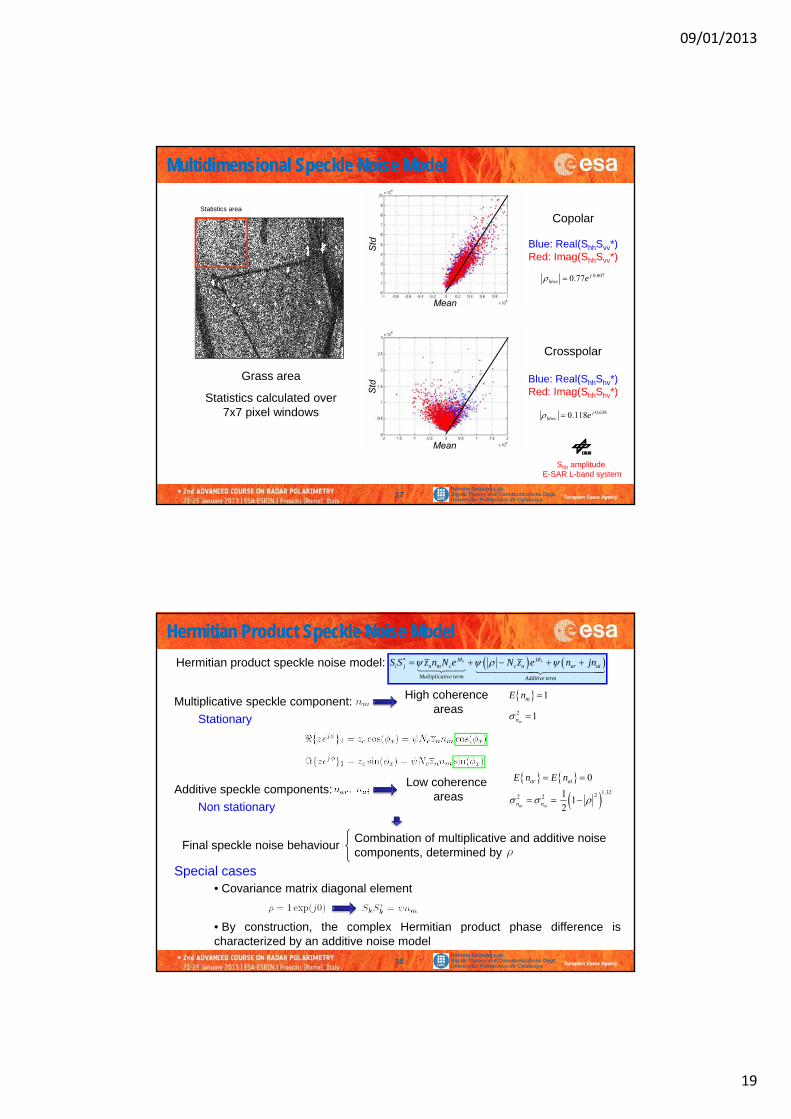
Multidimensional Speckle Noise ModelMultidimensional Speckle Noise Model
Statistics area
Blue: Real(ShhSvv*)Red: Imag(ShhSvv*)
Copolar
Std
Grass area
0.8070.77 jhhvv e
Blue: Real(ShhShv*)
Crosspolar
Mean
td
Remote Sensing Lab.Signal Theory and Communications Dept.Universitat Politècnica de Catalunya
37
Red: Imag(ShhShv*)
0.6380.118 jhhvv e
Statistics calculated over7x7 pixel windows
Mean
St
Shh amplitudeE-SAR L-band system
Hermitian Product Speckle Noise ModelHermitian Product Speckle Noise Model
Multiplicative speckle component: High coherence
areasStationary
x xj ji j n m c c n ar ai
Multiplicative term Additive term
S S z n N e N z e n jn Hermitian product speckle noise model:
1mE n
2 1mn
Additive speckle components: Low coherence
areasNon stationary
Final speckle noise behaviourCombination of multiplicative and additive noisecomponents determined by
1.3222 2 11
2ar ain n
0ar aiE n E n
Remote Sensing Lab.Signal Theory and Communications Dept.Universitat Politècnica de Catalunya
38
components, determined by
• Covariance matrix diagonal element
• By construction, the complex Hermitian product phase difference ischaracterized by an additive noise model
Special cases
09/01/2013
20
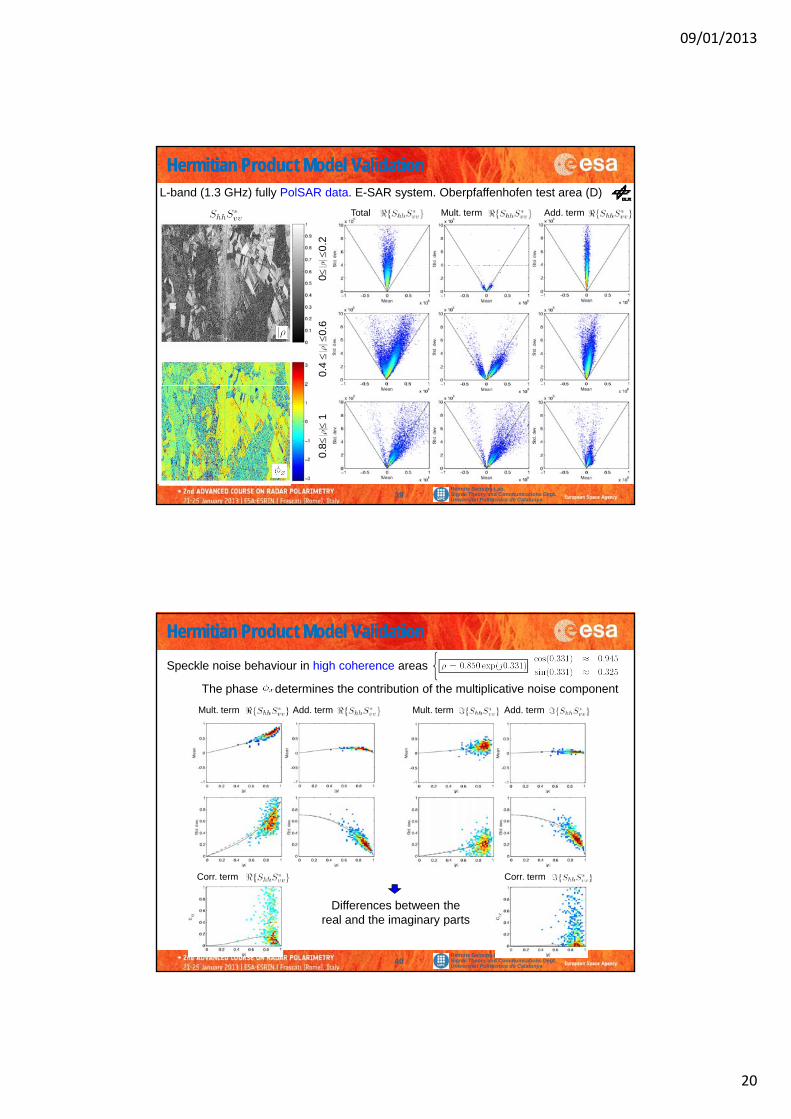
Hermitian Product Hermitian Product Model ValidationModel ValidationL-band (1.3 GHz) fully PolSAR data. E-SAR system. Oberpfaffenhofen test area (D)
0.2
Total Mult. term Add. term
00.
4
0.6
Remote Sensing Lab.Signal Theory and Communications Dept.Universitat Politècnica de Catalunya
39
Scatter diagram
Useful tool to display the nature of noise sources
0.8
1
Hermitian Product Hermitian Product Model ValidationModel Validation
Speckle noise behaviour in high coherence areas
Mult. term Add. term Mult. term Add. term
The phase determines the contribution of the multiplicative noise component
Remote Sensing Lab.Signal Theory and Communications Dept.Universitat Politècnica de Catalunya
40
Corr. term Corr. term
Differences between thereal and the imaginary parts

09/01/2013
21
Hermitian Product Hermitian Product Model ValidationModel Validation
Mult. term Add. term Mult. term Add. term
Low influence of the average phase in low coherence areas
Speckle noise behaviour in low coherence areas
Remote Sensing Lab.Signal Theory and Communications Dept.Universitat Politècnica de Catalunya
41
Corr. term Corr. term
For low coherences, additivespeckle term dominates
Multilook Multidimensional Speckle Noise ModelMultilook Multidimensional Speckle Noise Model
Multiplicative speckle noise component
Hermitian product speckle noise model: * exp expi j m x c n x ar ain
Multiplicative term Additive term
S S n j N z j n jn
Multiplicative speckle noise componentDominant for high coherences
Modulated by phase information
Additive speckle noise componentDominant for low coherences
Not affected by phase information
Effect of the approximations
m c nE n N z 2
2 21
2mn cNn
1.3222 2 11
2ar ai
n
n n n 0ar aiE n E n
Remote Sensing Lab.Signal Theory and Communications Dept.Universitat Politècnica de Catalunya
42
ppMean value IS NOT approximated No loss of information
Std. Dev. ARE approximated
lim exp exp expm x c n x ar ai xn
n j N z j n jn j
09/01/2013
22
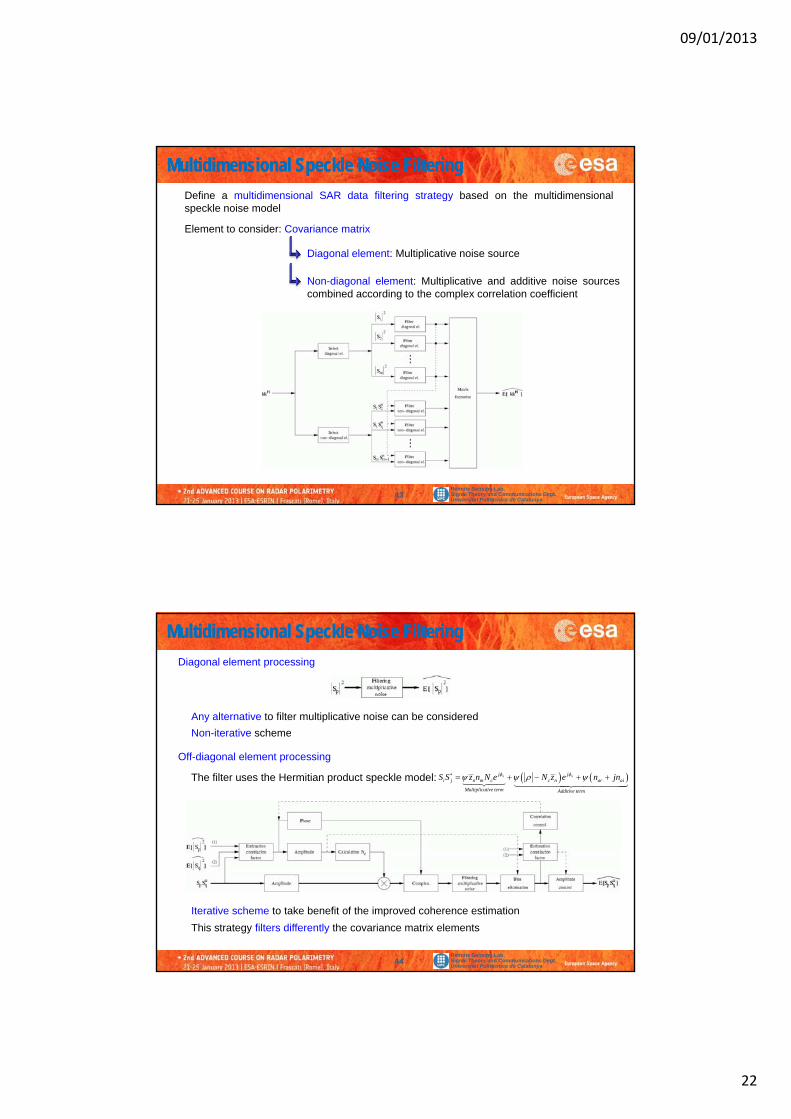
Multidimensional Speckle Noise FilteringMultidimensional Speckle Noise Filtering
Define a multidimensional SAR data filtering strategy based on the multidimensionalspeckle noise model
Element to consider: Covariance matrix
Diagonal element: Multiplicative noise source
Non-diagonal element: Multiplicative and additive noise sourcescombined according to the complex correlation coefficient
Remote Sensing Lab.Signal Theory and Communications Dept.Universitat Politècnica de Catalunya
43
Multidimensional Speckle Noise FilteringMultidimensional Speckle Noise Filtering
Diagonal element processing
Any alternative to filter multiplicative noise can be considered
Non iterative scheme
Off-diagonal element processing
x xj ji j n m c c n ar ai
Multiplicative term Additive term
S S z n N e N z e n jn The filter uses the Hermitian product speckle model:
Non-iterative scheme
Remote Sensing Lab.Signal Theory and Communications Dept.Universitat Politècnica de Catalunya
44
Iterative scheme to take benefit of the improved coherence estimation
This strategy filters differently the covariance matrix elements
09/01/2013
23
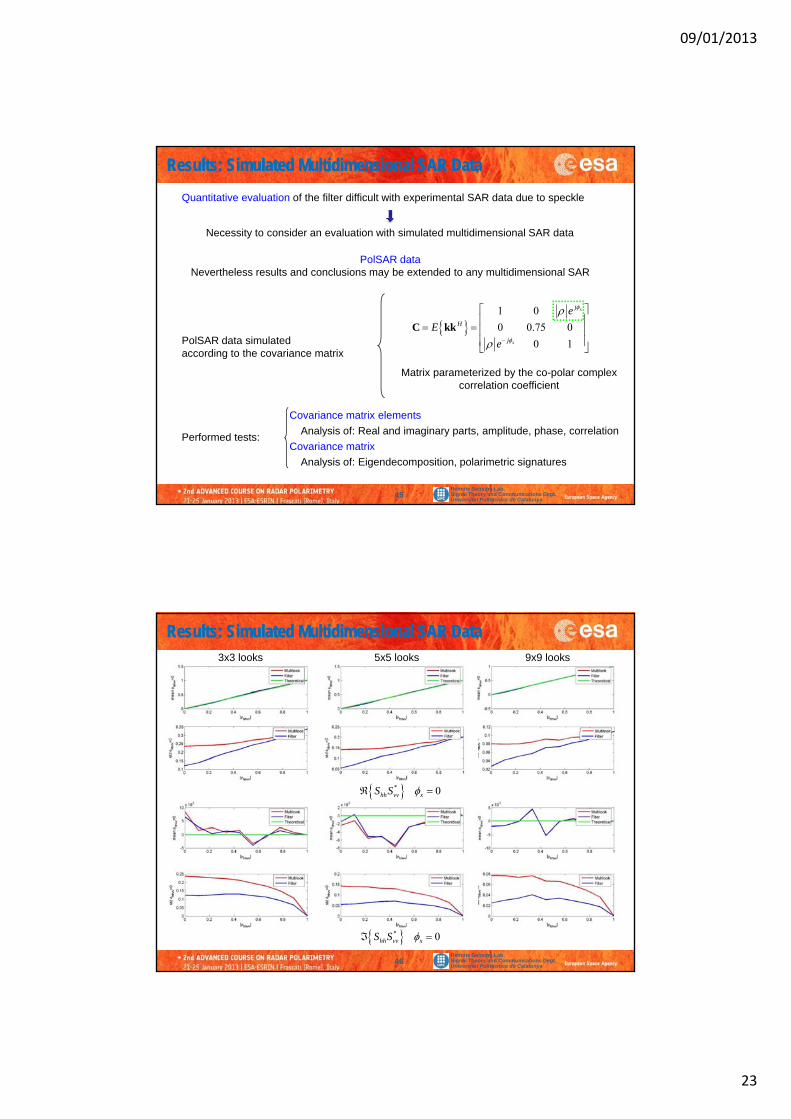
Results: Simulated Multidimensional SAR DataResults: Simulated Multidimensional SAR Data
Quantitative evaluation of the filter difficult with experimental SAR data due to speckle
Necessity to consider an evaluation with simulated multidimensional SAR data
PolSAR data
PolSAR data simulatedaccording to the covariance matrix
1 0
0 0.75 0
0 1
x
x
j
H
j
e
E
e
C kk
Matrix parameterized by the co-polar complexcorrelation coefficient
Nevertheless results and conclusions may be extended to any multidimensional SAR
Remote Sensing Lab.Signal Theory and Communications Dept.Universitat Politècnica de Catalunya
45
correlation coefficient
Performed tests:Analysis of: Real and imaginary parts, amplitude, phase, correlation
Covariance matrix elements
Covariance matrix
Analysis of: Eigendecomposition, polarimetric signatures
Results: Simulated Multidimensional SAR DataResults: Simulated Multidimensional SAR Data3x3 looks 5x5 looks 9x9 looks
* 0hh vv xS S
Remote Sensing Lab.Signal Theory and Communications Dept.Universitat Politècnica de Catalunya
46
* 0hh vv xS S
09/01/2013
24
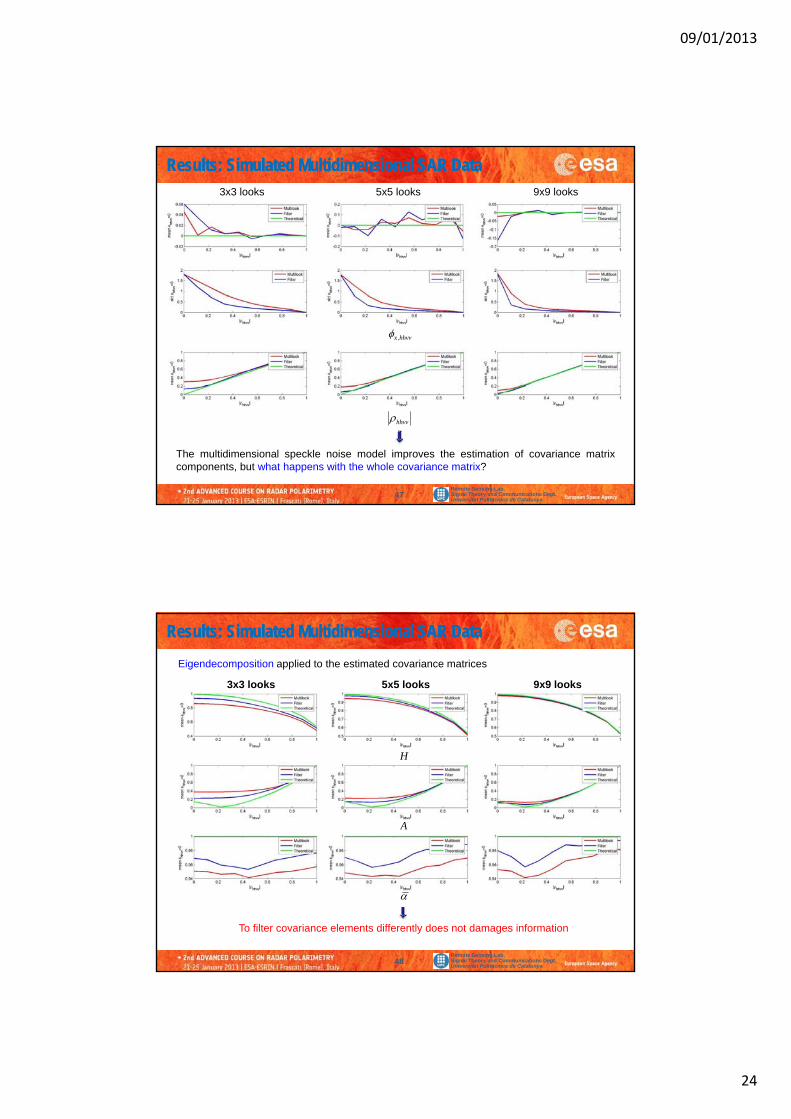
Results: Simulated Multidimensional SAR DataResults: Simulated Multidimensional SAR Data3x3 looks 5x5 looks 9x9 looks
,x hhvv
Remote Sensing Lab.Signal Theory and Communications Dept.Universitat Politècnica de Catalunya
47
hhvv
The multidimensional speckle noise model improves the estimation of covariance matrixcomponents, but what happens with the whole covariance matrix?
Results: Simulated Multidimensional SAR DataResults: Simulated Multidimensional SAR Data
3x3 looks 5x5 looks 9x9 looks
Eigendecomposition applied to the estimated covariance matrices
H
A
Remote Sensing Lab.Signal Theory and Communications Dept.Universitat Politècnica de Catalunya
48
To filter covariance elements differently does not damages information
09/01/2013
25
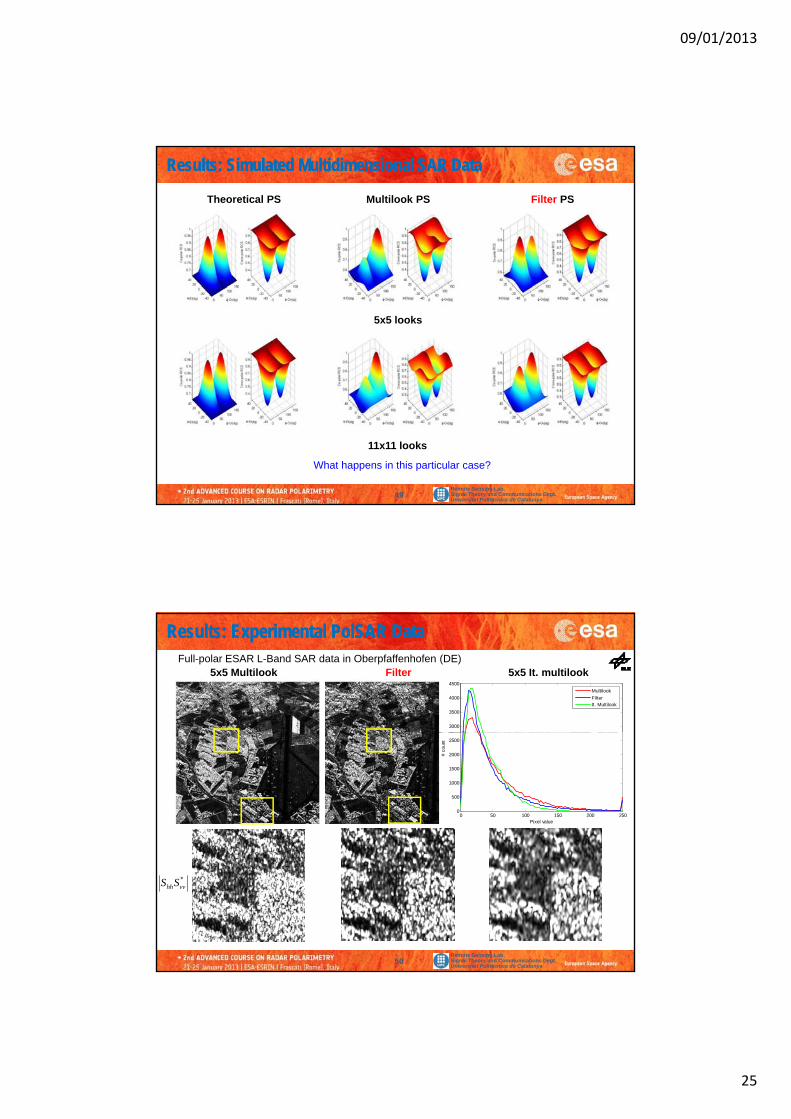
Results: Simulated Multidimensional SAR DataResults: Simulated Multidimensional SAR Data
Theoretical PS Multilook PS Filter PS
5x5 looks
Remote Sensing Lab.Signal Theory and Communications Dept.Universitat Politècnica de Catalunya
49
11x11 looks
What happens in this particular case?
Results: Experimental PolSAR DataResults: Experimental PolSAR DataFull-polar ESAR L-Band SAR data in Oberpfaffenhofen (DE)
5x5 Multilook Filter 5x5 It. multilook
3000
3500
4000
4500
Multilook
FilterIt. Multilook
0 50 100 150 200 2500
500
1000
1500
2000
2500
Pixel value
# co
unt
Remote Sensing Lab.Signal Theory and Communications Dept.Universitat Politècnica de Catalunya
50
*hh vvS S
09/01/2013
26
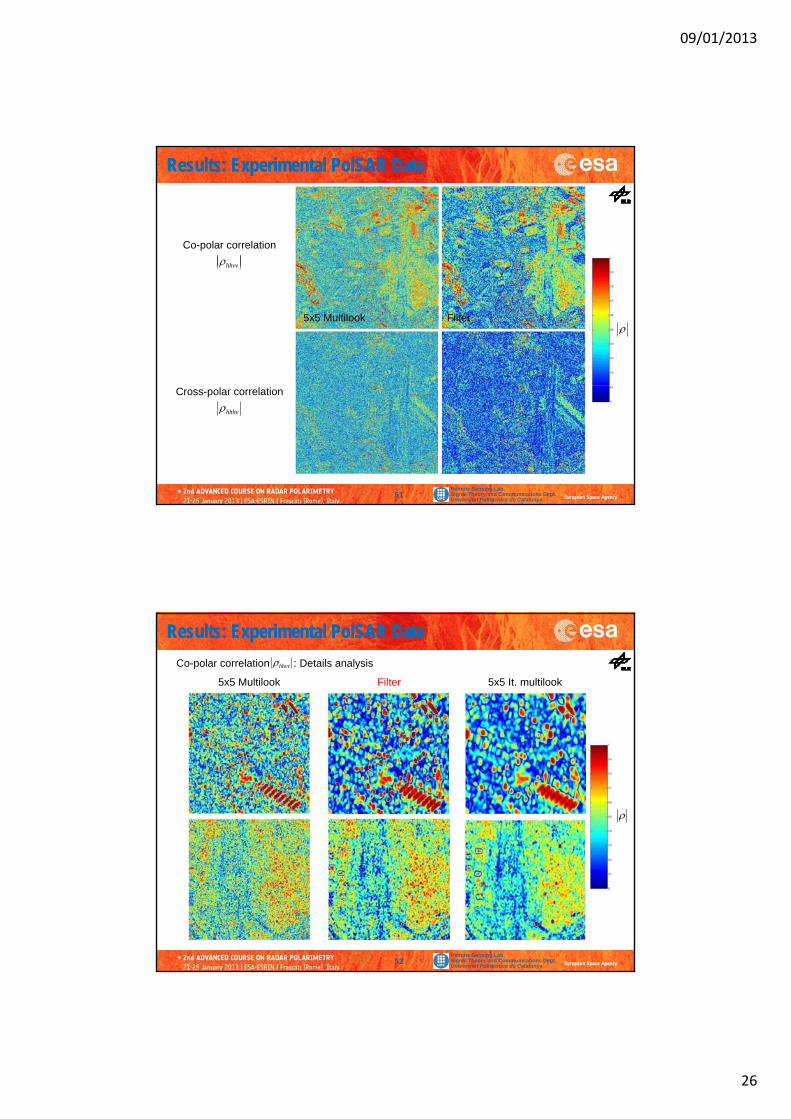
Results: Experimental PolSAR DataResults: Experimental PolSAR Data
hhvvCo-polar correlation
hhvv
5x5 Multilook Filter
Remote Sensing Lab.Signal Theory and Communications Dept.Universitat Politècnica de Catalunya
51
hhhvCross-polar correlation
Results: Experimental PolSAR DataResults: Experimental PolSAR Data
hhvvCo-polar correlation : Details analysis
5x5 Multilook Filter 5x5 It. multilook
Remote Sensing Lab.Signal Theory and Communications Dept.Universitat Politècnica de Catalunya
52
09/01/2013
27
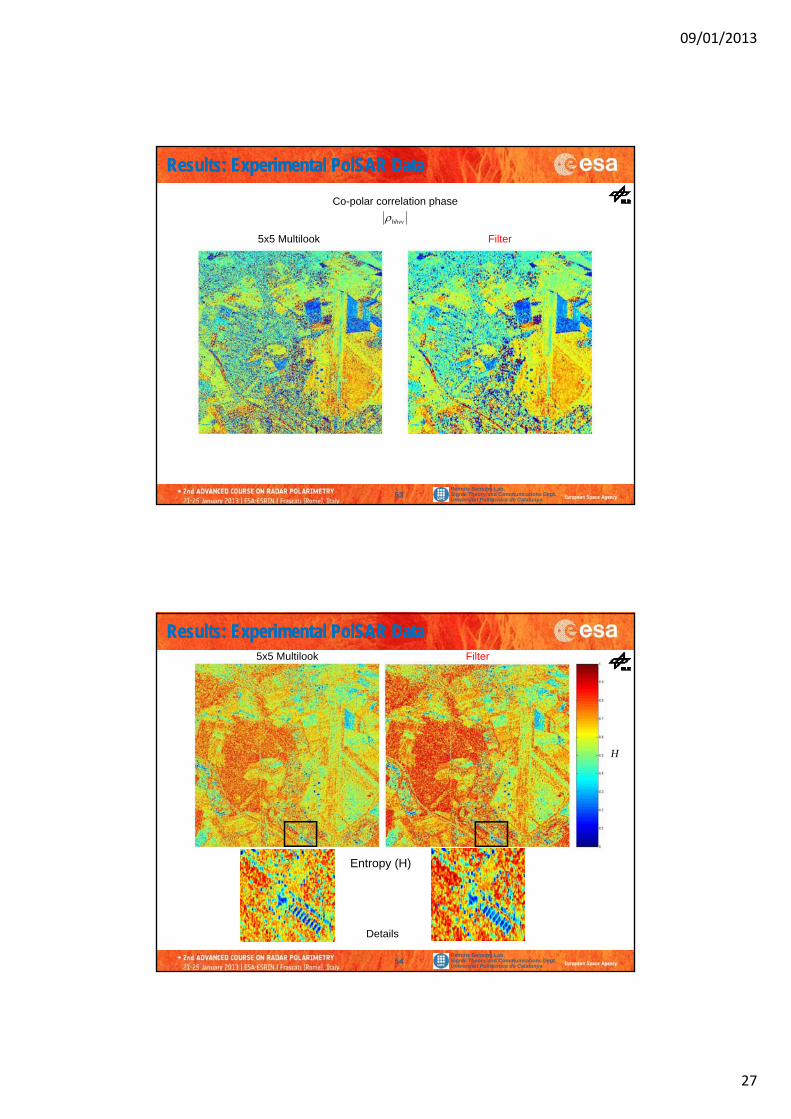
Results: Experimental PolSAR DataResults: Experimental PolSAR Data
hhvvCo-polar correlation phase
5x5 Multilook Filter
Remote Sensing Lab.Signal Theory and Communications Dept.Universitat Politècnica de Catalunya
53
Results: Experimental PolSAR DataResults: Experimental PolSAR Data5x5 Multilook Filter
H
Remote Sensing Lab.Signal Theory and Communications Dept.Universitat Politècnica de Catalunya
54
Entropy (H)
Details

09/01/2013
28
Results: Experimental PolSAR DataResults: Experimental PolSAR Data5x5 Multilook Filter
A
Remote Sensing Lab.Signal Theory and Communications Dept.Universitat Politècnica de Catalunya
55
Anisotropy (A)
Details
Remote Sensing Lab.Signal Theory and Communications Dept.Universitat Politècnica de Catalunya
56