specification of aide methodology · specification of aide methodology ... the cookbook defines...
TRANSCRIPT

Information Society Technologies (IST)
Programme
AIDE IST-1-507674-IP
Specification of AIDE methodology Deliverable No. D2.1.4
SubProject No. SP2 SubProject Title Evaluation and assessment methodology
Workpackage No. WP2.1 Workpackage Title Generic evaluation methodology
Activity No. A2.1.4 Activity Title Development of AIDE evaluation methodology with end users
Authors
W. Janssen (TNO), E. Nodari (CRF), R. Brouwer (TNO) J. Plaza (CIDAUT), J. Östlund (VTI), A. Keinath (BMW), A. Toffetti (CRF), M. Alonso (CIDAUT), M. Rimini-Doering (BOSCH), V. Portouli (HIT), D. Horst (Regienov), C. Marberger (USTUTT), H. Vega (CIDAUT), C Cherri (CRF)
Status (D: draft, in progress, S: Submitted to EC, F: Final accepted by EC)
S
File Name: AIDE D2.1.4 v11.doc (annexes in separate file) Project start date and duration 01 March 2004, 50 Months

AIDE Deliverable 2.1.4 Dissemination level PU Contract N. IST-1-507674-IP (public summary)
21/10/2008 i
History table Version No.
Date (dd/mm/yy)
Details
1 02/02/07 First draft 2 20/03/07 Structure enhanced; text elaborated 3 02/04/07 Draft for Annual review 2007; text elaborated 4 18/01/08 Draft for peer review; comments received from Annual
Review and partners WP 2.4 taken into account 5 31/03/2008 Deliverable revised on the basis of peer reviewer document
18/02/2008, provided as two separate documents (main text + annexes)
6 31/03/2008 Merged into one document. Submitted to EC. 7-10 16/10/2008 Updates based on comments in Final Review. 11 21/10/2008 Minor editorial modifications by coordinator. Submitted to
EC.
AIDE Deliverable 2.1.4 Dissemination level PU Contract N. IST-1-507674-IP (public summary)
21/10/2008 ii
Note: This public summary of AIDE D2.1.4 (full deliverable has limited dissemination level PP) includes not only the executive summary (as is the case for other non-public AIDE deliverables), but on request from the European Commission also the definition of the AIDE evaluation and assessment methodology itself. What is included is: Chapter 1 (Introduction), an excerpt of Chapter 2 (Description of AIDE functionalities and meta-functions), Chapter 5 (The Cookbook: Recommendations and specifications of a final test regime) and Chapter 8 (References).
Executive Summary This deliverable defines the final AIDE methodology for evaluation and assessment of In-Vehicle Information (IVI) and Advanced Driving Assistance (ADA) Systems (IVIS/ADAS). After an introductory Chapter 1, Chapter 2 provides a detailed description of AIDE systems, focusing in particular on the meaning of adaptivity and integration of system. Moreover a definition of meta-functions is provided. In Chapter 3, summarizing tables of the experiments carried out during AIDE task 2.1.4 are described. The experiments had the aim to evaluate AIDE meta-functions with a selection of metrics that have been developed or improved in SP2 (Evaluation and Assessment Methodology). The experimental methodology was based on the outcome of Task 2.2.7 (Empirical comparison of approaches) where different evaluation approaches and tools were evaluated according to their suitability in evaluating ADAS and IVIS. However, in this report we describe experiments that have been specifically designed to evaluate these metrics especially linked to usefulness for the evaluation of AIDE meta-functions. Overall conclusions based on experimental work previously reported are presented in Chapter 4. The final methodology indicated as cookbook is described in Chapter 5. This cookbook intends to be a sort of handbook to develop and apply an evaluation methodology of integrated as well as non-integrated ADA/IVI Systems. This chapter summarises all the relevant outcomes of SP2 work. The cookbook defines steps to be followed to design a user evaluation of IVI and ADA systems. A great number of links to literature are provided in the same chapter, to obtain more detailed descriptions of these different steps. Finally Chapter 6 provides a proposal on how to transform experimental data into accident risk estimates. Annexes to this report (full details on the studies summarized in Chapter 3, as well as minutes from an SP2-SP3 interaction workshop) are provided in a separate file, “AIDE D2.1.4 v11 annexes”.

AIDE Deliverable 2.1.4 Dissemination level PU Contract N. IST-1-507674-IP (public summary)
21/10/2008 iii
Table of Contents
EXECUTIVE SUMMARY ................................................................................................................ II
TABLE OF CONTENTS ................................................................................................................ III
LIST OF TABLES..........................................................................................................................IV
LIST OF FIGURES .........................................................................................................................V
ACRONYMS..................................................................................................................................VI
1 INTRODUCTION ......................................................................................................................... 1
2 DESCRIPTION OF AIDE FUNCTIONALITIES AND META-FUNCTIONS (EXCERPT) ............... 2
5 THE COOKBOOK: RECOMMENDATIONS AND SPECIFICATIONS OF A FINAL TEST REGIME ......................................................................................................................................... 6
5.1 Aim .............................................................................................................................................................................. 6
5.2 Cookbook context ................................................................................................................................................... 6
5.3 Steps for the evaluation ........................................................................................................................................ 7
5.4 Operative specifications........................................................................................................................................ 8 5.4.1 Define the aims of the evaluation and describe the system to be evaluated ........................................... 8 5.4.2 To describe the system to be evaluated ...................................................................................................... 11 5.4.3 To define a scenario ....................................................................................................................................... 11
5.4.3.1 How to come up with Use Cases (conflict Scenarios) for integrated systems ............................... 15 5.4.4 To define the subject sample......................................................................................................................... 18
5.4.4.1 Sample size.............................................................................................................................................. 18 5.4.4.2 Composition of samples ......................................................................................................................... 19 5.4.4.3 Ethical and safety issues........................................................................................................................ 20
5.4.5 To define subjective and objective parameters .......................................................................................... 20 5.4.5.1 The minimum set for workload and driving performance .................................................................. 20 5.4.5.2 The non-minimum set for workload and driving performance .......................................................... 22 5.4.5.3 The minimum set for acceptance and usability measures ................................................................ 22
5.4.6 To define the experimental design................................................................................................................ 24 5.4.6.1 Integrated system experimental design ............................................................................................... 25
5.4.7 To develop experimental instruction both for participants and for experimenters ................................. 26 5.4.7.1 To select and train experimenters ........................................................................................................ 26 5.4.7.2 To carry out a pilot .................................................................................................................................. 27 5.4.7.3 To finalize the experimental set-up....................................................................................................... 28
5.4.8 To analyse the collected data........................................................................................................................ 28 5.4.9 To produce summary indications about the system................................................................................... 30
8 REFERENCES .......................................................................................................................... 33

AIDE Deliverable 2.1.4 Dissemination level PU Contract N. IST-1-507674-IP (public summary)
21/10/2008 iv
List of tables TABLE 8: MATRIX – LEVEL OF SYSTEM DEVELOPMENT VS. AIM OF EVALUATION ...................................................... 10 TABLE 9 - MATRIX FUNCTIONS PRESENTED IN THE SYSTEM VS. SCENARIO BUILDING BLOCKS. ................................. 12 TABLE 10: SUGGESTED SIMULATOR CATEGORY AND AIDE DESIGN SCENARIO FOR EACH ADAS/IVIS .................... 14 TABLE 11: FORMAL DESCRIPTION OF AIDE DESIGN SCENARIOS............................................................................ 16 TABLE 12: AIDE APPROACH – DESIGN SCENARIO EXAMPLE .................................................................................. 16 TABLE 13: CONFLICTS CATEGORIES .................................................................................................................... 17 TABLE 14 – ERRORS AND DECISIONS IN HYPOTHESIS TESTING.............................................................................. 18 TABLE 15: THE SELECTED SUBSET OF DRIVING CONTROL METRICS FROM 2.2.5 DELIVERABLE (ÖSTLUND, ET AL.,
2005), THE MAIN BEHAVIOURAL EFFECTS THAT THEY ARE INTENDED TO QUANTIFY ........................................ 21 TABLE 16: CHARACTERISTICS OF WITHIN DESIGN ................................................................................................. 25

AIDE Deliverable 2.1.4 Dissemination level PU Contract N. IST-1-507674-IP (public summary)
21/10/2008 v
List of figures FIGURE 1: GLOBAL PICTURE OF DELIVERABLE D2.1.4............................................................................................ 1 FIGURE 2: AIDE CONCEPT.................................................................................................................................... 2 FIGURE 3: GENERAL SCHEME OF UCD PROCESS ................................................................................................... 7 FIGURE 4: AIDE COOKBOOK IN THE UCD PROCESS .............................................................................................. 7 FIGURE 5: A MODEL OF THE ATTRIBUTES OF SYSTEM ACCEPTABILITY (NIELSEN, 1993)........................................... 23

AIDE Deliverable 2.1.4 Dissemination level PU Contract N. IST-1-507674-IP (public summary)
21/10/2008 vi
Acronyms
ACC Adaptive Cruise Control ADAS Advanced Driver-Assistance System AIDE Adaptive Integrated Driver-vehicle Interface ANOVA ANalysis Of VAriance ART Accelerator Release Time BRT Brake Reaction Time BS Blind Spot CSW Curve Speed Warning DALI Driving Activity Load Index DCM Driver Characteristics Module DVE Driver-Vehicle-Environment FCW Forward Collision Warning GMTA Goals-Means Task Analysis GUI Graphical User Interface HHDD High Head Down Display HMD Human Machine Display HMI Human Machine Interaction I/O Input/Output ICA Interaction and Communication Assistant IST Information Society Technologies IVIS Integrated Vehicular Information System LANEX LANe EXceedences LANEXC LANEX in Curves LDW Lane Departure Warning LSD Lateral Standard Deviation MOSC Maximum Over-Speed in Curves MSC Mean Speed in Curves MSDLP Modified SDLP
MTH Mean Time Headway / Minimum Time Headway
NA Non-Adaptivity NCA Number of Cautionary Alerts NIA Number of Imminent Alerts OP Output PDA Personal Digital Assistant PDT Peripheral Detection Task POSC Percentage of Over-Speed in Curves RSME Rating Scale of Mental Effort RT Release Time SD Standard Deviation SDLP Standard Deviation of Lateral Position SP Sub Project SRR Steering wheel Reversal Rate TH Time Headway THB Time Headway when Braking

AIDE Deliverable 2.1.4 Dissemination level PU Contract N. IST-1-507674-IP (public summary)
21/10/2008 vii
THDIFF THB - MTH TLC Time-to-line crossing TTC Time To Collision UCD User-Centered Design VELB Vehicle Exceeds Lane Boundaries WP Work Package
AIDE Deliverable 2.1.4 Dissemination level PU Contract N. IST-1-507674-IP (public summary)
21/10/2008 1
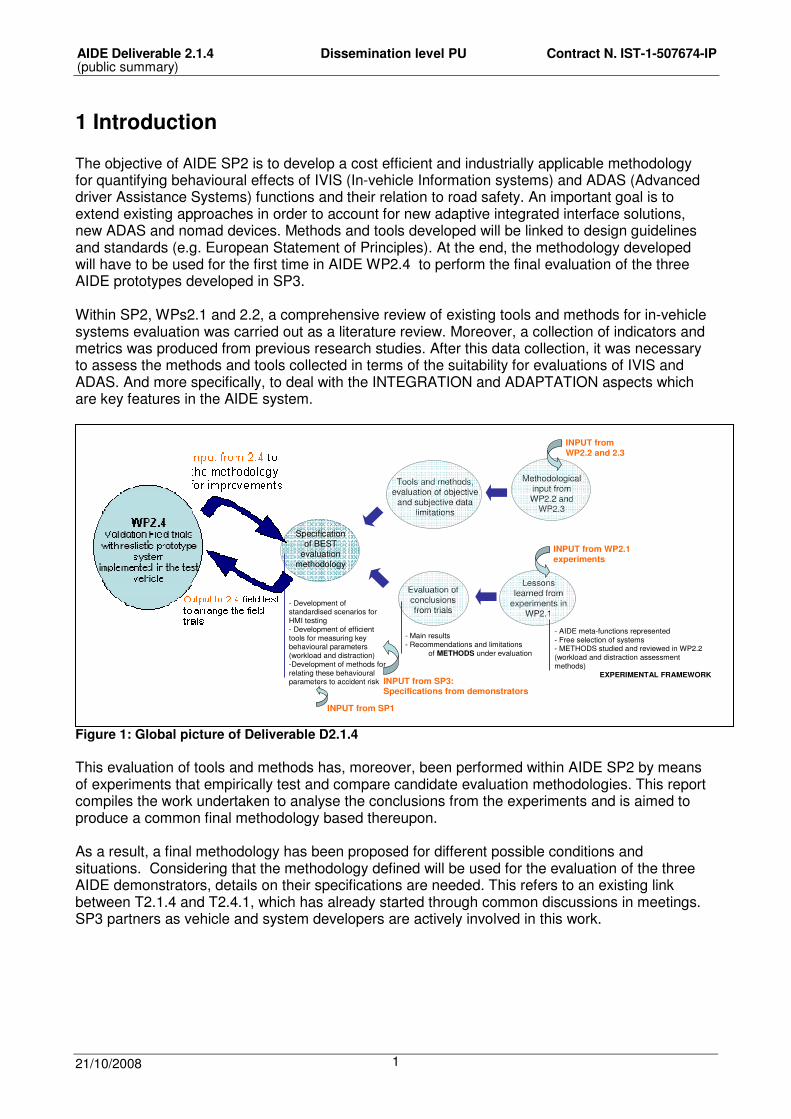
1 Introduction The objective of AIDE SP2 is to develop a cost efficient and industrially applicable methodology for quantifying behavioural effects of IVIS (In-vehicle Information systems) and ADAS (Advanced driver Assistance Systems) functions and their relation to road safety. An important goal is to extend existing approaches in order to account for new adaptive integrated interface solutions, new ADAS and nomad devices. Methods and tools developed will be linked to design guidelines and standards (e.g. European Statement of Principles). At the end, the methodology developed will have to be used for the first time in AIDE WP2.4 to perform the final evaluation of the three AIDE prototypes developed in SP3. Within SP2, WPs2.1 and 2.2, a comprehensive review of existing tools and methods for in-vehicle systems evaluation was carried out as a literature review. Moreover, a collection of indicators and metrics was produced from previous research studies. After this data collection, it was necessary to assess the methods and tools collected in terms of the suitability for evaluations of IVIS and ADAS. And more specifically, to deal with the INTEGRATION and ADAPTATION aspects which are key features in the AIDE system.
Figure 1: Global picture of Deliverable D2.1.4 This evaluation of tools and methods has, moreover, been performed within AIDE SP2 by means of experiments that empirically test and compare candidate evaluation methodologies. This report compiles the work undertaken to analyse the conclusions from the experiments and is aimed to produce a common final methodology based thereupon. As a result, a final methodology has been proposed for different possible conditions and situations. Considering that the methodology defined will be used for the evaluation of the three AIDE demonstrators, details on their specifications are needed. This refers to an existing link between T2.1.4 and T2.4.1, which has already started through common discussions in meetings. SP3 partners as vehicle and system developers are actively involved in this work.
Methodological input from WP2.2 and
WP2.3
Lessons learned from
experiments in WP2.1
Tools and methods, evaluation of objective
and subjective data limitations
Evaluation of conclusions from trials
Specification of BEST
evaluation methodology
- Main results- Recommendations and limitations
of METHODS under evaluation
- AIDE meta-functions represented- Free selection of systems- METHODS studied and reviewed in WP2.2 (workload and distraction assessment methods)
EXPERIMENTAL FRAMEWORK
- Development of standardised scenarios for HMI testing- Development of efficient tools for measuring key behavioural parameters (workload and distraction)-Development of methods for relating these behavioural parameters to accident risk
INPUT from WP2.2 and 2.3
INPUT from WP2.1 experiments
INPUT from SP3:Specifications from demonstrators
INPUT from SP1

AIDE Deliverable 2.1.4 Dissemination level PU Contract N. IST-1-507674-IP (public summary)
21/10/2008 2
2 Description of AIDE functionalities and meta-functions (excerpt) One of the central aims of the AIDE project is to provide drivers with an adaptive integrated HMI (Human Machine Interaction) platform that makes use of current driver state/driving context based on real-time monitoring of the driver, the vehicle and the environment (see Figure 2 as an illustration of the general AIDE concept).
Figure 2: AIDE concept The AIDE system can be described as an overall manager of the in-vehicle HMI. The management functions are described within AIDE SP3 (Design and Development of an Adaptive Integrated Driver-vehicle interface) as so called meta-functions. These functions are intended to manage the interaction between ADAS (Advanced Driver-Assistance System) and IVIS (Integrated Vehicular Information System) and the driver. An example of such a meta-function could be to suppress phone-calls while the driver is in a highly demanding situation. Therefore, as explained in previous project deliverables (D3.1.2 and D3.2.1), the AIDE meta-functions represent the responses of the AIDE system, i.e. possible solutions, to the conflict situations described by the AIDE design scenarios. The meta-functions could thus be regarded as “functions that control other (more basic) functions”, and are a key focus of the AIDE project. In the proposed AIDE functional architecture (see Kussman, 2005), the meta-functions are mainly implemented by the ICA (Interaction and Communication Manager), in order to provide a description of the intended functional scope of the AIDE system. Below, the five general AIDE meta-functions are further described along with examples.
1. HMI I/O management
This is perhaps the most basic meta-function implemented by the AIDE system. As described in Kussman (2005), the AIDE architecture is based on a logical separation between different HW/SW components such as sensors, applications, the ICA and HMI I/O devices. Thus, in principle, every application should have access to every sensor and every HMI I/O device. The objective of the HMI I/O management is to manage the allocation of HMI I/O devices to applications. This entails keeping track of which I/O devices that are currently used and by which applications, and setting up the communication link between the application and the requested I/O device(s). Conflicts with other actions and/or the DVE state are handled by meta-functions 2-4.

AIDE Deliverable 2.1.4 Dissemination level PU Contract N. IST-1-507674-IP (public summary)
21/10/2008 3
Example The route guidance application wants to initiate a guidance message using the head-up display (HUD) and the audio system. The application asks the ICA for the resources who checks if the requested resources are available. If so, the application is given access to the requested I/O devices.
2. Action prioritisation
This meta-function resolves general conflicts between application actions. These conflicts may be, but are not necessarily due to competing requests for I/O devices. Thus, even if the requested resources are available, the action could be denied by the ICA due to a human-factors related conflict with another action (for example, presenting the two actions simultaneously could lead to information overload). Example The driver is talking on the phone while driving. During the conversation, an SMS and an email are initiated. The two actions requests different displays. However, in order to not overload the driver with information, they are presented sequentially in priority order after the phone call has ended.
3. DVE-dependent action scheduling
This general purpose of this meta-function is to resolve conflicts between application actions and the current driving situation (i.e. the DVE state), by re-scheduling (e.g. delaying) information when necessary. For moderately time-critical actions (e.g. phone calls), the delay may be on the time-scale 5-20 s. Less time critical actions (e.g. SMS) could possibly be delayed for longer periods (several minutes). Example The driver enters a roundabout. While in the roundabout, a phone call is initiated. The phone call is delayed until the driver has exited the roundabout.
4. Modality selection
This involves selecting the appropriate sensory modality for an action. The modality may, for example, be changed from visual to auditory in driving situations with high visual demand. Moreover, some conflicts between concurrent actions may be resolved by adapting the presentation modality of one and both of the actions (rather than interrupting or delaying one of the messages). Example While driver is traveling and listening to music (high volume detected from cd player), a traffic announcement is initiated by the TMC application and the intended modality is auditory. The system chooses not to intervene lowering the music and instead presents the TMC application output visually.
5. Warning adaptation to DVE state
This involves optimising the timing/intensity of warnings to the current DVE state. For example, when the driver is distracted or drowsy, a forward collision warning could be given earlier or/with higher intensity than when driver is alert. This also potentially involves adaptation to driver intent. Example

AIDE Deliverable 2.1.4 Dissemination level PU Contract N. IST-1-507674-IP (public summary)
21/10/2008 4
The driver is distracted and exits the lane. The lane departure warning is enabled since the driver could be assumed to exit the lane unintentionally. Later, the driver exits the lane to overtake another vehicle. In this case, the warning is disabled since the driver was fully alert and the lane change could be assumed to be intentional.
The large amount of such possible meta-functions leads to a generic description of problem scenarios that are called AIDE design scenarios. The AIDE design scenarios were specified in terms of a formalism using two main types of parameters: (1) application actions and (2) DVE (Driver-Vehicle-Environment) conditions. The actions represent an event initiated by the user or a system while the DVE conditions represent the momentary state of the Driver-Vehicle-Environment system. Three general groups of design scenarios have been defined, based on the type of conflict they represent and should be solved by AIDE system (for more detailed examples see D 3.1.2)
1. Conflict between concurrent actions. Example: A driver is distracted and, as a result, swerves out of the lane. The lane departure warning system gives a warning. However, shortly after, the vehicle ahead brakes suddenly, triggering the forward collision warning. 2. Conflict between one action and DVE conditions. Example: The driver enters a busy intersection. While negotiating the intersection, a phone call is received.
3. Conflict between multiple actions and DVE-conditions. Example: The driver enters a busy intersection. While negotiating the intersection, a phone call and meeting reminder from the PDA (Personal Digital Assistant) calendar application are received.
This way, the AIDE design scenarios target at illustrating conflict situations that the AIDE system is intended to solve. A potential conflict could refer to messages occurring simultaneously and either demanding the same modality or having different priorities. Potential conflict could also refer to messages initiated in a “bad” or “difficult” DVE condition. In that case, a potential solution would be to adjust its outputs according to the current DVE state. Thus, a conflict within AIDE occurs either between concurrent actions or between actions and DVE conditions. […] It is obvious that integrating IVIS and ADAS together in a system basing HMI decisions capabilities based on in monitoring the driver and the environment poses new challenges for the evaluation methodology. While most of the common metrics have been used to evaluate single functionalities the goal for this task was to set up a methodology that is capable of handling the evaluation of such complex demonstrator vehicles as in AIDE. However, some earlier attempts have been made to evaluate comparable functionalities, e.g. COMMUNICAR. The results of this project showed that it was the easiest to find a benefit in the subjective workload data. It was much more complicated to prove the benefit in the objective data, because it is very difficult to find the appropriate metrics for events that only seldom occur. As some of the basic methodological difficulties of the COMMUNICAR project remain the same to evaluate the AIDE demonstrators it was very important for the metrics developed within AIDE to prove their suitability for evaluating meta-functions and design scenarios. However, many lessons have been learned from the COMMUNICAR methodology and many tools have been advanced to suit the AIDE purposes.

AIDE Deliverable 2.1.4 Dissemination level PU Contract N. IST-1-507674-IP (public summary)
21/10/2008 5
[…]

AIDE Deliverable 2.1.4 Dissemination level PU Contract N. IST-1-507674-IP (public summary)
21/10/2008 6
5 The Cookbook: Recommendations and Specifications of a final test regime
5.1 Aim The aim of this chapter is to provide a detailed guide that allows to develop and apply an evaluation methodology with end-users of integrated as well as non-integrated ADA / IVI Systems. All the results of the research carried out within AIDE SP2 are used here to create a practical instrument for Human Factor experts to develop an evaluation methodology able to maximize the different types of validity and the reliability. This methodology should follow specific steps and it should be used to define the evaluation procedure of AIDE final demonstrators in WP2.4 (Prototype evaluation). However this chapter wants to be a handbook as general as possible to be applied also in other contexts and situations not directly linked to AIDE project.
5.2 Cookbook context During AIDE project the design and the development of the final adaptive system has always followed the User-Centred Design (UCD). Following this approach (see D 2.1.1, chapter 2.1 for a detailed description) means to focus on needs, wants, and limitations of the end user in each step of the design process. The international standard that deals with this general design philosophy1 is the “ISO 13407:1999 Human-centred design processes for interactive systems.” This standard defines a general process to include human-centred activities throughout a development life-cycle, but does not specify exact methods. In this model, once the need of applying a human centred design process has been identified, four activities form the main cycle of work:
1. Specify the context of use: Identify people who will use the product, what they will use it for, and in which conditions they will use it.
2. Specify requirements: Identify any business requirements or user goals that must be achieved for the product to be successful.
3. Create design solutions: This part of the process may be done in stages, starting from a rough concept to a complete design.
4. Evaluate designs. The most important part of this process is that evaluation - ideally through usability testing with actual users - is an integral part of the human centred design.
The process ends - and the product can be released - once the requirements are achieved
1 We use the term design philosophy to refer to User-Centred Design (UCD) as defined in Wikipedia, http://en.wikipedia.org/wiki/User-centered_design).
AIDE Deliverable 2.1.4 Dissemination level PU Contract N. IST-1-507674-IP (public summary)
21/10/2008 7
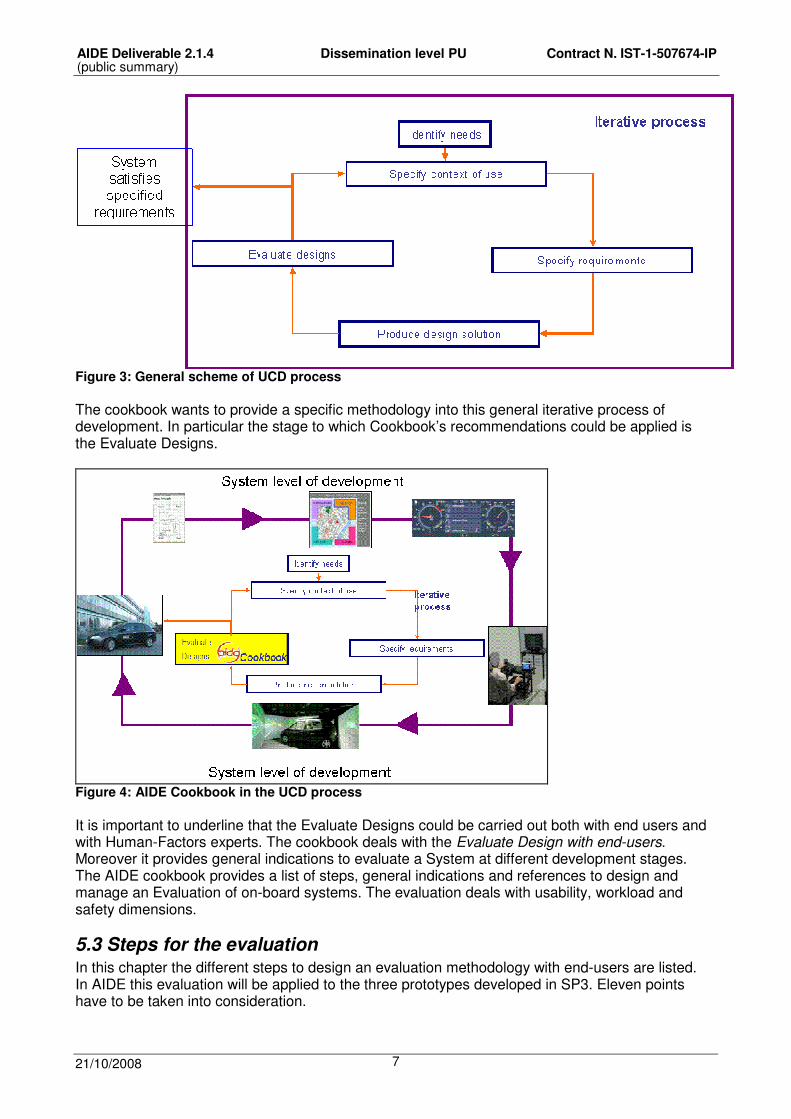
Figure 3: General scheme of UCD process The cookbook wants to provide a specific methodology into this general iterative process of development. In particular the stage to which Cookbook’s recommendations could be applied is the Evaluate Designs.
Figure 4: AIDE Cookbook in the UCD process It is important to underline that the Evaluate Designs could be carried out both with end users and with Human-Factors experts. The cookbook deals with the Evaluate Design with end-users. Moreover it provides general indications to evaluate a System at different development stages. The AIDE cookbook provides a list of steps, general indications and references to design and manage an Evaluation of on-board systems. The evaluation deals with usability, workload and safety dimensions.
5.3 Steps for the evaluation In this chapter the different steps to design an evaluation methodology with end-users are listed. In AIDE this evaluation will be applied to the three prototypes developed in SP3. Eleven points have to be taken into consideration.

AIDE Deliverable 2.1.4 Dissemination level PU Contract N. IST-1-507674-IP (public summary)
21/10/2008 8
1. To define the aims of the evaluation. 2. To describe the system to be evaluated. 3. To define a scenario. 4. To define the subject sample. 5. To define subjective and objective parameters and instruments to collect them. 6. To define the experimental design. 7. To develop experimental instruction both for participants and for experimenters. 8. To finalize the experimental set-up. 9. To carry out the experiment. 10. To analyse the collected data. 11. To produce summary indications about the system.
To carry out an evaluation of any on-board system integrated and non- integrated with end-users is very important to consider accurately each point described above. The steps have to be followed in the previous order proposed. The next chapters will describe in detail each step on the basis of specific situations Human Factors Experts have to investigate. In particular, the aims of the evaluation could be different. For example, the usability, the workload or the acceptability of a system could be evaluated. Moreover the system under investigation can have different levels of development. Section 5.3.1, provides a summarizing table that allows choosing the best parameters which can be evaluated on the basis of available different systems. Once decided on the typology of evaluation to be carried out it is important to describe the system in a complete way. Section 5.3.2 explains how to do this. The following chapters provide general indications and specific links to literature to prepare the most suitable experiment, considering all the important dimensions:
• scenario; • sample typology (both size and sample typology); • experimental design; • subjective and objective parameters to consider.
Once the experiment is defined the steps to prepare the test leaders and the general setting of the trial need to be described (see sections 5.4.7 and 5.4.8). Some general indications are provided in the following chapters to analyse data and to provide summarizing results.
5.4 Operative specifications
5.4.1 Define the aims of the evaluation and describe the system to be evaluated A system can be evaluated from different points of view. It is possible to carry out an:
- Usability evaluation (short term): investigation of the “successful” USE of a system, the misuse
of a system, the easiness of use and the satisfaction during interaction. - Usability evaluation (long term) after long-term exposure to a particular system: Investigation of
the “successful” USE of a system, the misuse of a system, its learning curve, the easiness of use and the satisfaction during interaction.
- Workload and safety evaluation (short term): investigation of the impact of the system on driving.
- Workload and safety evaluation (long term) after long-term exposure to a particular system: investigation of the impact of the system on driving behaviour when learning phase is ended.
- Acceptability evaluation (short term): investigation of the system acceptability in terms of social acceptability and practical acceptability (usefulness, cost, compatibility, reliability).
- Acceptability evaluation (long term) after long-term exposure to a particular system: investigation of the system acceptability in terms of social acceptability and practical acceptability (usefulness, cost, compatibility, reliability).

AIDE Deliverable 2.1.4 Dissemination level PU Contract N. IST-1-507674-IP (public summary)
21/10/2008 9
Table 1 indicates, for each Evaluation typology and short/long term condition, the best prototype to use in order to evaluate the system, both for IVI and ADA Systems. The table also contains information regarding dimensions that can be explored with the prototype, as well as possible issues when using that type of prototype (highlighted in green).
An example of usage of Table 1 is as follows: 1. Choose the Evaluation typology or typologies (you can decide to carry out more than one type
of evaluation); 2. Choose whether to make a short or long term evaluation for each typology chosen; 3. Select the suitable level of development of the system. Remember it is necessary to choose at
least the suitable solutions for each Evaluation typology chosen in step 2. For example, for a long-term usability and workload and safety evaluation, choose the development level that is at least suitable for one evaluation and preferable for the other. For instance, the On-board prototype respects these indications for the given evaluation typologies.
4. When evaluating an integrated IVI + ADA system, choose a prototype which presents a level of suitability of at least “Suitable” for both IVIS and ADAS aspects.

AIDE Deliverable 2.1.4 Contract N. IST-1-507674-IP
January 2008 10
Table 1: Matrix – level of system development vs. Aim of evaluation

AIDE Deliverable 2.1.4 Contract N. IST-1-507674-IP
January 2008
11
5.4.2 To describe the system to be evaluated It is fundamental to have an exhaustive description of the system under evaluation. In particular it is important to consider three aspects: 1) Level of integration (IVIS, ADAS or integrated). With the term “integrated”, we mean an on-board system with both IVI and ADA functions working cooperatively. 2) Level of development of the system (e.g. a bench prototype (simulated on a PC computer or with its own display and junction box), a simulated prototype, an on-board prototype or a final on-board system already on the market). 3) Functions of the system (e.g. an infotainment system, a frontal collision warning, an integrated system with radio, navigator, blind spot and lane keeping). It is recommended to apply the procedure to obtain this ‘deep’ description like that developed in the Response-3 project, as part of the Code of Practice it has produced. The procedure they developed was an extensive checklist for the following topics:
• what level of driving task does the system support • is it a warning or intervening systems • is it an assisting or intervening systems • who are system users • which vehicle will use the system • functional description of system • what are the user requirements and expectations • what are the limits of the systems • What does the Human Machine Interaction looks like • what kind of feedback does the system give
A more detailed description is given in “Code of Practice for the Design and Evaluation of ADAS” of the Response 3 project.2
5.4.3 To define a scenario A crucial aspect for evaluation is the selection of appropriate scenarios. The point of scenario selection is important, because good evaluation scenarios are one key aspect for the generalization of results beyond the borders of the evaluation experiment (others include selection of participants, selection of metrics; see other paragraphs of this deliverable). This point becomes even more important if one realizes that the amounts of conceivable situations in which an ADAS and/or IVIS are used are numerous while time for evaluation is restricted. The basis for scenario selection is coming from AIDE Deliverable 2.1.3 Considerations on Test Scenarios. In this deliverable accounts for many of the open questions on how to choose a scenario and what scenario. A means to facilitate the selection is the so called “Relevance Table” of Scenario Building blocks (see Table). This table has been developed in an iterative refinement process based on the ADAS/IVIS characterization of Task 2.1.2. Experts in the field of evaluation have proposed different scenario building blocks that have been revised through a series of review processes. As can be seen from the Table 9 the rows define the main categories of possible scenarios, like: 2 October 2008: Internet link is http://www.prevent-ip.org/en/public_documents/deliverables/d112_code_of_practice_for_the_design_and_evaluation_of_adas.htm

AIDE Deliverable 2.1.4 Contract N. IST-1-507674-IP
January 2008
12
• Road type & conditions, visibility • Traffic type and actors • Tasks and goals. •
While the first category addresses the more “static” parts of the environment, the second describes the more “dynamic” driver vehicle environment. The third main category subsumes a variety of actions and tasks that can occur while driving. As an example for the first main category (Road type & conditions, visibility) the following subcategories can be found in Table 8.
• Type of road: city roads • Type of road: highways (a maximum of 2 lanes) • Type of road: motorways (Interstate or “Autobahn”) • Type of road: rural • Road conditions • Visibility conditions • Weather conditions
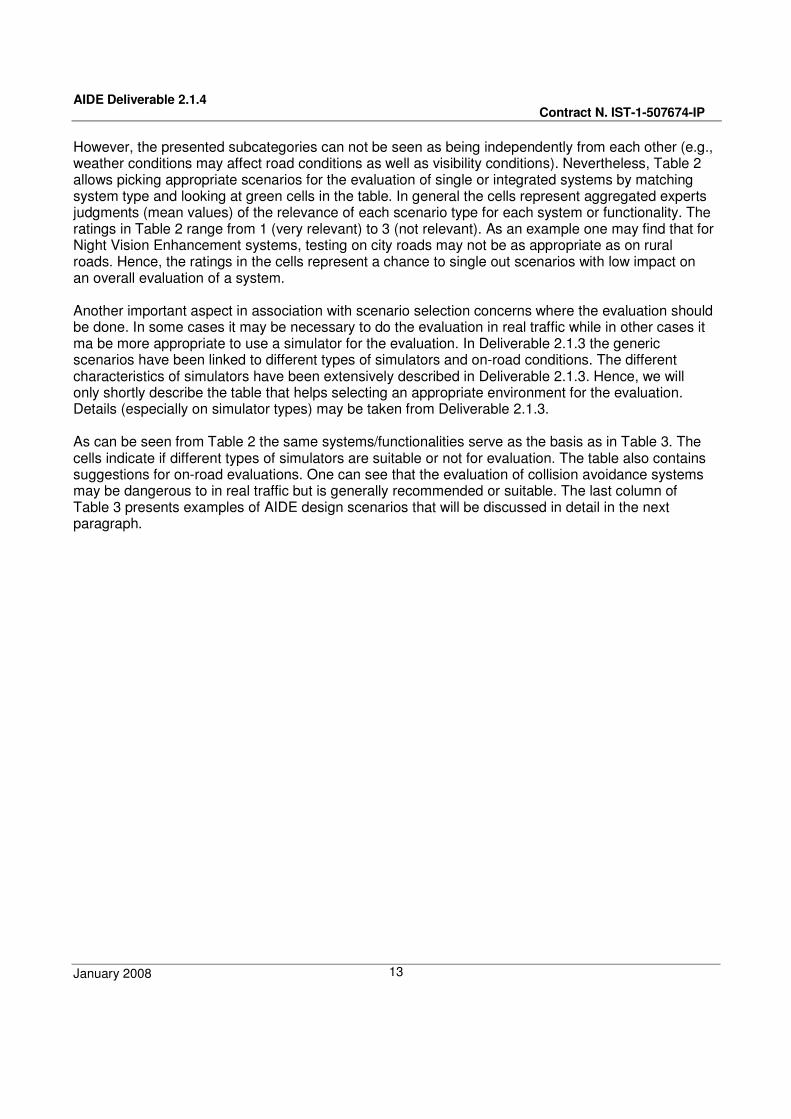
Table 2 - Matrix functions presented in the system vs. Scenario building blocks.
Note: 1 indicates “most/very relevant”, 2 is “somehow relevant” and 3 “not relevant”
General means in the ratings
Road type & conditions, visibility Traffic type and actors Tasks and goals
Possible Scenarios
Type
of r
oad:
city
roa
ds
Type
of r
oad:
hig
hway
s
Type
of r
oad:
mot
orw
ays
Type
of r
oad:
rur
al
Roa
d co
nditi
ons
Vis
ibilt
y co
nditi
ons
Wea
ther
con
ditio
ns
Traf
fic in
the
sam
e di
rect
ion
Onc
omin
g tr
affic
Cro
ssin
g tr
affic
Ped
estr
ians
Pla
toon
dri
ving
Car
follo
win
g
Lane
Cha
nge
Task
(LC
T)
Ove
rtak
ing
man
oeuv
res
Dis
trac
tion
task
Obj
ect a
nd e
vent
det
ectio
n ou
tsid
e th
e ca
r
Use
of m
irro
rs
IVIS:Navigation Systems 1,5 2 2,5 2,5 2 3 3 3 3 3 2 3 3 3 3 2 2 3
Travelling/Traffic Related Information Systems 2 2 2 2 2 2,5 2,5 2 2 2,5 2 2 2 2 2 2 3 2
Vehicle Communication Systems 1 2 3 1 2 2 2 2,5 2 2,5 2 3 2 2 2 2 3 2
Driver Convenience Systems 1 1 1 1 2 2 2 2 2,5 2 2 2 2 2 2 2 2,5 2
ADAS:Lateral Control 2 1 1 1 1 2 2 3 2 3 3 2 1 1 1 2 1 2
Lane Keeping and warning 2 1 1 1 1,5 2 2,5 2 2 2 2 2,5 1,5 2 2 1,5 2,5 2
Blind spot monitoring 2 2 2 2 3 1,5 2 1,5 2 1,5 2 3 1,5 1 1,5 2 2 1
Lane change and merge collision avoidance 2 1 2 1 2 2 2 2 2 1 2,5 2,5 2,5 1,5 2,5 1,5 1,5 2
Longitudinal Control 2,5 2 2 2 3 2 2 1 2 2 2 3 1,5 2 3 2 1,5 2
Intelligent Speed Adaptation 1 1 2 1 2 1 2,5 2 3 1,5 1 2,5 3 2 1 2 2 2
Road Low Friction Warning Systems 1 2 1 1 2 2,5 2 3 2 2,5 1 2 1 2 1 2 2 1
Reversing/Parking Aid 1 3 3 3 3 1 3 3 3 3 2 3 3 3 3 3 1 1
Vision Enhancement 3 2 2 1 2 1 1 2 2 2 1 3 2 3 3 2 1 3
Driver Monitoring 3 1 1 1 3 2 3 2 2 3 3 2 2 3 3 3 2 3
Pre-Crash Systems 2 1 1 1 2 1 1 1 1 1 1 2 1 3 3 2 1 3
Vulnerable Road Users Protection Systems 1 2 3 1 3 1 1 2 2 2 1 3 3 3 3 1 1 1
AIDE Deliverable 2.1.4 Contract N. IST-1-507674-IP
January 2008
13
However, the presented subcategories can not be seen as being independently from each other (e.g., weather conditions may affect road conditions as well as visibility conditions). Nevertheless, Table 2 allows picking appropriate scenarios for the evaluation of single or integrated systems by matching system type and looking at green cells in the table. In general the cells represent aggregated experts judgments (mean values) of the relevance of each scenario type for each system or functionality. The ratings in Table 2 range from 1 (very relevant) to 3 (not relevant). As an example one may find that for Night Vision Enhancement systems, testing on city roads may not be as appropriate as on rural roads. Hence, the ratings in the cells represent a chance to single out scenarios with low impact on an overall evaluation of a system. Another important aspect in association with scenario selection concerns where the evaluation should be done. In some cases it may be necessary to do the evaluation in real traffic while in other cases it ma be more appropriate to use a simulator for the evaluation. In Deliverable 2.1.3 the generic scenarios have been linked to different types of simulators and on-road conditions. The different characteristics of simulators have been extensively described in Deliverable 2.1.3. Hence, we will only shortly describe the table that helps selecting an appropriate environment for the evaluation. Details (especially on simulator types) may be taken from Deliverable 2.1.3. As can be seen from Table 2 the same systems/functionalities serve as the basis as in Table 3. The cells indicate if different types of simulators are suitable or not for evaluation. The table also contains suggestions for on-road evaluations. One can see that the evaluation of collision avoidance systems may be dangerous to in real traffic but is generally recommended or suitable. The last column of Table 3 presents examples of AIDE design scenarios that will be discussed in detail in the next paragraph.

AIDE Deliverable 2.1.4 Contract N. IST-1-507674-IP
January 2008
14
Table 3: Suggested simulator category and AIDE design scenario for each ADAS/IVIS
Legend for the simulator: Legend for the road: NS = not suitable (red field) S = suitable LS = less suitable (orange field) D = dangerous S = suitable (pale green field) E = expensive P = preferable (bright green field) T = test track OD = over-dimensioned (blue field)
Vehicle on the road
Examples of AIDE driving scenarios
A B C D E F G IVIS:
Navigation Systems LS S P S OD S 1.5 or 2.1 Travelling/Traffic Related Information Systems LS S P S OD S 1.7 or 2.2 Vehicle Communication Systems LS S P S OD E 1.3 or 1.4 Driver Convenience Systems S S P S OD S (evtl. D) 1.2 or 1.6 ADAS: Lateral Control S (evtl. D) 3.3 Lane Keeping and warning LS S P S OD S (evtl. D) 3.3 Blind spot monitoring NS NS S P S S (evtl. D) 3.3 Lane change and merge collision avoidance NS NS LS P S D 3.3 Longitudinal Control S S S P S S 3.3 Intelligent Speed Adaptation NS S P OD OD S 3.3 Road Low Friction Warning Systems NS NS LS P S T (S) 3.3 Reversing/Parking Aid LS S S S S P S 3.3 Vision Enhancement NS NS LS LS LS S, T 3.1 Driver Monitoring NS NS P S OD D, T 2.3 or 2.4 Pre-Crash Systems NS NS NS LS S S D, T 1.1 Vulnerable Road Users Protection Systems LS LS LS LS LS S S D, T 3.3
Scalability over types of simulators
The detailed description of the different types of simulator are provided in Aide D 2.1.3 (Rimini-Döring et al.,2005). To conclude, the steps for scenario selections should be: 1) Check what systems and/or functionalities are implemented in the prototype you want to evaluate. 2) Check which scenarios in Table 8 are marked by a green cell (or received a rating of 1 for high
relevance). 3) Adjust scenario to the specific characteristics of your systems/functionalities. 4) If there are too many scenarios left for your first evaluation step, try to prioritize scenarios together
with experts (experts should include evaluation experts as well as system experts). 5) Select a specific type of simulator that is appropriate for your evaluation or go for on road testing.
Legend for the scalability of the simulators: A = Low-level system B= Static or semi-dynamic simple driving simulator C= Fixed driving simulator D= Dynamic driving simulator E= Advanced driving simulator F= Head-Mounted-Device (HMD) simulator G = CAVE© simulator

AIDE Deliverable 2.1.4 Contract N. IST-1-507674-IP
January 2008
15
It has to be mentioned, that step 3 is very crucial for the success of an experiment. However, no general framework can be given for adjusting the generic scenarios presented in Table 3 according to each specific evaluation question, as each system and functionality may differ in many ways from other occurrences of the “same” system or functionality. However, in most instances it is quite easy to adjust the generic scenarios to specific cases, because the system design obviously asks for those specific adjustments. While simulator experiments may be safer and easier to design/analyze, there may be still a need to test functionality or system on real roads (e.g., because driving simulators generally show relative validity). In this case some precautions have to be taken into account to come up with a sound experimental design. These precautions can be summarized as following:
1. Route selection on real roads. Contrary to driving simulator experiments one has to make sure that the route conditions are mainly the same for all participants. This may not be entirely possible (contrary to driving simulation), as weather conditions and traffic conditions change over time. However one should take care to use the same route for all participants and record additional variables that may co-vary with the dependent variables (e.g. time of day or traffic density). A task analysis should also be carried out to define the complexity of the driving task and the traffic environment. In a simulator experiment it is much easier to define road curvatures, traffic density and other variables of the traffic environment. This may not hold completely true for experiments on real roads. Therefore it may be helpful to do task analysis that allows comparing nominal vs. actual behaviour and taking into account the complexity of specific traffic conditions. One good example of this methodological approach can be found in Fastenmeier and Gstalter (2006). Following the recommendations of such a task analysis one may easily come up with appropriate routes for the research question at hand. In general it should be noted that all unwanted variations are kept to minimum.
2. Controllability of events. While driving simulation experiments can be seen as very
standardized experiments one should take care that all relevant events can be addressed on real roads. It has to be ensured that as many as possible complete data sets are gathered. If there are too many missing data statistical problems concerning generalizations of results may arise (e.g. possibly all of those who missed one critical situation may have reacted differently than those for whom you have the data). This also means that an experimenter has to keep in mind that the length of the experiment does not vary too much (e.g. some participants face fatigue while others do not).
3. Safety. While traffic simulator studies ensure that there is no safety risk for the participants
experiments on real roads are quite different. Therefore, one has to take care that the experiment, situations and functionalities can be stopped easily. It is also helpful to carry out safety and controllability analysis for your systems and functionalities before starting with the experiment (See section 5.4.4).
5.4.3.1 How to come up with Use Cases (conflict Scenarios) for integrated systems After selecting general scenarios as described in the paragraph above, there are some important issues left in the evaluation of an integrated system like the AIDE system. Within AIDE there has been done a lot of specification work to define possible conflict situations that should be resolved by the AIDE system. These conflict scenarios are called AIDE design scenarios. The design scenarios represent an exhaustive set of potential conflicts that may arise due to the integration of multiple functions, within AIDE mainly IVIS and ADAS. An example of a potential conflict could be the need of

AIDE Deliverable 2.1.4 Contract N. IST-1-507674-IP
January 2008
16
the driver to react to multiple output messages from different systems while s/he is in a complex traffic situation. These kind of potential conflict scenarios have been described within AIDE in a formal way that allows categorizing conflicts that are due to concurrent actions (e.g. multiple output messages) or due to actions and the so called DVE conditions (Driver-vehicle environment, e.g. complex traffic situations). While in AIDE all meaningful combinations of actions and DVE conditions have been described in Deliverable 3.2.1 we will shortly present the formal approach of AIDE, because it can be used for the description of other integrated systems. Such formal descriptions provide the evaluator with so called use cases that can be directly linked with the general scenarios described above to set up an evaluation experiment. A use case can be seen as a task a participant is exposed to in an experimental evaluation. The sum of such use cases should then cover the intended use of the system that covers all the main aspects of it. Table 4: Formal description of AIDE design scenarios
AIDE design scenario An application action or a combination of application actions is/are initiated/in progress in a single or complex DVE condition Ci. Flow of events This field is intended to quantify the precise nature of the conflict. If there are several possible flows of events leading to the conflict, they are described separately. Action/s = {…} Condition/s = {…} Example : …
Table 5 gives an example from AIDE how this approach is used to describe formally a scenario that can directly be used as a use case for evaluation. Table 5: AIDE approach – design scenario example
AIDE design scenario 3.3: Conflict between a driver initiated action and a warning in critical driving situation Action/s = {D+W}, where D = User-initiated actions (dialogs or inputs) W = Warning indicating high traffic risk DVE Condition/s: DVE1-4=LOW/NO, Traffic/Environment Risk(DVE5)=LOW&HIGH Flow of events 1. Traffic/Environment Risk turns from LOW to HIGH 2. Driver starts executing D 3. W is initiated 4. Traffic/environment Risk turns from HIGH to LOW Possible AIDE solutions(*) Delaying of D until W has caused a DVE5 – transition to LOW. Example: Conflict scenario: The driver is in the middle of a phone call conversation while he drives on the highway. He/she drifts out of the lane while an approaching vehicle is detected from the blind spot camera. Possible solution: D is paused/interrupted while the warning is issued. When the corrective action of the driver has reset DVE5 to LOW, D is recovered.

AIDE Deliverable 2.1.4 Contract N. IST-1-507674-IP
January 2008
17
For the evaluation of integrated systems, such formal descriptions should always be the basis of the evaluation. One can then easily compare if the intended solution of a conflict scenario has a positive effect on the chosen evaluation metrics compared to a condition where no such integrated solution is existing. The evaluation should show in a baseline condition that there is a conflict that can be measured in terms of driving behaviour or subjective ratings (e.g. mental workload) that is resolved by the system and is shown in the experimental condition. If no positive effect (or negative in the baseline) exists one should first rethink the conflict scenarios before trying to adapt the system and/or functionalities. Hence, such descriptions provide directly baseline as well as experimental conditions and can be seen as the core of the evaluation. To summarize, for the evaluation of the AIDE system it is important for each demonstrator to evaluate the AIDE design scenarios in terms of specific Use Cases that are the basis for the baseline and experimental conditions. In the following we will shortly present the exhaustive list of the possible AIDE design scenarios (for details please consult AIDE Deliverable 3.2.1). Table 6: Conflicts categories Conflicts between concurrent actions (category 1) AIDE design scenario 1.1: Conflict between concurrent warnings (ADAS with at least 2 warning
outputs or warnings from 2 different ADAS) AIDE design scenario 1.2: Conflict between warning and driver initiated action (ADAS/IVIS) AIDE design scenario 1.3: Conflict between warning and output message (ADAS/IVIS) AIDE design scenario 1.4: Conflict between a driver-initiated action and an important output message
(OP1) (IVIS/IVIS) AIDE design scenario 1.5: Conflict between a driver-initiated action and an output message (OPi,i>1)
(IVIS/IVIS) AIDE design scenario 1.6: Conflict between two output messages (IVIS/IVIS) Conflicts between one action and DVE conditions (category 2) AIDE design scenario 2.1: An output message is initiated in a demanding driving situation (IVIS +
DrivingDemand [DDE and/or similar indicators]) AIDE design scenario 2.2:
An important output message (OP1) is given while driver is distracted. (IVIS + DriverDistraction [CAA or DSD])
AIDE design scenario 2.3:
An important output message (OP1) is given while driver is tired and drives during night. (IVIS + DriverFatigue [DSD])
AIDE design scenario 2.4: Warning is given while driver is distracted (ADAS [Lat, Lon, VE, ISA, DM, PCS, VRU, RLF] + DriverDistraction [CAA or DSD]
Conflicts between multiple actions and DVE conditions (category 3) AIDE design scenario 3.1: Multiple output messages (OPi, i>1) are presented in a demanding situation
(IVIS + DrivingDemand [DDE and/or similar indicators]) AIDE design scenario 3.2: Multiple important output messages (OP1) are presented in a demanding
situation (IVIS + DrivingDemand [DDE and/or similar indicators]) AIDE design scenario 3.3: Conflict between a driver initiated action and a warning in critical driving
situation (HighTrafficRisk [Lat, Lon, ISA, VE, DM, PCS, VRU, RLF] +IVIS) AIDE design scenario 3.4:
Conflict between a driver-initiated action and an important output message (OP1) in a demanding situation (IVIS + DrivingDemand [DDE & above])
AIDE design scenario 3.5: Conflict between concurrent warnings (ACC, LDW) when driver’s intention to perform a maneuver is detected (ADAS + DrivingDemand [DDE & above])
Note: The blue italics refer to the systems addressed in each scenario. However, it is obvious, that for the final evaluation one has to check if all design scenarios are available in the demonstrator. Further, due to restricted time it may be necessary to select scenarios according to their hypothesised contribution to reduce traffic risk or any other criteria that may be in
AIDE Deliverable 2.1.4 Contract N. IST-1-507674-IP
January 2008
18
the focus of the evaluation study. To select Use Cases the following criteria may help to prioritize Use Cases (Conflict Scenarios) from a possible vast amount.
1. Generate a list of all possible Use cases from the whole functionality of the system(s) (see above).
2. Assign expert ratings (high-low) on: • User needs • Safety criticality/Controllability by User • Frequency of Use • General Impact on Driving Behaviour • General Impact on Traffic behaviour
3. Select first those Use Cases for evaluation that have been rated high on all dimensions given in 2.
4. Check if the amount of Use Cases is appropriate for a timed experiment (e.g. lengthy simulator experiments may increase the danger of simulator sickness). If there are still to many Use Cases start again with expert ratings on the reduced set from 2).
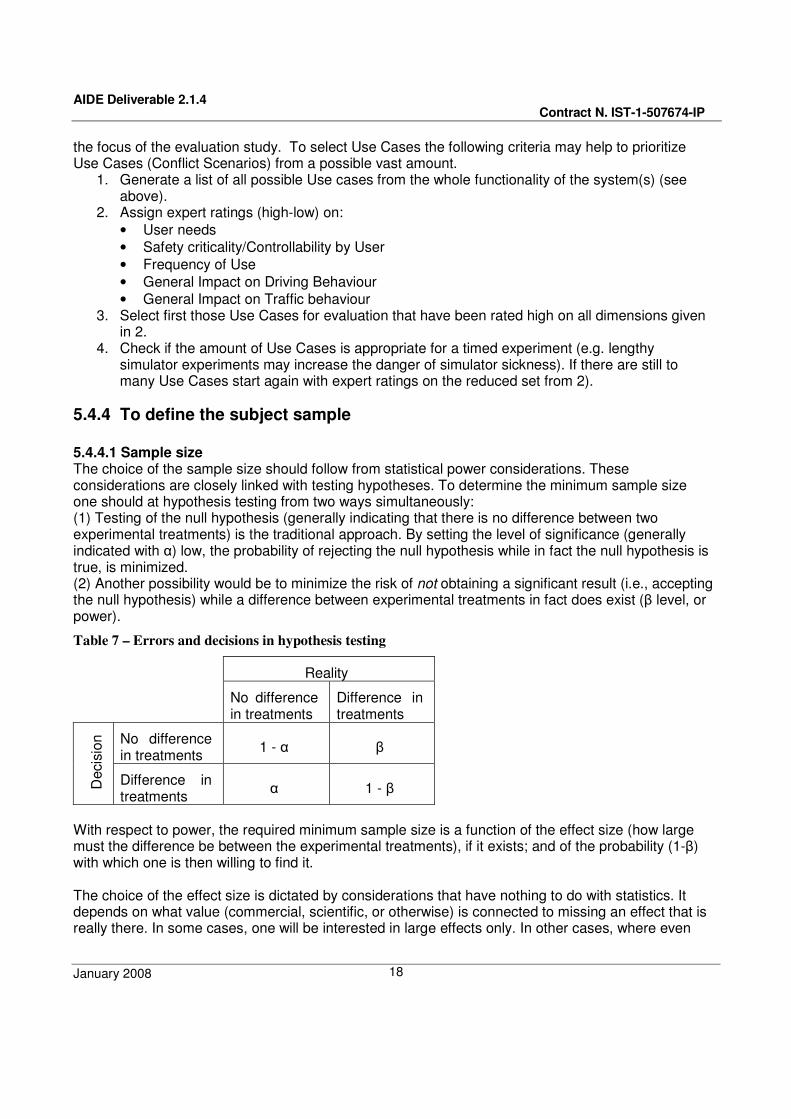
5.4.4 To define the subject sample 5.4.4.1 Sample size The choice of the sample size should follow from statistical power considerations. These considerations are closely linked with testing hypotheses. To determine the minimum sample size one should at hypothesis testing from two ways simultaneously: (1) Testing of the null hypothesis (generally indicating that there is no difference between two experimental treatments) is the traditional approach. By setting the level of significance (generally indicated with �) low, the probability of rejecting the null hypothesis while in fact the null hypothesis is true, is minimized. (2) Another possibility would be to minimize the risk of not obtaining a significant result (i.e., accepting the null hypothesis) while a difference between experimental treatments in fact does exist (� level, or power).
Table 7 – Errors and decisions in hypothesis testing
With respect to power, the required minimum sample size is a function of the effect size (how large must the difference be between the experimental treatments), if it exists; and of the probability (1-�) with which one is then willing to find it. The choice of the effect size is dictated by considerations that have nothing to do with statistics. It depends on what value (commercial, scientific, or otherwise) is connected to missing an effect that is really there. In some cases, one will be interested in large effects only. In other cases, where even
Reality
No difference in treatments
Difference in treatments
No difference in treatments 1 - � �
Dec
isio
n
Difference in treatments � 1 - �

AIDE Deliverable 2.1.4 Contract N. IST-1-507674-IP
January 2008
19
small differences may cost, for example, considerable sums of money, one would be mainly interested in finding even small effects. The same is true of the probability level with which one is satisfied to find or miss a real effect: cost-benefit considerations, in the widest sense of the word, are dominant here. Textbooks can be consulted to select the appropriate number of subjects etc. for all possible (combinations of) � and � choices, as can the most popular statistical packages that are commercially available. The commonly applied levels of the above described variables (size effect, power, significance level) are:
• A medium-sized effect, i.e., of 0.30 standardized units difference between two experimental treatments
• A probability (power) 1-� of 80% of detecting an effect size of that magnitude if it exists in the populations
• An alpha level (significance) of � = 5%, one-sided Using these values it follows from available tables (e.g., Cohen, 1988) that one should have a sample of at least 18 subjects in a within-subjects condition and of at least 26 subjects in a between-subjects condition. In practice, if the experiment has even a single between-subjects variable, like in a mixed design, that means that a minimum of 26 subjects should be use per between-subjects condition. Of course other values for power calculations can be chosen. And as stated there can be valid considerations for doing so. The values used here to obtain the number of subjects are generally accepted values. As said, however, it is in the last instance the experimenters’ choice to decide what effect size is of interest and, in particular, what risk is acceptable not to find an effect. 5.4.4.2 Composition of samples One may have reasons to define subgroups of subjects, according to age, experience, etc. It should be stressed, however, that the only good reason to make a subdivision is if an interaction is expected between some system property and some user characteristic. For example, if readability of lettering on a display is non-optimal one could expect elderly users to suffer from that in particular, which could then be a reason to introduce age as a subdivision. It goes without saying that subdivision of a sample has its price in the statistical sense: with each subdivision the experimental design doubles or triples, in terms of subject numbers, given that one wants to maintain the statistical power for testing the effects of each independent variable. Thus, a realistic test is impossible to do by subdividing the original group of subjects into two, e.g., according to age. To minimize the effect of being used to a particular type of vehicle it is important to recruit people that usually drive cars of the same segment involved in the trials. For example if the AIDE car is a luxury car, people have to usually drive a luxury car. If experience with the driving is chosen as an independent variable it is very important to create group of participants with a homogeneous level of driving skill. Concerning the importance to have control also on the level of ability to use the system under evaluation it is important, during the selection of the sample, to control also the experience with-infotainment system and ADA system.

AIDE Deliverable 2.1.4 Contract N. IST-1-507674-IP
January 2008
20
5.4.4.3 Ethical and safety issues When performing an evaluation one should also consider ethical and safety issues. This is especially of importance for on the road tests. In those tests drivers can be asked to perform tasks that do not relate to driving or drivers could be in a certain state that safe driving is not always ensured (e.g., drowsiness research). Consequently situations may occur that are dangerous to the driver and to other persons in the vehicle. In these examples there should be a second person in the car capable of intervening if needed. The above mentioned examples are quite obvious and relate directly to the experiment. However in driving simulator experiments there may certainly also ethical and safety issues involved. For example when investigating the effect of drugs or alcohol on driving quite often a driving simulator is used. However, after the experiment the driver may still be under the influence of alcohol/drugs. Therefore some precautions will be needed in this case. Sometimes ethical and safety issues will not arise and sometimes they will be quite clear. Anyway if they are there they should be dealt with. Safety issues for, for example, on the road studies can to some extent be easily be dealt with by installing a double peddle command (minimally a braking pedal) and have a certified driving instructor involved in the experiment. Consensus forms to be signed by the participants are also a must. These forms should also indicate that participants may stop the evaluation whenever they want to. Also one should check how and if participants are insured. In general the message is that when performing an evaluation one should consider ethical and safety issues. If they apply they should be dealt with. Guidelines for this have been developed in the HUMANISt NoE, (see, Hanzlikova, 2005).
5.4.5 To define subjective and objective parameters The AIDE methodology comprises:
• a minimum set of mandatory parameters • a non-minimum set, i.e., that is not mandatory, but for which there are prescriptions in case
one wants to include them Technical prescriptions are to be found in the separate underlying AIDE WP 2.2 Deliverables. 5.4.5.1 The minimum set for workload and driving performance Objective parameters In the following, the minimum set of parameters, split in objective and subjective ones, will be presented. Objective parameters refer to the measurement of driving performance or measurement of the driver interaction with the on-board systems. These parameters use metrics related to the effective behaviour of the user-vehicle system. Such parameters are usually collected through a data logging system.
Subjective parameters refer to the user evaluation of the driving performance and system interaction in which the user is involved. It is an evaluation related to personal attitudes and opinions. This kind of parameters is usually collected through questionnaires or interviews.

AIDE Deliverable 2.1.4 Contract N. IST-1-507674-IP
January 2008
21
Table 8: The selected subset of driving control metrics from 2.2.5 deliverable (Östlund, et al., 2005), the main behavioural effects that they are intended to quantify
Metric Behavioural effect Likely secondary task-related cause
Speed reduction Visual secondary task load Mean speed Large speed increase/reduction
Cognitive secondary task load
Maximum speed Large speed increase Cognitive secondary task load Mean lateral position
Changed position in the lane during visual load.
Visual secondary task load
Increased variation Visual secondary task load Modified lateral position variation
Reduced variation Cognitive secondary task load
Line crossings Increased frequency Visual secondary task load Increased frequency of medium-large reversals
Visual secondary task load Steering wheel reversal rate
Increased frequency of small reversals
Cognitive secondary task load
Increased headway Visual secondary task load Mean time headway Reduced headway Cognitive secondary task load
Min time headway
Reduced min headway
Cognitive secondary task load
Increased BRT Visual secondary task load Brake reaction time Increased BRT Cognitive secondary task load
Increased frequency Visual secondary task load Brake jerks Increased frequency Cognitive secondary task load
Detailed specifications, together with interpretation guidelines and descriptions of use of these driving control parameters, are provided in Chapter 7 of the D 2.2.5 (Östlund, et al., 2005). Some considerations are here provided:
• the SDLP is a weak metric as it is too linked to data length, so it is very important to follow the specifications proposed in D2.2.5 to calculate a modified lateral position variation;
• Steering wheel reversal rate is a very sensitive parameter and it is recommended to be used as specified in Chapter 7 of the D 2.2.5.
Subjective parameters The following questionnaires are recommended to measure workload from the point of view of user perception. Detailed information about DALI and RSME questionnaires are provided in D 2.2.6 (Chin, at al., 2006).
• DALI (abridged version can be used) • RSME • Driving performance (CRF questionnaire3)
3 For more details about CRF questionnaire see Annex I.

AIDE Deliverable 2.1.4 Contract N. IST-1-507674-IP
January 2008
22
5.4.5.2 The non-minimum set for workload and driving performance This set of parameters is also divided in objective and subjective set op parameters. Objective parameters
• Gaze parameters: the validity of gaze parameters, and of glance duration parameters in particular, is almost self-evident. In fact, it is to be considered as a major indicator for driver distraction, as it may be caused by an in-vehicle visual display that is a component of the system to be evaluated. For practical reasons we felt we could not make this tool mandatory for everybody, however if this measurement is not included, a significant loss in the accuracy of predicting risk effects will arise.4
• Tactile PDT: as for the gaze parameters. Moreover, there is some remaining concern about the interaction of PDT with other measures, i.e., PDT as a tertiary task to be performed in some conditions.
Subjective parameters Thinking aloud techniques as described in D 2.1.1 (Cherri et al. 2004) is a good way to capture subjective way to think, expectations, problems, frustrations of users during interaction with a system. The data analysis is a long process. For this reason one way to shorten the data analysis time, is to add open questions in the structured questionnaire. 5.4.5.3 The minimum set for acceptance and usability measures As clearly explained by Jacobs Nielsen (Nielsen, 1993) usability is not a sufficient dimension to understand if a system is good enough to satisfy all the needs of users. It is therefore important to consider also other aspects as, for example, acceptability. Nielsen defines acceptability as the issue which basically deals with the question “of whether the system is good enough to satisfy all the needs and requirements of the users and other potential stakeholders, such as the users’ clients and managers” (Nielsen, 1993). The concept is quite complex and the model presented in Figure 5 tries to show how the concept is linked with other important dimensions. When a device has to be put on the market these dimensions should be considered. The Nielsen model actually refers to computer systems, but it is possible to generalize this concept also to other complex products in which most part of interaction is entrusted not to physical aspects but to cognitive ones. The acceptability (see also D 2.1.1, paragraph 4.2) is split into social and practical dimension. The social dimension deals with the fact that a system is good or not from an ethical point of view. Normally all the on-board systems are socially acceptable. Another important aspect is the practical acceptability. Aspects as costs compatibility, reliability are very important but also the usefulness is an important issue not to underestimate. Usefulness is the issue of whether that system can be used to achieve desired goals. 4 Data processing to assess quality of gaze data was complex and required a long time. It consisted of two main parts: the first one was automated (i.e. implemented in the VDM tool software) and the second one was manual and required an expert operator. In the first part of data processing the VDM tool assessed quality by checking when gaze was properly tracked by the eye tracker and created and digital index of quality for each sample of gaze data. Further, the VDM tool provided an estimation of the center of the road, and divided the gaze data in 3 clusters.In the second part of data processing, an operator used VDM tool to plot all gaze data. By visually assessing 1) that quality from the VDM quality indicator was high, and 2) that center of road and clusters were consistent with the use case under consideration and complying with human eye movement kinematics, the operator could select a subset of the data where measurement errors were minimized. This subset of data was then analyzed with the VDM tool by calculating a few parameters such as the percentage of time in which gaze was directed to the road center (see D 2.2.2).

AIDE Deliverable 2.1.4 Contract N. IST-1-507674-IP
January 2008
23
Figure 5: a model of the attributes of system acceptability (Nielsen, 1993).
It can again be broken down into the two other categories of utility and usability. Utility is the question of whether the functionality of the system in principle can do what is needed.
On the other hand for usability we mean “the extent to which a product can be used by specified users to achieve specified goals with effectiveness, efficiency and satisfaction in a specified context of use” (see D2.1.1, paragraph 4.1 and Annex I, paragraph 16.3 of this document, for further details about this concept).
So it is recommended to take into consideration both practical acceptability and usability dimensions during the evaluation of a system. CRF questionnaire was developed during these years (since 2006 it was applied to different researches, refined with the aid of AIDE partners suggestions and applied during all 2007 trials and for the evaluation of the AIDE prototypes – see Annex 16.7 for more details) with the aim to measure these two subjective aspects. Subjective parameters Acceptability should be measured only with a large sample of participants.
With an experiment of forty participants, it is possible to obtain only a first idea about system acceptance. The CRF questionnaire should be use to collect these type of indications, in particular with the following sheets:
• Aesthetic of visual interface sheet, • Willingness sheet; • Car image sheet
Usability can also be measured with the CRF questionnaire, in particular with the following sheets:
• modality of use sheet • interfaces sheet
Moreover the thinking aloud technique has to be used in order to collect free comments from participants in real time. In order to collect them it is important to train participants (see section 5.4.7.1) and to prepare an open grid to facilitate the data recording.

AIDE Deliverable 2.1.4 Contract N. IST-1-507674-IP
January 2008
24
Objective parameters For usability the following objective parameters should be recorded, beyond driving performance parameters described in the table 12:
• Errors to accomplish the task during the interaction with the system should be recorded trough an observational grid.
• Time to accomplish tasks with the system (i.e. to answer to a phone call) should be recorded through log file.
5.4.6 To define the experimental design There are textbooks that treat matters of experimental design into exhaustive detail, so only the essentials will be given here. Within subjects Within-subject designs are designs in which one or more of the independent variables are within-subject variables, that is, that are manipulated by testing each subject at each level of the variables. Within-subjects designs are often called repeated-measures designs since within-subjects variables always involve taking repeated measurements from each subject. The principal advantages of this design are:
• equivalence among groups respect to different conditions, because all the subjects test all the conditions
• more sensibility to independent variable effects respect to between subject design. Within-subject designs reduce the variance error, because they remove a major cause of variability, that due to individual differences – hence they have intrinsically more power,
• the possibility to involve a smaller sample of subjects compared to a between subject design, because all the subjects test all the conditions (see the discussion on power, earlier in this Chapter)
• the possibility to administer instruction only once, because the same subjects test all the conditions
As the same set of participants is requested to carry out the different conditions it is very important to consider the learning and sequence effects. In a real-road test, to take under control these biases, it is fundamental the randomization of the different conditions among participants. Moreover, it is important to remember that the driving test trial should be equal for the different conditions. For example, in an on-road test trial, participants should drive long the same path with and without the system. This allows to test the impact of it on driving performance. In this way it is possible not to add confounding variables, as the typology of track. In fact the only different aspect between the conditions will be the presence and the absence of the system. In a driving-simulator test the learning effect can be taken under control also with the randomization, among participants, of the different parts of the track. See for an example of this type of experimental design the AIDE Deliverable 1.3.2 (Marchitto et al, 2004).

AIDE Deliverable 2.1.4 Contract N. IST-1-507674-IP
January 2008
25
Between subjects Between-subject variables are independent variables in which a different group of subjects is used for each level of the variable. If every variable in an experimental design is a between- subjects variable, then the design is called a between-subjects design. The principal advantages of this design are:
• it is possible to test different conditions without any effect of order and sequence; • it is possible to involve subjects in trials that do not last that long and that are therefore less
demanding
The disadvantages are: • There is a priori non- equivalence among groups as a result of existing individual differences,
so there is less control over error variance. • Subjective measures in particular are less robust as the individual variability plays a great role
to define the difference between experimental conditions. Mixed design Some experimental designs have both between- and within-subjects variables. 5.4.6.1 Integrated system experimental design For the final evaluation of adaptive systems a real road trial is strongly recommended. As shown in Table 9, the preferable situation in order to collect data concerning usability, workload and acceptability is the real road test. A simulator test can give comparable information of real road test concerning usability and workload. To obtain reliable information also about acceptability, users have to interact with a real prototype in a real driving context. In particular a within design with the following characteristics should be followed: Table 9: Characteristics of within design Within design Baseline condition (no system) Same >18 participants Non – integrated system condition (Non AIDE)
Same >18 participants
Integrated system condition (AIDE) Same >18 participants A ‘baseline’ measurement of unsupported driving is always required to estimate a system interaction in the present state of the world. In particular, an estimate of risk effects only makes sense if it can be related to this baseline condition (see Chapter 6). Baseline, non-Integrated system condition and Integrated-system condition have to be counterbalanced among participants to avoid sequence effect. The best solution should be to choose three different tracks with quite the same characteristics in order to compare the different scenario for each condition. As this is sometimes not practically feasible the counterbalancing can be a compromise to minimize the learning of the track. Some recommended practicalities with respect to conditions are:
� Each condition has to last not less than forty minutes and not more than an hour. � After one hour and half it is mandatory to have a break. � Before the beginning of the trials, all participants have to carry out a familiarization phase with
the demonstrator car they have to drive and, in general, with the new driving context. This phase has to last not less than 15 -20 minutes. This time has been fixed on the basis of a

AIDE Deliverable 2.1.4 Contract N. IST-1-507674-IP
January 2008
26
general agreement among partners. Usually after 20 minutes drivers with normal driving abilities reach an acceptable level of driving skill.
� All participants have to reach the same level of skill with the new vehicle both with primary and auxiliary driving controls.
� During this part of the trial the following tasks have to be accomplished: o in case of manual gear: participants have to insert all the driving gears and they have
to back up; o in case of automatic gear: they have to use the parking, drive and neutral position. o concerning auxiliary controls participants have to use turn indicators, low beam, high
beam, horn, windscreen wipers, hazard indicator. To verify that all participants have reached the same level of skill after the familiarization phase, an observational grid should be used. The experimenter in the vehicle with the participants should observe how participant solved all the tasks with primary and secondary controls. When all tasks (i.e. to use manual gear, to use auxiliary controls) are accomplished without any errors participants reach the acceptable level of driving skill. It is possible to collect the very first impact of the system. With first impact we mean a part of trial that is aimed to collect information about how easy is to use the system without any deep instruction about its working modality. In order to obtain this type of information participants have to be given a set of minimum instructions (see section 5.4.7.1). This very first phase has to come, as a separate session, after the familiarization phase, and it has to last not more then fifteen – twenty minutes. During this phase the thinking aloud technique should be applied. Type and number of errors should be collected too.
5.4.7 To develop experimental instruction both for participants and for experimenters 5.4.7.1 To select and train experimenters Instruction One relevant disturbance effect is represented by instructions. Therefore great importance must be given to the instructions given to participants involved in empirical studies. Written instructions avoid the disturbing effect due to the experimenter’s presence per se. This disturbance can also depend on the task complexity that the participants have to cope with. For very simple psychomotor tasks, there is no evidence of significant differences on the effects produced by written, oral, written/oral instruction modality presentation. In usability experiments, in which there are also cognitive tasks, the exact way of presenting instructions could have effects. So, a recommendation is to use always written instruction that participants can read by themselves. These written instructions must be written in a simple way, using simple words and phrases and, moreover, the instruction must make explicit the possibility to ask to experimenter for further clarifications. Another important issue to be given to the participants in a written form is the introduction to the research, in which there are information about who is the experimenter, what the purpose of the research is and what the results are going to be used for. One must be careful to avoid putting information in the introduction that may bias the participant in any way. It should also be indicated that information given by the participants and data collected will be treated only for statistical purpose and in an anonymous way.

AIDE Deliverable 2.1.4 Contract N. IST-1-507674-IP
January 2008
27
Last but not least, it is important to underline that there will not be any evaluation about participants´ ideas and performance during the experiments. Written instruction about the system functionality is another important part to consider. In particular, to measure the very first impact of the system only general information about devices have to be given. In particular:
- what type of devices are present (i.e. navigator, cell phone, frontal collision warning etc ); - which functions are linked to different devices (i.e. “with the navigator system you can insert a
destination, select a destination memorized from a phone book …”;.”frontal collision warning gives you information through acoustical messages about possible collision with frontal obstacles….”.)
If you don’t want to collect the very first impact of the system for each function of the system you have also to add information about specific modality of interaction. For example “to insert a new destination you have to push this bottom and scroll this menu…..” As reading an end user manual is very tiring for participants it is important to develop a manual with few written instructions. Following the indication of the manual, the experimenter has to interact practically with the system showing the different functions in order to maximize the attention of participants. Experimenter’s effect During the experiments, the unavoidable interaction between experimenter and participant is surely different from an interaction that happens in normal life. The experimenter presence and role can’t be indifferent for the participant. The fact of being observed can induce participants to behave in a different way with respect to his/her normal life. And these changes could modify in some way the experiment results. During the interaction, the disturbance effects can come from information that the experimenter communicates involuntarily through his/her individual characteristics: physical aspect, personality, momentary emotional state. Moreover the experimenter can induce systematic mistakes with his/her behaviour. In fact he/she can communicate to participants how to answer or behave with unintentional signs, such as smiles and glances, voice tone modification, or words choice in instruction or questions presentation (see Instruction Effect paragraph), eyes and head movements in correspondence with certain participants’ words or performances. Experimenter expectations can also induce some observation, data registration and interpretation mistakes. Regarding effects due to the experimenter presence, written presentation and computerised stimulus presentation – whenever feasible - represent an undoubted help. Regarding the experimenter’s expectations effect, one possibility is to avoid that participants are in direct contact with the researcher and the experimenter doesn’t know research objectives and hypothesis (double blind method). In this way, the experimenter will not be able to transmit to participants any information, not even unintentionally, about what is expected from him/her. 5.4.7.2 To carry out a pilot A test pilot has to be carried out at least with three persons with features very similar to those of the sample of users in the real experiment. During this phase the instructions to participants are twofold:
• he/she has to answer to all questions experimenter will propose;

AIDE Deliverable 2.1.4 Contract N. IST-1-507674-IP
January 2008
28
• he/she should help the researchers to refine the general experiment pointing out any possible situation that can create stress or misunderstanding.
So test pilot participants should signal:
• if some questions and or instructions are not clear; • if some situations are dangerous in their opinion; • if the trials are too long and it gets too tiring.
All the suggestions have to be used to crystallize the final version of the test. A good rule is not to have a session of trials longer than one hour and half. After this period it is necessary to have a break. 5.4.7.3 To finalize the experimental set-up On the basis of the results of the previous step the trial can be refined. For example the description of the system can be improved or changed. The trial length can be adapted. Some instruments can be better explained.
5.4.8 To analyse the collected data Preliminary statistical analysis of sample characteristics The first statistical analysis that could be carried out is the Outliers detection An outlier is an observation that lies an abnormal distance from other values in a random sample from a population. In a sense, this definition leaves it up to the analyst (or a consensus process) to decide what will be considered abnormal. Before abnormal observations can be singled out, it is necessary to characterize normal observations. Two activities are essential for characterizing a set of data:
• Examination of the overall shape of the graphed data for important features, including symmetry and departures from assumptions (Jobson, 1999).
• Examination of the data for unusual observations that are far from the mass of data. These points are often referred to as outliers. Two graphical techniques for identifying outliers are scatter plots and box plots, along with an analytic procedure for detecting outliers when the distribution is normal (Grubbs' Test).
Box plot construction. The box plot is a useful graphical display for describing the behavior of the data in the middle as well as at the ends of the distributions. The box plot uses the median and the lower and upper quartiles (defined as the 25th and 75th percentiles). If the lower quartile is Q1 and the upper quartile is Q2, then the difference (Q2 - Q1) is called the interquartile range or IQ. Box plots with fences. A box plot is constructed by drawing a box between the upper and lower quartiles with a solid line drawn across the box to locate the median. The following quantities (called fences) are needed for identifying extreme values in the tails of the distribution: lower inner fence: Q1 - 1.5*IQ upper inner fence: Q2 + 1.5*IQ lower outer fence: Q1 - 3*IQ upper outer fence: Q2 + 3*IQ

AIDE Deliverable 2.1.4 Contract N. IST-1-507674-IP
January 2008
29
Outlier detection criteria. A point beyond an inner fence on either side is considered a mild outlier. A point beyond an outer fence is considered an extreme outlier. In any case the rational by which outliers are detected, excluded and eventually analyzed individually shall be documented by the analyst. Through appropriate analysis the drivers should be classified using two criteria:
• individual ability to differentiate systems or conditions; • judgment coherence between each driver and the others.
When a workload or safety evaluation is carried out, the subjects with low ability to differentiate and low coherence with the other participants should be excluded from analysis. To have an idea about the impact of a system on workload and on driving performance, only mean performance should be considered. On the other hand when a usability evaluation is being carried out also outliers can give important and valuable information. In usability evaluation the analysis of performance in terms of typology and numbers of errors of outliers (in this case we mean the slow outliers as defined by Nielsen, 2006) can be very important to improve the interaction modality of the system and to be sure to create a system usable for a sample of users as wide as possible. Statistical analysis of subjective and objective performance It is necessary to use different parameters (both subjective and objective) depending on the different aims of the evaluation, In experimental research it is important to collect subjective and objective data in order to evaluate influence of the independent variables (e.g. adaptive vs non-adaptative vs baseline) on the dependent variables (driving performance parameters, subjective evaluations). To carry out a general Usability evaluation:
• subjective data collected through CRF questionnaire have to be used; • moreover it is possible to integrate this measures with objective secondary task parameters as
errors and time to accomplish the task during the interaction with the system. These objective parameters can be taken into account to verify coherence between perceived judgement and real interaction. . It is important to underline that in adaptive system evaluation the time to accomplish task has a parameter to be taken into account with caution because of the Adaptativity strategies.
It is important to acquire also primary task parameters (driving performance) and in this case it is necessary to compare portion of tracks in which there are significantly experimental events (or conflict scenario in case of Adaptative evaluation):
• linked to the external scenario (e.g. fog, street occlusion…); • linked to secondary task (e.g. answer to an incoming call, selection of a radio station); • linked to the experimental design (e.g. adaptive vs non-adaptive condition)
It is important to make a comparison between trends of the objective and the subjective data collected in order to verify coherence between user judgments and performances. In this case it is possible only to do a general comparison not based on statistical correlation as available subjective data are collected only at the end of each sessions and are a sort of perceived average evaluation of the entire tested session.

AIDE Deliverable 2.1.4 Contract N. IST-1-507674-IP
January 2008
30
The usability analysis will be focused to analyse in a depth frequencies and, above all, error typologies in order to highlight pros and cons of the interface and interactions logics. To carry out a general Workload evaluation :
• subjective data collected through DALI questionnaire and RSME questionnaire have to be used;
• moreover it is possible to integrate this measures with objective secondary task parameters as number of errors and time to accomplish the task during the interaction with the system. It is important to underline that in adaptive system evaluation the time to accomplish task has a parameter to be taken into account with caution because of the adaptativity strategies.
The primary task parameters (driving performance) are fundamental. It is important to compare portion of tracks in which there are significantly experimental events:
• linked to the external scenario (e.g. fog, street occlusion…); • linked to secondary task (e.g. answer to an incoming call, selection of a radio station); • linked to the experimental design (e.g. adaptive vs non-adaptive condition)
It is important to make correlation between the objective data collected and the subjective data in order to verify coherence between user judgments and performances. As it is possible to have a punctual subjective workload evaluation of each conflict scenario (in case of Adaptive evaluation) or specific event during the task using the RSME scale, the comparison between objective and subjective data can be more punctual. In the end the a priori considerations on the experimental design (power!) have been followed. For the proposed set of parameters, ANOVA is the usual form analysis. In some cases, non-parametric forms of analysis must be used. This need not be explained here in detail, since textbooks are available. It is important to underline that parametric analysis as ANOVA could be applied only if two assumptions are verified:
• normality of the distribution; • the size of the sample (not less than 30 objective and subjective measures) .
If these two assumptions are not verified it would be better to use non-parametric statistics. One relatively new element that we want to propose, however, is that results should from now on not only be reported in terms of statistical significance, but also in terms of effect sizes. When an effect is statistically significant this by itself does not tell us how ‘big’ it is. Effect sizes, which are basically standardized or z-scores, (Cohen, 1988) tell us, and they also permit us to compare across variables and even across different studies. With respect to this last aspect they furthermore allow us to do meta-analysis, so that the results of a set of studies can be compared and combined.
5.4.9 To produce summary indications about the system Regarding the kind of evaluation which will be realised, a series of indications will be produced. Usability evaluation Evaluating an IVIS/ADAS according to its Usability means to identify the user-friendlieness and easy-learning level, how much it influences the driving experience, and how much it is appreciated and used in a satisfying way by the drivers. In order to verify these aspects, it is important to identify them according to the following aspects:

AIDE Deliverable 2.1.4 Contract N. IST-1-507674-IP
January 2008
31
A. Aspects related to the interaction between System and driver. This encompasses some issues such as visibility, legibility, readability of the visual output, acoustic messages and Speech Recognition, Multimodal Conflicts, interaction logic, mapping between input and output device.
B. Aspects related to the interaction between driver, system, and driving task. That is to say how many drivers’ resources are absorbed by the System and whether the system endangers driving safety. This would encompass such as system’s interaction modes (by touch screen, by manual controls, by speech) and how high is the distraction needed to operate a simple task with the system
To obtain information about point A, the following parameters can be used: subjective parameters as CRF questionnaire; objective parameters as number of errors, typology of errors accomplishing task time . To obtain summarizing information about point B, also primary driving performance must be used and must be compared with subjective data. Workload and safety evaluation Workload Indications about system impact on driving task in terms of objective and perceived workload, and number of incidents (in case of simulator trials) will be produced. Workload refers to the concept that a user must share mental resources when driving and doing something else, such interacting with an IVIS / ADAS. It is a great concern to understand how resources are shared, because subtracting too many resources to driving task might lead to unsafe situations, therefore compromising safety. When assessing an in-car system, it is therefore important to verify, beside Usability and Acceptance issues, the level of Workload the system induces. Poor Usability of the System might lead to higher levels of Workload, thus lower safety. The relation between workload and performance depending on task demands is a non-linear relation, so an increase in task difficulty might lead to a more than proportional increase of Workload. To answer this question it is important to use the different objective data collected and link these data with significant parts of test track (for example different use cases) and with different conditions. Above all for evaluation of integrated system it is possible that different use cases with same demand level are clustered together as they may impact differently on the workload Safety evaluation This is treated in Chapter 6 Acceptability Acceptance is the measure according to which a user expresses the will to use a system and the level of appreciation resulted after use, in terms of safety improvement, reduction of vehicle operation costs, saving in travel time, improvement in driving comfort, HMI friendliness. System performance quality influences Acceptance as well. Usually this dimension can be measured only with a sample size higher than 18 or 20 participants. However it is possible, with a little size sample, to obtain indications concerning a general first acceptability impression When considering this dimension it is also interesting to provide indications concerning the willingness to pay, and the general perceived impact on drivers and passengers’ safety. The perceived safety is an operative information which is fundamental to guide the re-design.

AIDE Deliverable 2.1.4 Contract N. IST-1-507674-IP
January 2008
32
[…]

AIDE Deliverable 2.1.4 Contract N. IST-1-507674-IP
January 2008
33
8 References Amditís, A., Bolovinou, A., Engstrom, J., Kussmann H.,Placke, L. Bekiaris, E., Panou, M., Gaitanidou, E., Andreone, L., Deregibus E., Kompfner, P., Robertson, P. (2006). Aide Scenarios and Use cases Definition. (EU project AIDE, IST-1-507674-IP, Deliverable 3.1.2.) Allen, R.W., Rosenthal, T., Aponso, B.L., Klyde, D.H., Anderson, F.G., Chrstos, J.P. (1998). A low Cost PC Based Driving Simulator for Prototyping and Hardware-in-the-Loop Applications. SAE Paper No. 98-0222, Spec. Pub. 1361 Bekiaris, E., Portouli, V., Papakostopoulos, V. & Janssen, W.H. (2005). Combining workload and behavioural effects into overall risk reduction estimate. AIDE Deliverable D2.3.3. Breker, S., Henrikson, P., Falkmer, T., Bekiaris, E., Panou, M., Eeckhout, G., Siren, A., Hakamies-Blomqvist, L., Middleton, H., Leue, H.. (2003). AGILE project (QLRT-2001-00118) Deliverable No 1.1 Problems of elderly in relation to the driving task and relevant critical scenarios Cherri C., Nodari E., Toffetti A. (2004). Review of existing Tools and Methods. AIDE Deliverable D2.1.1.
Chin, E., Nathan, F., Pauzié, A., Manzano, J., Nodari, E., Cherry, C., Rambaldini, A., Toffetti, A., Marchitto, M., (2006) Subjective assessment methods for workload. (EU project AIDE, project IST-1-507674-IP, Deliverable 2.2.6)
Code of Code of Practice for the Design and Evaluation of ADAS (2206). Response 3. http://www.prevent-ip.org/download/deliverables/RESPONSE3/D11.2/Response3_CoP_v3.0.pdf Cohen, J. (1988). Statistical Power Analysis for the Behavioral Sciences. Lawrence Erlbaum, 2nd Edition.
Fastenmeier, W. & Gstalter, H. (2006). Driving Task Analysis as a Tool in Traffic Safety Research and Practice. Safety Science Glaser, W.R., Waschulewski, H., Schmid, D. (2005). I-TSA - a standardized procedure to assess the safety impact of driver information and driver assistance systems. "Der Fahrer im 21. Jahrhundert" (The driver in the 21st century), VDI-Berichte 1919, 17-10. Braunschweig, http://www.invent-online.de Green, M. (2000). “How long does it take to stop” Methodological analysis of driver perception-brake times. Transportation Human Factors, 2(3), 195-216. Hanzlikova, I. (2005). Inventory of ethical laws which apply, at the national and EC levels, during behavioural experimental studies. HUMANIST NoE Deliverable. Hart, S. G., & Staveland, L. E. (1988). Development of NASA - TLX (Task Load Index):Results of Empirical and Theoretical Research. In P. A. Hancock & N. Meshkati (Eds.), Human Mental Workload (pp. 139 - 183). Amsterdam: Elsevier Science Publisher B.V.

AIDE Deliverable 2.1.4 Contract N. IST-1-507674-IP
January 2008
34
Hollnagel, E. & Woods, D. D. (2005). Joint cognitive systems: Foundations of cognitive systems engineering. Boca Raton, FL: CRC Press / Taylor & Francis. Hoeschen, A., Bekiaris, E., (2001). TRAINER project (GRD1-1999-10024) Deliverable No 2.1 Inventory of driver training needs and major gaps in the relevant training procedures Hopstock, M. & Thoma, S. (2006). Evaluation Results of the Intersection Safety System on the Driving Simulator. EU project Intersafe/PREVENT. Deliverable 40.74b.
Janssen, W.H. (2000). Functions relating driver behavior and accident risk. (In Dutch). Soesterberg: TNO Human Factors, memo. Janssen, W.H., Brouwer, R.F.T. & Huang, Y. (2005). Risk trade-offs between driving behaviour and driver state. AIDE Deliverable D 2.3.2 Jamson, S., Batley, R., Janssen, W., Portouli, V., Papakostopoulos, V., Tapani, A., Lundgren, J., Huang, Y. & Hollnagel, E. (2005). Obtaining the functions describing the relations between behaviour and risk. AIDE Deliverable D 2.3.1
Jobson, J., D. (1999). Applied Multivariate Data Analysis. Vol I: regression and experimental design. New York: Springer Ed. Johansson E., Engström J., Cherri C., Nodari E., Toffetti A., Schindhelm R. and Gelau C. (2005). Review of existing techniques and metrics for IVIS and ADAS assessment. AIDE Deliverable D2.2.1 Klauer, S.G., Dingus, T.A., Neale, V., Sudweeks, J.D. & Ramsey, D.J. (2006). The impact of driver inattention on near-crash/crash risk: an analysis using the 100-car naturalistic driving study data. Virginia Tech Transportation Institute, Blacksburg, Report No. DOT HS 810 594 Künstler, B. (1980). Psychische Belastung durch die Arbeitstätigkeit – Theoretisches Rahmenkonzept der Entwicklung eines Fragebogens zum Belastungserleben. Probleme und Ergebnisse der Psychologie, 74, 45-67.4Nielsen, J., (1993) Usability Engineering, Academic Press Kussmann H., Modler H., Engstrom J., Agnvall A., Piamonte P., Markkula's G., Amditis A., Bolovinou A., Andreone L., Deregibus E., Kompfner P., Robertson P., De Miguel Garcia N., Feron S., Berninger H., Couvreur C., Bellet T., Scholliers J., Kutila M. (2006). Requirements for AIDE HMI and safety functions. AIDE Deliverable D3.2.1. Malaterre, G. (1994). Méthode de mesure de la charge de travail en situation de conduite simulée et réelle. Rapport INRETS n 191. Manstetten, D. (2005). Evaluating the traffic safety effects of driver assistance systems. Proceedings of the 6th Braunschweig Conference AAET 2005 “Automation, Assistance and Embedded Real Time Platforms for Transportation“, Braunschweig, Germany. Marberger, C., Theodorsson, N., Giese, B. (2006). Report on user and expert evaluations of AIDE virtual HMI prototypes. EU project AIDE, IST-1-507674-IP, Internal report WP 3.4.

AIDE Deliverable 2.1.4 Contract N. IST-1-507674-IP
January 2008
35
Marchitto, M. Casucci, F. Dogliani, M. Hjälmdahl (2004). Driving Simulator Tests and Data Analysis for DVE model validation. AIDE Deliverable D 1.3.2. Markkula, G. and Engström, J. (2006). A Steering Wheel Reversal Rate Metric for Assessing Effects of Visual and Cognitive Secondary Task Load. Proceedings of the 13th ITS World Congress. London, UK. Mattes, S., Foehl, U. & Schindhelm, R. (2006). Empirical comparisons of methods for off-line workload measurement. AIDE Deliverable D 2.2.7 Nakayama, O., Futami, T., Nakamura, T., Boer, E.R. (1999). Development of a Steering Entropy Method for Evaluating Driver Workload. SAE Technical Paper Series: #1999-01-0892
Nielsen, J. (1993) Usability Engineering, Academic Press.
Nielsen, J. (2006). Outliers and Luck in User Performance. Alertbox, March, 6. http://www.useit.com/alertbox/outlier_performance.html
Nilsson, G. (1982). The effects of speed limits on traffic accidents in Sweden. In: Proceedings of the international symposium on the effects of speed limits on accidents and fuel consumption, 6-8 October 1981, Dublin (OECD, Paris).
Nilsson, G. (1984). Speeds, accident rates and personal injury consequences for different road types. Linköping: VTI, Rept. VTI-277. Nilsson, G. (1997). Speed management in Sweden. Linköping: VTI. Östlund, J., Peters, B., Thorslund, B., Engström, J., Markkula, G., Keinath, A., Horst, D., Mattes, S., Foehl, U., (2005), AIDE project Deliverable No. 2.2.5 Driving performance assessment – methods and metrics Parker, D., Reason, J. T., Manstead, A. S. R., & Stradling, S. G. (1995). Driving errors, driving violations and accident involvement. Ergonomics, 38, 1036-1048. Pauzié, A., Pachiaudi, G. , (1996) Subjective Evaluation of the Mental Workload in the DrivingContext, Laboratory Ergonomics Health Comfort, INRETS / LESCO, Interational Conference onTraffic and Trasport Psychology Peterson, D. Piamonte, P. Montanari, R. Gelau, C., Winsum, W. van , Hoedemaeker, M., Dangelmaier, M., Hess, M., Kuhn, F. and Mariani, M. (2000). Validation plan. EU project Communicar, IST 11595, Deliverable 6.1. Reichart, G. (2001). Menschliche Zuverlässigkeit beim Führen von Kraftfahrzeugen. Düsseldorf: VDI Verlag. VDI-Reihe 22, Nr. 7. Rimini-Döring, M, Keinath., A., Nodari, E., Palma, F., Toffetti, A., Floudas, N., Bekiaris, E., Portouli, V., Panou, M. (2005) Evaluation and assessment methodology. EU project AIDE, project IST-1-507674-IP, Deliverable 2.1.3

AIDE Deliverable 2.1.4 Contract N. IST-1-507674-IP
January 2008
36
Salusjärvi, M. (1990). In G. Nilsson (Ed.), Speed and safety: research results from the Nordic countries. Linköping: VTI. Schindhelm, R., Gelau, C., Montanari, R., Moreale, D., Deregibus, E., Hoedemaeker, M., De Ridder, S., & Piamonte, P. (2003). Human factor tests on car demonstrator. EU project COMUNICAR (COmmunication Multimedia UNit Inside CAR), Deliverable 6.4. Verwey, W. B. (2001). Evaluating safety effects of in-vehicle information systems. In P. A. Hancock & P. A. Desmond (Eds.) Stress, workload, and fatigue, 409-425. Mahwah, NJ, U.S.A.: Lawrence Erlbaum. Wierwille, W., Tijerina, L., Kiger, S., Rockwell, T., Lauber, E. And Bittner, A Jr. (1996). Heavy Vehicle Driver Workload Assessment. Task 4: Review of Workload and Related Research. US Department of Transportation, NHTSA. DOT HS 808 467 (4). Zijstra & Van Doorn, (1985), The construction of a scale to measure perceived effort. Department of Philosophy and Social Sciences, Delft University of Technology.