species richness of insects and mites on trees: blackwell ... · pdf filejournal of animal...
TRANSCRIPT

Journal of Animal Ecology
2001
70
, 491–504
© 2001 British Ecological Society
Blackwell Science, Ltd
Species richness of insects and mites on trees: expanding Southwood
MARTIN BRÄNDLE* and ROLAND BRANDL†
*
State Museum of Natural History, Karlsruhe, Department of Zoology, Erbprinzen Str. 13, D–76133 Karlsruhe, Germany; and
†
UFZ Centre for Environmental Research Leipzig-Halle Ltd, Department of Community Ecology, Theodor-Lieser Str. 4, D–06120 Halle, Germany
Summary
1.
Data on the species richness of phytophagous insects and mites associated with 25tree genera occurring as natives in Germany were compiled and compared to data forBritish trees published by Kennedy & Southwood (1984). For tree genera occurring inGermany and Britain patterns of species richness and composition of phytophagefaunas were similar.
2.
Present abundance of trees, their distributional history during the Holocene,morphological traits and taxonomic isolation were used to explain the variance ofspecies richness and proportion of specialists across tree genera occurring as nativesin Germany. Tree genera were either used as independent data points or to calculatephylogenetically independent contrasts. For the latter approach, a phylogeny for thetree genera was generated from published
rbc
L gene sequences. In general, the conclu-sions from the two types of analyses were similar.
3.
The species richness of phytophages on German tree genera were positively relatedto present tree abundance, tree height and tree abundance derived from pollen samples.For phylogenetically independent contrasts the length of time a genus was present sincethe end of the last glaciation also became significant.
4.
The proportions of specialists showed a negative relationship with present abundanceof trees, a positive relationship with taxonomic isolation as well as the length of time ofgenus was present since the end of the last glaciation. For phylogenetically independentcontrasts only the latter two variables remained significant.
6.
Overall the results support the species–area and the coevolutionary hypotheses.
Key-words
:
coevolution, insects, mites, specialists, species–area relationship, speciesrichness.
Journal of Animal Ecology
(2001)
70
, 491–504
Introduction
In 1984 the research efforts of Southwood culminated ina paper where Kennedy & Southwood (1984) presentedan analysis of the species richness of phytophagousinsects and mites associated with British trees. Theseauthors reported that present abundance of trees inBritain, length of time a tree has been present in Britainsince the end of the last glaciation, taxonomic isolationof trees, tree height and leaf length explained in decreas-ing order of importance a significant part of the vari-ance in species richness of phytophages across trees.
Altogether these five variables accounted for 82% ofthe variance. At least three classes of hypothesis weresuggested to explain these patterns:
1.
The
species–area
hypothesis: species–area curvesare universal in ecology (Rosenzweig 1995). On a geo-graphical scale several explanations of the species–arearelationship have been specifically tallied for phyto-phages: the habitat–heterogeneity hypothesis (Williams1943), the encounter–frequency hypothesis and theequilibrium theory hypothesis originally developedfor islands (MacArthur & Wilson 1967; see Strong,Lawton & Southwood 1984 for a review). Together, allthree hypotheses predict that species richness of phyto-phages should increase with abundance and distributionof a host species. In analogy to the explanations ofthe species–area hypothesis on a geographical scale,individual trees may be viewed as islands on a local
Correspondence: Martin Brändle, State Museum of NaturalHistory Karlsruhe, Department of Zoology, Erbprinzen Str.13, D–76133 Karlsruhe, Germany Fax:
+
49 (721) 1752110,Tel:
+
49 (721) 1752138. E-mail: [email protected]
JAE506.fm Page 491 Monday, April 16, 2001 10:13 AM
492
M. Brändle & R. Brandl
© 2001 British Ecological Society,
Journal of Animal Ecology
,
70
,491–504
scale and large trees should accumulate more phyto-phages than smaller ones. Since large trees provide manymicrohabitats, passive sampling increases with tree sizeand population size of phytophages increases with treesize which reduces extinction probabilities (Lawton &Schröder 1977; Strong & Levin 1979).
2.
The
geological time
hypothesis: richness of phyto-phages on hosts may depend on how long a particularhost has been able to accumulate phytophages either bycollecting species from the available pool of phytophagesor by evolutionary processes. Trees re-colonized Europeduring the Holocene. Thus, the earlier a tree re-colonizedan area in Europe, the more phytophages should occuron it (Birks 1980; Kennedy & Southwood 1984).
3.
The
taxonomic isolation
hypothesis: related plants arelikely to share chemical and physical traits. Phytophagesare more likely to switch to closely related than tounrelated hosts as related potential hosts offer similarliving conditions (e.g. chemical defence systems;Connor, Simberloff & Opler 1980; Strong, Lawton &Southwood 1984). Thus, tree species with co-occurringrelatives (low taxonomic isolation) should have morephytophagous species than taxonomically isolated trees.
Subsequent to Southwood and coworkers, however,there were only few further attempts to analyse speciesrichness of insects on trees (e.g. Leather 1986, 1991),but there are still several open questions and after 15years some new perspectives.
1.
Britain is an island. This geographical isolationcertainly affected the re-colonization of organismsafter the Pleistocene (e.g. Dennis 1977). For instance,there were no waves of different woodland types duringthe Holocene, as suggested for continental Europe(Ingrouille 1995). Nowadays, in Britain only 10–12%of the landscape is covered by woodland, one of thelowest values in Europe. In contrast, Germany has awoodland cover of 26% (WRI 1999). Thus the questionarises as to whether the biogeographical patterns ofspecies richness on trees obvious in Britain will alsohold for continental Europe.
2.
Kennedy & Southwood (1984) combined native andalien trees within their analyses. Rosenzweig (1995) showedthat the correlation between g
eological time
and speciesrichness is due to the inclusion of these alien trees. Thus,the
geological time
hypothesis is still a matter of debate(Southwood 1961; Strong 1974; Claridge & Wilson1978; Birks 1980; Boucot 1983; Kennedy & Southwood1984; Bush, Aho & Kennedy 1990; Price 1997).
The processes determining the proportions of spe-cialists or generalists among plants are poorly under-stood (Lawton & Schröder 1978; Neuvonen & Niemelä1981). The
plant predictability–apparency
hypothesis(Levins & MacArthur 1969; Feeny 1970; Strong &Levin 1979) predicts that apparent plants invest moreinto chemical defence and only specialists are able toexploit such hosts. Abundance is one component ofapparency and thus one expects more specialists onabundant trees (Levins & MacArthur 1969; Rhoades& Cates 1976; Neuvonen & Niemelä 1981). The
coevolutionary
hypothesis (e.g. Berenbaum 1983) sug-gests that over time phytophages become increasinglyspecialized and in time evolve to specialists. Thus, theearlier a tree re-colonized an area the more specializedphytophages should occur on it.
The phylogenetic relatedness of taxa influencesstatistics (Harvey & Pagel 1991). Nowadays sophistica-ted methods exist which incorporate phylogeny intoanalyses (e.g. Felsenstein 1985). The development oflaboratory techniques made DNA sequences availablewhich can be used to infer the phylogenies of taxa to fuelphylogenetic controlled analyses (e.g. Chase
et al
. 1993).Kelly & Southwood (1999) already showed that the rela-tionship between species richness of phytophages onBritish trees and tree abundance, at least, does not changeby introducing phylogeny of trees into the analysis.
Altogether these arguments encouraged us to carryout an analysis of species richness of phytophagousinsects and mites on their host trees in Germany. Theaim of our study is threefold.
1.
We will compare the species richness of the Britishinsect fauna on trees with the fauna on trees alsooccurring in Germany. This will help to understand theeffects of the special situation of Britain on biogeo-graphic patterns.
2.
We will analyse the variation in species richnessacross trees native to Germany in correlation of severalindependent variables using naive methods as well asmodern comparative approaches.
3.
We will analyse the variation in the percentage ofspecialized insect and mite species across tree genera.
Methods
Species richness of phytophages was analysed on thelevel of tree genera. More precise data are not available(see also Neuvonen & Niemelä 1981; Kennedy &Southwood 1984). Among the 25 tree genera native toGermany (see Appendix 1) 20 are also native in Britain.We pooled the genus
Frangula
with the genus
Rhamnus
as suggested by some taxonomists (e.g. Fitschen 1987).For Britain Kennedy & Southwood (1984) handled
Picea abies
(L.) Karst as a native since it was presentin Britain before the last glaciation. However, it wasreintroduced by humans approximately 500 years ago(Birks 1980). Thus
Picea
abies
was excluded whencomparing the fauna of Britain and Germany.
In order to compare the results with the resultsobtained by Kennedy & Southwood (1984), the sameinsect and mite taxa were considered (Appendix 1). Hostrecords were compiled from published accounts. Onlypublications of renowned experts were selected.However, for some taxa information was scanty oroutdated (Eriophyidae, Thysanoptera). From the lists
JAE506.fm Page 492 Monday, April 16, 2001 10:13 AM
493
Insects and mites on trees
© 2001 British Ecological Society,
Journal of Animal Ecology
,
70
,491–504
we counted the overall species richness of insects andmites (subsequently simply called species richness) andthe number of specialists (Appendix 2). Specialists weredefined as phytophages restricted to one tree genus.
Undoubtedly, using published lists of phytophagesintroduces some bias (Kennedy & Southwood 1984;Gotelli & Graves 1996). Prominent critiques are the‘entomologist–area effect’ (e.g. Connor & McCoy1979) and that rare trees were sampled less frequentlythan common trees. However, as already suggested byKennedy & Southwood (1984; see also Southwood1961), the fauna of Britain as well as Central Europehas been studied for more than 100 years. Variousstudies also tested the reliability of published hostrecords (Lawton
et al
. 1981; Southwood, Moran &Kennedy 1982; Niemelä & Neuvonen 1983; Leather1990; but see Fielding & Coulson 1995). Most of themfound no important differences in their analyses eitherusing field samples or data retrieved from the literature.
Two surrogates of tree abundance were used in theanalyses: grid occupancy across Germany and pollensamples across Europe. At present there are no grid mapsof plant distribution available which cover Germanyas a whole. Thus occupancy had to be combined fromHäupler & Schönfelder (1989) covering the former BRDand Benkert, Fukarek & Korsch (1996) covering theformer GDR (Appendix 2; 11
×
11-km grids, MTB-System). In tree genera with two or more species thetotal number of grids in which the genus was recordedwas used. Claridge & Wilson (1978) and Kennedy &Southwood (1984) noted the all-or-nothing nature ofgrid occupancy as a surrogate of abundance (but seeKennedy & Southwood 1984). However, many macro-ecological studies demonstrate a correlation betweenabundance and occupancy (e.g. Hengeveld & Haeck 1982;Gaston & Blackburn 2000, and references therein) andthus in the present analyses the grid occupancy of treespecies across Germany is used as a measure of presentabundance of tree genera.
Huntley (1990) compiled a list of contemporary andfossil pollen samples of trees across Europe. These datarest on 500 localities studied for pollen-stratigraphyand more than 1000 localities with surface-samples (fordetails see Huntley 1990). This list, however, does notinclude data for the rosaceous trees. We use the numberof samples in which a tree genus was recorded as a measureof abundance. Note that this measure of abundanceis some kind of an average across time and space. Atleast in part the pollen data provide evidence for theabundance of tree genera during the Holocene. We callthis measure of tree abundance derived from pollensamples ‘pollen abundance’.
Tree height was measured by the maximum height (in
m) of the tallest species within the genus (Rothmaler1987). Leaf size, ‘coniferousness’ and ‘evergreenness’(Kennedy & Southwood 1984) were not considered.Within Angiosperms and Conifers these variables showalmost no variation and there are no degrees of freedomfor meaningful phylogenetically controlled tests.
To estimate the time span since the first fossil record ofa tree in Central Europe after the last glaciation wecompiled data from Firbas (1949), Sebald, Seybold &Philippi (1990a, 1990b, 1992, 1996), Lang (1994) andBurga & Perret (1998) (Appendix 2). Three problemsarise. First, the time estimates are only approximate.Secondly, some trees produce very little pollen since theyare pollinated by insects (e.g.
Rhamnus
, rosaceous trees).For these genera the probability of recording somefossil pollen is small. Thirdly, the genera of the rosaceoustrees can not be distinguished by the morphology oftheir pollen (G. Lang, personal communication).Nevertheless, the length of time of occurrence since thelast glaciation (further called postglacial occurrence)compiled for Germany showed good correlation withthe data compiled for Britain (Birks 1980;
n
=
20,
r
2
=
0·72,
P
< 0·001).
Most researchers use the number of congeneric speciesas a measure of taxonomic isolation (e.g. Lawton & Price1979). Kennedy & Southwood (1984) used the numberof co-occurring species within the order (see alsoNeuvonen & Niemelä 1981). For statistical reasons wedecided to use the number of congeneric species as thenumber of species within the order will have the samevalue for several tree genera which violates the assump-tion of independent data needed for statistical tests.
Species or genera are not independent from eachother but are linked by their evolutionary history(Felsenstein 1985; Harvey & Pagel 1991). Thus, twoanalyses were performed: first, a naive analysis usinggenera as independent data points (cross-generaanalysis) and secondly, a phylogenetic controlledanalysis (Harvey & Pagel 1991) with phylogeneticindependent contrasts of traits calculated across ahypothesized phylogeny (called cladogram or some-times tree; for definitions see Kitching
et al
. 1998).To estimate a phylogeny for the tree genera, DNA
sequences of the
rbc
L gene (ribulosebisphosphate-carboxylase, large subunit) were extracted from GenBank(GenBank accessions: X58391, L1318, X56618, L01889,X56621, X56619, U06799, L13340, AJ235804, L01928,L12573, X63663, AJ001766, X63660, X63665,AF133677, L01947, M58391, L13189, AB012793,U06827, AJ235811, AF022127, U00441). It was possible
JAE506.fm Page 493 Monday, April 16, 2001 10:13 AM

494
M. Brändle & R. Brandl
© 2001 British Ecological Society,
Journal of Animal Ecology
,
70
,491–504
to retrieve sequences for examples of species from mostof the tree genera occurring in Germany. Exceptionswere
Fraxinus
,
Malus
and
Pyrus
. Since
Fraxinus
wasthe only Oleaceae in the data set, the sequence from
Olea europaea
L. was used as a substitute. Note that themolecular data include species from all parts of theworld. Thus, it is assumed that the genera are welldefined.
Ginkgo biloba
L. was used to root the phylogeny.Sequences (1428 positions) were aligned by MultAlin4·0 (Anonymous 1992) with the default option of gappenalty. Phylogenetic relationships were inferred usingparsimony as implemented in
3·57c (Felsenstein1993).
resulted in four equally parsimonioustrees of 907 steps. To find further support for relation-ships
was used to produce 100 bootstrapreplicates. Across these bootstrap replicates,
found 281 most parsimonious trees. Subsequently, amajority rule consensus tree was computed with theprogram
(Fig. 1a). To complete the phylogeny,information for the relationships among Maloideaegiven in Campbell
et al
. (1995, their Fig. 7) was used.The final hypothesized phylogeny (Fig. 1b) used forcalculating phylogenetic independent contrasts issimilar to the phylogeny used by Kelly & Southwood(1999).
The fully resolved phylogeny allowed calculationof phylogenetic independent contrasts according tothe method developed by Felsenstein (1985). As branchlengths were not available, all branch lengths wereset to be equal (Pagel 1992). Contrasts were calculatedusing
(Purvis & Rambaut 1995). To analysecontrasts, least-squares regression with an intercept ofzero was used (Garland, Harvey & Ives 1992; Pagel 1992).
Prior to statistical analyses variables were either log
10
-or arcsine square root-transformed to reduce skewnessand to attain equal variance (see Appendix 2). For allstatistical tests significance was assumed when the errorprobability was below 5% (two-tailed). Error probabil-ities between 5 and 10% are marginally significant.
To compare the patterns of species richness andfaunal composition, species richness in Britain wasplotted against species richness in Germany. This wasperformed across tree genera using the species richnessof all phytophages as well as the richness of singlegroups (Fig. 2; Appendix 1). In such a plot each symbolindicates the species richness of the total fauna orcertain groups on a certain tree genus. Furthermore,for the total fauna or single tree genera we plotted therichness of each group of phytophages in Germanyagainst the richness of this group in Britain. Therebyeach symbol represents one of the phytophagous groupslisted in Appendix 1. If the composition of the fauna ofphytophages is similar in Britain and Germany, oneexpects high correlations in the latter type of plot. Ifrichness values are log
10
-transformed, a slope of oneindicates similarity in the composition of the faunas(Frenzel & Brandl 2000). Slopes were estimated by thereduced major axis approach (Rayner 1985) as the esti-mates of species richness in Britain and Germany havea substantial error (McArdle 1988).
A correlation matrix was computed to show relation-ships among independent variables (Table 1). Further,multiple regression analyses were carried out usingordinary least squares with a backward elimination of
Fig. 1. Hypothesized phylogeny of tree genera native to Germany. (a) Majority rule consensus tree obtained by parsimonyanalysis of nucleotide sequences of the rbcL-gene rooted by Ginkgo biloba. Numbers indicate bootstrap support based on 100replicates. (b) Final phylogeny used for calculating phylogenetically independent contrasts. This tree includes a phylogenetichypothesis of the relationship among Maloidea proposed by Campbell et al. (1995).
JAE506.fm Page 494 Monday, April 16, 2001 10:13 AM
495
Insects and mites on trees
© 2001 British Ecological Society,
Journal of Animal Ecology
,
70
,491–504
variables (Crawley 1993). A significance level of 0·1 forthe elimination of independent variables was chosen.
Results
: .
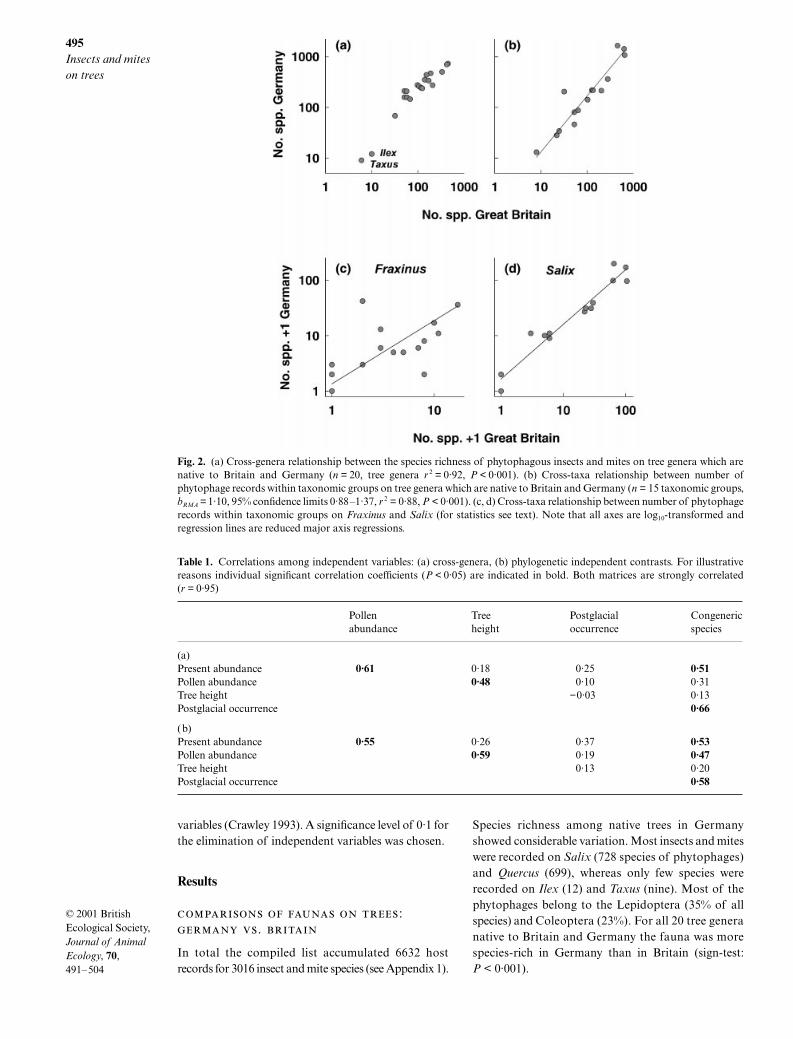
In total the compiled list accumulated 6632 hostrecords for 3016 insect and mite species (see Appendix 1).
Species richness among native trees in Germanyshowed considerable variation. Most insects and miteswere recorded on
Salix
(728 species of phytophages)and
Quercus
(699), whereas only few species wererecorded on
Ilex
(12) and
Taxus
(nine). Most of thephytophages belong to the Lepidoptera (35% of allspecies) and Coleoptera (23%). For all 20 tree generanative to Britain and Germany the fauna was morespecies-rich in Germany than in Britain (sign-test:
P
< 0·001).
Fig. 2. (a) Cross-genera relationship between the species richness of phytophagous insects and mites on tree genera which arenative to Britain and Germany (n = 20, tree genera r 2 = 0·92, P < 0·001). (b) Cross-taxa relationship between number ofphytophage records within taxonomic groups on tree genera which are native to Britain and Germany (n = 15 taxonomic groups,bRMA = 1·10, 95% confidence limits 0·88–1·37, r 2 = 0·88, P < 0·001). (c, d) Cross-taxa relationship between number of phytophagerecords within taxonomic groups on Fraxinus and Salix (for statistics see text). Note that all axes are log10-transformed andregression lines are reduced major axis regressions.
Table 1. Correlations among independent variables: (a) cross-genera, (b) phylogenetic independent contrasts. For illustrativereasons individual significant correlation coefficients (P < 0·05) are indicated in bold. Both matrices are strongly correlated(r = 0·95)
Pollen abundance
Tree height
Postglacial occurrence
Congenericspecies
(a)Present abundance 0·61 0·18 0·25 0·51Pollen abundance 0·48 0·10 0·31Tree height −0·03 0·13Postglacial occurrence 0·66
(b)Present abundance 0·55 0·26 0·37 0·53Pollen abundance 0·59 0·19 0·47Tree height 0·13 0·20Postglacial occurrence 0·58
JAE506.fm Page 495 Monday, April 16, 2001 10:13 AM
496
M. Brändle & R. Brandl
© 2001 British Ecological Society,
Journal of Animal Ecology
,
70
,491–504
The proportions of specialists showed also consider-able variation. Proportions of specialists were high on
Juniperus
(66%) and
Pinus
(47%), whereas the phytophagefaunas of
Carpinus
(8%) and
Malus
(11%) were lessspecialized.
Species richness was closely correlated across treegenera native to Britain and Germany (Fig. 2a). Thegenera
Taxus
and
Ilex
have impoverished phytophagefaunas and thus dominate the correlation. Nevertheless,the relationship remained highly significant (
n
=
18,
r
2
=
0·86,
P
<
0·001), even without the data from
Taxus
and
Ilex
. When correlating the richness for individualphytophage groups, significant positive relationshipsagain appeared, except for the Coccoidea. The significantcoefficient of determinations (
r
2
;
P
<
0·05) ranged be-tween 0·33 (Thysanoptera) and 0·91 (Microlepidoptera).
In the analyses of species richness across the phyto-phage groups, a high correlation also appeared (Fig. 2b).Furthermore, the confidence limits of the reduced majoraxis slope of the regression line includes one. When thespecies richness of groups in Germany and Britain wereplotted against each other for each tree genus, signific-ant positive relationships were again found in all cases(
P
<
0·05). The coefficients of determination rangedbetween 0·29 (
Fraxinus
, Fig. 2c) and 0·93 (
Salix
, Fig. 2d),the reduced major axis slopes between 0·98 (
Salix
) and1·52 (
Acer
). In most cases the slopes were not signific-antly different from one (except
Ulmus).
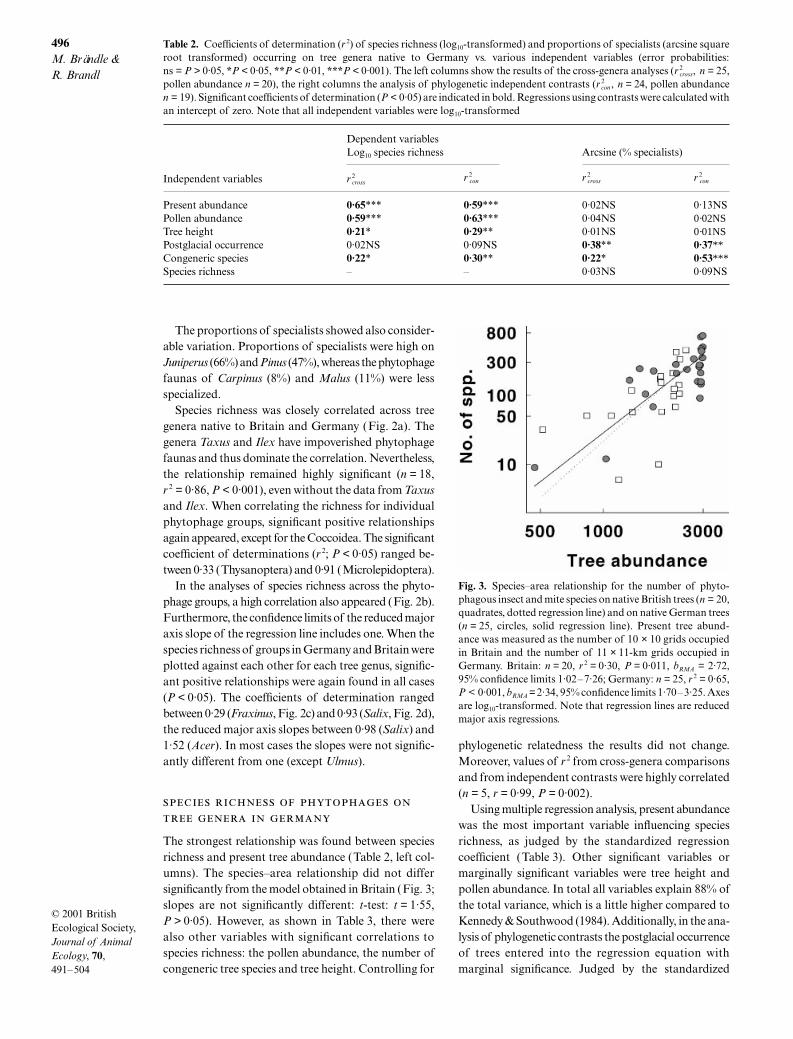
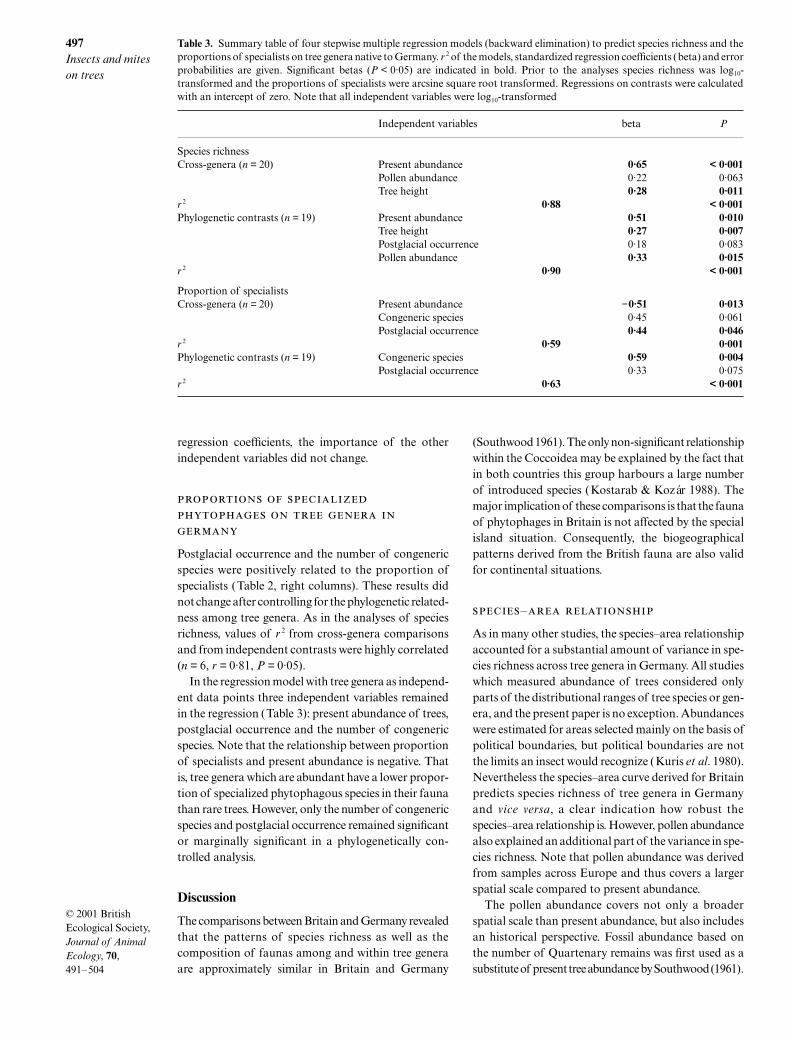
The strongest relationship was found between speciesrichness and present tree abundance (Table 2, left col-umns). The species–area relationship did not differsignificantly from the model obtained in Britain (Fig. 3;slopes are not significantly different: t-test: t = 1·55,P > 0·05). However, as shown in Table 3, there werealso other variables with significant correlations tospecies richness: the pollen abundance, the number ofcongeneric tree species and tree height. Controlling for
phylogenetic relatedness the results did not change.Moreover, values of r 2 from cross-genera comparisonsand from independent contrasts were highly correlated(n = 5, r = 0·99, P = 0·002).
Using multiple regression analysis, present abundancewas the most important variable influencing speciesrichness, as judged by the standardized regressioncoefficient (Table 3). Other significant variables ormarginally significant variables were tree height andpollen abundance. In total all variables explain 88% ofthe total variance, which is a little higher compared toKennedy & Southwood (1984). Additionally, in the ana-lysis of phylogenetic contrasts the postglacial occurrenceof trees entered into the regression equation withmarginal significance. Judged by the standardized
Table 2. Coefficients of determination (r 2) of species richness (log10-transformed) and proportions of specialists (arcsine squareroot transformed) occurring on tree genera native to Germany vs. various independent variables (error probabilities:ns = P > 0·05, *P < 0·05, **P < 0·01, ***P < 0·001). The left columns show the results of the cross-genera analyses (r 2
cross, n = 25,pollen abundance n = 20), the right columns the analysis of phylogenetic independent contrasts (r 2
con, n = 24, pollen abundancen = 19). Significant coefficients of determination (P < 0·05) are indicated in bold. Regressions using contrasts were calculated withan intercept of zero. Note that all independent variables were log10-transformed
Dependent variables Log10 species richness Arcsine (% specialists)
Independent variables r 2cross r 2
con r 2cross r 2
con
Present abundance 0·65*** 0·59*** 0·02NS 0·13NSPollen abundance 0·59*** 0·63*** 0·04NS 0·02NSTree height 0·21* 0·29** 0·01NS 0·01NSPostglacial occurrence 0·02NS 0·09NS 0·38** 0·37**Congeneric species 0·22* 0·30** 0·22* 0·53***Species richness – – 0·03NS 0·09NS
Fig. 3. Species–area relationship for the number of phyto-phagous insect and mite species on native British trees (n = 20,quadrates, dotted regression line) and on native German trees(n = 25, circles, solid regression line). Present tree abund-ance was measured as the number of 10 × 10 grids occupiedin Britain and the number of 11 × 11-km grids occupied inGermany. Britain: n = 20, r 2 = 0·30, P = 0·011, bRMA = 2·72,95% confidence limits 1·02–7·26; Germany: n = 25, r 2 = 0·65,P < 0·001, bRMA = 2·34, 95% confidence limits 1·70–3·25. Axesare log10-transformed. Note that regression lines are reducedmajor axis regressions.
JAE506.fm Page 496 Monday, April 16, 2001 10:13 AM
497Insects and mites on trees
© 2001 British Ecological Society, Journal of Animal Ecology, 70,491–504
regression coefficients, the importance of the otherindependent variables did not change.
Postglacial occurrence and the number of congenericspecies were positively related to the proportion ofspecialists (Table 2, right columns). These results didnot change after controlling for the phylogenetic related-ness among tree genera. As in the analyses of speciesrichness, values of r 2 from cross-genera comparisonsand from independent contrasts were highly correlated(n = 6, r = 0·81, P = 0·05).
In the regression model with tree genera as independ-ent data points three independent variables remainedin the regression (Table 3): present abundance of trees,postglacial occurrence and the number of congenericspecies. Note that the relationship between proportionof specialists and present abundance is negative. Thatis, tree genera which are abundant have a lower propor-tion of specialized phytophagous species in their faunathan rare trees. However, only the number of congenericspecies and postglacial occurrence remained significantor marginally significant in a phylogenetically con-trolled analysis.
Discussion
The comparisons between Britain and Germany revealedthat the patterns of species richness as well as thecomposition of faunas among and within tree generaare approximately similar in Britain and Germany
(Southwood 1961). The only non-significant relationshipwithin the Coccoidea may be explained by the fact thatin both countries this group harbours a large numberof introduced species (Kostarab & Kozár 1988). Themajor implication of these comparisons is that the faunaof phytophages in Britain is not affected by the specialisland situation. Consequently, the biogeographicalpatterns derived from the British fauna are also validfor continental situations.
‒
As in many other studies, the species–area relationshipaccounted for a substantial amount of variance in spe-cies richness across tree genera in Germany. All studieswhich measured abundance of trees considered onlyparts of the distributional ranges of tree species or gen-era, and the present paper is no exception. Abundanceswere estimated for areas selected mainly on the basis ofpolitical boundaries, but political boundaries are notthe limits an insect would recognize (Kuris et al. 1980).Nevertheless the species–area curve derived for Britainpredicts species richness of tree genera in Germanyand vice versa, a clear indication how robust thespecies–area relationship is. However, pollen abundancealso explained an additional part of the variance in spe-cies richness. Note that pollen abundance was derivedfrom samples across Europe and thus covers a largerspatial scale compared to present abundance.
The pollen abundance covers not only a broaderspatial scale than present abundance, but also includesan historical perspective. Fossil abundance based onthe number of Quartenary remains was first used as asubstitute of present tree abundance by Southwood (1961).
Table 3. Summary table of four stepwise multiple regression models (backward elimination) to predict species richness and theproportions of specialists on tree genera native to Germany. r 2 of the models, standardized regression coefficients (beta) and errorprobabilities are given. Significant betas (P < 0·05) are indicated in bold. Prior to the analyses species richness was log10-transformed and the proportions of specialists were arcsine square root transformed. Regressions on contrasts were calculatedwith an intercept of zero. Note that all independent variables were log10-transformed
Independent variables beta P
Species richnessCross-genera (n = 20) Present abundance 0·65 < 0·001
Pollen abundance 0·22 0·063Tree height 0·28 0·011
r 2 0·88 < 0·001Phylogenetic contrasts (n = 19) Present abundance 0·51 0·010
Tree height 0·27 0·007Postglacial occurrence 0·18 0·083Pollen abundance 0·33 0·015
r 2 0·90 < 0·001
Proportion of specialistsCross-genera (n = 20) Present abundance −0·51 0·013
Congeneric species 0·45 0·061Postglacial occurrence 0·44 0·046
r 2 0·59 0·001Phylogenetic contrasts (n = 19) Congeneric species 0·59 0·004
Postglacial occurrence 0·33 0·075r 2 0·63 < 0·001
JAE506.fm Page 497 Monday, April 16, 2001 10:13 AM
498M. Brändle & R. Brandl
© 2001 British Ecological Society, Journal of Animal Ecology, 70,491–504
He found a strong positive relationship, but he didnot use multivariate approaches. Thus we re-analysedthe data of Kennedy & Southwood (1984; only nativespecies) using the data of Huntley (1990). A strongrelationship appeared (cross-genera: n = 16, r2 = 0·63,P < 0·001; phylogenetic independent contrasts: n = 15,r2 = 0·70, P < 0·001). Moreover, in a multiple regres-sion analysis both present abundance in England andpollen abundance entered significantly into themodel. Pollen abundance was much more importantthan present abundance, as judged by the standardizedregression coefficients (cross-genera: n = 16, pollenabundance: beta = 0·68, P < 0·001; present abundance:beta = 0·31, P = 0·077; phylogenetic independentcontrasts: n = 15, pollen abundance: beta = 0·58,P < 0·001; present abundance: beta = 0·22, P = 0·325).
The major drawback of the pollen abundance is thatthis measure mixes spatial and temporal components.Thus at present it is not possible to decide whether theadditional explanatory power of the pollen abundanceis due to the temporal or spatial component. The useof pollen records as a measurement of tree abundancethrough time was criticized by Birks (1980), on the groundsthat each tree genus produces very different amounts ofpollen and fossil pollen preservation depends on morphol-ogy and the sediments in which pollen were located.However, the pollen data used by Southwood (1961),as well as those from Huntley (1990) which were usedin the present study, are based on presence/absence data.
Explicit tests for these mechanisms which generatethe species–area curve are beyond the possibilities of thepresent study. One may only suggest that the passivesampling is probably of minor importance. The passivesampling hypothesis predicts that there is no substantialspecies turnover among trees (Gotelli & Graves 1996,p. 210). The large number of phytophages restricted toonly one tree genus suggests that impoverished faunasare not nested subsets of rich faunas.
After controlling for the species–area relationship,Neuvonen & Niemelä (1981) as well as Kennedy &Southwood (1984) found a significant contribution oftree height on species richness, although it does notcontribute greatly to the explained variance. Also in thepresent study tree height explained a significant part ofthe variance in species richness, even after controllingfor phylogenetic relatedness. Thus, this relationshipseems to be robust across areas and methods. Two mainexplanations have been suggested: first, the correlationresults from a common species–area relationship.Secondly, architectural complexity increases with treesize and large trees provide more niches (Lawton &Schröder 1977; Lawton 1978; Strong & Levin 1979;Kennedy & Southwood 1984; Strong et al. 1984).Neuvonen & Niemelä (1981) doubt the architecturalhypothesis since they included only trees and shrubsinto their analysis, which in their opinion show littlevariations in size and therefore architectural complex-ity. However, there are great differences in size betweenshrubs and trees. For example, Picea abies, the tallest
species in the study by Neuvonen & Niemelä (1981),reaches 25 m whereas the smallest, Rubus ceasius L.,reaches only 0·25 m (see also Appendix 2). Neverthe-less, one may argue that height per se is not a suitablemeasure of architectural complexity. Various othermorphological features, such as branching structure,are more convincing surrogates for architectural com-plexity, although it may be difficult to design a measureof complexity which allows comparison of the architec-ture across tree genera. Nevertheless, such attempts areneeded in future studies.
When Rosenzweig (1995) reanalysed the data of Kennedy& Southwood (1984) he failed to find support for thegeological time hypothesis. In his analysis he excludedtrees introduced by man (see also Birks 1980). Similarly,in the analysis of species richness of phytophages ontree genera in Germany the time a species was presentsince the last glaciation (postglacial occurrence) did notremain in the multiple regression model. However, notethat for phylogenetic contrasts postglacial occurrencehad some marginal significance. In general, the avail-able analyses do not provide convincing support for thegeological time hypothesis. The results so far are notrobust across areas and methods.
As well as technical problems with the measure usedto estimate postglacial history, two arguments may causedoubts about a simple correlation between species rich-ness and postglacial occurrence. First, all tree generahave evolved before the Pleistocene. Thus, the time for theevolution of a phytophage–host association may beindependent of re-colonization patterns of trees afterthe Pleistocene and consequently the time measure usedin the analyses operates on the wrong scale. Secondly, thegeological time hypothesis assumes that trees bring fewphytophages from their Pleistocene refuges. Phytophagescertainly followed their hosts (see Eber & Brandl 1994).
Despite the different methods applied to measuretaxonomic isolation, most studies found a significantcontribution of taxonomic isolation on host phyto-phagous species richness (Lawton & Schröder 1977;Connor, Simberloff & Oppler 1980; Neuvonen &Niemelä 1981; Kennedy & Southwood 1984; Leather1990). In the present study, taxonomic isolation showedonly in the univariate analysis a significant positiverelationship with species richness of phytophages.Thus, the importance of taxonomic isolation affectingspecies richness of phytophages remains dubious.
‒
The processes shaping the specialist/generalist ratioon hosts are far from clear, as results varied greatly
JAE506.fm Page 498 Monday, April 16, 2001 10:13 AM

499Insects and mites on trees
© 2001 British Ecological Society, Journal of Animal Ecology, 70,491–504
between studies (e.g. Lawton & Schröder 1978). Neuvonen& Niemelä (1981) favoured the plant predictability–apparency hypothesis (Levins & MacArthur 1969) whenthey analysed the proportions of specialized Macro-lepidoptera on Finnish deciduous trees and shrubs. Theyfound a significant positive relationship betweenproportions of specialists (or negative relationshipof proportions of polyphagous, respectively) and thetotal number of species as well as the abundance oftrees as predicted by the plant predictability–apparencyhypothesis. The data from this study failed to find sucha correlation (see also Andow & Imura 1994). On thecontrary, the findings of the present study providesome support for of the coevolutionary hypothesis: post-glacial occurrence and the number of congeneric specieswere positively related to the proportions of specialistseven when we controlled for phylogenetic relatedness.To find further support for a correlation between theproportion of specialists and postglacial occurrence,the data of Neuvonen & Niemelä (1981) on tree-feedingMacrolepidoptera were analysed. Although the authorsdefined specialists as species restricted to one hostplant family, and we used the postglacial occurrencedata from Germany, a marginally positive relationshipappeared (cross-genera: n = 14, r2 = 0·25, P = 0·07; phylo-genetic independent contrasts: n = 13, r2 = 0·17, P =0·14; proportions of specialists were arcsine square root-transformed). Andow & Imura (1994) provided furthermore direct support for the coevolutionary hypothesis.They found that arthropod communities on invasivecrops in Japan become increasingly specialized overtime.
Conclusions
In sum, the results of the present study expand Kennedy& Southwood (1984) and demonstrate that the patternsreported by them also hold for Germany. Thus, the factthat Britain is an island has not biased the analyses ofSouthwood and coworkers. Furthermore, most of thepatterns reported by Kennedy & Southwood are notaffected by the phylogenetic relationships of tree genera.However, it should be noted that some patterns are nottestable within a phylogenetic framework. In Europe,most of the gymnosperm trees are evergreen whereasmost angiopserm trees are deciduous. Thus with Euro-pean trees it is not possible to test whether ‘evergreen-ness’ has an effect on species richness of phytophages.Beyond Southwood, the present study emphasizes therole of coevolutionary processes for the composition ofphytophage faunas, especially the relative number ofspecialized phytophages.
Acknowledgements
We thank G. Lang and J. Settele for informationsabout data sources. T.R.E. Southwood, C.K. Kellyand K.J. Gaston commented on earlier drafts of ourpaper.
References
Andow, D.A. & Imura, O. (1994) Specialization of phyto-phagous arthropod communities on introduced plants.Ecology, 75, 296–300.
Anonymous (1992) Multalin 4.0, Multiple Sequence Align-ment. Cherwell Scientific Publishing, Oxford.
Benkert, D., Fukarek, F. & Korsch, H. (1996) Verbreitungsatlasder Farn- und Blütenpflanzen Ostdeutschlands. Fischer,Jena.
Bense, U. (1996) Bockkäfer. Markgraf, Stuttgart.Berenbaum, M. (1983) Coumarins and caterpillars: a case
study for coevolution. Evolution, 37, 163–179.Birks, H.J.B. (1980) British trees and insects: a test of the time
hypothesis over the last 13 000 years. American Naturalist,115, 600–605.
Blackmann, R.L. & Eastop, V.F. (1994) Aphids on the World’sTrees. CABI, Cambridge.
Börner, C. (1952) Europae Centralis Aphides. Die BlattläuseMitteleuropas, Namen, Synonyme, Wirtspflanzen, Genera-tionszyklen. Mitteilungen der Thüringer BotanischenGesellschaft Beiheft, 3, pp. 1–488. Weimar.
Boucot, A.J. (1983) Area-dependent-richness hypotheses andrates of parasite/pest evolution. American Naturalist, 121,294–300.
Buhr, H. (1965) Bestimmungstabellen der Gallen (Zoo- undPhytocecidien) an Pflanzen Mittel- und Nordeuropas.Fischer, Jena.
Burga, C. & Perret, R. (1998) Vegetation und Klima derSchweiz seit dem Jüngeren Eiszeitalter. Ott, Thun.
Bush, A.O., Aho, J.M. & Kennedy, C.R. (1990) Ecologicalversus phylogenetic determinants of helminth parasitecommunities. Evolutionary Ecology, 4, 1–20.
Campbell, C.S., Donoghue, M.J., Baldwin, B.G. &Wojciechowski, M.F. (1995) Phylogenetic relationships inMaloidea (Rosaceae): Evidence from sequences of internaltranscribed spacers of nuclear ribosomal DNA and itscongruence with morphology. American Journal of Botany,82, 903–918.
Chase, M.W., Soltis, D.E., Olmstead, R.G., Morgan, D., Les,D.H., Mishler, B.D., Duvall, M.R., Price, R.A., Hills,H.G., Qiu, Y.-L., Kron, K.A., Rettig, J.H., Conti, E.,Palmer, J.D., Manhart, J.R., Sytsma, K.J., Michaels, H.J.,Kress, W.J., Karol, K.G., Clark, W.D., Hedrén, M., Gaut, B.S.,Jansen, R.K., Kim, K.-J., Wimpee, C.F., Smith, J.F.,Furnier, G.R., Strauss, S.H., Xiang, Q.-Y., Plunkett, G.M.,Soltis, P.S., Swensen, S., Williams, S.E., Gadek, P.A.,Quinn, C.J., Eguiarte, L.E., Golenberg, E., Learn, G.H.,Graham, S.W. Jr, Barrett, S.C.H., Dayanandan, S. &Albert, V.A. (1993) Phylogenetics of seed plants: an analysisof nucleotide sequences from the plastid gene rbcL. Annalsof the Missouri Botanical Garden, 80, 528–580.
Claridge, M.F. & Wilson, M.R. (1978) British insects andtrees: a study in island biogeography or insect/ plantcoevolution? American Naturalist, 112, 451–456.
Connor, E.F. & McCoy, E.D. (1979) The statistics and bio-logy of the species–area relationship. American Naturalist,113, 791–833.
Connor, E.F., Simberloff, S.H. & Opler, P.A. (1980) Taxo-nomic isolation and the accumulation of herbivorousinsects: a comparison of native and introduced trees. Eco-logical Entomology, 5, 205–211.
Crawley, M.J. (1993) Glim for Ecologists. Blackwell, London.Dennis, R.L.H. (1977) The British Butterflies. Their origin and
establishment. E.W. Classey, Faringdon, Oxon.Dieckmann, L. (1972) Beiträge zur Insektenfauna der DDR
Coleoptera – Curculionidae Ceutorhynchinae. BeiträgeZur Entomologie Berlin, 22, 3–128.
Dieckmann, L. (1974) Beiträge zur Insektenfauna der DDRColeoptera – Curculionidae (Rhinomacerinae, Rhynchitinae,
JAE506.fm Page 499 Monday, April 16, 2001 10:13 AM
500M. Brändle & R. Brandl
© 2001 British Ecological Society, Journal of Animal Ecology, 70,491–504
Attelabinae, Apoderinae). Beiträge Zur Entomologie Berlin,24, 5–54.
Dieckmann, L. (1980) Beiträge zur Insektenfauna der DDRColeoptera – Curculionidae (Brachycerinae, Otiorhynchinae,Brachyderinae). Beiträge Zur Entomologie Berlin, 30, 145–310.
Dieckmann, L. (1988) Beiträge zur Insektenfauna der DDRColeoptera – Curculionidae (Curculioninae Ellescini,Acalyptini, Tychiini, Anthonomini, Curculionini). BeiträgeZur Entomologie Berlin, 38, 365–468.
Eber, S. & Brandl, R. (1994) Ecological and genetic spatialpatterns of Urophora cardui (Diptera: Tephritidae) asevidence for population structure and biogeographicalprocesses. Journal of Animal Ecology, 63, 187–199.
Ebert, G. (ed.) (1994a) Die Schmetterlinge Baden-Württembergs.Band 3. Ulmer, Stuttgart.
Ebert, G. (ed.) (1994b) Die Schmetterlinge Baden-Württembergs.Band 4. Ulmer, Stuttgart.
Ebert, G. (ed.) (1997a) Die Schmetterlinge Baden-Württembergs.Band 5. Ulmer, Stuttgart.
Ebert, G. (ed.) (1997b) Die Schmetterlinge Baden-Württembergs.Band 6. Ulmer, Stuttgart.
Ebert, G. (ed.) (1998) Die Schmetterlinge Baden-Württembergs.Band 7. Ulmer, Stuttgart.
Ebert, G. & Rennwald, E. (eds) (1991a) Die SchmetterlingeBaden-Württembergs. Band 1. Ulmer, Stuttgart.
Ebert, G. & Rennwald, E. (eds) (1991b) Die SchmetterlingeBaden-Württembergs. Band 2. Ulmer, Stuttgart.
Eckstein, K. (1933) Die Schmetterlinge Deutschlands mitbesonderer Berücksichtigung ihrer Biologie und wirtschaftlichenBedeutung. Band 5. Die Kleinschmetterlinge Deutschlans.K.G. Lutz, Stuttgart.
Feeny, P. (1970) Seasonal changes in oak leaf tannins andnutrients as a cause of spring feeding by winter mothcaterpillars. Ecology, 51, 565–581.
Felsenstein, J. (1985) Phylogenies and the comparativemethod. American Naturalist, 125, 1–12.
Felsenstein, J. (1993) PHYLIP (Phylogeny Inference Package),Version 3.5c. Distributed by the author. Department ofGenetics, University of Washington, Seattle.
Fielding, C.A. & Coulson, J.C. (1995) A test of the validity ofinsect food–plant and life-history records: Lepidoptera onheather (Calluna vulgaris). Ecological Entomology, 20,343–350.
Firbas, F. (1949) Spät- und nacheiszeiliche WaldgeschichteMitteleuropas nördlich der Alpen. 1. Band: AllgemeineWaldgeschichte. Fischer, Jena.
Fitschen, J. (1987) Gehölzflora. Quelle & Mayer, Heidelberg,Wiesbaden.
Frenzel, M. & Brandl, R. (2000) Phytophagous insectassemblages and the regional species pool: patterns andasymmetries. Global Ecology and Biogeography, 9, 293–305.
Freude, H., Harde, W. & Lohse, G.A., eds (1965–85) DieKäfer Mitteleuropas. Band 1–14. Goecke & Evers, Krefeld.
Garland, T., Harvey, P.H. & Ives, A.R. (1992) Procedures forthe analysis of comparative data using phylogeneticallyindependent contrasts. Systematic Biology, 41, 18–32.
Gaston, K.J. & Blackburn, T.M. (2000) Pattern and Process inMacroecology. Blackwell, London.
Gotelli, N.J. & Graves, G.R. (1996) Null Models in Ecology.Smithsonian Institute Press, Washington.
Hannemann, H.J. (1961) Kleinschmetterlinge oder Microlepi-doptera I Die Wickler (s. str.) (Tortricidae). Die TierweltDeutschlands 48. Teil (eds M. Dahl & H. Bischoff), pp. 1–233. Fischer, Jena.
Hannemann, H.J. (1964) Kleinschmetterlinge oderMicrolepidoptera II Die Wickler (s. l.) (Cochylidae undCarposinididae) Die Zünslerartigen (Pyraloidea). DieTierwelt Deutschlands 50. Teil (eds M. Dahl & H. Bischoff ),pp. 1–356. Fischer, Jena.
Hannemann, H.J. (1977) Kleinschmetterlinge oder
Microlepidoptera III Federmotten (Pterophoridae),Gespinstmotten (Yponomeutidae), Echte Motten(Tineidae). Die Tierwelt Deutschlands 63. Teil (eds M. Dahl& H. Bischoff ), pp. 1–273. Fischer, Jena.
Hannemann, H.J. (1995) Kleinschmetterlinge oder Micro-lepidoptera IV Flachleibmotten (Depressariidae). DieTierwelt Deutschlands 69. Teil (ed. K. Senglaub), pp. 1–189.Fischer, Jena.
Hannemann, H.J. (1997) Kleinschmetterlinge oder Micro-lepidoptera V Oecophoridae, Chimabachidae, Carcinidae,Ethmiidae, Stathmopodidae. Die Tierwelt Deutschlands 70.Teil (ed. K. Senglaub), pp. 1–163. Fischer, Jena.
Harvey, P.H. & Pagel, M.D. (1991) The Comparative Methodin Evolutionary Biology. Oxford University Press, Oxford.
Häupler, H. & Schönfelder, P. (1989) Atlas der Farn- undBlütenpflanzen der Bundesrepublik Deutschland. Ulmer,Stuttgart.
Hengeveld, R. & Haeck, J. (1982) The distribution of abund-ance. 1. Measurements. Journal of Biogeography, 9, 303–316.
Hering, E.M. (1957) Bestimmungstabellen der Blattminen VonEuropa Einschließlich Des Mittelmeerbeckens und derKanarischen Inseln. Uitgeverij Dr W. Junk, ’sGravenhage.
Huntley, B. (1990) European vegetation history: palaeovege-tation maps from pollen data – 13 000 yr to present.Journal of Quaternary Science, 5, 103–122.
Ingrouille, M. (1995) Historical Ecology of the British Flora.Chapman & Hall, London.
Kelly, C.K. & Southwood, T.R.E. (1999) Species richness andresource availability: a phylogenetic analysis of insects asso-ciated with trees. Proceedings of the National Academy ofScience, USA, 96, 8013–8016.
Kennedy, C.E.J. & Southwood, T.R.E. (1984) The number ofspecies of insects associated with British trees: a re-analysis.Journal of Animal Ecology, 53, 455–478.
Kitching, I.J., Forey, P.L., Humphries, C.J. & Williams, D.M.(1998) Cladistics. 2nd edn. Oxford University Press,Oxford.
Klimaszewski, S.M. (1973) The jumping plant lice or Psyllids(Homoptera, Psyllodea) of the Palaearctic. An annotedchecklist. Annales Zoolgici Warszawa, 30, 155–286.
Koch, M. (1988) Wir Bestimmen Schmetterlinge. NeumannNeudamm, Berlin.
Kostarab, M. & Kozár, F. (1988) Scale Insects of CentralEurope. Kluwer, Dordrecht.
Kuris, A.M., Blaustein, A.R. & Alio, J.J. (1980) Hosts asislands. American Naturalist, 116, 570–586.
Lang, G. (1994) Quartäre Vegetationsgeschichte Europas.Methoden und Ergebnisse. Fischer, Jena.
Lawton, J.H. (1978) Host–plant influences on insects diver-sity: the effects of space and time. Symposium of the RoyalEntomological Society London, 9, 105–125.
Lawton, J.H., Cornell, H., Dritschilo, W., Hendrix, S.D.(1981) Species as islands: comment on a paper by Kuriset al. American Naturalist, 116, 623–627.
Lawton, J.H. & Price, P.W. (1979) Species richness of parasiteson hosts: agromyzid flies on the British Umbelliferae. Jour-nal of Animal Ecology, 48, 619–637.
Lawton, J.H. & Schröder, D. (1977) Effects of plant type, sizeof geographical range and taxonomic isolation on numberof insect species associated with Brithish plants. Nature,265, 137–140.
Lawton, J.H. & Schröder, D. (1978) Some observations onthe structure of phytophagous insect communities: theimplications for biological control. Proceedings of the 4thInternational Symposium on Biological Control of Weeds(ed. T.E. Freeman), pp. 57–73, Gainesville, Florida.
Leather, S.R. (1986) Insect species richness on the BritishRosaceae: the importance of host range, plant architecture,age of establishment, taxonomic isolation and species–arearelationships. Journal of Animal Ecology, 55, 841–860.
JAE506.fm Page 500 Monday, April 16, 2001 10:13 AM

501Insects and mites on trees
© 2001 British Ecological Society, Journal of Animal Ecology, 70,491–504
Leather, S.R. (1990) The analysis of species–area relation-ships, with particular reference to macrolepidoptera onRosaceae: how important is insect data-set quality? Ento-mologist, 109, 8 –16.
Leather, S.R. (1991) Feeding specialisation and host distributionof British and Finnish Prunus feeding Macrolepidoptera.Oikos, 60, 40–48.
Levins, R. & MacArthur, R.H. (1969) A hypothesis to explainthe incidence of monophagy. Ecology, 50, 910–911.
Lohse, G.A. & Lucht, W.H. (1989) Die Käfer Mitteleuropas.Band 12. Goecke & Evers, Krefeld.
Lohse, G.A. & Lucht, W.H. (1992) Die Käfer Mitteleuropas.Band 13. Goecke & Evers, Krefeld.
Lohse, G.A. & Lucht, W.H. (1994) Die Käfer Mitteleuropas.Band 14. Goecke & Evers, Krefeld.
Lucht, W.H. (1998) Die Käfer Mitteleuropas. Band 15. Goecke& Evers, Krefeld.
MacArthur, R.H. & Wilson, E.O. (1967) The Theory of IslandBiogeography. Princeton University Press, Princeton.
McArdle, B.H. (1988) The structural relationship: regressionin biology. Canadian Journal of Zoology, 66, 2329–2339.
Moulet, P. (1995) Hemiptères Coreoidea Euro-Mèditerranéens.Faune de France 69. Fédération Francaise des Sociétés deSciences Naturelles, Paris.
Mound, L.A. & Halsey, S.H. (1978) Whitefly of the World. Asystematic catalogue of the Aleyrodidae (Homoptera) withhost plant and natural enemy data. British Museum of NaturalHistory, London.
Muche, W.H. (1968) Die Blattwespen Deutschlands. I. Ten-thredinidae (Hymenoptera). Entomologische AbhandlungenStaatliches Museum für Tierkunde Dresden, 36 (Suppl.),1–58.
Muche, W.H. (1969a) Die Blattwespen Deutschlands. II.Selanddriinae (Hymenoptera). Entomologische Abhand-lungen Staatliches Museum für Tierkunde Dresden, 36(Suppl.), 61–96.
Muche, W.H. (1969b) Die Blattwespen Deutschlands. III.Blennocampinae (Hymenoptera). Entomologische Abhan-dlungen Staatliches Museum für Tierkunde Dresden, 36(Suppl.), 98–155.
Muche, W.H. (1970) Die Blattwespen Deutschlands. IV.Nematinae (Hymenoptera). Entomologische AbhandlungenStaatliches Museum für Tierkunde Dresden, 36 (Suppl.),157–236.
Muche, W.H. (1974) Die Nematinengattungen PristiphoraLatreille, Pachynematus Konow und Nematus Panzer (Hym.Tenthredinidae). Deutsche Entomologische Zeitschrift, NF,21, 1–137.
Muche, W.H. (1975) Die Blattwespen Mitteleuropas. DieGattung Amauronematus Konow (Hymenoptera, Nemat-inae). Entomologische Abhandlungen Staatliches Museumfür Tierkunde Dresden, 40 (Suppl.), 1–53.
Muche, W.H. (1977) Die Blattwespen Mitteleuropas. DieGattung Nematinus Rohw., Euura Newm. und CroseusLeach (Nematinae) sowie Heterarthrus Steph. (Heterar-thrinae) (Hymenoptera, Nematinae et Heterarthrinae).Entomologische Abhandlungen Staatliches Museum fürTierkunde Dresden, 41 (Suppl.), 1–21.
Nast, J. (1972) Palaearctic Auchenorrhyncha (Homoptera), anAnnotated Check List. Polish Science Publications,Warszawa.
Neuvonen, S. & Niemelä, P. (1981) Species richness ofMacrolepidoptera on Finnish deciduous shrubs andtrees. Oecologia, 51, 364–370.
Niemelä, P. & Neuvonen, S. (1983) Species richness of herbiv-ores on hosts: how robust are patterns revealed by analysingpublished host plant lists. Annales Entomologici Fennici, 49,95–99.
Ossiannilsson, F. (1978) The Auchenorrhyncha (Homoptera)of Fennoscandica and Denmark. Part 1. Indroductioninfraorder Fulgoromorpha. Fauna Entomologica Scandi-
navica, 7, pp. 1–222. Scandinavian Science Press Ltd,Klampenbourg, Denmark.
Ossiannilsson, F. (1981) The Auchenorrhyncha (Homoptera)of Fennoscandica and Denmark. Part 2. The families Cica-didae, Cercopidae, Membracidae and Cicadellidae. FaunaEntomologica Scandinavica, 7, pp. 223–593. ScandinavianScience Press Ltd, Klampenbourg, Denmark.
Ossiannilsson, F. (1983) The Auchenorrhyncha (Homoptera)of Fennoscandica and Denmark. Part 3. The familyCicadellidae Deltocephalinae, Catalogue, Literature andIndex. Fauna Entomologica Scandinavia, 7, pp. 594–979.Scandinavian Science Press Ltd, Klampenbourg, Denmark.
Pagel, M.D. (1992) A method for the analysis of comparativedata. Journal of Theoretical Biology, 156, 431–442.
Péricart, J. (1983) Hémiptères Tingidae Euro-Méditerranéens.Faune de France 69. Fédération Francaise des Sociétés deSciences Naturelles, Paris.
Péricart, J. (1984) Hémiptères Berytidae Euro-Méditerranéens.Faune de France 70. Fédération Francaise des Sociétés deSciences Naturelles, Paris.
Pfeffer, A. (1994) Zentral- und Westpaläarktische Borken- undKernkäfer (Coleoptera Scolytidae, Platypodidae). Entomol-ogica Basiliensia, 17, 5–31.
Price, P.W. (1997) Insect Ecology. 3rd edn. John Wiley & Sons,Inc., New York.
Purvis, A. & Rambaut, A. (1995) Comparative analysisby independent contrasts (CAIC): an Apple Macintoshapplication for analysing comparative data. ComputerApplications in Biosciences, 11, 247–251.
Rayner, J.M. (1985) Linear relations in biomechanics: thestatistics of scaling functions. Journal of Zoology London(A), 206, 415–439.
Rhoades, D.F. & Cates, R.G. (1976) Towards a general theoryof plant antiherbivore chemistry. Recent Advance in Phyto-chemistry, 10, 168–213.
Rosenzweig, M.L. (1995) Species Diversity in Space and Time.Cambridge University Press, Cambridge.
Rothmaler, W. (1987). Exkursionsflora für die Gebiete derDDR und der BRD. Band 3, Atlas der Gefäßpflanzen. Volk &Wissen, Berlin.
Schliephake, G. & Klimt, K. (1979) Thysanoptera. DieTierwelt Deutschlands 66. Teil (ed. K. Senglaub), pp. 1–477.Fischer, Jena.
Schmutterer, H. (1959) Schildläuse oder Coccoidea. DieTierwelt Deutschlands 45. Teil (eds M. Dahl & H. Bischoff ),pp. 1–260. Fischer, Jena.
Schwenke, W., ed. (1972–82) Die Forstschädlinge Europas.Parey, Hamburg.
Sebald, O., Seybold, S. & Philippi, G., eds (1990a, 1990b, 1992,1996) Die Farn- und Blütenpflanzen Baden-Württembergs.Ulmer, Stuttgart.
Sebald, O., Seybold, S. & Philippi, G., eds (1990b) Die Farn-und Blütenpflanzen Baden-Württembergs. Ulmer, Stuttgart.
Sebald, O., Seybold, S. & Philippi, G., eds (1992) Die Farn-und Blütenpflanzen Baden-Württembergs. Ulmer, Stuttgart.
Sebald, O., Seybold, S. & Philippi, G., eds (1996) Die Farn-und Blütenpflanzen Baden-Württembergs. Ulmer, Stuttgart.
Skuhravá, M. & Skuhravy, V. (1997) Gall midges (Diptera:Cecidomyiidae) of Switzerland. Mitteilungen der Sch-weizerischen Entomologischen Gesellschaft, 70, 133–176.
Southwood, T.R.E. (1961) The number of species of insectassociated with various trees. Journal of Animal Ecology,30, 1–8.
Southwood, T.R.E., Moran, V.C. & Kennedy, C.E.J. (1982)The richness, abundance and biomass of the arthropod com-munities on trees. Journal of Animal Ecology, 51, 635–649.
Spencer, K.A. (1990) Host Specialisation in the World Agro-myzidae. Kluwer, Dordrecht.
Strong, D.R. (1974) The insects of British trees: communityequilibration in ecological time. Annals of the MissouriBotanical Garden, 61, 692–701.
JAE506.fm Page 501 Monday, April 16, 2001 10:13 AM

502M. Brändle & R. Brandl
© 2001 British Ecological Society, Journal of Animal Ecology, 70,491–504
Strong, D.R., Lawton, J.H. & Southwood, T.R.E. (1984)Insects on plants. Community Patterns and Mechanisms.Blackwell, London.
Strong, D.R. & Levin, D.A. (1979) Species richness of plantparasites and growth form of their hosts. American Natur-alist, 114, 1–22.
Vitzthum, H. (1929) Spinnentiree. 5. Ordnung, Milben, Acari.Die Tierwelt Mitteleuropas 3, 3. Lieferung (eds P. Brohmer,E. Ehrmann & G. Ulmer), pp. 1–155. Quelle & Meyer,Leipzig.
Wagner, E. (1952) Blindwanzen oder Miriden. Die TierweltDeutschlands und der Angrenzenden Meeresteile. 41. Teil(eds M. Dahl & H. Bischoff ), pp. 1–218. Fischer, Jena.
Wagner, E. (1966) Wanzen oder Heteropteren. I. Pentatomorpha.Die Tierwelt Deutschlands und der Angrenzenden Meeresteile.54. Teil (eds M. Dahl & F. Peus), pp. 1–235. Fischer,Jena.
Wagner, E. (1967) Wanzen oder Heteropteren. II Cimicomor-pha. Die Tierwelt Deutschlands und der AngrenzendenMeeresteile. 55. Teil (eds M. Dahl & F. Peus), pp. 1–179.Fischer, Jena.
Wagner, E. (1970/71) Die Miridae Hahn, 1831, des Mittel-
meerraumes und der Makaronesischen Inseln. Part 1.Entomologische Abhandlungen Museum Tierkunde,Dresden.
Wagner, E. (1973) Die Miridae Hahn, 1831, des Mittelmeer-raumes und der Makaronesischen Inseln. Part 2. Entomolo-gische Abhandlungen Museum Tierkunde, Dresden.
Wagner, E. (1975) Die Miridae Hahn, 1831, des Mittelmeer-raumes und der Makaronesischen Inseln. Part 3. Entomolo-gische Abhandlungen Museum Tierkunde, Dresden.
Wagner, E. (1978) Die Miridae Hahn, 1831, des Mittel-meerraumes und der Makaronesischen Inseln. Part 4.Entomologische Abhandlungen Museum Tierkunde,Dresden.
Williams, C.B. (1943) Area and the number of species. Nature,152, 264–267.
World Resource Institute (WRI) (1999) World Resources1998–99. A Guide to the Global Environment. OxfordUniversity Press, Oxford.
Zahradnik, J. (1963) Aleyrodina. Die Tierwelt Mitteleuropas4, 3, Xd. (ed. H. Brohmer), pp. 1–19. Quelle & Meyer, Leipzig.
Received 30 August 2000; revision received 16 January 2001
JAE506.fm Page 502 Monday, April 16, 2001 10:13 AM

503Insects and m
ites on trees
© 2001 B
ritish E
cological Society, Journal of A
nimal
Ecology, 70,
491–504
Appendix 1
The number of phytophages associated with trees in Germany: Buhr (1965)1, Vitzthum (1929)2, Freude, Harde & Lohse (1965–85)3, Lohse & Lucht (1989, 1992, 1994)4, Lucht (1998)5, Pfeffer (1994)6, Bense (1996)7,Dieckmann (1972, 1974, 1980, 1988)8, Hering (1957)9, Spencer (1990)10, Skuhravá & Skuhravy (1997)11, Wagner (1952, 1966, 1967, 1970/71, 1973, 1975, 1978)12, Péricart (1983, 1984)13, Moulet (1995)14,Ossiannilsson (1978, 1981, 1983)15, Nast (1972)16, Klimaszewski (1973)17, Börner (1952)18, Blackmann & Eastop (1994)19, Zahradnik (1963)20, Mound & Halsey (1978)21, Schmutterer (1959)22, Kostarab & Kozár(1988)23, Muche (1968, 1969a, 1969b, 1970, 1974, 1975, 1977)24, Schwenke (1972, 1982)25, Koch (1988)26, Ebert & Rennwald (1991a, 1991b)27, Ebert (1994a, 1994b, 1997a, 1997b, 1998)28, Eckstein (1933)29,Hannemann (1961, 1964, 1977, 1995, 1997)30, Schliephake & Klimt (1979)31. ERI = Eriophyidae (Acarina), COL = Coleoptera, AGR = Agromyzidae (Diptera), CEC = Cecidomyiidae (Diptera), HET = Heteroptera,AUC = Auchenorrhyncha (Homoptera), PSY = Psylloidea (Homoptera), APH = Aphidoidea (Homoptera), ALE = Aleyrodoidea (Homoptera), COC = Coccoidea (Homoptrea), SYM = Symphyta(Hymenoptera), CYN = Cynipoidea (Hymenoptera), MAC = Macro-Lepidoptera, MIC = Micro-Lepidoptera, THY = Thysanoptera.
ERI1,2 COL3,4,5,6,7,8 AGR1,9,10 CEC1,11 HET12,13,14 AUC15,16 PSY17 APH18,19 ALE20,21 COC22,23 SYM24,25 CYN1,25 MAC26,27,28 MIC29,30 THY31
Abies – 73 – 3 6 3 – 9 – 11 15 – 14 31 –Acer 8 51 – 8 6 11 1 16 4 13 10 1 44 37 –Alnus 9 96 2 3 17 27 4 9 – 9 28 – 86 52 7Betula 8 106 2 7 8 20 3 18 1 13 51 – 140 115 7Carpinus – 53 1 6 3 8 – 1 2 10 6 – 39 27 2Corylus 4 90 1 9 13 11 1 2 1 11 11 – 63 38 4Crataegus 4 73 1 6 2 11 2 10 1 11 16 – 67 68 1Fagus 3 99 – 8 12 7 – 2 1 12 5 – 72 47 7Fraxinus 4 41 1 5 10 2 4 2 1 12 7 – 35 16 5Ilex – 6 1 – – – – 2 – 2 – – 1 – –Juniperus 1 11 – 6 13 2 – 1 – 4 2 – 10 15 3Larix 1 48 – 1 5 – – 8 – – 14 – 11 15 1Malus 4 55 2 1 5 4 2 15 – 14 4 – 60 75 1Picea – 127 – 6 21 6 – 20 – 8 24 – 30 34 3Pinus 1 160 – 4 26 5 – 24 – 11 31 – 24 43 6Populus 7 139 7 12 10 19 1 26 – 10 32 – 130 71 6Prunus 6 90 1 5 4 9 4 16 – 12 18 – 147 121 3Pyrus 4 56 – 3 9 2 3 17 1 15 7 – 49 58 1Quercus 4 208 – 8 39 24 1 14 1 19 22 45 168 137 9Rhamnus 1 13 – 2 4 4 5 7 – 5 – – 30 20 –Salix 10 197 8 38 26 30 8 30 1 10 95 – 169 97 9Sorbus 3 36 1 2 1 6 2 9 – 10 12 – 28 47 –Taxus 2 1 – 1 – – – – – 3 – – 1 1 –Tilia 5 52 – 8 9 8 – 2 – 11 3 – 77 26 6Ulmus 4 81 – 4 9 13 1 17 – 7 7 – 54 36 4
JAE
506.fm P
age 503 Monday, A
pril 16, 2001 10:13 AM

504M. Brändle & R. Brandl
© 2001 British Ecological Society, Journal of Animal Ecology, 70,491–504
Appendix 2
List of untransformed dependent and independent variables: Benkert et al. (1996)1, Häupler & Schönfelder (1989)2, Huntley(1990)3, Fitschen (1987)4, Lang (1994)5, Firbas (1949)6, Burga & Perret (1998)7, Sebald et al. (1990a, 1990b, 1992, 1996)8,Rothmaler (1987)9. Transformation of variables as used for statistical analyses in brackets.
Total number of phytophages ( log10)
Number of specialists (arcsine – square root)
Present abundance1,2
( log10)
Pollen abundance Europe3 ( log10)
Congeneric species in Germany4
( log10)
Postglacial occurrence5,6,7,8 ( log10)
Tree height (m)9
( log10)
Abies 165 31 1335 795 1 5 000 50Acer 210 77 2917 292 5 8 000 25Alnus 349 82 2976 3419 3 8 000 25Betula 499 133 2987 4103 5 14 000 25Carpinus 158 13 2825 788 1 4 000 20Corylus 259 33 2871 2904 1 9 500 6Crataegus 273 43 2901 – 2 5 500 10Fagus 275 44 2878 1026 1 6 000 40Fraxinus 145 43 2928 900 2 8 000 40Ilex 12 3 1030 49 1 6 500 6Juniperus 68 45 1729 784 3 14 000 12Larix 104 27 1590 106 1 11 000 35Malus 242 29 1493 – 1 6 000 10Picea 279 75 2222 2048 1 5 200 50Pinus 335 157 2708 4122 3 14 000 40Populus 470 151 2936 208 3 12 000 30Prunus 436 94 2945 – 5 12 000 25Pyrus 225 29 1738 – 1 4 500 20Quercus 699 252 2921 2702 3 10 000 40Rhamnus 91 29 2896 67 3 12 000 4Salix 728 312 2983 2087 22 12 000 30Sorbus 157 31 2928 – 4 12 000 15Taxus 9 4 470 51 1 8 000 15Tilia 207 28 2238 1535 2 9 000 30Ulmus 237 61 2514 2236 3 10 000 40
JAE506.fm Page 504 Monday, April 16, 2001 10:13 AM