special dividends and the evolution of dividend...
TRANSCRIPT

qWe appreciate the useful comments and suggestions of David Denis, Ananth Madhavan, RonMasulis, Kevin J. Murphy, Pat O'Brien, Jay Ritter, ReneH Stulz, Mike Weisbach, and especially JimBrickley (the referee) and Larry Dann. We thank Arezou Motamedi, Steve Sedmak, Robert Sosa,Michael Wartena, and especially Sharon Sun for research assistance. Financial support wasprovided by the Marshall School of Business at USC (Charles E. Cook/Community Bank andKenneth King Stonier Chairs) and the University of Michigan Business School (KPMG Professor-ship).
*Corresponding author.
E-mail address: [email protected] (H. DeAngelo).
Journal of Financial Economics 57 (2000) 309}354
Special dividends and the evolution ofdividend signalingq
Harry DeAngelo!,*, Linda DeAngelo!, Douglas J. Skinner"
!Marshall School of Business, University of Southern California, Los Angeles, CA 90089, USA"University of Michigan Business School, Ann Arbor, MI 48109, USA
Received 14 January 1999; received in revised form 19 November 1999
Abstract
This paper documents that (1) special dividends were once commonly paid by NYSE"rms, but are now rarely paid; (2) "rms typically paid specials almost as predictably asthey paid regular dividends; (3) despite the dramatic overall decline in specials, theincidence of very large specials increased in recent years; and (4) special dividends werenot displaced by stock repurchases. Most plausibly, small specials disappeared becausetheir predictability made them close substitutes for regular dividend signals, whilelarge specials survived because their sheer size automatically di!erentiates them fromregulars. ( 2000 Elsevier Science S.A. All rights reserved.
JEL classixcation: G35; D82
Keywords: Dividend policy; Payout policy; Special dividends; Signaling; Stock repur-chases
0304-405X/00/$ - see front matter ( 2000 Elsevier Science S.A. All rights reserved.PII: S 0 3 0 4 - 4 0 5 X ( 0 0 ) 0 0 0 6 0 - X
1. Introduction
Dividend signaling plays a prominent role in corporate "nance theory, withnumerous studies outlining scenarios in which managers use cash dividends toconvey information about "rm pro"tability [see, e.g., Bhattacharya, 1979; Millerand Rock, 1985; John and Williams, 1985; and more recent papers cited in Allenand Michaely's (1995) survey of the dividend literature]. However, few empiricalstudies indicate that signaling is pervasively important, although some researchsuggests it might be important in limited circumstances [see e.g., DeAngeloet al., 1996; Benartzi et al., 1997; and many earlier studies cataloged by Allen andMichaely]. In their comprehensive survey, Allen and Michaely (1995, p. 825)state that `2the empirical evidence (on dividend signaling) is far from conclus-ive2 more research on this topic is neededa. The juxtaposition of continuedstrong theoretical interest in signaling models on the one hand, with limitedempirical support on the other, has made the relevance of dividend signaling animportant unresolved issue in corporate "nance.
There are "rms in which dividend signaling is inarguably at work, and theyare the ones studied by Brickley (1982, 1983), whose managers pay both regulardividends and occasional special dividends (extras, specials, year-ends, etc.,hereafter `specialsa). As Brickley indicates, the di!erential labeling of special andregular dividends inherently conveys a warning to stockholders that the`speciala payout is not as likely to be repeated as the `regulara payout.Brickley's evidence indicates that investors treat special dividends as hedgedmanagerial signals about future pro"tability, in that unanticipated specials areassociated with weaker stock market reactions than are regular dividendincreases of comparable size. One contribution of the current paper is to provideevidence that the historically prevalent practice of paying special dividends haslargely failed the survival test, casting further doubt on the overall importance ofsignaling motivations in explaining dividend policy in general.
We document that special dividends were once commonly paid by NYSE"rms but have gradually disappeared over the last 40 to 45 years and are nowa rare phenomenon. During the 1940s, 61.7% of dividend-paying NYSE "rmspaid at least one special, while only 4.9% did so during the "rst half of the 1990s.In the single year 1950, 45.8% of dividend-paying NYSE "rms paid specials,while just 1.4% of such "rms paid specials in 1995. In years past, specialdividends constituted a substantial fraction of total cash dividends. AmongNYSE "rms that paid specials, these bonus disbursements average 24.3%(median, 16.8%) of the dollar value of total dividends paid over all yearsbetween the "rm's "rst and last special. Firms that at one point frequently paidspecials include such high visibility `blue chipa corporations as General Motors,Eastman Kodak, Exxon, Mobil, Texaco, Gillette, Johnson & Johnson, Merck,P"zer, Sears Roebuck, J.C. Penney, Union Paci"c, Corning, InternationalHarvester, McGraw Hill, and Boeing. Today, only a handful of NYSE "rms
310 H. DeAngelo et al. / Journal of Financial Economics 57 (2000) 309}354

1Large specials, like large repurchases, are likely to get stockholders' attention. These largepayouts may or may not serve as signals in the conventional sense, however, depending on whetherstockholders interpret them as information about the "rm's future pro"tability as opposed, e.g., toinformation about the success of its current restructuring e!orts.
continues to pay frequent special dividends, and these "rms are generally notwell known companies.
Why have "rms largely abandoned the once pervasive practice of payingspecial dividends? Our evidence suggests that the evolution of special dividendsre#ects the principle that dividends are a useful signaling mechanism only whenthey send clear messages to stockholders. Surprisingly, most "rms paid specialsalmost as predictably as they paid regulars, thereby treating the two dividendcomponents as close substitutes and impeding their ability to convey di!erentmessages. Over 1926}1995, more than 10,000 specials were paid by NYSE "rms,and virtually all of these were declared by "rms that announced specials inmultiple years. Remarkably, a full 27.9% of the latter "rms omitted payingspecials in less than one year out of ten on average (i.e., they paid specials in over90% of the years between their "rst and last special dividend). Well over half(56.8%) the "rms that paid specials in multiple years did so more frequently thanevery other year on average. We "nd that the only specials that have survived toan appreciable degree } and that, in fact, have grown in importance } are largespecials whose sheer size automatically di!erentiates them from regular divi-dends.1
When investors view specials and regulars as close substitutes, there is littleadvantage to di!erential labeling, and so "rms should eventually drop thepractice of paying two types of dividends and simply embed specials into theregular dividend. Evidence supporting this prediction comes from our Lintner(1956) model analysis of the dividend decisions of "rms that eliminated specialsafter paying them frequently for many years. This analysis shows that, control-ling for earnings, the pattern of regular dividends after the cessation of specialsdoes not di!er systematically from the earlier pattern of total (special plusregular) dividends. Other data indicate that these sample "rms preserved therelation between earnings and total dividends by substituting into greaterreliance on regular dividend increases. We also "nd that "rms generally tendedto increase regulars when they reduced specials to a still-positive level, furthersupporting the view that "rms treated specials and regulars as reasonably closesubstitutes. Finally, our data show that the disappearance of specials is part ofa general trend toward simple, homogeneous dividend policies in which "rmsconverged on the now prevalent practice of paying exactly four regular divi-dends per year.
We study the stock market's reaction to special dividends from mid-1962(when CRSP "rst provides daily returns) through 1995. We "nd that the stockmarket typically reacts favorably to the fact that a special dividend is declared
H. DeAngelo et al. / Journal of Financial Economics 57 (2000) 309}354 311
(holding regular dividends constant), but that the market reaction is not system-atically related to the sign or magnitude of the change from one positive specialdividend payment to another. For example, we observe an average stock marketreaction of about 1%, both when "rms increase specials and when they reducethem to a still-positive level. Overall, our event study analysis indicates that,although special dividend declarations tend to convey good news to marketparticipants, any signaling content they exhibit is typically small.
We "nd some empirical support for the notion that the long-term decline inspecial dividends is related to the clientele e!ect shift from the mid-century era,in which stock ownership was dominated by individual investors, to the currentera, in which institutions dominate. One might reasonably expect this clienteleshift to reduce the importance of special dividends, since institutions are presum-ably more sophisticated than retail investors and are therefore better able to seethat most "rms treated specials as close substitutes for regulars. At the aggregatelevel, the secular decline in specials and the increase in institutional ownershipoccurred roughly in parallel, with both trends proceeding gradually over manyyears. At the "rm level, our logit regressions show a signi"cant negative relationbetween the level of institutional ownership and the probability that a "rmcontinues to pay special dividends.
Finally, we "nd little support for the notion that special dividends weredisplaced by common stock repurchases. Theoretically, one might expect a closeconnection between the disappearance of specials and the adoption of stockrepurchases. Both payout methods allow managers to signal their beliefs aboutcompany prospects through temporary bonus distributions, with no necessarycommitment to repeat today's higher cash payout in future years. Moreover,repurchases are now widely prevalent (much as specials used to be), althoughhistorically they were rare events (as specials are now). However, at the aggreg-ate level, the secular decline in specials began many years before the upsurge inrepurchase activity, so that any theory which attributes the disappearance ofspecials to the advent of repurchases faces the di$cult task of explaining thelong time gap between the two phenomena. Moreover, at the "rm level, thenumber of companies that repurchased stock after they stopped paying specialdividends is signi"cantly less than expected if "rms simply substituted one forthe other form of payout. Finally, repurchase tender o!ers and large specialsboth increase in recent years with the upsurge in corporate restructurings andtakeovers.
Perhaps the most important implication of the "ndings reported here is thechallenge they pose for dividend signaling theories. Speci"cally, the fact thatspecial dividends once #ourished, but have largely failed to survive, is inconsist-ent with the view that these signals serve an economically important function.We discuss this and other implications of our "ndings for corporate "nanceresearch in Section 7. We begin in Section 2 by documenting the long-termevolution of special dividend payments. Section 3 analyzes the predictability of
312 H. DeAngelo et al. / Journal of Financial Economics 57 (2000) 309}354

2Throughout the paper, we employ the Center for Research in Security Prices (CRSP) monthlytape to identify NYSE-listed "rms that paid special dividends. We consider only securities withCRSP distribution codes 10 or 11 and thus exclude ADRs, various ownership units (e.g., limitedpartnership interests), closed-end funds, REITs, and shares of "rms incorporated outside the UnitedStates. We classify a cash distribution as a special if it carries distribution code 1262 or 1272, the codenumbers CRSP employs to identify dividends labeled year-end, "nal, extra, or special. We do notinclude CRSP code 1282 (de"ned as `interima dividends) because they are relatively uncommon andalmost all are bunched in one year (1929). We exclude code 1292 (de"ned as `non-recurring, orproceeds from sale of rightsa) because these distributions are generally not pure cash payouts tostockholders. For example, during the 1980s, code 1292 often identi"es poison pill securities.
special dividends, the evolution of large specials, the behavior of total dividendsaround the time "rms stopped paying specials, and "rms' general tendency toincrease regulars when they reduce specials. Section 4 presents our event studyanalysis of the information content of special dividends. Section 5 examines therelation between institutional ownership and the payment of specials. Section 6investigates the connection between repurchases and the decline in specials.
2. The historical importance of special dividends in corporate dividend policies
Table 1 documents the number and size of special dividends paid by NYSE-listed "rms (panel A) and the length of time that specials were an element ofthese "rms' dividend policies (panel B).2 From mid-year 1926 through year-end1995, 1,287 NYSE-listed "rms paid a total of 10,008 special dividends, with 9,636specials paid by the 942 "rms that made special distributions in multiple years.Panel A shows that the average special dividend is 157% (median, 100%) of thelatest regular dividend payment for the full sample and 138% (median, also100%) for "rms that paid specials in multiple years. These "gures indicate thatthe specials paid by our sample "rms tend to be larger than those examined byBrickley (1982, 1983), whose median special is 67% of the most recent regulardividend.
Panel A of Table 1 also reports the ratio of special dividends to totaldividends, a measure that shows the importance of special dividends in "rms'payout policies during the time they paid specials. This ratio is de"ned as (1) thesum of the dollar amount of all split-adjusted special dividend payments froma "rm's "rst year of special payment through its last such year, divided by (2) thesum of all split-adjusted regular and special dividends paid over all years in thesame interval, regardless of whether a special distribution was made in a givenyear. Special dividends account for an average of 24.3% (median, 16.8%) of totalcash dividends in the full sample and 20.0% (median, 15.5%) of total dividendsby "rms that paid specials in multiple years. These "gures indicate that, over theyears that "rms had policies of paying occasional special dividends, these
H. DeAngelo et al. / Journal of Financial Economics 57 (2000) 309}354 313

Table 1Size of special dividends and length of time they were paid by NYSE-listed "rms from mid-1926through year-end 1995
In panel A, the "rst size measure is the ratio of each individual special dividend payments to the mostrecent single regular dividend payment, provided that a regular has been paid within the last year.The second size measure is the ratio of the dollar value of all special dividends to the dollar value oftotal dividends paid beginning with the "rst year the "rm paid a special and ending with the last yearit did so. The denominator in the latter measure incorporates all dividends paid over all years in thisinterval, including those years in which no special was paid. For both size measures, all cashdividend amounts have been adjusted for stock splits and stock dividends. For the "rst size measure,the number of specials accompanied by regulars within one year is 9,821 for the full sample and 9,494for the "rms that paid specials in multiple years. Panel B reports the cross-sectional distribution ofthe length of time that specials were paid by "rms that paid them in multiple years. The length oftime that a given "rm paid special dividends is de"ned as the total number of years between the "rstand last special. All data are from the CRSP monthly tape, and include only NYSE securities withCRSP share codes 10 or 11. A dividend is classi"ed as a special if it has a distribution code of 1262 or1272, the codes CRSP employs to identify dividends labeled year-end, "nal, extra, or special.
All "rms Firms that paid specialsin multiple years
A. Number and size of special dividend payments
Number of "rms 1,287 942
Number of special dividends 10,008 9,636
Special/latest regular dividendMean 157% 138%Median 100% 100%
All specials/all dividendsMean 24.3% 20.0%Median 16.8% 15.5%
B. Length of time that xrms paid special dividends
Length of time from the "rm's Number of "rms Cumulative number"rst to last special (% of cases) (%) of "rms
30 or more years 174 "rms 174 "rms(18.5%) (18.5%)
20}29 years 193 "rms 367 "rms(20.5%) (39.0%)
10}19 years 218 "rms 585 "rms(23.2%) (62.2%)
less than 10 years 357 "rms 942 "rms(37.9%) (100.0%)
314 H. DeAngelo et al. / Journal of Financial Economics 57 (2000) 309}354
3Brickley (1982) documents that special dividends were paid by many banks, particularly thosewith shares traded over-the-counter. We therefore identi"ed the number of "rms with a primary SICcode of 60 (depository institutions) that paid special dividends while listed on the NYSE. From 1926through 1995, there are at most 10 such depository institutions paying specials in a given year (thepeak of 10 was attained only in 1937). From 1926 through the early 1970s, depository institutionsnever account for more than 5.4% of the special dividend-paying "rms on the NYSE (with the peakof 5.4% also attained in 1937). These data indicate that the early popularity of (and subsequentdecline in) special dividends among NYSE-listed "rms was not a phenomenon driven by banks orother depository institutions.
payments typically accounted for approximately one-"fth of total dividenddistributions.
Panel B of Table 1 shows that special dividends were a component of manyNYSE "rms' dividend policies for long periods of time. For each "rm that paidspecials in multiple years, we tabulate the number of years between the "rst andlast special dividend payment, an interval which can be viewed as a lower boundon the time that a "rm had a policy of paying specials. (A "rm's ex ante policy ofpaying specials may have started earlier or ended later than the interval betweenthe "rst and last payment dates, even though the events necessary to triggerspecial payments actually occurred only between the latter dates.) We "nd that174 NYSE "rms had policies of paying specials for 30 or more years, 367 "rmshad such policies for at least 20 years, and 585 "rms had such policies for at least10 years.
Fig. 1 reports the annual incidence and dollar magnitude of special dividendsby NYSE "rms for 1927}1995. Panel A gives the proportion of dividend-paying"rms that paid specials, while panel B reports the annual dollar amount of specialsdivided by the dollar amount of total dividends paid by all NYSE "rms. Fig. 1indicates that the incidence and dollar volume of special dividends is generallyquite high in the early sample years, but that both erode gradually over the lastfour decades to very low levels. In virtually every year from 1927 through the1950s, a large fraction of dividend-paying "rms distributed specials (panel A). Inthe average year during the decade of the 1950s, specials were paid by 26.2% ofthe dividend-paying "rms on the NYSE. This average is not signi"cantlydi!erent from the average annual incidence of 23.9% over 1927}1949. However,the average falls to 11.2% for the 1960s, 5.4% for the 1970s, 2.2% for the 1980s,and 1.8% for the 1990s (through 1995). All these "gures are below the averagefor 1927}1949 at very high levels of statistical signi"cance.3
The dollar value statistics in panel B of Fig. 1 show that special dividendpayments generally #uctuated around 10% of all cash dividend distributions,hitting peaks of 21.1% in 1936 and 19.3% in 1950. The dollar volume of specialsfalls below 5% of all dividends in the early 1930s at the depths of the GreatDepression and does not fall below 5% again until the late 1950s. In the averageyear over 1927}1949, specials constitute 9.8% of the dollar value of all cash
H. DeAngelo et al. / Journal of Financial Economics 57 (2000) 309}354 315

Fig. 1. Annual incidence of NYSE "rms that paid special dividends (Panel A) and magnitude ofspecial dividend payments as a fraction of all dividends paid (Panel B): 1927}1995.
Panel A gives the number of NYSE-listed "rms that paid special dividends in a given year asa proportion of the total number of NYSE "rms that paid any type of cash dividend in that year.Panel B gives the dollar amount of special dividend payments by all NYSE "rms in a given year asa proportion of the total cash dividends they paid in that year. To generate the dollar volume of totaldividends for a given "rm, we take the number of shares outstanding at the beginning of the year andmultiply by the sum of all (split-adjusted) dividend payments during the year. The dollar volume ofspecial dividend payments is calculated analogously for the subset of dividend payments labeledspecials. The sample "rms and associated dividend data are drawn from the CRSP monthly tape. Weconsider only those securities with CRSP share codes 10 or 11, which exclude ADRs, various typesof units, closed-end funds. REITs, and shares of "rms incorporated outside the United States. A cashdividend is classi"ed as a special if it has a distribution code of 1262 or 1272, which are the CRSPcodes for dividends labeled year-end, "nal, extra, or special.
316 H. DeAngelo et al. / Journal of Financial Economics 57 (2000) 309}354

4To see why, consider a "rm whose policy is to pay specials only in even numbered years. In oddyears, this "rm will not be counted as a "rm that pays special dividends, even though its policy isunchanged in those years. Since "rms do not generally pay special dividends in every single year,a one year window is too narrow to accurately estimate the incidence of "rms that have a policy ofpaying specials. For our example "rm, a two year window would su$ce, but that window would betoo narrow for "rms in general (see the payment frequency data in Section 3.2).
dividends paid by NYSE "rms. The corresponding average for the 1950s is8.0%, which is not signi"cantly di!erent from the 9.8% average over 1927}1949.During the 1960s, the average year's dollar volume of specials falls to 7.2% oftotal dividend payments, which di!ers signi"cantly from 9.8% (p-value, 0.04).For the 1970s, 1980s, and 1990s, the average dollar volume of specials fallsrespectively to 2.2%, 0.2%, and 0.1% of all dividends paid by NYSE "rms, withall three averages below 9.8% at very high signi"cance levels.
The data in Fig. 1 establish that, at least through the middle part of the 20thcentury, many NYSE "rms paid special dividends. Because of the occasionalnature of special payouts, these data understate the importance of specials asa component of corporate dividend policies.4 A broad horizon view of the extentto which "rms occasionally paid specials is provided by the incidence of NYSE"rms that paid at least one special dividend during a given decade. These data(not presented in our tables) show that specials were an element of the payoutpolicies of over half the dividend-paying "rms on the NYSE during the 1930s,1940s, and 1950s. Consistent with the trends in Fig. 1, the number of "rmspaying at least one special during the 1960s falls to less than half the level of the1950s (from 56.3% to 24.8% of dividend-paying "rms). During the 1970s, fewerthan one in "ve dividend-paying "rms paid a special dividend. The downwardtrend continues during the 1980s and 1990s, with less than one "rm in ten payinga special dividend. In sum, these data indicate that special dividends were once acommon feature of the dividend policies of NYSE "rms, but they are now a rarephenomenon.
3. Sharply delineated signals and the survival of special dividends
While Section 2 documents that specials as a group have virtually disap-peared, the data in Section 3.1 show that large special dividends (constituting atleast 5% or 10% of equity value) have actually increased in importance. Largespecial dividends are notable because their sheer size inherently commandsstockholders' attention and accordingly di!erentiates the special from the regu-lar payout. The trend in large specials is therefore consistent with the view thatthe disappearance or survival of special dividends depends on whether they sendsharply delineated messages to stockholders. Further support for this viewcomes from an examination of the predictability of most special dividends(Section 3.2), "rms' conversion of special into regular dividend payments
H. DeAngelo et al. / Journal of Financial Economics 57 (2000) 309}354 317

Table 2Special dividends whose size equals or exceeds (1) 5% of equity value (2) 10% of equity value, and (3)the size of the average repurchase tender o!er
The table reports the number of specials whose size meets three thresholds. Thresholds (1) and (2) are5% and 10% of equity value at the end of month before announcement of the special dividend.Threshold (3) is 18.6% of pre-announcement equity value, the average size of the cash distributed tostockholders in Dann's (1981) sample of 143 repurchase tender o!ers by NYSE and AMEX "rmsover 1962}1976. This analysis examines 9,948 specials (rather than the 10,008 reported elsewhere inthe paper) because we exclude those cases in which CRSP does not report a stock price for the "rmfor the month prior to a given special. All data are drawn from the CRSP monthly tape, and includeonly NYSE securities with CRSP share codes 10 or 11. A cash dividend is classi"ed as a special if ithas a distribution code of 1262 or 1272, the CRSP code numbers for dividends labeled year-end,"nal, extra, or special.
Specials whose size equals or exceeds:
(1) 5% of equityvalue
(2) 10% of equityvalue
(3) Size of the averagerepurchase tender o!er
Decade Number of Number of % of all Number of % of all Number of % of allspecials cases specials cases specials cases specials
1926}1929 539 6 1.1% 3 0.6% 1 0.2%1930}1939 1,445 44 3.0% 5 0.3% 1 0.1%1940}1949 2,653 81 3.0% 12 0.5% 1 (0.1%1950}1959 2,982 51 1.7% 1 (0.1% 0 0.0%1960}1969 1,244 2 0.2% 0 0.0% 0 0.0%1970}1979 691 12 1.7% 1 0.1% 0 0.0%1980}1989 281 37 13.2% 22 7.8% 17 6.0%1990}1995 113 21 18.6% 17 15.0% 6 5.3%All years 9,948 254 2.6% 61 0.6% 26 0.3%
(Sections 3.3 and 3.4), and "rms' general convergence on the now pervasivepractice of paying exactly four regular dividends per year (Section 3.5).
3.1. Large special dividends have increased in importance
Table 2 reports the number of special dividends by NYSE "rms that exceedsthree size thresholds for each decade from the 1920s to the 1990s, and thepercentage they represent of all special dividends paid in each decade. Columns(1) and (2) respectively present the incidence of special dividends that equal orexceed 5% and 10% of the pre-announcement equity value of the "rm, whilecolumn (3) reports the incidence of specials whose size equals or exceeds that ofthe average repurchase tender o!er studied by Dann (1981), i.e., a cash distribu-tion of 18.6% of pre-announcement equity value.
Table 2 shows that, in the early sample years, large special dividends representa modest fraction of all specials. For example, column (1) indicates that 5%-plus
318 H. DeAngelo et al. / Journal of Financial Economics 57 (2000) 309}354

5This "nding is consistent with the restructuring pattern documented by Denis (1990), Palepu andWruck (1992), and Denis and Denis (1995). The 12 specials that are elements of restructuring arepaid by eight "rms and include one payout by Sealed Air Corp. (Wruck, 1994), three payouts byGeneral Dynamics Corp. (Dial and Murphy, 1995), and two payouts by Manville Corp. as itemerged from asbestos litigation-induced bankruptcy.
specials never exceed 3% of all specials from the 1920s through the 1970s, whilecolumn (2) indicates that 10%-plus specials always account for less than 1% ofall specials during the same period. Column (3) reveals that there are virtually nospecial dividends as large as the average repurchase tender o!er over this period.Consistent with Section 6's inference that repurchases did not generally replacespecials, the latter observation clearly establishes that repurchase tender o!erscannot have displaced large specials since, at least through the 1970s, there werevirtually no comparably large special dividends to displace.
Table 2 further shows that large special dividends have increased substan-tially in importance in recent years, both in absolute number and as a propor-tion of all specials. For example, over the 1980s and 1990s, there are 39 specialswhose size equals or exceeds 10% of equity value } almost double the 22 specialsof comparable size paid over the prior half-century. The increased importance oflarge specials in recent years plausibly re#ects the takeover/restructuring pres-sures faced by many "rms over the last two decades. Wall Street Journal reportsindicate that 30 (81.1%) of the 37 10%-plus specials announced during the 1980sand 1990s are part of a corporate restructuring, and that 18 (60.0%) of these 30payouts are related to explicit takeover pressures.5 The presence of take-over/restructuring pressures suggests that managers of these "rms felt it wasimportant to distribute large amounts of cash to provide a credible indication oftheir faith in their planned restructurings (and perhaps to convince investorsthat otherwise successful restructurings would not be undermined by unpro"t-able reinvestment of free cash #ow).
3.2. The predictability of special dividends
Although the `speciala or `extraa label seems to connote an infrequent cashdividend, managers actually distributed these bonus payouts remarkably often.Fig 2 presents the dividend histories of Eastman Kodak and General Motors,with the height of each bar representing total dividends for a given year and theblack portion representing the special dividend component. Over the 33 yearsfrom 1954 to 1986, Kodak paid a special dividend in every year, and since thattime has paid no specials at all. Many years before this lengthy string began,Kodak had another period of densely clustered special dividend payments,making such distributions in 1926}1932, 1935}1937, and 1942. GM wentthrough three distinct phases in which it paid specials quite often, interspersedbetween long dormant periods with no such distributions. GM's clustering of
H. DeAngelo et al. / Journal of Financial Economics 57 (2000) 309}354 319

Fig. 2. Special and regular dividends paid by Eastman Kodak and General Motors: 1926}1995.
The height of each bar is the total dollar dividends paid per share in the year in question. The blackportion of the bar represents special dividend payments, while the white portion represents regulardividend payments. All cash dividends have been adjusted for stock splits and stock dividends. Thelow total dividend values for early years re#ect the fact that one current share of stock is equivalentto a small fractional share interest in earlier years due to stock splits that occur in the interim. Alldividend data are drawn from the CRSP monthly tape. A cash dividend is classi"ed as a special if ithas a distribution code of 1262 or 1272, the CRSP code numbers for dividends labeled year-end,"nal, extra, or special.
specials came in (1) 16 of the 20 years between 1961 and 1980 (and nineconsecutive years in the 1960s), (2) nine of the 11 years between 1926 and 1936,and (3) four of the seven years between 1949 and 1955.
The high frequency of special dividends is not peculiar to the Kodak and GMcases, but instead characterizes the vast bulk of NYSE "rms that at one time had
320 H. DeAngelo et al. / Journal of Financial Economics 57 (2000) 309}354

Table 3Frequency of special dividend payments by 942 NYSE-listed "rms that paid specials in multipleyears during 1926}1995
The frequency with which a "rm paid special dividends is de"ned as the total number of years inwhich a special was paid divided by the total number of years between the "rst and last special. Forexample, a frequency of 40% implies that the "rm paid specials in four out of 10 years on average(during the time that it was paying specials). All data are drawn from the CRSP monthly tape, andinclude only NYSE securities with CRSP share codes 10 or 11. A dividend is classi"ed as a special ifit has a distribution code of 1262 or 1272, the codes CRSP employs to identify dividends labeledyear-end, "nal, extra, or special.
Percent of time that Number (%) Cumulative Number (%) Cumulative"rm paid specials of "rms % of "rms of specials % of specials
90%(frequency 263 27.9% 2,037 21.1%(27.9%) (21.1%)
80%(frequency(90% 52 33.4% 999 31.5%(5.5%) (10.4%)
70%(frequency(80% 56 39.3% 990 41.8%(5.9%) (10.3%)
60%(frequency(70% 73 47.0% 980 52.0%(7.7%) (10.2%)
50%(frequency(60% 92 56.8% 1,271 65.2%(9.8%) (13.2%)
40%(frequency(50% 84 65.7% 1,038 76.0%(8.9%) (10.8%)
30%(frequency(40% 110 77.4% 1,074 87.1%(11.7%) (11.1%)
20%(frequency(30% 113 89.4% 839 95.8%(12.0%) (8.7%)
10%(frequency(20% 74 97.3% 344 99.4%(7.9%) (3.6%)
frequency(10% 25 100.0% 64 100.0%(2.7%) (0.6%)
a policy of paying specials. For our full sample, Table 3 summarizes thefrequency of special dividends, de"ned as the number of years in which a "rmpays specials divided by the number of years between the "rm's "rst and lastspecial dividend. A strikingly large 27.9% of the "rms that paid specials inmultiple years did so more often than 90% of the time } i.e., these "rms omittedpaying specials in less than one year out of 10 on average. Well over half (56.8%)the sample "rms paid specials more frequently than every other year on average.Moreover, these "gures actually understate the frequency with which "rms
H. DeAngelo et al. / Journal of Financial Economics 57 (2000) 309}354 321

6The Kodak and GM examples show that some "rms paid specials in multiple year clusters,interspersed between long periods with no special dividends. Table 3 measures the frequency ofspecial dividends from the time of a "rm's "rst special through its last, including intervening periodsin which the "rm paid no specials. Inclusion of these intermittent periods obviously reduces theestimated frequency of special dividends below that which prevailed during the time the "rm actuallypaid specials.
7 It might, however, take a long time for the practice of paying specials to die out unless there arelarge costs from a policy of paying two types of dividends with poorly di!erentiated signalingattributes. As long as any disadvantages are modest, little is lost if managers take a long time torecognize that specials are not serving a useful purpose and to act to eliminate them.
temporally clustered their special dividend payments, since they do not adjustfor dormant periods in which "rms paid no specials.6 These "gures establishthat specials typically were not paid as occasional bonuses, but rather providedstockholders with recurring payments at frequent intervals.
Since most "rms paid specials almost as predictably as they paid regulardividends, the payout pattern chosen by managers diminished any signalingdi!erence between specials and regulars. There is a clear analogy here tothe practice of paying faculty salaries in academic year and summer researchcomponents. Since many schools now pay summer money virtually all thetime, faculty often focus on their total pay and treat the university's commitmentto maintain both salary components as almost equivalent. The same logicimplies that, if managers pay special dividends with great frequency,stockholders will come to expect them nearly as much as the regular dividendso that little purpose is served by the di!erential explicit labeling. Moreover,as it becomes clear that specials are e!ectively close substitutes for re-gulars, it becomes more likely that "rms would eliminate the di!erentiallabeling.7
3.3. The conversion of specials into regular dividends
To assess the latter prediction, we focus on NYSE "rms that (1) paid specialdividends in 10 or more di!erent years, (2) paid specials at least 25% of the timeon average, (3) paid specials through at least 1965, and (4) remained listed onCRSP for at least four years after the last special. Criteria (1) and (2) ensure thatwe have isolated "rms that followed well-established policies of paying specials.Criterion (3) increases the likelihood that Compustat data are available for theearnings-based tests described below. Criterion (4) enables us to observe sample"rms' payout decisions following the cessation of specials. We exclude four "rmsthat satisfy (1) through (4), but continue to pay specials after 1991. This screeningprocess yields a sample of 91 "rms that ended well-established policies of payingrecurring special dividends. These "rms account for more than 22% of all
322 H. DeAngelo et al. / Journal of Financial Economics 57 (2000) 309}354

Table 4Frequency of increases and decreases in annual regular dividend payments during and after theperiod in which special dividends were paid by 91 NYSE "rms with long histories of paying specialsat frequent intervals
This table reports changes in the annual amounts of regular (split-adjusted) dividend payments. Thesample contains 91 "rms that paid specials in 10 or more years and that did so at least once everyfour years on average. All dividend data are drawn from CRSP. A "rm is included here only if it paidspecials through 1965 and remained listed on CRSP for at least four years after the last reportedspecial. A given dividend is classi"ed as a special if it has distribution code 1262 or 1272, the CRSPcode numbers for dividends labeled year-end, "nal, extra, or special. A dividend is classi"ed asa regular payment if it has distribution codes 1232, 1212, 1218, 1222, or 1245, which are the CRSPcode numbers for U.S. cash dividends with the following respective frequencies: quarterly, unspeci-"ed frequency (normally taxable), unspeci"ed frequency (fully taxable), monthly, and semiannual.The table considers dividend changes from a positive level so that regular increases excludeinitiations of dividends and unchanged values exclude cases where the "rm paid no regulardividends in adjacent years. The p-values are for pairwise tests to assess whether the proportion ofdecreases (or increases or unchanged regulars) during the special dividend payment period di!ersfrom the corresponding proportion after the cessation of specials. A chi-square test that simulta-neously assesses all di!erences in the table is signi"cant at the 0.029 level.
Number (%) of "rm-year observations that entail:
Regulardecreases
Unchangedregulars
Regularincreases
Row total
During special dividend 471 1151 1496 3118payment period (15.1%) (36.9%) (48.0%) (100.0%)
After cessation of special 206 473 739 1418dividends (14.5%) (33.4%) (52.1%) (100.0%)
Signi"cance of pairwise p"0.612 p"0.021 p"0.010proportion comparison
specials paid by NYSE "rms over 1926}1995, and their median special dividendis identical in size to the median for the full sample (100% of the most recentregular dividend).
Table 4 documents regular dividend increases and decreases by the 91 "rmsthat stopped paying specials after long histories of paying them at frequentintervals. The "rst row of the table gives the incidence of regular increases anddecreases during the time the "rms had policies of paying specials, while thesecond row gives their incidence after the cessation of specials. The table showsno signi"cant di!erence in the incidence of "rm-years with dividend cuts duringthe period that specials were paid and the period after they were stopped (15.1%versus 14.5%, with a p-value of 0.612 to assess the di!erence). However, we "nda statistically signi"cant rise in the incidence of regular dividend increases from48.0% during the time specials were paid to 52.1% after the cessation of specials
H. DeAngelo et al. / Journal of Financial Economics 57 (2000) 309}354 323

(p-value of 0.010). While this rise is not particularly large, it is nonethelessconsistent with the notion that "rms simply converted payouts formerly labeled`speciala into regular dividend increases.
Although the cessation of specials is associated with somewhat more frequentregular dividend increases, it is not associated with a material change in thepayment of total dividends by sample "rms. In other words, the evidence isconsistent with the view that sample "rms simply rolled specials into regulardividend increases while continuing to follow the same overall (total dividend)payout policy. In Table 5, we work with the 59 companies (out of the sample of91) that have su$cient data on Compustat to estimate the Lintner (1956) modeland to test for dividend shifts around the cessation of special dividends. Wede"ne event year 0 as the calendar year in which the "rm last paid a special, year!1 as the immediately prior year, year #1 as the immediately subsequentyear, and so on. The sample of 59 "rms consists of those "rms with no "scal yearchanges and with dividends and earnings data available on Compustat through-out years !15 to #3.
For each "rm, we obtain Lintner model parameter estimates using data forevent years !15 to !4. These estimations use the "rm's annual earnings pershare before extraordinary items and total dividends per share, i.e. the sum ofboth regular and special dividends, with all data inputs split-adjusted as appro-priate. Fama and Babiak (1968) examine a variety of Lintner model speci"ca-tions and conclude that the best dividend predictions come from thespeci"cation that suppresses the constant term and includes both lagged andcurrent earnings per share. To provide a robustness check on our "ndings, werun tests on this and three other model speci"cations. (Models A and B haveintercepts set equal to zero, while C and D have "tted intercepts. Models B andD included lagged earnings, while A and C do not.)
For each "rm in each year from !3 through #3, we generate raw predictionerrors, which equal the observed level of total dividends minus the predictedlevel of total dividends based on the Lintner parameter estimates, realizedearnings, and the prior year's dividend. We then generate standardized predic-tion errors, de"ned as the raw error divided by the "rm's average dividend overthe "ve years beginning with year !10. Our statistical tests analyze the mean,median and percent of negative standardized prediction errors for the cross-section of the 59 "rms in each of years !3 through #3.
If "rms simply converted specials into regular dividends, we should observedividend prediction errors clustered near zero in the years surrounding thecessation of specials. On the other hand, we should "nd systematically negativeprediction errors around this time if "rms largely stopped paying specialsbecause of general factors that put downward pressure on total dividends.Suppose, for example, that tax law changes encouraged "rms to reduce divi-dends or, more realistically, to raise them less aggressively. We should then "ndthat actual dividends are systematically below the levels predicted by realized
324 H. DeAngelo et al. / Journal of Financial Economics 57 (2000) 309}354
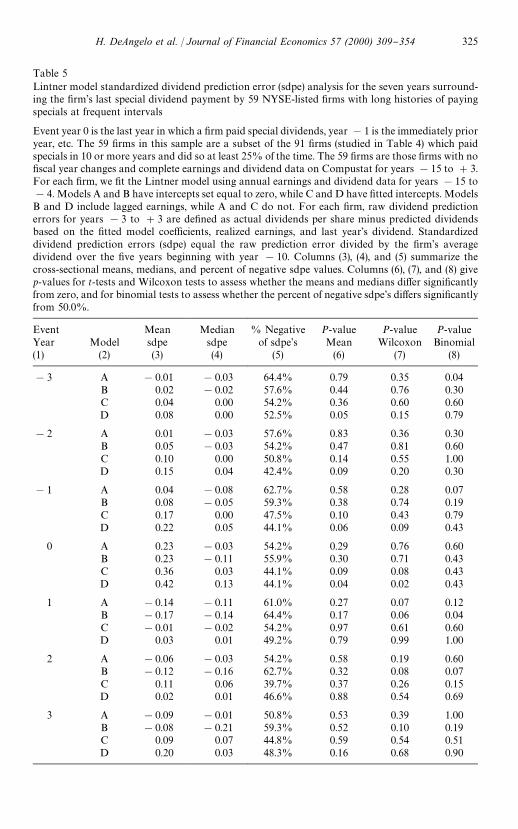
Table 5Lintner model standardized dividend prediction error (sdpe) analysis for the seven years surround-ing the "rm's last special dividend payment by 59 NYSE-listed "rms with long histories of payingspecials at frequent intervals
Event year 0 is the last year in which a "rm paid special dividends, year !1 is the immediately prioryear, etc. The 59 "rms in this sample are a subset of the 91 "rms (studied in Table 4) which paidspecials in 10 or more years and did so at least 25% of the time. The 59 "rms are those "rms with no"scal year changes and complete earnings and dividend data on Compustat for years !15 to #3.For each "rm, we "t the Lintner model using annual earnings and dividend data for years !15 to!4. Models A and B have intercepts set equal to zero, while C and D have "tted intercepts. ModelsB and D include lagged earnings, while A and C do not. For each "rm, raw dividend predictionerrors for years !3 to #3 are de"ned as actual dividends per share minus predicted dividendsbased on the "tted model coe$cients, realized earnings, and last year's dividend. Standardizeddividend prediction errors (sdpe) equal the raw prediction error divided by the "rm's averagedividend over the "ve years beginning with year !10. Columns (3), (4), and (5) summarize thecross-sectional means, medians, and percent of negative sdpe values. Columns (6), (7), and (8) givep-values for t-tests and Wilcoxon tests to assess whether the means and medians di!er signi"cantlyfrom zero, and for binomial tests to assess whether the percent of negative sdpe's di!ers signi"cantlyfrom 50.0%.
Event Mean Median % Negative P-value P-value P-valueYear Model sdpe sdpe of sdpe's Mean Wilcoxon Binomial(1) (2) (3) (4) (5) (6) (7) (8)
!3 A !0.01 !0.03 64.4% 0.79 0.35 0.04B 0.02 !0.02 57.6% 0.44 0.76 0.30C 0.04 0.00 54.2% 0.36 0.60 0.60D 0.08 0.00 52.5% 0.05 0.15 0.79
!2 A 0.01 !0.03 57.6% 0.83 0.36 0.30B 0.05 !0.03 54.2% 0.47 0.81 0.60C 0.10 0.00 50.8% 0.14 0.55 1.00D 0.15 0.04 42.4% 0.09 0.20 0.30
!1 A 0.04 !0.08 62.7% 0.58 0.28 0.07B 0.08 !0.05 59.3% 0.38 0.74 0.19C 0.17 0.00 47.5% 0.10 0.43 0.79D 0.22 0.05 44.1% 0.06 0.09 0.43
0 A 0.23 !0.03 54.2% 0.29 0.76 0.60B 0.23 !0.11 55.9% 0.30 0.71 0.43C 0.36 0.03 44.1% 0.09 0.08 0.43D 0.42 0.13 44.1% 0.04 0.02 0.43
1 A !0.14 !0.11 61.0% 0.27 0.07 0.12B !0.17 !0.14 64.4% 0.17 0.06 0.04C !0.01 !0.02 54.2% 0.97 0.61 0.60D 0.03 0.01 49.2% 0.79 0.99 1.00
2 A !0.06 !0.03 54.2% 0.58 0.19 0.60B !0.12 !0.16 62.7% 0.32 0.08 0.07C 0.11 0.06 39.7% 0.37 0.26 0.15D 0.02 0.01 46.6% 0.88 0.54 0.69
3 A !0.09 !0.01 50.8% 0.53 0.39 1.00B !0.08 !0.21 59.3% 0.52 0.10 0.19C 0.09 0.07 44.8% 0.59 0.54 0.51D 0.20 0.03 48.3% 0.16 0.68 0.90
H. DeAngelo et al. / Journal of Financial Economics 57 (2000) 309}354 325

earnings and the "tted Lintner model. Conversely, we should observe positiveprediction errors if the cessation of specials was associated with a shift towardpayout policies in which "rms tended to distribute greater total dividends thanthey would have historically, given their earnings performance.
Table 5 indicates that sample "rms did not signi"cantly alter their policiesregarding total dividends around the time they ceased paying special dividends.For almost every Lintner model speci"cation and event year from !3 to #3,columns (6) and (7) show that the mean and median standardized dividendprediction errors (sdpe's) are not signi"cantly di!erent from zero at conven-tional levels. In only two instances (model D in years !3 and 0, column (6)) isthe mean signi"cantly di!erent from zero at the 0.05 level or better. TheWilcoxon p-values in column (7) show only one instance in which the mediansdpe di!ers signi"cantly from zero at this level (model D in year 0). A similarpattern appears in column (8), which reveals only two cases in which the percentof negative spde's is statistically distinguishable from 50.0% at the 0.05 level orbetter (model A in year !3 and model B in year #1).
The results shown in Table 5 for years !3 through 0 indicate that sample"rms did not systematically alter their total dividend policies in the four years upto and including their last special dividend. These "ndings are inconsistent withthe view that sample "rms were under signi"cant pressures } for example, fromchanges in tax laws or other parameter shifts } that led them to drop specials aspart of a general shift toward a less aggressive dividend policy. These "rmssimply continued to adjust total dividends in response to earning realizations ina manner consistent with the policies they had followed in prior years. The samepattern holds in years #1, #2, and #3, a "nding which also indicates thatmanagers largely converted specials into regulars, with no signi"cant change inthe total dividends paid.
3.4. Increases in regulars often owset reductions in special dividends
The data we next report indicate that the conversion of specials into regularsis a general phenomenon, and one that does not simply occur at the time when"rms terminate a longstanding policy of paying special dividends. These datashow a strong tendency for managers to increase the regular whenever theyreduce a special dividend. This pattern is consistent with the view that managersseek to avoid disappointing investors with cuts in the special by compensatingthem at least to some degree with increases in the "rm's regular dividend.
Table 6 documents the frequency and magnitude of regular and specialdividend changes (panels A and B), and the extent to which our sample "rmsused increases in the regular dividend to o!set reductions in specials (panelsC and D). Since it is impossible to observe dividend reductions from a zero level,we restrict attention to those "rm-years in which a company paid both positivespecial and regular dividends in the prior year. All data are for split-adjusted
326 H. DeAngelo et al. / Journal of Financial Economics 57 (2000) 309}354

Table 6Changes in regular and special dividends by 942 NYSE "rms that paid specials in multiple yearsover 1926}1995
The dividend change data in panels A through D are based on split-adjusted annual dividends (asreported by CRSP), and are restricted to cases in which the "rm paid positive regular and specialdividends in the prior year. In panel B, the last column gives the percent of the sample of dividendcuts that are omissions. For the subset of cases in which the "rm reduced special dividends from theprior year, panel C documents the incidence of the di!erent types of regular dividend changes thatcame in the same year as the special reduction. For those years in which the "rm both reduced thespecial and increased the regular dividend, panel D documents the incidence of cases in which thedollar magnitude of the regular increase was less than, equal to, or greater than the dollar magnitudeof the special reduction.
A. Incidence of regular and special dividend changes the year after a special dividend payment
Sample Decrease No change Increasesize dividend in dividend dividend
Regular 7,171 13.4% 33.6% 53.0%Specials 7,171 49.8% 27.2% 23.0%
B. Percent changes in regular and special dividends the year after a special dividend payment
Sample 25th Median 75th Dividendsize percentile change percentile omissions
Regular decreases 963 !50.0% !25.0% !16.7% 8.3%Special decreases 3,572 !100.0% !100.0% !50.0% 65.7%Regular increases 3,800 11.1% 25.0% 50.0%Special increases 1,648 28.6% 60.0% 100.0%
C. Regular dividend decisions that accompany a reduction in special dividends
Samplesize
Decreaseregular
No changein regular
Increaseregular
All "rms, all years 3,572 18.2% 21.8% 60.0%1960#earlier 2,648 19.3% 24.3% 56.4%After 1960 924 15.0% 14.8% 70.2%
D. Size of regular dividend increase relative to a contemporaneous special dividend reduction
% of cases with dollar amount of regular increase
Sample (special "special 'specialsize reduction reduction reduction
All "rms, all years 2,142 38.3% 3.5% 58.2%1960#earlier 1,494 43.4% 4.3% 52.3%After 1960 648 25.5% 1.9% 71.6%
H. DeAngelo et al. / Journal of Financial Economics 57 (2000) 309}354 327

8The statistics in panel B imply that there are fewer than 100 "rm-years with regular dividendomissions and more than 2,300 with special omissions, since omissions constitute just 8.3% of the963 regular decreases versus 65.7% of the 3,572 special decreases.
changes in annual dividends for the 942 NYSE "rms that paid special dividendsin multiple years over 1926}1995 (per CRSP).
Since the special label connotes a temporary or occasional dividend #ow,conventional wisdom suggests that "rms will cut specials more frequently thanthey cut regulars, and that specials will accordingly exhibit greater volatilitythan regulars. The former expectation is con"rmed in panel A, which shows thatreductions in special dividends outnumber reductions in regular dividendsroughly four-to-one (49.8% versus 13.4%) and in panel B, which shows thatspecial omissions vastly outnumber regular omissions.8 The latter expectation iscon"rmed in panel B, which shows that the median reduction in regulardividends is !25% versus !100% for the median reduction in special divi-dends, while the median regular increase is 25% versus 60% for the medianspecial increase. (For both increases and decreases, the 25th and 75th percentilesalso show larger absolute changes for specials than for regulars.)
While managers of sample "rms are more willing to cut specials than to cutregulars, our data also show that managers are hesitant to reduce specialswithout providing compensation in the form of a regular dividend increase.Panel C reveals that managers raised the regular dividend in 60.0% of the 3,572"rm-years in which they cut specials, a frequency signi"cantly greater than the46.1% of the "rm-years in which they increased regulars while also increasingthe special or paying the same special amount. (The 46.1% "gure is not shown inthe table; the p-value to assess the di!erence between 46.1% and 60.0% showsstatistical signi"cance at better than the 0.0001 level.) Panel C further showsthat, during the "rst half of our sample period (mid-1926 to 1960), sample"rms raised regulars in 56.4% of the "rm-years in which they cut specials, anddid so in 70.2% of such cases during the later sample period. However, theincrease from 56.4% to 70.2% is not of economic importance, since it can beexplained by the general tendency for sample "rms to increase regulars moreoften in recent years (details not provided).
The contemporaneous changes in special and regular dividends reported inTable 6 are those that occur within the same calendar year, and not necessarilyon the same declaration day. However, declaration day data reported in Table 8below indicate that, more often than not, regular dividends are increased on thesame day that "rms reduce or fail to pay special dividends, after paying botha regular and a special contemporaneously in the prior year (see Section 4.1 forsampling details). Speci"cally, columns (3) and (4) of Table 8 show that regulardividends were increased 55.7% of the time (240 out of 431 total observations)on the same day that specials were cut or omitted.
328 H. DeAngelo et al. / Journal of Financial Economics 57 (2000) 309}354

Panel D of Table 6 compares the immediate (i.e., current year) dollar magni-tude of regular dividend increases with the magnitude of special dividendreductions for the subset of 2,142 "rm-years with contemporaneous specialreductions and regular increases. Of these particular special dividend reduc-tions, 58.2% were accompanied by a larger immediate dollar increase in theregular dividend. (This incidence rises from 52.3% in the "rst half of the sampleperiod to 71.6% in the second half, but this trend can again be explained bysample "rms' general tendency to increase regular dividends more frequently inrecent years.) These "ndings are stronger than they might seem at "rst glance,since the more permanent nature of regular dividends implies that investorsshould happily trade a given dollar reduction in the special dividend fora somewhat smaller increase in the regular dividend.
The data in panels C and D indicate that managers typically adjust theregular dividend to ameliorate } and in many cases more than fully o!set } anydisappointment that stockholders might associate with a reduction in specialdividends. Since such compensating actions were taken with reasonably highfrequency in our sample, investors had (yet another) reason to view specials andregulars as reasonably close substitutes, rather than as independent variablesthat managers might use to signal distinctly di!erent information about transi-tory versus persistent earnings.
3.5. Convergence to the now prevalent practice of paying four quarterly dividendsper year
Table 7 provides evidence that the virtual disappearance of special dividendsis an element of a long-term convergence toward homogeneous dividend pol-icies in which "rms pay exactly four regular dividends per year. The sample hereconsists of all 1,287 "rms that paid at least one special dividend sometimebetween mid-1926 and year-end 1995 while listed on the NYSE. For simplicity,we present data only at "ve year intervals, beginning with 1930 and ending with1995. For each year, we include only those "rms that paid at least one regulardividend during that year. We tabulate the percentage of "rms that paidbetween one and three dividends, exactly four dividends, and more than fourdividends.
Table 7 shows that over the last several decades, more than 80% of sample"rms paid exactly four dividends per year, consistent with one's intuition thatmost "rms pay regular dividends on a quarterly basis. But the table also showsthat this was far from uniform practice earlier in the century and that sample"rms converged slowly on this practice over the same years they graduallydropped special dividends. Recall from Fig. 1 that the decades of the 1930s,1940s, and 1950s were years when many "rms paid specials. Table 7 shows that,during these same years, many "rms } often a majority } deviated from a policyof paying exactly four dividends per year and a substantial minority paid fewer
H. DeAngelo et al. / Journal of Financial Economics 57 (2000) 309}354 329

Table 7Number of dividend payments per year by 1,287 "rms that paid at least one special dividend whileNYSE-listed
The sample consists of the 1,287 "rms that paid at least one special dividend at some time frommid-1926 through year-end 1995 while listed on the NYSE. For each year, we consider only thesubset of the 1,287 "rms that paid at least one regular dividend in that year. We then tabulate thetotal number of dividend payments (regulars and specials) by that "rm in the year in question. Thetable reports the percent of "rms paying less than four, exactly four, and more than four dividendsduring the speci"ed year. For simplicity, we report data at "ve year intervals. All data are drawnfrom the CRSP monthly tape, and include only NYSE securities with CRSP share codes 10 or 11.A dividend is classi"ed as a special if it has a distribution code of 1262 or 1272, the codes CRSPemploys to identify dividends labeled year-end, "nal, extra, or special.
Percent of "rms with given number of dividends in year:Year Number 1, 2 or 3 exactly 4 more than 4
of "rms dividends dividends dividends
1930 423 21.7% 57.7% 20.6%
1935 331 26.6% 47.4% 26.0%
1940 500 30.8% 41.8% 27.4%
1945 634 23.8% 56.2% 20.0%
1950 747 14.5% 37.2% 48.3%
1955 753 13.8% 54.2% 32.0%
1960 714 12.7% 70.2% 17.1%
1965 732 9.8% 70.4% 19.8%
1970 627 10.4% 82.6% 7.0%
1975 632 8.7% 80.5% 10.8%
1980 575 8.3% 84.2% 7.5%
1985 454 9.7% 87.0% 3.3%
1990 329 10.0% 84.8% 5.2%
1995 291 7.9% 88.7% 3.4%
than four dividends per year. The latter fact clearly indicates that many "rmshad not yet settled on a policy of paying four regular dividends per year. (Sincemany "rms paid three or fewer dividends per year, including specials, theyobviously could not have paid regulars on a quarterly basis). The data for more
330 H. DeAngelo et al. / Journal of Financial Economics 57 (2000) 309}354

9 Jayaraman and Shastri (1988) report a positive average stock price reaction to special dividendannouncements, but unlike Brickley do not control for whether or the extent to which theseannouncements represent a change in the special dividend. It is di$cult to interpret Jayaraman andShastri's "ndings, since they assume that every special dividend is simply a `labelled dividendincreasea (p. 301). But this assumption is not descriptive since, as we document below, many specialdeclarations actually represent a reduction (or no change) from the prior year's special. Nevertheless,Jayaraman and Shastri's results are consistent with Brickley's "ndings and with those reported here.
recent years show a substantially higher proportion of "rms paying exactly fourdividends per year and much lower proportions of "rms paying either less thanfour or more than four dividends per year. This pattern suggests that thedisappearance of special dividends was part of a gradual evolution to the nowpervasive practice of paying exactly four undi!erentiated quarterly dividends ineach year.
4. Information content of special dividend announcements
The evidence in Section 3 is consistent with the view that special dividendswere largely replaced by regular dividends because many "rms paid specialsfrequently, e!ectively converting them into close substitutes for regulars. Thisexplanation does not consider the potential signaling value attached to themagnitude of any change in special distributions declared by management.However, the event study evidence we present next indicates that the sign andmagnitude of special dividend changes do not systematically convey signi"cantinformation. Moreover, the average stock market reaction to special dividenddeclarations, although statistically di!erent from zero, is just not that substan-tial. These observations lend credence to the notion that, at least during the1962}1995 sample period for which we have data, the information signalingcontent of special dividends is small at best.
Brickley (1982, 1983) documents that stock prices increase by about 2% onaverage when "rms announce unanticipated special dividends (de"ned asspecials declared by "rms that had not paid them for at least two years). Brickleyalso "nds that, controlling for the size of the total dividend change, regulardividend increases have a signi"cantly more favorable market impact than dounanticipated specials. We extend Brickley's analysis by (1) documenting thestock market reaction to other types of special dividend changes, most impor-tantly to reductions in specials to a still-positive level, and by (2) assessingwhether the abnormal stock returns at special dividend announcements aresystematically related to the size of the special change.9
We "nd that the stock market typically reacts favorably to the fact thata special dividend is declared (holding the regular dividend constant), but thatthe stock price response is not systematically related to the magnitude of the
H. DeAngelo et al. / Journal of Financial Economics 57 (2000) 309}354 331

change in the special. Most strikingly, we observe a signi"cantly positive averagestock market reaction even when "rms reduce special dividends (to a still-positive level) and leave regular dividends unchanged. Our data also showstatistically indistinguishable positive average abnormal returns for increasesand decreases in the special dividend to a still-positive level. Moreover, theaverage market reaction to special dividend declarations (including increases,decreases, and no change from the prior year's level) is signi"cantly greater thanthe essentially zero market response we "nd when "rms fail to pay a special afterdeclaring one in the prior year. Finally, our tests reveal no systematic relationbetween the stock return at special dividend announcement and the magnitudeof the special change, holding the regular dividend constant.
4.1. Basic event study xndings
In Table 8, we examine special dividends declared from mid-1962 (when dailystock returns become available on CRSP) through year-end 1995 by NYSE"rms that paid multiple specials while on the CRSP tape. For all dividendannouncements analyzed here, the "rm paid one special dividend in the baseyear (de"ned as year 0) and paid either one special or none in the event year(de"ned as year 1). Columns (1), (2), and (3) of the table contain cases where the"rm paid a special in both years 0 and 1, while column (4) contains cases wherethe "rm paid one special in year 0 but omitted such payment in year 1. Forcolumns (1), (2) and (3), we restrict attention to those cases in which the "rmdeclared a regular dividend on the same date that it declared its special in year 1.We cannot apply this condition to special omissions because "rms generally donot announce the omission of a special, but instead simply fail to declare one.Accordingly, the column (4) analysis of special omissions examines cases inwhich a "rm (a) declared a regular dividend in the same calendar month ofyear 1 as it declared both a regular and a special in year 0, and (b) did not declarea special in that or any other month of year 1.
Table 8 documents average abnormal stock performance in the three dayssurrounding announcements of special dividends, with the sample partitionedaccording to the combination of regular and special dividend actions taken onthe announcement day. Columns (1), (2), (3), and (4) respectively report resultsfor announcements of an increase, no change, a decrease to a still-positive level,and an omission of special dividends. Rows (A), (B), and (C) report results forincreases, no change, and decreases (including omissions) in regular dividends.For each observation in the table, we calculate the abnormal stock return as the"rm's raw stock return from the business day before through the business dayafter the dividend announcement minus the return on the CRSP value-weightedmarket index over the same three-day period. We assess statistical signi"canceusing t- and z-statistics under standard parametric and nonparametricWilcoxon tests.
332 H. DeAngelo et al. / Journal of Financial Economics 57 (2000) 309}354

Tab
le8
Mea
n(m
edia
n)a
bno
rmal
stock
retu
rnsin
the
thre
eda
ysar
ound
div
iden
dan
nou
ncem
ents
byN
YSE"rm
sove
r19
62}19
95:s
ample
part
itio
ned
acco
rdin
gto
the
com
bin
atio
nofsp
ecia
lan
dre
gula
rdiv
iden
ddec
isio
ns
anno
unc
edby
the"rm
Forth
ese
test
s,th
esa
mple
consist
sofN
YSE"rm
sth
atpai
dm
ultipl
esp
ecia
lsove
r19
26}19
95ac
cord
ing
toC
RSP.T
he
sam
ple
isre
strict
edto"rm
sth
atpai
dsp
ecia
lsfrom
mid
-196
2th
roug
hye
ar-e
nd
1995
,sin
ceC
RSP
does
notpro
videda
ilyst
ock
retu
rnsfo
rea
rlie
rper
iods.
Foral
ldat
apoin
tsan
alyz
edhe
re,
the"rm
pai
don
esp
ecia
ldiv
iden
din
the
bas
eye
ar(d
e"ned
asye
ar0)
and
paid
eith
eron
esp
ecia
lornon
ein
the
even
tye
ar(y
ear1)
.Colu
mns
(1),
(2),
and
(3)
cont
ain
case
sin
whi
chth
e"rm
pai
dsp
ecia
lsin
both
year
s0
and
1,w
hile
colu
mn
(4)c
onta
insca
sesw
her
eth
e"rm
pai
don
esp
ecia
lin
year
0butom
itte
dsu
chpa
ymen
tin
year
1.F
orth
efo
rmer
group,w
ere
strict
atte
ntio
nto
case
sin
whi
chth
e"rm
dec
lare
da
regu
lardi
vide
nd
onth
esa
me
dat
eth
atit
dec
lare
dits
spec
ialin
year
1.W
eca
nnot
apply
this
cond
itio
nto
spec
ialom
issionsbec
ause"rm
sge
ner
ally
donot
announc
eth
eom
ission
ofa
spec
ial,
butin
stea
dsim
ply
fail
todec
lare
one.
The
refo
re,o
uran
alys
isofs
pec
ialo
missions
inco
lum
n(4
)foc
use
son
thos
eca
sesin
whic
hth
e"rm
(a)d
ecla
red
are
gula
rdiv
iden
din
thesa
meca
lend
arm
onth
ofy
ear1
asit
decl
ared
bot
ha
regu
laran
da
spec
iali
nye
ar0
and
(b)d
idno
tdec
lare
asp
ecia
lin
that
oran
yot
her
mon
thofy
ear
1.C
olum
n(5
)giv
espa
ram
etric
t-an
dW
ilcox
onno
npar
amet
ric
z-st
atistics
toco
mpa
reco
lum
ns(1
)ver
sus(3
),w
hile
colu
mn
(6)g
ives
t-an
dz-
stat
istics
toco
mpa
reco
lum
ns(1
),(2
),an
d(3
)po
ole
dve
rsus
colu
mn
(4).
For
each
obs
erva
tion
inth
eta
ble,
we
calc
ulat
eth
eab
norm
alst
ock
retu
rnas
the"rm's
raw
stoc
kre
turn
form
the
busine
ssday
bef
ore
thro
ugh
the
busines
sda
yaf
terth
edi
vide
ndan
nou
nce
men
tm
inus
the
conte
mpor
aneo
usth
ree
day
retu
rnon
the
CR
SPva
lue-
wei
ghte
dm
arket
inde
x.Forca
sesin
whi
chth
ere
gula
rdiv
iden
dw
asde
crea
sed,t
her
ear
ere
spec
tive
ly0,
1,an
d2
obse
rvat
ionsin
colu
mns(1
),(2
),an
d(3
)an
dso
the
rele
vant
table
entr
ies
are
mar
ked
asnot
mea
nin
gful(n
.m.).
Firm
pay
san
oth
ersp
ecia
ldiv
iden
d:
Com
par
ison
test
stat
istics
:
Spec
ialin
crea
ses
Spe
cial
pay
men
tsIn
crea
sesp
ecia
lP
aysa
me
spec
ial
Dec
reas
esp
ecia
lO
mit
spec
ial
vers
usdec
reas
esve
rsus
om
issions
(1)
(2)
(3)
(4)
(5)
(6)
Incr
ease
regu
lar
2.45
%H
2.45
%H
1.33
%H
0.08
%t"
1.60
t"5.
15(A
)(1
.63%
)H(1
.78%
)H(1
.33%
)H(0
.08%
)z"
1.03
z"4.
90n"
67n"
59n"
64n"
176
Pay
sam
ere
gula
r1.
25%H
0.61
%H
1.09
%H
!0.
70%
t"0.
42t"
2.74
(B)
(0.9
1%)H
(0.4
4%)H
(0.8
9%)H
(!0.
93%
)z"
0.14
z"3.
06n"
200
n"31
1n"
124
n"42
Dec
reas
ere
gula
r!
1.32
%(C
)n.
m.
n.m
.n.
m.
(!1.
32%
)n.
m.
n.m
.n"
25
HIn
dic
ates
that
repo
rted"gu
reis
sign
i"ca
ntly
di!er
entfrom
zero
atth
e0.
01le
velor
bet
ter
under
apar
amet
ric
t-te
stor
non
par
amet
ric
Wilc
oxon
test
.
H. DeAngelo et al. / Journal of Financial Economics 57 (2000) 309}354 333

The most important "ndings in Table 8 are those in row (B), since thesesubsamples contain only observations for which the regular dividend isunchanged. These data show that, on average, "rms experience signi"cantlypositive abnormal stock returns of about 1% when they do not change theirregular dividend and either increase the special [column (1)], leave the specialunchanged [column (2)], or cut the special to a still-positive level [column (3)].The "ndings in column (3) are especially noteworthy because they indicate thatinvestors respond favorably to the news that the "rm will pay a special dividend,even when that dividend is smaller than the prior year's special.
Brickley (1982, pp. 121}126) runs tests analogous to those in columns (2) and(4) of row (B). For 22 special omission observations, he reports a negativeaverage announcement day return that is almost identical to the mean "gure inour column (4) and which, like ours, is not signi"cantly di!erent from zero. For15 observations in which the "rm left the special unchanged, he "nds a negativebut statistically insigni"cant stock return. The latter "nding is inconsistent withthe signi"cantly positive return we document in column (2), but this inconsist-ency is not particularly troubling given the small sample size. Brickley does notpresent "ndings for samples analogous to those in our columns (1) and (3), andso we cannot compare these aspects of our analysis with the "ndings of hisstudy.
The comparison test statistics in row (B) of Table 8 indicate that, on average,the stock market reacts more favorably when a special will be paid than whenone is omitted, but that it reacts in essentially the same way to special increasesand decreases to a still-positive level. Speci"cally, when "rms leave the regulardividend unchanged, we "nd signi"cantly greater stock returns when theycontinue to pay another special of whatever magnitude [columns (1), (2), and (3)pooled] than we observe when they fail to pay one [column (4)], with compari-son test statistics of t"2.74 and z"3.06. However, we "nd no statisticallydetectable di!erence between the favorable market reactions to special increasesand to special decreases to a still-positive level (t"0.42, z"0.14).
Row (A) of Table 8 presents a similar picture, except that these tests are lessinformative than those in row (B) because the various observations in row (A)have heterogeneous (and contemporaneous) changes in the size of regulardividends. As with row (B), the row (A) data show that "rms experience positivemean and median abnormal stock returns when they increase the regulardividend and simultaneously either increase the special, leave it unchanged, orcut the special to a still-positive level (columns (1), (2), and (3) respectively).However, when "rms increase the regular dividend but omit payment ofa special, the average stock return does not di!er signi"cantly from zero (column(4)), suggesting that the regular dividend increase e!ectively compensates stock-holders for the relatively disappointing news that the "rm will not pay a special.
We "nd no statistically signi"cant di!erence between the mean (and median)stock returns for increases and decreases in special dividends to a still-positive
334 H. DeAngelo et al. / Journal of Financial Economics 57 (2000) 309}354

level, as evidenced by comparison test statistics of t"1.60 and z"1.03 incolumn (5) of Table 8. However, the pooled sample in which "rms continue topay specials exhibits materially larger stock returns than we "nd for the samplein which regulars are increased and specials omitted (t"5.15, z"4.90).Although the tests in row (A) do not control for the size of regular dividendchanges, they are nonetheless consistent with the general patterns found in row(B), which do control for such changes.
The 25 cases in which "rms cut the regular dividend and omitted the specialexperience an average abnormal return of !1.32% [row (C) and column (4) ofTable 8]. This stock return represents a smaller decline than the !5% or!6% average market reaction to regular dividend decreases previouslyreported by Charest (1978) and Woolridge (1983). Since this "nding is notcentral to the main themes of this paper and since it is based on a relatively smallsample, we do not investigate this issue further.
4.2. Cross-sectional regression analysis of announcement returns
We next investigate whether there is signi"cant information (or signaling)content associated with the magnitude of special dividend changes. For thisregression analysis, we study the sample of observations in which regulardividends are unchanged, i.e., the observations in row (B) of Table 8. We excludethe 7 observations (out of 677) where the special increased by 300% or more,since these very large changes likely di!er in fundamental ways from the vastmajority of recurring special dividends. (For example, consistent with the"ndings presented in Section 3.1, they are more likely to be associated withcorporate restructurings.)
The dependent variable in our regression tests is the abnormal stock returnfor the three-day dividend announcement period, denoted AR. The "rst ex-planatory variable, OMIT, is an indicator variable that takes the value 1 if thespecial dividend was omitted and 0 if a special was paid. The size of the specialdividend change is denoted CHG, which is de"ned as the ratio of the split-adjusted values of (1) the di!erence between the current year's and last year'sspecial dividends, divided by (2) total dividend payments in the prior year.Finally, OMIT]CHG is a slope interaction term which measures the dollar sizeof a given special omission standardized by the "rm's total dividend in the prioryear. The regression estimates (and t-statistics) are:
AR"0.008!0.023 OMIT#0.024 CHG!0.071 OMIT]CHG.
(6.16) (!2.00) (1.54) (!1.10)
This regression captures a very small portion of the total variation in abnor-mal returns, with an adjusted R-squared of just over 1%. However, the interceptis signi"cantly positive, indicating that specials are met with a favorable stock
H. DeAngelo et al. / Journal of Financial Economics 57 (2000) 309}354 335

price reaction that averages about 1%, a "nding that is consistent with the"gures reported in Table 8. Also, the signi"cantly negative coe$cient on OMITindicates that the stock market return is materially lower when the "rm fails topay a special dividend, corroborating our earlier "nding that investors reactfavorably to the fact that a special will be paid. The insigni"cant coe$cients onCHG and on OMIT]ICHG indicate the absence of a systematic relationbetween the announcement period abnormal stock return and the size of thechange in special dividends.
We "nd similar results when we replace the CHG variable with the percentagechange in the special dividend. The new size measure dictates that we mustexclude a slope interaction term in the regression, since all special omissionsrepresent a !100% change in the special dividend, which makes the slopeinteraction variable perfectly collinear with the intercept term. With thesemodi"cations, the resulting regression yields a signi"cant positive intercept anda signi"cantly negative coe$cient for OMIT (t-statistic"!2.12), while thecoe$cient for the percentage change in the special does not di!er signi"cantlyfrom zero (t-statistic"0.61). As before, the announcement return is signi"cantlyin#uenced by the presence or absence of a special dividend payment, but it is notsystematically related to the size of the special change.
We would ideally like to assess whether (1) special dividends had signi"cantsignaling content in our early sample period, but (2) lost much of that power inlater years after special payments had become routine. Unfortunately, CRSPreports daily stock returns only beginning in mid-1962. Given these datalimitations, we instead run one additional cross-sectional test on post-1962 datato see if the wealth impact of specials is smaller when the "rm historically paidconsistent specials. We employ the structure of the regressions reported above,but add as an independent variable the number of consecutive years that a "rmpaid specials prior to each announcement under consideration. We include theconsecutive years variable to assess the hypothesis that, when the signalingcontent of specials is relatively large (the number of consecutive payment years islow), the market reaction will be greater than when the `surprisea element issmall (the number of consecutive payments is high).
We "nd that the coe$cient estimates for the consecutive years variable arenegative, as expected, but not statistically di!erent from zero (details notreported). These results do not support the notion that a longer history ofpaying special dividends translates to a diminished stock market response tosubsequent special announcements. (As in the regressions reported above, thesetests also show no signi"cant relation between announcement returns and themagnitude of the change in special dividends.)
We are reluctant to place much weight on the results of these cross-sectionaltests because they focus exclusively on post-1962 data, and our Section 2 analy-sis indicates that the decline in specials was already well underway by that time.The latter regularity suggests that any signaling content these payments had in
336 H. DeAngelo et al. / Journal of Financial Economics 57 (2000) 309}354

10Strickland (1997) and Jain (1999) provide evidence that institutions tend to tilt their portfolioholdings toward stocks with low dividend yields. Evidence that institutional ownership and theERISA prudent man rule a!ect the stock returns of dividend-omitting"rms is presented by Brav andHeaton (1998). Although these studies document a connection between institutional ownership anddividend policy, none speaks directly to the issue of the incentive to pay specials. Our discussionemphasizes di!erences in "nancial sophistication across institutional and retail investors becausethis di!erence plausibly implies a connection between institutional ownership and the payment ofspecials.
earlier decades may have been substantially reduced by the time our sampleperiod begins. If so, it would be di$cult to observe in our data any cross-sectional relation between relative signaling content and stock returns. Consis-tent with this conjecture, our regressions uniformly exhibit low R-squareds.Additionally, most announcement returns in our sample are just not that large.In fact, the main picture that emerges from our event study analysis is that, whilespecial declarations convey modest good news to market participants in recentyears, their signaling content is typically small.
5. Institutional stock ownership clienteles and the decision to pay special dividends
The virtual disappearance of special dividends may re#ect di!erences in thedemand for specials by individual and institutional clienteles, coupled with thesubstantial shift over the last 45 or so years from a retail-dominated stockmarket to one dominated by institutions. If institutional investors are more"nancially sophisticated than retail investors, they should more easily infer thelack of a substantive di!erence between regular dividends and specials paid withgreat frequency. Consequently, higher levels of institutional ownership shouldencourage "rms to stop paying specially designated dividends. Stockholders'behavioral biases will reinforce this e!ect. For example, Shefrin and Statman(1984) argue that some investors demand dividends because they impose a `selfcontrola heuristic that prohibits spending out of invested capital. Miller andModigliani's (1961) logic implies that such behavior assumes "nancially namKveinvestors, since invested capital will fall by the amount of the dividend on theex-dividend day. Nevertheless, some investors may believe dividends do notreduce invested capital, and thus namKvely view special dividends as `windfallsa.To the extent that special dividends are aimed at "nancially namKve investors,greater institutional ownership should reduce "rms' incentives to pay them.10
At least two other factors might encourage managers to pay fewer specialswhen institutional ownership increases. One possibility is that the greaterdividend volatility inherent in a policy of paying specials may lead someinstitutional investors to raise more questions about "rm performance than theyotherwise would. If so, managers seeking to avoid scrutiny may eliminate
H. DeAngelo et al. / Journal of Financial Economics 57 (2000) 309}354 337

11Poterba and Samwick (1995, Table 7) provide a year-by-year summary of the same data thatshows a slow and steady decline in the incidence of household stock ownership from 89.7% in 1952to 47.7% in 1994. These data show that household ownership increased in only three of the 43 yearsfrom 1952 to 1994, and two of these increases are by 1/10th of 1% and 2/10ths of 1%. Almost all thedecreases are also small in magnitude (on the order of 1% or so), with the sole exception of 1969when household ownership declined from 81.9% to 69.1%.
12The introduction noted than many large blue chip "rms historically paid specials, a "nding thatmight seem at odds with the argument that specials largely appeal to unsophisticated investors (sincetoday we "nd heavy institutional ownership of blue chips). The two points are consistent, however,since the data show that as recently as the middle part of the 20th century, institutional ownership ofequities was not very substantial. The latter fact virtually requires that, during these earlier periods,ownership of many blue chips was not dominated by institutions.
specials to generate a smoother overall dividend series. A second possibility isthat managers eliminate specials because institutional investors "nd the asso-ciated dividend volatility to be bothersome when rebalancing their portfolios.For example, some institutions may view specials as unattractive because of theperiodic need to make last minute portfolio `window dressinga trades inresponse to unanticipated bonus dividend amounts.
5.1. Aggregate trends in institutional ownership and special dividend payments
The New York Stock Exchange Fact Book (various issues) presents FederalFlow of Funds data which indicate that the percent of equity holdings byhouseholds and nonpro"t institutions fell from 91.3% in 1950 to 48.6% in 1990,while stock ownership by pro"t-oriented institutions increased from 6.1% to44.5%.11 Gompers and Metrick (1998) report "rm- and institution-speci"c datawhich show that, in recent years, stock ownership has come to be highlyconcentrated in the hands of a small number of institutional investors. For 1996,they "nd that investment managers with over $100 million in discretionaryfunds controlled over 50% of the value of publicly traded stocks, and the 100largest fund managers controlled over two-thirds of this total. The high concen-tration of equity ownership by a small number of "nancially sophisticatedinstitutions suggests that such ownership plausibly contributed to the virtualdisappearance of special dividends, consistent with the behavioral bias outlinedabove.
Two characteristics of the aggregate shift from individual to institutionalstock ownership make it more likely that this clientele trend contributed to thedisappearance of specials. First, in 1950, aggregate institutional stock ownershipwas at modest levels (less than 10%, according to the NYSE Fact Books) andspecial dividends were paid by almost half the dividend-paying "rms on theNYSE.12 Second, subsequent years' increases in institutional ownership anddeclines in special dividends both occurred gradually over a long period. If theincidence of specials had fallen abruptly over a short time period, we would
338 H. DeAngelo et al. / Journal of Financial Economics 57 (2000) 309}354

suspect a particular tax or regulatory shift as the primary causal agent. But sincewe "nd a gradual decline in specials, it seems more likely that their disappear-ance is due to economic factors such as the clientele shift toward institutionalownership, which evolved slowly over many years.
5.2. Logit analysis of the impact of institutional ownership on the decision to payspecials
Our tests for a negative relation between the likelihood that a "rm continuesto pay specials in recent years and its level of institutional ownership employthree samples of dividend-paying NYSE-listed "rms. We include only those"rms with institutional ownership reported at year-end 1985 in Standard andPoor's Security Owner's Stock Guide. Sample (I) contains 118 "rms that paid atleast 10 special dividends before 1981. Sample (II) contains 195 "rms that paid atleast "ve specials before 1981. By construction, these two samples contain only"rms with a strong historical tendency to pay specials frequently, which shouldenhance our ability to detect any impact of institutional ownership on thedecision to pay specials in the 1980s. Sample (III) contains 1,009 dividend-paying "rms with su$cient data for our logit regressions (described below). Thelatter sample contains a large number of "rms that did not pay specials before1981, which should make it more di$cult to detect any impact of institutionalownership on the decision to pay specials in the 1980s.
We classify a "rm as paying special dividends during the 1980s if, at any timefrom 1981 through 1990, it paid at least one special whose size was less than 5%of equity value. (We impose the size cap because, as documented in Section 3.1,the 1980s witnessed a substantial increase in large one-time specials associatedwith corporate restructurings, i.e., payments that are not necessarily indicativeof an ongoing policy of paying specials.) If the "rm paid no such specialsover 1981}1990, we classify it as having a policy of not paying specials. Insamples (I), (II), and (III), the number of "rms that pay specials during the 1980sare 16, 23, and 28 (13.6%, 11.8%, and 2.8% of the "rms in the respectivesamples).
For all three samples, we "nd that "rms that pay special dividends in the1980s have signi"cantly lower institutional ownership, both under simpleunivariate comparison tests and in logit regressions that control for otherfactors that plausibly a!ect the decision to pay specials. In sample (I), the meaninstitutional ownership is 49.3% for the "rms that do not pay specials versus34.3% for "rms that pay them (t-value for di!erence"3.50) and the respectivemedians are 52.4% and 32.9% (Wilcoxon z-value"3.38). In sample (II), themean and median are 49.7% and 52.5% for those that do not pay specials,compared to 33.0% and 33.9% for those that continue to pay specials (t- andz-values of 5.11 and 4.50). In sample (III), the mean and median institutionalownership are 33.1% and 35.1% for "rms that pay specials during the 1980s
H. DeAngelo et al. / Journal of Financial Economics 57 (2000) 309}354 339

versus 40.5% and 41.3% for "rms that do not (t- and z-values of 2.29 and 2.10).These univariate results are consistent with the notion that higher levels ofinstitutional ownership are associated with a lower probability of paying specialdividends.
Table 9 reports results of logit regressions that assess whether the likelihoodthat a "rm pays specials is negatively related to the percentage of stock held byinstitutions. The dependent variable equals one if the "rm pays special dividendsduring the 1980s and zero otherwise. Since larger "rms tend to have higherinstitutional ownership, we control for (the log of) market capitalization toavoid having institutional ownership proxy for other potentially important, butomitted factors related to "rm size. We also control for stock return volatilitysince theory suggests that a riskier operating environment should encouragemanagers to pay specials to make any future dividend cuts less surprising, hencepresumably less troubling to stockholders. The regressions include dividendyield to control for the "rm's overall level of dividends. It seems plausible thatfewer specials will be paid by "rms that pay low overall dividends, given thattheir dividend policies are not likely to attract any clientele (individual orinstitutional) with a strong demand for dividend income.
Panel A of Table 9 reveals a signi"cant negative relation between the level ofinstitutional ownership and the likelihood that a "rm continues to pay specialdividends, controlling for the e!ects of these other variables. The statisticalstrength of the relation is of roughly the same order of magnitude in the threesamples, with p-values for the institutional ownership coe$cient of 0.003 forsample (I), 0.0001 for sample (II), and 0.001 for sample (III).
The control variables show some signs of signi"cance, but overall their impactis not great. The market capitalization coe$cient is signi"cantly negative onlywhen institutional ownership is excluded in samples (I) and (II) and is indistin-guishable from zero in sample (III). These "ndings suggest that "rm size per sedoes not a!ect the decision to continue paying specials. Stock return volatility issigni"cant (or nearly so) in all speci"cations, but the sign of its coe$cient is theopposite of that predicted. One possible explanation is that greater volatilityleads managers to adopt conservative dividend policies (with lower regular andfewer special dividends) to hedge against disappointing investors with cuts ineither type of dividends. The dividend yield coe$cient is insigni"cant in samples(I) and (II), and signi"cantly negative in sample (III). Contrary to our expecta-tion, these dividend yield coe$cients are inconsistent with the view that "rmsthat pay higher overall dividends are most likely to pay specials in the 1980s. Wehave no obvious explanation for this "nding. In any case, the importantimplication for the current study is that all three logit estimations indicate thatgreater levels of institutional ownership are associated with a signi"cantly lowerprobability that a "rm pays special dividends.
Panel B of Table 9 provides evidence that the negative impact of institutionalownership on the decision to pay specials is economically material. In this
340 H. DeAngelo et al. / Journal of Financial Economics 57 (2000) 309}354

analysis, we hold the control variables constant at their mean values and varythe level of institutional ownership to generate estimates of the probability thata "rm pays specials at a given level of institutional ownership. The logitestimates for samples (I) and (II) both imply that, at low levels of institutionalownership, the predicted probability is high that a "rm continues to pay specialsin the 1980s. For example, 10% institutional ownership implies a "rm willcontinue to pay specials with 88% probability if it is in sample (I) and 50% if it isin sample (II). The predicted probabilities decline fairly rapidly as institutionalownership increases: at 20% institutional ownership, the probabilities decline to49% for "rms in sample (I) and to 34% for "rms in sample (II) and, at 50%institutional ownership, they fall to 8.8% and 6.7% respectively. These logitresults imply that a large increase in institutional ownership } roughly equal tothat which occurred over the last 45 or so years } would be met with a very largedecline in the incidence of special dividends.
Although they point towards the same conclusion, the predicted probabilitychanges for sample (III) are not as striking. For this sample, the predictedprobability that a "rm pays specials falls from 7.6% at 10% institutionalownership to 1.3% at 50% ownership. Arguably, it is more relevant that theabsolute probability change from 7.6% to 1.3% represents a relative decline of83% in the predicted probability of paying specials. The reason that the 83%"gure is more telling is that sample (III) contains many "rms with no priorhistory of paying specials, which implies a low unconditional probability ofpaying specials for this sample as a whole. In other words, the fact that few "rmsin sample (III) ever paid specials inherently limits the chances of "nding a largeabsolute reduction in the probability of paying specials. Thus, the 83% relativedecline is a strong "nding in the sense that it represents almost as large a declinein the importance of specials as one could possibly expect to "nd in thesedata.
6. Did common stock repurchases displace special dividends?
Four considerations motivate our interest in assessing whether commonstock repurchases displaced special dividends. First, specials and repurchasesshare the common feature of allowing managers to temporarily increasecash payouts without necessarily committing to continue the higher distribu-tions in future years. Second, managers may have replaced specials with repur-chases to capture the tax advantages associated with the latter form of cashdistribution. Third, common stock repurchases are currently used by many"rms to distribute cash to stockholders, just as special dividends were once usedby many "rms. Finally, repurchase activity was economically trivial during theyears that specials were prominent in corporate payout policies (see below fordetails).
H. DeAngelo et al. / Journal of Financial Economics 57 (2000) 309}354 341

Tab
le9
Logi
tre
gres
sions
toas
sess
whet
her
div
iden
dpa
ying"rm
slis
ted
onth
eN
YSE
pay
atle
ast
one
spec
ialdi
vide
nd
during
1981}19
90
Inth
epan
elA
regr
essions
,the
dep
enden
tva
riab
leeq
ual
sone
ifth
e"rm
pai
dat
leas
ton
esp
ecia
ldiv
iden
d(d
urin
g19
81}19
90)w
hose
dol
larm
agni
tude
isle
ssth
an5%
ofeq
uity
valu
e,an
dze
root
her
wise.
We
impo
seth
e5%
size
cap
bec
ause
larg
esp
ecia
ldi
vide
nds
paid
during
this
per
iod
are
gene
rally
asso
ciat
edw
ith
corp
ora
tere
stru
cturings
rath
erth
anw
ith
ongo
ing
pro
gram
sof
pay
ing
occ
asio
nal
spec
ials
tost
ock
hol
ders
.A
llsa
mple"rm
sar
ediv
iden
d-p
ayin
gco
mpa
nies
liste
don
the
NY
SE,h
ave
inst
itutiona
ldat
afo
rye
ar-e
nd19
85re
port
edin
Stan
dard
&Poor's
Secu
rity
Ow
ner
s'Sto
ckG
uide,
and
hav
eda
taav
aila
ble
onC
RSP
for
the
contr
olva
riab
les
des
crib
edbe
low
.Sam
ple
sI
and
IIin
clude
only"rm
sw
ith
aprior
hist
ory
ofpa
ying
spec
ials
befo
re19
81,w
hile
sam
pleII
Iin
cludes
all"
rmsre
gard
less
ofth
eirpr
iorsp
ecia
ldiv
iden
dpay
men
tre
cord
.Log
(MktC
ap)i
sth
enat
ura
llog
oft
he"rm's
tota
lm
arke
tva
lue
ofeq
uity
atye
ar-e
nd19
85.S
tock
vola
tilit
yis
the
stan
dar
dde
viat
ion
ofth
e"rm's
dai
lyst
ock
retu
rnove
r19
85.D
ivid
end
yiel
dis
the"rm's
tota
ldiv
iden
dsin
1984
div
ided
byth
em
arket
valu
eof
equi
tyat
year
-end
1994
.Pan
elB
repor
tsth
epre
dic
ted
prob
abili
tyth
ata"rm
will
pay
spec
ials
atdi!
eren
tle
vels
ofin
stitutional
ow
ner
ship
.In
thes
epre
dict
ions
,th
eoth
erva
riab
les
are
held
const
ant
atth
eir
mea
nva
lues
.
A.E
stim
ated
coez
cien
ts(p
-val
ues)
from
logi
tre
gres
sion
s
(I)11
8"rm
sth
atpai
dat
(II)
195"rm
sth
atpai
dat
(III
)1,
009"rm
s,in
clud
ing
those
leas
t10
spec
ials
bef
ore
leas
t5
spec
ials
bef
ore
that
histo
rica
lly
pai
dsp
ecia
ls19
8119
81an
dth
ose
that
did
not
Inte
rcep
t8.
658.
165.
205.
01!
1.47
!2.
90(0
.022
)(0
.028
)(0
.064
)(0
.072
)(2
.28)
(2.2
1)
%In
stitutiona
l!
5.77
!6.
56!
4.56
stoc
khol
dings
(0.0
03)
(0.0
001)
(0.0
01)
Log(
Mkt
Cap
)!
0.44
!0.
22!
0.35
!0.
090.
020.
30(0
.03)
(0.2
9)(0
.03)
(0.5
8)(0
.87)
(0.1
5)
342 H. DeAngelo et al. / Journal of Financial Economics 57 (2000) 309}354

Sto
ckvo
latilit
y!
258.
7!
262.
5!
111.
6!
139.
5!
105.
0!
116.
1(0
.01)
(0.0
2)(0
.12)
(0.0
5)(0
.05)
(0.0
2)
Div
iden
dyi
eld
!16
.39
!15
.95
!16
.40
!20
.84
!17
.53
!26
.82
(0.4
5)(0
.52)
(0.3
0)(0
.21)
(0.0
6)(0
.004
)
Mod
elp-
valu
e0.
032
(0.
001
0.07
2(
0.00
10.
110
0.00
1
B.
Pre
dict
edpr
obab
ilit
ies
ofsp
ecia
ldi
vide
ndpa
ymen
tsas
afu
ncti
onof
inst
itut
iona
low
ners
hip,
eval
uate
dw
ith
othe
rva
riab
les
held
atsa
mpl
em
eans
%In
stitut
ional
(I)11
8"rm
sth
atpai
dat
(II)
195"rm
sth
atpa
idat
(III
)1,
009"rm
s,in
clud
ing
ow
ner
ship
:le
ast
10sp
ecia
lsbe
fore
leas
t5
spec
ials
bef
ore
those
that
pai
dsp
ecia
ls19
8119
81an
dth
ose
that
did
not
10%
0.88
00.
500
0.07
620
%0.
494
0.34
00.
050
30%
0.27
80.
211
0.03
240
%0.
156
0.12
20.
021
50%
0.08
80.
067
0.01
3
H. DeAngelo et al. / Journal of Financial Economics 57 (2000) 309}354 343

6.1. The timing of the decline in specials and the increase in stock repurchases
Many prior studies indicate that stock repurchases were uncommon before1973. For example, Dann (1980, 1981) reports a yearly average of 3.8 repur-chases tender o!ers during 1962}1972 by NYSE and AMEX "rms, whichincreased to 43 and 30 in 1973 and 1974. Dollar volume, however, remainedmodest until 1984. Bagwell and Shoven (1989) estimate annual repurchases forCompustat "rms at:
1977: $3.3 billion 1981: $4.0 billion 1985: $41.3 billion
1978: $3.5 billion 1982: $8.1 billion 1986: $41.5 billion
1979: $4.5 billion 1983: $7.7 billion 1987: $54.3 billion
1980: $5.0 billion 1984: $27.4 billion
For the same population, Poterba (1987) estimates repurchases at $1.8 billionfor 1976, while Helwege et al. (1995) estimate them at $0.7 billion for 1975 and$1.1 billion for 1976. These authors, Barclay and Smith (1988), Allen andMichaely (1995), Dunsby (1995), and Dittmar (1997) also report a radicalupsurge in repurchases in 1984. Jagannathan et al. (1999) document that therepurchase boom continued at least through 1996.
The decline in special dividends we observe began sometime in the late 1950sand was essentially complete well before the 1984 upsurge in repurchases (Fig. 1,panel A). Only 1.6% of dividend-paying NYSE "rms paid special dividends in1984, an incidence far below that of the 1920s through the 1950s. Similarly,specials account for one-"fth of 1% of the dollar amount of all dividends paid byNYSE "rms in 1984 (the same is true for 1981}1983). It is di$cult to conceive ofeconomically plausible scenarios in which the mid-1980s stock repurchase boomis closely connected to decisions that many "rms made 20 or more years earlierto cease paying special dividends.
6.2. Tax law changes and the incentives to repurchase stock and pay specialdividends
The timing of the repurchase boom is also at odds with familiar argumentsabout tax incentives to pay dividends versus repurchase stock. As many othershave noted, the tax law changes in the Tax Reform Act of 1986 should haveencouraged greater reliance on dividends relative to repurchases, yet the oppo-site occurred. It therefore seems unlikely that the increased use of repurchases inrecent years is primarily attributable to tax-related factors.
It is similarly di$cult to argue that the disappearance of specials is due to taxcode shifts that discouraged dividend payments in general. The decline inspecials occurred gradually over many years and not in a short time span as onewould expect if a single tax law change were the cause. If multiple tax law
344 H. DeAngelo et al. / Journal of Financial Economics 57 (2000) 309}354

13Special dividends provide cash to all stockholders, who can also choose to sell their shares andthus receive a similar cash distribution under an open market repurchase program. Data in Stephensand Weisbach (1998) imply that the average annual payout under an open market repurchaseprogram is about 2% of equity value. For our sample, the mean and median specials are 1.46% and0.98% of the "rm's share price one month before the special was announced.
changes were responsible, there should be a contemporaneous dampening of allforms of dividends over the years that specials eroded. However, the availableevidence is inconsistent with this view. Poterba (1987, Table 4) reports thataggregate dividend payout ratios are reasonably stable from the 1940s onward,and increase substantially in the 1980s. [Similar evidence is reported by Dunsby(1995, Table 2) and Fama and French (1999, Table 10)]. This pattern isinconsistent with the view that taxes } or any other factors } put generaldownward pressure on dividends during the years that specials were declining inimportance. This evidence suggests that the disappearance of specials is connec-ted to forces that made specials per se unattractive and not to factors thatgenerally discouraged dividend payments.
Finally, other data in Poterba (1987) cast additional doubt on the notion thatincome taxes played an important role in the disappearance of specials. HisTable 4 provides estimates of the tax penalty on dividends relative to capitalgains. These data show only small variation in the dividend tax penalty fromWorld War II through the early 1980s, with a modest trend toward a smallerdividend tax penalty in later years. If tax changes were the primary reason that"rms altered their usage of special dividends, the incidence of specials shouldincrease in recent years, the opposite of what actually occurred.
6.3. Did xrms replace recurring special dividends with stock repurchaseprograms?
Because special dividends are similar in structure and size to open marketstock repurchases,13 we next investigate whether "rms substitute open marketrepurchase programs for prior policies of paying recurring special dividends. Toenhance our ability to detect a substitution of repurchases for specials, we focuson the sample of 91 NYSE "rms (described in Section 3.3) that ended well-established policies of paying specials at frequent intervals. If these "rms haveindeed substituted repurchases for specials, we would expect to observe a rea-sonable number of repurchases (see below for more precise estimates) withina few years of their last special dividend. We exclude "rms that historically paidspecials infrequently, since we would have di$culty interpreting evidence of lowrepurchase activity following their last special dividend. A low incidence ofrepurchases may be perfectly normal for the latter "rms (given their historical
H. DeAngelo et al. / Journal of Financial Economics 57 (2000) 309}354 345

14An assumption here is that by focusing on "rms with a high historical incidence of specialdividend payments, our tests analyze "rms whose future policies are to make bonus distributions ata high frequency. This assumption seems reasonable a priori, but it is clearly an approximation, sincewhether a special dividend is paid or not depends on both the "rm's policy regarding specialdistributions and whether the exogenous events necessary to trigger a special dividend actuallymaterialized ex post. Since the tests reported below show an unexpectedly low incidence of stockrepurchases following the cessation of specials, one might be concerned that this low incidenceoccurred because of exogenous changes that led "rms to materially after their payout practices.Some evidence that this concern is not an issue for the 91 "rms in this sample is that our earlierLintner model analysis reveals no detectable change in the behavior of their total dividend paymentsaround the time they stop paying special dividends (see Table 5).
15For each event year, we report repurchase incidences as a proportion of the full sample of 91"rms, even though there are four "rms for which we have incomplete data after event year 5. Thestatistical signi"cance of our results is unchanged when we measure repurchase incidence asa proportion of the number of "rms with complete data.
16The proportion of "rms that repurchase stock by event year ¹ follows a binomial distributionwith `successa probability p(¹). Letting O(¹) equal the observed number of "rms that repurchasestock by year ¹ (out of a sample of n "rms), the test statistic is then z"[O(¹)!np(¹)!0.5]/[np(¹)(1!p(¹))]1@2. This test statistic is based on the normal approximation to the binomialdistribution with correction for continuity.
proclivity to pay special dividends infrequently) and not necessarily an indica-tion that they have failed to substitute repurchases for specials.14
For each "rm in the sample of 91, we document repurchases by searching theWall Street Journal Index for the last year in which a special was paid (eventyear 0), the two prior years (years !2 and !1), and the ten years after the lastspecial (years #1 to #10). Column (1) of Table 10 reports the cumulativeincidence of open-market repurchases as of each event year.15 Columns (2) and(4) report estimates of the expected repurchase incidence under the assumptionthat repurchases replaced specials. To see the logic underlying these estimates,let p represent the probability that a "rm makes a bonus cash distribution ina given year. Assuming that di!erent years' bonus payouts are independent, theprobability of zero repurchases for ¹ consecutive years is (1!p)T and theprobability of at least one repurchase by year ¹ and is p(¹)"[1!(1!p)T]. Ifp is equal across "rms, the expected incidence of "rms that repurchase stock byyear ¹ is np(¹), where n is 91. Column (2) sets p"0.25, and thereby providesa lower bound on the expected repurchase incidence, since all sample "rms paidspecials at least 25% of the time. Column (4) sets p"0.587, and therebyprovides an `average casea estimate, since the average sample "rm paid specials58.7% of the time. Columns (3) and (5) report z-statistics to assess whether theobserved level of open-market repurchases di!ers signi"cantly from their ex-pected level.16
For each event year from #1 through #10, Table 10 shows a signi"cantlylower cumulative incidence of open-market stock repurchases than expectedunder either the lower bound or average case scenarios. By event year #5, 20
346 H. DeAngelo et al. / Journal of Financial Economics 57 (2000) 309}354

Table 10Cumulative incidence of "rms announcing open-market stock repurchases in the years surroundingthe cessation of special dividend payments: 91 NYSE "rms with long histories of paying recurringspecials
The sample contains 91 NYSE "rms that paid special dividends in 10 or more years and did so atleast once every four years on average. A "rm is included here only if it paid specials through 1965and remained listed on CRSP for at least four years after its last reported special. Event year 0 isde"ned as the calendar year in which the "rm last paid a special dividend. Column (1) reports theactual cumulative number and percent of "rms announcing an open-market repurchase program bythe speci"ed event year. Columns (2) and (4) give the expected cumulative number and percent of"rms repurchasing stock under two di!erent scenarios, while columns (3) and (5) provide z-statisticsto assess the signi"cance of the di!erence between the actual and expected numbers. The `lowerbounda scenario takes the probability that a "rm will repurchase stock in a given year as 0.25. It isa lower bound scenario in the sense that all sample "rms paid special dividends at least once everyfour years during the time between their "rst and last special. The `averagea scenario takes theprobability that a "rm will repurchase stock in a given year as 0.587. It is an average scenario in thesense that the average "rm in the sample paid special dividends in 58.7% of the years between their"rst and last special. Information on stock repurchases is taken from the Wall Street Journal Index.A dividend is classi"ed as a special if it has a distribution code of 1262 or 1272, the CRSP codes fordividends labeled year-end, "nal, extra, or special. In columns (2) through (5), the entries for years!2 through 0 are marked not applicable (n.a.) to re#ect the assumption that "rms do notrepurchase stock until they stop paying special dividends.
Event yearrelative
Cumulativenumber (%) of
Lower bound prediction of Average case prediction of
to paymentof lastspecial
"rms makingopen-marketrepurchases
stock repurchases stock repurchases
Expected (1) vs. (2) Expected (1) vs. (4)number (%) z-statistic number (%) z-statistic
(1) (2) (3) (4) (5)
!2 1 n.a. n.a. n.a. n.a.(1.1%)
!1 4 n.a. n.a. n.a. n.a.(4.4%)
0 8 n.a. n.a. n.a. n.a.(8.8%)
1 10 23 !3.21 53 !9.35(11.0%) (25.0%) (58.7%)
2 14 40 !5.56 75 (!15.00(15.4%) (43.8%) (82.9%)
3 16 53 !7.88 85 (!15.00(17.6%) (57.8%) (93.0%)
4 18 62 !10.08 88 (!15.00(19.8%) (68.4%) (97.1%)
H. DeAngelo et al. / Journal of Financial Economics 57 (2000) 309}354 347

Table 10 (continued)
Event yearrelative
Cumulativenumber (%) of
Lower bound prediction of Average case prediction of
to paymentof lastspecial
"rms makingopen-marketrepurchases
stock repurchases stock repurchases
Expected (1) vs. (2) Expected (1) vs. (4)number (%) z-statistic number (%) z-statistic
(1) (2) (3) (4) (5)
5 20 69 !12.30 90 (!15.00(22.0%) (76.3%) (98.8%)
6 21 75 !14.89 91 (!15.00(23.1%) (82.2%) (99.5%)
7 22 79 (!15.00 91 (!15.00(24.2%) (86.7%) (99.8%)
8 28 82 (!15.00 91 (!15.00(30.8%) (90.0%) (99.9%)
9 29 84 (!15.00 91 (!15.00(31.9%) (92.5%) (100.0%)
10 29 86 (!15.00 91 (!15.00(31.9%) (94.4%) (100.0%)
"rms or 22.0% of the test sample had announced an open-market repurchase.Using lower bound estimates, we expect that number to be 69 "rms, or 76.3% ofthe test sample. Using average case estimates, we expect it to be 90 "rms, or98.8%. Under the lower bound scenario, we expect 86 "rms to have announcedsuch programs by event year #10 while, under the average case scenario, weexpect virtually all 91 "rms to have done so.
The same picture emerges when we consider all types of repurchases: tendero!ers, privately negotiated buybacks, and open-market repurchases. In everyyear, we observe signi"cantly fewer repurchases of all types than expected underthe substitution hypothesis (details not shown in Table 10). For example, by year#10, 38 "rms (41.8% of the sample) announced some type of repurchase, anincidence that is materially below that expected under both lower bound andaverage case scenarios.
Because our data include the 1970s and 1980s period of generally increasedrepurchase activity, they probably overstate the number of "rms that introducedrepurchases speci"cally to replace special dividends. In Table 10, 11 (28.9%) ofthe 38 "rms that paid their last special before 1973's general increase inrepurchases had repurchased stock by year #10. Of the remaining 53 "rms(which paid their last special in 1973 or later), 50.1% (27 "rms) repurchased
348 H. DeAngelo et al. / Journal of Financial Economics 57 (2000) 309}354

stock by year #10. The di!erence in repurchase incidence before and after 1973is signi"cant at the 0.031 level under a chi-square test. The higher incidence ofrepurchases after 1973 plausibly re#ects, at least to some degree, the generalincreased popularity of repurchases per se rather than a deliberate substitutionof repurchases for specials.
A possible explanation for the low incidence of stock repurchases in oursample is that "rms replaced a policy of paying frequent specials with one ofmaking infrequent stock repurchases. We can assess this possibility by notingthat, even if "rms slowed the rate of special payouts (independent of form), weshould nonetheless observe the greatest incidence of repurchases among "rmswith the highest prior frequency of special dividends. For this test, we partitionthe sample according to the historical frequency of special dividends. GroupI contains those "rms that paid specials least often (less than every other year onaverage), group III contains the "rms that paid specials most often (more thanthree out of four years on average), and group II contains the "rms that paidspecials with intermediate frequency.
Among the "rms that had previously paid special dividends most frequently,only 20.0% ("ve of 25 "rms) had repurchased stock by the end of event year#10 (group III), a frequency well below that for "rms in the other groups.Among "rms that previously paid specials least often, 53.7% (22 of 41 "rms)had repurchased stock by the end of event year #10 (group I). And repurchaseswere undertaken by 44.0% of the "rms (11 of 25) in the intermediate specialdividends group (group II). Thus, "rms with the highest prior frequency ofspecial dividends have the lowest subsequent incidence of repurchases, and thedi!erence across groups is signi"cant at the 0.052 level under a chi-square test.This pattern is the opposite of what we should observe if "rms replaced specialdividends with stock repurchases.
7. Summary and implications of 5ndings
This paper documents that NYSE "rms once pervasively paid special divi-dends, but this practice gradually eroded over the second half of the 20thcentury so that now such payouts are rare. Our evidence indicates that "rmstypically paid specials almost as predictably as regular dividends, a paymentpattern that e!ectively made them close substitutes for regulars. A remarkablylarge 27.9% of NYSE-listed "rms that paid specials in multiple years did so atleast 90% of the time, i.e., in at least nine out of ten years on average. Well overhalf (56.8%) these "rms paid specials more often than every other year onaverage. When specials are paid so predictably, the special versus regularlabeling loses much of any meaningful distinction. In contrast to the vastmajority of special dividends, large specials (de"ned as those exceeding 5% or10% of equity value) have survived and, in fact, have increased in importance in
H. DeAngelo et al. / Journal of Financial Economics 57 (2000) 309}354 349

recent years. The survival of large specials likely re#ects the fact that their sheersize automatically di!erentiates them from regular dividends.
With little substantive economic di!erence between virtually all specials andregulars, we would expect most "rms to eventually drop the labeling distinctionand simply incorporate specials into the regular dividend. Evidence consistentwith this view is provided by our Lintner (1956) model analysis of "rms thateliminated specials after paying them frequently for many years. Controlling forearnings, the pattern of regular dividends after the cessation of specials does notdi!er signi"cantly from the earlier pattern of total (special plus regular) divi-dends. Further evidence that these "rms simply substituted regular dividends forspecials is the fact that they increased regulars signi"cantly more often after theystopped paying specials than they did while paying specials. More generally, wealso "nd that "rms tended to increase regulars when they reduced specials toa still positive level, e!ectively treating regular increases as substitutes forreductions in specials. Our data also indicate that the disappearance of specialsis part of a general evolution toward homogeneous dividend policies in which"rms gradually converged on the simple practice of paying exactly four regulardividends per year.
Consistent with Brickley (1983), we "nd that over 1962}1995 the stock markettypically reacts favorably to the declaration of a special dividend, holding theregular dividend constant. However, the market reaction is typically modest insize and is not systematically related to the sign or magnitude of the change fromone positive special dividend payment to another. For example, the stockmarket response averages approximately 1%, both when "rms increase specialsand when they reduce them to a still-positive level. Overall, our data indicatethat although recent years' special dividends generally convey good news toinvestors, any such signaling content is typically small.
We also "nd some evidence that the decline in specials is related to theclientele shift from the mid-century era when individuals dominated stockownership to the current era in which institutions dominate. At the aggregatelevel, the decline in specials and the increase in institutional ownership evolvedroughly in parallel, with both occurring gradually over many years. At the "rmlevel, logit regressions show a signi"cantly negative relation between institu-tional stock ownership and the probability that a "rm pays specials in recentyears. These "ndings suggest that the disappearance of specials is at least partlydue to institutional investors' superior ability to infer that, as a practical matter,corporate managers treated most specials and regulars as close economicsubstitutes.
Our evidence indicates that the disappearance of specials is not closelyconnected to recent years' upsurge in stock repurchases. For example, thedecline in special dividends began many years before the upsurge in stockrepurchases and was largely complete by the time repurchases became common.Historically, there is no clear analog to repurchase tender o!ers among special
350 H. DeAngelo et al. / Journal of Financial Economics 57 (2000) 309}354

dividends, since prior to the takeover and restructuring wave of the 1980s therewere virtually no specials comparable in size to repurchase tender o!ers. Tendero!ers apparently emerged as vehicles to satisfy relatively recent desires toquickly distribute large amounts of cash, and did not displace large specialdividends in accomplishing this objective. Finally, among "rms that stoppedpaying specials after long histories of frequently making such payouts, theincidence of open market (and other types of) repurchases is signi"cantly lowerthan expected if "rms had simply substituted stock repurchases for specialdividends.
Our "ndings pose a challenge for dividend signaling theories, which hold thatdividend decisions are an important vehicle for managers to signal stockholdersabout future "rm pro"tability. As Brickley (1982, 1983) notes, the explicitlabeling of special dividends inherently conveys a message that a portion ofcurrent dividends is transitory. The fact that specials have almost completelydisappeared is inconsistent with the view that these particular dividend signalsserve an economically important function. Moreover, the revealed preferences ofmost managers indicate that they generally did not assign great importance tothe ability to send signals that sharply and credibly di!erentiated betweentransitory and permanent dividend components. If managers viewed such sig-nals as important, they would not have followed the self-defeating practice ofpaying specials almost as predictably as they paid regulars.
It is conceivable that special dividends historically served an economicallyuseful signaling function, but were supplanted by more e!ective signalingvehicles. In this case, the disappearance of specials would not call into questionthe value of "nancial signaling per se, but would indicate that one type ofdividend signal had been rendered obsolete by innovation in signaling techno-logy. A priori, common stock repurchase is the most plausible candidate forsuch a signaling innovation. The empirical di$culty with this explanation is thatwe "nd little evidence of a connection between the disappearance of specials andthe emergence of repurchases as an important payout vehicle.
If we nonetheless assume that special dividends historically served as "nancialsignaling devices and that repurchases now serve this function, we are left withsome interesting unresolved questions about what would appear to be a gla-cially slow process of "nancial innovation. What factors might explain whyspecials declined in importance many years before the wide adoption of anostensibly superior signaling vehicle? And why would most "rms that droppedspecials after paying them at frequent intervals not move immediately into usingthe superior signaling technology? Bagwell and Shoven (1989, p. 136) argue thatmanagers required a long time to learn about the advantages of repurchases asa cash distribution method. Yet, if managers were slow to see the advantages ofrepurchases, why were the disadvantages of special dividends apparent to themso much earlier? While answers to these questions would be interesting in theirown right, they could also help us better understand the general process through
H. DeAngelo et al. / Journal of Financial Economics 57 (2000) 309}354 351

which once-popular "nancial practices come to be obsolete and are eventuallyreplaced.
The "ndings documented here for special dividends also raise doubts aboutthe importance of signaling as an explanation for observed changes in "rms'regular dividends. Our evidence indicates that the survival of di!erent types ofspecial dividends depends on whether or not these payouts send sharply delin-eated messages to stockholders. If we apply this criterion to "rms' regulardividends, changes therein would seem to convey an important message tostockholders only when those changes are dramatic (and not when they areroutine). Since most "rms tend to make modest changes in regular dividends, theprobability that these changes are viewed by investors as meaningful signalsabout future pro"tability is small. Thus, if we extrapolate our inference from thedata on special dividends, most regular dividend decisions are unlikely to re#ectsignaling motives. Fama and French (1999) report evidence that publicly traded"rms have become signi"cantly more reluctant to pay dividends over thelast two decades. Although a variety of factors may explain this trend, Famaand French's evidence is consistent with the view that a substantially largerproportion of publicly traded "rms now "nds it worthwhile to forego dividendsignaling.
Signaling issues aside, our analysis is also relevant to the question of thegeneral relation between "rms' dividend policies and their stock repurchaseactivity. Although dividends and stock repurchases are widely viewed as closelyrelated cash distribution methods, Shoven (1986) and Dunsby (1995) "nd noevidence that increases in repurchases lead to o!setting reductions in totaldividends. Similarly, Jagannathan et al. (1999) conclude that repurchases do notappear to replace dividends. It is possible that the "ndings of these studies areattributable to their empirical focus on total dividends rather than on specialsalone. Unlike regulars, specials and repurchases are similar because both enablemanagers to make temporary cash payouts without implicitly committing tocontinue the higher payments in the future. For this reason, an examination ofthe relation between specials and repurchases should provide a more powerfultest of whether repurchases displaced dividends. Our evidence on special divi-dends indicates that any such connection is weak at best.
A possible explanation for the weak empirical relation between dividends andrepurchases is that each accomplishes fundamentally di!erent objectives. Forexample, dividends may largely serve to distribute free cash #ow, while repur-chases may be actions taken primarily to raise the "rm's share price. This view isplausible in that repurchases were of marginal economic signi"cance until the1980s, when takeover pressures became widespread. The increased importanceof institutional ownership may play a complementary role by pressuring man-agers to keep stock values high. Such pressures could explain why repurchasesare now so popular and why they were not generally observed earlier in thiscentury when institutions did not dominate the stock market and when hostile
352 H. DeAngelo et al. / Journal of Financial Economics 57 (2000) 309}354

takeovers were uncommon. The disappearance of specials and the advent ofrepurchases might therefore both be related to the clientele shift toward institu-tional ownership, but with di!erent speci"c motivations driving the two trends.
Finally, our evidence indicates that the scope of interesting unresolved ques-tions about corporate payout policies extends beyond that emphasized in recentresearch. The recent literature focuses on the questions of why "rms paydividends (e.g., to signal future pro"tability or to limit free cash #ow wastage),and what determines the mix of dividends versus repurchases. Interest in thesequestions is shaped partially by issues that seem of immediate relevance; e.g.,interest in stock repurchases is undoubtedly driven by their explosive growthsince the mid-1980s. But the evidence implies that corporate "nance theory doesnot simply face the task of explaining the current set of payout practices, sincethe nature of those practices has changed substantially over the last 50 years.Taking history as a guide, there is no guarantee that the paractices thatcurrently seem of greatest relevance will continue to seem so important even 20or 30 years from now. A more realistic view is that there is not a single "xed setof payout practices to be explained, but that instead these practices are inconstant #ux, so that an important task of corporate "nance research is to helpidentify the factors that shape their evolution.
References
Allen, F., Michaely, R., 1995. Dividend policy. In: Jarrow, R.A., Maksimovic, V., Ziemba, W.T.(Eds.), Operations Research and Management Science. Elsevier, Amsterdam.
Bagwell, L., Shoven, J., 1989. Cash distributions to shareholders. Journal of Economic Perspectives3, 129}140.
Barclay, M., Smith Jr., C., 1988. Corporate payout policy: cash dividends versus open marketrepurchases. Journal of Financial Economics 22, 61}82.
Benartzi, S., Michaely, R., Thaler, R., 1997. Do changes in dividends signal the future or the past?Journal of Finance 52, 1007}1034.
Bhattacharya, S., 1979. Imperfect information, dividend policy, and the `bird in the hand fallacya.Bell Journal of Economics 10, 259}270.
Brav, A., Heaton, J., 1998. Did ERISA's prudent man rule change the pricing of dividend omitting"rms? Working paper, Duke University.
Brickley, J., 1982. Shareholder wealth, information signaling, and the specially designated dividend.Ph.D. Dissertation, University of Oregon.
Brickley, J., 1983. Shareholder wealth, information signaling, and the specially designated dividend:an empirical study. Journal of Financial Economics 12, 187}209.
Charest, G., 1978. Dividend information, stock returns and market e$ciency } II. Journal ofFinancial Economics 6, 297}330.
Dann, L., 1980. The e!ect of common stock repurchases on securityholder returns. Ph.D. Disserta-tion, UCLA.
Dann, L., 1981. Common stock repurchases: an analysis of returns to bondholders and stockholders.Journal of Financial Economics 9, 101}138.
DeAngelo, H., DeAngelo, L., Skinner, D., 1996. Reversal of fortune: dividend signaling and thedisappearance of sustained earnings growth. Journal of Financial Economics 40, 341}371.
H. DeAngelo et al. / Journal of Financial Economics 57 (2000) 309}354 353

Denis, D., 1990. Defensive changes in corporate payout policy: share repurchases and specialdividends. Journal of Finance 45, 1433}1456.
Denis, D., Denis, D., 1995. Causes of "nancial distress following leveraged recapitalizations. Journalof Financial Economics 37, 129}157.
Dial, J., Murphy, K., 1995. Incentives, downsizing, and value creation at General Dynamics. Journalof Financial Economics 37, 261}314.
Dittmar, A., 1997. Stock repurchase waves. Working paper, University of North Carolina.Dunsby, A., 1995. Share repurchases, dividends, and corporate distribution policy. Ph.D. Disserta-
tion, University of Pennsylvania.Fama, E., Babiak, H., 1968. Dividend policy: an empirical analysis. Journal of American Statistical
Association 63, 1132}1161.Fama, E., French, K., 1999. Disappearing dividends: changing "rm characteristics or increased
reluctance to pay? Working paper, Graduate School of Business, University of Chicago.Gompers, P., Metrick, A., 1998. How are large institutions di!erent from other investors? Why do
these di!erences matter? Working paper, Harvard University.Helwege, J., Laster, D., Cole, K., 1995. Stock market valuation indicators: is this time di!erent?
Research paper no. 9520, Federal Reserve Bank of New York.Jagannathan, M., Stephens, C., Weisbach, M., 1999. Financial #exibility and the choice between
dividends and stock repurchases. Working paper, University of Arizona.Jain, R., 1999. Institutional investors do not prefer dividends: individual investors do. Ph.D.
Dissertation, UCLA.Jayaraman, N., Shastri, K., 1988. The valuation impacts of specially designated dividends. Journal of
Financial and Quantitative Analysis 23, 310}312.John, K., Williams, J., 1985. Dividends, dilution, and taxes: a signaling equilibrium. Journal of
Finance 40, 1053}1070.Lintner, J., 1956. Distribition of incomes of corporations among dividends, retained earnings, and
taxes. American Economic Review 46, 97}113.Miller, M., Modigliani, F., 1961. Dividend policy, growth, and the valuation of shares. Journal of
Business 34, 411}433.Miller, M., Rock, K., 1985. Dividend policy under asymmetric information. Journal of Finance 40,
1031}1051.New York Stock Exchange, various dates. New York Stock Exchange Fact Book, NY, NY.Palepu, K., Wruck, K., 1992. Consequences of leveraged shareholder payouts: defensive versus
voluntary recapitalizations. Working paper, Harvard Business School.Poterba, J., 1987. Tax policy and corporate saving. Brookings Papers on Economic Activity,
455}503.Poterba, J., Samwick, A., 1995. Stock ownership patterns, stock market #uctuations, and consump-
tion. Brookings Papers on Economic Activity, 295}372.Shefrin, H., Statman, M., 1984. Explaining investor preference for cash dividends. Journal of
Financial Economics 13, 253}282.Shoven, J., 1986. The tax consequences of share repurchases and other non-dividend cash payments
to equity owners. In: Summers, L. (Ed.), Tax Policy and the Economy, Vol. 1. NBER and MITPress, Cambridge, MA.
Stephens, C., Weisbach, M., 1998. Actual share reacquisitions in open-market repurchase programs.Journal of Finance 53, 313}333.
Strickland, D., 1997. Determinants of institutional ownership: implications for dividend clienteles.Working paper, The Ohio State University.
Woolridge, J., 1983. Dividend changes and security prices. Journal of Finance 38, 1067}1615.Wruck, K., 1994. Financial policy, internal control, and performance: Sealed Air Corporation's
leveraged special dividend. Journal of Financial Economics 36, 157}192.
354 H. DeAngelo et al. / Journal of Financial Economics 57 (2000) 309}354