spe-dl slides ericmackayall
TRANSCRIPT

SPE DISTINGUISHED LECTURER SERIES is funded principally
through a grant of the
SPE FOUNDATION
The Society gratefully acknowledges
those companies that support the program
by allowing their professionals
to participate as Lecturers.
And special thanks to The American Institute of Mining, Metallurgical,
and Petroleum Engineers (AIME) for their contribution to the program.

Oilfield Scale:
A New Integrated Approach
to Tackle an Old Foe
Dr Eric J. Mackay
Society of Petroleum Engineers
Distinguished Lecturer 2006-07 Lecture Season
Flow Assurance and Scale Team (FAST)
Institute of Petroleum Engineering
Heriot-Watt University
Edinburgh, Scotland

Slide 3 of 100
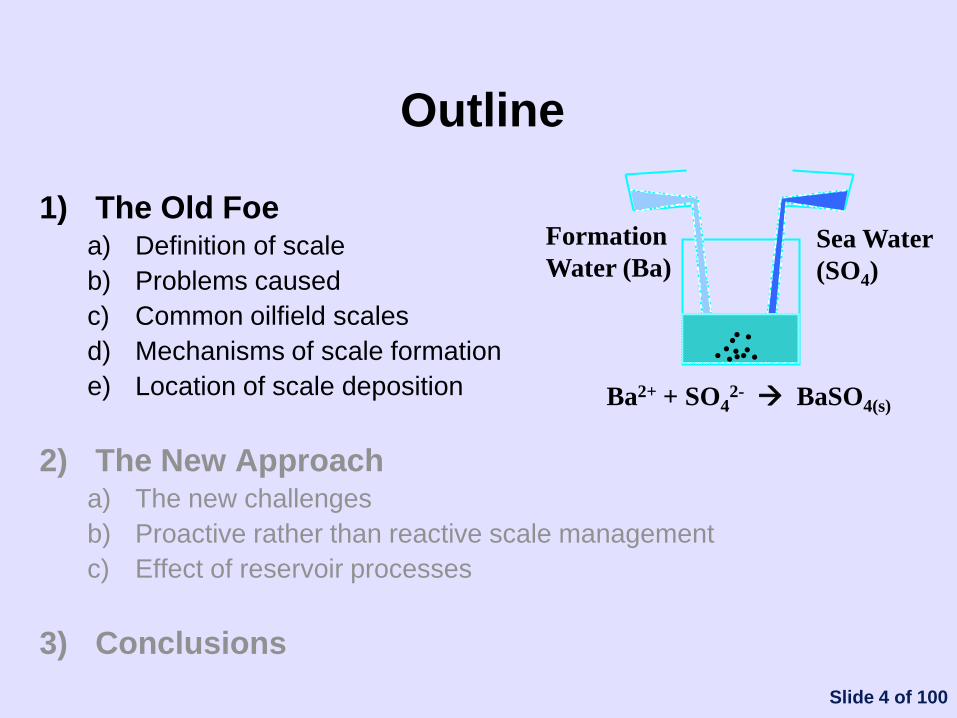
Outline
1) The Old Foe a) Definition of scale
b) Problems caused
c) Common oilfield scales
d) Mechanisms of scale formation
e) Location of scale deposition
2) The New Approach a) The new challenges
b) Proactive rather than reactive scale management
c) Effect of reservoir processes
3) Conclusions
Formation
Water (Ba)
• • • •
• • • • • • •
Sea Water
(SO4)
Ba2+ + SO42- BaSO4(s)
Slide 4 of 100
Outline
1) The Old Foe a) Definition of scale
b) Problems caused
c) Common oilfield scales
d) Mechanisms of scale formation
e) Location of scale deposition
2) The New Approach a) The new challenges
b) Proactive rather than reactive scale management
c) Effect of reservoir processes
3) Conclusions
Formation
Water (Ba)
• • • •
• • • • • • •
Sea Water
(SO4)
Ba2+ + SO42- BaSO4(s)

Slide 5 of 100
1a) Definition of Scale
Scale is any crystalline
deposit (salt) resulting from
the precipitation of mineral
compounds present in water
Oilfield scales typically
consist of one or more types
of inorganic deposit along
with other debris (organic
precipitates, sand, corrosion
products, etc.)

Slide 6 of 100
1b) Problems Caused
Scale deposits formation damage (near wellbore)
blockages in perforations or gravel pack
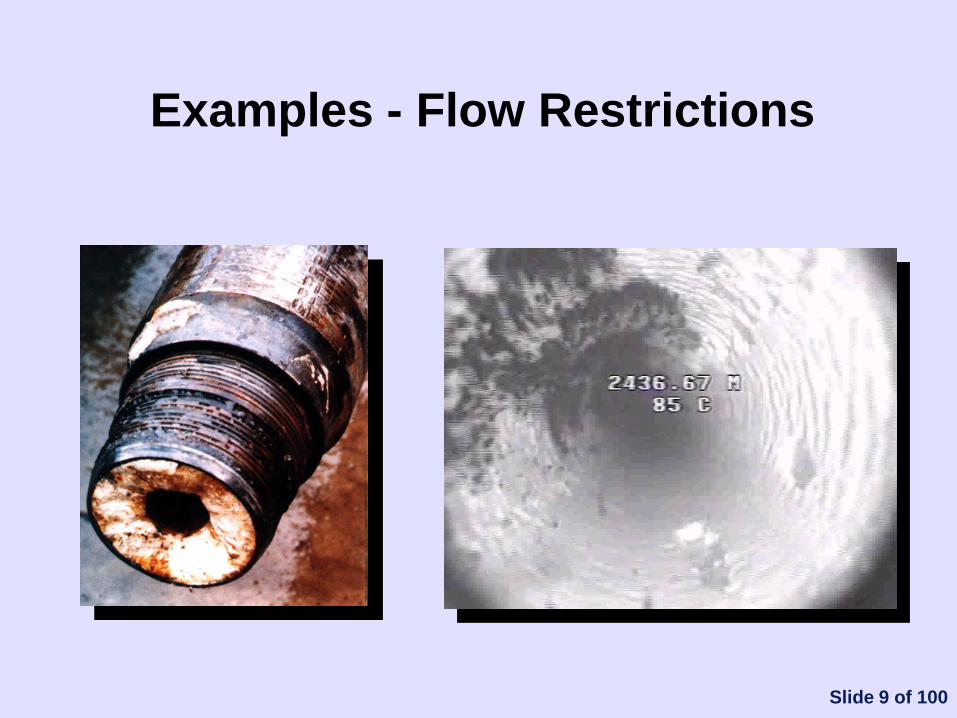
restrict/block flow lines
safety valve & choke failure
pump wear
corrosion underneath deposits
some scales are radioactive (NORM)
Suspended particles plug formation & filtration equipment
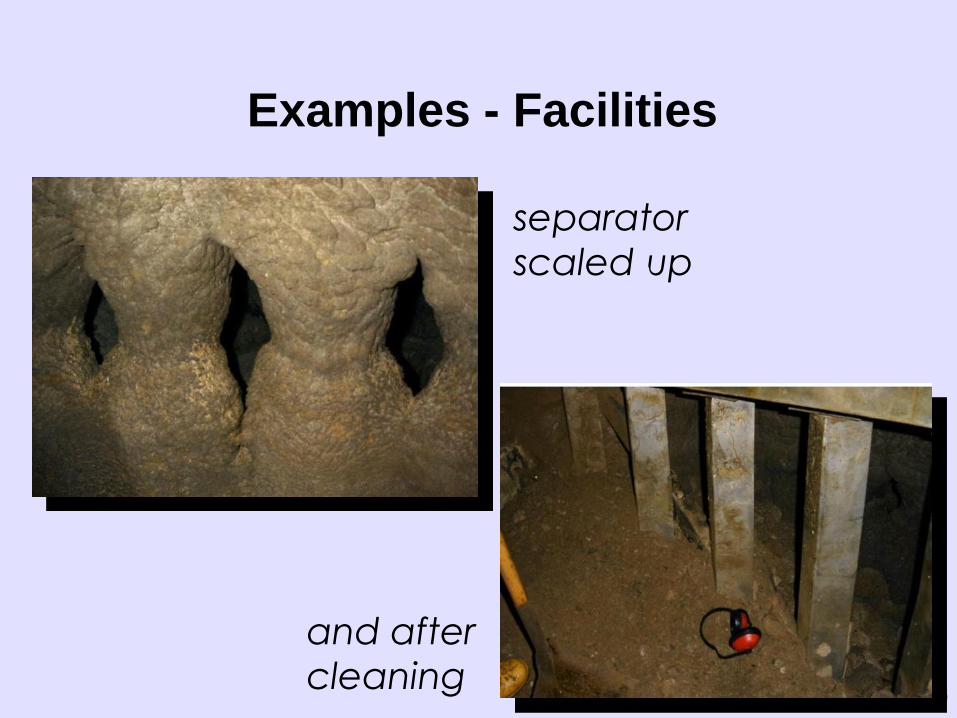
reduce oil/water separator efficiency

Slide 7 of 100
Examples - Formation Damage
quartz grains
scale crystals block
pore throats
Slide 9 of 100
Examples - Flow Restrictions
Slide 10 of 100
Examples - Facilities
separator
scaled up
and after
cleaning
Slide 11 of 100
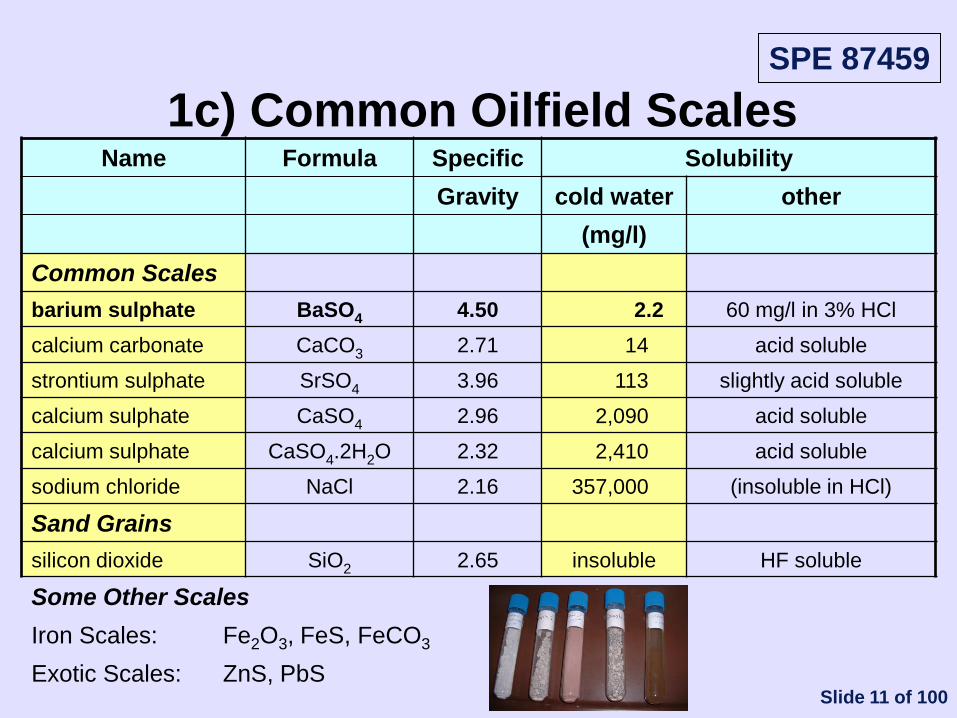
1c) Common Oilfield Scales Name Formula Specific Solubility
Gravity cold water other
(mg/l)
Common Scales
barium sulphate BaSO4 4.50 2.2 60 mg/l in 3% HCl
calcium carbonate CaCO3 2.71 14 acid soluble
strontium sulphate SrSO4 3.96 113 slightly acid soluble
calcium sulphate CaSO4 2.96 2,090 acid soluble
calcium sulphate CaSO4.2H2O 2.32 2,410 acid soluble
sodium chloride NaCl 2.16 357,000 (insoluble in HCl)
Sand Grains
silicon dioxide SiO2 2.65 insoluble HF soluble
Some Other Scales
Iron Scales: Fe2O3, FeS, FeCO3
Exotic Scales: ZnS, PbS
SPE 87459
Slide 12 of 100
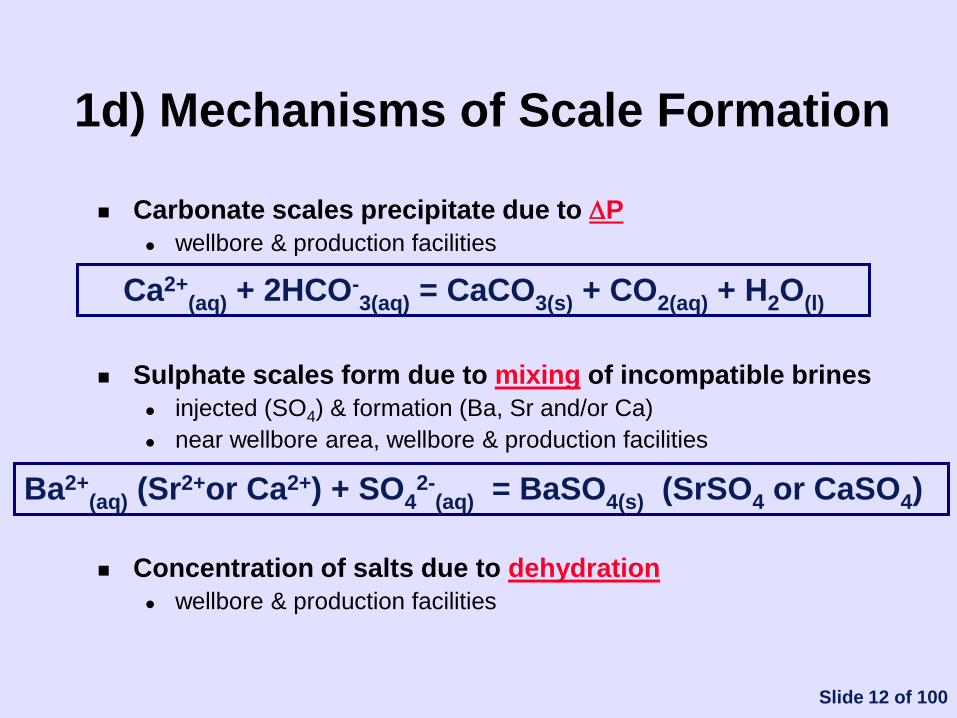
1d) Mechanisms of Scale Formation
Carbonate scales precipitate due to DP
wellbore & production facilities
Sulphate scales form due to mixing of incompatible brines
injected (SO4) & formation (Ba, Sr and/or Ca)
near wellbore area, wellbore & production facilities
Concentration of salts due to dehydration
wellbore & production facilities
Ca2+(aq) + 2HCO-
3(aq) = CaCO3(s) + CO2(aq) + H2O(l)
Ba2+(aq) (Sr2+or Ca2+) + SO4
2-(aq) = BaSO4(s) (SrSO4 or CaSO4)
Slide 13 of 100
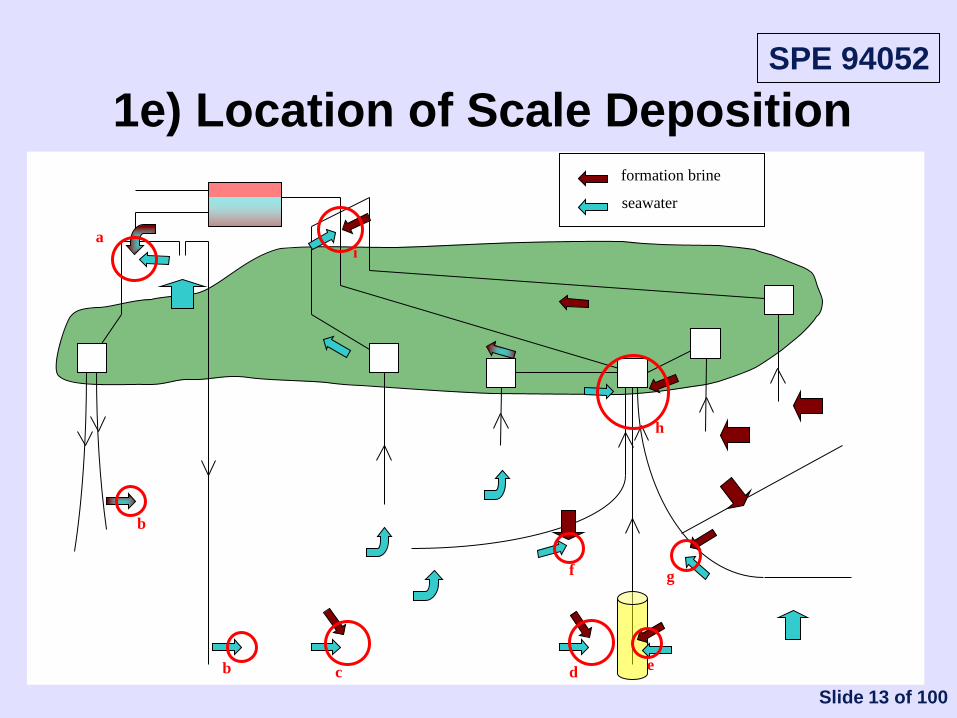
seawater
formation brine
1e) Location of Scale Deposition
b c d e
f g
i
h
b
a
SPE 94052

Slide 39 of 100
Outline
1) The Old Foe a) Definition of scale
b) Problems caused
c) Common oilfield scales
d) Mechanisms of scale formation
e) Location of scale deposition
2) The New Approach a) The new challenges
b) Proactive rather than reactive scale management
c) Effect of reservoir processes
3) Conclusions
Formation
Water (Ba)
• • • •
• • • • • • •
Sea Water
(SO4)
Ba2+ + SO42- BaSO4(s)

Slide 40 of 100
2a) The New Challenges
Deepwater and other harsh environments Temperature and pressure
Residence times
Access to well
Production chemicals compatibility
Inhibitor placement Complex wells (eg deviated, multilateral)
Well value & scale management costs Deepwater
Downhole instrumentation
Rig hire vs Sulphate Reduction Plant
Slide 43 of 100
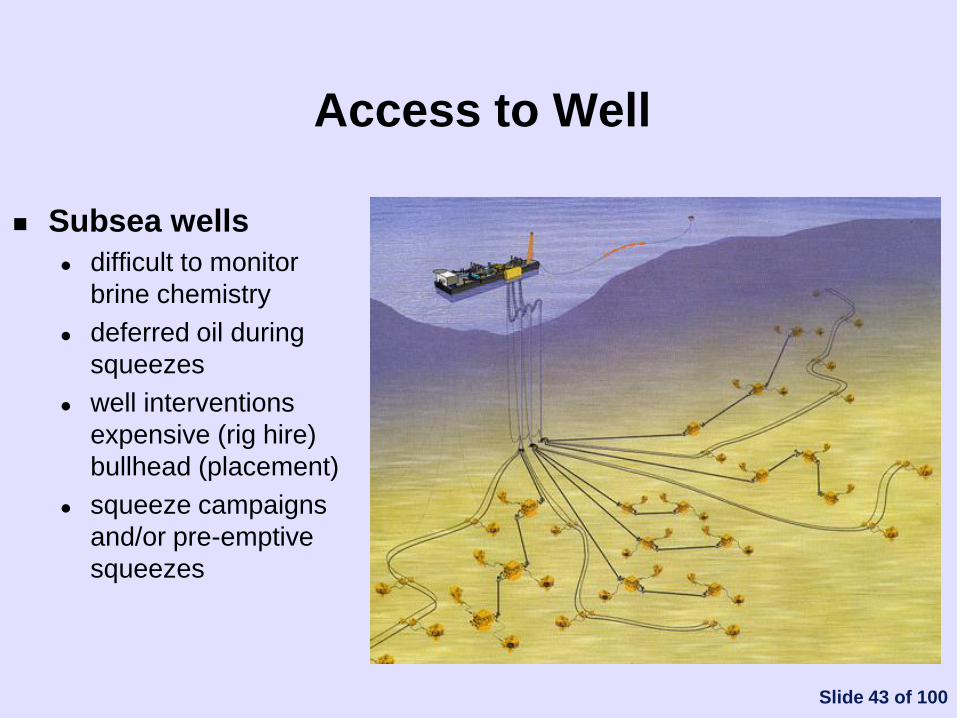
Access to Well
Subsea wells
difficult to monitor
brine chemistry
deferred oil during
squeezes
well interventions
expensive (rig hire)
bullhead (placement)
squeeze campaigns
and/or pre-emptive
squeezes

Slide 45 of 100
Inhibitor Placement in Complex Wells
Where is scaling brine being produced?
Can we get inhibitor where needed?
wellbore friction
pressure zones (layers / fault blocks)
damaged zones
Options:
bullhead (from platform / FPS via subsea chemical injection or test line)
bullhead + divertor
Coiled Tubing (CT) from rig
Combined stimulation / inhibitor treatments
Ptubing head
Fault
Shale
Pcomp 1
Pcomp N
Presv 1
Presv N

Slide 46 of 100
Well Value & Scale Management Costs
Deepwater wells costing US$10-100 million (eg GOM)
Interval Control Valves (ICVs) costing US$0.5–1 million each to install
good for inhibitor placement control
susceptible to scale damage
Rig hire for treatments US$100-400 thousand / day
necessary if using CT
deepwater may require 1-2 weeks / treatment
cf. other typical treatment costs of US$50-150 thousand / treatment
Sulphate Reduction Plant (SRP), installation and operation may cost US$20-100 million

Slide 47 of 100
2b) Proactive Rather Than Reactive
Scale Management
Scale management considered during CAPEX
Absolute must: good quality brine samples and analysis
Predict water production history and profiles well by well
brine chemistry evolution during well life cycle
impact of reservoir interactions on brine chemistry
ability to perform bullhead squeezes:
• flow lines from surface facilities
• correct placement
Monitor and review strategy during OPEX

Slide 48 of 100
2c) Effect of Reservoir Processes
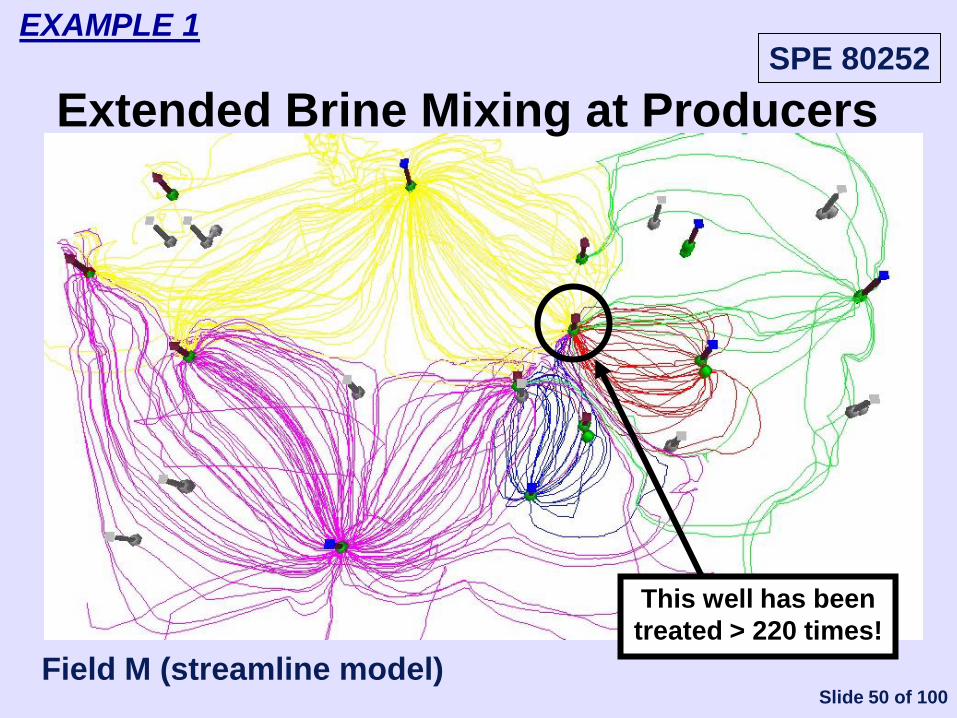
EXAMPLE 1 Management of waterflood leading to extended brine mixing at producers (increased scale risk for producers)
EXAMPLE 2 In situ mixing and BaSO4 precipitation leading to barium stripping (reduced scale risk for producers)
EXAMPLE 3 Ion exchange and CaSO4 precipitation leading to sulphate stripping (reduced scale risk for producers)
EXAMPLE 4 Impact of reservoir pressures (correct / incorrect placement profiles)

Slide 49 of 100
SPE 80252
Extended Brine Mixing at Producers
EXAMPLE 1
Slide 50 of 100
SPE 80252
Field M (streamline model)
This well has been
treated > 220 times!
Extended Brine Mixing at Producers
EXAMPLE 1
Slide 51 of 100
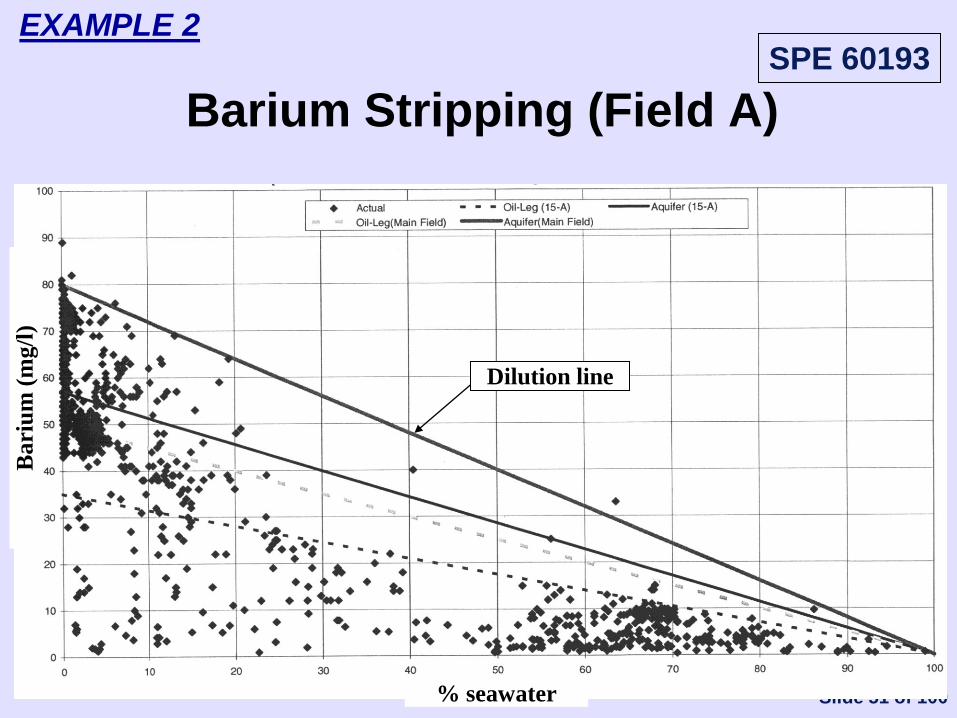
Barium Stripping (Field A)
% seawater
Bari
um
(m
g/l
)
Dilution line
SPE 60193 EXAMPLE 2

Slide 52 of 100
Barium Stripping (Theory)
Seawater (containing SO4) mixes with
formation water (containing Ba)
leading to BaSO4 precipitation in the
reservoir
Minimal impact on permeability in the
reservoir
Reduces BaSO4 scaling tendency at
production wells
SPE 94052 EXAMPLE 2
Slide 53 of 100
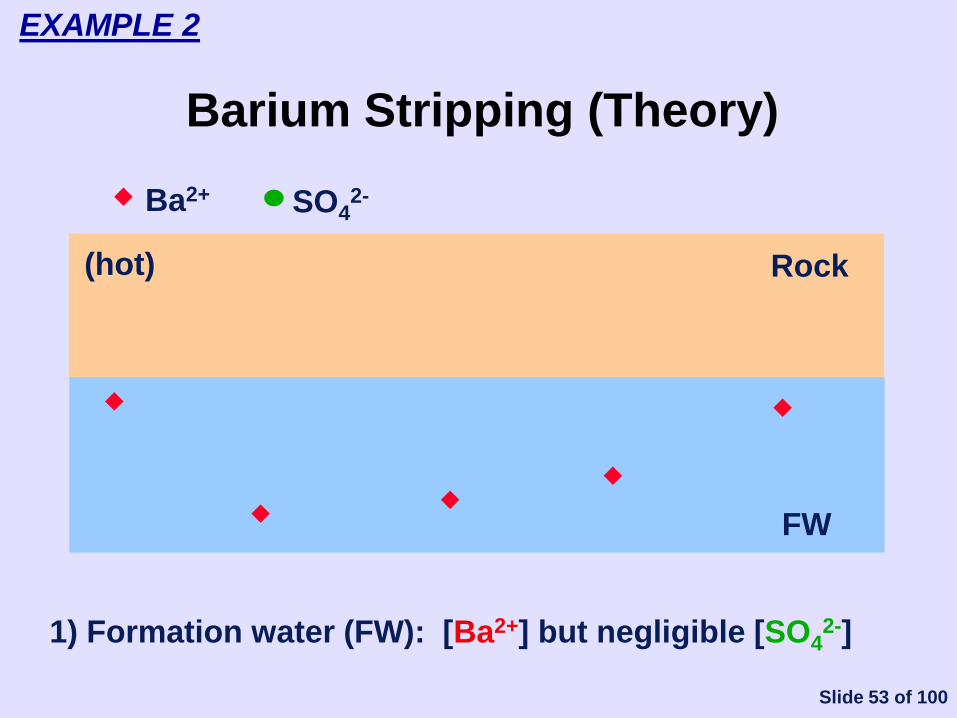
Barium Stripping (Theory)
Ba2+
Rock
SO42-
1) Formation water (FW): [Ba2+] but negligible [SO42-]
FW
(hot)
EXAMPLE 2

Slide 54 of 100
Barium Stripping (Theory)
Ba2+ SO42-
2) Waterflood: SO42- rich seawater displaces Ba2+ rich FW
Rock
FW SW
(cold) (hot)
EXAMPLE 2
Slide 55 of 100
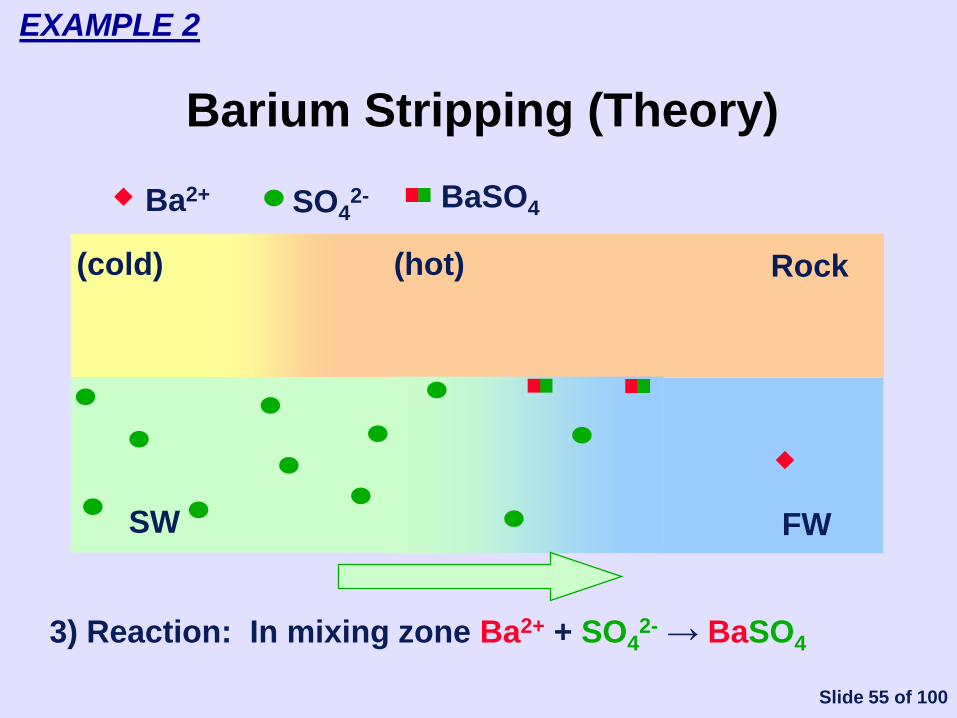
Barium Stripping (Theory)
Ba2+ SO42-
Rock
3) Reaction: In mixing zone Ba2+ + SO42- → BaSO4
FW SW
(cold) (hot)
BaSO4
EXAMPLE 2
Slide 56 of 100
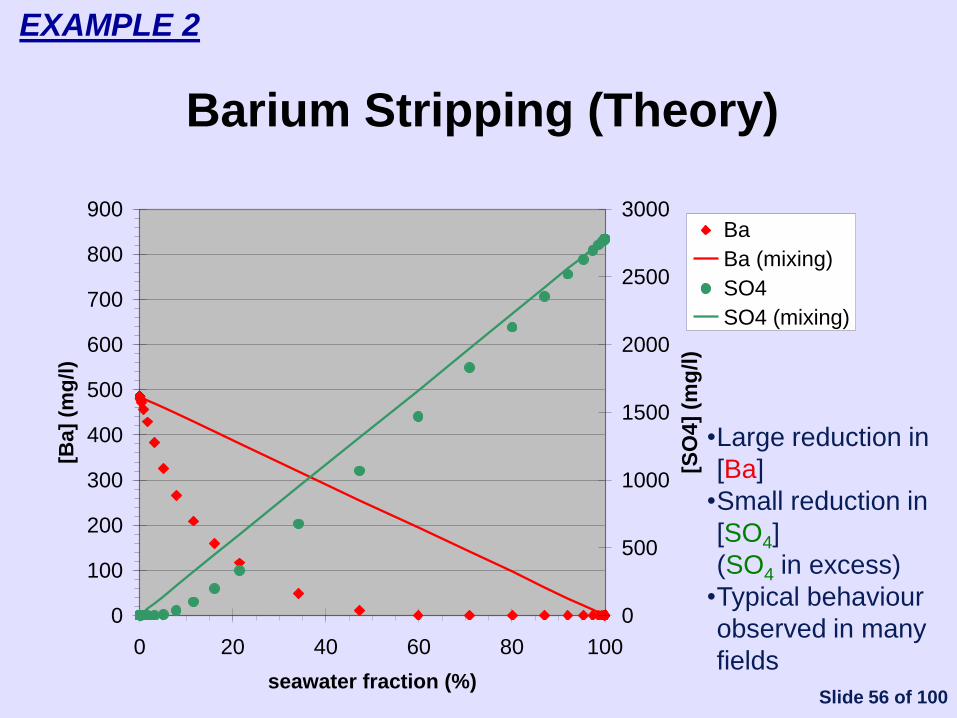
Barium Stripping (Theory)
0
100
200
300
400
500
600
700
800
900
0 20 40 60 80 100
seawater fraction (%)
[Ba
] (m
g/l
)
0
500
1000
1500
2000
2500
3000
[SO
4]
(mg
/l)
Ba
Ba (mixing)
SO4
SO4 (mixing)
•Large reduction in
[Ba]
•Small reduction in
[SO4]
(SO4 in excess)
•Typical behaviour
observed in many
fields
EXAMPLE 2
Slide 57 of 100
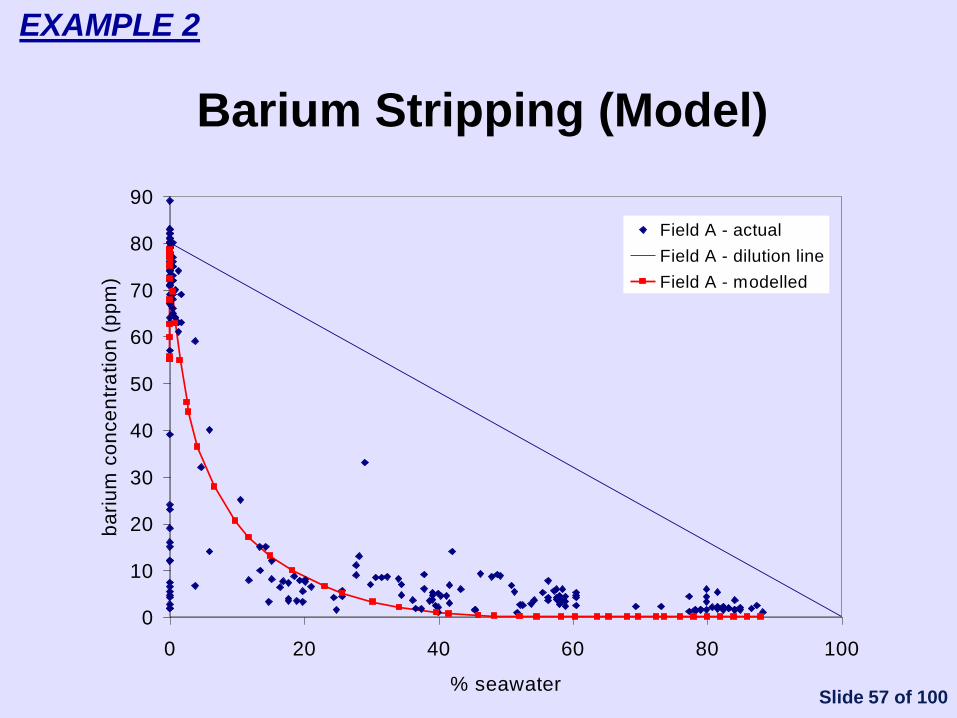
Barium Stripping (Model)
0
10
20
30
40
50
60
70
80
90
0 20 40 60 80 100
% seawater
ba
riu
m c
on
ce
ntr
atio
n (
pp
m)
Field A - actual
Field A - dilution line
Field A - modelled
EXAMPLE 2

Slide 63 of 100
Barium Stripping (Field G)
a) water saturation b) mixing zone
c) BaSO4
deposition (lb/ft3)
SPE 80252
Field G (model)
EXAMPLE 2b

Slide 64 of 100
Barium Stripping (Field G)
0
50
100
150
200
250
0 500 1000 1500 2000 2500
time (days)
ba
riu
m c
on
ce
ntr
ati
on
(p
pm
)
0
500
1000
1500
2000
2500
3000
su
lph
ate
c
on
ce
ntr
ati
on
(p
pm
)
Ba
Ba (no precip)
SO4
SO4 (no precip)
[Ba] at well when no
reactions in reservoir
[Ba] at well when
reactions in reservoir
Field G (model)
EXAMPLE 2b
Slide 65 of 100
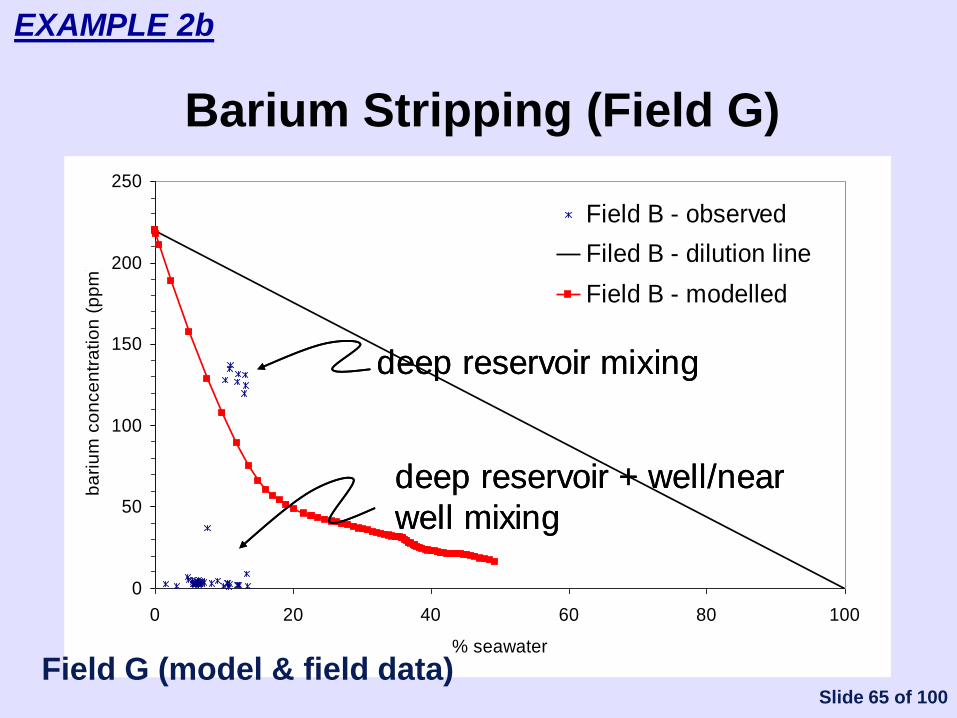
Barium Stripping (Field G)
0
50
100
150
200
250
0 20 40 60 80 100
% seawater
ba
riu
m c
on
ce
ntr
atio
n (
pp
m)
Field B - observed
Filed B - dilution line
Field B - modelled
deep reservoir + well/near
well mixing
deep reservoir mixing
0
50
100
150
200
250
0 20 40 60 80 100
% seawater
ba
riu
m c
on
ce
ntr
atio
n (
pp
m)
Field B - observed
Filed B - dilution line
Field B - modelled
deep reservoir + well/near
well mixing
deep reservoir + well/near
well mixing
deep reservoir mixingdeep reservoir mixing
Field G (model & field data)
EXAMPLE 2b

Slide 71 of 100
Sulphate Stripping (Theory)
Seawater (with high Mg/Ca ratio) mixes with
formation water (with high Mg/Ca ratio)
leading to Mg and Ca exchange with rock to
re-equilibrate
Increase in Ca in seawater leads to CaSO4
precipitation in hotter zones in reservoir
Minimal impact on permeability in the
reservoir
Reduces BaSO4 scaling tendency at
production wells
SPE 100516 EXAMPLE 3

Slide 72 of 100
Ion Exchange
Ca
Mg
Ca
Mg
C
C 0.50
C
C
FW: 0.077
SW: 3.2
Rock: 0.038
CCa Ca in solution
CMg Mg in solution
ĈCa Ca on rock
ĈMg Mg on rock
Gyda FW (mg/l)
30,185
2,325
SW (mg/l)
426
1,368
EXAMPLE 3
Slide 73 of 100
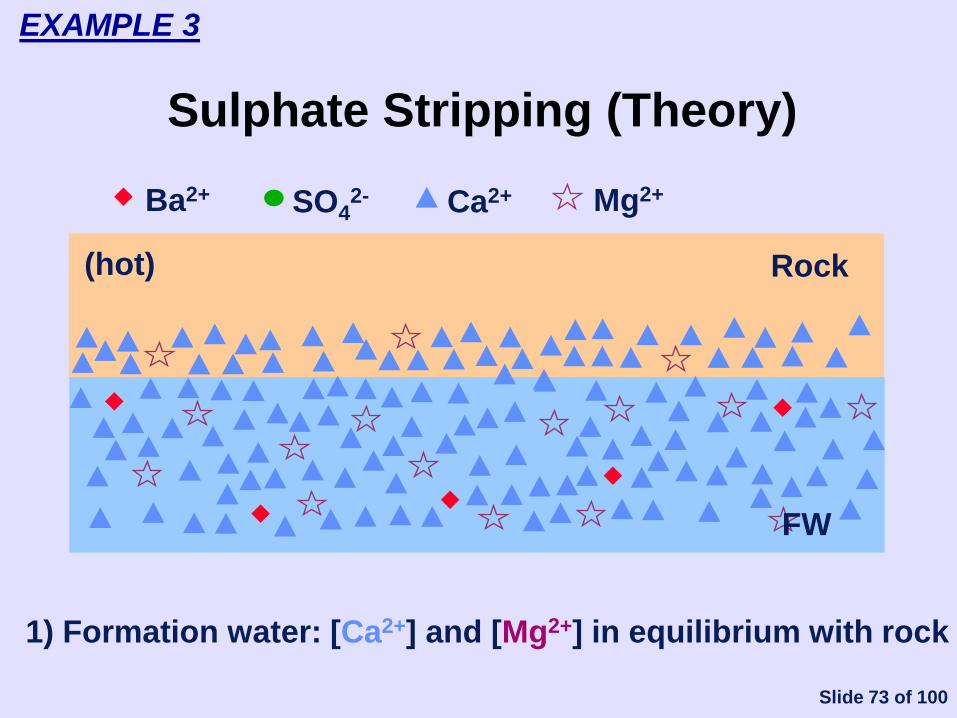
Sulphate Stripping (Theory)
Ba2+
Rock
SO42- Ca2+ Mg2+
1) Formation water: [Ca2+] and [Mg2+] in equilibrium with rock
FW
(hot)
EXAMPLE 3

Slide 74 of 100
Sulphate Stripping (Theory)
Ba2+ SO42- Ca2+ Mg2+
2) Waterflood: [Ca2+] and [Mg2+] no longer in equilibrium
Rock
CW SW
(cold) (hot)
EXAMPLE 3
Slide 75 of 100
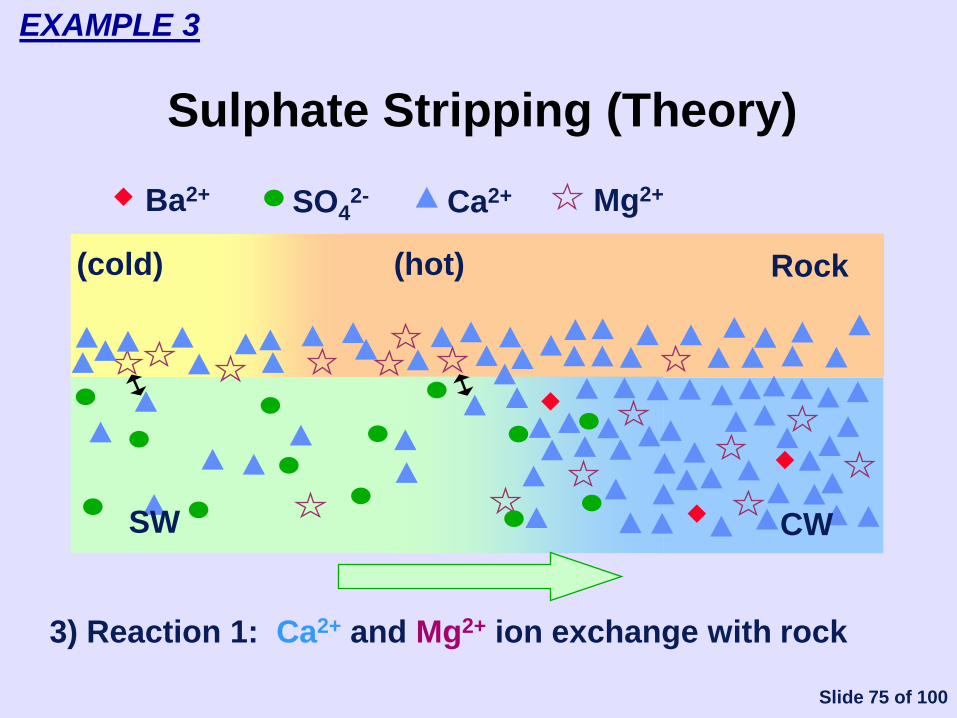
Sulphate Stripping (Theory)
Ba2+ SO42- Ca2+ Mg2+
3) Reaction 1: Ca2+ and Mg2+ ion exchange with rock
Rock
CW SW
(cold) (hot)
EXAMPLE 3

Slide 76 of 100
Sulphate Stripping (Theory)
Ba2+ SO42- Ca2+ Mg2+
4) Reaction 2: In hotter zones Ca2+ + SO42- → CaSO4
Rock
CW SW
(cold) (hot)
CaSO4
EXAMPLE 3
Slide 77 of 100
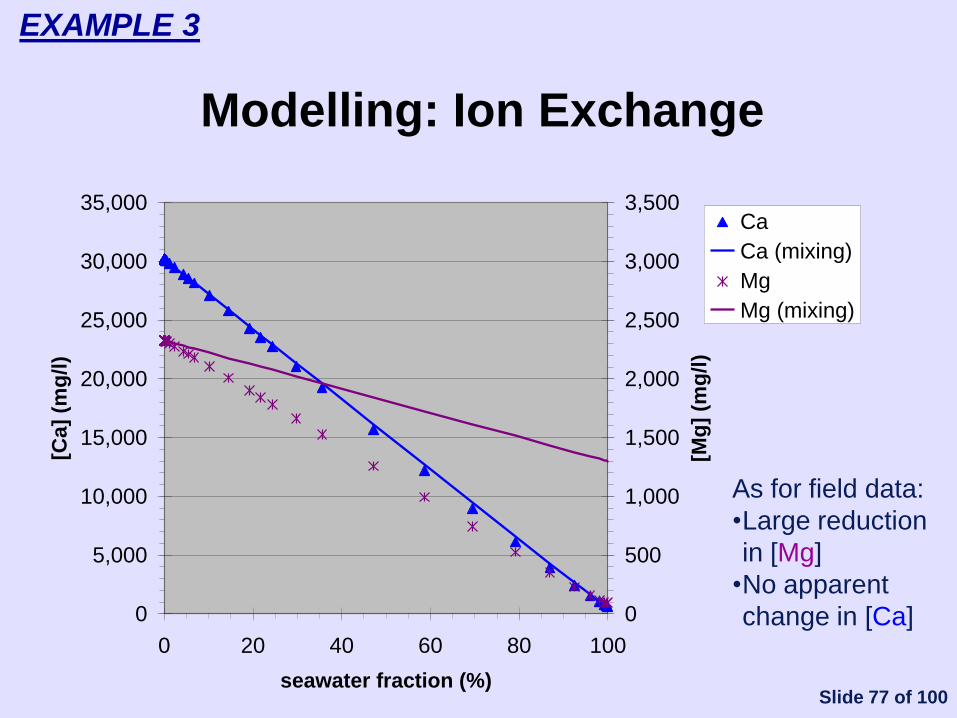
Modelling: Ion Exchange
0
5,000
10,000
15,000
20,000
25,000
30,000
35,000
0 20 40 60 80 100
seawater fraction (%)
[Ca]
(mg
/l)
0
500
1,000
1,500
2,000
2,500
3,000
3,500
[Mg
] (m
g/l
)
Ca
Ca (mixing)
Mg
Mg (mixing)
As for field data:
•Large reduction
in [Mg]
•No apparent
change in [Ca]
EXAMPLE 3
Slide 78 of 100
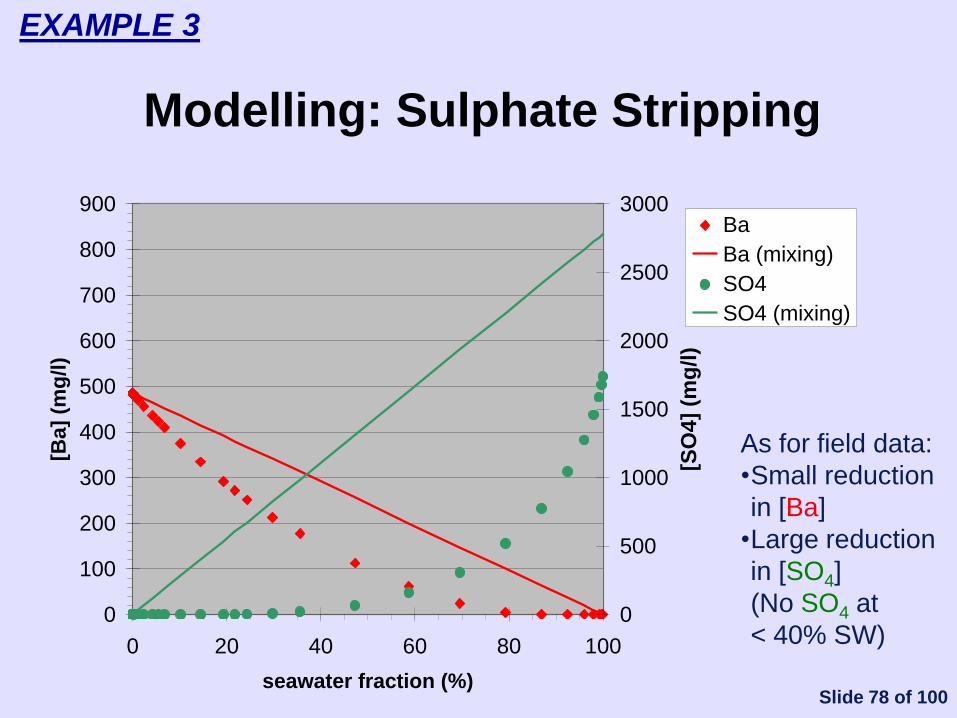
Modelling: Sulphate Stripping
0
100
200
300
400
500
600
700
800
900
0 20 40 60 80 100
seawater fraction (%)
[Ba
] (m
g/l
)
0
500
1000
1500
2000
2500
3000
[SO
4]
(mg
/l)
Ba
Ba (mixing)
SO4
SO4 (mixing)
As for field data:
•Small reduction
in [Ba]
•Large reduction
in [SO4]
(No SO4 at
< 40% SW)
EXAMPLE 3
Slide 84 of 100
Impact of Reservoir Pressures on
Placement
Question for new subsea field under
development:
Can adequate placement be achieved
without using expensive rig
operations?
EXAMPLE 4

Slide 85 of 100
Placement (Field D)
-200
-100
0
100
200
300
400
500
0 200 400 600 800
well length (m)
flo
w r
ate
(m
3/d
)
prior to squeeze
shut-in
INJ 1 bbl/m
INJ 5 bbl/m
INJ 10 bbl/m
1 year after squeeze
production
injection
(squeeze)
• Good placement along length of well during treatment (> 5 bbls/min)
• Can squeeze this well
SPE 87459 EXAMPLE 4
Slide 86 of 100
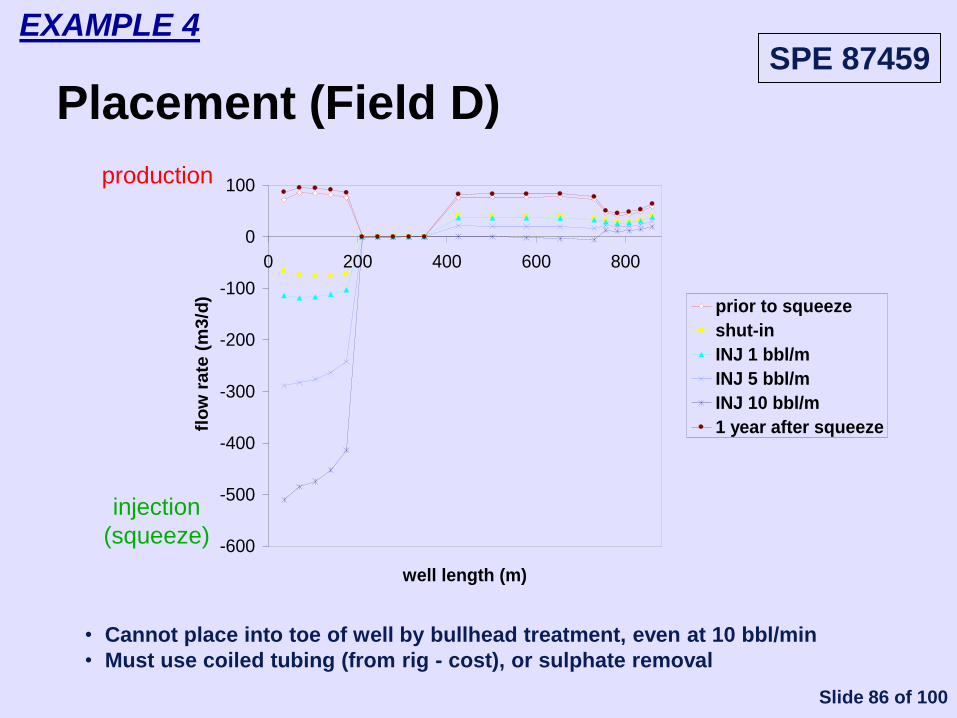
Placement (Field D)
production
injection
(squeeze)
• Cannot place into toe of well by bullhead treatment, even at 10 bbl/min
• Must use coiled tubing (from rig - cost), or sulphate removal
-600
-500
-400
-300
-200
-100
0
100
0 200 400 600 800
well length (m)
flo
w r
ate
(m
3/d
)
prior to squeeze
shut-in
INJ 1 bbl/m
INJ 5 bbl/m
INJ 10 bbl/m
1 year after squeeze
SPE 87459 EXAMPLE 4

Slide 99 of 100
3) Conclusions
Modelling tools may assist with understanding of where scale is forming and what is best scale management option… identify location and impact of mixing
evaluate feasibility of squeeze option (placement)
calculate chemical requirements
… thus providing input for economic model.
Particularly important in deepwater environments, where intervention may be difficult & expensive
But – must be aware of uncertainties….. reservoir description
numerical errors
changes to production schedule, etc.
… so monitoring essential.

Slide 100 of 100
Acknowledgements
Sponsors of Flow Assurance and Scale
Team (FAST) at Heriot-Watt University:
Baker Petrolite, BG Group, BWA Water
Additives, BP, Champion Technologies,
Chevron, Clariant, ConocoPhillips,
Halliburton, M I Production Chemicals,
Nalco, Hydro Oil & Energy, Petrobras,
REP, Rhodia, Shell, Solutia, Statoil, Total