spe-174907-ms rapid data integration and analysis for ...cchelmis/pubs/spe15.pdf · rapid...
TRANSCRIPT
SPE-174907-MS
Rapid Data Integration and Analysis for Upstream Oil and Gas Applications
Chung Ming Cheung, Palash Goyal, Greg Harris, Om Patri, Ajitesh Srivastava, Yinuo Zhang,Anand Panangadan, and Charalampos Chelmis, University of Southern California; Randall McKee, Mo Theron,and Tamas Nemeth, Chevron U.S.A. Inc.; Viktor K. Prasanna, University of Southern California
Copyright 2015, Society of Petroleum Engineers
This paper was prepared for presentation at the SPE Annual Technical Conference and Exhibition held in Houston, Texas, USA, 28–30 September 2015.
This paper was selected for presentation by an SPE program committee following review of information contained in an abstract submitted by the author(s). Contentsof the paper have not been reviewed by the Society of Petroleum Engineers and are subject to correction by the author(s). The material does not necessarily reflectany position of the Society of Petroleum Engineers, its officers, or members. Electronic reproduction, distribution, or storage of any part of this paper without the writtenconsent of the Society of Petroleum Engineers is prohibited. Permission to reproduce in print is restricted to an abstract of not more than 300 words; illustrations maynot be copied. The abstract must contain conspicuous acknowledgment of SPE copyright.
Abstract
The increasingly large number of sensors and instruments in the oil and gas industry, along with novelmeans of communication in the enterprise has led to a corresponding increase in the volume of data thatis recorded in various information repositories. The variety of information sources is also expanding: fromtraditional relational databases to time series data, social network communications, collections of unsortedtext reports, and linked data available on the Web. Enabling end-to-end optimization considering thesediverse types of information requires creating semantic links between them. Though integration of dataacross silo-ed databases has been recognized as a problem for a long time, it has proven to be difficult toaccomplish due to the complexity of the data arrangement within databases, scarcity of metadata thatdescribe the content, lack of a direct mapping between related entities across databases, and the severaltypes of data represented within a database. In addition, there are large amounts of unstructured text datasuch as text entries in databases and document repositories. These contain valuable information onprocesses from the field but there is currently no method to convert this raw data to useable information.The Center for Interactive Smart Oilfield Technologies (CiSoft) is a USC-Chevron Center of Excellencefor Research and Academic Training on Smart Oilfield Technologies. We describe the IntegratedOptimization project at CiSoft which has the goal of developing a framework for automated linking ofheterogeneous data sources and analysis of the integrated data in the context of upstream applications.
IntroductionThe increasingly large number of sensors and instruments in the oil and gas industry, along with novelmeans of communication in the enterprise has led to a corresponding increase in the volume of data thatis recorded in various information repositories. The variety of information sources is also expanding: fromtraditional relational databases to time series data, social network communications, collections of unsortedtext reports, and linked data available on the Web. Enabling end-to-end optimization considering thesediverse types of information requires creating semantic links between them. Though integration of dataacross silo-ed databases has been recognized as a problem for a long time, it has proven to be difficult toaccomplish due to the complexity of the data arrangement within databases, scarcity of metadata thatdescribe the content, lack of a direct mapping between related entities across databases, and the several

types of data represented within a database. In addition, there are large amounts of unstructured text datasuch as text entries in databases and document repositories. These contain valuable information onprocesses from the field but there is currently no method to convert this raw data to useable information.
The Center for Interactive Smart Oilfield Technologies (CiSoft) is a USC-Chevron Center of Excel-lence for Research and Academic Training on Smart Oilfield Technologies. We describe the IntegratedOptimization project at CiSoft which has the goal of developing a framework for automated linking ofheterogeneous data sources and analysis of the integrated data in the context of upstream applications. Ourhypothesis is that there is valuable insight to be gained by analyzing large diverse datasets together. In thiscontext, “large” refers to data volume (millions of instances) and “diverse” refers to the variety in datatypes (such as sensor measurements, work orders, operator text annotations). For example, informationrelated to routine oilwell operations and repairs are recorded in production and maintenance databasesrespectively. Each of these databases is typically large, has a complex schema, and is updated inindependent workflows. Linking these databases, while still retaining their independent operation, enablesoptimization across both of these databases (such as accounting for planned maintenance activities inproduction planning). The Integrated Optimization project aims to develop the data abstractions andautomation methods for data integration and exploiting the resulting information sources. The projectextensively uses pattern recognition techniques to automate data integration. Different methods are beingdeveloped to handle the diverse data types encountered in enterprise data stores. State-of-the-art machinelearning methods are used to extract only the most discriminative pieces of information from the differenttypes of data (such as abnormal modes of equipment operation). This reflects the growing importance ofdata mining and machine learning approaches in digital oilfield operations (Burda et al. 2007; Crompton2008) as they move into the age of Big Data.
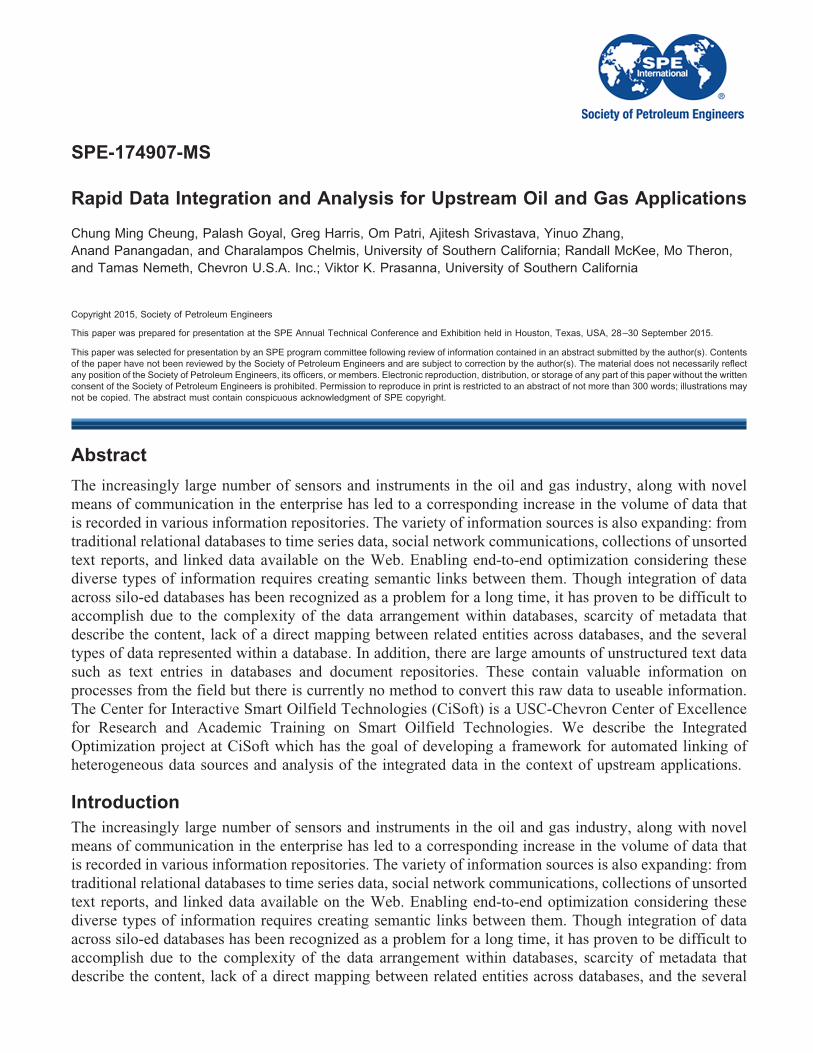
The components of the proposed data integration and analysis framework are shown in Figure 1. TheRapid integration framework automatically discovers entries in different databases that are related to eachother using lexical, semantic and structural similarities of the data points. In order to accommodatedifferent types of data sources, both structured and unstructured, specific methods are being developed toextract information from each type of data source. The current source types are relational databases,Semantic Web ontologies, social network communications, time-series data, and free-form English text.Together with the data integration component, the framework will enable rapid automatic integration andsubsequent analysis of heterogeneous information sources. These components are described in thefollowing sections (specifically, the Rapid Integration Framework for integrating relational databases andontologies, the Event modeling and management component for time-series analysis and temporal rulemining, Content extraction from text for free-form English text analysis, and the Social network analysiscomponent for modeling enterprise social network interactions). Components of the framework are beingevaluated on specific upstream data-driven applications. Descriptions of the evaluation use-cases areincluded in the corresponding component descriptions.
2 SPE-174907-MS
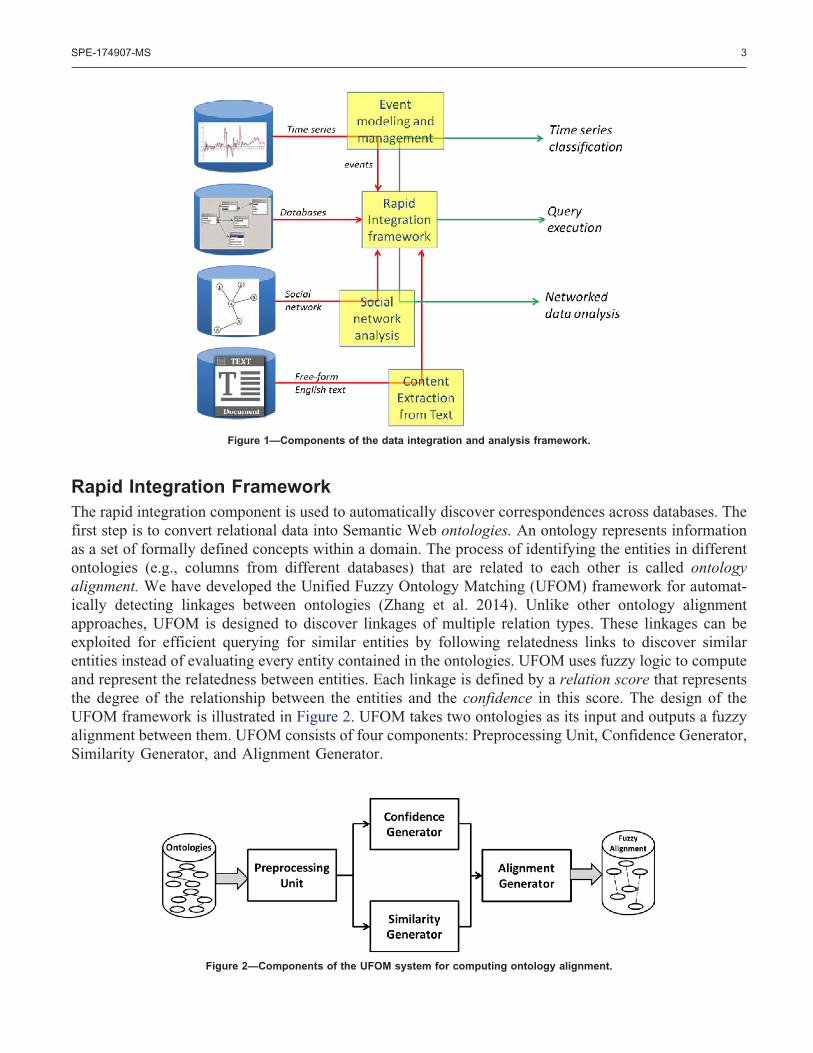
Rapid Integration FrameworkThe rapid integration component is used to automatically discover correspondences across databases. Thefirst step is to convert relational data into Semantic Web ontologies. An ontology represents informationas a set of formally defined concepts within a domain. The process of identifying the entities in differentontologies (e.g., columns from different databases) that are related to each other is called ontologyalignment. We have developed the Unified Fuzzy Ontology Matching (UFOM) framework for automat-ically detecting linkages between ontologies (Zhang et al. 2014). Unlike other ontology alignmentapproaches, UFOM is designed to discover linkages of multiple relation types. These linkages can beexploited for efficient querying for similar entities by following relatedness links to discover similarentities instead of evaluating every entity contained in the ontologies. UFOM uses fuzzy logic to computeand represent the relatedness between entities. Each linkage is defined by a relation score that representsthe degree of the relationship between the entities and the confidence in this score. The design of theUFOM framework is illustrated in Figure 2. UFOM takes two ontologies as its input and outputs a fuzzyalignment between them. UFOM consists of four components: Preprocessing Unit, Confidence Generator,Similarity Generator, and Alignment Generator.
Figure 1—Components of the data integration and analysis framework.
Figure 2—Components of the UFOM system for computing ontology alignment.
SPE-174907-MS 3

The Preprocessing Unit identifies the type of each entity in the ontology and classifies the entities basedon their types. Different computation strategies are adopted for matching the entities with the mostappropriate type. Specifically, an entity is classified as one of the following types: Class, ObjectProperty,String DatatypeProperty, Datetime DatatypeProperty, and Numerical DatatypeProperty. Confidence Gen-erator quantifies the sufficiency of the resources used to generate a potential match between two entities.It computes a confidence score for each correspondence which reflects if there is sufficient underlyingdata to generate this correspondence. For correspondence between properties, their instances are the mainresources. The more instances that are used for computing similarity, the more confident we can be in thematching process. In order to quantify the sufficiency of the properties, we utilize two metrics — Volumeand Variety.
Similarity Generator computes multiple types of similarity for every pair of entities. It generates avector of similarities between two entities. These similarities form the basis for computing different typesof relation correspondences (using their respective fuzzy membership functions). In UFOM, the vectorconsists of four values: Name-based Similarity, Mutual Information Similarity, Containment Similarity,and Structural Similarity (Figure 3).
Name-based Similarity is calculated based on both the semantic similarity and syntactic similaritybetween the names of the two entities. The name denoting an entity typically captures the most distinctivecharacteristic of the instances. Mutual Information Similarity models the mutual information that existsbetween the individuals of one entity and the domain represented by the second entity. If two propertieshave a high proportion of instances shared between them, then this is indicative of these properties beinghighly related. Containment Similarity models the average level of alignment between an instance of anentity and its most similar instance in another entity. It is designed to detect pairs of entities that share alarge number of common instances even if the instances themselves are misaligned. The fourth value inthe vector of similarities is designed to capture the structural similarity between two properties as they arerepresented within their ontologies. We represent the ontology as a graph with properties as edges andclasses as nodes. If two properties have similar domains and ranges (classes), then they are assigned highsimilarity. In turn, two classes that have similar properties should have higher similarity.
Alignment Generator calculates a single relation score by combining the vector of similarities using thefuzzy membership functions for each relation type and constructs the correspondence based on both these.The output of Alignment Generator is a set of fuzzy correspondences in the form of relation scores andcorresponding confidence scores. The confidence score is obtained from Confidence Generator. In orderto calculate the relation score, a set of membership functions are pre-defined in UFOM. Each suchmembership function corresponds to one type of relation. Once both scores are calculated, AG prunes thecorrespondences with scores less than pre-defined cutoff thresholds. Different applications will have
Figure 3—Components of the UFOM Similarity Generator.
4 SPE-174907-MS

different thresholds. For example, a recommendation system may have relatively low thresholds sincefalse positives are tolerated, while a scientific application may have high thresholds.
Query ExecutionFuzzy ontology alignment can be used to speed up query execution over the matched ontologies (Zhanget al. 2015). We consider the following problem: Given two ontologies O1 and O2, return all individualsin O2 which are “relevant” to a given individual t in O1. A naïve approach to retrieve all such individualsis to compare each property value of t with all property instances in O2. This approach is inefficient interms of search time. Since we have already discovered the matching between ontology properties, we canimprove the query performance using the fuzzy alignment. The query execution has two steps: generatinga fuzzy SPARQL query and converting to crisp SPARQL query.
The first step is to identify related properties using the fuzzy alignment. We have developed twoapproaches for querying related entities: follow only a single alignment link (direct matching), and followmultiple alignment links (indirect matching). These are illustrated in Figure 4.
For direct matching, we retrieve properties in O2 having fuzzy relations (such as equivalence andrelevance) with t’s identifier property using the fuzzy alignment derived by UFOM. For indirect matching,we first identify intermediate classes in O2. Such classes have properties having fuzzy relation with tt’sidentifier property. Based on the intermediate classes, we discover the properties which are equivalent tothe identifier of intermediate class. This equivalent relation usually can be found by checking ObjectProperties in O2. In contrast to direct matching which outputs a set of properties, indirect matching resultsin a collection of triples in the form of (p1 p2, p3), where p1 is the intermediate class’ property having fuzzyrelation with t’s identifier property, p2 is the intermediate class’ identifier property, and p3 is the targetproperty equivalent to p2. Once we have the properties discovered by direct matching and indirectmatching, we can build fuzzy SPARQL queries to retrieve the related individuals.
Before converting the fuzzy query to crisp query, we calculate a seed vector for each value pair (v0,v) where v0 is the given value and v is the value in the matched properties. The vector considers multiplesimilarity metrics including syntactic, semantic, and containment similarities. The results are stored ininstance ontology. We compute the �-cut of fuzzy terms based on the membership function in order toremove the fuzzy terms. The individuals are ranked based on their membership grade. Once the crisp
Figure 4—Top: direct matching. Bottom: indirect matching.
SPE-174907-MS 5

SPARQL query is generated, it can be registered on the triple store. As a result, all related individuals arereturned. With the help of the fuzzy alignment, the computation burden can be reduced.
Quantitative evaluationWe performed a set of experiments to evaluate query execution components. For datasets, we usedpublicly available ontologies provided by Ontology Alignment Evaluation Initiative (OAEI) campaigns(Euzenat et al. 2011). The first dataset we use is Instance Matching (IM) ontology from OAEI 2013. Ithas 5 ontologies and 1744 instances. We initialize 10 individuals from one of the ontologies and retrieverelated individuals from other ontologies. The membership grade threshold is set as 0.75. Figure 5(a)shows the performance of our query execution component on the IM ontology. Each data point isgenerated by averaging the results of 10 individuals.
As the relation score threshold increases, both precision and running time for query execution decrease.It is because the number of correspondences decreases when we raise the relation score threshold. As aresult, we have fewer correspondences to consider when we generate crisp queries and therefore thecomputational time is reduced. The reason precision also decreases is that we lose some true correspon-dences when we increase the relation score threshold. Those correspondences can actually help us to findmore related individuals. However, as we can see if we increase the threshold from 0.5 to 0. 8, precisiononly decreases by 9% while execution time is reduced by 81%. This indicates that the elimination ofcorrespondences caused by increasing threshold do not affect retrieving correct related individualssignificantly. This is because the remaining correspondences are still sufficient to find connectionsbetween classes. In terms of querying for similar individuals, the correspondences between same pair ofclasses may have functional overlap.
For the evaluation of querying for related individuals, we considered two ontologies from anenterprise-scale information repository. Due to privacy concerns, we do not reveal the real names of theproperties and ontologies. Specifically, we considered two classes, C1 and C2, in O1 and two classes, C3and C4, in O2. We selected 10 representative individuals from C1 or C2 and retrieve their relevantinstances from C3 or C4 using the fuzzy alignment. Both precision and recall are 1.0 when we verified
Figure 5—(a) Precision and execution time on applying UFOM query execution to the Instance Matching Ontology. (b) Query ExecutionTime (UFOM vs Baseline)
6 SPE-174907-MS

the results with the ground truth obtained by manually examining the ontologies for each of theautomatically retrieved entities.
Computational complexity Indirect matching is capable of discovering entities that are not directlyrelated to the given query entity but it is computationally more intensive than direct matching. We havederived the computational complexity of the two approaches. We assume that the cost for comparing a pairof entities is constant. The computation time of the direct matching process is proportional to the numberof relevant field pairs, the number of records in the source class that has the specified value, and thenumber of records in the target class. The computational cost of indirect matching is proportional to thenumber of records in each indirect class, the size of the set of relevant field pairs between the source classand each indirect class, and the size of the set of primary keys of relevant records identified in a targetclass. Figure 5(b) shows the average execution time for querying the ontologies from the enterprise-scaleinformation repository. Compared with a baseline approach of traversing the values of all properties in O2,the proposed approach reduces the execution by approximately 99%.
Event Modeling and ManagementTime Series Classification using ShapeletsA massive portion of oilfield data today is in the form of sensor streams, which necessitates the use ofrapid real-time data analysis techniques (Brule 2013; Abou-Sayed 2012). We have adapted a time-seriesmining approach that was recently developed in the computer science community, known as time-seriesshapelets (Le and Keogh 2009), for application to sensor measurements typically collected in the oil andgas industry, in particular to component failure detection and prediction. The streaming time series natureof such data is especially suited to this approach. The shapelets method identifies those time segments(“shapelets”) within the available sensor data which are most discriminative for differentiating betweentwo classes, for instance those arising from failed pump components in contrast to those that are workingnormally. Using discovered shapelets from historical data, predictions about future failures or anomaliescan be made such that proactive steps can be taken to mitigate their effects. As an example, a shapelet thatwas discovered from intake pressure measurements from an electrical submersible pump is overlaid overthe full time series in Figure 6 – the short segment shown in red was found to be the most discriminativefrom this time series and others in the labeled data record for distinguishing failed pumps from normalones. This shapelet, along with other shapelets, can be used for detecting failures by comparing them withreal-time sensor data.
The shapelets approach is particularly effective for oil and gas enterprise data because it does not needaccess to the entire historical record of sensor data while making decisions – only the shapelet timesegments, identified in an offline step from the historical record, are needed for real-time analysis. This
Figure 6—A discriminative segment (shown in red), or shapelet, from a time series as computed by the shapelet mining algorithm. Thex-axis shows time (in days) while the y-axis represents normalized values of the intake pressure for a specified ESP.
SPE-174907-MS 7

greatly reduces the amount of data needed to be stored for further data mining. Moreover, this approachdoes not make any assumptions about the nature of the data, making it practical for real world scenarios.The shapelets found are visually interpretable, making deeper root cause analysis possible. Such timeseries mining methods are directly related to events in the oilfield, and as described in (Crompton 2008),there are several value propositions for efficient event processing (Patri et al. 2012, 2014b).
Gas Compressor Valve Failure Use Case We coupled feature selection methods with shapelets-basedtime series classification to address the problem of failure detection of gas compressors (Patri et al. 2015).A regular failure in rotating equipment such as compressors is the breakdown of valves. This issue is ofgreat value to the oil and gas industry because a large portion of production is dependent on rotatingequipment. Our goal is to rank sensor dimensions and find signatures in compressor sensor data, whichmay aid in the prediction of valve failure, and as a result create a path to prioritize and monitormaintenance schedules for compressors, which are often on remote platforms. The data used in ourevaluation is from sensors that measure various physical properties of compressors, ranging fromcompressor vibrations and motor winding temperatures to pressure and temperature for both suction anddischarge at the various compression stages.
Our dataset consists of sensor data from four-cylinder gas compressors in an oilfield. Each compressorhas approximately fifty sensors. The sensor functions range from measuring compressor vibrations andmotor winding temperatures to sensors measuring the pressure and temperature for both suction anddischarge at the various compression stages. Data from some of the sensors is shown in Figure 7. Weapplied feature selection algorithms to automatically rank sensor streams in order of usefulness for thespecific prediction tasks.
Figure 7—Data from some of the sensors in the gas compressor – discharge temperature of a cylinder (top left), motor windingtemperature (top right), motor vibration (bottom left) and cooler vibration (bottom right).
8 SPE-174907-MS

While these sensor measurements are easily accessible, information on past occurrences of abnormaloperating conditions is not recorded in a format suitable for use as labels in a machine learning algorithm.We used dates entered as part of maintenance records as labels for the sensor streams in order to applysupervised machine learning algorithms. These were obtained from a subset of work orders on compressormaintenance that focused on issues related to valves. The work orders listed dates of reported failure andcompletion along with comments for each repair. We used information from the work orders to build ourlabels, thus framing our failure prediction problem as a time series classification problem.
Approach Data labeling: To convert the sensor data streams into our required time series training andtesting datasets, we partitioned the full sensor stream around the occurrences of failures. A failure reportdate is available as part of the maintenance records for the gas compressor. However, this report date doesnot necessarily correspond to the time when the compressor actually failed but rather when a techniciancreated a work order to address a deficiency or respond to a prior open work order. In this work, we labelsegments as failures if they appear a short while before this failure report date. We expect the actual failureto have occurred before a human operator notices it. Failure windows are set just before these calculatedfailure times. The size of this window can be set as a parameter in our experiments, but we focused onone-week windows. Since the data in this window is just prior to the failure occurrence, it is likely to beindicative of failure signals before the failure. For each labeled failure occurrence, we obtain the data inthis failure window, as shown in Figure 8, and extract shapelets from this window. Each such datasegment will have a failure label associated with it.
Next, we select normal instances only from those periods that are not close to any failures. Thus, wepick data segments of the same window size from the rest of the data (normal operation) ensuring thatthere is no intersection between the clean data segments and the failure periods or the pre-failure periodsi. e. the failure window. These data segments from normal operation are assigned the “normal” label forclassification.
Our approach is presented in the following training and testing algorithms. We have also applied asimilar approach for predicting electric submersible pump (ESP) failures in the context of single sensor(univariate) data (Patri et al. 2014).
Training algorithm:Input: A multivariate time series, time instances known to represent failuresOutput: Set of selected sensors; shapelets and decision trees for every selected sensor1. Pre-processing: Extract equal length (multivariate) segments and assign failure/normal labels to each
from the time series based on the distribution of failure instances.2. Feature selection: Compute a variety of features for each sensor stream in each segment. Specifi-
cally, we use the maximum cross-correlation with an exponential decay curve with a pre-definedmagnitude and exponent. Correlate the maximum cross-correlation feature for each sensor stream with the
Figure 8—Pre-processing sensor data – a failure window is set just prior to the occurrence of each failure and we use these blocks ofdata to extract signals indicative of failure
SPE-174907-MS 9

failure/normal labels using a linear classifier. Retain only sensor streams which have � 50% classificationaccuracy.
3. Apply univariate shapelet mining algorithm (specifically, Fast Shapelets (Rakthanmanon and Keogh2013)) to only the sensor streams selected in Step 2. This step produces a set of shapelets and a decisiontree for each selected sensor stream (much fewer than the total number of sensors).
Testing algorithm:Input: A single multivariate time seriesOutput: Class A (Normal) or Class B (Failure)1. Discard variables from the multivariate time series that correspond to sensors not in the set of
selected sensors2. For every selected sensor stream, compute the Euclidean distance to shapelets in the corresponding
decision tree (from Step 3 of the training algorithm).3. Use the distances to compute a failure/normal label using the decision tree for each selected sensor.4. Apply majority voting to select a single failure/normal label from the set of labels from selected
sensors (from Step 3).
Data mining across heterogeneous data sourcesThe data integration framework facilitates data mining across heterogeneous data sources and mining theintegrated historical data can enable the discovery of temporal patterns. In our work, we identify a classof patterns called classification rules, which take the form: “IF Conditions, THEN Class.” The conditionsare a conjunction of attributes or features found in the data which identify the target class with highprecision. Rules are intended to be concise and interpretable. This comprehensibility relative to “black-box” classifiers facilitates easier adoption by domain experts.
Rule-Learning Features The data integration framework links together both relevant information andnon-relevant information to any specific application. Therefore, steps must be taken to restrict the numberof features in the search space to reduce the chances of over-fitting the data and finding spurious rules.Preprocessing the data into a smaller set of semantically meaningful features also keeps the rulesinterpretable.
An example of such preprocessing is the clustering of pump cards, which is a series of load-positionpairs recorded throughout each pump cycle. Rather than data mining on individual load-position points,we group complete pump cards together into similar clusters. We find that hierarchical agglomerativebottom-up clustering using the Euclidean distance metric works well for grouping similar pump cards.Each cluster is one feature in the search for classification rules. Figure 9 shows some example pump cardclusters.
10 SPE-174907-MS

Confidence in inferred production estimates use case Enhanced Oil Recovery is a technique used toimprove production in fields with highly viscous oil. In this technique, operators inject steam into andaround a well that has seen a reduction in flow. The steam heats the oil under the surface, reducing itsviscosity. This often leads to an increase in production. The primary indication that a well would benefitfrom steam stimulation is a decline in production. Inferred production calculations are used as estimatesof individual well production in lieu of expensive well gauging. Inferred production is calculated basedon an analysis of pump card measurements, in addition to other data. Noise in the inferred productionestimates can also lead to sub-optimal wells being flagged for stimulation. For low-producing wells, evenwell tests measuring actual production can have high variation. This leads to many spurious alerts whichobscure the alerts for high-producing wells ready for stimulation.
Rule learning can help with Enhanced Oil Recovery by reducing false alarms due to well failures anddue to low-confidence inferred production data. For this use-case, the objective for rule learning is to findthe best candidate wells based on characteristics of productive wells in the historical record. A goodcandidate is a well that will benefit most from steam injection. Features can include pump card clustersand temporal information about events, such as the amount of time elapsed since the last steam injection.
Content Extraction from TextThe amount of unstructured text data collected in real-world enterprise applications is increasing with theeasy availability of portable computers enabling operators to enter notes in the field. For instance, fieldengineers record their observations into a Computerized maintenance management system (CMMS) usinga mix of natural language and domain-specific terms. Such text instances can number in the hundreds ofthousands in an enterprise. In this context, “unstructured” refers to natural language that does not strictlyfollow the rules of the language. Content extraction from such unstructured text collections is the processof identifying only the key terms in an entry that are relevant to a specific application, i.e., the terms thatshare a particular relation with each other. Content extraction thus transforms unstructured text to astructured representation. For example, in a maintenance application, the content extraction task could be
Figure 9—Example pump card clusters. To keep the clusters interpretable, we label each cluster with an image made up of acomposition of all member images. This “average” pump card image conveys information to the domain expert.
SPE-174907-MS 11

to identify terms describing repair actions and parts that were repaired. This transformation helps usunderstand the data and make use of it in various tasks such as data integration and summarization.
The problem of content extraction has been widely studied in Natural Language Processing but mostof these approaches make use of the structure of the text by assuming that it is composed of grammaticallycorrect sentences. Corporate datasets often do not satisfy this criterion. For this reason we applied abootstrapping based approach to solve the problem (Shang et al. 2015). The approach is illustrated inFigure 10. The method uses an iterative approach where event patterns are used to extract matchingsentences and these matches are used to refine the patterns. This approach is adapted from the DIPREsystem (Brin 1999) where patterns are used to extract author-book pairs. While DIPRE relied on regularexpressions of characters for patterns, we use approximate matching based on the semantic distancebetween words. We rank patterns in order to ensure that only high precision patterns are retained. We alsotokenize the input sentences to extract local features before searching for patterns. The steps are listed inAlgorithm 1 (Figure 10). The information extraction part is preceded by set of data pre-processing tasksin which we tokenize the sentences using bigrams, remove stop words, and perform stemming.
We evaluated our approach on the text comments in the database of an enterprise level corporation. Thedatabase contained approximately 400,000 lines and represented field notes by engineers. Events in thisapplication correspond to actions taken by engineers and the event parameter represents the objectinvolved in an action. The average length of a line is 13 words.
The lines are a mixture of English words, numbers, and alphanumeric terms. Since variations innumbers and alphanumeric terms between otherwise similar sentences do not typically represent differentevents, we replaced instances of such terms with a generic tag. Examples of lines in this dataset are shownin Figure 11.
Figure 10—Illustration of approach and algorithm for event extraction from unstructured data.
Figure 11—Examples from enterprise dataset. ID and DIGIT represent alphanumeric characters and numbers respectively that arereplaced with type tags before event extraction. PART represents words not shown for privacy concerns.
12 SPE-174907-MS

We selected the following seed Event-Event parameter word pairs for extracting new events from theenterprise dataset: “replace belts”, “repair part”, “need belts”, and “repair break”. With these seed pairsand by using approximate matching using WordNet similarity, the patterns found after the first iterationare shown in Figure 12. The false positives are marked in red. The method achieves a precision of 70%.
Learning word relatedness from unstructured textGiven a text dataset, several applications require words in the data to be associated with terms of knownsignificance, i.e., there is a need to learn word similarity. Typically, the Distributional Hypothesis, whichstates that words that occur in the same contexts tend to have similar meanings (Harris 1985), has beenused as the basis for association methods in information retrieval (Stiles 1961). However, when the dataset contains only short free-form sentences as in the case of field notes in industrial applications, learningsimilarity based on co-occurrence within the context is not sufficient. Therefore, we need to consider theco-occurrence of a pair of words “across” similar contexts.
We have developed the notion of cross-context similarity (CCS) to relate similarity between sentences(more generally, denoted “contexts”) to similarity between the individual words that comprise the context.Our approach makes use of a simple bag-of-words model relating terms to their contexts and the similarityis calculated using only the information provided in a labeled sentence corpus. In the case, where thesentences (contexts) are not labeled and similarity between them is not known, we can use establishedsentence similarity measures (e.g., cosine similarity) to compute context similarity. Our hypothesis is thatthe more often two terms occur in similar contexts, the greater the cross-context similarity between them.The idea is especially advantageous in short texts, where the contexts are short sentences. In this case theremay not be enough information in the same context to find similar terms. For instance consider thesentences:
1. “Two-Face has appeared in multiple Batman media forms.”2. “The character of Joker has undergone many revisions.”
Co-occurrence alone does not provide any relationship between (Joker, Two-Face). However, if it isknown that the sentences are related (both describe Batman villains), one can infer that there is somesimilarity between (Joker, Two-Face).
The CCS model is based on computing cross-occurrence which is defined as a measure of the weightedco-occurrence between terms in similar contexts. The weights in the cross occurrence are calculated basedon context similarity over all pairs of contexts and the membership score of words in the correspondingcontexts. This membership score may be a binary value representing presence/absence, frequency, orTF-IDF score. Cross-occurrence is appropriately normalized to get CCS so that it is bounded between 0and 1.
Figure 12—Approximate pattern matching: Subset of event and event parameter pairs after first iteration. Pairs in red are consideredincorrect in our evaluation.
SPE-174907-MS 13

We use CCS to automatically obtain the relatedness between cataloged (English) and uncatalogued(non-English codes such as part numbers) words from text data in an enterprise dataset. A sample ofresults obtained using CCS is shown in Figure 13. In this graph, low relatedness links were removed,preserving only meaningful relationships. The cataloged words such as flats, tires, and vehicle can betogether considered to form a description of the codes.
Figure 14 shows another snapshot of the relatedness measure, where all the codes related to wellsgather around the term wells. Thus, CCS not only finds the relatedness but also helps in interpreting themeaning of unknown terms.
Figure 13—Relatedness between cataloged (English) and uncatalogued (non-English codes such as part numbers) words using CCS.
14 SPE-174907-MS

Social Network AnalysisThe wealth of information available in the modern enterprise is not limited to formal interactions and siloscontaining structured data. As social media have become phenomenally popular, enterprises have adoptedlight-weight tools such as on-line forums and microblogging services for internal communication.Employees have been using social network sites and microblogging services to stay in touch with closecolleagues or to reach out to employees they do not know, to connect on a personal level or to establishstrong professional relationships (Wu et al. 2010). Analysis of enterprise social interactions analysis canlead to insights, both at the atomic (micro) and collective (macro) level. Micro analysis is intended toprovide better tools for communication, search and productivity, whereas macro analysis is be used forstrategic decision making and informed planning. Examples of micro analysis include recommendationservices that can connect employees to “interesting” people, suggest “interesting” discussions foremployees to contribute, or projects to get involved in. Macro analysis can enable enterprises to utilize theresults stemming out of informal interactions analysis, to better understand how their employees worktogether to complete tasks or produce innovative ideas, reveal trends, identify experts and influentialindividuals, so as to evaluate and adjust their management strategy, team building and resource allocationpolicies (Chelmis et al. 2013).
In prior work, we have designed and built the Semantic Social Network Analysis for the Enterprise(rESONAtE) model (Chelmis et al. 2013). rESONAtE is a formal model that abstracts the semantics ofsocial network communication into an integrated, context-aware, time-sensitive, multi-dimensional space,with the goal of enabling the correlation across different domains (Chelmis et al. 2013). The social graphrepresentation, shown in Figure 15, represents both social links between users and maintains integratedinformation regarding users dynamically changing interests and activities, across collaboration tools usedin the work environments. The Social Layer captures users’ contextual and temporal interactions. Nodesrepresent users and arcs represent explicit relationships (links) between them. An edge between users isdefined by the context under which it was created and has an associated timestamp. The Content Layercaptures published content from all available sources, including but not limited to resources shared by
Figure 14—Relatedness between known word (well) and non-English codes (part numbers) as computed using CCS.
SPE-174907-MS 15

users (e.g. photos or videos), bookmarked and/or tagged resources (e.g. URLs), users’ generated content(e.g. status updates in Facebook), e-mails, chat messages, and blog posts. The Semantic Layer containsmeta-information about content, and can be broken down into several constituting layers, each containingdifferent metadata about the content.
Organizational Hierarchy vs. Social Network InteractionsOrganizational hierarchy is relatively static whereas communication may reflect “shortcuts,” i.e. collab-oration that spans hierarchical levels when seeking for help, or offering guidance. Studying communi-cation patterns may reveal hidden organizational dynamics such as employees belonging to the same teamaccording to the organizational hierarchy, but rarely actually interact due to having diverse responsibil-ities. Social network analysis can enable better understanding of how information propagation worksbetween corporate borders. As a specific use-case of such analysis, we have analytically examined theimpact of organizational hierarchy in adopting new technologies in the enterprise (Chelmis et al. 2014).
For our study, we acquired the organizational hierarchy of a Fortune 500 multinational company. Inaddition, we gathered adoption logs of the internal microblogging service, which resembles Twitter,during the first two years of adoption of the service in the enterprise. This dataset allows us to empiricallycharacterize individual dynamics and influence and examine the spread of adoption through the hierarchy.To characterize the adoption mechanism of the internal microblogging service, we developed twoagent-based computational models with the least possible number of parameters. The model emphasizesmodeling the cumulative number of adoptions over time, rather than trying to predict which specific nodein the network will infect which other nodes. The model represents the influence that each node has onthe spread of influence (microscopic modeling) and uses this to provide an analytical framework by which
Figure 15—Layers of the rESONAtE model for representing social network communications (Chelmis et al. 2013).
16 SPE-174907-MS

changes in the adoption rate over time can be predicted (macroscopic dynamics). This study suggested thatmiddle-level managers are most successful in influencing employees into adopting the new microbloggingservice. The analysis was further extended to model a wide variety of social network influence (Srivastava2014).
ConclusionsThe Integrated Optimization project is developing a suite of technologies to enable rapid integration andanalysis of large heterogeneous data sources in the oil and gas industry. The Rapid Integration Frameworkprovides a semantic layer for integrating relational databases and ontologies without affecting theunderlying data recording workflows. The Event Modeling and Management component developsmachine learning-based methods for classifying sensor measurements and has applications in predictingequipment (electric submersible pumps and compressors) failures and for optimizing enhanced oilrecovery operations. Methods for content extraction from text enable automatic identification of key termsin large quantities of free-form English text. The models for social network analysis can provide insightsto oil and gas enterprises seeking to realize the dynamics of adoption of new technologies in theirorganization and could assist in designing better strategies for rapid and efficient technology adoption andinformation dissemination at the workplace. These methods are currently evaluated in specific upstreamapplications.
AcknowledgmentThis work is supported by Chevron U.S.A. Inc. under the joint project, Center for Interactive SmartOilfield Technologies (CiSoft), at the University of Southern California.
ReferencesAbou-Sayed, A. 2012. Data mining applications in the oil and gas industry. Journal of Petroleum
Technology, 64:88–95.Brin, S. 1999. Extracting patterns and relations from the world wide web. In The World Wide Web and
Databases, 172–183, Springer.Brule, M. R. 2013. Big Data in Exploration and Production: Real-Time Adaptive Analytics and
DataFlow Architecture. SPE Digital Energy Conference and Exhibition, 5-7 March, The Woodlands,Texas, USA. SPE-163721-MS.
Burda, B., Crompton, J., Sardoff, H. M. et al. 2007. Information Architecture Strategy for the DigitalOil Field. SPE Digital Energy Conference and Exhibition, 11-12 April, Houston, Texas, U.S.A. SPE-106687-MS.
Chelmis, C., Srivastava, A., and Prasanna, V. K. 2014. Computational Models of TechnologyAdoption at the Workplace. Social Network Analysis and Mining, 4(1): 1–18.
Chelmis, C., Wu, H., Sorathia, V. et al. 2013. Semantic social network analysis for the enterprise.Computing and Informatics – Special Issue on Computational Intelligence for Business Collaboration.
Crompton, J. 2008. Putting the FOCUS on Data. Keynote Address at the 2008 W3C Workshop onSemantic Web in Oil & Gas Industry, Houston, Texas.
Euzenat, J., Meilicke, C., Stuckenschmidt, H. et al. 2011. Ontology Alignment Evaluation Initiative:Six Years of Experience. Journal on Data Semantics XV, 6720:158–192.
Harris, Z. S. 1985. Distributional structure. In The Philosophy of Linguistics, ed. J. J. Katz, 26–47.Oxford University Press.
Patri, O. P., Sorathia, V. and Prasanna, V. K. 2012. Event-driven information integration for the digitaloilfield. SPE Annual Technical Conference and Exhibition. 8-10 October, San Antonio, Texas, USA.SPE-159835-MS.
SPE-174907-MS 17

Patri, O., Panangadan, A., Chelmis, C. et al. 2014. Predicting Failures from Oilfield Sensor Data usingTime Series Shapelets. SPE Annual Technical Conference and Exhibition, 27-29 October, Amsterdam,The Netherlands. SPE-170680-MS.
Patri, O., Sorathia, V., Panangadan, A. et al. 2014. The Process-oriented Event Model (PoEM) – AConceptual Model for Industrial Events. ACM International Conference on Distributed Event-BasedSystems (DEBS), Mumbai, India, 26-29 May.
Patri, O., Reyna, N., Panangadan, A. et al. 2015. Predicting Compressor Valve Failures fromMultiSensor Data, SPE Western Regional Meeting, 27-30 April, Garden Grove, California, USA.SPE-174044-MS.
Rakthanmanon, T. and Keogh, E. 2013. Fast shapelets: A scalable algorithm for discovering timeseries shapelets. Proc. Thirteenth SIAM conference on data mining (SDM), 2-4 May, Austin, Texas, USA.
Shang, C., Panangadan, A. and Prasanna, V. K. 2015. Event Extraction from Unstructured Text Data,26th International Conference on Database and Expert Systems Applications (DEXA), Valencia, Spain,1-4 September.
Srivastava, A., Chelmis, C. and Prasanna, V. K. 2014. Influence in Social Networks: A UnifiedModel? IEEE/ACM International Conference on Social Networks Analysis and Mining (ASONAM),Beijing, China, 17-20 August.
Stiles, H. E. 1961. The association factor in information retrieval. J. ACM, 8(2):271–279.Wu, A., DiMicco, J. M. and D. R. Millen. 2010. Detecting professional versus personal closeness
using an enterprise social network site. Proc. 28th international conference on Human factors incomputing systems (CHI ‘10), 1955-1964, New York, NY, USA.
Ye, L. and Keogh, E. 2009. Time series shapelets: a new primitive for data mining. Proc., 15th ACMSIGKDD international conference on Knowledge discovery and data mining, 947–956.
Zhang, Y., Panangadan, A. and Prasanna, V. K. UFOM: Unified Fuzzy Ontology Matching, IEEEInternational Conference on Information Reuse and Integration (IRI), San Francisco, USA, 13-15 August.
Zhang, Y., Panangadan, A. and Prasanna, V. K. 2015. UFOMQ: An Algorithm for Querying forSimilar Individuals in Heterogeneous Ontologies,” 17th International Conference on Big Data Analyticsand Knowledge Discovery (DaWaK), Valencia, Spain, 1-4 September.
18 SPE-174907-MS