spe 145434 fully automated fluid level measurement tool · the fully automated fluid level...
TRANSCRIPT

SPE 145434
Fully automated Fluid Level Measurement Tool G. Sam, SPE, RAG Austria, M. Kaestenbauer, RAG Austria, Chr. Burgstaller, SPE, RAG Austria, E. Chevelcha, SPE, Mining University Leoben
Copyright 2011, Society of Petroleum Engineers This paper was prepared for presentation at the SPE Asia Pacific Oil and Gas Conference and Exhibition held in Jakarta, Indonesia, 20–22 September 2011. This paper was selected for presentation by an SPE program committee following review of information contained in an abstract submitted by the author(s). Contents of the paper have not been reviewed by the Society of Petroleum Engineers and are subject to correction by the author(s). The material does not necessarily reflect any position of the Society of Petroleum Engineers, its officers, or members. Electronic reproduction, distribution, or storage of any part of this paper without the written consent of the Society of Petroleum Engineers is prohibited. Permission to reproduce in print is restricted to an abstract of not more than 300 words; illustrations may not be copied. The abstract must contain conspicuous acknowledgment of SPE copyright.
Abstract The fully automated fluid level measurement tool was developed recently. The paper describes the technical features of the tool and shows via case study the results of the field tests on various Electrical Submersible Pumps - ESPs and sucker rod pumps – SRP, running with and without Variable Speed Drive - VSD.
The unique feature of this system is its fully automated and purely electronic functioning. The measuring device is enclosed, mounted on the casing valve, has a pressure rating of 350 bar (5000psi) and works with zero emissions on the environment (no outlet of casing gas).
Compared with a conventional downhole pressure sensor, mounted on an ESP, the system is insensitive to high well fluid temperatures and simple to maintain due to its easy access on surface location. It additionally has a sampling rate of down to one measurement per minute. The measured fluid level data can be transmitted via SCADA system.
The measurement tool enables to run a pump in a more safe way. It can be used to avoid pump off conditions and the resulting equipment damage. It can also be used to control a VSD to keep the fluid level in a well at a specific depth to avoid bottomhole flow conditions below the bubble point pressure. Due to the availability of online fluid level data, all kind of pumps (e.g. ESP, Sucker Rod, PCP, Jet Pump) can be operated safely at more aggressive production rates in order to mobilize more oil.
Furthermore the vision and corresponding thoughts of acoustic well diagnosis, also a feature of the tool which is currently under investigation, are presented.
Introduction Whereas in free flowing wells it is relatively easy to get downhole pressure measurements, there are significant difficulties in wells which are on artificial lift. Compared to gas wells, in which memory gauges can be placed via slickline or wirelinetechnology downhole through the tubing, this is not possible in sucker rod pumped oil wells because of the moving rods within the tubing.
However, to measure bottomhole pressure also at artificially lifted wells is of special interest for both reservoir and prodution engineers. Conventionally the reservoir pressure and the well flowing pressure are calculated from the fluid level, which in turn is measured indirectly via acoustic method. An acoustic event is produced at the opened casing valve. Depending on the height of the available casing gas pressure, this event can be produced differently. If there are several bars of casing gas pressure available, the casing can be vented shortly to the atmosphere and closed immediately thereafter. So gas comes to flow at first. This flow is suddenly stopped, via closing a valve as shown in Fig. 1, which produces noise. If there is not enough casing gas pressure available, an external pressure source, like a nitrogen gas bottle is connected to the casing valve. A short flow of pressured nitrogen is established into the casing and stopped suddenly, which produces noise once again.
The acoustic wave propagates down the annulus and is reflected at every obstacle like each tubing connection on the one hand and the fluid level itsef on the other hand. These reflections are measured via microphone on the casing valve as shown in Fig. 2. Basicly each reflection caused by a tubing connection is counted and the big reflection caused by the fluid level is also given. Due to the known average tubing length and the number of couplings above the fluid level, the depth of fluid level can be calculated. This measurement method is usually nonautomated, personel and time intensive and the amount of available data is limited to a few measurements per day. Furthermore the accouracy is naturally limited with the length of one tubing pipe.

2 SPE 145434
Fully Automated Pure Electronically Functioning Fluid Level Measurement Tool Du to the recently done new invention and development, it is now possible to replace the conventional acoustic pressure measurement through a pure electronic functioning measurement tool. The tool generates different types of signals which are introduced into the annulus. In a first step, four prototypes were constructed to find the best type of signal and to get the best measurement results.
The final tool consists of two main parts, the measurement device as shown in Fig.3 and the evaluation unit as shown in Fig.4, which are connected to each other by cable. The measurement device is mounted on the opened casing valve and couples the different types of generated signals into the casing annulus. Its second function is the recording of the backtransmitted signals from the well itself. These signals are transmitted via cable to the evaluation unit.
This unit cares for calculating the fluid level and to store the measured data. Furthermore it feeds the data into the Supervisory Control and Data Acquisition System - SCADA via standardized interface, if required. Compared to the conventional system the fluid level is measured directly. The reflections on the couplings are not taken into consideration anymore. The fluid level is available via the standardized 4-20mA current interface. This signal can be transmitted into a SCADA system, where it can be visualized, stored or further processed. The sampling rate is free to choose wheras the shortest available rate is about one measurement per minute. The relative accuracy is +/- 3 m. The measurement device has a small and compact structural shape and shows a rating pressure of 350 bar (about 5000 psi). It is furthermore completely closed and shows zero emissions, so no casing gas is vented to the surrounding environment anymore. The measurement device is commissioned to operate permanently within explosion hazardous areas. The specification plate is shown in Fig. 5. The measurement device has the certification CE and Ex II 2G Ex d IIB T4.
Case 1 - ESP lifted Well KTG-W-002 The well KTG-W-002 operated by RAG Austria, is lifted via electrical submersible pump which is connected to a VSD. With this combination it is possible to run the pump on different speed and therfore different production rates. The well is a high watercut oil well with a low gas oil ratio of about 15.
The new measurement tool delivers reliable measurements. The fluid level, casing- and tubing pressures are transmitted per SCADA system. The pump can be remote controlled based on the important and now also continuously available fluid level data. The fluid level is indicated inverse in Fig. 6. It shows the static fluid level at start up of the pump and the continuous decreasing fluid level after a few days until the steady state production situation is reached.
Case 2 – ESP lifted Well V-030 The well V-030 as shown in Fig. 7 is of similar configuration (ESP + VSD). V-030 is also a high watercut oil well. The Casing is connected to the flowline to vent the produced gas (2000 m³/day). Fig. 8 shows at first a stable production situation and afterwards a sudden pressure build up at the casing which indicates plugging of the casing flowline connection. This is further supported by a decreasing fluid level because of the increasing backpressure. So a malfunction of the casing pressure sensor could be excluded and immediate counteraction could be set. So the pump could be protected from running dry.
Case 3 – Sucker Rod Pumped Oil Well BH-003 The well BH-003 operated by RAG Austria, is lifted via sucker rod pumping system (SRP) which is also connected to a VSD. With this combination it is possible to run the SRP on variable speed (variable stroke number per minute) and therefore on a different production rate.
Producing an oil well below the bubble point of its well fluid will cause bubbles of liberated gas to appear in the formation. They can block the pore throats, decrease relative oil permeability and lead to a reduced production rate. This effect can be irreversible and the goal should be to avoid it wherever possible. Controlling the fluid level is the solution to avoid this negative impact.
In well BH-003 the fluid level was to be kept above 1700 m for this reason. Sure, if the SRP would be set at a depth of 1700 m the fluid level can not go below, but when the water cut of the well rises and the gas bubbling effect is of less importance anymore because there is less oil and gas, the pump has to be set deeper to get the benefits of additional drawdown. The later coming recompletion could be avoided via setting the sucker rod pump below 1700m and controlling the fluid level with the new measurement tool.
At well BH-003, a further phenomenon was discovered. The flowlinepressure oscillated on a periodical base of several hours due to dynamics in the flowline (gas slugs building up). This could also be verified downhole because in the case of BH-003 the casing is connected to the flowline via backpressure valve. So if casing gas pressure exceeds the flowline pressure, gas is vented into the flowline. If there is a higher flowline pressure, also the casing pressure goes up and furthermore correspondingly the fluid level in the well goes down, shown in Fig. 9. This is an evidence of the sensibility of the new measuring tool.
Case 4 – Sucker Rod Pumped Oil Well – Bubble Point Driven Control – BH-009 The well BH-009, operated by RAG Austria, is lifted via SRP as shown in Fig. 10. At this well, special consideration is given to avoid negative effects on the relative oil permeability. The goal is to avoid arising gas bubbles in the productive oil bearing sandstone formation. As long as the results of PVT measurement where under examination the reservoir department set a

SPE 145434 3
conservative fluid level of 1400 m as the maximum to avoid negative influence on the relative permeability curve. After the detailed data was available, the value of 1700 m was given. The well was put on the fluid level measurement tool as control device. Shown in Fig. 11 is the measured fluid level before and after the lowering to the new value. The pump is driven with a fixed speed motor and additional set on an ON/OFF controller. Further Application Spectrum of the Automated Fluid Level Measurement Tool To get long service life of the installed production equipment, it is beneficial to proper size each artificial lift method according to the individual well productivity. Sometimes the well productivity is not known exactly and artificial lift systems with adjustable production rates are installed (VSD). The fluid level measurement tool can be used to control and assist to optimize the systems more effectively. Some beneficial applications are summarized below:
Application ESP: Electrical submersible pumps are susceptible against running dry production conditions. Furthermore, often severe scaling can be observed on pulled equipment if no effective chemical treatment is established. The new tool can assist to avoid both unfavorable production conditions. The pump can be either switched off or be run at a smaller production rate if the fluid level tends to get into an unacceptable region. Scale formation can be pressure dependent and for carbonatic scale at higher pressures less scale tendency is given. If the fluid level can be held several meters above the pump, enough back pressure can be ensured to avoid severe formation of scaling.
ESP systems have a beneficial recommended operating window which should not be left to avoid pump damage and short running time. The fluid level measurement tool can assist the operator to stay within this range.
Compared with other available downhole sensors, this system is insensitive to high temperatures, more reliable and simple to maintain in case of any malfunction because of its easy access on surface.
Because of uncertainties of poor known inflow performance relationships, ESPs are often set up in a conservative production range to avoid equipment damage. The new tool can be used to produce a well in a more aggressive way without the danger of equipment damage. Furthermore higher drawdowns are available which will mobilize more oil, so additional reserves are generated.
The now available higher density of fluid level data can be used to design the following ESP more precise and well specific which will elongate the run life and enable to set the pump more close to the maximum efficiency point. This lowers the consumption of electrical power and operational expense.
Application Sucker Rod Pump (SRP): The fluid level measurement tool can either be used to avoid pump off conditions to elongate pump running time, or to hold the fluid level several meters above the pump, to avoid gas liberation within the reservoir rock (bubble point considerations).
Application Progressive Cavity Pump (PCP): Progressive Cavity Pumps are usually very sensitive to running dry conditions. The new measurement tool can be used to adjust the rotation speed of the pump based on fluid level data and effectively avoid running dry condition.
Application Jet Pump: Jet pumps, based on the so called “Venturi-principle”, suffer on cavitation if the intake pressure (= fluid level) is too low. The fluid measurement tool can be used to indicate the dangerous region to take counteraction like lowering the pumping flowrate so that fluid level rises and enough inlet pressure is established at the jet pump once again.
Application Plunger Lift: The new fluid level measurement tool could be used to control the plunger based on the wells fluid level, which indicates the well flowing pressure indirectly. Pressure Build Up Tests are Made Possible by the New Automated Fluid Measurement Tool Pressure Transient Analysis from Fluid Level Data While the tool has been designed to monitor and control a well during production, data that is collected during shut-in periods can be used for pressure buildup analysis. Both sample rate and accuracy of the fluid level data is sufficient for this purpose.
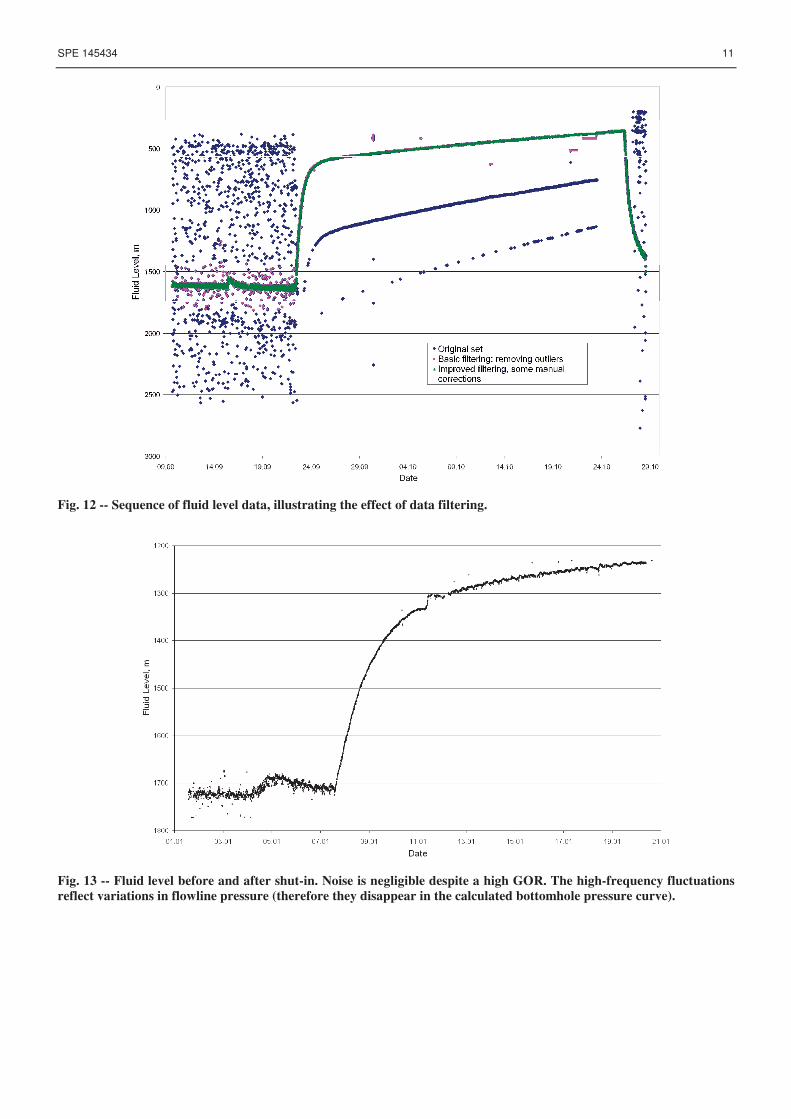
Typically, running a buildup test involves setting and pulling of memory gauges and a planned shut-in. Therefore, transient tests are seldom run at wells equipped with sucker rod pumps or other installations that prevent easy access. Being able to use fluid level data allows performing pressure transient analysis on data collected during the occasional unexpected downtime, without any equipment cost or lost production. Data Quality Fig. 12 shows a pressure buildup test recorded by one of the prototype units. Built-in error correction was deactivated intentionally, leading to many false picks during flowing periods. During shut-in, there is no scatter, but multiple travels are picked frequently.

4 SPE 145434
Throughout the entire sequence, most of the picks are accurate, though. Therefore noise can be removed by fairly simple filtering algorithms, and the remaining data points are more than sufficient for pressure transient analysis. This example demonstrates that even in adverse conditions the data gathered by the automated fluid level measuring tool can substitute bottomhole pressure recordings.
Improvements in calibration and automated data processing have largely eliminated noise, as Fig. 13 illustrates. When the device has been properly adjusted to well conditions, the raw data can be directly converted to bottomhole pressures.
Calculation of Bottomhole Pressures At steady-state conditions (this includes both production at a constant rate and the shut-in well after gas bubbles have left the liquid column), the bottomhole pressure can be calculated in a spreadsheet with the following input:
• Fluid level and corresponding wellhead pressure • Deviation survey (measured depth/true vertical depth) • Wellbore fluid (mixture) density for suitable range of pressure and temperature • Density of oil and water for static column
Using average fluid densities for large depth intervals introduces error. The accuracy of the pressure profile can be improved by splitting the wellbore into smaller segments. Multiphase flow modeling software is recommended to calculate the density of the fluid column according to the produced water cut and in the presence of gas percolating through.
During the transition period, the resulting movement of the fluid level is the sum of two effects: Pressure buildup in the formation, driving the fluid level in the well up; and rising gas bubbles leaving the liquid column, causing the fluid level to drop. Usually the first effect will dominate, so the fluid level goes up steadily after the well is stopped. The changing density along the wellbore, however, makes it very difficult to calculate exact bottomhole pressures from the fluid level. The phase distribution needs to be tracked through a time-dependent calculation, which requires some more information (e.g. gas slip velocity). A greater degree of refinement along the well axis is required compared to static conditions. Commercial software to simulate transient multiphase flow in wellbores is available.
Conclusion RAG has started to use fluid level measurements as a substitute for downhole memory gauges and obtained good results. Data was acquired from rod pumped wells that previously have not been candidates for pressure buildup tests because of prohibitive well intervention cost. This information contributes to optimizing the performance of mature fields.
Deriving a bottomhole pressure from fluid level is not trivial, but can be done with good accuracy for steady-state well conditions. Mastering the same for the transition from a flowing well into a static liquid column is most critical for the interpretation. This requires some effort, as a time-dependent calculation of the phase distribution needs to be done. Well geometry and PVT properties play an important role; recording bottomhole pressure and fluid level in parallel during a well test for a particular field or type of well is advisable to verify the calculation. Prospects: Subsurface Accoustic Well Diagnosis The tool also supports acoustic well diagnosis. This feature is currently under scientific investiagation by the Mining University of Leoben. Some preliminary results are presented here. Technique and Idea The fluid level measurement device comprises two different functional units mounted together. The first one is intended for the fluid level measurements and described above; another one shown in Fig. 2 (GOND-40) can be used to record noise generated in the wellbore. This application of the device is put into research.
The general idea about this research originates from the assumption that an oil well with a newly installed SRP system emits a characteristic sound spectrum that can be assessed. Every change to the system according to wear, staining, or beginning failures should be reflected in a corresponding change of this sound spectrum, creating thus a correlation. The boundaries of the study are set to find this dependence and to establish a relation between emitted noise and a production state of sucker rod pump. Therefore, the correlation between changes to the sound spectrum and changes to the system’s behavior will be researched on the basis of dynamometer readings and actual failure events.
The technique of the sucker rod pump production analysis with the help of sound response is brand new on the market. Previous research was held by the company manufacturing the fluid level measurement device. The adjustments and installation-specific settings, which control the operation of the fluid level measurement device as the sound recorder, are based on the experience of the tool manufacturing company.
The noise represents a function of dynamic behavior of fluid and gas, downhole and surface equipment. The noise created by the system (the well in general with completion equipment, pump, and surface equipment) is recorded with a microphone installed in the body of the fluid level measurement device (the installation is shown above). The microphone recording

SPE 145434 5
frequency range allows registering frequencies of 0 to 44100 Hz. The recorded noise is transmitted further to the evaluation unit. The sound data are stored and available to download.
The part of the dynamic fluid level measurement device responsible for the sound recording (“sound” part) starts operating only if another part responsible for the fluid level measurements (“level measurement” part) is shut down. This condition ensures that there is no additional noise recorded which is caused by emitted and reflected waves from dynamic fluid level measurements.
The entire process of the well analysis by the fluid level measurement device is suggested as follows:
• continuous online noise response monitoring • automatic online comparison and recording • necessary actions launching
Data Gathering One of the most important parts of the analysis is to compose the main database of sound responses, where sound data from each well are stored. The creation of the database is the first step to work on the well noise analysis. The database is built for the wells individually, since the sound response is unique for each well. Every well generates sound with certain characteristics caused by completion, depth, strokes per minute, fluids and gas composition etc. (for instance the range of the main frequencies: e.g. a well equipped with the polyethylene lined tubing has the highest registered frequency at 16 200 Hz as another one completed with a steel tubing has the highest frequency at 32 000 Hz).
The database will have several referring points. Sound responses will be divided into so-called “normal” ones (it is then the operating system is considered to produce without failures) and “abnormal” or “failures” ones (then the system is producing under unusual condition (e.g. excessive loads on rods) or is having failures (tubing leak, knocking plunger, buckling sucker rod string etc.). Sound responses taken out the well are compared to the “normal” responses on regular basis and in case there is an unexpected noise event or change in noise characteristic appears, the system is admitted out of its normal operation state.
The necessary information for a proper analysis comprises two kinds of data sets: Dynamometer readings (which are used as the reference to identify the system state) and sound records.
In this research, the dynamometer readings are gathered on a monthly basis, including standard valve check reports. The sound records are gathered on a daily basis. Due to the fact that sound recordings represent a huge amount of data, only changes in the spectrum will be stored for further analysis.
Proper data sampling is essential and involves the recording of a number of individual pump strokes per day for the sake of measurements precision, error elimination, and statistical validation. Analyzing Method The data analysis will utilize statistics and computational intelligence to determine the correlations between the state of the system and its corresponding sound response.
Considering SRP wells, each stroke is studied. Figs. 14 through 15 depict the frequencies of sound recordings at different system states of one well with the SRP in place. Fig. 14 shows one stroke in 3-D interpretation, where x-axis is the timeaxis of one stroke, y-axis is the noise frequency and z-axis is its amplitude. Thereby, the range of frequency and amplitude changes can be observed. To compare how frequency bounds are changed, Fig. 15 depicts a noise interpretation of the same well but the pump is running with an activated mechanical brake to simulate squeaky belts and a high loaded electrical motor.
From the example the difference in sound responses is visible: changing in amplitude, loudness, and their correspondence. Differences within the sound spectrum can be observed. When the pump operates in the motor break mode, the frequencies up to 40 Hz, and between 300-350 Hz displays higher amplitude; frequencies between 3600 and 5200 Hz display lower amplitude compared to the normal pump run.
The databases are built during the whole well production life. It gives an observer the better understanding of the well behavior as long as the system alters and new production conditions appear. At the same time, noise responses are expected to change as well.
Another profit of the fluid level measurement device recording system is the option to watch how the system response was changed during the arising problem. An example is a tubing leak. It is supposed that the tubing leak starts with a small orifice in the tubing, then oil passes through it and additional noise is generated, which can be registered by the represented device.

6 SPE 145434
Development Goal In the long run the application of this technology should allow identifying the following sucker rod pump failures before they cause major damage or production loss:
• leaking tubing • leaking, standing or travelling valve • excessive load on the rod string • rod part or even damaged sucker rod string • gas-locked sucker rod pump • worn out rod guides • sucker rod buckling • knocking down (of the plunger on the standing valve) • Squeaky Belts • Leaking Stuffing Box
Summary The new fully automated fluid level measurement tool enables getting permanent downhole pressure data even if no tubing access for slickline or wireline technique is given. The tool is mounted on the opened casing valve and can only be used at wells with packerless completions. It supports the optimizing process of several artificial lift production methods as SRP, ESP, and PCP. The proper usage of it leads to higher production systems lifetime and less well downtime.
Due to the now permanently available fluid level data, wells can be produced at more aggressive rates without taking the corresponding risk of severe equipment damage. The tool assists to protect ESPs and PCPs from running dry. The new measurement tool enables to produce oil wells holding a specific fluid level to avoid the negative effect of arising gas bubbles in the productive formation. It is designed for a permanent installation at the well site and commissioned to work also in explosion hazardous area.
The automated fluid level measurement tool enables pressure built up tests also at sucker rod pumped wells, where this was not common so far, because of the usual necessary workover and the corresponding high costs.
The vision of acoustic well diagnosis, a further feature of the tool is currently under promising scientific investigation. The goal of this development is to have the possibility of proactive maintenance before a production system failure occurs. This should lead to less systems downtime, reduced production deferment and lifting costs.
The tool is a development and invention of RAG Austria, an independent Operator on continental Europe in close cooperation with a company specialized on acoustic diagnosis of facilities. It was designed to fit RAG needs and to address difficulties in producing mature oil and gasfields. RAG currently owns 12 permanently installed measurement tools, whereas six are installed on ESP- and other six are installed on SRP completions. Each tool is connected to a SCADA system.

SPE 145434 7
APPENDIX A – Figures
Fig. 1 – Conventional Fluid Level Measurement Tool – Casinggas is vented shortly to the atmosphere and closed suddenly. Noise is induced.
Fig. 2 – The Rectifier and Printer of the Conventional Fluid Level Measurement Tool. Each reflection caused at a tubing connection and at the fluid level itselve is recorded and printed for further analysis.

8 SPE 145434
Fig. 3 – The Automated Fluid Level Measurement Device is mounted on the opened casing valve.
Fig. 4 – The Automated Fluid Level Evaluation Unit calculates the fluid level, stores it and feeds it into the SCADA system per standardized 4-20 mA interface for further processing.
Fig. 5 – The Specification / Certification Plate of the Automated Fluid Level Measurement Device

SPE 145434 9
Fig. 6 – Visualised fluid level data of the well KTG-W-002 after start up of the ESP. The fluid level is visualized inverse (negative algebraic sign) on the y-axis in meters. The Time (calendar date) is shown on the x-axes.
Fig. 7 – Surface installation of well V-030. The fluid level measurement device (painted blue) is mounted on the opened casing valve.
Fig. 8 – Visualised fluid level data of well V-030. The casing pressure is shown on the lower (black) line, whereas the fluid level is indicated on the upper (red) line. The sudden and continous increase in casing pressure and vize versa decrease of fluid level indicates a plugged casing flowline connection (casing gas usually vented to the flowline).

10 SPE 145434
Fig. 9 – The casing gas pressure on well BH-003 (upper – black line) fluctuates because of pressure dynamics in the flowline. The fluid level (lower – red line) fluctuates with a phase shift correspondingly. This is an evidence for the sensitivity of the new fluid level measurement tool.
Fig. 10 – Fluid level Measurement Tool mounted on a sucker rod pumped well BH-009.
Fig. 11 – Fluid level data of well BH-009. At first the fluid level should not be below 1400m because PVT measurement was under examination. After receiving of the analysed data the new fluid level limit of 1700m was set. The pump jack is operated with a fixed speed motor additionally set on an ON/OFF controller.
SPE 145434 11
Fig. 12 -- Sequence of fluid level data, illustrating the effect of data filtering.
Fig. 13 -- Fluid level before and after shut-in. Noise is negligible despite a high GOR. The high-frequency fluctuations reflect variations in flowline pressure (therefore they disappear in the calculated bottomhole pressure curve).

12 SPE 145434
Fig. 14 – Normal Run of the Sucker Rod Pump.
Fig. 14 – Sucker Rod Pump running with activated mechanical brake to simulate squeaky belts.