spatiotemporal coordination of cell division and...
TRANSCRIPT

RESEARCH ARTICLE
Spatiotemporal coordination of cell division
and growth during organ morphogenesis
Samantha FoxID1☯, Paul Southam1☯¤a, Florent Pantin1,2☯¤b, Richard Kennaway1,
Sarah Robinson1¤c, Giulia Castorina1¤d, Yara E. Sanchez-Corrales1¤e, Robert Sablowski1,
Jordi Chan1, Veronica Grieneisen3, Athanasius F. M. Maree3, J. Andrew Bangham2†,
Enrico Coen1*
1 Department of Cell and Developmental Biology, John Innes Centre, Norwich, England, United Kingdom,
2 School of Computational Sciences, University of East Anglia, Norwich, England, United Kingdom,
3 Department of Computational and Systems Biology, John Innes Centre, Norwich, England, United
Kingdom
☯ These authors contributed equally to this work.
† Deceased.
¤a Current address: School of Computational Sciences, University of East Anglia, Norwich, England, United
Kingdom
¤b Current address: UMR LEPSE, Montpellier SupAgro/INRA, Montpellier, France
¤c Current address: Institute of Plant Sciences, University of Bern, Bern, Switzerland
¤d Current address: Department of Agricultural and Environmental Sciences—Production, Landscape,
Agroenergy, University of Milan, Milan, Italy
¤e Current address: MRC-Laboratory of Molecular Biology, Cambridge Biomedical Campus, Francis Crick
Avenue, Cambridge, England, United Kingdom
Abstract
A developing plant organ exhibits complex spatiotemporal patterns of growth, cell division,
cell size, cell shape, and organ shape. Explaining these patterns presents a challenge
because of their dynamics and cross-correlations, which can make it difficult to disentangle
causes from effects. To address these problems, we used live imaging to determine the spa-
tiotemporal patterns of leaf growth and division in different genetic and tissue contexts. In
the simplifying background of the speechless (spch) mutant, which lacks stomatal lineages,
the epidermal cell layer exhibits defined patterns of division, cell size, cell shape, and growth
along the proximodistal and mediolateral axes. The patterns and correlations are distinctive
from those observed in the connected subepidermal layer and also different from the epider-
mal layer of wild type. Through computational modelling we show that the results can be
accounted for by a dual control model in which spatiotemporal control operates on both
growth and cell division, with cross-connections between them. The interactions between
resulting growth and division patterns lead to a dynamic distributions of cell sizes and
shapes within a deforming leaf. By modulating parameters of the model, we illustrate how
phenotypes with correlated changes in cell size, cell number, and organ size may be gener-
ated. The model thus provides an integrated view of growth and division that can act as a
framework for further experimental study.
PLOS Biology | https://doi.org/10.1371/journal.pbio.2005952 November 1, 2018 1 / 48
a1111111111
a1111111111
a1111111111
a1111111111
a1111111111
OPEN ACCESS
Citation: Fox S, Southam P, Pantin F, Kennaway R,
Robinson S, Castorina G, et al. (2018)
Spatiotemporal coordination of cell division and
growth during organ morphogenesis. PLoS Biol 16
(10): e2005952. https://doi.org/10.1371/journal.
pbio.2005952
Academic Editor: Mark Estelle, University of
California San Diego, United States of America
Received: March 8, 2018
Accepted: September 20, 2018
Published: November 1, 2018
Copyright: © 2018 Fox et al. This is an open access
article distributed under the terms of the Creative
Commons Attribution License, which permits
unrestricted use, distribution, and reproduction in
any medium, provided the original author and
source are credited.
Data Availability Statement: Images and models
software from this study are available at https://
figshare.com/s/b14c8e6cb1fc5135dd87. Models
and GFtbox modeling software are also available
at http://cmpdartsvr3.cmp.uea.ac.uk/wiki/
BanghamLab/index.php/Software.
Funding: Biotechnology and Biological Sciences
Research Council (grant number BB/P013511/1;
BB/J004588/1). The funder had no role in study
design, data collection and analysis, decision to
publish, or preparation of the manuscript.

Author summary
Organ morphogenesis involves two coordinated processes: growth of tissue and increase
in cell number through cell division. Both processes have been analysed individually in
many systems and shown to exhibit complex patterns in space and time. However, it is
unclear how these patterns of growth and cell division are coordinated in a growing leaf
that is undergoing shape changes. We have addressed this problem using live imaging to
track growth and cell division in the developing leaf of the mustard plant Arabidopsisthaliana. Using subsequent computational modelling, we propose an integrated model of
leaf growth and cell division, which generates dynamic distributions of cell size and shape
in different tissue layers, closely matching those observed experimentally. A key aspect of
the model is dual control of spatiotemporal patterns of growth and cell division parame-
ters. By modulating parameters in the model, we illustrate how phenotypes may correlate
with changes in cell size, cell number, and organ size.
Introduction
The development of an organ from a primordium typically involves two types of processes:
increase in cell number through division, and change in tissue shape and size through growth.
However, how these processes are coordinated in space and time is unclear. It is possible that
spatiotemporal regulation operates through a single control point: either on growth with
downstream effects on division, or on division with downstream effects on growth. Alterna-
tively, spatiotemporal regulation could act on both growth and division (dual control), with
cross talk between them. Distinguishing between these possibilities is challenging because
growth and division typically occur in a context in which the tissue is continually deforming.
Moreover, because of the correlations between growth and division it can be hard to distin-
guish cause from effect [1]. Plant development presents a tractable system for addressing such
problems because cell rearrangements make little or no contribution to morphogenesis, sim-
plifying analysis [2].
A growing plant organ can be considered as a deforming mesh of cell walls that yields con-
tinuously to cellular turgor pressure [3,4]. In addition to this continuous process of mesh
deformation, new walls are introduced through cell division, allowing mesh strength to be
maintained and limiting cell size. It is thus convenient to distinguish between the continuous
expansion and deformation of the mesh, referred to here as growth, and the more discrete pro-
cess of introducing new walls causing increasing cell number, cell division [5–8].
The developing Arabidopsis leaf has been used as a system for studying cell division control
within a growing and deforming tissue. Developmental snapshots of epidermal cells taken at
various stages of leaf development reveal a complex pattern of cell sizes and shapes across the
leaf, comprising both stomatal and non-stomatal lineages [9]. Cell shape analysis suggests that
there is a proximal zone of primary proliferative divisions that is established and then abol-
ished abruptly. Expression analysis of the cell cycle reporter construct cyclin1 Arabidopsisthaliana β-glucuronidase (cyc1At-GUS) [10] shows that the proximal proliferative zone
extends more distally in the subepidermal as compared with the epidermal layer. Analysis of
the intensity of cyc1At-GUS, which combines both epidermal and subepidermal layers, led to a
one-dimensional model in which cell division is restricted to a corridor of fixed length in the
proximal region of the leaf [11]. The division corridor is specified by a diffusible factor gener-
ated at the leaf base, termed mobile growth factor, controlled by expression of Arabidopsiscytochrome P450/CYP78A5 (KLUH). Two-dimensional models have been proposed based on
Coordination of cell division and growth during organ morphogenesis
PLOS Biology | https://doi.org/10.1371/journal.pbio.2005952 November 1, 2018 2 / 48
Biotechnology and Biological Sciences Research
Council (grant number BB/M023117/1, BB/
F005997/1, and BB/L008920/1). Received by EC.
The funder had no role in study design, data
collection and analysis, decision to publish, or
preparation of the manuscript. ERC (grant number
Carnomorph, 323028). Received by EC. The funder
had no role in study design, data collection and
analysis, decision to publish, or preparation of the
manuscript. Biotechnology and Biological Sciences
Research Council (grant number BB/F005555/1).
Received by AB. The funder had no role in study
design, data collection and analysis, decision to
publish, or preparation of the manuscript. Marie
Skłodowska-Curie actions (grant number
HEMOTIONAL, 329784). Received by FP. The
funder had no role in study design, data collection
and analysis, decision to publish, or preparation of
the manuscript. Consejo Nacional de Ciencia y
Tecnologıa. Received by YSC. The funder had no
role in study design, data collection and analysis,
decision to publish, or preparation of the
manuscript.
Competing interests: The authors have declared
that no competing interests exist.
Abbreviations: Ā, mean threshold cell area for
division execution; CD, cumulative difference;
CDIV, competence to divide; CER, controlled
environment room; cyc1At-GUS, cyclin1
Arabidopsis thaliana β-glucuronidase; DAI, day
after initiation; HAI, hour after initiation; FAMA,
basic helix-loop-helix transcription factor
(bHLH097; KLUH, Arabidopsis cytochrome P450/
CYP78A5; Kpar, specified growth rate parallel to
polarity axis; Kper, specified growth rate
perpendicular to polarity axis; KRN, growth
regulatory network; LAM, a factor distinguishing
lamina from petiole; LATE, a timing factor; LOCO-
EFA, Lobe-Contribution Elliptic Fourier Analysis;
MID, a mediolateral factor; mPS-PI, modified
pseudo-Schiff propidium iodide; PGRAD, a graded
proximodistal factor; PMF, proximal mobile factor;
POL, factor determining polarity field; SDS, Sodium
Dodecyl Sulfate; spch, speechless; v-cell, virtual
cell.

growth and cell division being regulated in parallel by a morphogen generated at the leaf base
[12,13]. These models assume either a constant cell area at division, or constant cell cycle
duration.
The above models represent important advances in understanding the relationships
between growth and division, but leave open many questions, such as the relations of divisions
to anisotropic growth, variations along both mediolateral and proximodistal axes, variation
between cell layers, variation between genotypes with different division patterns, and predic-
tions in relation to mutants that modify organ size, cell numbers, and cell sizes [14].
Addressing these issues can be greatly assisted through the use of live confocal imaging to
directly quantify growth and division [15–22]. Local rates and orientations of growth can be
estimated by the rate that landmarks, such as cell vertices, are displaced away from each other.
Cell division can be monitored by the appearance of new walls within cells. This approach has
been used to measure growth rates and orientations for developing Arabidopsis leaves and has
led to a tissue-level model for its spatiotemporal control [16]. Live tracking has also been used
to follow stomatal lineages and inform hypotheses for stomatal division control [23]. It has
also been applied during a late stage of wild-type leaf development after most divisions have
ceased [24]. However, this approach has yet to be applied across an entire leaf for extended
periods to compare different cell layers and genotypes.
Here, we combine tracking and modelling of 2D growth in different layers of the growing
Arabidopsis leaf to study how growth and division are integrated during organ morphogenesis.
We exploit the speechless (spch) mutant to allow divisions to be followed in the absence of sto-
matal lineages, and show how the distribution and rates of growth and cell division vary in the
epidermal and subepidermal layers along the proximodistal and mediolateral axes and in time.
We further compare these findings to those of wild-type leaves grown under similar condi-
tions. Our results reveal spatiotemporal variation in both growth rates and cell properties,
including cell sizes, shapes, and patterns of division. By developing an integrated model of
growth and division, we show how these observations can be accounted for by a model in
which core components of both growth and division are under spatiotemporal control. Vary-
ing parameters of this model illustrates how changes in organ size, cell size, and cell number
are likely interdependent, providing a framework for evaluating growth and division mutants.
Results
To develop an integrated model of growth and division, we first tracked the epidermis of spchmutants, as they exhibit a simplified pattern of cell lineages [23]. Cell division dynamics were
monitored by measuring spatiotemporal variation in two components: competence and execu-
tion. Competence refers to whether a cell has the potential to divide at some point in the
future, whereas execution refers to a cell undergoing division (i.e., being cleaved into two).
A proximal zone of division competence initially extends with tissue
growth in the epidermis
Tracking cell vertices on the abaxial epidermis of spch seedlings imaged at about 12-h intervals
allowed cells at a given developmental stage to be classified into those that would undergo divi-
sion (competent to divide, green, Fig 1A), and those that did not divide for the remainder of
the tracking period (black, Fig 1A). During the first time interval imaged (Fig 1A, 0–14 h),
division competence was restricted to the basal half of the leaf, with a distal limit of about
150 μm (all distances are measured relative to the petiole-lamina boundary, Fig 1). To visualise
the fate of cells at the distal limit, we identified the first row of nondividing cells (orange) and
displayed them in all subsequent images. During the following time intervals, the zone of
Coordination of cell division and growth during organ morphogenesis
PLOS Biology | https://doi.org/10.1371/journal.pbio.2005952 November 1, 2018 3 / 48

Fig 1. Dynamics of cell division and growth in the spch epidermis. Time-lapse imaging of a spch leaf at
approximately 12-h intervals over 4 d (0–100 h; last time point in series not shown). Data shown on the first time point
Coordination of cell division and growth during organ morphogenesis
PLOS Biology | https://doi.org/10.1371/journal.pbio.2005952 November 1, 2018 4 / 48

competence extended together with growth of the tissue to a distance of about 300 μm, after
which it remained at this position, while orange boundary cells continued to extend further
through growth. Fewer competent cells were observed in the midline region at later stages.
Thus, the competence zone shows variation along the proximodistal and mediolateral axes of
the leaf, initially extending through growth to a distal limit of about 300 μm and disappearing
earlier in the midline region.
Execution of division exhibits spatiotemporal variation in the epidermis
To monitor execution of division, we imaged spch leaves at shorter intervals (every 2 h). At
early stages, cells executed division when they reached an area of about 150 μm2 (Fig 2A, 0–24
h). At later stages, cells in the proximal lamina (within 150 μm) continued to execute division at
about this cell area (mean = 151 ± 6.5 μm2, Fig 2B), while those in the more distal lamina or in
the midline region executed divisions at larger cell areas (mean = 203 ± 9.7 μm2 or 243.0 ± 22.4
μm2, respectively, Fig 2A, 2B and 2D). Cell cycle duration showed a similar pattern, being lowest
within the proximal 150 μm of the lamina (mean = 13.9 ± 0.8 h) and higher distally (mean =
19.4 ± 1.8 h) or in the midline region (18.9 ± 2.1 h, Fig 2C and 2E). Within any given region,
there was variation around both the area at time of division execution and the cell cycle dura-
tion (Fig 2F and 2G). For example, the area at execution of division within the proximal 150 μm
of the lamina had a mean of about 150 μm2, with standard deviation of about 40 μm2 (Fig 2F).
The same region had a cell cycle duration with a mean of about 14 h and a standard deviation of
about 3 h. Thus, both the area at which cells execute division and cycle duration show variation
around a mean, and the mean varies along the proximodistal and mediolateral axes of the leaf.
These findings suggest that models in which either cell area at the time of division or cell cycle
duration are fixed would be unable to account for the observed data.
Epidermal growth rates exhibit spatiotemporal variation
To determine how cell division competence and execution are related to leaf growth, we mea-
sured areal growth rates (relative elemental growth rates [25]) for the different time intervals,
using cell vertices as landmarks (Fig 1B). Areal growth rates varied along both the mediolateral
and proximodistal axis of the leaf, similar to variations observed for competence and execution
of division. The spatiotemporal variation in areal growth rate could be decomposed into
growth rates in different orientations. Growth rates parallel to the midline showed a proximo-
distal gradient, decreasing towards the distal leaf tip (Fig 1C and S1A Fig). By contrast, medio-
lateral growth was highest in the lateral lamina and declined towards the midline, becoming
very low there in later stages (Fig 1D and S1B Fig). The region of higher mediolateral growth
may correspond to the marginal meristem [26]. Regions of low mediolateral growth (i.e., the
proximal midline) showed elongated cell shapes. Models for leaf growth therefore need to
(underlined) for each tracking interval. Leaf widths for the first time point (left to right) are 0.15, 0.22, 0.27, 0.31, 0.39,
0.48, and 0.68 mm. (A) Cells amenable to tracking that were competent to divide (green), and either executed division
during the interval (light green) or divided in a later interval (dark green). Cells that did not divide (black, first row in
0–14 h are coloured orange throughout). For the last interval (74–100 h), cell divisions could only be tracked for a
subset of cells because of missing data points at 100 h. (B-D) Cellular growth rates (heat maps) for each tracking
interval. Black line refers to orange cells in (A). (B) Areal growth rates. (C) Growth rates parallel to the midline
(proximodistal). (D) Growth rates perpendicular to the midline (mediolateral). (E) Cell areas for the first time point of
the interval. Leaf outline indicated by dotted black line. The petiole-lamina boundary was defined by selecting a cell
from a later stage of development, where the lamina narrows, and then tracing its lineage back to all stages. Grey boxes
are aligned to the petiole-lamina boundary and extend to 150 or 300 μm. Black arrows indicate distal boundary of the
zone of division competence. Scale bar = 100 μm. See also S1 Fig, S2 Fig, S3 Fig, S4 Fig, S5 Fig, and S6 Fig. Source data
are available from https://figshare.com/s/b14c8e6cb1fc5135dd87. spch, speechless.
https://doi.org/10.1371/journal.pbio.2005952.g001
Coordination of cell division and growth during organ morphogenesis
PLOS Biology | https://doi.org/10.1371/journal.pbio.2005952 November 1, 2018 5 / 48

Coordination of cell division and growth during organ morphogenesis
PLOS Biology | https://doi.org/10.1371/journal.pbio.2005952 November 1, 2018 6 / 48

account not only for the spatiotemporal pattern of areal growth rates but also the pattern of
anisotropy (differential growth in different orientations) and correlated patterns of cell shape.
Cell sizes reflect the combination of growth and division
Cell size should reflect both growth and division: growth increases cell size while division
reduces cell size. Cell periclinal areas were estimated from tracked vertices (Fig 1E). Segment-
ing a sample of cells in 3D showed that these cell areas were a good proxy for cell size, although
factors such as leaf curvature introduced some errors (for quantifications see S5 Fig, and ‘Anal-
ysis of cell size using 3D segmentation’ in Materials and methods). At the first time point
imaged, cell areas were about 100–200 μm2 throughout most of the leaf primordium (Fig 1E,
left). Cells within the proximal 150 μm of the lamina remained small at later stages, reflecting
continued divisions. In the proximal 150–300 μm of the lamina, cells were slightly larger,
reflecting larger cell areas at division execution. Lamina cells distal to 300 μm progressively
enlarged, reflecting the continued growth of these nondividing cells (Fig 1E and Fig 3A). Cells
in the midline region were larger on average than those in the proximal lamina, reflecting exe-
cution of division at larger cell areas (Fig 1E and Fig 3C). Thus, noncompetent cells increase in
area through growth, while those in the competence zone retain a smaller size, with the small-
est cells being found in the most proximal 150 μm of the lateral lamina.
Correlations between cell size and growth rate
Visual comparison between areal growth rates (Fig 2B) with cell sizes (Fig 2E) suggested that
regions with higher growth rates had smaller cell sizes. Plotting areal growth rates against log
cell area confirmed this impression, revealing a negative correlation between growth rate and
cell size (Fig 4B). Thus, rapidly growing regions tend to undergo more divisions. This relation-
ship is reflected in the pattern of division competence: mean areal growth rates of competent
cells in the lamina were higher than noncompetent cells, particularly at early stages (Fig 3I).
However, there was no fixed threshold growth rate above which cells were competent, and for
the midline region there was no clear difference between growth rates of competent and non-
competent cells (Fig 3I). Plotting areal growth rates for competent and noncompetent cells
showed considerable overlap (S6 Fig), with no obvious switch in growth rate when cells no
longer divide (become noncompetent). Thus, high growth rate broadly correlates with division
competence, but the relationship is not constant for different regions or times.
Fig 2. Quantification of cell division execution. Time-lapse imaging of a spch leaf imaged at 2-h intervals over 3 d (0–
71 h, last time point in series not shown). Leaf widths for the first time point (left to right) are 0.09, 0.21, and 0.36 mm.
(A) Cell area at division execution (heat map) for cells amenable to tracking, visualised over 24-h intervals and shown
on the first time point of the interval (underlined). Cells that did not divide during the 24-h interval are coloured black.
If cells divided more than once in the 24-h interval, the area of the first division is shown. Leaf outline indicated by
dotted black line. The petiole-lamina boundary was defined as described in Fig 1. Grey boxes are aligned to the petiole-
lamina boundary and extend to 150 or 300 μm. Cells within the magenta line were assigned as being within the midline
region. (B-E) Data grouped into intervals of 12 h (inset in D). Means (μ) are shown with ± ranges indicating
1.96 × standard error, corresponding to the 95% confidence limit for a normal distribution. (B, D) Area of cells at
division execution versus distance from the petiole-lamina boundary. (B) Cells in the lamina (μ = 170.8 ± 7.7 μm2),
mean cell area of cells within the proximal 150 μm = 151 ± 6.5 μm2, mean cell area of cells outside the proximal 150
μm = 203 ± 9.7 μm2. (D) Cells in the midline region (μ = 243.0 ± 22.4 μm2). (C, E) Cell cycle duration versus distance
from the petiole-lamina boundary. (C) Cells in the lamina (μ = 16.2 ± 1.0 h). For cells in the proximal 150 μm, μ =
13.9 ± 0.8 h. For cells outside the proximal 150 μm, μ = 19.4 ± 1.8 h. (E) Cells in the midline (μ = 18.9 ± 2.1 h). (F, G)
Histograms of cell area at time of division execution, and cell cycle duration, during time intervals of 24 h (as in A). (F)
Area at division execution for cells within the proximal 150 μm of the lamina (μ = {145.6, 158.3, 142.6}, standard
deviation σ = {36.3, 37.9, 40.1}). (G) Cell cycle duration for cells within the proximal 150 μm of the lamina (μ = {15.8,
13.1, 16.7}, σ = {2.5, 3.3, 2.7}). Measurements of cell area and cell cycle duration are accurate to within 2 h (the time
interval between imaging) of division execution. Scale bar = 100 μm. See also S7 Fig. Source data are available from
https://figshare.com/s/b14c8e6cb1fc5135dd87. spch, speechless.
https://doi.org/10.1371/journal.pbio.2005952.g002
Coordination of cell division and growth during organ morphogenesis
PLOS Biology | https://doi.org/10.1371/journal.pbio.2005952 November 1, 2018 7 / 48
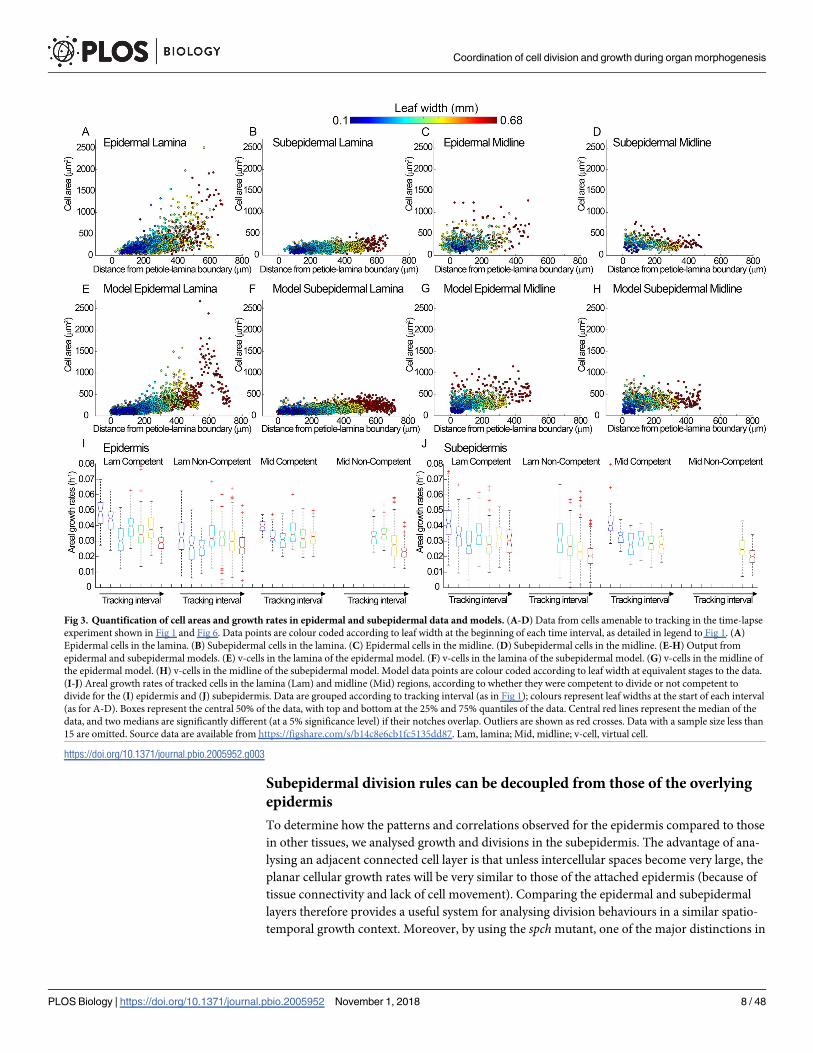
Subepidermal division rules can be decoupled from those of the overlying
epidermis
To determine how the patterns and correlations observed for the epidermis compared to those
in other tissues, we analysed growth and divisions in the subepidermis. The advantage of ana-
lysing an adjacent connected cell layer is that unless intercellular spaces become very large, the
planar cellular growth rates will be very similar to those of the attached epidermis (because of
tissue connectivity and lack of cell movement). Comparing the epidermal and subepidermal
layers therefore provides a useful system for analysing division behaviours in a similar spatio-
temporal growth context. Moreover, by using the spch mutant, one of the major distinctions in
Fig 3. Quantification of cell areas and growth rates in epidermal and subepidermal data and models. (A-D) Data from cells amenable to tracking in the time-lapse
experiment shown in Fig 1 and Fig 6. Data points are colour coded according to leaf width at the beginning of each time interval, as detailed in legend to Fig 1. (A)
Epidermal cells in the lamina. (B) Subepidermal cells in the lamina. (C) Epidermal cells in the midline. (D) Subepidermal cells in the midline. (E-H) Output from
epidermal and subepidermal models. (E) v-cells in the lamina of the epidermal model. (F) v-cells in the lamina of the subepidermal model. (G) v-cells in the midline of
the epidermal model. (H) v-cells in the midline of the subepidermal model. Model data points are colour coded according to leaf width at equivalent stages to the data.
(I-J) Areal growth rates of tracked cells in the lamina (Lam) and midline (Mid) regions, according to whether they were competent to divide or not competent to
divide for the (I) epidermis and (J) subepidermis. Data are grouped according to tracking interval (as in Fig 1); colours represent leaf widths at the start of each interval
(as for A-D). Boxes represent the central 50% of the data, with top and bottom at the 25% and 75% quantiles of the data. Central red lines represent the median of the
data, and two medians are significantly different (at a 5% significance level) if their notches overlap. Outliers are shown as red crosses. Data with a sample size less than
15 are omitted. Source data are available from https://figshare.com/s/b14c8e6cb1fc5135dd87. Lam, lamina; Mid, midline; v-cell, virtual cell.
https://doi.org/10.1371/journal.pbio.2005952.g003
Coordination of cell division and growth during organ morphogenesis
PLOS Biology | https://doi.org/10.1371/journal.pbio.2005952 November 1, 2018 8 / 48

Fig 4. Correlations between growth rates and cell size. Areal cell growth rates against log cell area for time intervals at different developmental stages. Data
points are colour coded according to leaf width at the start of the interval (colour scale is shown at the top). Solid red lines indicate mean cell areas (μa) and dashed
red lines indicate mean growth rate (μk), with ± ranges indicating 1.96 × standard error of mean. Lines fitted for R2 > 0.2 are shown in magenta; those with R2 <
0.2 and> 0.1 are shown in grey (p-values are all less than 5.1×10⁻⁶ for line fits). (A) Wild type (from dataset shown in Fig 7B–7D, time intervals: 12–25 h, 25–37 h,
37–47 h, 47–57 h). From left to right, μa = {4.2 ± 0.08, 4.3 ± 0.07, 4.4 ± 0.07, 4.4 ± 0.07}, μk = {0.038 ± 0.001, 0.033 ± 0.001, 0.021 ± 0.001, 0.026 ± 0.001}, gradient
m = {−0.008, −0.004, −0.002, −0.006}, and R2 = {0.18,−,−,0.14}. (B) spch epidermis (from dataset shown in Fig 1, time intervals: 14–24 h, 35–47 h, 47–58 h, 58–74
h), μa = {5.3 ± 0.08, 5.3 ± 0.06, 5.4 ± 0.06, 5.4 ± 0.06}, μk = {0.033 ± 0.001, 0.036 ± 0.001, 0.033 ± 9×10⁻⁴, 0.031 ± 8×10⁻⁴}, m = {−0.014, −0.009, −0.008, −0.008},
and R2 = {0.31,0.31,0.27,0.38}. (C) spch subepidermis (from dataset shown in Fig 6, time intervals: 14–24 h, 35–47 h, 47–58 h, 58–74 h), μa = {5.0 ± 0.09, 5.0 ± 0.06,
5.1 ± 0.05, 5.1 ± 0.05}, μk = {0.033 ± 0.002, 0.033 ± 0.001, 0.028 ± 0.001, 0.026 ± 9×10⁻⁴}, m = {−0.003, −0.010, −0.002, −0.008}, and R2 = {−, 0.19, −, 0.15}. (D) spchepidermal model output at stages corresponding to leaf widths in (B), μa = {4.9 ± 0.05, 4.9 ± 0.05, 5.0 ± 0.04, 5.0 ± 0.04}, μk = {0.045 ± 0.001, 0.037 ± 5×10⁻⁴,
0.035 ± 0.004, 0.038 ± 1×10⁻⁴}, m = {−0.012, −0.008, −0.008, −0.009}, R2 = {0.33,0.42,0.54,0.59}. Source data are available from https://figshare.com/s/
b14c8e6cb1fc5135dd87. Ln, natural logarithm; spch, speechless.
https://doi.org/10.1371/journal.pbio.2005952.g004
Coordination of cell division and growth during organ morphogenesis
PLOS Biology | https://doi.org/10.1371/journal.pbio.2005952 November 1, 2018 9 / 48

division properties between these layers (the presence of stomatal lineages in the epidermis) is
eliminated.
Divisions in the abaxial subepidermis were tracked by digitally removing the overlying epi-
dermal signal (the distalmost subepidermal cells could not be clearly resolved). As with the epi-
dermis, 3D segmentation showed that cell areas were a good proxy for cell size, although
average cell thickness was greater (S11 Fig, see also ‘Analysis of cell size using 3D segmenta-
tion’ in Materials and methods). Unlike the epidermis, intercellular spaces were observed for
the subepidermis. As the tissue grew, subepidermal spaces grew and new spaces formed (Fig
5A–5D). Similar intercellular spaces were observed in subepidermal layers of wild-type leaves,
showing they were not specific to spch mutants (S8 Fig).
Vertices and intercellular spaces in the subepidermis broadly maintained their spatial rela-
tionships with the epidermal vertices (Fig 5C, 5E and 5F). Comparing the cellular growth rates
in the plane for a patch of subepidermis with the adjacent epidermis showed that they were
similar (S9 Fig), although the subepidermal rates were slightly lower because of the intercellu-
lar spaces. This correlation is expected, because unless the intercellular spaces become very
large, the areal growth rates of the epidermal and subepidermal layers are necessarily similar.
The most striking difference between subepidermal and epidermal datasets was the smaller
size of the distal lamina cells of the subepidermis (compare Fig 6A with Fig 1E, and Fig 3A
with Fig 3B). For the epidermis, these cells attain areas of about 1,000 μm2 at later stages, while
for the subepidermis they remain below 500 μm2. This finding was consistent with the subepi-
dermal division competence zone extending more distally (Fig 6B), reaching a distal limit of
about 400 μm compared with 300 μm for the epidermis. A more distal limit for the subepider-
mis has also been observed for cell cycle gene expression in wild type [10]. Moreover, at early
stages, divisions occurred throughout the subepidermis rather than being largely proximal, as
observed in the epidermis, further contributing to the smaller size of distal subepidermal cells
(S10 Fig). Despite these differences in cell size between layers, subepidermal cell areal growth
rates showed similar spatiotemporal patterns to those of the overlying epidermis, as expected
because of tissue connectivity (compare Fig 6C with Fig 1B). Consequently, correlations
between growth rate and cell size were much lower for the subepidermis than for the epidermis
(Fig 4B and 4C).
This difference in the relationship between growth and cell size in different cell layers was
confirmed through analysis of cell division competence. In the subepidermis, at early stages
there was no clear difference between mean growth rates for competent and noncompetent
cells (Fig 3J cyan, green), in contrast to what is observed in the epidermis (Fig 3I cyan, green),
while at later stages noncompetent cells had a slightly lower growth rate (Fig 3J yellow, red).
SPCH promotes division competence
To determine how the patterns of growth and division observed in spch related to those in
wild type, we imaged a line generated by crossing a spch mutant rescued by a functional SPCH
protein fusion (pSPCH:SPCH-GFP) to wild type expressing the PIN3 auxin transporter (PIN3:
PIN3-GFP), which marks cell membranes in the epidermis [23]. The resulting line allows sto-
matal lineage divisions to be discriminated from non-stomatal divisions (see below) in a SPCHcontext. At early stages, wild-type and spch leaves were not readily distinguishable based on
cell size (S12 Fig). However, by the time leaf primordia attained a width of about 150 μm, the
number and size of cells differed dramatically. Cell areas in wild type were smaller in regions
outside the midline region, compared with corresponding cells in spch (Fig 7A). Moreover,
cell divisions in wild type were observed throughout the lamina that was amenable to tracking
(Fig 7B, 0–12 h), rather than being largely proximal. Divisions were observed over the entire
Coordination of cell division and growth during organ morphogenesis
PLOS Biology | https://doi.org/10.1371/journal.pbio.2005952 November 1, 2018 10 / 48

Fig 5. Subepidermal and epidermal cells in a spch leaf. (A) Projections of the subepidermal layer, imaged approximately every 24 h
over 4 d (0–96 h). Cell divisions and growth for the epidermal layer of this leaf are shown in S3 Fig. Leaf widths (left to right) are 0.17,
0.27, 0.39, 0.50, and 0.58 mm. A patch of cells was tracked between intervals (cells coloured red). (B) Enlargement of the patch of cells
in (A) (red outline). (C) Cells outlined in (B), showing individual cells (filled pink, outlined red) and vertices around some air spaces
(coloured dots, also shown in F). (D) Enlargement of cells located in the black box of C, showing air spaces (white, examples
Coordination of cell division and growth during organ morphogenesis
PLOS Biology | https://doi.org/10.1371/journal.pbio.2005952 November 1, 2018 11 / 48

lamina for subsequent time intervals, including regions distal to 300 μm (Fig 7B, 12–57 h).
These results indicate that SPCH can confer division competence in epidermal cells outside
the proximal zone observed in spch mutants.
SPCH acts autonomously to reduce the cell area at which cells execute
division
To further clarify how SPCH influences cell division, we used SPCH-GFP signal to classify
wild-type cells into two types: (1) Stomatal lineage divisions, which include both amplifying
divisions (cells express SPCH strongly around the time of division and retain expression in
one of the daughter cells) (S1 Video, orange/yellow in Fig 7C) and guard mother cell divisions
(SPCH expression is bright and diffuse during the first hours of the cycle, transiently switched
on around time of division, and then switched off in both daughters). (2) Non-stomatal divi-
sions, in which SPCH expression is much weaker, or only lasts <2 h, and switches off in both
daughter cells (S2 Video, light/dark green in Fig 7C).
If cells with inactive SPCH behave in a similar way in wild-type or spch mutant contexts, we
would expect non-stomatal divisions to show similar properties to divisions in the spchmutant. In the first time interval, non-stomatal divisions (green) were observed within the
proximal 150 μm (Fig 7C, 0–12 h), similar to the extent of the competence zone in spch (Fig
1A, 0–14h). The zone of non-stomatal divisions then extended to about 250 μm and became
restricted to the midline region. After leaf width was greater than 0.45 mm, we did not observe
further non-stomatal divisions in the midline region, similar to the situation in spch leaves at a
comparable width (Fig 1A, 58-74h, 0.48 mm). These results suggest that similar dynamics
occur in the non-stomatal lineages of wild type and the spch mutant.
To determine how SPCH modulates division, we analysed stomatal and non-stomatal divi-
sions in the lamina. Considerable variation was observed for both the area at which cells divide
(25–400 μm2) and cell cycle duration (8–50 h) (S13 Fig). The mean area at which cells execute
division was greater for non-stomatal divisions (about 165 ± 28 μm2 [1.96 × standard error])
than stomatal divisions (about 80 ± 6 μm2) (S13 Fig). Similarly, cell cycle durations were longer
for non-stomatal divisions (about 25 ± 3 h) compared with stomatal divisions (about 18 ± 1 h).
These results suggest that in addition to conferring division competence, SPCH acts cell auton-
omously to promote division at smaller cell sizes and/or for shorter cell cycle durations.
Wild type and spch can grow at similar rates despite different division
patterns
Given the alteration in cell sizes and division patterns in wild type compared to spch, we won-
dered if these may reflect alterations in growth rates. When grown on agar plates, spch mutant
leaves grow more slowly than wild-type leaves (S14A Fig). The slower growth of spch could
reflect physiological limitations caused by the lack of stomata, or an effect of cell size on
growth—larger cells in spch cause a slowing of growth. However, the tracking data and cell size
analysis of spch and wild type described above were carried out on plants grown in a bio-imag-
ing chamber in which nutrients were continually circulated around the leaves. Growth rates
for wild type and spch leaves grown in these conditions were comparable for much of early
development, and similar to those observed for wild type on plates (compare Fig 7D with Fig
highlighted with black arrows). (E) Epidermal cells adjacent to the subepidermal patch (B). (F) Outlines of epidermal cells (blue) with
vertices of subepidermal cells (coloured spots, also shown in C). Scale bars for A, B, C, E, F = 50 μm; scale bar for D = 10 μm. See also
S8 Fig and S9 Fig. Source data are available from https://figshare.com/s/b14c8e6cb1fc5135dd87. spch, speechless.
https://doi.org/10.1371/journal.pbio.2005952.g005
Coordination of cell division and growth during organ morphogenesis
PLOS Biology | https://doi.org/10.1371/journal.pbio.2005952 November 1, 2018 12 / 48

Fig 6. Dynamics of cell division and growth in the spch subepidermis. Cells amenable to tracking in the subepidermal layer of the spch leaf shown in Fig 1. Data
shown on first time point (underlined) for each tracking interval. (A) Cell areas (heat map). (B) Cells that were competent to divide (green) and either executed
Coordination of cell division and growth during organ morphogenesis
PLOS Biology | https://doi.org/10.1371/journal.pbio.2005952 November 1, 2018 13 / 48

1B, S14 Fig). These results suggest that the reduced growth rates of spch compared with wild
type at early stages on plates likely reflect physiological impairment caused by a lack of stomata
rather than differences in cell size. As a further test of this hypothesis, we grew fama (basic
helix-loop-helix transcription factor bHLH097) mutants, as these lack stomata but still
undergo many stomatal lineage divisions [27]. We found that fama mutants attained a similar
size to spch mutants on plates, consistent with the lack of stomata being the cause of reduced
growth in these conditions (S14 Fig).
Plots of cell area against growth rates of tracked leaves grown in the chamber showed that,
for similar growth rates, cells were about three times smaller in wild type compared with spch(compare Fig 4A with Fig 4B). Thus, the effects of SPCH on division can be uncoupled from
effects on growth rate, at least at early stages of development.
At later stages (after leaves were about 1 mm wide), spch growth in the bio-imaging cham-
ber slowed down compared with wild type, and leaves attained a smaller final size. This later
difference in growth rate might be explained by physiological impairment of spch because of
the lack of stomata, and/or by feedback of cell size on growth rates. This change in later behav-
iour may reflect the major developmental and transcriptional transition that occurs after cell
proliferation ceases [9].
An integrated model of growth and division
The above results reveal that patterns of growth rate, cell division, and cell size and shape
exhibit several features in spch: (1) a proximal corridor of cell division competence, with an
approximately fixed distal limit relative to the petiole-lamina boundary; (2) the distal limit is
greater for subepidermal (400 μm) than epidermal tissue (300 μm); (3) a further proximal
restriction of division competence in the epidermis at early stages that extends with growth
until the distal limit of the corridor (300 μm) is reached; (4) larger and narrower cells in the
proximal midline region of the epidermis; (5) a proximodistal gradient in cell size in the epi-
dermal lamina; (6) a negative correlation between cell size and growth rate that is stronger in
the epidermis than subepidermis; (7) variation in both the size at which cells divide and cell
cycle duration along both the proximodistal and mediolateral axes; and (8) variation in growth
rates parallel or perpendicular to the leaf midline. In wild-type plants, these patterns are fur-
ther modulated by the expression of SPCH, which leads to division execution at smaller cell
sizes and extension of competence, without affecting growth rates at early stages. Thus, growth
and division rates exhibit different relations in adjacent cell layers, even in spch, in which epi-
dermal-specific stomatal lineages are eliminated, and division patterns can differ between
genotypes (wild type and spch) without an associated change in growth rates.
These observations argue against spatiotemporal regulators acting solely on the execution
of division, which then influences growth, as this would be expected to give conserved rela-
tions between division and growth. For the same reason, they argue against a single-point-of-
control model in which spatiotemporal regulators act solely on growth, which then secondarily
influences division. Instead, they suggest dual control, with spatiotemporal regulators acting
on both growth and division components. With dual control, growth and division may still
interact through cross-dependencies, but spatiotemporal regulation does not operate exclu-
sively on one or the other.
division during the interval (light green) or divided in a later interval (dark green). Cells that did not divide (black), intercellular air spaces (white). (C) Cellular
areal growth rates (heat map). Leaf outline indicated by dotted black line. The petiole-lamina boundary was defined as described in Fig 1. Grey boxes are aligned to
the petiole-lamina boundaries and extend to 150 or 300 μm. Black arrows indicate the distal boundary of the epidermal zone of division (as shown in Fig 1). Scale
bar = 100 μm. See also S10 Fig and S11 Fig. Source data are available from https://figshare.com/s/b14c8e6cb1fc5135dd87. spch, speechless.
https://doi.org/10.1371/journal.pbio.2005952.g006
Coordination of cell division and growth during organ morphogenesis
PLOS Biology | https://doi.org/10.1371/journal.pbio.2005952 November 1, 2018 14 / 48

Coordination of cell division and growth during organ morphogenesis
PLOS Biology | https://doi.org/10.1371/journal.pbio.2005952 November 1, 2018 15 / 48

To determine how a hypothesis based on dual control may account for all the observations,
we used computational modelling. We focussed on the epidermal and subepidermal layers of
the spch mutant, as these lack the complications of stomatal lineages. For simplicity and clarity,
spatiotemporal control was channelled through a limited set of components for growth and
division (Fig 8A). There were two components for growth under spatiotemporal control: spec-
ified growth rates parallel and perpendicular to a proximodistal polarity field (Kpar and Kper,
respectively) [16]. Together with mechanical constraints of tissue connectivity, these specified
growth components lead to a pattern of resultant growth and organ shape change [28]. There
were two components for cell division under spatiotemporal control: competence to divide
(CDIV), and a threshold area for division execution that varies around a mean (Ā). Control-
ling division execution by a threshold cell size (Ā) introduces a cross-dependency between
growth and division, as cells need to grow to attain the local threshold size before they can
divide. The cross-dependency is indicated by the cyan arrow in Fig 8A, feeding information
back from cell size (which depends on both growth and division) to division. An alternative to
using Ā as a component of division-control might be to use a mean cell cycle duration thresh-
old. However, this would bring in an expected correlation between high growth rates and large
cell sizes (for a given cell cycle duration, a faster-growing cell will become larger before cycle
completion), which is the opposite trend of what is observed.
Spatiotemporal regulators of growth and division components can be of two types: those
that become deformed together with the tissue as it grows (fixed to the tissue) and those that
maintain their pattern to some extent despite deformation of the tissue by growth (requiring
mobile or diffusible factors) [28]. In the previously published growth model, regulatory factors
were assumed, for simplicity, to deform with the tissue as it grows [16]. These factors com-
prised a graded proximodistal factor (PGRAD), a mediolateral factor (MID), a factor distin-
guishing lamina from petiole (LAM), and a timing factor (LATE) (S15A and S15B Fig).
However, such factors cannot readily account for domains with limits that remain at a con-
stant distance from the petiole-lamina boundary, such as the observed corridors for division
competence. This is because the boundary of a domain that is fixed to the tissue will extend
with the tissue as it grows. We therefore introduced a mobile factor, proximal mobile factor
(PMF), that was not fixed to the tissue to account for these behaviours. This motivation is simi-
lar to that employed by others [11–13]. PMF was generated at the petiole-lamina boundary
and with appropriate diffusion and decay coefficients such that PMF initially filled the primor-
dium and then showed a graded distribution as the primordium grew larger, maintaining a
high concentration in the proximal region and decreasing towards the leaf tip (S15C and S15D
Fig). This profile was maintained despite further growth, allowing thresholds to be used to
define domains with relatively invariant distal limits. Further details of the growth model are
given in Materials and methods, and the resultant growth rates are shown in S16 Fig (compare
with Fig 1B and 1D).
Fig 7. Dynamics of cell division and growth in the wild-type epidermis. (A) Cell areas (heat map) of wild-type (left) and spch(right) leaves at similar developmental stages. (B-D) Cells amenable to tracking from time-lapse imaging of a wild-type leaf
(expressing pSPCH:SPCH-GFP, not shown) at approximately 1-h intervals over 2.5 d (0–57 h, last time point in series not shown).
Data are visualised over about 12-h intervals and shown on first time point (underlined) for each interval. Leaf widths for first time
point (left to right) are 0.17, 0.23, 0.28, 0.39, and 0.42 mm. (B) Cells amenable to tracking that were competent to divide (green) and
either executed division during the interval (light green) or divided in a later interval (dark green). Cells that did not divide (black).
(C) Non-stomatal divisions coloured as for (B). Stomatal lineage divisions that executed division during the interval (yellow) or
divided in a later interval (orange). (D) Cellular areal growth rates (heat map) for each tracking interval. Leaf outline indicated by
dotted black line. The petiole-lamina boundary was defined as described in Fig 1. Grey boxes are aligned to the petiole-lamina
boundary and extend to 150 or 300 μm. Cells within the magenta lines were assigned as being destined to form the midline
according to their position and shape in the final image. Scale bars = 100 μm. See also S12 Fig, S13 Fig, and S14 Fig. Source data are
available from https://figshare.com/s/b14c8e6cb1fc5135dd87. GFP, green fluorescent protein; spch, speechless.
https://doi.org/10.1371/journal.pbio.2005952.g007
Coordination of cell division and growth during organ morphogenesis
PLOS Biology | https://doi.org/10.1371/journal.pbio.2005952 November 1, 2018 16 / 48

Fig 8. Model regulatory network and output. (A) Schematic showing how spatiotemporal regulatory factors
(PGRAD, MID, LATE, LAM, PMF) act on components of specified growth (Kpar, Kper) and cell division (CDIV and Ā)
Coordination of cell division and growth during organ morphogenesis
PLOS Biology | https://doi.org/10.1371/journal.pbio.2005952 November 1, 2018 17 / 48

Cells were incorporated by superimposing polygons on the initial tissue or canvas (S15A
Fig, right). The sizes and geometries of these virtual cells (v-cells) were based on cells observed
at corresponding stages in confocal images of leaf primordia [16]. The vertices of the v-cells
were anchored to the canvas and displaced with it during growth. Cells divided according to
Errera’s rule: the shortest wall passing through the centre of the v-cell [29], with noise in posi-
tioning of this wall incorporated to capture variability. V-cells were competent to divide if they
expressed factor CDIV, and executed division when reaching a mean cell target area, Ā. As the
observed area at time of division was not invariant (Fig 2F), we assumed the threshold area for
division varied according to a standard deviation of σ = 0.2Ā around the mean. CDIV and Āare the two core components of division that are under the control of spatiotemporal regula-
tors in the model (Fig 8A, 8C and 8D). Variation between epidermal and subepidermal pat-
terns reflects different interactions controlling cell division (interactions colour coded red and
blue, respectively, in Fig 8C and 8D).
We first modelled cell divisions in the subepidermis, as this layer shows a more uniform
pattern of cell sizes (Fig 3B and Fig 6A). Formation of intercellular spaces was simulated by
replacing a random selection of cell vertices with small empty equilateral triangles, which grew
at a rate of 2.5% h−1, an average estimated from the tracking data. To account for the distribu-
tion of divisions and cell sizes, we assumed that v-cells were competent to divide (express
CDIV) where PMF was above a threshold value. This value resulted in the competence zone
extending to a distal limit of about 400 μm. To account for the proximodistal pattern of cell
areas in the lamina (Fig 3B and Fig 6A) and larger cells in the midline (Fig 3D and Fig 6A), we
assumed that Ā was modulated by the levels of PMF, PGRAD, and MID (Fig 8D, black and
blue). These interactions gave a pattern of average v-cell areas and division competence that
broadly matched those observed (compare Fig 8E and 8F with Fig 6A and 6B, and Fig 3F and
3H with 3B and 3D, S3 Video).
For the epidermis, the zone of division competence was initially in the proximal region of
the primordium and then extended with the tissue as it grew (Fig 1A). We therefore hypothe-
sised that in addition to division being promoted by PMF, there was a further requirement for
a proximal factor that extended with the tissue as it grew. We used PGRAD to achieve this
additional level of control, assuming CDIV expression requires PGRAD to be above a thresh-
old level (Fig 8C, red and black). V-cells with PGRAD below this threshold were not compe-
tent to divide, even in the presence of high PMF. Thus, at early stages, when PMF was high
throughout the primordium, the PGRAD requirement restricted competence to the proximal
region of the leaf (Fig 8H). At later stages, as the PGRAD domain above the threshold extended
beyond 300 μm, PMF became limiting, preventing CDIV from extending beyond about 300
to influence resultant growth, cell division, cell size, and organ shape and size. The magenta arrow shows an optional
feedback on growth rate from cell size. The cyan arrow shows feedback from cell size to division. (B-D) Model
regulatory networks for early stages of leaf development (124–182 h). (B) Growth regulatory network (KRN).
Epidermal-specific interactions are denoted with red lines, subepidermal-specific interactions with light blue, and
interactions common to both models with black. (C) The regulatory network for CDIV. (D) The division threshold (Ā)
regulatory network. (E-H) Model output leaves (left to right) at 115, 132, 140, 147, 156, 164, and 178 h for the (E-F)
subepidermis model and (G-H) epidermis model. (E) Area and pattern of v-cells (heat map) with intercellular spaces
(white). (F) v-cells that were competent to divide (green) and either executed division during the interval (light green)
or divided in a later interval (dark green). Cells that did not divide (white). (G) Area and pattern of v-cells (heat map).
(H) v-cells that were competent to divide (green) and either executed division during the interval (light green) or
divided in a later interval (dark green). Cells that did not divide (white). Grey boxes are aligned to the petiole-lamina
boundary and extend to 150 and 300 μm. Scale bar = 100 μm. See also S15 Fig and S16 Fig. Source data are available
from https://figshare.com/s/b14c8e6cb1fc5135dd87. Ā, threshold cell area for division execution; CDIV, competence
to divide; Kpar, specified growth rate parallel to polarity axis; Kper, specified growth rate perpendicular to polarity axis;
KRN, growth regulatory network; LAM, a factor distinguishing lamina from petiole; LATE, a timing factor; MID, a
mediolateral factor; PGRAD, a graded proximodistal factor; PMF, proximal mobile factor; v-cell, virtual cell.
https://doi.org/10.1371/journal.pbio.2005952.g008
Coordination of cell division and growth during organ morphogenesis
PLOS Biology | https://doi.org/10.1371/journal.pbio.2005952 November 1, 2018 18 / 48
μm. To account for the earlier arrest of divisions in the midline region (Fig 1A), CDIV was
inhibited by MID when LATE reached a threshold value (Fig 8C, red). As well as CDIV being
regulated, the spatiotemporal pattern of Ā was modulated by factors MID and PMF (Fig 8D
black).
With these assumptions, the resulting pattern of epidermal divisions and v-cell sizes
broadly matched those observed experimentally for the epidermis (compare Fig 8G with Fig
1E, S4 Video). In particular, the model accounted for the observed increases in cells sizes with
distance from the petiole-lamina boundary, which arise because of the proximal restrictions in
competence (compare Fig 3E and 3G with Fig 3A and 3C). The model also accounted for the
elongated cell shapes observed in the midline region, which arise through the arrest of division
combined with low specified growth rate perpendicular to the polarity. Moreover, the negative
correlations between growth rates and cell size, not used in developing the model, were similar
to those observed experimentally (Fig 4B and 4D). These correlations arise because both
growth and division are promoted in proximal regions.
We also measured the cell topology generated by the epidermal model. It has previously
been shown that the frequency of six-sided neighbours observed experimentally for the spchleaf epidermis is very low compared with that for other plant and animal tissues and also with
that generated by a previous implementation of Errera’s rule (S17 Fig) [30]. The topological
distribution generated by the epidermal leaf model gave a six-sided frequency similar to that
observed experimentally, falling two standard deviations away from the mean and thus close
to a reasonable fit (S17 Fig). The increased similarity of the model output to the spch leaf epi-
dermal topology, compared with a previous implementation of Errera’s rule [31], may reflect
the incorporation of anisotropic growth in our model. If polarity is removed from our model
to render specified growth as isotropic (while preserving local areal growth rates), the fre-
quency of six-sided neighbours increases, becoming more like the empirical data for the shoot
apical meristem (S17 Fig). A further likely contribution to the lowering of six-sided neighbour
frequency generated by our model is the use of random noise to displace the positioning of
new walls, rather than positioning them always to pass precisely through the cell centre. Thus,
our analysis shows how incorporating more realistic growth patterns can be valuable in evalu-
ating division rules.
Taken together, the simulations show that the pattern of growth and division can be
broadly accounted for by factors modulating specified growth rates (Kpar and Kper) and cell
division components (CDIV and Ā). Variation between epidermal and subepidermal patterns
generated by the models reflects different interactions controlling cell division (Fig 8C and
8D).
Modulation of model parameters leads to variation in leaf size, cell
number, and cell size
Many mutants have been described that influence cell division and/or leaf size [32,33]. To gain
a better understanding of such mutants, we explored how changes in key parameters in our
model may alter leaf size, cell size, and cell number. As leaf size is normally measured at matu-
rity, we first extended our analysis to later stages of development. Tracking spch to later stages
of development showed that overall growth rates declined, on average, while remaining rela-
tively high towards the proximal region of the lamina (S4B Fig), consistent with a previous
study [18]. Cell divisions were not observed after the leaf reached a width of about 0.9 mm
(S4A Fig, 96h). To capture arrest of division, we assumed that CDIV was switched off through-
out the leaf after LATE reached a threshold value.
Coordination of cell division and growth during organ morphogenesis
PLOS Biology | https://doi.org/10.1371/journal.pbio.2005952 November 1, 2018 19 / 48

In the previously published growth model [16], the decline of growth rates with develop-
mental time was captured through an inhibitory effect of LATE on growth. To extend the
model to later stages and bring about eventual arrest of growth, we assumed that LATE
increased exponentially after 189 h and inhibited both Kper and Kpar thereafter. Parameters for
growth inhibition were adjusted to give a final leaf width of about 3 mm, which was the final
size attained for leaf 1 in spch mutants in the bio-imaging chamber. The v-cell sizes generated
by the model broadly matched the patterns observed (Fig 9A and 9B, S5 Video). As epidermal
divisions have ceased by the time the spch leaf is about 1 mm wide, all the growth depicted in
Fig 9A and 9B occurs in the absence of division (i.e., cell expansion). However, a notable dis-
crepancy between the model output and the experimental data was the generation of distal v-
cells that exceeded the values observed (about 20,000 μm2 compared with about 10,000 μm2).
A similar result was obtained if the model was tuned to match not only the final leaf width but
also the reduced growth rate of spch in the growth chamber at later stages (S14B and S14C
Fig). A better fit was obtained by inhibiting specified growth rates in distal regions at later
stages. This inhibition was implemented by introducing inhibitory factors with levels that
increased distally. The result was that distal v-cells remained at or below about 10,000 μm2 (Fig
9C and S6 Video). We refer to this as the limit-free model. Another way of limiting the size of
distal v-cells was to introduce feedback from cell size to growth, so that the specified growth
rate decreased as v-cells approached upper size limits (Fig 9J and S7 Video). This feedback cor-
responds to introducing a further interaction in the regulatory pathway (Fig 8A, magenta). We
refer to this as the limiting cell size model.
We varied parameters in both the limit-free model (Fig 9C) and the limiting cell size model
(Fig 9J) to see how the parameters influence cell number, cell size, and final leaf size. Increasing
Ā by a constant amount did not change leaf size with the limit-free model but resulted in
fewer, larger v-cells (Fig 9D). Reducing Ā resulted in a leaf with more v-cells that were, on
average, smaller but did not change leaf size (Fig 9E). With the limiting cell size model,
increasing or decreasing Ā had similar effects as with the limit-free model but also slightly
reduced or increased leaf size (Fig 9K and 9L). Thus, it is possible to affect cell number and
size without a major effect on organ size or growth.
To investigate how changing growth parameters influences cell numbers and areas, we
reduced the specified growth rates (values for Kpar and Kper) by 5%. For the limit-free model
this resulted in a smaller leaf with both smaller and fewer v-cells (Fig 9F). There were fewer
cells because they grew more slowly and thus took longer to reach Ā, and cells were smaller
because they grew at a slower rate after they had ceased dividing. Conversely, increasing speci-
fied growth rate by 5% led to larger leaves, with more v-cells that were, on average, larger (Fig
9G). The model with limiting cell size gave similar results (Fig 9M and 9N). Thus, modulating
growth rates has consequences on organ size, cell size, and cell number. This may account for
why many mutants with smaller organs have both fewer cells and smaller cells [34].
To examine the effect of changes in developmental timing, we altered the onset of LATE.
Moving the onset earlier for the limit-free model led to smaller leaves because of the earlier
decline in growth rate (Fig 9H). There were fewer v-cells because of the earlier arrest of divi-
sion, and there was also a slight reduction in v-cell size. Delaying the onset of LATE had the
opposite effect of increasing leaf size, cell number, and cell size (Fig 9I). The limiting cell size
model gave similar results (Fig 9O and 9P). Thus, changes in developmental timing affected
organ size and cell number, with a lesser effect on cell size. This is because changing LATE
shifts both the onset of the growth rate decline and the time of division arrest (inactivation of
CDIV).
A further application of the model is to explore the effects of the environment on leaf
growth and division. To illustrate this possibility, we analysed data for the spch mutant grown
Coordination of cell division and growth during organ morphogenesis
PLOS Biology | https://doi.org/10.1371/journal.pbio.2005952 November 1, 2018 20 / 48

Coordination of cell division and growth during organ morphogenesis
PLOS Biology | https://doi.org/10.1371/journal.pbio.2005952 November 1, 2018 21 / 48

on plates, which exhibits a greatly reduced growth rate compared with growth in the chamber
(S14A and S14B Fig). A prediction of the model is that cell divisions should cease when the
leaf is at a smaller size (i.e., the leaf will have grown less by the time the threshold value of
LATE for division arrest is reached). In addition, as spch plants grown on plates have impaired
general physiology, the rate of developmental progression (physiological time) may also be slo-
wed down. We simulated these effects by modifying the model parameters such that the overall
growth rate was reduced by 40% and physiological time reduced by 45%. This gave a growth
curve matching that observed for spch grown on plates (blue line, S14A Fig). As expected, this
model takes longer to attain a given leaf width (e.g., 0.5 mm) than the original model. The
resulting cell areas are larger at the 0.5-mm leaf-width stage, particularly in proximal regions,
because divisions arrest when the leaf is at a smaller size, so all subsequent cell growth occurs
in the absence of division (Fig 10A and 10B and S18 Fig).
To test this prediction of enlarged cell size, we compared leaves when they had attained a
width of about 0.5 mm (Fig 10C and 10D), which is just before divisions cease for spch grown
in the chamber (Fig 1). Cells in the proximal lamina of the chamber-grown leaves were rela-
tively small (mean = 123.3 ± 6.4 μm2 for region shown in Fig 10I), typical of dividing cells (Fig
10C and 10G); whereas those of the plate-grown leaves were larger (mean = 199.8 ± 17.3 μm2
for region shown in Fig 10J), indicating division arrest (Fig 10D and 10H and S18 Fig). Proxi-
mal lamina cells in plate-grown leaves also showed greater shape complexity, typical of pave-
ment cells that have ceased division (Fig 10K–10N and S18 Fig). These results suggest that cell
divisions in much of the lamina cease when the leaf is smaller for plate-grown compared to
chamber-grown leaves, as predicted by the model. The sizes of midline cells for plate-grown
leaves predicted by the model are larger than those observed (compare Fig 10B with Fig 10H),
indicating that withdrawal of competence from this region, as implemented in the model, may
be activated too early. Conversely, the most proximal lamina cells in the plate-grown leaves
(dark blue cells, Fig 10H) are smaller than predicted (Fig 10B), suggesting that the uniform
arrest of division when LATE reaches a threshold value is an oversimplification.
Discussion
Growth rates, cell division, and cell shapes and sizes in the growing first leaf of Arabidopsisexhibit complex spatiotemporal patterns. The main features observed in spch are (1) a proxi-
mal corridor of division competence with an approximately fixed distal limit; (2) the distal
limit is greater for subepidermal compared to epidermal tissue; (3) a further proximal restric-
tion of division competence in the epidermis at early stages that extends with growth until the
distal limit is reached; (4) a proximodistal gradient in cell size in the epidermal lamina; (5)
larger and narrower cells in the proximal midline region of the epidermis; (6) a negative
Fig 9. Cell areas, numbers, and leaf sizes at later developmental stages. (A) Cell areas for the spch leaf at later stages
(earlier stages shown in S4 Fig). Leaf widths (left to right) are 1.1, 1.4, 1.8, 2.1, and 2.8 mm. Leaf outline is indicated by
a dotted black line. Grey boxes are aligned to the petiole-lamina boundary and extend to 150 or 300 μm. (B) Model
output at equivalent stages to experimental data (model times 201, 219, 243, 264, and 412 h). (C-I) Limit-free spchepidermal model outputs at maturity. (C) Wild type. (D) Cell division threshold increased by 85 μm2. (E) Cell division
threshold decreased by 85 μm2. (F) Specified growth rate reduced by 5%. (G) Specified growth rate increased by 5%.
(H) LATE comes on 6 h earlier. (I) LATE comes on 6 h later. (J-P) Limiting cell size spch epidermal model outputs at
maturity. (J) Wild type. (K) Cell division threshold increased by 85 μm2. (L) Cell division threshold decreased by
85 μm2. (M) Specified growth rate reduced by 5%. (N) Specified growth increased by 5%. (O) LATE comes on 6 h
earlier. (P) LATE comes on 6 h later. Number of cells (# Cells), average cell area (μ CA) in μm2, and leaf area (Leaf A)
in mm2 are shown for each model. Percentage values for mutants show relative difference to limit-free (C) and limiting
cell size (J) wild-type models. Scale bars = 1 mm. Source data are available from https://figshare.com/s/
b14c8e6cb1fc5135dd87. # Cells, number of cells; μ CA, average cell area; LATE, a timing factor; Leaf A, leaf area; spch,
speechless.
https://doi.org/10.1371/journal.pbio.2005952.g009
Coordination of cell division and growth during organ morphogenesis
PLOS Biology | https://doi.org/10.1371/journal.pbio.2005952 November 1, 2018 22 / 48

Coordination of cell division and growth during organ morphogenesis
PLOS Biology | https://doi.org/10.1371/journal.pbio.2005952 November 1, 2018 23 / 48

correlation between cell size and growth rate that is stronger in the epidermis than in the sube-
pidermis; (7) variation in both the size at which cells divide and cell cycle duration along both
the proximodistal and mediolateral axes; (8) variation in growth rates parallel or perpendicular
to the leaf midline. In wild-type plants these patterns are further modulated by expression of
SPCH, which leads to division execution at smaller cell sizes and extension of competence,
without affecting growth rates at early stages.
The observed varying relations between growth rates and division between tissue layers and
genotypes argue against single-point-of-control models, in which spatiotemporal regulators
act solely through either division or growth. Instead, they suggest dual control, in which spa-
tiotemporal regulators act on both growth and division, with cross talk between them. We
show that a model based on dual control can broadly account for the data. In this model, spa-
tiotemporal control is channelled through two growth components (specified growth rates
parallel and perpendicular to polarity) and two division components (competence and mean
threshold size for division) (Fig 8A). The growth components reflect turgor and cell wall exten-
sibility in different orientations, and the division components reflect regulatory mechanisms
for partitioning cells. Orientation information is provided by a tissue-wide polarity field, for
which direct evidence has recently been obtained in both wild-type and spch mutants [22,35].
The polarity field may be established through a biochemical mechanism as proposed here,
likely involving tissue-level coordinated cell polarity [36]. Alternatively, information could be
relayed through mechanical stresses [20,22,37]. The resulting patterns of growth and division
determine the distribution of cell sizes and shapes and organ shape. The implications, limita-
tions, and questions raised by this model are discussed below.
Growth, division, and cell size
Execution of leaf cell division does not occur at an unvarying cell size, even within a given
region and developmental stage. Similar variability has been observed for cell divisions in api-
cal meristems [21,38]. Variability may reflect experimental errors in estimation of cell size, sto-
chasticity in the process of division, and/or mechanisms other than geometric size sensing that
influence division execution (e.g., factors such as vacuole size, which is not monitored in our
analysis). We model such variability by explicitly adding variation around a mean threshold
size needed for division, Ā. Controlling division execution by a threshold cell size (Ā) intro-
duces a cross-dependency between growth and division, as cells need to grow to attain the
local threshold size before they can divide. An alternative to using Ā would be to use a mean
cell cycle duration threshold. However, this would bring in an expected correlation between
Fig 10. Comparison of spch epidermis grown in a bio-imaging chamber and on plates. (A, B) Model outputs when
leaf has grown to a width of about 0.5 mm (see horizontal line in S14A Fig). (A) Epidermal model used to generate Fig
8G, corresponding to growth in a chamber. (B) Output from epidermal model tuned to match spch growth on plates
(by slowing growth by 40% and physiological time by 45%). (C) Leaf grown in a bio-imaging chamber when width has
attained 0.46 mm (8DAS). (D) Leaf grown on plates when width has attained 0.48 mm (13 DAS). (E) Enlargement of
region indicated by magenta square in C. (F) Enlargement of region indicated by orange square in D. (G,H)
Segmented cells from leaves shown in C,D. Cell area colour coded as heat map for A,B. (I) Enlargement of segmented
region indicated by magenta square in G; average cell area 123.3 ± 6.4 μm2 (n = 184). All cells with their centroid
falling within the square were taken into account. (J) Enlargement of segmented region indicated by orange square in
H; average cell area 199.8 ± 17.3 μm2 (n = 111). (K,L) Cell complexity from leaves shown in C,D, quantified through
the CD of the LOCO-EFA components of each individual cell’s shape, normalised for cell area (see Materials and
methods). Heat map range corresponds to zero for perfect circular or elliptical shapes, ranging to 5 as more
LOCO-EFA harmonics are needed to describe the shape (dimensionless measure). (M) Enlargement of region
indicated by magenta square in K. (N) Enlargement of region indicated by orange square in L. Scale bar = 100 μm.
Source data are available from https://figshare.com/s/b14c8e6cb1fc5135dd87. CD, cumulative difference; DAS, days
after stratification; LOCO-EFA, Lobe-Contribution Elliptic Fourier Analysis; spch, speechless.
https://doi.org/10.1371/journal.pbio.2005952.g010
Coordination of cell division and growth during organ morphogenesis
PLOS Biology | https://doi.org/10.1371/journal.pbio.2005952 November 1, 2018 24 / 48

high growth rates and large cell sizes (for a given cell cycle duration, faster growing cells will
become larger before cycle completion), which is the opposite of the correlation observed.
Role of tissue layers in growth
In contrast to the epidermal layer, intercellular spaces are observed in the subepidermis of
wild-type and spch from early stages. The spaces may originate, in part, from a reduction in
adhesion between subepidermal cells, allowing cell walls to become detached from each other.
In addition to reduced adhesion, a further requirement for intercellular spaces is that cells are
not too tightly packed against each other. Packing may be reduced if subepidermal cells have
lower specified growth rates than the epidermis. Subepidermal cells could move away or be
pulled apart from each other, as epidermal growth creates more space than they can fill
through their own expansive growth. According to this view, the epidermis rather than the
subepidermis provides the expansive force driving planar growth, in contrast to what has been
described for other tissues, such as the stem [39]. A primary role for the epidermis in driving
planar growth is also consistent with the observed developmental effects of epidermal gene
activity [40]. However, it is possible that the subepidermis provides a restraint on growth,
which could account for the effect of subepidermal tissue on leaf shape in some chimeras [41].
Spatiotemporal control
Spatiotemporal control of growth and division in the model of spch is established through
combinatorial interactions between five factors: PGRAD, MID, LAM, LATE, and a mobile fac-
tor that allows proximal corridors with fixed distal limits to be established (PMF). PMF is simi-
lar to the previously proposed mobile growth factor [11], except that the effect of PMF on
division does not have a consequential effect on growth. To account for the difference in distal
limits of the division corridor between cell layers, PMF action extends more distally in the sub-
epidermis compared with the epidermis, either because the competence threshold requirement
for PMF is lower in the subepidermal layer, or because PMF levels are higher. A candidate fac-
tor for coordinating proliferation between layers is the transcriptional coactivator ANGUSTI-FOLIA3 [42,43]. Candidates for LAM are LEAFY PETIOLE [44] and members of the YABBYgene family [45], which are expressed in the lamina and promote lateral outgrowth.
A fixed corridor for division has also been described for other systems such as the root,
where a division zone is maintiained at a distance of about 300–500 μm from the quiescent
centre in Arabidopsis [46]. In contrast to the leaf, regions of highest growth rate in the root are
outside the cell division zone, providing further support for a dual control mechanism. The
spatial extent of the division zone in roots is maintained through auxin-cytokinin interactions
[47]. Auxin-cytokinin interactions also influence leaf growth and division: temporal arrest of
leaf growth depends on auxin-induced cytokinin breakdown [48]; increased cytokinin degra-
dation in leaf primordia can accelerate termination of cell proliferation [49]; and accumulation
of specific cytokinins may promote indeterminate leaf growth [50]. However, it is currently
unclear whether auxin, cytokinin, and/or other molecular players underlie PMF.
A limitation of our model is that it does not consider modulation of growth or division
near the leaf margin, creating serrations [51,52]. Serrations have previously been modelled by
displacement of the leaf outline without modelling the tissue growth explicitly [52,53]. In
terms of the modelling framework described here, they may reflect alterations in polarity and/
or growth rates of tissue, and accounting for these behaviours would require the introduction
of additional factors into the model, as illustrated by generation of winglike outgrowths in bar-
ley lemma mutants [54].
Coordination of cell division and growth during organ morphogenesis
PLOS Biology | https://doi.org/10.1371/journal.pbio.2005952 November 1, 2018 25 / 48

To account for the further proximal restriction of competence in the epidermis at early
stages, PGRAD limits divisions in the epidermis until the distal limit set by PMF is reached.
PMF also interacts with MID in the epidermis, accounting for larger cells in the midline
region. The elongated shape of proximal midline cells is a result of early arrest of division com-
bined with low specified growth rates perpendicular to the proximodistal polarity.
Divisions in the wild-type epidermis are also influenced by SPCH. We show that SPCH acts
autonomously in the epidermis to confer competence, and has little impact in the proximal
midline region, where its activity has previously been shown to be low [55]. The autonomous
effect of SPCH on division competence contrasts with its nonautonomous effects at later stages
of development, with regard to layer thickness and photosynthetic capacity [56]. This differ-
ence in autonomy may reflect primary and secondary consequences of SPCH activity. SPCHalso promotes asymmetric divisions and divisions at smaller cell sizes or shorter cell cycle
durations. The complex pattern of divisions in wild type epidermis observed here and else-
where [9] would thus reflect the combined effect of PMF, PGRAD, MID, and SPCH, although
the molecular basis of these interactions remains to be established.
In agreement with [24], we observed that mean cell cycle duration is relatively constant for
wild type (about 20 h). However, cell cycle duration varies from 8 h to 50 h around the mean.
Some of this variation depends on whether SPCH is active: epidermal cells that do not show
high SPCH activity divide at a larger cell size and longer cell cycle duration. Moreover, the size
at which cells with active SPCH divide is not fixed but becomes progressively smaller with suc-
cessive divisions [23], indicating that cell cycle duration likely becomes shorter as well. Thus,
the spatiotemporal variation in cell cycle duration may be the consequence of variation in
growth rates (for a given threshold division size, cell cycle duration depends on growth rate)
and/or direct control of cell cycle length.
Leaf size, cell size, and cell number
Most small-leaf mutants have both fewer and smaller cells [34]. Such outcomes can be gener-
ated with the model by reducing specified growth rates. The leaves end up smaller because of
the lower growth rate, cells are smaller because they grow less after divisions have arrested,
and there are fewer cells because they grow more slowly and thus take longer to reach Ā. Thus,
the observation that organ size, cell size, and cell number are commonly reduced together in
mutants is a natural outcome of the model.
Change in developmental timing through factor LATE also leads to changes in leaf size,
although this is mainly reflected in changes in cell number rather than cell size. This is because
changing LATE shifts both the onset of growth rate decline and the time of division arrest
(loss of division competence). Such variation in developmental timing could underlie mutants
that change organ size with little or no effect on cell size, such as kluh and big brother [57,58].
Loss of expression of D-type cyclins leads to premature termination of cell division and
fewer cells autonomously in each layer, without a major change in leaf size [59,60]. Such fea-
tures can be captured by changing model parameters that are specific to cell division, such as
the value of Ā, in one or more layers (Fig 9D, 9E, 9K and 9L). This situation corresponds to
compensation [61–63], as change in cell number is counterbalanced by a change in cell area
(organ size is preserved). However, no dedicated mechanism for counterbalancing is needed,
as division is under separate spatiotemporal control from growth in our model.
Although execution of division does not have an immediate effect on growth rates in our
model, we explore the possibility of feedback from division on growth at later developmental
stages. If growth slows down when cells approach an upper size limit, then cell division could
postpone the slowing down of growth by reducing cell size. Such a mechanism would lead to
Coordination of cell division and growth during organ morphogenesis
PLOS Biology | https://doi.org/10.1371/journal.pbio.2005952 November 1, 2018 26 / 48

cell division extending the duration of growth, thus increasing leaf size. Mature leaves display
an array of final cell sizes that correlate with levels of endoreduplication [64,65], suggesting
that as cells approach a size limit, endocycles are induced that allow them to surpass the limit.
If endoreduplication is impaired, these cell size limits may not be so easily overcome, leading
to smaller leaves with smaller cells [66,67]. However, the extent to which endoreduplication is
limited in wild type and thus may constrain final cell size and growth is unclear. Through
modelling, we show that it is possible to account for the data with or without feedback from
cell size on growth.
If endocycles are promoted as cells enlarge, then promoting division (e.g., by reducing Ā)
should lead to lower levels of endoreduplication (as cells will be smaller). This prediction is in
accord with the effect of overexpressing D-type cyclins, which leads to smaller cells with lower
levels of endoreduplication [68]. Conversely, inhibiting cell division (e.g., by increasing Ā)
should give larger cells and higher levels of endoreduplication, as observed with cycd3 mutants
[7]. However, if both division and the ability to endoreduplicate are impaired, cell size may
eventually feedback to inhibit growth rate, giving smaller leaves and perhaps accounting for
the phenotype of ant mutants, which have smaller organs with larger cells that do not endore-
duplicate more than wild type [7,69].
A further application of the model is to explore the effects of different environments on leaf
growth and division. As an illustration, we compared leaves of spch mutants grown in a bio-
imaging chamber (in which nutrients were continually circulated around the leaves) with
those grown on agar plates (in which growth rate is greatly reduced). Cell divisions arrested
when leaves were at a smaller size in the slow-growing conditions, as predicted by the model
in which division arrest depends on a timing mechanism (LATE). However, the growth and
cells sizes observed suggests that the timing mechanisms are not based on external time but
passage of physiological time, which may also be affected by altered growth conditions.
The model presented here identifies core components of growth and division that may be
regulated and interact to generate the spatiotemporal patterns observed. Further integrative
studies on growth and division at the subcellular, cellular, and tissue level in different geno-
types and environments should help provide a deeper understanding of the mechanisms by
which regulatory factors are established and control these core components.
Materials and methods
Plant material and growth conditions
For tracking growth of the speechless mutant, we used the previously published Arabidopsisline, spch-1, containing a fluorescently labelled plasma membrane marker [70]. To more pre-
cisely determine division execution times, we crossed the spch mutant to an Arabidopsis line
containing fluorescently labelled nuclei, HTA11-GFP [71], and PIN3:PIN3-GFP [72], which
labels plasma membranes in the epidermal layer only. For tracking growth in the wild-type
background and to distinguish cells in the stomatal lineage, we used the previously published
Arabidopsis line containing pSPCH:SPCH-GFP and PIN3:PIN3-GFP [23]. For measuring leaf
widths in the fama mutant we used the previously published line fama-1 (Ohashi-Ito and Berg-
mann, 2006).
Seeds were surface sterilised with 70% ethanol containing 0.05% Sodium Dodecyl Sulfate
(SDS) for 10 min and then rinsed with 100% ethanol. Sterilised seeds were sown on petri
dishes containing 25 mL of MS growth media {1× Murashige and Skoog salt mixture, 1% (w/
v) sucrose, 100 mg/mL inositol, 1 mg/mL thiamine, 0.5 mg/mL pyridoxin, 0.5 mg/mL nico-
tinic acid, 0.5 mg/mL MES, 0.8% (w/v) agar, pH 5.7} and kept at 4 oC in the dark for 72 h
Coordination of cell division and growth during organ morphogenesis
PLOS Biology | https://doi.org/10.1371/journal.pbio.2005952 November 1, 2018 27 / 48

(stratification). Plates were then transferred to a controlled environment room (CER) at 20 oC
in long-day conditions (16-h light/8-h dark cycles) for 5–8 d.
Time-lapse imaging
At 5–8 d after stratification, seedlings were transferred under sterile conditions into an auto-
claved optical live-imaging chamber [16,73] and continuously supplied with 1/4 strength MS
liquid growth medium, including sucrose to support growth. Time-lapse imaging was carried
out at regular intervals using a Leica SP5 Confocal microscope, a Zeiss LSM 5 EXCITER con-
focal microscope, or a Zeiss LSM 780 confocal microscope. For experiments imaged with a
high temporal resolution (intervals of 1–2 h), the chamber remained mounted on the micro-
scope stage for the duration of the experiment, with room temperature and photoperiod set to
be similar to that of the CER in which seedlings were germinated. For experiments with a lon-
ger interval between imaging (12–24 h), the chamber was returned to the CER between confo-
cal imaging. Experiments were carried out on leaf 1 within the range of 0.15–2.75 mm width.
Seedlings were positioned in the chamber such that the abaxial epidermis of the leaf was ori-
ented approximately parallel and adjacent to the coverslip, although it curved away to some
extent at the leaf margins. This curvature affected the leaf outline produced when projected
images were made from confocal image stacks. Leaf outlines (indicated by dotted lines in Fig
1, Fig 2, Fig 6, Fig 7, Fig 9, S2 Fig, S3 Fig, S4 Fig, S6 Fig, and S9 Fig) reflect projections onto the
imaging plane rather than being corrected for curvature and thus convey a shape that appears
narrower than the actual leaf outline. Some regions could not be tracked because of occlusion
by overlapping leaves (at early developmental stages) or because movement in the z-dimension
caused parts of the leaf to go out of focus. Thus, some cell lineages could not be traced all the
way back to the initial time point. Images are available from https://figshare.com/s/
b14c8e6cb1fc5135dd87.
Image processing
To facilitate cell tracking, confocal image stacks were converted into 2D projections using
either Volviewer [74] (http://cmpdartsvr3.cmp.uea.ac.uk/wiki/BanghamLab/index.php/
VolViewer) or Fiji [75]. For early stages, when the leaf could be captured in a single scan, Vol-
Viewer was used to create a projection of the leaf surface. At later stages, when leaves were
larger, multiple overlapping tiled scans were required to capture the entire leaf. In such cases,
Fiji was used to create multiple 2D projections, which were merged together using Photoshop
to create a single composite image. Leaf width was measured in 3D, when possible, using Vol-
Viewer. For later stages, leaf width was measured in 2D from merged projections using Fiji.
Projections of the subepidermal layer were created in VolViewer using the ‘Depth-Peal Shader’
lighting editor. Several projections were created for each z-stack (using different parameters to
reveal as many cells as possible in approximately the middle of the cell layer) and merged
together using Photoshop to create a composite image.
Tracking growth and divisions
Projected confocal images were used to calculate growth rates and cell areas and monitor cell
division dynamics in 2D by placing points around the vertices of individual cells using Point-Tracker, as described in [16]. A toolset (Track ‘n’ R) was created for ImageJ (https://imagej.
nih.gov/ij/) to facilitate access to ImageJ macros and offer improved visualisation of Point-Tracker data using R [76]. Track ‘n’ R was used to create leaf outlines, visualise the zone of cell
division, and analyse cell lineages and to display cell cycle duration, cell area at division execu-
tion, and growth rates (source code and detailed instructions for Track’n’R and PointTracker
Coordination of cell division and growth during organ morphogenesis
PLOS Biology | https://doi.org/10.1371/journal.pbio.2005952 November 1, 2018 28 / 48
have been deposited at https://github.com/fpantin/Track-n-R and https://figshare.com/s/
b14c8e6cb1fc5135dd87 respectively).
Graphical outputs from Track ‘n’ R were reoriented so that the leaf tip pointed upwards.
Cellular growth rates over a time interval t1–t2 were calculated according to ln(At2−At1)/(t2
−t1), where At1 is cell area at t1 and At2 is cell area at t2. If a cell divided in this interval, At2
was the area of the clone it gave rise to at time t2.
For each tracking experiment, the first row of nondividing cells was identified in the first
time point and coloured orange by hand using Photoshop. These cells were identified in each
subsequent image and also coloured orange (Fig 1A and S3 Fig and S4 Fig). The approximate
location of the petiole-lamina boundary was identified based on the shape of the leaf outline in
the last image available for each dataset. A cell was identified in the midline of this image, in
line with the base of the leaf lamina. This cell was then traced back to through each image to its
earliest ancestor in the first time point, thus identifying the location of the petiole-lamina
boundary even when the leaf shape was less developed. Cells were identified as part of the mid-
line region based on appearance (shape and location) in the last image of each tracking experi-
ment. The lineage of these cells were traced back to the beginning of the experiment (S2 Fig).
Cells that did not form part of the midline region were classed as lamina cells.
Analysis of cell size using 3D segmentation
For 3D segmentation and volume measurements, confocal image stacks were processed using
Python scripts, as described [17], with additional scripts added to measure the external sur-
faces of epidermal cells in 3D and the corresponding 2D projections (source code and detailed
instructions have been deposited at https://figshare.com/s/b14c8e6cb1fc5135dd87). Fiji mac-
ros [75] using the 3D Viewer and Point Picker plugins were used to visualise images and select
cells during manual quality control.
For the epidermis, plotting projected segmentation-based area against vertex-based area
gave a good linear fit (R2 = 0.87) with a gradient of about 1, showing that vertex-based cell area
is a good proxy for projected cell area (S5A Fig). Areas extracted from the cell surface plotted
against vertex-based cell area also gave a good linear fit (R2 = 0.77) with a gradient of about 1.2
(S5B Fig). The higher value for the gradient likely reflects curvature of the cell surface and the
leaf, both of which increase area compared to projected values. Nevertheless, segmented sur-
face area remains linearly related to vertex-based area. Plotting cell volume against segmenta-
tion-based cell surface area gave a linear fit, with R2 = 0.91 and a gradient suggesting an
approximately constant cell thickness of about 9 μm (S5C Fig). Variation in cell thickness is
displayed by plotting cell volume divided by surface area as a heat map. Although a slight
increase in cell thickness was observed in the proximal midline (about 15 μm), cell thickness
showed relatively little spatial variation for much of the lamina (S5D Fig), compared with the
striking spatiotemporal variation in cell area (S5E Fig) and cell volume (S5F Fig). Thus, the
major contribution to cell size variation derives from cell area rather than cell thickness. These
results are also consistent with fixed leaf sections shown in [10], which have epidermal cells in
the range of 8–15 μm thick (measured according to the scale in the published images).
For the subepidermal cell layer, fewer cells could be segmented in 3D because the bases of
the cells were too deep within the tissue to be captured clearly by confocal imaging. However,
around 13 cells could be segmented and plotting projected segmentation-based area against
vertex-based cell area gave a good linear fit (R2 = 0.98) with a gradient of about 1 (S11A Fig).
Plotting the volume of these cells against projected segmentation-based cell areas showed that
they had similar thickness to epidermal cells of the same area, except for cells in the proximal
midline region, where subepidermal cells have a greater volume because of increased thickness
Coordination of cell division and growth during organ morphogenesis
PLOS Biology | https://doi.org/10.1371/journal.pbio.2005952 November 1, 2018 29 / 48

(S11B and S11C Fig). These results are also consistent with fixed leaf sections shown in [10],
which have subepidermal cells in the range of 9–14 μm thick.
Analysis of cell shape complexity
To quantify cell shape complexity, we employed Lobe-Contribution Elliptic Fourier Analysis
(LOCO-EFA), a method to decompose the outline of each cell into a list of biologically mean-
ingful descriptors [77]. The LOCO-EFA decomposition was used to estimate a measure of cell
shape complexity, coined the ‘cumulative difference’ (CD), which is the integral over all
LOCO-EFA modes larger than 2 of the mismatch (Exclusive OR or XOR) between the original
and reconstituted shape, yielding a scalar value representing the degree of shape complexity of
each cell [77]. We used this measure normalised to cell area; hence, a small or large cell with
the same shape will yield the same cell complexity measure (CD). It ranged from zero (low
complexity, which describes perfectly circular or elongated cells) to higher values, as more
LOCO-EFA harmonics are required to accurately describe the shape. The computer code was
written in C and is available on a remote repository (Git repository), which is publicly available
on Bitbucket (https://bitbucket.org/mareelab/LOCO_EFA).
Analysis of spch expression
The expression pattern of pSPCH:SPCH-GFP was analysed from time-lapse images to distin-
guish cells in the stomatal lineages from non-stomatal lineages. For each cell division, the dura-
tion of SPCH expression was determined from the time when SPCH first became visible in the
nucleus of the mother cell to when it could no longer be seen in each daughter cell. S1 Video
shows an example of cell division in the stomatal lineage. S2 Video shows an example cell divi-
sion in a non-stomatal lineage.
Analysis of subepidermal cells in wild type
To facilitate imaging of the subepidermal cell layer in wild-type leaves, seedlings grown on
plates were stained by the modified pseudo-Schiff propidium iodide (mPS-PI) method, as pre-
viously described [78]. After approximately 1 wk (for the mounting solution to set), leaf pri-
mordia were imaged using a Leica SP5 Confocal microscope. Projections of the subepidermal
layer were created in VolViewer using the ‘Depth-Peal Shader’ lighting editor, as described
above for spch in “Image processing”.
Modelling leaf growth
All models and GFT-box software used for modelling can be downloaded from http://
cmpdartsvr3.cmp.uea.ac.uk/wiki/BanghamLab/index.php/Software.
Models are also downloadable from https://figshare.com/s/b14c8e6cb1fc5135dd87. To
implement an integrated model of division and growth, we built on a previously published tis-
sue-level model for wild-type leaf growth at early stages of development [16]. This model has
two interconnected networks: the Polarity Regulatory Network specifies tissue polarity and
hence specified orientations of growth, and the Growth Regulatory Network (KRN) deter-
mines how factors influence specified growth rates. Specified growth orientations are estab-
lished in relation to a polarity field, determined by the local gradient of a factor determining
polarity field (POL) that propagates through the tissue, termed the canvas. The resultant
growth and shape depend on the specified growth rates parallel (Kpar) and perpendicular
(Kper) to the polarity, and the mechanical constraints arising from the connectedness of the
tissue.
Coordination of cell division and growth during organ morphogenesis
PLOS Biology | https://doi.org/10.1371/journal.pbio.2005952 November 1, 2018 30 / 48

In the equations, factors are denoted by i subscripted with the factor name. For instance,
the factor PGRAD is described by ipgrad in the equations. Factors may promote growth rates
through the linear function pro, defined as follows:
proðpf ; if Þ ¼ 1þ pf if
where if is a factor, F, and pf is a promotion coefficient for that factor. Factors may inhibit
growth through the function inh, defined as follows:
inhðhf ; if Þ ¼ 1=ð1þ hf if Þ
where hf is a inhibition coefficient for factor F. All multiplications and divisions are
elementwise.
The previously proposed tissue-level growth model [16] was based on tracking only a subset
of cell vertices and therefore had a lower cellular resolution than the data presented in this
paper. Based on the higher resolution the cell fate map of the midline region of wild type and
spch (S2 Fig), we widened the initial MID domain (S15 Fig) so that it gave a better match to
the cellular data. Running the model with this change produced a narrower leaf, as MID inhib-
its Kper. To compensate for this effect and to account for the regions with high growth rate per-
pendicular to the midline (Fig 1D and S1B Fig), we promoted Kper with PMF.
S15 Fig—Model setup
The initial starting canvas for all models consists of 3,000 finite elements, which are not subdi-
vided during the simulations, and model time is aligned with days after initiation (DAI),
which is defined based on growth curves of leaf width [16]. To give finer resolution, times are
given in hours (hours after initiation [HAI]). A list of growth parameter values is given in
Table 1.
Specified growth rates are modulated by a set of overlapping regional factors, PGRAD,
MID, and LAM, the concentrations of which are fixed to the canvas and deform with it during
growth (S15A Fig). PGRAD declines distally and accounts for the proximodistal variation in
growth rate parallel to the polarity. LAM is expressed highest in the presumptive lamina and at
lower levels in the distal regions that will form the petiole. LAM promotes growth
Table 1. Model parameters.
Parameter Description Value
Polarity parameters
bpol maximum POL levels 0.1
μpol POL decay rate 0.1 h−1
Growth parameters
bpgrad minimum levels of PGRAD 0.195
glate increase in LATE over time 0.0048 h−1
ppgrad Kpar promotion by PGRAD 0.041 h−1
plam Kper promotion by LAM 0.0235 h−1
plate Kper promotion by LATE 0.7
hlate Kpar inhibition by LATE 2.2
hmid Kper inhibition by MID 1.0
μpmf PMF decay rate 0.3 h−1
dpmf Diffusion rate of PMF 0.01
ppmf Kper promotion by PMF 0.9
https://doi.org/10.1371/journal.pbio.2005952.t001
Coordination of cell division and growth during organ morphogenesis
PLOS Biology | https://doi.org/10.1371/journal.pbio.2005952 November 1, 2018 31 / 48

perpendicular to polarity. MID is expressed in the midline region, as shown in S15A Fig, and
inhibits growth perpendicular to the polarity. The maximum value of these factors is 1. Speci-
fied growth rates are also modulated by diffusible factor PMF, which is fixed to a value of 1 at
the approximate position of the lamina-petiole boundary and allowed to diffuse through
growth with a diffusion rate of dpmf and a decay rate of μpmf, giving the distribution shown in
S15 Fig.
A temporally varying factor, LATE, is activated throughout the canvas to decrease growth
at later stages. The value of LATE is initially 0 but rises linearly with time after 149 h:
ilate0 if t < 148 h
glateðt � 148 hÞ if t � 148 h
(
where glate defines the increase of LATE with time. LATE inhibits specified growth rates with
an inhibition coefficient of hlate.
Polarity regulatory network
Polarity is established using factor PROXORG, which is set to 1 at the base of the canvas and 0
elsewhere (S15A Fig). The value of POL is fixed at a value of bpol, where PROXORG is greater
than zero. POL diffuses throughout the canvas with a diffusion rate of Dpol and a decay rate
of μpol. POL distribution is allowed to establish during the setup phase for 20 time steps before
the commencement of growth. Polarity is initially proximodistal and then deforms with the
canvas as it grows to its final shape.
Fig 8E and 8F—spch subepidermis model
This is a model for spch subepidermis during early stages of development.
KRN. Specified growth rates parallel to the polarity field Kpar are defined as follows:
Kpar ¼ ppgrad ipgrad:inhðhlate; i lateÞ
where ppgrad is the promotion of growth by PGRAD.
Specified growth perpendicular to the polarity field Kper is defined as:
Kper ¼ plami lam:proðplate; i lateÞ
:inhðhmid; imidÞ
:proðppmf ; ipmftkÞ
where plam is the promotion of growth by LAM. The value of PMFTK is set to the value of
PMF except where the value of PMF� 0.295, in which case the value PMFTK is capped at
0.295. The canvas grows for the period 87 h< t< 178 h.
v-Cells
To incorporate cell divisions within our tissue-level model, we superimposed polygons on the
initial canvas to represent cells (S15A Fig, right). The sizes and geometries of these v-cells are
based on cells observed at corresponding stages in confocal images of leaf primordia [16]. The
vertices of the v-cells are anchored to the canvas and displaced with it during growth. New ver-
tices are introduced as v-cells divide, according to the shortest wall passing through the centre
of the v-cell [29]. Calling this the nominal new wall, the actual new wall is chosen to be parallel
to this, through a point that is randomly displaced from the midpoint of the nominal new wall.
The displacement is a vector chosen uniformly at random from a disc centred on the
Coordination of cell division and growth during organ morphogenesis
PLOS Biology | https://doi.org/10.1371/journal.pbio.2005952 November 1, 2018 32 / 48

midpoint. The radius of this disc is 0.25 times the length of the nominal new wall. The length
of the new wall is shortened slightly to give more realistic wall angles [79].
Cell divisions are determined through controlling competence and Ā.
Competence. Competence was determined by factor CDIV. v-cells can only divide if
CDIV > 0. Factor CDIV was set to a value of 1 in the zone in which v-cells are competent to
divide. The value of CDIV was set to 1 where the value of PMF� 0.184, which corresponds to
the value of PMF at about 400 μm2 from the petiole-lamina boundary. v-cells within the CDIV
zone divide when they reach an area threshold, while v-cells outside the CDIV-expressing
zone do not divide, regardless of their size. CDIV is turned off throughout the canvas when
LATE reaches a threshold value of 0.1680 at 183 h.
Control of A. At cell birth, the cell is assigned a target area, A, equal to the mean target
area Ā plus a random variation with standard deviation σ = 0.2Ā, in accordance with observed
values of σ (Fig 2F). Before 114 h, we assume Ā = Amin. After 114 h in the lamina, Ā ranges
from 150 μm2 to 300 μm2 according to the value of PMF. For PMF values above PMFmax, Āremains at Amin. As the value of PMF falls below PMFmax, Ā rises linearly to Amax according to
the formula:
ĀAmin
Aminð1 � aÞ þ Amax a
t < 114 ht � 114 h
(
where
a ¼ðPMFmax � ipmf Þ
ðPMFmax � PMFminÞ
In the midline region,
ĀAmin
1:5 Amid ipgrad
t < 114 ht � 114 h
(
In the Fig 8E and 8F—spch subepidermis model, PMFmax = 0.51, PMFmin = 0.184, Amin =
150 μm2, Amax = 300 μm2, and Amid = 500 μm2.
Intercellular spaces. For the subepidermal model, formation of intercellular spaces was
simulated by replacing a random selection of cell vertices with small empty equilateral triangles
(with an initial area of 2 μm2). The number of initial intercellular spaces and the rate of addi-
tional spaces were calculated using the ratio of cells to intercellular spaces, in accordance with
the experimental data. This resulted in 30 intercellular spaces being introduced at 120 h, and
further replacements were made at a rate of 11 h−1. The vertices of the intercellular spaces
moved away from their centres at a rate of 1.25% of their length h−1, equivalent to an areal
growth rate of 2.5% h−1.
Fig 8G and 8H—spch epidermis model
This is a model for spch epidermis during early stages of development.
KRN. Specified growth rates parallel to the polarity field, Kpar, and perpendicular to the
polarity field, Kper, were defined as in “Fig 8E and 8F—spch subepidermis model”.
The canvas grew for the period 87 h< t< 178 h.
v-Cells. v-cells were implemented as in “Fig 8E and 8F—spch subepidermis model,” but
with the following modifications:
CDIV was set to 1 when the value of PMF� PMFmin = 0.295 (compared with PMFmin =
0.184 for the subepidermis model), which shifts the distal boundary from about 400 μm to
Coordination of cell division and growth during organ morphogenesis
PLOS Biology | https://doi.org/10.1371/journal.pbio.2005952 November 1, 2018 33 / 48

about 300 μm from the petiole-lamina boundary. Additionally, in order to model the initial
restriction of cell division to proximal regions, CDIV was also set to 0 where PGRAD< 0.628.
Ā in the lamina was set using the same equation as the Fig 8E and 8F—spch subepidermis
model (but with PMFmin = 0.295, as described in the previous paragraph). In the midline
region, Ā was set to a constant value Amid = 500 μm2 and did not vary with PGRAD as in “Fig
8E and 8F—spch subepidermis model.”
ĀAmin
Amid
t < 114 ht � 114 h
(
Cells in the midline stopped dividing earlier than in the Fig 8E and 8F—spch subepidermis
model and this was achieved in this model by reducing the LATE threshold in the midline to
0.0768 (compared with 0.1680).
Fig 9B—Later stage mature spch epidermis model
This model extends the Fig 8G and 8H—spch epidermis model to later stages of development.
A new factor, EARLYGROWTH, was introduced in the model setup and set to a value of 1
throughout the canvas. After 189 h, EARLYGROWTH decreases linearly by a value of 0.0417
h−1 until it reaches a minimum value of 0.
iearlygrowth1 if t < 189 h
iearlygrowth � 0:0417 ðt � 189Þ if t � 189 h
(
To arrest growth, we modified factor LATE to increase exponentially after 189 h:
ilate
0 if t < 148 h
glateðt � 148 hÞ if 189 h > t � 148 h
A eBt if t � 189 h
8><
>:
where A = glate (189–148) e−B 189 and B = 1 / (189–148). This ensures ilate evaluates to glate (t–148) at 189 h.
KRN. Changes relative to the Fig 8G and 8H—spch epidermis model are shown
underlined.
Specified growth rate parallel to the polarity field Kpar was modified with an additional term
that led to inhibition after EARLYGROWTH starts to decline (at 189 h), as follows:
Kpar ¼ ppgradipgrad:inhðhlate; i lateÞ:inhð0:24; i late:ð1 � i earlygrowthÞÞ
Specified growth perpendicular to the polarity field Kper was modified with additional
terms that led to loss of promotion by LATE and inhibition after EARLYGROWTH starts to
decline (at 189 h), as follows:
Kper ¼ plami lam:inhðhmid; imidÞ
:proðppmf ; i pmftkÞ
:proðplate; i late:i earlygrowthÞ
:inhð2:8; i late:ð1 � i earlygrowthÞÞ
The canvas grows for the period 87 h< t< 412 h.
Coordination of cell division and growth during organ morphogenesis
PLOS Biology | https://doi.org/10.1371/journal.pbio.2005952 November 1, 2018 34 / 48

v-Cells. v-cells were defined as in “Fig 8G and 8H—spch epidermis model”.
Fig 9C—Later stage spch limit-free epidermis model
This model inhibits distal growth during later stages in order to reduce the size of distal cells.
It does this by using the existing factors PGRAD and LAM.
KRN. Changes relative to the Fig 8G and 8H—spch epidermis model are shown under-
lined. Specified growth rates parallel to the polarity field Kpar were modified by introducing
inhibitory factors that increase distally. As both PGRAD and LAM values decrease distally
from a maximum of 1, by subtracting their values from 1, we obtain factors that increase dis-
tally. These distally increasing factors inhibited growth as EARLYGROWTH decreased. As
this introduces extra growth inhibition, this was compensated for by also inhibiting growth
inhibition by LATE as EARLYGROWTH decreased:
Kpar ¼ Ppgradipgrad:inhðhlate; i late:inhð1:5; ð1 � i earlygrowthÞÞ
:inhð2; ð1 � i lamÞ:ð1 � i earlygrowthÞÞ
:inhð4; ð1 � i pgradÞ:ð1 � i earlygrowthÞÞ
Specified growth perpendicular to the polarity field Kper was modulated in a similar way as
Kpar described above:
Kper ¼ plami lam:inhðhmid; imidÞ
:proðppmf ; ipmftkÞ
:proðplate; i late:i earlygrowthÞ
:inhð1:2; i late:ð1 � i earlygrowthÞÞ
:inhð4; ð1 � ipgradÞ:ð1 � i earlygrowthÞÞ
The canvas grows for the period 87 h< t< 412 h.
v-Cells. v-cells were implemented as in the Fig 8G and 8H—spch epidermis model.
Fig 9J—Later stage spch limiting cell size epidermis model
In this model, cell size can affect growth. This is an alternative way to limit the size of distal
cells without having to use the factors PGRAD and LAM, as in the Fig 9C—Later stage spchlimit-free epidermis model.
KRN. Specified growth rates were defined as in the Fig 9B—Later stage mature spch epi-
dermis model, but with a v-cell size feedback on growth affecting Kper and Kpar. When cell
area, ca, exceeds a threshold size a1, specified growth rates (Kpar and Kper) start to be reduced
by ω in proportion to cell area until cell size reaches a2, after which specified growth rates are
Coordination of cell division and growth during organ morphogenesis
PLOS Biology | https://doi.org/10.1371/journal.pbio.2005952 November 1, 2018 35 / 48

set to zero.
Kpar ¼ o:ppgradipgrad:inhðhlate; i lateÞ:inhð0:24; i late:ð1 � i earlygrowthÞÞ
Kper ¼ o
:plami lam:inhðhmid; imidÞ
:proðppmf ; ipmftkÞ
:proðplate; i late:i earlygrowthÞ
:inhð2:8; i late:ð1 � i earlygrowthÞÞ
where
o ¼a2 � caa2 � a1
In the lamina region, a1 = 4,000 μm2 and a2 = 8,000 μm2, while in the midline region, a1 =
18,000 μm2 and a2 = 20,000 μm2.
All other v-cell properties were as in “Fig 9B—Later stage mature spch epidermis model.”
Fig 9D and 9E and 9K–9L—Cell division threshold mutant models
Cell division threshold models were developed for the Fig 9C—later stage spch limit-free epi-
dermis model and Fig 9J—later stage spch limiting cell size epidermis model. Each of the cell
division models was identical to its parent model, but the cell target area for division, Ā, was
increased by a constant a' for t� 114 h.
�A ¼ ð�Aminð1 � aÞ þ�Amax aÞ þ a0
In Fig 9D and 9K, a' = 85 μm2, while in Fig 9E and 9L, a' = −85 μm2.
Fig 9F and 9G and 9M–9N—Growth rate mutant models
Growth rate mutant models were developed for the Fig 9C—later stage spch limit-free epider-
mis model and the Fig 9J—later stage spch limiting cell size epidermis model. Each of the
growth rate mutant models was identical to its parent model, but Kper and Kpar were globally
scaled by a factor k'. In Fig 9F and 9M, k' = 0.95, while in Fig 9G and 9N, k' = 1.05.
For the Fig 9C—later stage spch limit-free epidermis model:
Kpar ¼ k0
:ppgradipgrad:inhðhlate; i late:inhð1:5; ð1 � i earlygrowthÞÞ
:inhð2; ð1 � i lamÞ:ð1 � i earlygrowthÞÞ
:inhð4; ð1 � ipgradÞ:ð1 � i earlygrowthÞÞ
Coordination of cell division and growth during organ morphogenesis
PLOS Biology | https://doi.org/10.1371/journal.pbio.2005952 November 1, 2018 36 / 48

Kper ¼ k0
:plami lam:inhðhmid; imidÞ
:proðppmf ; ipmftkÞ
:proðplate; i late:i earlygrowthÞ
:inhð1:2; i late:ð1 � i earlygrowthÞÞ
:inhð4; ð1 � i pgradÞ:ð1 � i earlygrowthÞÞ
For the Fig 9J—later stage spch limiting cell size epidermis model:
Kpar ¼ k0 :o:Ppgradipgrad:inhðhlate; i lateÞ:inhð0:24; i late:ð1 � i earlygrowthÞÞ
Kper ¼ k0
:o
:Plami lam:inhðhmid; imidÞ
:proðPpmf ; ipmftkÞ
:proðPlate; i late:i earlygrowthÞ
:inhð2:8; i late:ð1 � i earlygrowthÞÞ
Changes to models relative to those used to generate Fig 9C and Fig 9J are shown
underlined.
Fig 9H, 9I, 9O and 9P—LATE mutant models
Models were developed for the Fig 9C—later stage spch limit-free epidermis model and Fig 9J
—later stage spch limiting cell size epidermis model. Each of the LATE mutant models was
identical to its parent model, but the activation of LATE and EARLYGROWTH was shifted by
a constant number of hours, t0. In Fig 9H and 9O, t' = −6 h, while in Fig 9I and 9P, t' = 6 h.
ilate
0 if t < 148 hþt0
glateðt � 148 hþt0 Þ if 189 hþt0 > t � 148hþt0
A eBt if t � 189 hþt0
8><
>:
where A = glate. (189+t0 – 148+t0). e-B 189+t' and B = 1 / (189+t' – 148+t').
iearlygrowth1 if t < 189 hþt0
iearlygrowth � 0:0417 ðt � 189Þ if t � 189 hþt0
(
Changes to models relative to those used to generate Fig 9C and Fig 9J are shown
underlined.
Fig 10—Later stage mature spch epidermis model
In the above models, t refers to actual time. We modified the late stage spch epidermis model
(as used for Fig 9B) by setting physiological time to be a constant fraction (physiological ratio)
Coordination of cell division and growth during organ morphogenesis
PLOS Biology | https://doi.org/10.1371/journal.pbio.2005952 November 1, 2018 37 / 48

of duration since the start of the simulation (when t = 87 h). Key transitions and growth rates
were then set in relation to physiological time. Parameters describing physical processes such
as diffusion were left unchanged. For the model for spch grown on plates, the physiological
ratio was 0.55. In addition, the growth rates were globally scaled by a factor k' = 0.6 The net
result of these two changes is that growth in actual time is slowed to 0.33 of normal. If this
overall growth rate was matched purely by changing physiological time, the leaf on the plate
would end up larger than observed at maturity. Conversely, if the growth rate was matched
purely through changes in k', the leaf would end up much smaller than observed for spch on
plates at maturity. Thus, changes in both physiological time and k' are needed to match the
observed growth curve.
S14C Fig—spch in chamber tuned to lower growth rate at later stages
The only change in relation to the late stage spch epidermis model (as used for Fig 9B) was that
the physiological ratio (as defined above) was set to 0.75.
Supporting information
S1 Fig. Scatterplots of growth rates parallel and perpendicular to the midline in the spchepidermis. From the time-lapse imaging experiment shown in Fig 1. (A) Growth rates parallel
to the midline (KMidline) versus distance from the petiole-lamina boundary. (B) Growth rates
perpendicular to the midline(KPerMidline) versus distance from the centre of the midline. Data
points are colour coded according to tracking interval (inset). Source data are available from
https://figshare.com/s/b14c8e6cb1fc5135dd87.
(TIF)
S2 Fig. Assignment of the midline and lamina regions. From the time-lapse imaging experi-
ment shown in Fig 1. Lineages were traced from cells visible at the beginning of the experiment
(0 h, left) through to the end (74 h, right) and were assigned an arbitrary colour, ensuring
neighbours were coloured differently. Cells in the midline (within the black outline) were
identified using the position and shape of clones (cells of the same lineage) in the final image,
as was the approximate position of the distal end of the midline (dark grey). Cells outside the
midline region were classified as being in the lamina. Scale bar = 100 μm.
(TIF)
S3 Fig. Dynamics of cell division and growth in the spch epidermis, additional dataset.
Time-lapse imaging of a spch leaf at approximately 24-h intervals over 4 d (0–96 h, last time
point in series not shown). Data shown on the first time point (underlined) for each tracking
interval. Leaf widths for first time point (left to right) are 0.17, 0.27, 0.39, and 0.50 mm. (A)
Cells amenable to tracking that were competent to divide (green) and either executed division
during the interval (light green) or divided in a later interval (dark green). Cells that did not
divide (black, first row in 0–25 h are coloured orange throughout). (B-D) Cellular growth
rates (heat maps) for each tracking interval. Black line refers to orange cells in (A). (B) Areal
growth rates. (C) Growth rates parallel to the midline (proximodistal). (D) Growth rates per-
pendicular to the midline (mediolateral). (E) Cell areas for the first time point of the interval.
Leaf outline indicated by dotted black line. The petiole-lamina boundary was defined as
described in Fig 1. Grey boxes are aligned to the petiole-lamina boundary and extend to 150 or
300 μm. Black arrows indicate distal boundary of the zone of division. Scale bar = 100 μm.
Source data are available from https://figshare.com/s/b14c8e6cb1fc5135dd87. spch, speechless.(TIF)
Coordination of cell division and growth during organ morphogenesis
PLOS Biology | https://doi.org/10.1371/journal.pbio.2005952 November 1, 2018 38 / 48

S4 Fig. Dynamics of cell division and growth in the spch epidermis, additional dataset.
Time-lapse imaging of a spch leaf at approximately 24-h intervals over 5 d (0–118 h, last time
point in series not shown). Data shown on first time point (underlined) for each tracking
interval. Leaf widths for the first time point (left to right) are 0.23, 0.34, 0.48, 0.67, and 0.87
mm. (A) Cells amenable to tracking that were competent to divide (green) and either executed
division during the interval (light green) or divided in a later interval (dark green). Cells that
did not divide (black, first row in 0–23 h are coloured orange throughout). (B-D) Cellular
growth rates (heat maps) for each tracking interval. Black line refers to orange cells in (A). (B)
Areal growth rates. (C) Growth rates parallel to the midline (proximodistal). (D) Growth rates
perpendicular to the midline (mediolateral). (E) Cell areas for the first time point of the inter-
val. Leaf outline indicated by dotted black line. The petiole-lamina boundary was defined as
described in Fig 1. Grey boxes are aligned to the petiole-lamina boundary and extend to 150 or
300 μm. Black arrows indicate distal boundary of the zone of division. Scale bar = 100 μm.
Source data are available from https://figshare.com/s/b14c8e6cb1fc5135dd87. spch, speechless.(TIF)
S5 Fig. Analysis of epidermal cell size using 3D segmentation. (A,B) Data from a sample of
cells in the tracking experiment shown in S3 Fig, 96 h. (A) Segmentation-based projected cell
area versus vertex-based cell area (R2 = 0.87, slope = 1.03, intercept = 125, standard deviation
along y-axis = 72). (B) Segmentation-based cell surface area versus vertex-based cell area (R2 =
0.77, slope = 1.2, intercept = 145, standard deviation along y-axis = 115). (C-F) Data from a
sample of cells in tracking experiment shown in Fig 1E, 58 h. (C) Cell volume versus segmenta-
tion-based cell surface area (R2 = 0.91, slope = 8.93). (D) Cell volume divided by cell surface
area (cell thickness). (E) Segmentation-based cell surface area. (F) Cell volume. Scale bar = 100
μm. For each heat map, the upper limit of the colour scale was set to 20-fold that of the lower
limit. Source data are available from https://figshare.com/s/b14c8e6cb1fc5135dd87.
(TIF)
S6 Fig. Cellular areal growth rates of dividing and nondividing cells in the spch epidermis.
Time-lapse imaging of a spch leaf shown in Fig 1. (A) Panel repeated from Fig 1A, for ease of
comparison. Cells amenable to tracking that were competent to divide (green) and either exe-
cuted division during the interval (light green) or divided in a later interval (dark green). Cells
that did not divide (black, first row in 0–14 h are coloured orange throughout). For the last
interval (74–100 h), cell divisions could only be tracked for a subset of cells because of missing
data in the 100-h time point. (B-C) Cellular growth rates (heat maps) shown in Fig 1B, sepa-
rated to show (B) areal growth rates of nondividing cells, coloured black in (A). (C) Areal
growth rates of dividing cells, coloured green in (A). Leaf outline indicated by dotted black
line. The petiole-lamina boundary was defined by selecting a cell from a later stage of develop-
ment, where the lamina narrows, and then tracing its lineage back to all stages. Grey boxes are
aligned to the petiole-lamina boundary and extend to 150 or 300 μm. Black arrows indicate
distal boundary of the zone of division competence. Scale bar = 100 μm. spch, speechless.(TIF)
S7 Fig. Cell division dynamics of the epidermis at high temporal resolution. Cells amenable
to tracking from the time-lapse imaging experiment shown in Fig 2; data visualised over 24-h
intervals, shown on the first image of the interval (underlined). (A) Cell cycle duration (heat
map) for cells that were observed to complete a full cell cycle during the course of the experi-
ment. Cells that did not divide or did not complete a full cell cycle are coloured black. (B) Cells
that were competent to divide (green) and either executed division during the interval (light
green) or divided in a later interval (dark green). Cells that did not divide (black). Leaf outline
Coordination of cell division and growth during organ morphogenesis
PLOS Biology | https://doi.org/10.1371/journal.pbio.2005952 November 1, 2018 39 / 48

indicated by dotted black line. The petiole-lamina boundary was defined as described in Fig 1.
Grey boxes are aligned to the petiole-lamina boundary and extend to 150 or 300 μm. Scale
bar = 100 μm.
(TIF)
S8 Fig. Subepidermal cells in wild-type leaves. (A) Projections of the subepidermal layer of
four individual wild-type leaves, fixed and stained at developmental stages, similar to those of
the tracked spch leaf in Fig 5. Leaf widths (left to right) are 0.14, 0.28, 0.40, and 0.53 mm. A
patch of cells was coloured red and used to look in further detail. (B) Enlargement of the patch
of cells in (A) (red outline). (C) Cells outlined in (B), showing spacing of individual cells (filled
pink, outlined red). (D) Epidermal cells adjacent to the subepidermal patch (subepidermal
cells filled and outlined red). (E) Epidermal cells without subepidermal patch outlined. Scale
bars = 50 μm. Source data are available from https://figshare.com/s/b14c8e6cb1fc5135dd87.
spch, speechless.(TIF)
S9 Fig. Comparison of epidermal and subepidermal cell areal growth rates. A group of cells
from the time-lapse imaging experiment shown in Fig 5, subepidermis (cells highlighted red),
and adjacent epidermis (dynamics of the epidermis shown in full in S3 Fig). Average cell areal
growth rates for each tracking interval are shown on the first image of each interval (time
point underlined). (A) Epidermis, (B) subepidermis. The patch of cells is also shown enlarged
for comparison. (C) Epidermis. (D) Subepidermis, showing increase in number of cells
through division compared to the epidermis. Numbers refer to number of cells. Scale bars = 50
μm.
(TIF)
S10 Fig. Comparison of the zone of competence in epidermal and subepidermal layers.
Time-lapse imaging of a spch leaf at approximately 24-h intervals over 2 d (0–50 h); later time
points of this experiment are shown in S3 Fig. Cells amenable to tracking are shown on the
first time point (underlined). Cells that were competent to divide (green) and either executed
division during the interval (light green) or divided in a later interval (dark green). Cells that
did not divide (black). (A) Subepidermis. (B) Epidermis. Leaf outline indicated by dotted
black line. Leaf widths from left to right are 0.17 and 0.27 mm. The petiole-lamina boundary
was defined as described in Fig 1. Grey boxes are aligned to the petiole-lamina boundary and
extend to 150 or 300 μm. Scale bar = 100 μm. spch, speechless.(TIF)
S11 Fig. Analysis of subepidermal cell size using 3D segmentation. Analysis of a sample of
abaxial subepidermal cells from the tracking experiment shown in Fig 6, 58 h. (A) Projected
segmentation-based cell area versus vertex-based area (R2 = 0.98, slope = 1.03, intercept = 46,
standard deviation along y-axis = 20). (B) Cell volume versus projected segmentation-based
cell area, subepidermal cells (blue, R2 = 0.94, slope = 15.4), epidermal cells (red). (C) Cell vol-
ume divided by projected segmentation-based area (approximate cell thickness). (D) Projected
segmentation-based area. (E) Cell volume. For each heat map, the upper limit was set to 8-fold
that of the lower limit. (F) Orthogonal slice of confocal image, approximately through the mid-
line of the leaf. Thickness of epidermal and subepidermal cells appears approximately uniform
from leaf base (left) to leaf tip (right). Subepidermal cells close to the distal leaf tip are difficult
to resolve. Scale bars = 100 μm. Source data are available from https://figshare.com/s/
b14c8e6cb1fc5135dd87.
(TIF)
Coordination of cell division and growth during organ morphogenesis
PLOS Biology | https://doi.org/10.1371/journal.pbio.2005952 November 1, 2018 40 / 48

S12 Fig. Comparison of wild-type and spch primordia. Confocal images of an early wild-
type leaf primordium (left) and a spch primordium (right) at similar developmental stages.
The leaf primordia are partially obscured by the petioles of cotyledon leaves. Scale
bar = 50 μm. spch, speechless.(TIF)
S13 Fig. Quantification of cell area at division execution in wild type. Data from cells ame-
nable to tracking in the time-lapse experiment shown in Fig 7. (A,B) Area of lamina cells at the
time of division execution versus distance from the petiole-lamina boundary. Mean cell area at
the division for all cells is 87 ± 6.0 μm2. (A) Cells classified as non-stomatal lineage
(mean = 165 ± 27.8 μm2). (B) Cells classified as stomatal lineage (mean = 81 ± 5.7 μm2). (C,D)
Cell cycle duration for all cells observed to complete a cell cycle. (C) Non-stomatal lineage cells
(mean = 24.6 ± 2.8 h). (D) Stomatal lineage cells (mean = 18.5 ± 1.05 h). ± ranges indicate
1.96 × standard error of mean. Data points are colour coded according to time interval (inset
in A). Source data are available from https://figshare.com/s/b14c8e6cb1fc5135dd87.
(TIF)
S14 Fig. Comparison of wild-type and spch growth rates in leaf width. (A) Width measure-
ments of leaf 1 from spch, wild-type, and fama seedlings grown in standard conditions on
plates. The fitted growth curve of wild type (solid black line) was based on a logistic calculation
[16]. Pink line shows output leaf widths for the model. Blue line shows output leaf widths for
the model tuned to match spch growth on plates (by slowing growth by 40% and physiological
time by 45%). Horizontal line shows leaf width at about 0.5 mm, corresponding to stages
shown in Fig 10. (B) Width measurements of leaf 1 from seedlings grown in the bio-imaging
chamber and scanned using confocal microscopy. Measurements are from six independent
tracking experiments, two wild-type individuals, and four spch individuals (colour key).
Because spch plants grown prior to moving into the chamber have much-reduced growth
(shown in B), the initial data point from each tracking experiment was normalised to the wild-
type logistic curve (solid black line) to enable subsequent growth rates to be compared. Pink
line shows output leaf widths for the model. Blue line shows output for the leaf model tuned to
match spch growth in the chamber at later stages (by slowing physiological time by 25%). (C)
Outputs for the final stage comparing the model (left) with that tuned to match spch growth in
chamber (right). Source data are available from https://figshare.com/s/b14c8e6cb1fc5135dd87.
spch, speechless.(TIF)
S15 Fig. Model setup and regulatory factors. (A) Initial canvas distribution of regulatory fac-
tors, from left to right: PGRAD (greyscale), LAM (pink) and MID (purple), POL (blue, with
arrows indicating gradient), and initial pattern of v-cells. (B) Time series showing accumula-
tion of LATE at 115, 124, 153, and 182 h. (C) Time series of PMF levels at 115, 124, 153, and
182 h. (D) Sample plot of PMF concentration along the leaf midline. Note PMF concentration
is fixed at 1 around the petiole-lamina boundary (dotted line). LAM, a factor distinguishing
lamina from petiole; LATE, a timing factor; MID, a mediolateral factor; PGRAD, a graded
proximodistal factor; PMF, proximal mobile factor; POL, factor determining polarity field; v-
cell, virtual cell.
(TIF)
S16 Fig. Resultant growth rates for model output at different developmental stages. Model
output (from left to right) at 115, 132, 140, 147, 156, 164, and 178 h showing (A) resultant areal
growth rates, (B) resultant growth rates parallel to the midline (proximodistal growth rates),
and (C) resultant growth rates perpendicular to the midline (mediolateral growth rates). Grey
Coordination of cell division and growth during organ morphogenesis
PLOS Biology | https://doi.org/10.1371/journal.pbio.2005952 November 1, 2018 41 / 48

boxes are aligned to the petiole-lamina boundary and extend to 150 or 300 μm. Scale
bar = 100 μm.
(TIF)
S17 Fig. Topological distributions (frequency of n-sided cells) from empirical data and dif-
ferent models. (A) Dark green line shows Arabidopsis spch epidermis with standard deviation
between leaves for the fraction of n-sided cells indicated by a vertical line. Data are based on
42,901 cells from 99 spch leaves at different stages of development. The frequency of six-sided
cells is 0.334 ± 0.019 (SD). Black line shows the result of the model of spch epidermis presented
here. Grey line shows the model without polarity (isotropic specified growth). Light green line
shows empirical data from the shoot apical meristem [31]. Orange line shows the model using
the shortest path through the cell’s centroid within an isotropically growing tissue [31]. Dark
blue line shows a graph-model in which cells divide through the topological centre [30]. (B-D)
Tissue topology with cells coloured according to their neighbourhood number, with six-sided
cells in white, higher numbers in green, and lower numbers in brown, as shown in the colour
scale. (B) Result for the model of spch epidermis presented here (black profile in A); (C) model
without polarity, yielding an isotropically growing tissue (grey profile in A). (D) Example of
spch leaf, as shown in S18D Fig. Source data are available from https://figshare.com/s/
b14c8e6cb1fc5135dd87. spch, speechless.(TIF)
S18 Fig. Additional comparisons between chamber- and plate-grown spch leaves. Support-
ing data for Fig 10; spch leaf grown in the chamber at 8 DAS (A-B) or grown on plates at 13
DAS (C-D) at similar leaf widths to leaves presented in Fig 10. (A, C) Confocal images of
leaves, with segmentation outlines overlain in blue. (B, D) Analysis of segmentations in (A, C)
showing (from left to right) neighbourhood numbers (following neighbourhood colour map
used in S18B Fig); cell complexity based on the CD measure using LOCO-EFA (using com-
plexity colour scale as in Fig 10K–10N); and absolute areas (using colour scale as in Fig 10A
and 10B). Results are consistent with those described for Fig 10. Scale bars = 100 μm. Source
data are available from https://figshare.com/s/b14c8e6cb1fc5135dd87. CD, cumulative differ-
ence; LOCO-EFA, Lobe-Contribution Elliptic Fourier Analysis; spch, speechless.(TIF)
S1 Video. Cell division in the stomatal lineage. Magnification of a cell undergoing three
rounds of amplifying divisions, from time-lapse imaging of a wild-type leaf (expressing
pSPCH:SPCH-GFP, shown in Fig 7). Bright, nuclear-localised SPCH can be observed at the
time of division and is retained in one daughter cell until the next division. Scale bar = 10 μm.
Time interval, 1 h. Duration of video, 57 h. Images from time points 18–24 h are missing
because of movement of the microscope stage. SPCH, SPEECHLESS.
(AVI)
S2 Video. Cell division not in the stomatal lineage. Time-lapse movie of a cell undergoing a
single, non-stomatal division, from time-lapse imaging of a wild-type leaf (expressing pSPCH:
SPCH-GFP, shown in Fig 7). Weak, nuclear-localised SPCH can be observed at the time of
division and disappears immediately after division in both daughter cells. Scale bar = 10 μm.
Time interval, 1 h. Duration of video, 57 h. Images from time points 18–24 h are missing
because of movement of the microscope stage. SPCH, SPEECHLESS.
(AVI)
Coordination of cell division and growth during organ morphogenesis
PLOS Biology | https://doi.org/10.1371/journal.pbio.2005952 November 1, 2018 42 / 48

S3 Video. Subepidermal growth model. Stages of the model used to generate Fig 8E: growth
and divisions of the subepidermal layer during early stages.
(MP4)
S4 Video. Epidermal growth model. Stages of the model used to generate Fig 8G: growth and
divisions of the epidermal layer during early stages.
(MP4)
S5 Video. Epidermal growth model to maturity. Stages of the model used to generate Fig 9B:
growth and divisions of the epidermal layer through to maturity.
(MP4)
S6 Video. Epidermal growth model to maturity, with limiting cell size. Stages of the model
used to generate Fig 9J: growth and divisions of the epidermal layer through to maturity, with
feedback of cell size limits on growth.
(MP4)
S7 Video. Epidermal growth model to maturity, limit-free. Stages of the model used to gen-
erate Fig 9C: growth and divisions of the epidermal layer through to maturity, with distal inhi-
bition of growth.
(MP4)
Acknowledgments
We would like to thank Grant Calder for confocal microscopy support, Przemyslaw Prusinkie-
wicz for helpful discussions at early stages of the work, and Domonique Bergmann for provid-
ing spch and fama mutant seeds. We would also like to thank Des Bradley, Chris Whitewoods,
Catherine Mansfield, Claire Bushell, and Beatriz Pinto-Goncalves for helpful discussions and
comments on the manuscript. We thank Cindy Cooper for laboratory support.
Author Contributions
Conceptualization: Samantha Fox, Paul Southam, Florent Pantin, Sarah Robinson, J. Andrew
Bangham, Enrico Coen.
Data curation: Samantha Fox, Paul Southam, Florent Pantin, Richard Kennaway.
Formal analysis: Samantha Fox, Paul Southam, Florent Pantin, Giulia Castorina, Robert
Sablowski.
Funding acquisition: Enrico Coen.
Investigation: Samantha Fox, Sarah Robinson, Giulia Castorina, Yara E. Sanchez-Corrales.
Methodology: Samantha Fox, Paul Southam, Florent Pantin, Sarah Robinson, Enrico Coen.
Project administration: Enrico Coen.
Resources: Samantha Fox, Paul Southam, Florent Pantin, Richard Kennaway, Sarah Robinson,
Jordi Chan.
Software: Paul Southam, Florent Pantin, Richard Kennaway.
Supervision: J. Andrew Bangham, Enrico Coen.
Validation: Samantha Fox, Paul Southam, Florent Pantin, Robert Sablowski.
Visualization: Samantha Fox, Paul Southam, Florent Pantin.
Coordination of cell division and growth during organ morphogenesis
PLOS Biology | https://doi.org/10.1371/journal.pbio.2005952 November 1, 2018 43 / 48

Writing – original draft: Samantha Fox, Paul Southam, Enrico Coen.
Writing – review & editing: Samantha Fox, Paul Southam, Florent Pantin, Sarah Robinson,
Giulia Castorina, Yara E. Sanchez-Corrales, Robert Sablowski, Jordi Chan, Veronica Grie-
neisen, Athanasius F. M. Maree, Enrico Coen.
References1. Harashima H, Schnittger A. The integration of cell division, growth and differentiation. Curr Opin Plant
Biol. 2010; 13(1):66–74. https://doi.org/10.1016/j.pbi.2009.11.001 PMID: 19963429.
2. Sablowski R, Carnier Dornelas M. Interplay between cell growth and cell cycle in plants. J Exp Bot.
2014; 65(10):2703–14. Epub 2013/11/13. https://doi.org/10.1093/jxb/ert354 PMID: 24218325.
3. Lockhart JA. An analysis of irreversible plant cell elongation. Journal of theoretical biology. 1965; 8
(2):264–75. Epub 1965/03/01. PMID: 5876240.
4. Moulia B, Fournier M. The power and control of gravitropic movements in plants: a biomechanical and
systems biology view. J Exp Bot. 2009; 60(2):461–86. Epub 2009/03/07. https://doi.org/10.1093/jxb/
ern341 PMID: 19264759.
5. Coelho CM, Leevers SJ. Do growth and cell division rates determine cell size in multicellular organ-
isms? Journal of cell science. 2000; 113 (Pt 17):2927–34. Epub 2000/08/10. PMID: 10934032.
6. Schmelzle T, Hall MN. TOR, a central controller of cell growth. Cell. 2000; 103(2):253–62. Epub 2000/
11/01. PMID: 11057898.
7. Randall RS, Sornay E, Dewitte W, Murray JA. AINTEGUMENTA and the D-type cyclin CYCD3;1 inde-
pendently contribute to petal size control in Arabidopsis: evidence for organ size compensation being
an emergent rather than a determined property. J Exp Bot. 2015; 66(13):3991–4000. Epub 2015/05/08.
https://doi.org/10.1093/jxb/erv200 PMID: 25948704; PubMed Central PMCID: PMC4473993.
8. Green PB. Growth and cell pattern formation on an axis: critique of concepts, terminology, and modes
of study. Bot Gaz. 1976; 137(3):187–202.
9. Andriankaja M, Dhondt S, De Bodt S, Vanhaeren H, Coppens F, De Milde L, et al. Exit from Proliferation
during Leaf Development in Arabidopsis thaliana: A Not-So-Gradual Process. Developmental Cell.
2012; 22(1):64–78. https://doi.org/10.1016/j.devcel.2011.11.011 PMID: 22227310
10. Donnelly PM, Bonetta D, Tsukaya H, Dengler RE, Dengler NG. Cell cycling and cell enlargement in
developing leaves of Arabidopsis. Dev Biol. 1999; 215(2):407–19. Epub 1999/11/05. https://doi.org/10.
1006/dbio.1999.9443 PMID: 10545247.
11. Kazama T, Ichihashi Y, Murata S, Tsukaya H. The Mechanism of Cell Cycle Arrest Front Progression
Explained by a KLUH/CYP78A5-dependent Mobile Growth Factor in Developing Leaves of Arabidopsis
thaliana. Plant and Cell Physiology. 2010; 51(6):1046–54. https://doi.org/10.1093/pcp/pcq051 PubMed
PMID: WOS:000279534200017. PMID: 20395288
12. Kuylen E, Beemster GT, Broeckhove J, De Vos D. Simulation of regulatory strategies in a morphogen
based model of Arabidopsis leaf growth. Procedia Computer Science. 2017; 108C:139–48.
13. De Vos D, De Borger E, Broeckhove J, Beemster GT. Simulating leaf growth dynamics through Metrop-
olis-Monte Carlo based energy minimization. Journal of Computational Science. 2015; 9:107–11.
14. Czesnick H, Lenhard M. Size control in plants—lessons from leaves and flowers. Cold Spring Harb Per-
spect Biol. 2015; 7(8):a019190. Epub 2015/08/05. https://doi.org/10.1101/cshperspect.a019190 PMID:
26238357.
15. Tauriello G, Meyer HM, Smith RS, Koumoutsakos P, Roeder AH. Variability and constancy in cellular
growth of Arabidopsis sepals. Plant physiology. 2015. Epub 2015/10/04. https://doi.org/10.1104/pp.15.
00839 PMID: 26432876.
16. Kuchen EE, Fox S, de Reuille PB, Kennaway R, Bensmihen S, Avondo J, et al. Generation of leaf
shape through early patterns of growth and tissue polarity. Science. 2012; 335(6072):1092–6. Epub
2012/03/03. doi: 335/6072/1092 [pii] https://doi.org/10.1126/science.1214678 PMID: 22383846.
17. Serrano-Mislata A, Schiessl K, Sablowski R. Active Control of Cell Size Generates Spatial Detail during
Plant Organogenesis. Current biology: CB. 2015; 25(22):2991–6. Epub 2015/11/04. https://doi.org/10.
1016/j.cub.2015.10.008 PMID: 26526374.
18. Rolland-Lagan AG, Remmler L, Girard-Bock C. Quantifying Shape Changes and Tissue Deformation in
Leaf Development. Plant physiology. 2014; 165(2):496–505. Epub 2014/04/09. https://doi.org/10.1104/
pp.113.231258 PMID: 24710066; PubMed Central PMCID: PMC4044856.
Coordination of cell division and growth during organ morphogenesis
PLOS Biology | https://doi.org/10.1371/journal.pbio.2005952 November 1, 2018 44 / 48

19. Vlad D, Kierzkowski D, Rast MI, Vuolo F, Dello Ioio R, Galinha C, et al. Leaf shape evolution through
duplication, regulatory diversification, and loss of a homeobox gene. Science. 2014; 343(6172):780–3.
Epub 2014/02/18. https://doi.org/10.1126/science.1248384 PMID: 24531971.
20. Hervieux N, Dumond M, Sapala A, Routier-Kierzkowska AL, Kierzkowski D, Roeder AH, et al. A
Mechanical Feedback Restricts Sepal Growth and Shape in Arabidopsis. Current biology: CB. 2016.
Epub 2016/05/07. https://doi.org/10.1016/j.cub.2016.03.004 PMID: 27151660.
21. Willis L, Refahi Y, Wightman R, Landrein B, Teles J, Huang KC, et al. Cell size and growth regulation in
the Arabidopsis thaliana apical stem cell niche. Proc Natl Acad Sci U S A. 2016; 113(51):E8238–E46.
https://doi.org/10.1073/pnas.1616768113 PMID: 27930326; PubMed Central PMCID:
PMCPMC5187701.
22. Bringmann M, Bergmann DC. Tissue-wide Mechanical Forces Influence the Polarity of Stomatal Stem
Cells in Arabidopsis. Current biology: CB. 2017; 27(6):877–83. Epub 2017/03/14. https://doi.org/10.
1016/j.cub.2017.01.059 PMID: 28285992.
23. Robinson S, Barbier de Reuille P, Chan J, Bergmann D, Prusinkiewicz P, Coen E. Generation of spatial
patterns through cell polarity switching. Science. 2011; 333(6048):1436–40. Epub 2011/09/10. doi: 333/
6048/1436 [pii] https://doi.org/10.1126/science.1202185 PMID: 21903812.
24. Asl LK, Dhondt S, Boudolf V, Beemster GT, Beeckman T, Inze D, et al. Model-based analysis of Arabi-
dopsis leaf epidermal cells reveals distinct division and expansion patterns for pavement and guard
cells. Plant physiology. 2011; 156(4):2172–83. Epub 2011/06/23. https://doi.org/10.1104/pp.111.
181180 PMID: 21693673; PubMed Central PMCID: PMC3149966.
25. Goriely A. The Mathematics and Mechanics of Biological Growth. New York: Springer; 2017.
26. Alvarez JP, Furumizu C, Efroni I, Eshed Y, Bowman JL. Active suppression of a leaf meristem orches-
trates determinate leaf growth. eLife. 2016; 5. https://doi.org/10.7554/eLife.15023 PMID: 27710768;
PubMed Central PMCID: PMCPMC5096885.
27. Ohashi-Ito K, Bergmann DC. Arabidopsis FAMA controls the final proliferation/differentiation switch dur-
ing stomatal development. The Plant cell. 2006; 18(10):2493–505. Epub 2006/11/08. https://doi.org/10.
1105/tpc.106.046136 PMID: 17088607; PubMed Central PMCID: PMCPMC1626605.
28. Kennaway R, Coen E, Green A, Bangham A. Generation of diverse biological forms through combinato-
rial interactions between tissue polarity and growth. PLoS Comput Biol. 2011; 7(6):e1002071. Epub
2011/06/24. https://doi.org/10.1371/journal.pcbi.1002071 PMID: 21698124; PubMed Central PMCID:
PMC3116900.
29. Errera L. Sur une condition fondamentale d’equilibre des cellules vivantes. CR Acad Sci 1886;
103:822–4.
30. Carter R, Sanchez-Corrales YE, Hartley M, Grieneisen VA, Maree AFM. Pavement cells and the topol-
ogy puzzle. Development. 2017; 144(23):4386–97. Epub 2017/11/01. https://doi.org/10.1242/dev.
157073 PMID: 29084800; PubMed Central PMCID: PMCPMC5769637.
31. Sahlin P, Jonsson H. A modeling study on how cell division affects properties of epithelial tissues under
isotropic growth. PLoS ONE. 2010; 5(7):e11750. Epub 2010/08/07. https://doi.org/10.1371/journal.
pone.0011750 PMID: 20689588; PubMed Central PMCID: PMCPMC2912771.
32. Gonzalez N, De Bodt S, Sulpice R, Jikumaru Y, Chae E, Dhondt S, et al. Increased leaf size: different
means to an end. Plant physiology. 2010; 153(3):1261–79. https://doi.org/10.1104/pp.110.156018
PMID: 20460583; PubMed Central PMCID: PMCPMC2899902.
33. Gonzalez N, Vanhaeren H, Inze D. Leaf size control: complex coordination of cell division and expan-
sion. Trends in plant science. 2012; 17(6):332–40. https://doi.org/10.1016/j.tplants.2012.02.003 PMID:
22401845.
34. Horiguchi G, Ferjani A, Fujikura U, Tsukaya H. Coordination of cell proliferation and cell expansion in
the control of leaf size in Arabidopsis thaliana. J Plant Res. 2006; 119(1):37–42. Epub 2005/11/15.
https://doi.org/10.1007/s10265-005-0232-4 PMID: 16284709.
35. Mansfield C, Newman JL, Olsson TSG, Hartley M, Chan J, Coen E. Ectopic BASL reveals tissue cell
polarity throughout leaf development in Arabidopsis thaliana Current biology: CB. 2018;in press.
36. Abley K, Barbier de Reuille P, Strutt D, Bangham A, Prusinkiewicz P, Maree A, et al. An intracellular par-
titioning-based framework for tissue cell polarity in plants and animals Development (in press). 2013;
140. https://doi.org/10.1242/dev.062984 PMID: 23633507
37. Heisler MG, Hamant O, Krupinski P, Uyttewaal M, Ohno C, Jonsson H, et al. Alignment between PIN1
polarity and microtubule orientation in the shoot apical meristem reveals a tight coupling between mor-
phogenesis and auxin transport. PLoS Biol. 2010; 8(10):e1000516. Epub 2010/10/27. https://doi.org/
10.1371/journal.pbio.1000516 PMID: 20976043; PubMed Central PMCID: PMC2957402.
38. Jones AR, Forero-Vargas M, Withers SP, Smith RS, Traas J, Dewitte W, et al. Cell-size dependent pro-
gression of the cell cycle creates homeostasis and flexibility of plant cell size. Nat Commun. 2017;
Coordination of cell division and growth during organ morphogenesis
PLOS Biology | https://doi.org/10.1371/journal.pbio.2005952 November 1, 2018 45 / 48

8:15060. https://doi.org/10.1038/ncomms15060 PMID: 28447614; PubMed Central PMCID:
PMCPMC5414177.
39. Kutschera U. The pacemaker of plant growth. Trends in plant science. 2008; 13(3):105–7. Epub 2008/
02/12. https://doi.org/10.1016/j.tplants.2007.12.002 PMID: 18261951.
40. Savaldi-Goldstein S, Peto C, Chory J. The epidermis both drives and restricts plant shoot growth.
Nature. 2007; 446(7132):199–202. Epub 2007/03/09. https://doi.org/10.1038/nature05618 PMID:
17344852.
41. Marcotrigiano M. Genetic Mosaics and the Analysis of Leaf Development. International Journal of Plant
Sciences. 2001; 162(3):513–25.
42. Kawade K, Tanimoto H, Horiguchi G, Tsukaya H. Spatially Different Tissue-Scale Diffusivity Shapes
ANGUSTIFOLIA3 Gradient in Growing Leaves. Biophys J. 2017; 113(5):1109–20. https://doi.org/10.
1016/j.bpj.2017.06.072 PMID: 28877493.
43. Kawade K, Horiguchi G, Usami T, Hirai MY, Tsukaya H. ANGUSTIFOLIA3 signaling coordinates prolif-
eration between clonally distinct cells in leaves. Current biology: CB. 2013; 23(9):788–92. https://doi.
org/10.1016/j.cub.2013.03.044 PMID: 23602479.
44. van der Graaff E, Dulk-Ras AD, Hooykaas PJ, Keller B. Activation tagging of the LEAFY PETIOLE gene
affects leaf petiole development in Arabidopsis thaliana. Development. 2000; 127(22):4971–80. Epub
2000/10/25. PMID: 11044410.
45. Sarojam R, Sappl PG, Goldshmidt A, Efroni I, Floyd SK, Eshed Y, et al. Differentiating Arabidopsis
shoots from leaves by combined YABBY activities. The Plant cell. 2010; 22(7):2113–30. Epub 2010/07/
16. https://doi.org/10.1105/tpc.110.075853 PMID: 20628155; PubMed Central PMCID:
PMCPMC2929102.
46. Beemster GT, Baskin TI. Analysis of cell division and elongation underlying the developmental acceler-
ation of root growth in Arabidopsis thaliana. Plant physiology. 1998; 116(4):1515–26. Epub 1998/05/23.
PMID: 9536070; PubMed Central PMCID: PMCPMC35060.
47. Di Mambro R, De Ruvo M, Pacifici E, Salvi E, Sozzani R, Benfey PN, et al. Auxin minimum triggers the
developmental switch from cell division to cell differentiation in the Arabidopsis root. Proc Natl Acad Sci
U S A. 2017; 114(36):E7641–E9. Epub 2017/08/24. https://doi.org/10.1073/pnas.1705833114 PMID:
28831001; PubMed Central PMCID: PMCPMC5594665.
48. Carabelli M, Possenti M, Sessa G, Ciolfi A, Sassi M, Morelli G, et al. Canopy shade causes a rapid and
transient arrest in leaf development through auxin-induced cytokinin oxidase activity. Genes & develop-
ment. 2007; 21(15):1863–8. Epub 2007/08/03. https://doi.org/10.1101/gad.432607 PMID: 17671088;
PubMed Central PMCID: PMCPMC1935025.
49. Holst K, Schmulling T, Werner T. Enhanced cytokinin degradation in leaf primordia of transgenic Arabi-
dopsis plants reduces leaf size and shoot organ primordia formation. J Plant Physiol. 2011; 168
(12):1328–34. Epub 2011/04/09. https://doi.org/10.1016/j.jplph.2011.03.003 PMID: 21474200.
50. Frugis G, Giannino D, Mele G, Nicolodi C, Chiappetta A, Bitonti MB, et al. Overexpression of KNAT1 in
lettuce shifts leaf determinate growth to a shoot-like indeterminate growth associated with an accumula-
tion of isopentenyl-type cytokinins. Plant physiology. 2001; 126(4):1370–80. Epub 2001/08/14. PMID:
11500537; PubMed Central PMCID: PMCPMC117138.
51. Nikovics K, Blein T, Peaucelle A, Ishida T, Morin H, Aida M, et al. The balance between the MIR164A
and CUC2 genes controls leaf margin serration in Arabidopsis. The Plant cell. 2006; 18(11):2929–45.
Epub 2006/11/14. https://doi.org/10.1105/tpc.106.045617 PMID: 17098808; PubMed Central PMCID:
PMC1693934.
52. Bilsborough GD, Runions A, Barkoulas M, Jenkins HW, Hasson A, Galinha C, et al. Model for the regu-
lation of Arabidopsis thaliana leaf margin development. Proc Natl Acad Sci U S A. 2011; 108(8):3424–9.
Epub 2011/02/09. https://doi.org/10.1073/pnas.1015162108 PMID: 21300866; PubMed Central
PMCID: PMC3044365.
53. Runions A, Tsiantis M, Prusinkiewicz P. A common developmental program can produce diverse leaf
shapes. The New phytologist. 2017; 216(2):401–18. Epub 2017/03/02. https://doi.org/10.1111/nph.
14449 PMID: 28248421; PubMed Central PMCID: PMCPMC5638099.
54. Richardson AE, Rebocho AB, Coen ES. Ectopic KNOX Expression Affects Plant Development by Alter-
ing Tissue Cell Polarity and Identity. The Plant cell. 2016. Epub 2016/08/25. https://doi.org/10.1105/tpc.
16.00284 PMID: 27553356; PubMed Central PMCID: PMCPMC5059799.
55. Pillitteri LJ, Sloan DB, Bogenschutz NL, Torii KU. Termination of asymmetric cell division and differenti-
ation of stomata. Nature. 2007; 445(7127):501–5. https://doi.org/10.1038/nature05467 PMID:
17183267
56. Dow GJ, Berry JA, Bergmann DC. Disruption of stomatal lineage signaling or transcriptional regulators
has differential effects on mesophyll development, but maintains coordination of gas exchange. The
Coordination of cell division and growth during organ morphogenesis
PLOS Biology | https://doi.org/10.1371/journal.pbio.2005952 November 1, 2018 46 / 48
New phytologist. 2017; 216(1):69–75. https://doi.org/10.1111/nph.14746 PMID: 28833173; PubMed
Central PMCID: PMCPMC5601202.
57. Anastasiou E, Kenz S, Gerstung M, MacLean D, Timmer J, Fleck C, et al. Control of plant organ size by
KLUH/CYP78A5-dependent intercellular signaling. Dev Cell. 2007; 13(6):843–56. Epub 2007/12/07.
https://doi.org/10.1016/j.devcel.2007.10.001 PMID: 18061566.
58. Disch S, Anastasiou E, Sharma VK, Laux T, Fletcher JC, Lenhard M. The E3 ubiquitin ligase BIG
BROTHER controls arabidopsis organ size in a dosage-dependent manner. Current biology: CB. 2006;
16(3):272–9. Epub 2006/02/08. https://doi.org/10.1016/j.cub.2005.12.026 PMID: 16461280.
59. Dewitte W, Scofield S, Alcasabas AA, Maughan SC, Menges M, Braun N, et al. Arabidopsis CYCD3 D-
type cyclins link cell proliferation and endocycles and are rate-limiting for cytokinin responses. Proc Natl
Acad Sci U S A. 2007; 104(36):14537–42. Epub 2007/08/30. https://doi.org/10.1073/pnas.0704166104
PMID: 17726100; PubMed Central PMCID: PMC1964848.
60. Bemis SM, Torii KU. Autonomy of cell proliferation and developmental programs during Arabidopsis
aboveground organ morphogenesis. Dev Biol. 2007; 304(1):367–81. Epub 2007/01/30. https://doi.org/
10.1016/j.ydbio.2006.12.049 PMID: 17258192.
61. Horiguchi G, Tsukaya H. Organ size regulation in plants: insights from compensation. Frontiers in plant
science. 2011; 2:24. Epub 2011/01/01. https://doi.org/10.3389/fpls.2011.00024 PMID: 22639585;
PubMed Central PMCID: PMC3355714.
62. Hisanaga T, Kawade K, Tsukaya H. Compensation: a key to clarifying the organ-level regulation of lat-
eral organ size in plants. J Exp Bot. 2015; 66(4):1055–63. Epub 2015/01/31. https://doi.org/10.1093/jxb/
erv028 PMID: 25635111.
63. Tsukaya H. Controlling size in multicellular organs: focus on the leaf. PLoS Biol. 2008; 6(7):e174.
https://doi.org/10.1371/journal.pbio.0060174 PMID: 18630989; PubMed Central PMCID:
PMCPMC2459211.
64. Melaragno JE, Mehrotra B, Coleman AW. Relationship between Endopolyploidy and Cell Size in Epi-
dermal Tissue of Arabidopsis. The Plant cell. 1993; 5(11):1661–8. Epub 1993/11/01. https://doi.org/10.
1105/tpc.5.11.1661 PMID: 12271050; PubMed Central PMCID: PMC160394.
65. Roeder AH, Chickarmane V, Cunha A, Obara B, Manjunath BS, Meyerowitz EM. Variability in the con-
trol of cell division underlies sepal epidermal patterning in Arabidopsis thaliana. PLoS Biol. 2010; 8(5):
e1000367. Epub 2010/05/21. https://doi.org/10.1371/journal.pbio.1000367 PMID: 20485493; PubMed
Central PMCID: PMC2867943.
66. Sugimoto-Shirasu K, Stacey NJ, Corsar J, Roberts K, McCann MC. DNA topoisomerase VI is essential
for endoreduplication in Arabidopsis. Current biology: CB. 2002; 12(20):1782–6. Epub 2002/10/29.
PMID: 12401175.
67. Noir S, Marrocco K, Masoud K, Thomann A, Gusti A, Bitrian M, et al. The Control of Arabidopsis thaliana
Growth by Cell Proliferation and Endoreplication Requires the F-Box Protein FBL17. The Plant cell.
2015; 27(5):1461–76. https://doi.org/10.1105/tpc.114.135301 PMID: 25944099; PubMed Central
PMCID: PMCPMC4456641.
68. Dewitte W, Riou-Khamlichi C, Scofield S, Healy JM, Jacqmard A, Kilby NJ, et al. Altered cell cycle distri-
bution, hyperplasia, and inhibited differentiation in Arabidopsis caused by the D-type cyclin CYCD3.
The Plant cell. 2003; 15(1):79–92. https://doi.org/10.1105/tpc.004838 PMID: 12509523; PubMed Cen-
tral PMCID: PMCPMC143452.
69. Mizukami Y, Fischer RL. Plant organ size control: AINTEGUMENTA regulates growth and cell numbers
during organogenesis. Proc Natl Acad Sci U S A. 2000; 97(2):942–7. Epub 2000/01/19. PMID:
10639184; PubMed Central PMCID: PMC15435.
70. MacAlister CA, Ohashi-Ito K, Bergmann DC. Transcription factor control of asymmetric cell divisions
that establish the stomatal lineage. Nature. 2007; 445(7127):537–40. https://doi.org/10.1038/
nature05491 PubMed PMID: WOS:000243867300043. PMID: 17183265
71. Kumar SV, Wigge PA. H2A.Z-Containing Nucleosomes Mediate the Thermosensory Response in Ara-
bidopsis. Cell. 2010; 140(1):136–47. https://doi.org/10.1016/j.cell.2009.11.006 PubMed PMID:
WOS:000273391900021. PMID: 20079334
72. Dello Ioio R, Nakamura K, Moubayidin L, Perilli S, Taniguchi M, Morita MT, et al. A Genetic Framework
for the Control of Cell Division and Differentiation in the Root Meristem. Science. 2008; 322
(5906):1380–4. https://doi.org/10.1126/science.1164147 PubMed PMID: WOS:000261170600039.
PMID: 19039136
73. Calder G, Hindle C, Chan J, Shaw P. An optical imaging chamber for viewing living plant cells and tis-
sues at high resolution for extended periods. Plant Methods. 2015; 11(1):22. https://doi.org/10.1186/
s13007-015-0065-7 PMID: 25806083
74. Lee K, Avondo J, Morrison H, Blot L, Stark M, Sharpe J, et al. Visualizing plant development and gene
expression in three dimensions using optical projection tomography. The Plant cell. 2006; 18(9):2145–
Coordination of cell division and growth during organ morphogenesis
PLOS Biology | https://doi.org/10.1371/journal.pbio.2005952 November 1, 2018 47 / 48

56. Epub 2006/08/15. https://doi.org/10.1105/tpc.106.043042 PMID: 16905654; PubMed Central
PMCID: PMC1560903.
75. Schindelin J, Arganda-Carreras I, Frise E, Kaynig V, Longair M, Pietzsch T, et al. Fiji: an open-source
platform for biological-image analysis. Nat Methods. 2012; 9(7):676–82. https://doi.org/10.1038/nmeth.
2019 PubMed PMID: WOS:000305942200021. PMID: 22743772
76. R_Core_Team. A language and environment for statistical computing. Foundation for Statistical Com-
puting, Vienna, Austria 2018 [cited 2018 Sep 20]. Available from: http://www.R-project.org/.
77. Sanchez-Corrales YE, Hartley M, van Rooij J, Maree AFM, Grieneisen VA. Morphometrics of complex
cell shapes: lobe contribution elliptic Fourier analysis (LOCO-EFA). Development. 2018; 145(6). Epub
2018/02/16. https://doi.org/10.1242/dev.156778 PMID: 29444894; PubMed Central PMCID:
PMCPMC5897594.
78. Truernit E, Bauby H, Dubreucq B, Grandjean O, Runions J, Barthelemy J, et al. High-resolution whole-
mount imaging of three-dimensional tissue organization and gene expression enables the study of
Phloem development and structure in Arabidopsis. The Plant cell. 2008; 20(6):1494–503. https://doi.
org/10.1105/tpc.107.056069 PMID: 18523061; PubMed Central PMCID: PMCPMC2483377.
79. Nakielski J. Tensorial model for growth and cell division in the shoot apex. In: Carbone A, Gromov M,
Prusinkiewicz P, editors. Pattern Formation in Biology, Vision and Dynamics. Singapore: World Scien-
tific; 2000. p. 252–86.
Coordination of cell division and growth during organ morphogenesis
PLOS Biology | https://doi.org/10.1371/journal.pbio.2005952 November 1, 2018 48 / 48