spatial patterns of climatic changes in the eurasian north
TRANSCRIPT

source: https://doi.org/10.7892/boris.87385 | downloaded: 11.1.2022
Spatial patterns of climatic changes in the Eurasian northreflected in Siberian larch tree-ring parameters andstable isotopes
O L G A V. S I D O R O VA *w , R O L F T . W. S I E G W O L F *, M AT T H I A S S A U R E R *,
M U K H T A R M . N A U R Z B A E V w , A L E X A N D E R V. S H A S H K I N w and E U G E N E A . VA G A N O V w z*Paul Scherrer Institute, Villigen 5232, Switzerland, wV.N. Sukachev Institute of Forest SB RAS, Akademgorodok, Krasnoyarsk
660036, Russia, zSiberian Federal University, Svobodniy pr, 79, Krasnoyarsk 660049, Russia
Abstract
A spatial description of climatic changes along circumpolar regions is presented based on
larch tree-ring width (TRW) index, latewood density (MXD), d13C, d18O of whole wood and
cellulose chronologies from eastern Taimyr (TAY) and north-eastern Yakutia (YAK), Russia,
for the period 1900–2006, in comparison with a d13C cellulose chronology from Finland
(FIN) and a d18O ice core record from Greenland (GISP2). Correlation analysis showed a
strong positive relationships between TRW, MXD, stable isotope chronologies and June,
July air temperatures for TAY and YAK, while the precipitation signal was reflected
differently in tree-ring parameters and stable isotope data for the studied sites. Negative
correlations were found between July, August precipitation from TAY and stable isotopes
and MXD, while May, July precipitations are reflected in MXD and stable isotopes for the
YAK. No significant relationships were found between TRW and precipitation for TAY and
YAK. The areas of significant correlations between July gridded temperatures and TRW,
MXD and stable isotopes show widespread dimension from east to west for YAK and from
north to south for TAY. The climate signal is stronger expressed in whole wood than in
cellulose for both Siberian regions. The comparison analysis between d13C cellulose
chronologies from FIN and TAY revealed a similar declining trend over recent decades,
which could be explained by the physiological effect of the increasing atmospheric CO2.
TRW, MXD and d13C chronologies from TAY and YAK show a negative correlation with
North Atlantic Oscillation index, while the d18O chronologies show positive correlations,
confirming recent warming trend at high latitudes. The strong correlation between GISP2
and d18O of cellulose from YAK chronologies reflects the large-scale climatic signal
connected by atmospheric circulation patterns expressed by precipitation.
Keywords: climate change, d13C and d18O of wood and cellulose, Greenland ice core, late wood density,
North Atlantic Oscillation, northern Finland, permafrost, Siberian north (Russia), spatial patterns,
tree-ring width
Received 9 March 2009 and accepted 29 May 2009
Introduction
The instrumental data show a temperature increase
during the last 100 years for many regions along
circumpolar northern latitudes (ACIA, 2005; IPCC,
2007). The magnitude of temperature obtained from
instrumental data is higher than shown in reconstructed
models obtained from different indirect sources of
paleoclimate information such as ice core, lake sedi-
ments and tree rings (IPCC, 2007; D’Arrigo et al., 2008).
It is therefore important to establish new proxy series to
increase the reliability of the reconstructed climate
signal. Of these proxies, tree-ring chronologies (width,
density and stable isotopes) allow to reconstruct
temperature with temporal resolution up to 1 year for
several millennia (Hughes et al., 1999; Vaganov &
Shiyatov, 1999; Naurzbaev et al., 2002; McCarroll &
Loader, 2004; Sidorova et al., 2008).
Correspondence: Olga V. Sidorova, Paul Scherrer Institute, Villigen
5232, Switzerland, tel. 1 7 3912 495 053; 1 41 56 310 2903, fax 1 7
3912 433 686; 1 41 56 310 4525, e-mails:
[email protected]; [email protected]
Global Change Biology (2010) 16, 1003–1018, doi: 10.1111/j.1365-2486.2009.02008.x
r 2009 Blackwell Publishing Ltd 1003

As well known, trees growing at the northern tree line
in the permafrost zones are very sensitive to climate
changes due to limiting temperature regimes (Vaganov
et al., 1999; Briffa et al., 2001). The tree-ring width and
tree-ring density therefore provide summer temperature
information, but relatively little is known about precipi-
tation changes. However, under low amounts of pre-
cipitations and relatively warm and dry conditions trees
respond to limited water resources by reducing stomatal
conductance, resulting in a diminished intercellular CO2
concentration. This leads to a reduced 13C discrimina-
tion (Farquhar et al., 1989) and increased d18O values
(Farquhar & Lloyd, 1993). Oxygen isotopes in tree rings
are mainly influenced by the isotope signal in precipita-
tion (Craig, 1961), which represents the source water for
trees. Enrichment in d18O occurs in the needles/leaf
during transpiration, which may be enhanced under
drought conditions (Yakir & Sternberg, 2000). A mixed
signal of source and needle water enrichment is finally
stored in the wood and cellulose of the tree rings (Saurer
et al., 1997; Roden & Ehleringer, 2000). The stable isotope
chronologies (d13C, d18O) obtained from the Siberian
north thus show significant relationships not only with
temperature (like tree-ring parameters) but also with
precipitation (unlike tree-ring parameters) (Sidorova
et al., 2008). Most of the Siberian sites are covered by
permafrost, which plays a key role in the stabilization of
the climatic system (ACIA, 2005). The d18O signal could
be weak in the year-to-year variability due to the com-
plex soil hydrology causing an increased water avail-
ability from permafrost thawing and mixing of winter
precipitation and summer rainfall (Boike et al., 1998;
Sugimoto et al., 2002). However, it is possible to expect
strong long-term signals connected with annual precipi-
tation and atmospheric circulation patterns (Hurrell, 1995;
Welker et al., 2005). The application of the stable isotope
analysis in combination with classical dendrochronology
is steadily increasing because stable isotopes provide
complementary information about climatic variabilities
(McCarroll & Pawellek, 2001; Saurer et al., 2002; McCarroll
& Loader, 2004; Gagen et al., 2006; Skomarkova et al., 2006;
Kirdyanov et al., 2008; Sidorova et al., 2008).
In this paper, we report about the response of larch
trees to climatic changes on the eastern Taimyr (Russia)
(TAY) during the last century using tree-ring width,
latewood density and stable isotope wood and cellulose
(d13C, d18O) chronologies. For investigating large-scale
climate patterns and common signals between subarctic
regions we used tree-ring and stable isotope chronolo-
gies from north-eastern Yakutia (Sakcha Republic)
(YAK) (Hughes et al., 1999; Sidorova & Naurzbaev,
2002; Sidorova et al., 2008), d13C cellulose series from
Finland (FIN) (Gagen et al., 2007, 2008) and Greenland
ice core data (GISP 2) (Meese et al., 1994). Moreover, we
analyzed the influence of North Atlantic Oscillation
(NAO) patterns on tree-ring parameters and stable
isotope chronologies from the studied Siberian sites.
The use of different proxy data will improve our under-
standing of factors influencing on growth of conifer
trees in the northern regions and allow to build high
quality climate reconstructions into the past.
Materials and methods
Study site and sample collection
Discs samples from living larch trees (Larix gmelinii
Rupr.) were collected on the eastern part of Taimyr
Peninsula, Hatanga region, Kotuy valley (701380N–
1031210E) (TAY) (Fig. 1). The samples were taken at a
height of 1.3 m in the north-eastern slope of the plateau,
300 m a.s.l. The distance between the trees was 5–8 m.
The soil was covered with a moss layer of 4–5 cm.
The land surface of the study site is characterized by
coarse rocks on continues permafrost layer. The max-
imal depth of permafrost thawing is 40 cm in the middle
of August. The climate is extra continental with short
vegetation seasons (up to 90 days), which could be
variable due to date of snow melt and initiation of
cambial activity (Abaimov et al., 1997; Vaganov et al.,
1999). The tree growth on the studied site is limited by
June and July air temperature (Vaganov et al., 1996;
Abaimov et al., 1997; Naurzbaev et al., 2002). The
warmest month in the studied region is July with an
average air temperature up to 12.6 1C. The average
amount of annual precipitation is 278 mm for the period
of 1934–2006. Most part of the precipitation falls in July–
August. The mean annual temperature is �12.8 1C.
Climatic data
Monthly temperature and precipitation data for TAY are
available for the period 1929–2006 from the ‘Hatanga’
weather station: (711980N, 1021470E, 33 m), http://
climexp.knmi.nl. For the analysis of data from YAK,
we used weather station data from ‘Chokurdach’, lo-
cated approximately 200 km from the study site
(701620N, 1471880E, 61 m). The data were available for
the period 1901–2003. The comparative analysis of
climatological data between two Siberian sites was
carried out for the common period from 1929–2003.
Five-day averages of air temperature from weather
stations ‘Chokurdach’ and ‘Hatanga’ were used for de-
tailed analyses for comparisons with isotope chronolo-
gies. The data were available for the period 1945–1989.
For the analysis of spatial patterns we used gridded
July air temperature (GJT) data 2.11� 0.51, Po10% for
the period 1901–2001.
1004 O . V. S I D O R O VA et al.
r 2009 Blackwell Publishing Ltd, Global Change Biology, 16, 1003–1018

Data from NAO indices were obtained from the
Climatic Research Unit site, http://www.cru.uea.
ac.uk/cru/data/nao.htm, for the period 1821–2000.
The NAO is one of the Northern Hemisphere’s major
multiannual climate fluctuations and traditionally de-
fined as the normalized pressure difference between a
station on the Azores and one on Iceland. An extended
version of the index can be derived for the winter half
using a station in the southwestern part of the Iberian
Peninsula (Hurrell, 1995).
Hamming smoothing (Blackman & Tukey, 1958) with
11-year window was used for revealing long-term
climatic signals between all chronologies.
Compared sites
To reveal common climatic signals along the subarctic we
used available stable isotope (d13C, d18O), tree-ring width
and latewood density chronologies obtained for the
north-eastern Yakutia, Sakcha Republic (701N–1481E)
(YAK) (Hughes et al., 1999; Sidorova & Naurzbaev,
2002; Kirdyanov et al., 2008; Sidorova et al., 2008), a d13C
cellulose chronology from northern Finland (FIN) (Gagen
et al., 2007, 2008; M. H. Gagen, personal communication)
and a d18O ice core chronology from Greenland (GISP2)
(Meese et al., 1994) (Fig. 1). The ice core data (GISP2 –
Greenland Ice Sheet Project 2; 721600N–381500W,
3200 m a.s.l.) were obtained from the web site http://
www.ncdc.noaa.gov/paleo/icecore/greenland/sum-
mit/document/gispisot.htm
Dendrochronological analysis
Tree-ring widths were measured using semiautomatic
devices with accuracy 0.01 mm for 20 living trees for the
period 1846–2006. Cross-dating of samples and statis-
tical calculations were carried out in standard dendro-
chronological software (TSAP, DPL, ARSTAN) (Cook &
Kairiukstis, 1990). These trees were added to the tree-
ring width chronology constructed by Naurzbaev et al.
Fig. 1 Location of the study site in eastern Taimyr, Russia (TAY) and sites, which were used for comparative analyses of stable isotope,
tree-ring width and late wood density chronologies from the Sakcha Republic, north-eastern Yakutia, Russia (YAK) (Hughes et al., 1999;
Kirdyanov et al., 2008; Sidorova et al., 2008); d13C of cellulose chronology is from Laanila, northern Finland (FIN) (Gagen et al., 2007, 2008)
and d18O chronology from Greenland ice core (GISP2).
C L I M A T I C C H A N G E S I N T H E E U R A S I A N N O R T H 1005
r 2009 Blackwell Publishing Ltd, Global Change Biology, 16, 1003–1018

(2002). This combined chronology was used for the
further analysis.
The measurement of maximum latewood density was
carried out using densitometer DENDRO 2003 at the
Swiss Federal Institute of Snow Landscape and Ava-
lanches, WSL (Sidorova, 2004). The maximum latewood
density chronology was built using eight cores of living
trees for the period 1717–2000. Based on high coherence
and statistical relationships the late wood density
chronology from eastern Taimyr (Kotuy), the chronol-
ogy was combined with latewood chronologies ob-
tained by Schweingruber (1996) for the same region.
The stable isotope analysis
For the stable isotope analysis of TAY site we selected
four trees, which were analyzed separately for the13C/12C and 18O/16O isotopic ratios in whole wood and
cellulose for the period 1900–2006. The mean age of trees
used for the stable isotope analysis was 160 years. The
first 50 rings closest to the pith were excluded from
analyses due to the juvenile effect (McCarroll & Loader,
2004; Gagen et al., 2008; Sidorova et al., 2008). The resin
from the wood samples was extracted in ethanol using a
Soxhlet apparatus over 36 h and after that the samples
were washed and dried. The whole wood samples were
split with annual resolution and milled to a fine powder.
Samples of cellulose after extraction (Loader et al., 1997)
were weighed into tin capsules for analysis.
We determined the d13C and d18O values for whole
wood and cellulose using a delta-S mass spectrometer
(Finnigan MAT, Bremen, Germany) linked with two
elemental analyzers (EA-1108 and EA-1110; Carlo Erba,
Rodano, MI, Italy), one set to combustion and one
to pyrolysis mode, via a variable open split interface
(CONFLO-II, Finnigan MAT) at the stable isotope
facility at the Paul Scherrer Institute, Villigen, Switzer-
land. The isotopic values were expressed in the
delta notation relative to the international standards:
dsample 5 (Rsample/Rstandard�1)� 1000, where Rsample is
the molar fraction of 13C/12C, or 18O/16O ratio of the
sample and Rstandard, of the standards VPDB for carbon
and VSMOW for oxygen.
The d13C of whole wood and cellulose were corrected
for the decline of the 13C/12C ratio of atmospheric CO2
due to release of fossil fuel and land use change. The
d13C of atmospheric CO2 was obtained from ice cores
and direct atmospheric measurements at the Mauna
Loa Observatory, Hawaii (Francey et al., 1999; http://
www.esrl.noaa.gov/gmd/ccgg/globalview/co2c13/
co2c13_intro.html).
We subtracted the difference between preindustrial
and present-day d13C of atmospheric CO2 from the raw
isotope series for each year.
Results
Tree-ring width, maximum density and stable isotopechronologies from eastern Taimyr
The larch tree-ring width (TRW) chronology con-
structed for TAY by Naurzbaev et al. (2002) was
prolonged up to 2006 using 20 tree samples. Herein
we present tree-ring width and maximum latewood
density (MXD) chronologies (Fig. 2a) covering the
same period (1900–2006), which we used for the analy-
sis of carbon and oxygen isotope ratios for whole wood
and cellulose (Fig. 2b). TRW and MXD show similar
trends in year-to-year and long-term variability with
correlations between each other up to 0.62 for 1900–2001
(Table 1, Fig. 2a).
We determined d13C and d18O of whole wood and
cellulose for four individual trees separately. The aver-
age of isotope chronologies was constructed (Fig. 2b)
based on strong relationships between the four different
trees for carbon (r 5 0.59–0.64; Po0.05 for whole wood
and cellulose) and for oxygen (r 5 0.49–0.63; Po0.05 for
whole wood and cellulose), respectively. The mean
difference between whole wood and cellulose for car-
bon is 1.64% and for oxygen 3.46%. The mean stable
isotope values for carbon are �25.40% and �23.76% for
whole wood and cellulose and 17.88% and 21.34% for
oxygen, respectively. The d13C chronologies for both
wood and cellulose have an increasing trend until
1960 but after that they strongly decline. This clear
decrease in carbon isotope data was observed although
all data have been corrected for the decline in d13C of
the atmospheric CO2. The whole wood d18O chronology
shows a slight decrease over the 20th century while
cellulose is relatively constant and shows a slightly
increasing trend after 1960.
The MXD chronology shows significant correlations
with all isotope chronologies except for the d18O in
cellulose (see Table 1a), while the TRW chronology shows
significant correlations only with the isotope ratios of
whole wood. The correlation coefficients indicate a high
synchronicity between whole wood and cellulose for
carbon as well as for oxygen isotopes (Table 1a).
Tree-ring width, maximum density and stable isotopechronologies from north-eastern Yakutia
We calculated correlation coefficients between TRW
from earlier studies (Hughes et al., 1999; Sidorova
& Naurzbaev, 2002), MXD (Kirdyanov et al., 2007;
Sidorova et al., 2008) and d13C and d18O in whole wood
and cellulose (Sidorova et al., 2008) from YAK for the
period 1900–2001 (Table 1b). The correlation analysis
showed similar relationships between TRW, MXD and
1006 O . V. S I D O R O VA et al.
r 2009 Blackwell Publishing Ltd, Global Change Biology, 16, 1003–1018

stable isotope chronologies as they were found for
TAY (Table 1a), but we did not find significant correla-
tions between TRW and stable isotope chronologies
(Table 1b). Significant correlations were observed
only between smoothed TRW and d13C whole wood
and cellulose chronologies (r 5 0.29 and 0.35; Po0.05),
respectively. The correlation coefficients between wood
and cellulose from YAK are high for carbon as well
for oxygen (Table 1b). The differences between whole
wood and cellulose for the period 1900–2001 are
1.75% for d13C and 3.56% for d18O. The mean isotope
values for carbon are �25.8% and �24.05% and oxygen
15.5% and 19.06%, for whole wood and cellulose,
respectively.
Climatological analysis
Monthly and annual temperature and precipitation data. The
range of mean temperature and precipitation for the
closest weather stations ‘Hatanga’ (TAY) and
‘Chokurdach’ (YAK) are presented for the common
period from 1929 to 2003 (Table 2). We split the
analyzed period to equal parts with the goal to reveal
changes or similarities in the data sets for the beginning
and the end of 20th century.
The June air temperature changed in TAY less than in
YAK when comparing the last 37 years to the earlier
period, while the July air temperature was relatively
constant for both regions. The temperature of August
Tre
e rin
g in
dex
Max
umum
late
woo
d de
nsity
0
1
0
1
2
3(a)
(b)
TRW
MXD
TAY
Year
10
15
20
25
–27
–25
–23
–21
–19
–17
–15
1900 1910 1920 1930 1940 1950 1960 1970 1980 1990 2000
δ13C
(‰
)
δ18O
(‰
)
δ13C of cellulose
δ13C of wood
δ18O of cellulose
δ18O of wood
TAY
Fig. 2 (a) Standardized tree-ring width (TRW) and maximum latewood density (MXD) chronologies for the periods of 1900–2006 and
1900–2001, correspondingly; (b) d13C and d18O of whole wood and cellulose chronologies in comparison for the period 1900–2006.
C L I M A T I C C H A N G E S I N T H E E U R A S I A N N O R T H 1007
r 2009 Blackwell Publishing Ltd, Global Change Biology, 16, 1003–1018

shows a higher increase for Taimyr than for north-eastern
Yakutia. Also annual air temperatures are increased for
the period 1966–2003 in comparison with 1929–1966, up
to 0.53 1C for YAK and 0.24 1C for TAY. In contrast, the
amount of annual precipitations shows increasing trends
for the last 37 years for both sites, while July precipitation
increases only for YAK (Table 2).
We calculated simple Pearson’s correlation coefficients
between all tree-ring parameters and monthly
temperature and precipitation data from TAY (Fig. 3a)
and YAK (Fig. 3b) for the period 1929–2001. Mainly, June
and July air temperatures show positive significant
correlations with radial tree growth, latewood density
and stable isotopes for both sites (Fig. 3a, b). The cellulose
and whole wood d13C chronologies show negative
significant correlations with July and August precipi-
tation (Fig. 3a). The MXD chronology from TAY also
shows negative significant correlations with precipitation
of July and August (Fig. 3a), which was not observed in
the YAK MXD chronology (Fig. 3b). Negative correlations
were found when relating autumn temperatures of the
previous years and spring temperatures of current years
with tree-ring width and latewood density. A negative
correlation was also found between temperature of
February and carbon isotope values (�0.30 for cellulose
and�0.29 for whole wood) (Fig. 3a). In contrast, we found
positive significant correlation between the temperature
of February and d18O of cellulose for north-eastern Yakutia
(Fig. 3b). Regarding annual temperatures, the correlations
to d13C of whole wood and cellulose from north-eastern
Yakutia were weak but statistically significant (r 5 0.21;
Po0.05).
Negative correlations with annual precipitation were
found for tree-ring width (r 5�0.30; Po0.05), maximum
density (r 5�0.33; Po0.05) and d13C (r 5�0.35; Po0.05)
and d18O of whole wood (r 5�0.26; Po0.05), for the
period 1929–2003, while this was not the case for d13C
and d18O of cellulose.
Five-day average temperature data. For revealing
differences and/or similarities in the responses of trees
from two Siberian sites at the beginning of the growth
Table 1 Correlation coefficients between tree-ring width (TRW) index, maximum latewood density (MXD) and stable isotope (d13C
and d18O of whole wood and cellulose) chronologies for the period 1900–2001 for (a) eastern Taimyr and (b) for north-eastern
Yakutia
Parameter TRW MXD d13C of wood d13C of cellulose d18O of wood d18O of cellulose
(a)
TRW 1.00
MXD 0.62 1.00
d13C of wood 0.23 0.42 1.00
d13C of cellulose 0.37 0.84 1.00
d18O of wood 0.35 0.34 0.33 0.35 1.00
d18O of cellulose 0.23 0.32 0.58 1.00
(b)
TRW 1.00
MXD 0.59 1.00
d13C of wood 0.49 1.00
d13C of cellulose 0.48 0.87 1.00
d18O of wood 0.33 1.00
d18O of cellulose 0.32 0.56 0.47 0.45 1.00
Level of significance is Po0.05. Only significant correlation coefficients are presented.
Table 2 Monthly and annual temperature and precipitation data of the investigated sites (only months shown, which are
significantly correlated with tree-ring parameters and stable isotope chronologies)
Region Period T-June ( 1C) T-July ( 1C) T-August ( 1C) T-annual ( 1C) P-July (mm) P-annual (mm)
TAY 1929–1966 5.31 12.55 8.87 �12.85 44.51 193.91
1966–2003 5.28 12.49 9.49 �13.09 37.82 220.72
1929–2003 5.29 12.52 9.18 �12.97 41.16 207.31
YAK 1929–1966 7.32 10.76 7.86 �13.71 28.79 159.21
1966–2003 6.74 10.73 7.57 �14.24 34.59 177.05
1929–2003 7.03 10.74 7.71 �13.97 31.69 168.13
1008 O . V. S I D O R O VA et al.
r 2009 Blackwell Publishing Ltd, Global Change Biology, 16, 1003–1018

season we calculated correlation coefficients between all
tree-ring parameters and pentad temperatures (Fig. 4a, b).
We observed positive significant correlations with tree-
ring width, latewood density, d13C, d18O of whole wood
and cellulose for eastern Taimyr (Fig. 4a) and significant
correlations for all these parameters for north-eastern
Yakutia except for d18O of whole wood and cellulose
(Fig. 4b). We found that tree-ring width reflects the
temperature signal at the end of June and beginning of
July for eastern Taimyr and at the beginning of June for
north-eastern Yakutia confirming this date as the earliest
start of tree radial growth in the eastern part of Siberia.
The maximum latewood density shows significant
correlations from the middle of June till middle of
August for both regions (Fig. 4b). These relationships
show that the end of the growing season is approximately
at the same time for both regions but the beginning is at
different times. The d13C of whole wood and cellulose
significantly correlated from the middle of June till the
middle of August for TAY (Fig. 4a), while for YAK from
the end of June to the beginning of August (Fig. 4b).
Whereas the d18O of whole wood chronology from
Month
Sig
nific
ant c
orre
latio
n co
effic
ient
s
–0.8
–0.6
–0.4
–0.2
0.0
0.2
0.4
0.6
0.8
Sep
tO
ctN
ovD
ec Jan
Feb
Mar
chA
pril
May
June
July
Aug
Sep
tO
ctN
ovD
ec Jan
Feb
Mar
chA
pril
May
June
July
Aug
– TRW; – MXD
Temperature Precipitation
TAY
(a)
Month
Sig
nific
ant c
orre
latio
n co
effic
ient
–0.8
–0.6
–0.4
–0.2
0.0
0.2
0.4
0.6
0.8
Sep
tO
ctN
ovD
ec Jan
Feb
Mar
chA
pril
May
June
July
Aug
Sep
tN
ovD
ec Jan
Feb
Mar
chA
pril
May
May
June
July
Aug
– TRW; – MXD
– δ13C wood– δ13C cellulose
– δ18C cellulose– δ18C wood
– δ13C wood– δ13C cellulose
– δ18C cellulose– δ18C wood
Temperature Precipitation
(b)YAK
Fig. 3 Correlation coefficients between tree-ring width index (TRW), maximum latewood density (MXD), stable isotope chronologies
(d13C, d18O of whole wood and cellulose) and monthly temperature and precipitation from eastern Taimyr (TAY) (a) and north-eastern
Yakutia (YAK) (b). On this figures we present only significant values (Po0.05). All symbols are identical for both analyzed regions. The
dotted lines are the level of significance.
C L I M A T I C C H A N G E S I N T H E E U R A S I A N N O R T H 1009
r 2009 Blackwell Publishing Ltd, Global Change Biology, 16, 1003–1018

eastern Taimyr shows an earliest response with
temperatures at the end of May till the beginning of
July, d18O of cellulose shows a late response from the
end of June till middle of July (Fig. 4a). On the other
hand, we did not find any significant correlation between
d18O chronologies from YAK and 5-day temperature data
for the analyzed period, but monthly temperature data
indicate a positive relationship between d18O of whole
wood, cellulose and July air temperature (r 5 0.35 and
0.37; Po0.05, respectively) and July precipitation
(r 5�0.31 and �0.32; Po0.05, respectively) for the
period 1900–2004.
Comparison between eastern Taimyr and north-eastern
Yakutia. We observed significant negative correlations
between the chronologies from Taimyr (TAY) and
Date of middle of the pentad
Sig
nific
ant c
orre
latio
n co
effic
ient
0.0
0.2
0.4
0.6
0.8
1.0
MA
Y5_
9
MA
Y15
_19
MA
Y25
_Ma
JUN
E4_
8
JUN
E14
_1
JUN
E24
_J
JULY
4_8
JULY
14_1
JULY
24_2
AU
G3_
7
AU
G13
_17
AU
G23
_27
SE
PT
1_5
SE
PT
11_1
SE
PT
21_2
TRW; MXD
δ18O of wood
δ18O of cellulose
δ13C of wood
δ13C of cellulose
δ13C of wood
δ13C of cellulose
TAY
(a)
Date of the middle of the pentad
Sig
nific
ant c
orre
latio
n co
effic
ient
0.0
0.2
0.4
0.6
0.8
1.0
MA
Y5_
9
MA
Y15
_19
MA
Y25
_Ma
JUN
E4_
8
JUN
E14
_1
JUN
E24
_J
JULY
4_8
JULY
14_1
JULY
24_2
AU
G3_
7
AU
G13
_17
AU
G23
_27
SE
PT
1_5
SE
PT
11_1
SE
PT
21_2
TRW; MXDYAK
(b)
Fig. 4 Correlation coefficients between tree-ring width indices (TRW), maximum latewood density (MXD), stable isotope chronologies
(d13C, d18O of whole wood and cellulose) and 5-day average temperature data (pentads data) from eastern Taimyr (TAY) (a) and north-
eastern Yakutia (YAK) (b). These figures contain only significant values (Po0.05). All symbols are identical for both analyzed regions.
1010 O . V. S I D O R O VA et al.
r 2009 Blackwell Publishing Ltd, Global Change Biology, 16, 1003–1018
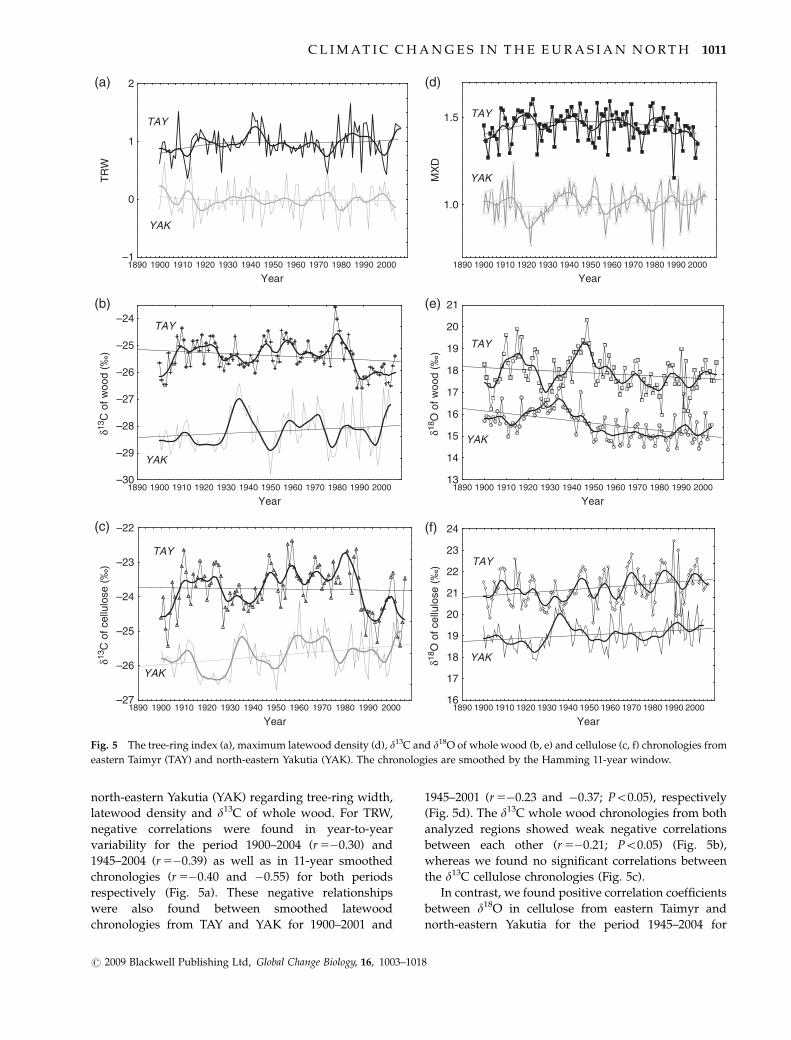
north-eastern Yakutia (YAK) regarding tree-ring width,
latewood density and d13C of whole wood. For TRW,
negative correlations were found in year-to-year
variability for the period 1900–2004 (r 5�0.30) and
1945–2004 (r 5�0.39) as well as in 11-year smoothed
chronologies (r 5�0.40 and �0.55) for both periods
respectively (Fig. 5a). These negative relationships
were also found between smoothed latewood
chronologies from TAY and YAK for 1900–2001 and
1945–2001 (r 5�0.23 and �0.37; Po0.05), respectively
(Fig. 5d). The d13C whole wood chronologies from both
analyzed regions showed weak negative correlations
between each other (r 5�0.21; Po0.05) (Fig. 5b),
whereas we found no significant correlations between
the d13C cellulose chronologies (Fig. 5c).
In contrast, we found positive correlation coefficients
between d18O in cellulose from eastern Taimyr and
north-eastern Yakutia for the period 1945–2004 for
(a)
Year
TR
W
–1
0
1
2
1890 1900 1910 1920 1930 1940 1950 1960 1970 1980 1990 2000
1890 1900 1910 1920 1930 1940 1950 1960 1970 1980 1990 2000
1890 1900 1910 1920 1930 1940 1950 1960 1970 1980 1990 2000 1890 1900 1910 1920 1930 1940 1950 1960 1970 1980 1990 2000
1890 1900 1910 1920 1930 1940 1950 1960 1970 1980 1990 2000
1890 1900 1910 1920 1930 1940 1950 1960 1970 1980 1990 2000
YAK
TAY
(d)
Year
MX
D
1.0
1.5 TAY
YAK
(b)
Year
–30
–29
–28
–27
–26
–25
–24
δ13C
of w
ood
(‰)
TAY
YAK
(e)
Year
13
14
15
16
17
18
19
20
21
δ18O
of w
ood
(‰)
TAY
YAK
(c)
Year
–27
–26
–25
–24
–23
–22
δ13C
of c
ellu
lose
(‰
)
TAY
YAK
(f)
Year
16
17
18
19
20
21
22
23
24
δ18O
of c
ellu
lose
(‰
) TAY
YAK
Fig. 5 The tree-ring index (a), maximum latewood density (d), d13C and d18O of whole wood (b, e) and cellulose (c, f) chronologies from
eastern Taimyr (TAY) and north-eastern Yakutia (YAK). The chronologies are smoothed by the Hamming 11-year window.
C L I M AT I C C H A N G E S I N T H E E U R A S I A N N O R T H 1011
r 2009 Blackwell Publishing Ltd, Global Change Biology, 16, 1003–1018

the smoothed chronologies (r 5 0.32; Po0.05) (Fig. 5f).
Both oxygen isotope chronologies in cellulose show
increasing trends after 1930. We did not find any
significant correlations between d18O whole wood
chronologies of the two regions, although the trends
were similar (Fig. 5e).
Spatial patterns (north-eastern Yakutia, eastern Taimyr and
northern Finland). Using tree-ring width index, latewood
density, stable isotope chronologies from TAY and YAK
we calculated correlation coefficients with GJT within
the coordinates 20–1501E and 50–801N for the period
1901–2002 (Fig. 6). The diagram of spatial dimension of
TRW for YAK and TAY (Fig. 6a, g) shows the areas of
significant correlation coefficients around analyzed
regions. Higher correlation coefficients and larger
areas of their distributions are found for MXD
(Fig. 6b, h). From the diagram we can see differences
in the temperature response between TAY and YAK. In
our climatological analysis we revealed that June is the
determining month for tree growth in YAK and July for
TAY. The spatial patterns of correlations confirm these
differences. d13C of whole wood and cellulose from
YAK (Fig. 6c, d) show high correlations with GJT in
comparison with TRW (Fig. 6a) and show widespread
dimension along the Eurasian north. The GJT and d13C
of whole wood and cellulose from TAY show negative
correlation coefficients with YAK (r 5�0.5; Po10%)
(Fig. 6i, j). The areas of significant relationships
between carbon and GJT are smaller than for oxygen,
which cover large distances from north to south (Fig. 6k,
l). The d18O of wood and cellulose from YAK shows
lower correlation coefficients and covers a smaller area
in comparison with d13C (Fig. 6e, f). The negative
relationship between d13C of whole wood and GJT is
higher for cellulose and very widespread for YAK,
partly reaching to FIN (Fig. 6c). Also the d13C cellu-
lose chronology obtained from Taimyr shows a
higher correlation with GJT than wood (Fig. 6j). The
oxygen isotope signals obtained from YAK trees show
widespread negative patterns toward the West Siberian
Lowland and the Kola Peninsula (Fig. 6e, f).
Stable isotope chronologies along the subarctic circle (north-
eastern Yakutia, eastern Taimyr, northern Finland and
Greenland). As mentioned above, we did not find any
significant correlations between d13C of TAY and YAK
cellulose chronologies. However, we found significant
correlations between cellulose d13C chronologies from
Taimyr and northern Finland (Gagen et al., 2007) in year-
to-year variability for the period 1945–2002 (r 5 0.31) and
in smoothed chronologies for 1900–2002 (r 5 0.28) and for
1945–2002 (r 5 0.60; Po0.05), respectively (Fig. 7). The
d13C chronologies in cellulose from TAY and FIN show
similar decreasing trends after 1940.
The comparison of the d18O data from a Greenland ice
core and d18O in cellulose from Siberian trees (TAY, YAK)
showed common climatic signals along the subarctic
circle. We found a high coherence and a statistically
significant relationship (r 5 0.80; Po0.05) between GISP2
and YAK for the period 1900–1986 for smoothed chrono-
logies (Fig. 8), whereas the d18O cellulose chronology from
Taimyr showed a very different pattern.
The NAO signature in the tree-ring parameters of northern
Siberian larch trees. The tree-ring index chronologies
from TAY and YAK show opposite patterns compared
with NAO of February (Fig. 9a). Negative correlations
to NAO were found for smoothed tree-ring width index
chronology, latewood density and d13C of whole wood
from Taimyr and north-eastern Yakutia for the whole
analyzed period 1900–2000 and for the last fifty years
1950–2000 (Table 3). During the positive phase of NAO
after the 1980s we observed negative tree-ring index,
late wood density (Fig. 9b) and carbon (Fig. 9c) patterns
for both regions, while for oxygen we found positive
correlations and overlapping (synchronous) patterns
with NAO (Fig. 9d).
Discussion
Seasonality
Based on tree-ring width and stable isotope analysis we
found that in the eastern part of Siberia (YAK) the tree
growth season starts earlier than in north-central Siberia
(TAY). Previous studies showed that seasonality in
these regions is dominated by the variability of snow
melt and strongly depends on the spring temperatures,
which therefore play an important role in starting tree
growth forming (Abaimov et al., 1997; Vaganov et al.,
1999). Recently, numerous papers reported about shift-
ing vegetation seasons to the earlier periods in northern
regions due to a warming trend (Vaganov et al., 1999;
Briffa et al., 2001). In contrast to the tree-ring width
records, the signal obtained from the whole wood d18O
Taimyr chronology indicated an even earlier tempera-
ture response of trees already at the end of May. This
relationship could indicate the beginning of snow melt
and root physiological activity in this region as soon as
temperatures are 40 1C (Vaganov et al., 1996; Abaimov
et al., 1997). However, the d18O whole wood and cellu-
lose chronologies from north-eastern Yakutia did not
show any significant response indicated by 5 days
average temperature data. Possible explanation of this
could be the complex soil hydrology. Even in the
beginning of the growth season when temperature of
1012 O . V. S I D O R O VA et al.
r 2009 Blackwell Publishing Ltd, Global Change Biology, 16, 1003–1018

Fig. 6 Spatial dimension of correlation coefficients between tree-ring parameters, stable isotopes and July air temperature data obtained
by grid data (http://climexp.knmi.nl) with a temporal resolution of up to 2.1� 0.51 grad, Po10% for the period 1901–2001. The colors
indicate the correlations, negative correlations are represented by blue to green colors, whereas positive correlations are represented by
red to yellow colors (see the color scales at the bottom of the figure panels).
C L I M A T I C C H A N G E S I N T H E E U R A S I A N N O R T H 1013
r 2009 Blackwell Publishing Ltd, Global Change Biology, 16, 1003–1018

June is the most important factor for tree growth the soil
is still frozen and the snow cover in this region is
minimal in comparison with eastern Taimyr. Our results
show that the combination of ring width and stable
isotopes allows to better analyze the onset of tree
physiological activity and the changes in environmental
conditions that are required for tree growth to start.
Drought/CO2 saturation
According to weather station data for the last 37 years
the amount of June and July precipitation was slightly
decreasing for TAY and slightly increasing for YAK.
Decreasing precipitation during the analyzed period
for TAY and along with a slight annual temperature
increase, could lead to deeper thawing of permafrost
and to hardly freezing soil back (Boike et al., 1998;
Euskirchen et al., 2006). In line with the lower amount
of available water and higher temperature in TAY, the
Year
–26
–24
–22
1890 1900 1910 1920 1930 1940 1950 1960 1970 1980 1990 2000
TAYFIN
δ13C
of c
ellu
lose
(‰
)
Fig. 7 The d13C of cellulose chronologies from eastern Taimyr
(TAY) and northern Finland (FIN) are shown. The data are
smoothed by the Hamming 11-year window.
Year
–38
–37
–36
–35
–34
–33
–32
–31
–30
18
19
20
21
22
δ18O
in c
ellu
lose
(‰
)
δ18O
in
ice
core
(‰
)
YAK
TAY
GISP2
Fig. 8 The d18O of cellulose chronologies from eastern Taimyr
and north-eastern Yakutia in comparison with the d18O in Green-
land ice core chronology. The data are smoothed by the Ham-
ming 11-year window.
NA
O
TR
W
–3
–2
–1
0
1
2
3
4
–3
–2
–1
0
1
2
3
4(a)
(b)
(c)
(d)
TRW
NA
O
MX
D
–3
–2
–1
0
1
2
3
4
–3
–2
–1
0
1
2
3
4MXD
�13C
�18O
NA
O
Car
bon
–3
–2
–1
0
1
2
3
4
–3
–2
–1
0
1
2
3
4
Year
NA
O
Oxy
gen
–3
–2
–1
0
1
2
3
4
–3
–2
–1
0
1
2
3
4
1890
1900
1910
1920
1930
1940
1950
1960
1970
1980
1990
2000
Fig. 9 The positive and negative phases of the normalized North
Atlantic Oscillation index chronology in comparison with the
normalized chronologies (a) tree-ring width index, (b) latewood
density, (c) d13C of cellulose and (d) d18O of cellulose from eastern
Taimyr and north-eastern Yakutia for the period 1900–2000.
1014 O . V. S I D O R O VA et al.
r 2009 Blackwell Publishing Ltd, Global Change Biology, 16, 1003–1018

decreasing d13C and increasing d18O of cellulose after
1970s could indicate a reduction in photosynthetic
capacity and stomatal conductance and development
of a drought situation based on isotope fractionation
theory (Scheidegger et al., 2000). A similar conclusion
was recently drawn for a somewhat less northern site
(641N) also in central Siberia, where strong isotope
trends over the 20th century were observed (Sidorova
et al., 2009). In addition to the changes in climatic
conditions, also the influence of increasing atmospheric
CO2 has to be considered. The limited access to nutri-
ents in the permafrost region suggests strongly a CO2
saturation of these trees. As the photosynthetic capacity
can no longer be enhanced the intercellular CO2 con-
centration will increase along with the ambient CO2.
Thus the D13CO2 discrimination will increase with in-
creasing CO2 concentration resulting in a continuous
decrease of d13C. As d13C decreases due to elevating
ambient CO2 concentrations the reduction in stomatal
conductance can detected by an increase in d18O. A
previous stable isotope study for Siberian Scots pine in
Turuchansk (661N) showed a declining trend in D13Cc
for the second half of the 20th century. Arneth et al.
(2002) explained the trend by tree responses to increas-
ing atmospheric CO2 concentration and increasing
water use efficiency due to increasing soil water deficit
and declining air humidity.
Trends over recent decades/wood and cellulose
Declining trends for the last decades, in d13C of cellulose
were not only found in eastern Taimyr, but also in
Finland, even after d13C correction for the atmospheric
CO2, showing a possibly wide-spread phenomenon
(McCarroll et al., 2009). Similarly, declining trends in tree
growth have been reported for many areas which could
be explained by (a) drought stress (Barber et al., 2000;
Wilmking et al., 2005; Sidorova et al., 2008), (b) time-
dependent responses to recent warming (increasing tem-
perature and CO2) (Briffa et al., 1998), (c) delayed snow
melt (Vaganov et al., 1999) and (d) seasonality changes
(Skomarkova et al., 2006).
The oxygen isotopes, on the other hand, do not show
unambiguous trends. The d18O cellulose chronology
obtained from eastern Taimyr shows a slight increase
after 1960s, while d18O of whole wood show slight
decreases. Previous studies, which were carried out
for the Eurasian north showed declining trends for
d18O from wood chronologies and were explained by
changes in the seasonality of precipitation (Saurer et al.,
2002). Although our wood d18O data agreed with earlier
data the analysis for d18O of cellulose, which was
carried out for the northern region for the first time
show an opposite pattern to the whole wood. The reason
for these differences could be explained by changes in the
composition of different wood constituents (e.g. cellu-
lose/lignin ratio, sucrose, starch) (Sidorova et al., 2008), or
in the composition differences of heart and sapwood
(D’Alessandro et al., 2004) induced by climatic changes
(temperature/precipitation) or elevated CO2. Differences
between whole wood and cellulose up to 4% were found
for oxygen for both analyzed Siberian regions (17.9% for
wood and 21.34% for cellulose – TAY; 15.5% for wood
and 19.06% for cellulose – YAK), respectively, where
isotopic exchange with hydroxyl groups in metabolic
reactions in needles and stems has to be considered
(Sternberg et al., 1986; Saurer et al., 1997; Roden &
Ehleringer, 2000). The increasing d18O values from east
to west can be explained by the latitude effect (Saurer
et al., 2002). The differences between whole wood and
cellulose for carbon were up to 2% for TAY (�25.4
for wood and �23.76 for cellulose) and for YAK (�25.8
for wood and �24.05 for cellulose), respectively. For a
better understanding of mechanisms causing these differ-
ences between d18O of whole wood and cellulose and
different trends over time, the compound specific isotope
analysis would be needed.
Spatial patterns in Siberia
We analyzed the spatial dimension of correlations
between our site tree-ring and stable isotope data and
temperature to get insight into the patterns of climate
change (Fig. 6). The climate in the vast territory of
Table 3 The significant correlation coefficients between tree-ring width (TRW) index, latewood density (MXD), stable isotope
chronologies from eastern Taimyr and north-eastern Yakutia and index of North Atlantic Oscillation for February
Region Period
Parameter
TRW MXD d13C of wood d13C of cellulose d18O of wood d18O of cellulose
TAY 1900–2000 �0.35 �0.36 �0.28 �0.34
1950–2000 �0.53 �0.77 �0.71 �0.72
YAK 1900–2000 �0.41 �0.42 0.28 0.55
1950–2000 �0.46 �0.42
C L I M A T I C C H A N G E S I N T H E E U R A S I A N N O R T H 1015
r 2009 Blackwell Publishing Ltd, Global Change Biology, 16, 1003–1018

northern Eurasia, where there are little topographic
barriers, clearly is controlled by large-scale atmospheric
pressure gradients. Therefore correlations between cli-
mate over large distances can be expected. Indeed, we
observed that correlations from the YAK site to July
temperatures at locations thousands of kilometers away
can be found, with the area of correlation extending
mostly in the direction of east to west. Respective
correlation for the central Siberian site TAY were also
extending far, but more from the north to the south.
However, we also observed an interesting opposite
patterns of climatic changes between the two Siberian
regions, in that areas that correlate positively with TAY
correlate negatively with YAK, mainly for ring width,
density and d13C (see Fig. 6a, b, f, i, j, k). This same
opposite behavior was observed for the temporal
changes in ring width, density and d13C (Fig. 5),
indicating that relatively warm temperatures in one
region are often occurring when temperatures in the
other region are relatively cold. Opposite patterns of
climate change as observed in our work challenge the
wide-spread approach of averaging different chronolo-
gies for obtaining an Eurasian or even hemispheric
temperature reconstruction, because the averaging will
cancel out important regional differences in trends. This
probably reflects changes in the atmospheric circulation
that affect central and eastern Siberia differently. An
earlier study showed an indirect link between tree-ring
parameters from Eurasian north and the atmospheric
circulation via the land temperature (Briffa et al., 2002).
The authors assumed that the relationship between
proxy series and its local climate is stationary meaning
that the response of surface climate to atmospheric
circulation variations will not change. Further it was
shown that the network of tree-ring density chronolo-
gies exhibits spatially coherent modes of variability and
that they are closely matched with summer temperature
variations, in terms of similar spatial patterns and
temporal evolution during the instrumental period.
The improved results allow the reconstruction of the
large-scale atmospheric circulation patterns that in-
cluded precipitation-sensitive networks of tree-ring
parameters around the Northern Hemisphere.
NAO
Changes in the Eurasian subarctic like temperature
increase, thawing of permafrost, changes in seasonality
(shifting of the beginning of the growth period) and
changes in the amount of precipitations are linked to a
positive phase of NAO (Hurrell, 1995; Boike et al., 1998;
Vaganov et al., 1999; Serreze et al., 2000; Briffa et al., 2002;
Stone et al., 2002; Sugimoto et al., 2002; Welker et al.,
2005; Euskirchen et al., 2006). The NAO is a large-scale
mode of atmospheric circulation, which has positive
and negative phases. The positive and negative phases
of the NAO are defined by the differences in pressure
between the persistent low over Greenland and Iceland
and the persistent high off the coast of Portugal. That is,
the low has a lower atmospheric pressure and the high
has a higher atmospheric pressure. During a positive
NAO, both systems are stronger than usual. During the
negative phase of the NAO, both systems are weaker,
lowering the difference in pressure between them.
During a strong positive NAO index, the winds along
this conduit pick up, and they push the storms toward
Eurasian north with temperature increase and reduc-
tion/stability in precipitations, which are observed
during the last 30 years (Hurrell, 1995; Serreze et al.,
2000; Welker et al., 2005). The negative phases are
characterized by high atmospheric pressure and tem-
perature decrease. The positive relationship, which was
found between February temperature and d18O of cel-
lulose for north-eastern Yakutia and the negative corre-
lations between the temperature of February and d13C
of wood and cellulose for eastern Taimyr, could also be
explained by the influence of NAO.
Large scale
The correlation analysis, which was carried out along the
circumpolar circle revealed high correlation coefficients
between the d18O cellulose chronology from north-east-
ern Yakutia and Greenland ice core d18O data, two
locations separated by thousands of kilometers. It is
interesting to note that Greenland and YAK are almost
on opposite points of the polar sea (see Fig. 1). Climatic
connections over such large distances are a result of
atmospheric circulation patterns controlling the precipi-
tations (Welker et al., 2005). The resulting temperature
changes influence the freezing and thawing processes in
the upper soil during several years. The different acces-
sible sources of water (snow, rain and melting water) lead
to an annual climatic signal similar to that accumulated in
d18O of ice cores. The positive correlations between oxy-
gen isotope data at north-eastern Yakutia with Greenland
ice cores indicate similarities in the nature of low-
frequency temperature variability during the recent per-
iod in these two regions. The revised pattern was ob-
served for eastern Taimyr and accordingly no significant
correlation was found for the recent period between these
regions, in fact the temperature and precipitation patterns
between eastern Taimyr and Greenland was opposite.
Conclusions
A new tree-ring index, d13C and d18O whole wood and
cellulose chronology was obtained from TAY, which
1016 O . V. S I D O R O VA et al.
r 2009 Blackwell Publishing Ltd, Global Change Biology, 16, 1003–1018

showed declining trends mainly in density and carbon
isotopes during the period 1950–2006. The d13C of wood
and cellulose chronologies from YAK did not show such
declining trends as we found for d13C of cellulose
chronologies from TAY and FIN. This could indicate
that forest ecosystems in north-eastern Siberia (YAK)
still are less impacted by global warming than in north-
ern parts of central Siberia (TAY).
The climatological analysis revealed that the stable
isotope data (C, O) show a significant relationship with
July precipitation, which is not observed in tree-ring
widths. Complementary, latewood density chronology
obtained from TAY show similar relationships as stable
isotopes.
The isotope chronologies from the northern Siberian
sites carry information on large-scale climate patterns.
In particular, the d18O signal from the eastern site YAK
proved to have many wide-ranging connections, reach-
ing as far as to Greenland and even responding to the
NAO. This indicates that this location is ideal for
capturing a representative climate signal for a large
area, which is important in the context of climate
reconstructions over millennia which are possible for
this site (Sidorova et al., 2008). On the other hand, we
found that the climatic signals inferred from tree-ring
width and d13C of whole wood and cellulose from TAY
and YAK show inverse (negative correlations) response.
This demands a cautionary note that climate variations
are not uniform over northern Eurasia, but that differ-
ent modes of atmospheric circulation can result in
complex warming and cooling patterns.
The signal obtained from d18O of whole wood and
cellulose from TAY and YAK show similar trends for the
common period 1900–2004. The d18O data could be
considered as a climatic indicator for long-term climatic
changes, which is confirmed by other proxies such as
d18O in Greenland ice core data and NAOs.
The temperature signal reflected in TRW, MXD and
stable isotope chronologies from both Siberian regions
show widespread dimension patterns from east to west
(latitude effect) and from north to south (longitude effect).
For obtaining the quantitative information about cli-
matic changes in the past the use of multidisciplinary
approach by analyzing multiproxy data as performed in
this study is needed.
Acknowledgements
This work was supported by Swiss National Science FoundationSNF_200021_121838/1, (PIOI2-119259/1), SCOPES program (No.IB73A0-111134), European Science Foundation BASIN-SIBAE(No. 596) and the grants of RFBR No. 09-05-98015-r_Sibir_a,RFBR No. 09-04-00803a, 07-04-00293-a. The authors thank MaryGagen and Danny McCarroll from Swansea University, Englandfor providing d13C data from Laanila (Finland) and for their
useful advises. This work was conducted in collaboration withthe EU-funded Millennium project (017008).
References
Abaimov AP, Bondarev AI, Zyryanova OA, Shitova SA (1997)
Polar Forests of Krasnoyarsk Region. Nauka Press, Novosibirsk.
ACIA (2005) Arctic Climate Impact Assessment. Cambridge Uni-
versity Press, Cambridge, NY, USA.
Arneth A, Lloyd J, Santruckova H et al. (2002) Response of
central Siberian Scots pine to soil water deficit and long-term
trends in atmospheric CO2 concentration. Global Biogeochemical
Cycles, 16, 5/1–5/13, doi: 10.1029/2000GB001374.
Barber VA, Juday GP, Finney B (2000) Reduced growth of
Alaskan white spruce in the twentieth century from tempera-
ture-induced drought stress. Nature, 405, 668–673.
Blackman RB, Tukey JW (1958) The Measurement of Power Spectra
from the Point of View of Communication Engineering. Dover
Publications, New York.
Boike J, Roth K, Overduin PP (1998) Thermal and hydrological
dynamics of the active layer at a continuous permafrost site
(Taymyr Peninsula, Siberia). Water Sources Research, 34, 355–363.
Briffa K, Osborn T, Schweingruber F et al. (2001) Low-frequency
temperature variations from a northern tree ring density net-
work. Geophysical Research, 106, 2929–2941.
Briffa K, Schweingruber F, Jones P, Osborn T (1998) Reduced
sensitivity of recent tree growth to temperature at high north-
ern latitudes. Nature, 391, 678–682.
Briffa KR, Osborn TJ, Schweingruber FH, Jones PD, Shiyatov SG,
Vaganov EA (2002) Tree-ring width and density data around
the Northern Hemisphere: part 2, spatial-temporal variability
and associated climate patterns. The Holocene, 12, 759–789.
Cook ER, Kairiukstis LA (eds) (1990) Methods of Dendrochronol-
ogy. Applications in the Environmental Sciences. Kluwer
Academic Publishers, Dordrecht.
Craig H (1961) Isotopic variations in meteoric waters. Science,
133, 1702–1703.
D’Alessandro CM, Guerrieri MR, Saracino A (2004) Comparing
carbon isotope composition of bulk wood and holocellulose
from Quercus cerris, Fraxinus ornus and Pinus radiata tree rings.
Forest, 1, 51–57.
D’Arrigo R, Wilson R, Liepert B, Cherubini P (2008) On the ‘‘Diver-
gence Problem’’ in Northern forests: a review of the tree-ring
evidence and possible causes. Global and Planetary Change, 60,
289–305.
Euskirchen ES, McGuire AD, Kicklighter DW, Zhuang Q, Clein
JS (2006) Importance of recent shifts in soil thermal dynamics
on growing season length, productivity, and carbon sequestra-
tion in terrestrial high-latitude ecosystems. Global Change
Biology, 12, 731–750.
Farquhar GD, Ehleringer JR, Hubick KT (1989) Carbon isotope
discrimination and photosynthesis. Annual Review of Plant
Physiology and Plant Molecular Biology, 40, 503–537.
Farquhar GD, Lloyd J (1993) Carbon and oxygen isotope effects
in the exchange of carbon dioxide between plants and the
atmosphere. In: Stable Isotope and Plant Carbon/Water Relations
(eds Ehleringer JR, Hall AE, Farquhar GD), pp. 47–70.
Academic Press, San Diego.
C L I M A T I C C H A N G E S I N T H E E U R A S I A N N O R T H 1017
r 2009 Blackwell Publishing Ltd, Global Change Biology, 16, 1003–1018
Francey RJ, Allison CE, Etheridge DM (1999) A 1000-year high
precision record of d13C in atmospheric CO2. Tellus, B51, 170–193.
Gagen MH, McCarroll D, Edouard J-L (2006) Combining ring
width, density and stable carbon isotope proxies to enhance
the climate signal in tree-rings: an example from the southern
French Alps. Climatic Change, 78, 363–379.
Gagen MH, McCarrol D, Loader NJ, Robertson I, Jalkanen R,
Anchukaitis KJ (2007) Exorcising the ‘segment length curse’
summer temperature reconstruction since AD 1640 using non
de-trend stable carbon isotope ratios from line trees in north-
ern Finland. The Holocene, 17, 433–444.
Gagen MH, McCarrol D, Robertson I, Loader NJ, Jalkanen R
(2008) Do tree ring d13C series from Pinus sylvestris in northern
Fennoscandia contain long-term non-climatic trends? Chemical
Geology, 252, 42–51.
Hughes MK, Vaganov EA, Shiyatov SG, Touchan R, Funkhouser
G (1999) Twentieth-century summer warmth in northern
Yakutia in a 600-year context. The Holocene, 9, 603–608.
Hurrell JW (1995) Decadal trends in the North Atlantic Oscilla-
tion and relationships to regional temperature and precipita-
tion. Science, 269, 676–679.
IPCC (2007) 4th Assessment Report Intergovernmental Panel on
Climate Change, Chap. 6, pp. 434–497. IPCC, Geneva, Switzerland.
Kirdyanov AV, Treydte KS, Nikolaev A, Helle G, Schleser GH
(2008) Climatic signals in tree ring width, density and d13C
from larches in Eastern Siberia (Russia). Chemical Geology, 252,
31–41.
Kirdyanov AV, Vaganov EA, Hughes MK (2007) Separating
the climatic signal from tree-ring width and maximum late-
wood density records. Trees, 21, 37–44.
Loader NJ, Robertson I, Barker AC, Switsur VR, Waterhouse JS
(1997) Improved technique for the batch processing of small
whole wood samples to alpha-cellulose. Chemical Geology, 136,
313–317.
McCarroll D, Gagen MH, Loader NJ et al. (2009) Correction of
tree ring stable carbon isotope chronologies for changes in the
carbon dioxide content of the atmosphere. Geochimica et
Cosmochimica Acta, 73, 1539–1547.
McCarroll D, Loader NJ (2004) Stable isotopes in tree rings.
Quaternary Science Reviews, 23, 771–801.
McCarroll D, Pawellek F (2001) Stable carbon isotope ratios of
Pinus sylvestris from northern Finland and the potential for
extracting a climate signal from long Fennoscandian chronol-
ogies. The Holocene, 11, 517–526.
Meese DA, Alley RB, Gow AJ et al. (1994) The accumulation
record from the GISP2 core as an indicator of climate change
throughout the Holocene. Science, 266, 1680–1682.
Naurzbaev MM, Vaganov EA, Sidorova OV, Schweingruber FH
(2002) Summer temperatures in eastern Taimyr inferred from a
2427-year late-Holocene tree-ring chronology and earlier float-
ing series. The Holocene, 12, 727–736.
Roden JS, Ehleringer JR (2000) Hydrogen and oxygen isotope
ratios of leaf water and tree ring cellulose for field grown
riparian trees. Oecologia, 123, 481–489.
Saurer M, Aellen K, Siegwolf R (1997) Correlating d13C and d18O
in cellulose of trees. Plant, Cell and Environment, 20, 1543–1550.
Saurer M, Schweingruber F, Vaganov EA, Schiyatov SG, Siegwolf
R (2002) Spatial and temporal oxygen isotope trends at the
northern tree-line in Eurasia. Geophysical Research Letters, 29,
doi: 10.1029/2001GL013739.
Scheidegger Y, Saurer M, Bahn M, Siegwolf R (2000) Linking
stable isotopes with stomatal conductance and photosynthetic
capacity: a conceptual model. Oecologia, 125, 350–357.
Schweingruber FH (1996) Tree Rings and Environment Dendroecol-
ogy. Paul Haupt Publisher, Bern.
Serreze MC, Walsh JE, Chapin FS (2000) Observational evidence
of recent change in the northern high latitude environment.
Climate Change, 46, 159–207.
Sidorova OV (2004) Analysis of the tree-ring and density character-
istics of larch in the Eastern Taimyr. Proceedings of International
Symposium, Saint-Petersburg. pp. 119–123.
Sidorova OV, Naurzbaev MM (2002) Response of Larix cajanderi
to climatic changes at the upper timberline and in the Indi-
girka River valley. Lesovedenie, 2, 73–75 (in Russian).
Sidorova OV, Siegwolf RTW, Saurer M, Naurzbaev MM, Vaga-
nov EA (2008) Isotopic composition (d13C, d18O) in wood and
cellulose of Siberian larch trees for early Medieval and recent
periods. Geophysical Research Biogeosciences, 113, G02019, doi:
10.1029/2007JG000473.
Sidorova OV, Siegwolf RTW, Saurer M et al. (2009) Do centennial
tree-ring and stable isotope trends of Larix gmelinii (Rupr.)
indicate increasing water shortage in the Siberian North?
Oecologia, in press, doi: 10.1007/s00442-009-1411-0.
Skomarkova MV, Vaganov EA, Mund M et al. (2006) Inter-annual
and seasonal variability of radial growth, wood density and
carbon isotope ratios 13C /12C in tree rings of beech (Fagus
sylvatica) growing in Germany and Italy. Trees, 20, 571–586.
Sternberg L, Deniro MJ, Savidge R (1986) Oxygen isotope exchange
between metabolites and water during biochemical reactions
leading to cellulose synthesis. Plant Physiology, 82, 423–427.
Stone RS, Dutton EG, Harris JM (2002) Earlier spring snowmelt
in northern Alaska as an indicator of climate change. Journal of
Geophysical Research, 107, 4089, doi: 10.1029/2000JD000286.
Sugimoto A, Yanagisawa N, Naito D, Fujita N, Maximov TC
(2002) Importance of permafrost as a source of water for plants
in east Siberian taiga. Ecological Research, 17, 493–503.
Vaganov EA, Hughes MK, Kirdyanov AV, Schweingruber F,
Silkin PP (1999) Influence of snowfall and melt timing on tree
growth in subarctic Eurasia. Nature, 400, 149–151.
Vaganov EA, Naurazbaev MM, Schweingruber FH, Briffa KR,
Moell M (1996) An 840-year tree-ring width chronology for
Taimyr as an indicator of summer temperature changes.
Dendrochronologia, 14, 193–205.
Vaganov EA, Shiyatov SG (1999) The role of dendroclimatical
and dendrohydrological study in development of global
and regional ecological problems. Siberian Ecological Journal, 6,
111–115.
Welker JM, Rayback S, Henry HR (2005) Arctic and North
Atlantic Oscillation phase changes are recorded in the isotopes
(d18O and d13C) of Cassiope tetragona plants. Global Change
Biology, 11, 997–1002.
Wilmking M, D’Arrigo R, Jacoby G, Juday G (2005) Divergent
growth responses in circumpolar boreal forests. Geophysical
Research Letters, 32, L15715, doi: 10.1029/2005GLO23331.
Yakir DL, Sternberg L (2000) The use of stable isotopes to study
ecosystem gas exchange. Oecologia, 123, 297–311.
1018 O . V. S I D O R O VA et al.
r 2009 Blackwell Publishing Ltd, Global Change Biology, 16, 1003–1018