spatial density estimation based segmentation of...
TRANSCRIPT

SPATIAL DENSITY ESTIMATION BASED SEGMENTATION OF SUPER-RESOLUTIONLOCALIZATION MICROSCOPY IMAGES
Kuan-Chieh Jackie Chen1,2,3, Ge Yang1,2, and Jelena Kovacevic3,1,2
1Dept. of Biomedical Eng., 2Center for Bioimage Informatics, 3Dept. of Electrical & Computer Eng.Carnegie Mellon University, Pittsburgh, PA 15213, USA
ABSTRACT
Super-resolution localization microscopy (SRLM) is a newimaging modality that is capable of resolving cellular struc-tures at nanometer resolution, providing unprecedented in-sight into biological processes. Each SRLM image is recon-structed from a time series of images of randomly activatedfluorophores that are localized at nanometer resolution andrepresented by clusters of particles of varying spatial densi-ties. SRLM images differ significantly from conventional flu-orescence microscopy images because of fundamental differ-ences in image formation. Currently, however, few quantita-tive image analysis techniques exist or have been developedor optimized specifically for SRLM images, which signifi-cantly limit accurate and reliable image analysis. This is espe-cially the case for image segmentation, an essential operationfor image analysis and understanding. In this study, we pro-posed a simple SRLM image segmentation technique basedon estimating and smoothing spatial densities of fluorophoresusing an adaptive anisotropic kernel. Experimental resultsshow that the proposed method provides robust and accuratesegmentation of SRLM images and significantly outperformsconventional segmentation approaches such as active contourmethods in segmentation accuracy.
Index Terms— Super-resolution microscopy, STORM,fluorescence imaging, image segmentation, spatial density es-timation
1. INTRODUCTION
Super-resolution microscopy techniques, which overcomethe resolution limit of convention optical microscope by im-proving the resolution to ∼20 nm, are revolutionizing biolog-ical research with the ability to resolve biological structuresat nanometer resolution. Super-resolution localization mi-croscopy (SRLM) such as stochastic optical reconstructionmicroscopy (STORM) [1] and photo-activated localizationmicroscopy (PALM) [2] achieve nanometer resolution by
We thank Dr. Michael Davidson for providing the sample slide usedto generate the data shown in Fig. 1. We gratefully acknowledge supportfrom the US NSF through awards 1017278 (J.K.), and DBI-1149494, DBI-1052925, MCB-1052660 (G.Y).
MitochondriaMicrotubules
Conventional
STORM
DC
BA
Fig. 1. Comparisons between conventional fluorescence mi-croscopy and STORM images of microtubules and mitochondria.(A, C) Widefield and STORM images of microtubules, respectively;(B, D) widefield and STORM images of mitochondria, respectively.Scale bars, 500 nm.
randomly activating separate fluorophores and computation-ally resolving their locations at nanometer resolution. Thelocalized fluorophores from different raw image frames arecombined into the final reconstructed image. While super-resolution techniques provide powerful tools for studyingcellular processes at nanometer resolution, current analysesof SRLM imaging remain largely qualitative. SRLM imagescontain clusters of particles that reflect locations of individualactivated fluorophores of varying spatial densities. Com-putational image analysis techniques that are developed oroptimized specifically for the unique properties of SRLMimages remain lacking.
Image segmentation is often the first step in quantitativeimage analysis. Although super-resolution images providesignificantly improved spatial resolution in visualizing cellu-lar structures (Fig. 1), this improvement in SRLM image anal-ysis can only be achieved using reliable and accurate imagesegmentation tools.
In conventional epifluorescence or confocal microscopyimages, objects can generally be characterized as continuousregions of fluorescence signals. In contrast, objects in SRLMimages appear as clusters of estimated fluorophore locations

with different spatial densities. To visualize detected fluo-rophores, common approaches are to render each particle as anormalized Gaussian kernel with the size proportional to thelocalization precision or to render a spatial histogram with apre-specified bin size [3]. Direct segmentation of such imagesis problematic. As shown for example in Fig. 1, SRLM im-ages appear punctate and the edges of image objects are oftenpoorly defined due to random activation of fluorophores. Es-sentially, the randomly activated fluorophores provide a sam-pling of the underlying true spatial density distribution of allfluorophores.
Another commonly encountered issue in SRLM images issparsely distributed artifacts (particles) appearing in the back-ground regions, which may result from diffused fluorophores;these isolated features need to be properly addressed in imageprocessing to avoid false segmentation. In general, reliableand accurate segmentation of SRLM images must take intoaccount the unique properties of such images. An intuitivestrategy is to estimate the underlying spatial density accord-ing to the sampled spatial distribution of the particles and thendetermine the criterion for segmenting the density image.
In this paper, we present a spatially adaptive density esti-mation based method for smoothing and segmenting super-resolution localization microscopy images. We propose toestimate local particle density using anisotropic kernels thatadapt to local particle distributions. This kernel based methodprovides a way to connect separated particles in an object re-gion as well as to interpolate object boundary without beingmisled by the random fluctuations of activated boundary flu-orophores. Experimental results confirm the robustness andaccuracy of the proposed method.
2. DENSITY ESTIMATION BASED SRLM IMAGESEGMENTATION
Problem formulation To take into account the uniquemodality of SRLM images, we formulate the image segmen-tation problem as identifying different density regions fromthe spatial distribution of the particles. We propose a two-stepprocess for SRLM image segmentation: 1) spatial densitydistribution estimation and 2) image segmentation based onthresholding that estimated density distribution. Inspired byprevious work on density estimation [4], we start with a com-monly adopted kernel density estimator, then follow by theproposed adaptive anisotropic kernel density estimator.
Density estimation with isotropic kernel Perhaps the mostcommonly used density estimator is the kernel density estima-tor. The idea is to estimate a continuous distribution from afinite set of points by placing a kernel centered at each of thepoints and taking the sum of all kernels. Kernel density esti-mation has been used previously in applications such as ge-ographical information systems [5] and human motion track-ing [6]
Specifically, suppose that we have a list of n pointsx1, x2, . . . , xn, sampled from some unknown density mapf of a spatial area (in our application, the image). A classic2D spatial kernel density estimator at location x is
f(x) =1
n
n∑i=1
Ki(x, xi), (1)
whereKi is a symmetric isotropic kernel function. We choosethe Gaussian kernel, which is defined as
Ki(x, x′) =
1
2πh2exp
(−||x− x
′||2
2h2
),
where h is a global spherical bandwidth, which can be esti-mated from the data by minimizing the L2 risk function usingcross-validation [4]. However, in SRLM images, h directlycontrols the resolution of the estimated density image as itrepresents the radius of the point-spread function of the den-sity image. If the h is too small, the density estimator loses itspower to connect the particles; if h is too large, the resolutiondegrades. Because the typical range of resolution for SRLMis 20 ∼ 100 nm [7], we choose h to be in the range of 10 ∼50 nm, i.e. half the resolution.
Density estimation with adaptive anisotropic kernel Themain limitation of the isotropic kernel appears when it isplaced at a location where the support of the underlying truedensity is close to one dimensional (for example, on theboundary). Isotropic kernel cannot properly represents theheterogeneity of the spatial density; it, instead, spreads itsdensity mass equally along all spatial directions, thus, givingtoo much emphasis to background regions and too little alongthe boundary direction. This motivates us to use adaptive,anisotropic kernels for density estimation.
The adaptive anisotropic kernel density estimation as-sociates with each point an anisotropic kernel. This kerneladapts to the local structure of the data points by estimatinglocally its scale, shape, and orientation. Again, the densityfunction as in (1) at the location x is a sum of kernels centeredat the surrounding points xi where now each kernelKi(x, xi)is the locally adaptive anisotropic Gaussian kernel
Ki(x, xi) =1
2π|Σi|exp
(−1
2(x− xi)>Σ−1i (x− xi)
),
where Σi is a positive definite covariance matrix that definesits configuration (scale, shape, and orientation).
To place the anisotropic kernel according to the spatialdistribution of local data points, for the kernel located at thepoint xi, we select its k-nearest neighbors x1, x2, . . . , xk, toestimate the covariance matrix
Σi =1
k
k∑j=1
(xj − xi)(xj − xi)>.
BA
DC
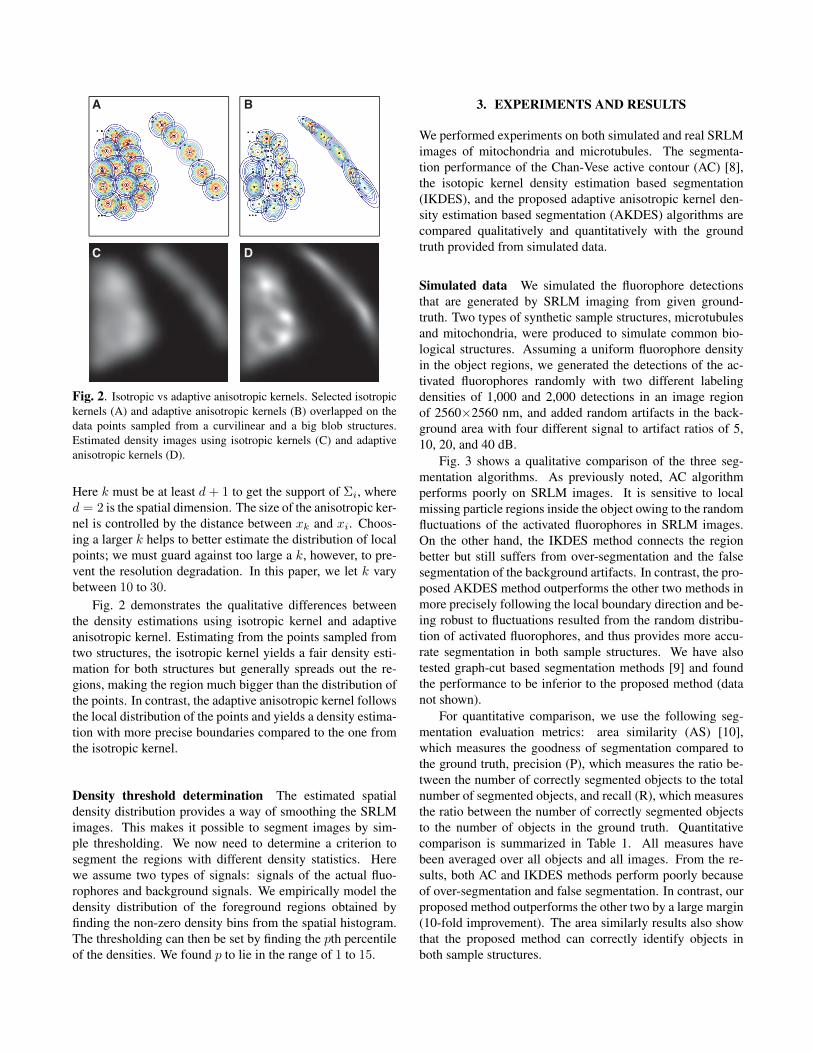
Fig. 2. Isotropic vs adaptive anisotropic kernels. Selected isotropickernels (A) and adaptive anisotropic kernels (B) overlapped on thedata points sampled from a curvilinear and a big blob structures.Estimated density images using isotropic kernels (C) and adaptiveanisotropic kernels (D).
Here k must be at least d + 1 to get the support of Σi, whered = 2 is the spatial dimension. The size of the anisotropic ker-nel is controlled by the distance between xk and xi. Choos-ing a larger k helps to better estimate the distribution of localpoints; we must guard against too large a k, however, to pre-vent the resolution degradation. In this paper, we let k varybetween 10 to 30.
Fig. 2 demonstrates the qualitative differences betweenthe density estimations using isotropic kernel and adaptiveanisotropic kernel. Estimating from the points sampled fromtwo structures, the isotropic kernel yields a fair density esti-mation for both structures but generally spreads out the re-gions, making the region much bigger than the distribution ofthe points. In contrast, the adaptive anisotropic kernel followsthe local distribution of the points and yields a density estima-tion with more precise boundaries compared to the one fromthe isotropic kernel.
Density threshold determination The estimated spatialdensity distribution provides a way of smoothing the SRLMimages. This makes it possible to segment images by sim-ple thresholding. We now need to determine a criterion tosegment the regions with different density statistics. Herewe assume two types of signals: signals of the actual fluo-rophores and background signals. We empirically model thedensity distribution of the foreground regions obtained byfinding the non-zero density bins from the spatial histogram.The thresholding can then be set by finding the pth percentileof the densities. We found p to lie in the range of 1 to 15.
3. EXPERIMENTS AND RESULTS
We performed experiments on both simulated and real SRLMimages of mitochondria and microtubules. The segmenta-tion performance of the Chan-Vese active contour (AC) [8],the isotopic kernel density estimation based segmentation(IKDES), and the proposed adaptive anisotropic kernel den-sity estimation based segmentation (AKDES) algorithms arecompared qualitatively and quantitatively with the groundtruth provided from simulated data.
Simulated data We simulated the fluorophore detectionsthat are generated by SRLM imaging from given ground-truth. Two types of synthetic sample structures, microtubulesand mitochondria, were produced to simulate common bio-logical structures. Assuming a uniform fluorophore densityin the object regions, we generated the detections of the ac-tivated fluorophores randomly with two different labelingdensities of 1,000 and 2,000 detections in an image regionof 2560×2560 nm, and added random artifacts in the back-ground area with four different signal to artifact ratios of 5,10, 20, and 40 dB.
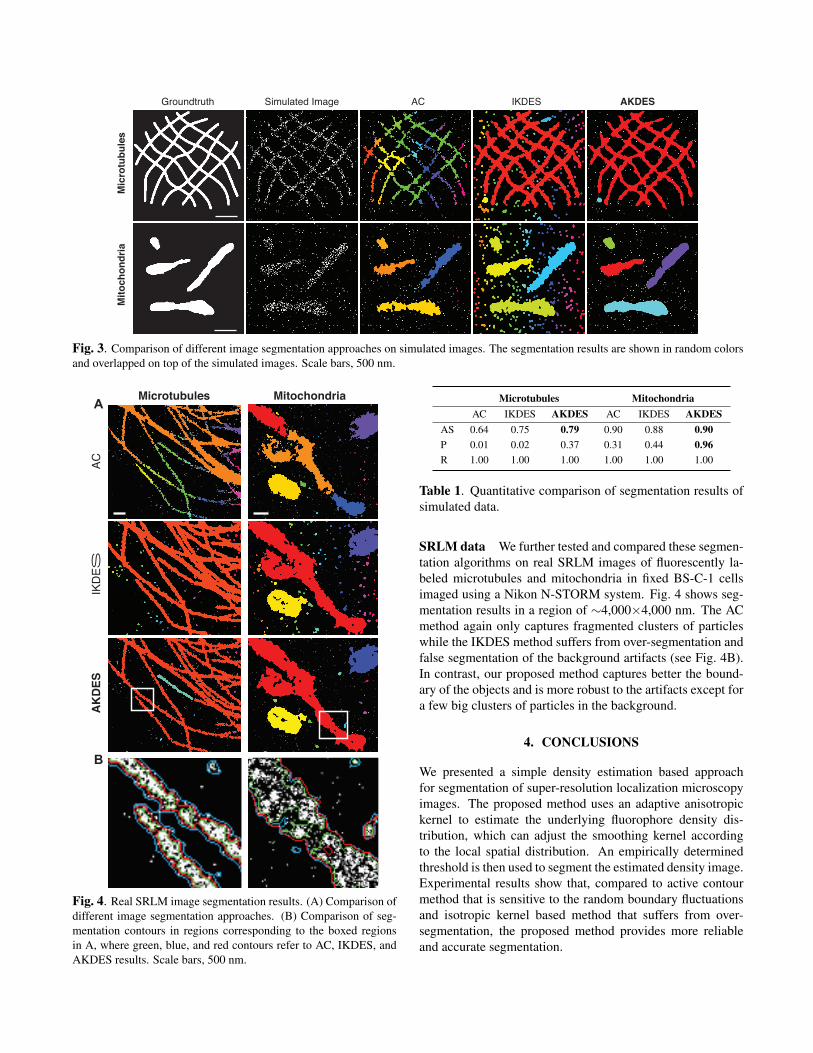
Fig. 3 shows a qualitative comparison of the three seg-mentation algorithms. As previously noted, AC algorithmperforms poorly on SRLM images. It is sensitive to localmissing particle regions inside the object owing to the randomfluctuations of the activated fluorophores in SRLM images.On the other hand, the IKDES method connects the regionbetter but still suffers from over-segmentation and the falsesegmentation of the background artifacts. In contrast, the pro-posed AKDES method outperforms the other two methods inmore precisely following the local boundary direction and be-ing robust to fluctuations resulted from the random distribu-tion of activated fluorophores, and thus provides more accu-rate segmentation in both sample structures. We have alsotested graph-cut based segmentation methods [9] and foundthe performance to be inferior to the proposed method (datanot shown).
For quantitative comparison, we use the following seg-mentation evaluation metrics: area similarity (AS) [10],which measures the goodness of segmentation compared tothe ground truth, precision (P), which measures the ratio be-tween the number of correctly segmented objects to the totalnumber of segmented objects, and recall (R), which measuresthe ratio between the number of correctly segmented objectsto the number of objects in the ground truth. Quantitativecomparison is summarized in Table 1. All measures havebeen averaged over all objects and all images. From the re-sults, both AC and IKDES methods perform poorly becauseof over-segmentation and false segmentation. In contrast, ourproposed method outperforms the other two by a large margin(10-fold improvement). The area similarly results also showthat the proposed method can correctly identify objects inboth sample structures.
Mitochondria
Microtubules
Groundtruth Simulated Image IKDES AKDESAC
Fig. 3. Comparison of different image segmentation approaches on simulated images. The segmentation results are shown in random colorsand overlapped on top of the simulated images. Scale bars, 500 nm.
MitochondriaMicrotubules
IKDES
AKDES
AC
A
B
Fig. 4. Real SRLM image segmentation results. (A) Comparison ofdifferent image segmentation approaches. (B) Comparison of seg-mentation contours in regions corresponding to the boxed regionsin A, where green, blue, and red contours refer to AC, IKDES, andAKDES results. Scale bars, 500 nm.
Microtubules MitochondriaAC IKDES AKDES AC IKDES AKDES
AS 0.64 0.75 0.79 0.90 0.88 0.90P 0.01 0.02 0.37 0.31 0.44 0.96R 1.00 1.00 1.00 1.00 1.00 1.00
Table 1. Quantitative comparison of segmentation results ofsimulated data.
SRLM data We further tested and compared these segmen-tation algorithms on real SRLM images of fluorescently la-beled microtubules and mitochondria in fixed BS-C-1 cellsimaged using a Nikon N-STORM system. Fig. 4 shows seg-mentation results in a region of ∼4,000×4,000 nm. The ACmethod again only captures fragmented clusters of particleswhile the IKDES method suffers from over-segmentation andfalse segmentation of the background artifacts (see Fig. 4B).In contrast, our proposed method captures better the bound-ary of the objects and is more robust to the artifacts except fora few big clusters of particles in the background.
4. CONCLUSIONS
We presented a simple density estimation based approachfor segmentation of super-resolution localization microscopyimages. The proposed method uses an adaptive anisotropickernel to estimate the underlying fluorophore density dis-tribution, which can adjust the smoothing kernel accordingto the local spatial distribution. An empirically determinedthreshold is then used to segment the estimated density image.Experimental results show that, compared to active contourmethod that is sensitive to the random boundary fluctuationsand isotropic kernel based method that suffers from over-segmentation, the proposed method provides more reliableand accurate segmentation.

5. REFERENCES
[1] M. J. Rust, M. Bates, and X. Zhuang, “Sub-diffraction-limit imaging by stochastic optical reconstruction microscopy(STORM),” Nature Methods, vol. 3, no. 10, pp. 793–795, 2006.
[2] E. Betzig, G. H. Patterson, R. Sougrat, O. W. Lindwasser, andet al., “Imaging intracellular fluorescent proteins at nanometerresolution.,” Science, vol. 313, no. 5793, pp. 1642–5, 2006.
[3] D. Baddeley, M. B. Cannell, and C. Soeller, “Visualization oflocalization microscopy data.,” Microsc. Microanal., vol. 16,no. 1, pp. 64–72, Feb. 2010.
[4] D. W. Scott, Ed., Multivariate Density Estimation, WileySeries in Probability and Statistics. John Wiley & Sons, Inc.,Hoboken, NJ, USA, Aug. 1992.
[5] B. W. Silverman, Density Estimation for Statistics and DataAnalysis, vol. 26, CRC press, 1986.
[6] T. Brox, B. Rosenhahn, D. Cremers, and H.-P. Seidel, “Non-parametric density estimation with adaptive, anisotropic ker-nels for human motion tracking,” in Proc. Second WorkshopHuman Motion, 2007, pp. 152–165.
[7] L. Schermelleh, R. Heintzmann, and H. Leonhardt, “A guide tosuper-resolution fluorescence microscopy.,” J. Cell Biol., vol.190, no. 2, pp. 165–175, July 2010.
[8] T. F. Chan and L. A. Vese, “Active contours without edges.,”IEEE Trans. Image Process., vol. 10, no. 2, pp. 266–277, Jan.2001.
[9] Y. Boykov and V. Kolmogorov, “An experimental comparisonof min-cut/max-flow algorithms for energy minimization in vi-sion.,” IEEE Trans. Pattern Anal. Mach. Intell., vol. 26, no. 9,pp. 1124–1137, Sept. 2004.
[10] A. P. Zijdenbos, B. M. Dawant, R. A. Margolin, and A. C.Palmer, “Morphometric analysis of white matter lesions in MRimages: Method and validation,” IEEE Trans. Med. Imag., vol.13, pp. 716 – 724, Dec. 1994.