spatial analysis study -...
TRANSCRIPT
State of Vermont Department of Financial Regulation 89 Main Street Montpelier, VT 05620-3101
www.dfr.vermont.gov
Vermont Healthcare Claims Uniform Reporting & Evaluation System
Spatial Analysis Study
The Development of P r im a r y Ca re S e r v i c e A r ea s
for the State of Vermont
Report released February 2013
• Spatial Analysis: The Development of PCSAs for the State of Vermont (February 2013) i
BRIEF BACKGROUND OF THIS REPORT
The Department of Financial Regulation (DFR) convened the Health Analysis Areas Work Group to discuss service area definitions and the population denominators needed for developing health care statistics and metrics. The work group recommended this study to develop Primary Care Service Areas (PCSAs) for Vermont for primary care providers (PCPs) and attributed populations. The Vermont Healthcare Claims Uniform Reporting and Evaluation System (VHCURES), the State’s all-payer claims database, was used in combination with other provider data sources to develop PCSAs for spatial analysis. Geographic data for health care providers were matched with insured Vermonters’ claims data to analyze primary care visits. After PCSAs were defined, the proportion of insured Vermonters who use primary care outside of their PCSAs was quantified to develop a fuller picture of the supply of primary care providers serving local populations. Sample expenditure flow maps were used to illustrate the flow of health care dollars in and out of geographic areas in Vermont. This study is intended to be exploratory, preliminary, and not exhaustive. Evaluating and reconciling differences among provider data resources is an important part of this study. Recommendations for refinement and future development are included in this report. The preliminary results provide updated geographic information about primary care providers serving Vermont residents with commercial insurance and Medicaid who use primary care services including health care expenditures. This study provides a basis for continuing efforts to develop health care-related service areas needed to generate useful information for decision makers involved in Vermont’s health care system and efforts in health care reform. Study done and report prepared by:
• Onpoint Health Data
- Leo Beaucage, Systems Analyst
- Karl Finison, Director of Analytic Development
- Amy Kinner, Health Services Researcher
- Adam Moody, Director of Analytic Operations
- Jeff Spaulding, Manager of Communications
• Stone Environmental
- David Healy, Vice President, Applied Information Management
- Barbara Patterson, Database Application Developer
- Charlie Hofmann, GIS Specialist
• State of Vermont
- Dian Kahn, Director of Analysis & Data Management, Vermont Department of Financial Regulation
- Zachary Sullivan, Green Mountain Care Board Intern
• Spatial Analysis: The Development of PCSAs for the State of Vermont (February 2013) ii
Acknowledgements
The study team would like to thank David Goodman, Chiang-Hua Chang, and Nancy Marth from the Dartmouth Institute for Health Policy & Clinical Practice for their generous sharing of knowledge and expertise about primary care service area methods and definitions. The Department of Financial Regulation would like to thank the members of the Health Analysis Areas Work Group for their participation and for supporting this study including the Agency of Human Services; the Departments of Health, Vermont Health Access, Mental Health; the Green Mountain Care Board; and state consultants including Burns & Associates, Policy Integrity, and Stone Environmental.
• Spatial Analysis: The Development of PCSAs for the State of Vermont (February 2013) iii
TABLE OF CONTENTS
Executive Summary .................................................................................................................................................................. 1 Background & Context ......................................................................................................................................................................................................... 1 Methods ....................................................................................................................................................................................................................................... 2 Key Findings .............................................................................................................................................................................................................................. 2 Recommendations.................................................................................................................................................................................................................. 3 Short-Term Recommendations for Follow-up Study ............................................................................................................................................ 3 Longer-Term Recommendations for Future Development................................................................................................................................ 4
Background ................................................................................................................................................................................. 6 The Role of Primary Care in the Health Care System ............................................................................................................................................ 6 Reforming Primary Care in Vermont ............................................................................................................................................................................ 7 Prior Efforts to Define Primary Care Areas in Vermont ...................................................................................................................................... 7 Uses for Primary Care Service Areas ............................................................................................................................................................................. 8 Project Objectives ................................................................................................................................................................................................................... 9
Methods ...................................................................................................................................................................................... 14 Data Sources ............................................................................................................................................................................................................................ 14 Identifying & Geocoding Primary Care Providers in Vermont ....................................................................................................................... 17 Developing PCSAs ................................................................................................................................................................................................................. 20 Additional Analyses ............................................................................................................................................................................................................. 23
Results ........................................................................................................................................................................................ 25 Primary Care Service Areas ............................................................................................................................................................................................. 25 Preference Index ................................................................................................................................................................................................................... 25 Population by PCSA ............................................................................................................................................................................................................. 31 Population per Provider by PCSA ................................................................................................................................................................................. 31 Travel Time.............................................................................................................................................................................................................................. 34 Expenditure Flows ............................................................................................................................................................................................................... 36
Discussion ................................................................................................................................................................................. 42
Appendix A – E&M Visit Codes Identifying Primary Care Visits ............................................................................ 44
Appendix B – Summary Data Table Used for the Development of PCSA Maps ................................................ 46
• Spatial Analysis: The Development of PCSAs for the State of Vermont (February 2013) 1
EXECUTIVE SUMMARY
Background & Context
The four goals articulated in the Strategic Plan for Vermont Health Reform 2012–2014 include reducing health care costs and cost growth; ensuring access to and coverage for high-quality care; supporting health improvement in the Vermont population; and ensuring greater fairness and equity in how care is financed.1
Evaluating progress toward these goals requires that decision makers have accurate and timely data resources and analytical capability to convert data into meaningful information.
Variations research can be used to compare measures of health care access, cost and resource use, and health outcomes among small areas as well as against regional and national benchmarks. After accounting for differences in health and other determinants that can affect spending, utilization, and outcomes, the study of variations has focused increased attention on “relative efficiency” and “accountability” — measuring the degree to which hospitals and physician practices are more or less efficient and might be held accountable for both the quality and cost of care that they provide.2
The State of Vermont historically has based analysis of variations on hospital service areas (HSAs) defined by geographically distinct populations of Vermonters who are highly dependent on a particular hospital or group of hospitals for acute care as displayed in Figure 1c.3, 4
Is the HSA the best population denominator for measuring rates of utilization and spending, health outcomes for the Vermont population, and the wide array of health care services? This question led the Department of Financial Regulation (DFR) to convene the Health Analysis Areas Work Group to discuss the population denominators — including HSAs and other models — needed to support measuring variations. The work group recommended that DFR commission a study to define primary care service areas (PCSAs) using claims data and other sources of provider data to locate primary care providers (PCPs), attribute people to PCPs, define and map PCSAs, and measure expenditures.
Primary care has assumed an important role and is a key component of health care reform, most notably addressed by the Blueprint for Health advanced primary care medical home program, which has expanded across the state. Newer models of care management and payment assume that primary care providers have a significant influence on costs and quality of care for their patients. Primary care plays a crucial role within the health care system, serving as a point of contact for providing basic health care services and care coordination, enhancing preventive care, and, if effective, reducing avoidable utilization of more costly health care services such as inpatient hospitalizations and emergency department visits. According to the Vermont Healthcare Claims Uniform Reporting and Evaluation System (VHCURES), roughly 57 percent or 800,000 of 1.4 million physician office visits for commercially insured Vermonters in 2010 were for primary care services as were 66 percent or 530,000 of 800,000 physician office visits for Medicaid enrollees.
1 Strategic Plan for Vermont Health Reform 2012–2014. Agency of Administration. State of Vermont. January 2012. 2 Skinner J, Fisher ES. Reflections on Geographic Variations in U.S. Health Care. The Dartmouth Institute for Health Policy &
Clinical Practice. March 31, 2010 (updated May 12, 2010). 3 2009 Inpatient Hospital Utilization Report. Vermont Department of Financial Regulation. October 2011. 4 2009 Tri-State Variation in Health Services Utilization & Expenditures. Vermont Department of Financial Regulation. June
2010.

• Spatial Analysis: The Development of PCSAs for the State of Vermont (February 2013) 2
This study is exploratory, non-exhaustive, and intended to address a gap in the data infrastructure needed to support measurement and evaluation of the primary care system for Vermonters. This study is limited to approximately 75 percent of the Vermont population covered by commercial insurance and Medicaid. Data for Medicare beneficiaries, enrollees in military coverage, and uninsured Vermonters were not available during the study. This study is a beginning step toward building a data infrastructure for the analysis of primary care. This would help answer questions such as: Are primary care practices distributed in a manner that supports need? How far are Vermonters traveling for primary care? Are there geographic disparities in access to health care, utilization and cost of health care, and health outcomes? Where do Vermonters travel for specialty care? What are the characteristics and health care needs of local populations, and how can these needs be met? PCSAs provide the framework for future analyses around these and other key questions.
Methods
The primary source of data for this study was Vermont’s all-payer health care claims database, the Vermont Healthcare Claims Uniform Reporting and Evaluation System (VHCURES). Claims for members ages 0–64 years enrolled in Medicaid and commercial insurance during 2010 were extracted. Key data elements include information on member location, primary care provider location, number of primary care visits, and expenditures. Since the geographic detail for providers is limited in VHCURES, the study benefits from the availability of practice location detail in the Blueprint for Health Practice Roster and the National Provider Index (NPI). The Blueprint roster is very timely but only captures a subset of PCPs serving the Vermont population. The NPI is not as timely but includes information on more PCPs. The Dartmouth Institute for Health Policy & Clinical Practice (“Dartmouth”) method for delineating PCSAs, which has been used for assignment of PCSAs nationally, is used in this project. Data were analyzed to determine where each member obtained the majority of his or her primary care and where the plurality of the population for each ZIP code went for primary care. U.S. ZIP codes were grouped into to PCSAs based on this plurality of beneficiaries’ preference for primary care clinicians, with adjustments to establish geographic contiguity and minimum population and service localization. Once PCSAs were defined, additional analyses using the new PCSA geographies were conducted to evaluate the usefulness of PCSAs for describing primary care utilization and to describe variation in measures of access across the state.
Key Findings
• The study identifies 44 distinct PCSAs around primary care provider locations in Vermont and New Hampshire border areas serving Vermonters.
• The proportion of commercial and Medicaid members who stayed within local PCSAs varied widely throughout the state (from as low as 23 percent to as high as 90 percent). The percentage was lower in several rural PCSAs in the center of the state (e.g., Bethel, Chelsea, Northfield, and Rochester) where PCP supply is limited. Populations in small, rural PCSAs were more likely to travel for pediatric care compared with adult care, probably due to lack of access to pediatricians closer to home.
• Spatial Analysis: The Development of PCSAs for the State of Vermont (February 2013) 3
• Many of PCSAs identified in this study have U.S. Census populations lower than 10,000 (28 of the 44 areas), reflecting the rural nature of the state. Some had fewer than 1,000 people. Future analyses using PCSAs, particularly analyses on subpopulations or specific conditions will need to consider the small numbers in some areas, develop a minimum population threshold for analysis, and potentially group together less populated contiguous areas that fail to meet a minimum threshold.
• The U.S. Census population per provider varies widely throughout the state. The ratio was very low in Burlington and South Burlington (fewer than 500 people per provider) due to the larger number of physicians practicing in the greater Burlington area. There were seven PCSAs with more than 1,000 residents per primary care provider (i.e., Bomoseen, Essex Junction, Hardwick, Manchester Center, Northfield, Waitsfield, and Wilmington).
• Commercial and Medicaid members’ median travel time for primary care services varied widely. Travel in and out of the PCSA was found to be as high as 36 minutes (i.e., Grovetown) and as low as 11 minutes (i.e., South Burlington). PCSAs where the median travel time was greater than 23 minutes included Brandon, Cambridge, Groveton, Island Pond, Rochester, Wells River, and West Pawlet. These PCSAs tend to be rural and isolated from other primary care centers with members either willing or required to travel a long time to access care.
• The percentage of total health care claims expenditures that commercial and Medicaid members incurred within their PCSA displays a broad range. For 23 of the 44 PCSAs, less than 10 percent of the members’ total claims expenditures stayed within the PCSA for members attributed to the PCSA. These 23 PCSAs are rural and dispersed throughout the state (e.g., Bradford, Groveton, Manchester Center, and Northfield). For 10 PCSAs, 40 percent – 70 percent of member total claims expenditures stayed within the member’s PCSA (e.g., Bennington, Brattleboro, Burlington, Middlebury and Rutland in Vermont; Lebanon in New Hampshire). There was a positive correlation between hospitals being located within these PCSAs and the increased percentage of in-PCSA spending.
Recommendations
This initial report uses available claims and other provider data sources to identify PCSAs and explores the potential for analyses. This study is not intended to answer all possible questions. This study makes recommendations for next steps in both the short and long term that would advance the ongoing availabilty of PCSA spatial resources and analysis.
Short-Term Recommendations for Follow-up Study
• Include claims data for the Medicare population, which will require a re-examination of methods to account for expected higher use of specialists for primary care services by Medicare beneficiaries.
• Generate claims expenditures flow tabulations and maps for all identified PCSAs (or possible aggregations of PCSAs with small populations) and for other specified categories of services, including but not necessarily limited to hospital inpatient, hospital outpatient, medical specialist, surgical specialist, OB/GYN, primary care, and mental health. Stratify by payer types — commercial,
• Spatial Analysis: The Development of PCSAs for the State of Vermont (February 2013) 4
Medicaid, Medicare — and age groupings. Review and adopt a method for categorization of claims expenditures consistent with other approaches in use by the State.
• Expand the study to include members who do not have primary care visits. Compare the
allocation of claims expenditures for all members and by payer type — commercial, Medicaid, Medicare — across categories of service for members with and without primary care services. For each payer type, stratify by age groups. Address potential differences in age, gender, risk/health status, social determinants, and access to primary care that may exist between members with and members without primary care visits.
• Test models of attribution to PCSAs for members without primary care visits based on
preference patterns for members with primary care visits.
• Test preference fraction methods by payer type and analyze differences among payer types and factors that contribute to differences.
• Intensify efforts to improve VHCURES claims data, including accuracy of coding that identifies both service and billing providers, accuracy of ZIP codes in VHCURES for practice locations, and improved assignment of NPI data to providers in the VHCURES data.
• Propose amendments to the VHCURES rule and guidelines and set program priorities to improve the timely availability of accurate and more precise provider and member data. Future inclusion of Medicare data will require discussions with the U.S. Centers for Medicare and Medicaid Services as a voluntary and not mandated VHCURES reporter regarding provider data issues.
Longer-Term Recommendations for Future Development
• Provide additional evaluation for populations in eastern Vermont and western New Hampshire along the Vermont border with a strong preference for New Hampshire providers. To evaluate the capacity and use of primary care practices in New Hampshire along the Vermont border, include population and claims data for New Hampshire.
• Adapt analyses to account for population variations. For future analyses using PCSAs, particularly analyses on subpopulations or specific conditions, consider the small numbers in some of these areas, develop a minimum population threshold, and potentially group small areas that do not meet the minimum threshold.
• Evaluate expenditures and resource use for members attributed to PCPs and PCSAs with potentially care-intensive diagnoses such as cancer, congestive heath failure, chronic obstructive pulmonary disease, amyotrophic lateral sclerosis (ALS), dementias, advanced cirrhosis, and other complex conditions.
• Include encounter data for uninsured Vermonters, understanding that the uninsured subpopulation is a relatively small proportion of the total Vermont population — estimated to be 6.8 percent in 2012. This population could be analyzed at a higher level of aggregation due to small numbers at sub-state levels. The same considerations would apply to inclusion of data for Vermonters with military benefits and providers.
• Spatial Analysis: The Development of PCSAs for the State of Vermont (February 2013) 5
• Evaluate access to care, adequacy of access, and outcomes for PCSAs with both high and low rates of persons-per-PCP (or PCP rates per population). An appearance of adequate supply does not always ensure sufficient access to care pertaining to timely availability of appointments, accessible office hours, acceptance of insurance coverage, coordination of care, and other factors.
• Develop a plan for a system to support a standardized and routinely updated master provider data file to support spatial analysis for the State of Vermont that includes data from various sources in addition to VHCURES. Designate an entity to support and require collaboration among public and private entities with provider data resources.
• Identify additional data sources that would support application of adjustments for risk, health status, environmental factors, and socioeconomic characteristics for analysis of variation in measures of access, utilization, expenditures, quality of care, and outcomes.
• Pursue long-term development of online web applications based on timely automated data feeds to provide decision makers with tools to answer questions regarding provider locations, supply and distribution of health care resources, access to care, utilization of services, expenditure flows, outcomes, and other issues.
• Spatial Analysis: The Development of PCSAs for the State of Vermont (February 2013) 6
BACKGROUND
The Role of Primary Care in the Health Care System
Primary care serves as a point of contact for patients’ basic health care needs and care coordination within the health care system. In 1996, the United States Institute of Medicine (IOM) defined primary care as “the provision of integrated, accessible health care services by clinicians who are accountable for addressing a large majority of personal health care needs, developing a sustained partnership with patients and practicing within the context of family and community.”5
According to the IOM, primary care provides a place for patients to bring a wide range of health problems, guides patients through the health system, facilitates an ongoing relationship between patients and providers, provides opportunities for disease prevention and early detection of problems, and links patients, family, and community.
Studies have found that patients who live in areas where primary care practitioner access is high had more favorable health outcomes than patients living in areas where access is low,6 that primary care is associated with a more equitable distribution of health in populations,7 and that primary care physicians provide better preventive care than specialists.8 Patients who use primary care also are more likely to be treated before serious problems develop, are more likely to receive preventive services, and are less likely to have avoidable hospital admissions and emergency room use.9, 10 , 11, 12 For the millions of Americans with chronic illnesses, the defining characteristics of primary care — guiding patients through the health system, providing comprehensive care, and linking to community resources — are particularly important, and system support and improvements are critical to successfully treating primary care patients.13
Most patients across the country, including in the State of Vermont, receive their health care in the primary care setting. In 2009, approximately 57 percent of all visits to physicians nationally were to primary care physicians. Similarly, in 2010, 56 percent of all physician visits attributed to commercially insured Vermonters were to primary care physicians.
14, 15
5 Primary care: America’s health in a new era. IOM. Washington, DC. National Academies Press. 1996.
6 Chang CH, Stukel TA, Flood AB, Goodman DC. Primary Care Physician Workforce and Medicare Beneficiaries’ Health Outcomes. JAMA.
305(20). May 25, 2011. 7 Starfield B, Shi L, Mackinko J. Contribution of Primary Care to Health Systems and Health. The Milbank Quarterly. 83(3). 2005. 8 Turner BJ, Amsel Z, Lustbader E, Schwartz JS, Balshem A, Grisso JA. Breast cancer screening: effect of physician specialty, practice setting,
year of medical school graduation and sex. American Journal of Preventive Medicine. 8(2):78-85. March-April 1992. 9 Parchman ML, Culler S. Primary care physicians and avoidable hospitalizations. Journal of Family Practice. 39(2):123-8. August 1994. 10 Mauskopf J, Turner BJ, Markson LE, Houchens RL, Fanning TR, McKee L. Patterns of ambulatory care for AIDS patients, and association with
emergency room use. Health Services Research. 29(4):489-510. October 1994. 11 Rosenblatt RA, Wright GE, Baldwin LM, Chan L, Clitherow P, Chen FM, Hart LG. The effect of the doctor-patient relationship on emergency
department use among the elderly. American Journal of Public Health. 90(1):97-102. January 2000. 12 Campbell RJ, Ramirez AM, Perez K, Roetzheim RG. Cervical cancer rates and the supply of primary care physicians in Florida. Family Medicine.
35(1):60-4. January 2003. 13 Rothman AA, Wagner E. Chronic illness management: what is the role of primary care? Annals of Internal Medicine. 138:256-61. February 4,
2003. 14 National Ambulatory Medical Care Survey: 2009 Summary Tables. Last accessed January 10, 2013:
http://www.cdc.gov/nchs/data/ahcd/namcs_summary/2009_namcs_web_tables.pdf
• Spatial Analysis: The Development of PCSAs for the State of Vermont (February 2013) 7
Reforming Primary Care in Vermont
Because of its importance to the health care system and to prevention and treatment, primary care has been a key focus for health care reform in the State of Vermont. The State has emphasized primary care improvement through its Vermont Blueprint for Health, a state-led initiative to promote Patient-Centered Medical Homes (PCMHs). PCMHs are models of care that strengthen the clinician-patient relationship by replacing episodic care with coordinated care. Vermont’s Advanced Primary Care Practices (APCPs) — a model that includes PCMHs and Community Health Teams (CHTs) — are supported by practice reform and payment reform, focusing on a more holistic approach to health improvement, including behavioral health care. Patients establish relationships with primary care clinicians who lead CHTs, which are multidisciplinary teams that take collective responsibility for care, arranging for care with other qualified clinicians, and arranging support within the community.16
Prior Efforts to Define Primary Care Areas in Vermont
Health care planners, program evaluators, and policymakers require a data infrastructure for evaluating the availability and effectiveness of primary care. There are three general methods traditionally used to define health care markets: (1) geographic boundaries (e.g., ZIP codes), (2) a fixed-area circumference within which providers and patients are located, and (3) a variable market approach based on the location of health consumers.17
While it is possible to use geographic boundaries to develop travel time circumferences, it is more useful to delineate service areas based on where people actually go for care (i.e., where the plurality of their primary care is delivered).
DARTMOUTH INSTITUTE FOR HEALTH POLICY & CLINICAL PRACTICE: PRIMARY CARE SERVICE AREAS (PCSAS)
Extensive work has been done by the Dartmouth Institute for Health Policy & Clinical Practice to develop a method to delineate service areas where the plurality of primary care is delivered for the Medicare population. These areas are called Primary Care Service Areas (PCSAs) and provide a tool for measuring primary care resources, utilization, and outcomes. Dartmouth first defined PCSAs using Medicare primary care claims data from 1996–1997; they later refined them using data from 2000 and now are completing work with 2009 data. Data were analyzed to determine where each beneficiary obtained the majority of his or her primary care and where the plurality of the population for each ZIP code went for primary care. U.S. ZIP codes were grouped into PCSAs based on this plurality of beneficiaries’ preference for primary care providers. Adjustments were made to establish geographic contiguity and minimum population and service localization.18
15 Vermont Department of Financial Regulation. State of Vermont Report Card for Calendar Year 2010. Last accessed January 10, 2013:
One limitation of Dartmouth’s
http://www.dfr.vermont.gov/sites/default/files/2010%20VHCURES%20RC.pdf 16 Department of Vermont Health Access. Blueprint for Health: 2011 Annual Report. January 2012. Last accessed January 10, 2013:
http://hcr.vermont.gov/sites/hcr/files/Blueprint%20Annual%20Report%20Final%2001%2026%2012%20_Final_.pdf 17 Goodman DC, Mick SS, Bott D, Stukel T, Chang CH, Marth N, Poage J, Caretta HJ. Primary care service areas: a new tool for the evaluation of
primary care services. HSR. 38:1, Part 1. February 2003. 18 Goodman, et al. February 2003.
• Spatial Analysis: The Development of PCSAs for the State of Vermont (February 2013) 8
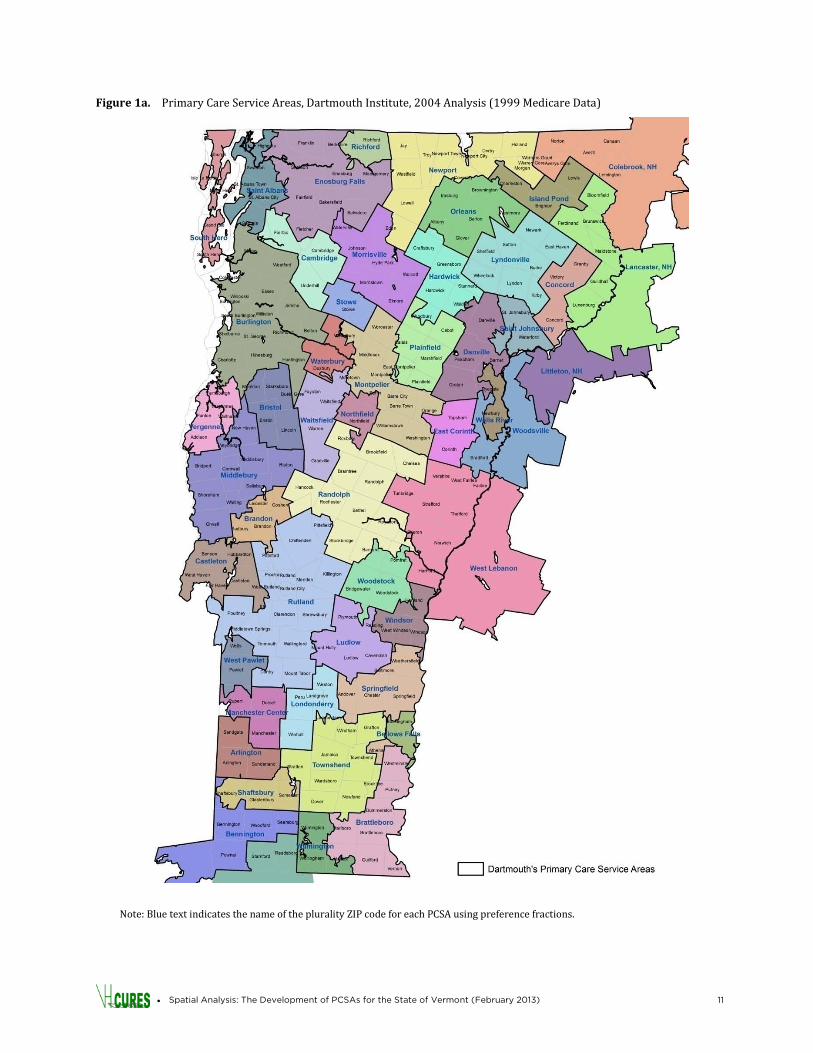
PCSA work is that it was based primarily on Medicare data; therefore, geographic patterns of primary care for the population under 65 years of age were not incorporated. A map of the 49 Medicare-based PCSAs that cover Vermont based on Dartmouth’s analysis of Medicare data is presented in Figure 1a. As shown in this map, there was significant crossover to New Hampshire providers from the towns on the eastern side of Vermont for these Medicare-based PCSAs. Some PCSAs at population and medical centers cover a large area of land (e.g., Burlington; Rutland; Lebanon, New Hampshire), while others (e.g., Wells River, Stowe, Richford) cover only a limited area. The Dartmouth analysis provides insights into patterns of primary care utilization in Vermont, but because the data presented in Figure 1a are older (i.e., from 1999) and are limited to the Medicare population only, updated data and approaches are needed. An updated Dartmouth analysis is under way. RATIONAL SERVICE AREAS
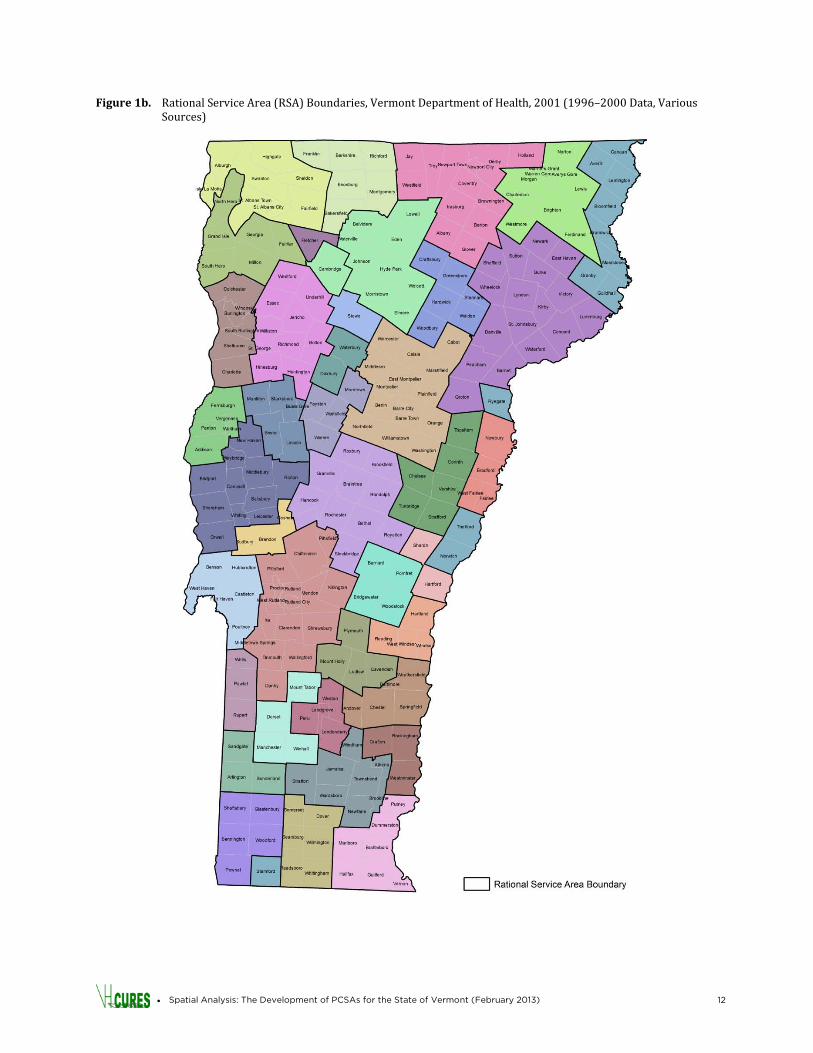
Other methods have been used in Vermont to define areas where residents tend to go for primary care. One such method is the Rational Service Area (RSA) approach. RSAs are used by the federal government to identify Health Professional Shortage Areas and Medically Underserved Areas. Vermont defined RSAs using an iterative process. The State started with the PCSAs that Dartmouth identified using Medicare data (1996–1997 data) then added data from Medicaid claims, assigning children ages 0–17 years to primary care providers (2000 data). The State also added data from the 1998–2000 Behavioral Risk Factor Surveillance Survey (BRFSS) on self-reported town of residence and town of primary care provider. Using these data sources on patterns of utilization, Vermont’s towns were assigned to town centers. For towns where the utilization pattern was unclear, mileage to towns with primary care physicians and contiguity were considered. The result of this process is shown below in Figure 1b, which illustrates the 38 RSAs in Vermont as of the 2001 analysis.19
BLUEPRINT PROGRAM
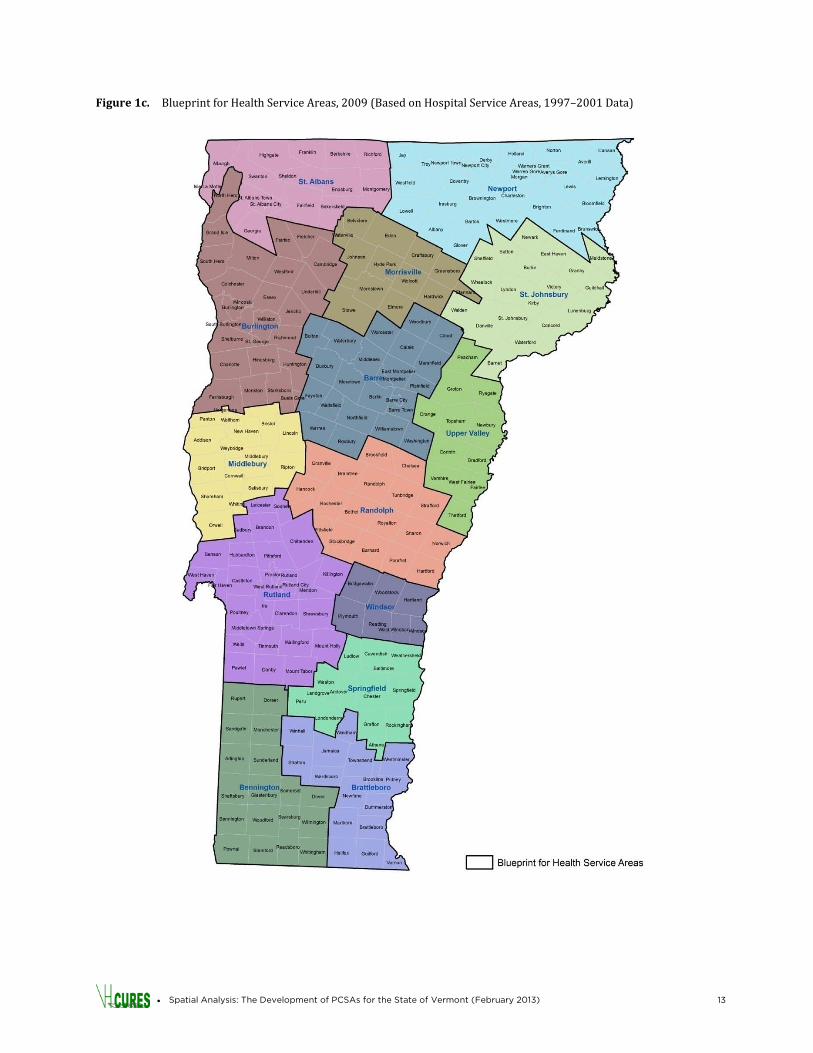
The Blueprint for Health defines its own service areas for the purposes of assigning Community Health Teams and supporting program metrics. The 14 areas shown in Figure 1c are based on Vermont’s Hospital Service Areas (HSAs) with modifications to improve the fit with District Health Offices. The Blueprint areas are used for planning and for organizing care under the Blueprint model and are based on readily available hospital data rather than primary care data derived from claims or encounter data sources.
Uses for Primary Care Service Areas
As Vermont makes additional efforts to shift care to the primary care setting and to improve the access to and the quality of primary care, this geographic analysis delineating PCSAs has many potential uses.
19 State of Vermont. Plan for Designation of Areas of High Medical Need. 2001. (Received from Peggy Brozicevic, Research & Statistics Chief,
Vermont Department of Health, January 2013).
• Spatial Analysis: The Development of PCSAs for the State of Vermont (February 2013) 9
First, this study serves as a descriptive analysis of how primary care is organized in the state for the commercially insured and Medicaid populations. It answers questions such as: Where are the primary care providers located? Where do people travel for primary care? What do travel times for primary care look like? How do spatial patterns compare for the Medicaid and commercial populations? How do they compare for different age cohorts? Once PCSAs are further developed, they may serve as useful units for future primary care planning and evaluation. They provide a framework for looking at geographic differences in access, utilization, spending, prevention, and management of chronic conditions. They may be used to address questions such as: Are primary care practices distributed in a manner that supports need? How far are people travelling for primary care? Are there geographic disparities in utilization and cost of health care? Are there disparities in utilization of potentially avoidable care such as ambulatory care sensitive inpatient admissions, hospital readmissions, and emergency department visits? Areas where access to specialty care is low or where the primary care network may be inadequate also can be identified. PCSAs are particularly useful for evaluating the impact of primary care initiatives on access, utilization, cost, and health outcomes. PCSAs also will support the evaluation of referral patterns to specialists and the use of specialists. They may be used to address questions such as: Where do patients from each PCSA travel for specialty care? Which procedures are done locally and which are done in facilities outside of the area? PCSAs also enable the evaluation of public health needs at the local level for planning purposes. They may be used to address questions such as: What are the characteristics of the local population? What are local profiles for risk factors and existing health problems? What programs can be implemented to address their problems? For example, are mental health and substance abuse services available to the local population? Do residents have access to programs addressing smoking cessation, healthy eating, or active living choices?
Project Objectives
The objectives of this project include:
• Evaluate different sources of provider data for strengths and weaknesses
• Geocode provider locations using the best available information
• Develop a VHCURES data file that summarizes where people go for their primary care for use in this and future analyses
• Explore and test PCSA methods such as that used by the Dartmouth Institute for national PCSAs based on Medicare data
• Use geographic information systems technology (GIS) to analyze patterns of primary care utilization by Vermont residents
• Propose method for updating Primary Care Service Area (PCSA) definitions for Vermont
• Evaluate differences in primary care utilization for specified populations (e.g., Medicaid, children, etc.)

• Spatial Analysis: The Development of PCSAs for the State of Vermont (February 2013) 10
• Display claims expenditures within PCSAs and claims expenditure flows out of PCSAs for primary care and other types of health care spending
• Recommend next steps needed for refinement and continued development of PCSAs and spatial analyses that would provide useful information for decision makers and programs for public health, health policy and regulation, and health care system development.
• Spatial Analysis: The Development of PCSAs for the State of Vermont (February 2013) 11
Figure 1a. Primary Care Service Areas, Dartmouth Institute, 2004 Analysis (1999 Medicare Data)
Note: Blue text indicates the name of the plurality ZIP code for each PCSA using preference fractions.
• Spatial Analysis: The Development of PCSAs for the State of Vermont (February 2013) 12
Figure 1b. Rational Service Area (RSA) Boundaries, Vermont Department of Health, 2001 (1996–2000 Data, Various Sources)
• Spatial Analysis: The Development of PCSAs for the State of Vermont (February 2013) 13
Figure 1c. Blueprint for Health Service Areas, 2009 (Based on Hospital Service Areas, 1997–2001 Data)
• Spatial Analysis: The Development of PCSAs for the State of Vermont (February 2013) 14
METHODS
Data Sources VHCURES
The primary source of data for this analysis was Vermont’s all-payer health care claims database, the Vermont Healthcare Claims Uniform Reporting and Evaluation System (VHCURES), which is collected by the Vermont Department of Financial Regulation (DFR) from commercial health insurers for Vermont residents and the state Medicaid program. Data for this project were derived from the medical claims data in VHCURES and from insurance eligibility data and provider files. This study uses claims data for members ages 0–64 years enrolled in Medicaid or commercial major medical insurance during 2010 (i.e., the selected data year for the study). Although the population covered by Medicare and military insurance and the uninsured are not included in this study due to lack of data availability, about 75 percent of Vermont’s total population is represented in this study. OTHER SOURCES OF PROVIDER DATA
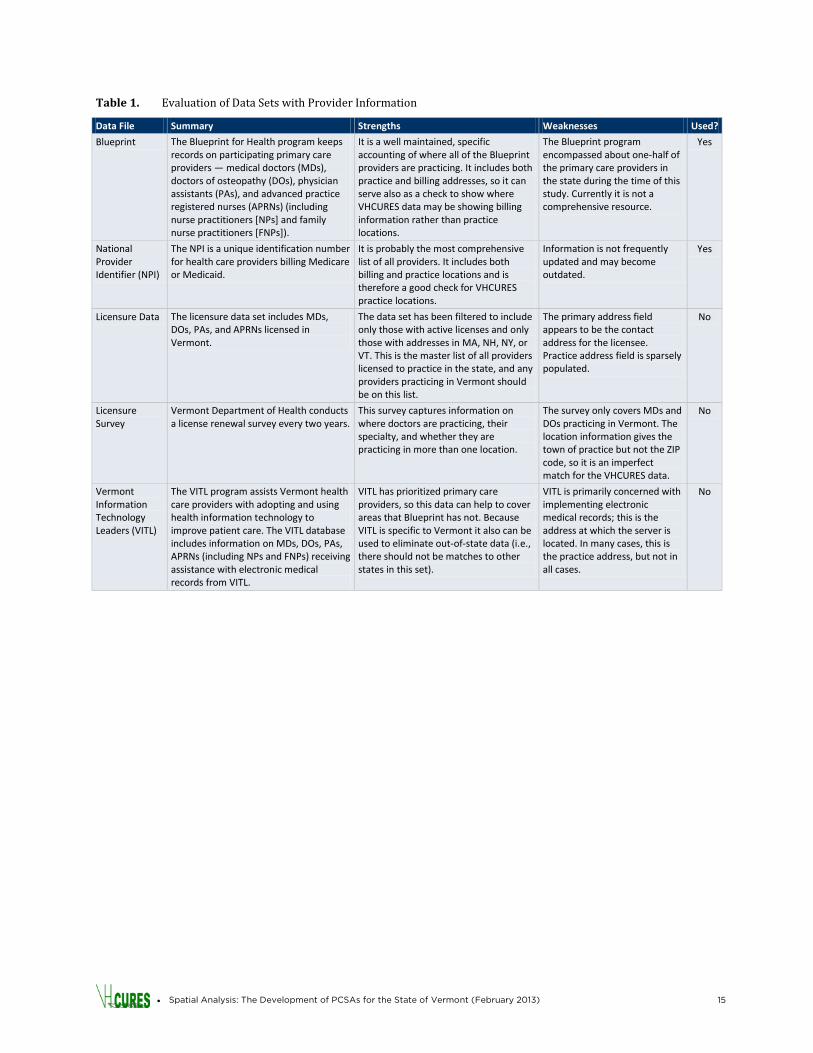
The State of Vermont and the federal government maintain a variety of databases with information on health care providers. For a spatial analysis, the location of providers (address and/or ZIP codes) is crucial. While VHCURES contains the provider ZIP codes, it does not contain their physical addresses (e.g., street address). To overcome this challenge, VHCURES provider data were merged with other sources of provider information to evaluate which data sources could be used to enhance the analysis with the physical address locations for providers. For the purpose of spatial analysis this study focuses on service provider location instead of billing provider location. The objective was to identify the best sources for provider addresses and to develop a comprehensive list of primary care practitioners. Data from the Blueprint for Health Practice Roster, National Provider Identifiers (NPIs), licensure and licensure surveys, and Vermont Information Technology Leaders (VITLs) were merged with VHCURES and evaluated to determine the strengths and weaknesses of each data set for determining provider address. Table 1 presents the results of this evaluation. Based on the findings in Table 1, the Blueprint program was found to have the most up-to-date and well-maintained data on provider locations. Blueprint data also helped verify that a provider was a primary care provider. When available, Blueprint data therefore were used to identify the location of providers. Because the Blueprint does not include all providers in Vermont, address data from the NPI were used to identify locations for primary care providers who were not participating in the Blueprint program at the time of the study. ZIP CODE DATA
A ZIP code tabulation area file from 2000 (i.e., BoundaryOther_ZCTA2000 ) came from the Vermont Center for Geographic Information (VCGI). There were more than 300 such ZIP codes in Vermont and they formed the building blocks of the PCSAs. A number of GIS steps were used to consolidate overlapping ZIP boundaries defined by college campuses and large office complexes. A second GIS tool was used to assign the geographic centroid, or geographic center, to each ZIP code area. The centroid used in the distance analysis was based on the building density centroid for each ZIP code area.
• Spatial Analysis: The Development of PCSAs for the State of Vermont (February 2013) 15
Table 1. Evaluation of Data Sets with Provider Information
Data File Summary Strengths Weaknesses Used?
Blueprint The Blueprint for Health program keeps records on participating primary care providers — medical doctors (MDs), doctors of osteopathy (DOs), physician assistants (PAs), and advanced practice registered nurses (APRNs) (including nurse practitioners [NPs] and family nurse practitioners [FNPs]).
It is a well maintained, specific accounting of where all of the Blueprint providers are practicing. It includes both practice and billing addresses, so it can serve also as a check to show where VHCURES data may be showing billing information rather than practice locations.
The Blueprint program encompassed about one-half of the primary care providers in the state during the time of this study. Currently it is not a comprehensive resource.
Yes
National Provider Identifier (NPI)
The NPI is a unique identification number for health care providers billing Medicare or Medicaid.
It is probably the most comprehensive list of all providers. It includes both billing and practice locations and is therefore a good check for VHCURES practice locations.
Information is not frequently updated and may become outdated.
Yes
Licensure Data The licensure data set includes MDs, DOs, PAs, and APRNs licensed in Vermont.
The data set has been filtered to include only those with active licenses and only those with addresses in MA, NH, NY, or VT. This is the master list of all providers licensed to practice in the state, and any providers practicing in Vermont should be on this list.
The primary address field appears to be the contact address for the licensee. Practice address field is sparsely populated.
No
Licensure Survey
Vermont Department of Health conducts a license renewal survey every two years.
This survey captures information on where doctors are practicing, their specialty, and whether they are practicing in more than one location.
The survey only covers MDs and DOs practicing in Vermont. The location information gives the town of practice but not the ZIP code, so it is an imperfect match for the VHCURES data.
No
Vermont Information Technology Leaders (VITL)
The VITL program assists Vermont health care providers with adopting and using health information technology to improve patient care. The VITL database includes information on MDs, DOs, PAs, APRNs (including NPs and FNPs) receiving assistance with electronic medical records from VITL.
VITL has prioritized primary care providers, so this data can help to cover areas that Blueprint has not. Because VITL is specific to Vermont it also can be used to eliminate out-of-state data (i.e., there should not be matches to other states in this set).
VITL is primarily concerned with implementing electronic medical records; this is the address at which the server is located. In many cases, this is the practice address, but not in all cases.
No
• Spatial Analysis: The Development of PCSAs for the State of Vermont (February 2013) 16
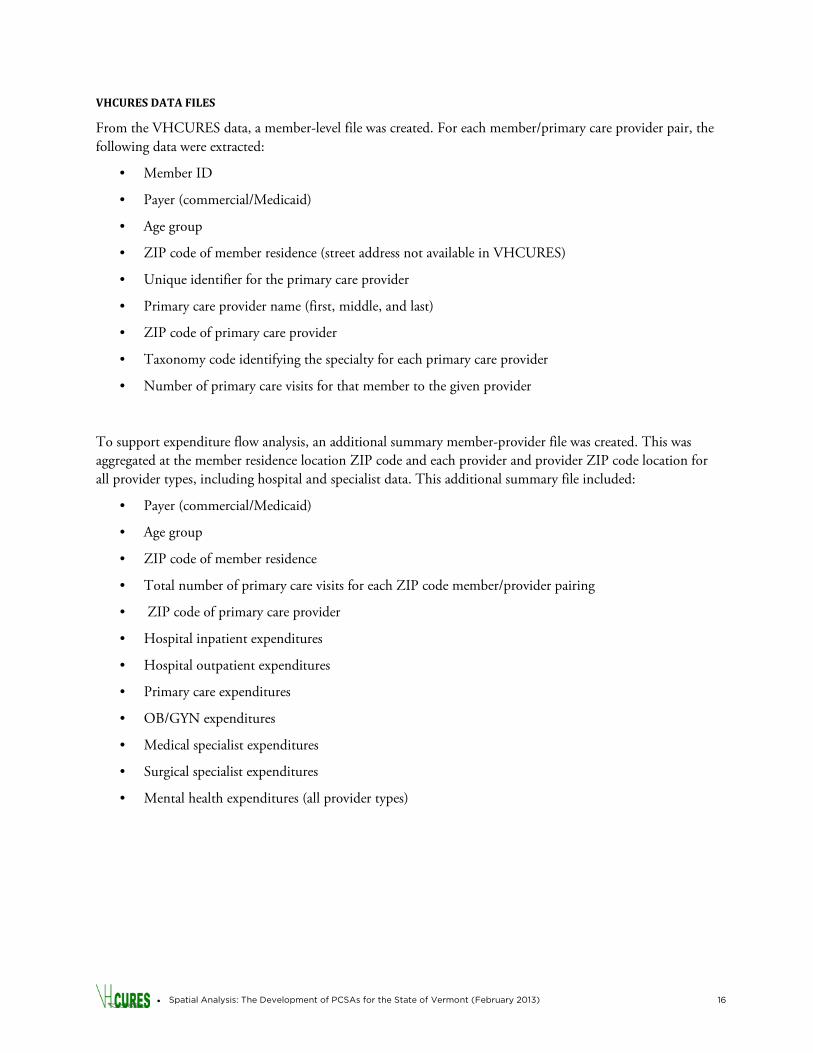
VHCURES DATA FILES
From the VHCURES data, a member-level file was created. For each member/primary care provider pair, the following data were extracted:
• Member ID
• Payer (commercial/Medicaid)
• Age group
• ZIP code of member residence (street address not available in VHCURES)
• Unique identifier for the primary care provider
• Primary care provider name (first, middle, and last)
• ZIP code of primary care provider
• Taxonomy code identifying the specialty for each primary care provider
• Number of primary care visits for that member to the given provider To support expenditure flow analysis, an additional summary member-provider file was created. This was aggregated at the member residence location ZIP code and each provider and provider ZIP code location for all provider types, including hospital and specialist data. This additional summary file included:
• Payer (commercial/Medicaid)
• Age group
• ZIP code of member residence
• Total number of primary care visits for each ZIP code member/provider pairing
• ZIP code of primary care provider
• Hospital inpatient expenditures
• Hospital outpatient expenditures
• Primary care expenditures
• OB/GYN expenditures
• Medical specialist expenditures
• Surgical specialist expenditures
• Mental health expenditures (all provider types)
• Spatial Analysis: The Development of PCSAs for the State of Vermont (February 2013) 17
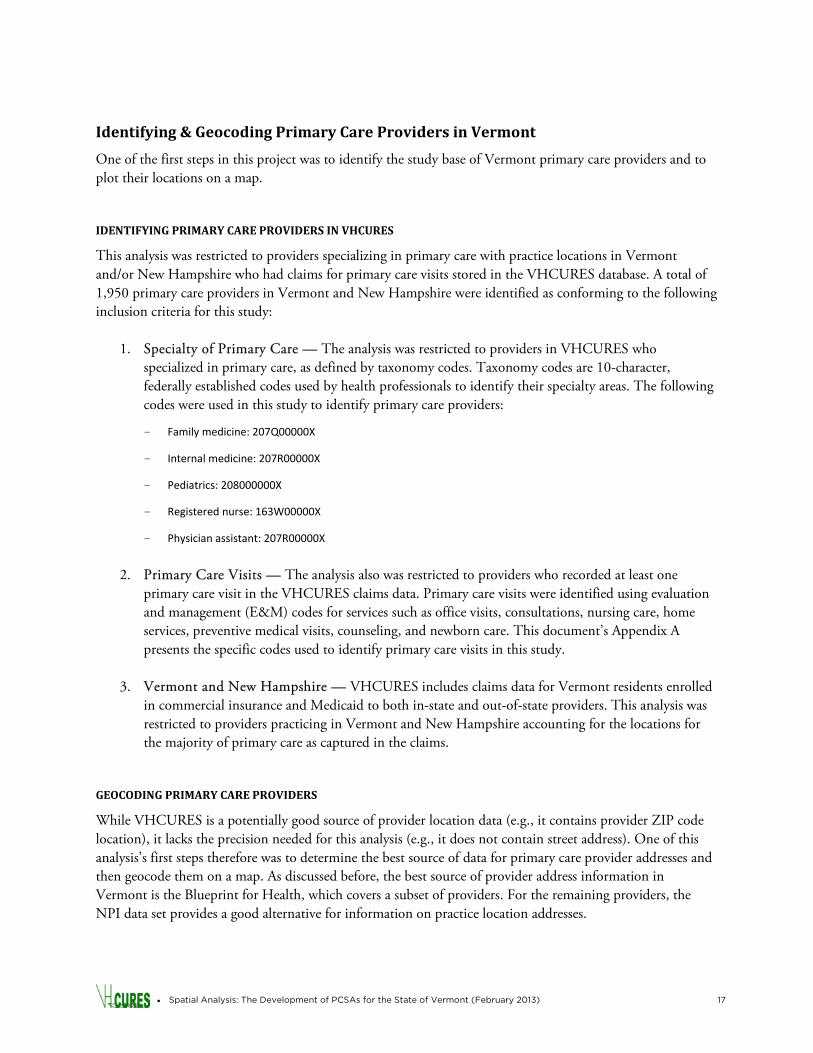
Identifying & Geocoding Primary Care Providers in Vermont
One of the first steps in this project was to identify the study base of Vermont primary care providers and to plot their locations on a map. IDENTIFYING PRIMARY CARE PROVIDERS IN VHCURES
This analysis was restricted to providers specializing in primary care with practice locations in Vermont and/or New Hampshire who had claims for primary care visits stored in the VHCURES database. A total of 1,950 primary care providers in Vermont and New Hampshire were identified as conforming to the following inclusion criteria for this study:
1. Specialty of Primary Care — The analysis was restricted to providers in VHCURES who specialized in primary care, as defined by taxonomy codes. Taxonomy codes are 10-character, federally established codes used by health professionals to identify their specialty areas. The following codes were used in this study to identify primary care providers:
- Family medicine: 207Q00000X
- Internal medicine: 207R00000X
- Pediatrics: 208000000X
- Registered nurse: 163W00000X
- Physician assistant: 207R00000X
2. Primary Care Visits — The analysis also was restricted to providers who recorded at least one
primary care visit in the VHCURES claims data. Primary care visits were identified using evaluation and management (E&M) codes for services such as office visits, consultations, nursing care, home services, preventive medical visits, counseling, and newborn care. This document’s Appendix A presents the specific codes used to identify primary care visits in this study.
3. Vermont and New Hampshire — VHCURES includes claims data for Vermont residents enrolled
in commercial insurance and Medicaid to both in-state and out-of-state providers. This analysis was restricted to providers practicing in Vermont and New Hampshire accounting for the locations for the majority of primary care as captured in the claims.
GEOCODING PRIMARY CARE PROVIDERS
While VHCURES is a potentially good source of provider location data (e.g., it contains provider ZIP code location), it lacks the precision needed for this analysis (e.g., it does not contain street address). One of this analysis’s first steps therefore was to determine the best source of data for primary care provider addresses and then geocode them on a map. As discussed before, the best source of provider address information in Vermont is the Blueprint for Health, which covers a subset of providers. For the remaining providers, the NPI data set provides a good alternative for information on practice location addresses.
• Spatial Analysis: The Development of PCSAs for the State of Vermont (February 2013) 18
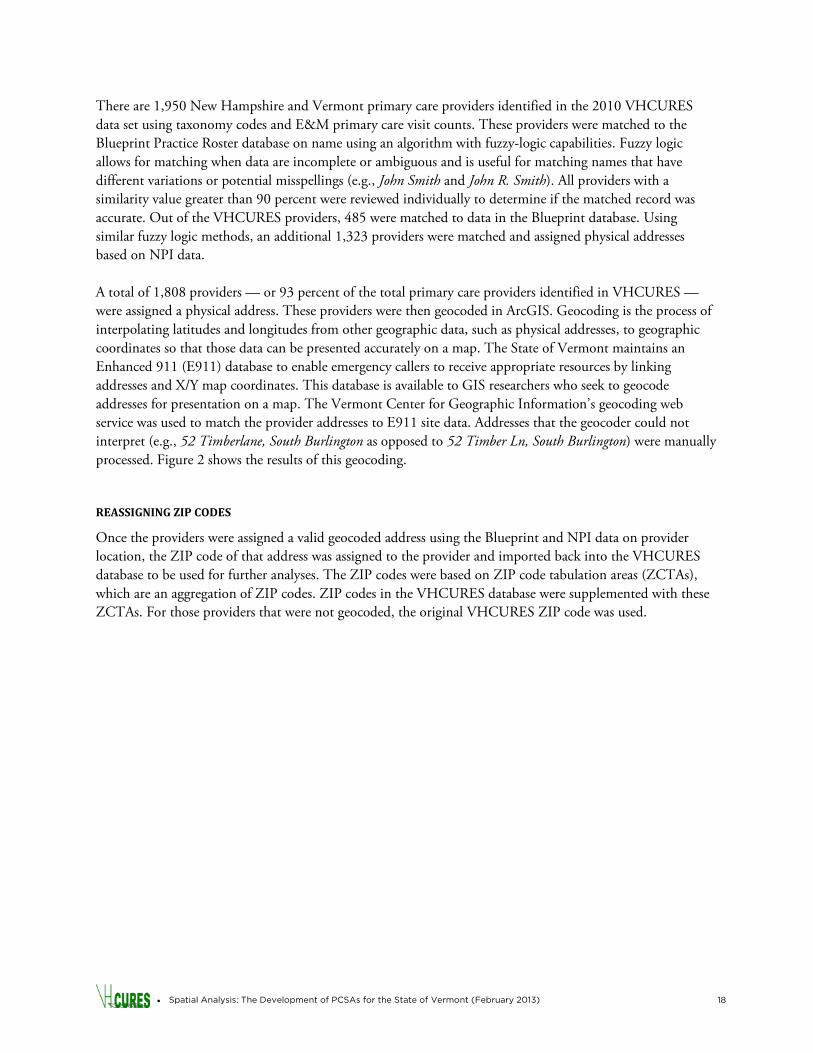
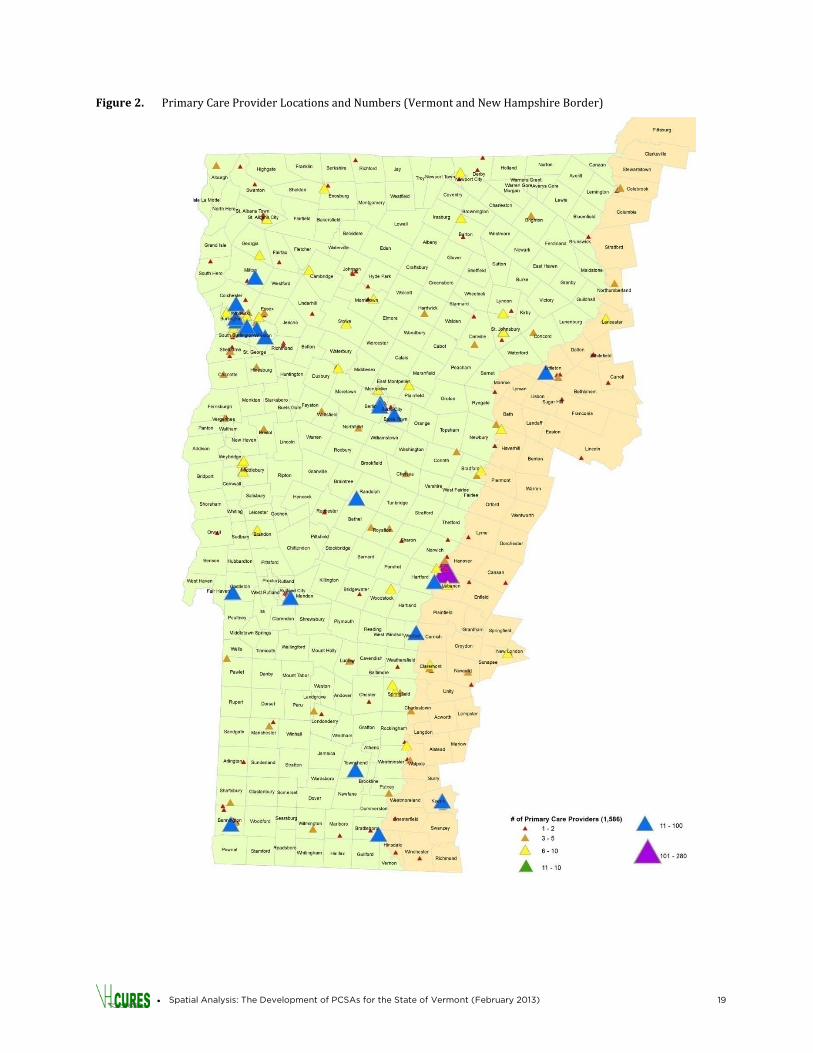
There are 1,950 New Hampshire and Vermont primary care providers identified in the 2010 VHCURES data set using taxonomy codes and E&M primary care visit counts. These providers were matched to the Blueprint Practice Roster database on name using an algorithm with fuzzy-logic capabilities. Fuzzy logic allows for matching when data are incomplete or ambiguous and is useful for matching names that have different variations or potential misspellings (e.g., John Smith and John R. Smith). All providers with a similarity value greater than 90 percent were reviewed individually to determine if the matched record was accurate. Out of the VHCURES providers, 485 were matched to data in the Blueprint database. Using similar fuzzy logic methods, an additional 1,323 providers were matched and assigned physical addresses based on NPI data. A total of 1,808 providers — or 93 percent of the total primary care providers identified in VHCURES — were assigned a physical address. These providers were then geocoded in ArcGIS. Geocoding is the process of interpolating latitudes and longitudes from other geographic data, such as physical addresses, to geographic coordinates so that those data can be presented accurately on a map. The State of Vermont maintains an Enhanced 911 (E911) database to enable emergency callers to receive appropriate resources by linking addresses and X/Y map coordinates. This database is available to GIS researchers who seek to geocode addresses for presentation on a map. The Vermont Center for Geographic Information’s geocoding web service was used to match the provider addresses to E911 site data. Addresses that the geocoder could not interpret (e.g., 52 Timberlane, South Burlington as opposed to 52 Timber Ln, South Burlington) were manually processed. Figure 2 shows the results of this geocoding. REASSIGNING ZIP CODES
Once the providers were assigned a valid geocoded address using the Blueprint and NPI data on provider location, the ZIP code of that address was assigned to the provider and imported back into the VHCURES database to be used for further analyses. The ZIP codes were based on ZIP code tabulation areas (ZCTAs), which are an aggregation of ZIP codes. ZIP codes in the VHCURES database were supplemented with these ZCTAs. For those providers that were not geocoded, the original VHCURES ZIP code was used.
• Spatial Analysis: The Development of PCSAs for the State of Vermont (February 2013) 19
Figure 2. Primary Care Provider Locations and Numbers (Vermont and New Hampshire Border)
• Spatial Analysis: The Development of PCSAs for the State of Vermont (February 2013) 20
Developing PCSAs CALCULATING PREFERENCE FRACTIONS
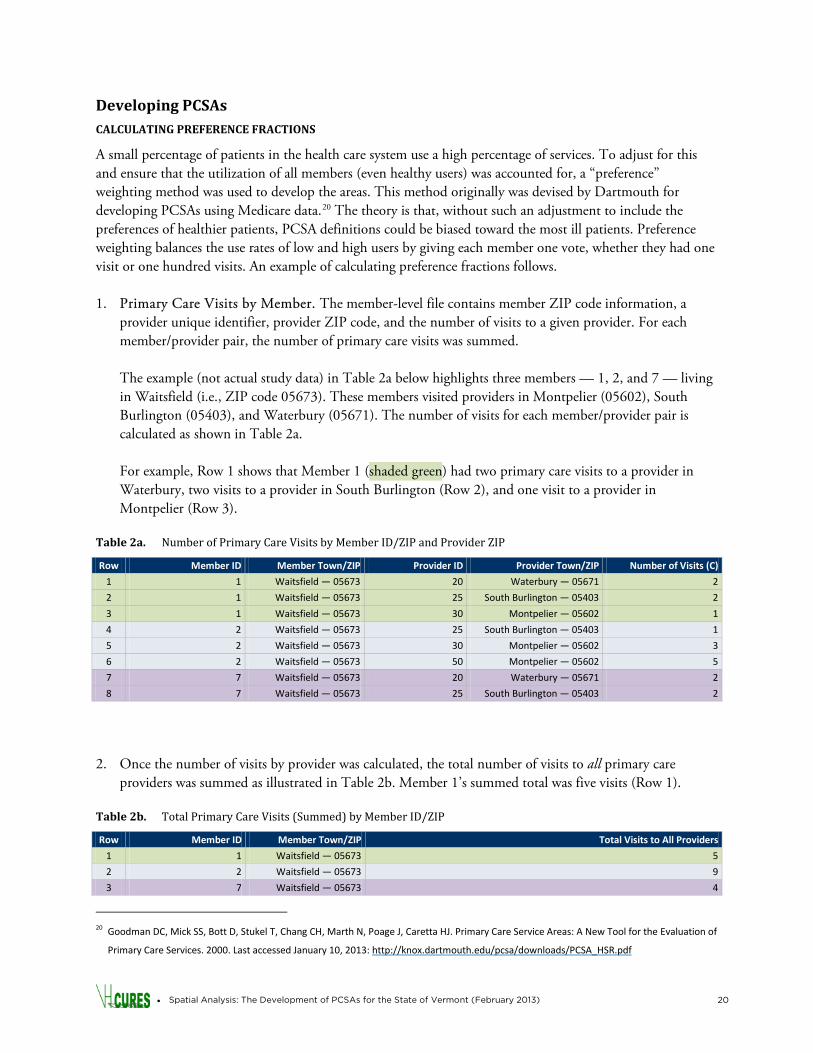
A small percentage of patients in the health care system use a high percentage of services. To adjust for this and ensure that the utilization of all members (even healthy users) was accounted for, a “preference” weighting method was used to develop the areas. This method originally was devised by Dartmouth for developing PCSAs using Medicare data.20
The theory is that, without such an adjustment to include the preferences of healthier patients, PCSA definitions could be biased toward the most ill patients. Preference weighting balances the use rates of low and high users by giving each member one vote, whether they had one visit or one hundred visits. An example of calculating preference fractions follows.
1. Primary Care Visits by Member. The member-level file contains member ZIP code information, a provider unique identifier, provider ZIP code, and the number of visits to a given provider. For each member/provider pair, the number of primary care visits was summed.
The example (not actual study data) in Table 2a below highlights three members — 1, 2, and 7 — living in Waitsfield (i.e., ZIP code 05673). These members visited providers in Montpelier (05602), South Burlington (05403), and Waterbury (05671). The number of visits for each member/provider pair is calculated as shown in Table 2a. For example, Row 1 shows that Member 1 (shaded green) had two primary care visits to a provider in Waterbury, two visits to a provider in South Burlington (Row 2), and one visit to a provider in Montpelier (Row 3).
Table 2a. Number of Primary Care Visits by Member ID/ZIP and Provider ZIP
Row Member ID Member Town/ZIP Provider ID Provider Town/ZIP Number of Visits (C)
1 1 Waitsfield — 05673 20 Waterbury — 05671 2
2 1 Waitsfield — 05673 25 South Burlington — 05403 2
3 1 Waitsfield — 05673 30 Montpelier — 05602 1
4 2 Waitsfield — 05673 25 South Burlington — 05403 1
5 2 Waitsfield — 05673 30 Montpelier — 05602 3
6 2 Waitsfield — 05673 50 Montpelier — 05602 5
7 7 Waitsfield — 05673 20 Waterbury — 05671 2
8 7 Waitsfield — 05673 25 South Burlington — 05403 2
2. Once the number of visits by provider was calculated, the total number of visits to all primary care
providers was summed as illustrated in Table 2b. Member 1’s summed total was five visits (Row 1).
Table 2b. Total Primary Care Visits (Summed) by Member ID/ZIP
Row Member ID Member Town/ZIP Total Visits to All Providers
1 1 Waitsfield — 05673 5
2 2 Waitsfield — 05673 9
3 7 Waitsfield — 05673 4
20 Goodman DC, Mick SS, Bott D, Stukel T, Chang CH, Marth N, Poage J, Caretta HJ. Primary Care Service Areas: A New Tool for the Evaluation of
Primary Care Services. 2000. Last accessed January 10, 2013: http://knox.dartmouth.edu/pcsa/downloads/PCSA_HSR.pdf
• Spatial Analysis: The Development of PCSAs for the State of Vermont (February 2013) 21
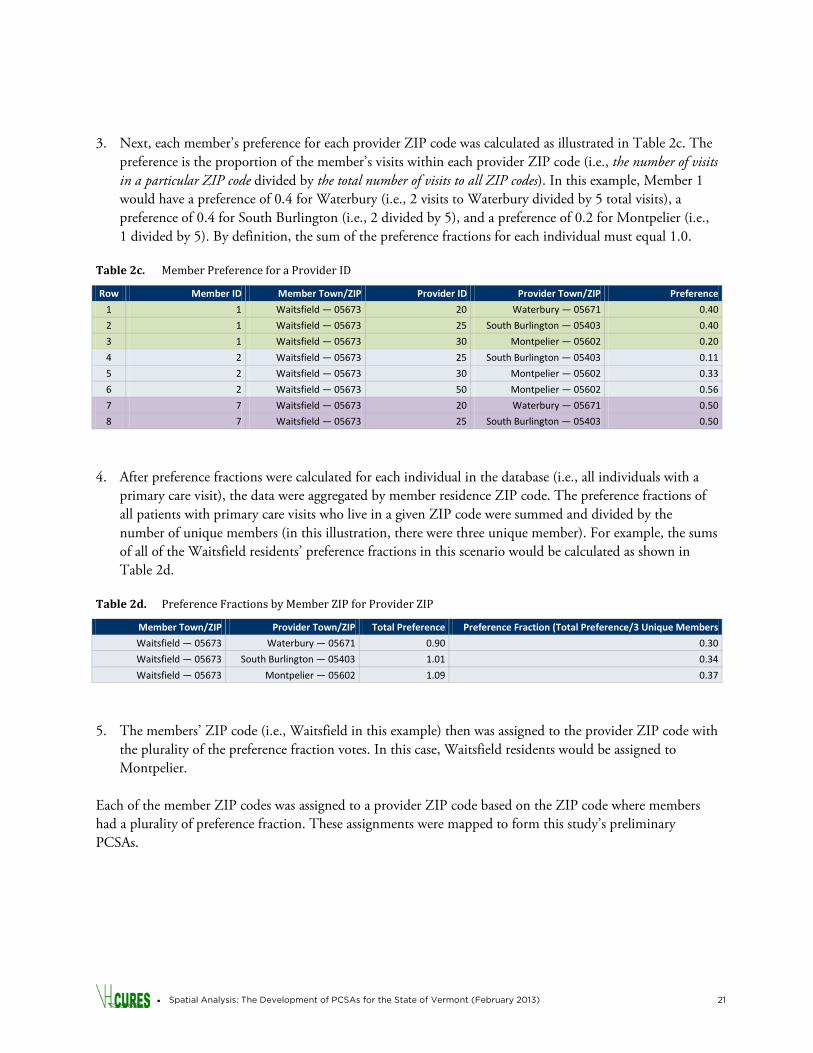
3. Next, each member’s preference for each provider ZIP code was calculated as illustrated in Table 2c. The
preference is the proportion of the member’s visits within each provider ZIP code (i.e., the number of visits in a particular ZIP code divided by the total number of visits to all ZIP codes). In this example, Member 1 would have a preference of 0.4 for Waterbury (i.e., 2 visits to Waterbury divided by 5 total visits), a preference of 0.4 for South Burlington (i.e., 2 divided by 5), and a preference of 0.2 for Montpelier (i.e., 1 divided by 5). By definition, the sum of the preference fractions for each individual must equal 1.0.
Table 2c. Member Preference for a Provider ID
Row Member ID Member Town/ZIP Provider ID Provider Town/ZIP Preference
1 1 Waitsfield — 05673 20 Waterbury — 05671 0.40
2 1 Waitsfield — 05673 25 South Burlington — 05403 0.40
3 1 Waitsfield — 05673 30 Montpelier — 05602 0.20
4 2 Waitsfield — 05673 25 South Burlington — 05403 0.11
5 2 Waitsfield — 05673 30 Montpelier — 05602 0.33
6 2 Waitsfield — 05673 50 Montpelier — 05602 0.56
7 7 Waitsfield — 05673 20 Waterbury — 05671 0.50
8 7 Waitsfield — 05673 25 South Burlington — 05403 0.50
4. After preference fractions were calculated for each individual in the database (i.e., all individuals with a
primary care visit), the data were aggregated by member residence ZIP code. The preference fractions of all patients with primary care visits who live in a given ZIP code were summed and divided by the number of unique members (in this illustration, there were three unique member). For example, the sums of all of the Waitsfield residents’ preference fractions in this scenario would be calculated as shown in Table 2d.
Table 2d. Preference Fractions by Member ZIP for Provider ZIP
Member Town/ZIP Provider Town/ZIP Total Preference Preference Fraction (Total Preference/3 Unique Members
Waitsfield — 05673 Waterbury — 05671 0.90 0.30
Waitsfield — 05673 South Burlington — 05403 1.01 0.34
Waitsfield — 05673 Montpelier — 05602 1.09 0.37
5. The members’ ZIP code (i.e., Waitsfield in this example) then was assigned to the provider ZIP code with
the plurality of the preference fraction votes. In this case, Waitsfield residents would be assigned to Montpelier.
Each of the member ZIP codes was assigned to a provider ZIP code based on the ZIP code where members had a plurality of preference fraction. These assignments were mapped to form this study’s preliminary PCSAs.
• Spatial Analysis: The Development of PCSAs for the State of Vermont (February 2013) 22
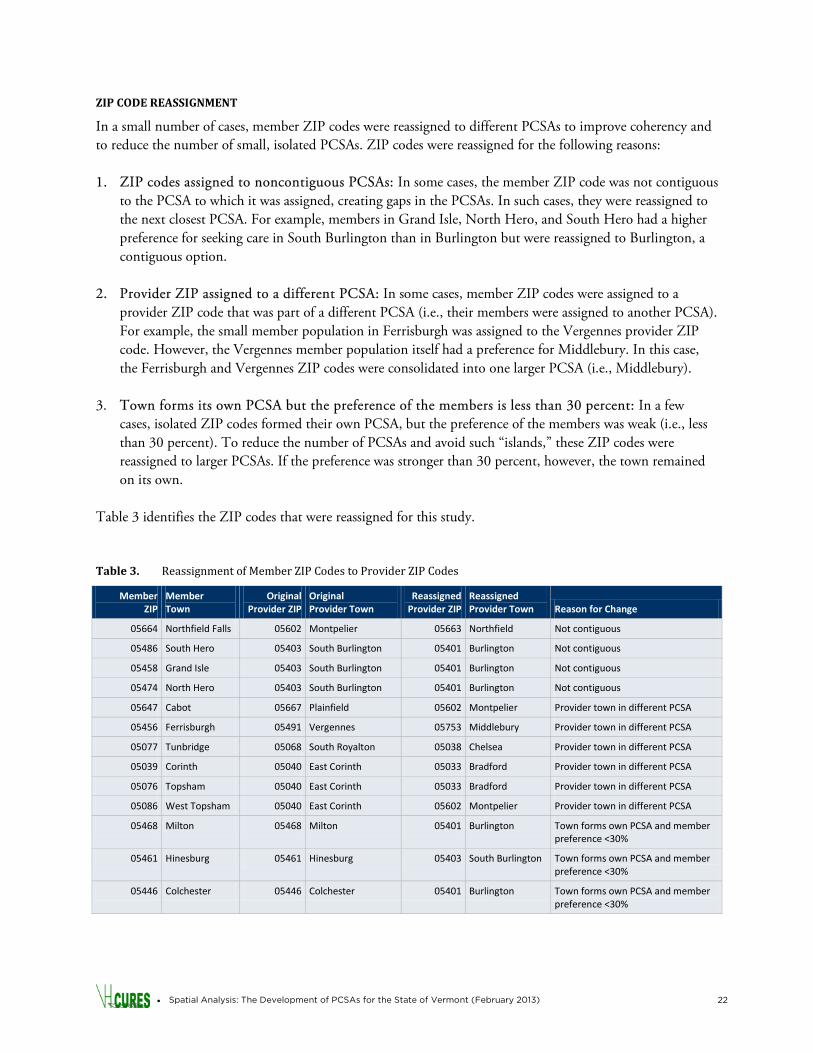
ZIP CODE REASSIGNMENT
In a small number of cases, member ZIP codes were reassigned to different PCSAs to improve coherency and to reduce the number of small, isolated PCSAs. ZIP codes were reassigned for the following reasons: 1. ZIP codes assigned to noncontiguous PCSAs: In some cases, the member ZIP code was not contiguous
to the PCSA to which it was assigned, creating gaps in the PCSAs. In such cases, they were reassigned to the next closest PCSA. For example, members in Grand Isle, North Hero, and South Hero had a higher preference for seeking care in South Burlington than in Burlington but were reassigned to Burlington, a contiguous option.
2. Provider ZIP assigned to a different PCSA: In some cases, member ZIP codes were assigned to a provider ZIP code that was part of a different PCSA (i.e., their members were assigned to another PCSA). For example, the small member population in Ferrisburgh was assigned to the Vergennes provider ZIP code. However, the Vergennes member population itself had a preference for Middlebury. In this case, the Ferrisburgh and Vergennes ZIP codes were consolidated into one larger PCSA (i.e., Middlebury).
3. Town forms its own PCSA but the preference of the members is less than 30 percent: In a few cases, isolated ZIP codes formed their own PCSA, but the preference of the members was weak (i.e., less than 30 percent). To reduce the number of PCSAs and avoid such “islands,” these ZIP codes were reassigned to larger PCSAs. If the preference was stronger than 30 percent, however, the town remained on its own.
Table 3 identifies the ZIP codes that were reassigned for this study. Table 3. Reassignment of Member ZIP Codes to Provider ZIP Codes
Member ZIP
Member Town
Original Provider ZIP
Original Provider Town
Reassigned Provider ZIP
Reassigned Provider Town Reason for Change
05664 Northfield Falls 05602 Montpelier 05663 Northfield Not contiguous
05486 South Hero 05403 South Burlington 05401 Burlington Not contiguous
05458 Grand Isle 05403 South Burlington 05401 Burlington Not contiguous
05474 North Hero 05403 South Burlington 05401 Burlington Not contiguous
05647 Cabot 05667 Plainfield 05602 Montpelier Provider town in different PCSA
05456 Ferrisburgh 05491 Vergennes 05753 Middlebury Provider town in different PCSA
05077 Tunbridge 05068 South Royalton 05038 Chelsea Provider town in different PCSA
05039 Corinth 05040 East Corinth 05033 Bradford Provider town in different PCSA
05076 Topsham 05040 East Corinth 05033 Bradford Provider town in different PCSA
05086 West Topsham 05040 East Corinth 05602 Montpelier Provider town in different PCSA
05468 Milton 05468 Milton 05401 Burlington Town forms own PCSA and member preference <30%
05461 Hinesburg 05461 Hinesburg 05403 South Burlington Town forms own PCSA and member preference <30%
05446 Colchester 05446 Colchester 05401 Burlington Town forms own PCSA and member preference <30%
• Spatial Analysis: The Development of PCSAs for the State of Vermont (February 2013) 23
FINAL PCSAS
After reassignment, the delineated areas were mapped to form the initial PCSAs. The strength of the preference for each of the ZIP codes within the PCSAs was evaluated.
Additional Analyses
Once PCSAs were defined, additional analyses using the new PCSA geographies were conducted to evaluate the usefulness of PCSAs as described below. PREFERENCE INDEX BY PCSA
The preference index is equal to the number of members who prefer to stay in their PCSA for primary care divided by the total number of primary-care-seeking members in that PCSA. Preference index offers a view of the strength of the PCSA as an analysis area (i.e., the fit of that PCSA to that population). A high preference index indicates that the members of the PCSA are very likely to stay in their PCSA for primary care and unlikely to travel elsewhere. In such cases, the PCSA is a good fit for that population compared with an area with a low preference index (i.e., a large portion of the members travel elsewhere for primary care). It is important to keep preference index in mind when additional studies of primary care are initiated using the defined PCSAs. If preference index is weak, caution must be used before attributing utilization and cost patterns to the primary care system within a PCSA. Preference index also was calculated separately for pediatric populations (i.e., members ages 0–5 years). CENSUS POPULATIONS BY PCSA
The population for each PCSA was determined from 2010 U.S. Census population data by Vermont ZIP code. Vermont’s total population figure from the Census will not be the same as the total number of people included in the VHCURES data nor the total number using primary care due to a range of factors. Instead, it is the total number of residents (all ages) living in each of these areas. The purpose of this step was to determine, for reference, the size of the populations that might be available for analysis at the PCSA level and to determine the degree to which statistical validity of future analyses might be impacted by small numbers in a PCSA. RATIO OF POPULATION TO PROVIDER
The ratio of population to provider can be used as a measure to gauge general access to care. Primary care provider shortages, particularly in rural areas, may make it difficult for residents to make appointments with a primary care physician when needed. This also contributes to longer travel times for appointments. High population per provider is indicative of low access, while low population per provider indicates possibly better access after also considering availability of timely appointments, accessible office hours, acceptance of insurance, coordination of care, and other factors that may impact access to care.

• Spatial Analysis: The Development of PCSAs for the State of Vermont (February 2013) 24
TRAVEL TIME
For each unique member-to-provider combination, the time travelled (i.e., member ZIP code to provider ZIP code) was calculated. Then, for each PCSA, the median travel time for member-to-provider visits was calculated separately for (1) all providers, (2) providers within the PCSA, and (3) providers outside of the PCSA. If the member and provider were in the same ZIP code, the travel time defaulted to zero minutes. Medians were used instead of means to prevent outlier member-provider pairs from disproportionately affecting the results. FLOWS OF EXPENDITURES
The workgroup requested exploration of claims expenditures within PCSAs the flow of claims expenditure from PCSAs to other areas. This is an important issue in planning for health reform. For many areas, a large proportion of hospital/specialist services and total expenditures were delivered by providers outside of the PCSA. For each PCSA population, total medical expenditures (i.e., hospital, specialists, primary care, and other providers) were calculated using VHCURES Medicaid and commercial claims data for 2010. Total expenditures were stratified by the amount spent within the PCSA and by the amount spent outside of the PCSA.
• Spatial Analysis: The Development of PCSAs for the State of Vermont (February 2013) 25
RESULTS
Primary Care Service Areas
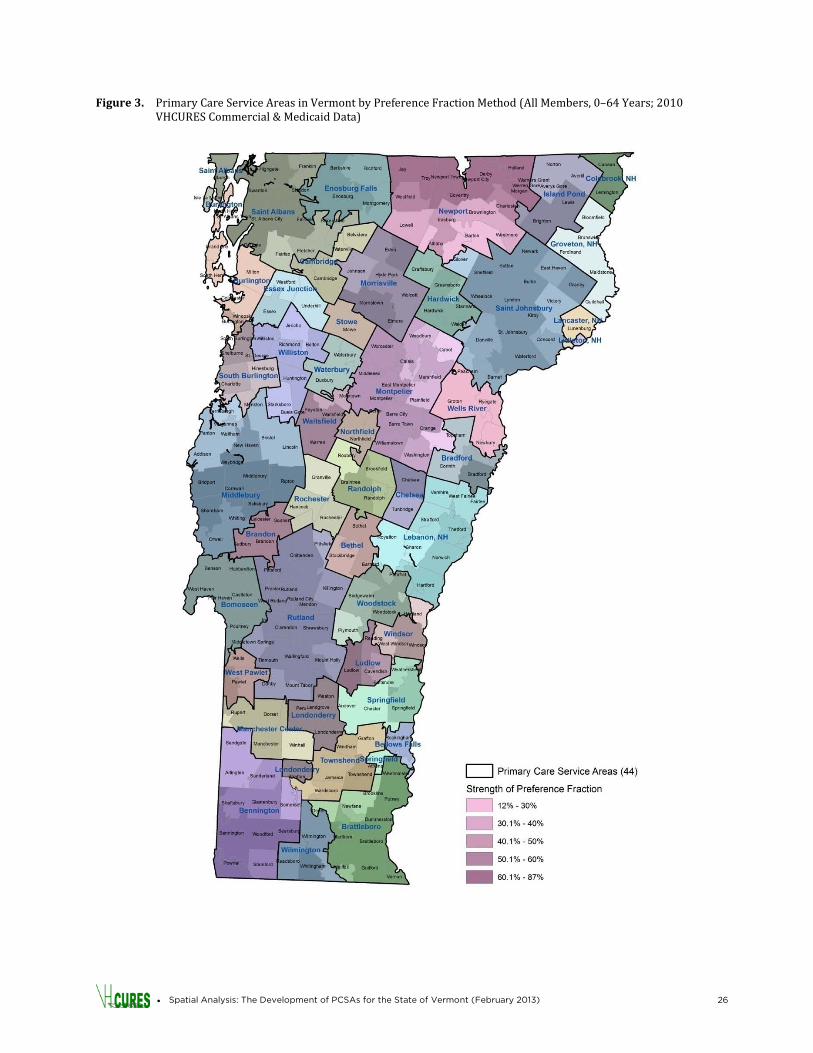
Using 2010 VHCURES claims data and the methodology described above, 44 Primary Care Service Areas were identified across the state, as shown in Figure 3. For each member ZIP code, the strength of the preference for the provider ZIP code also was determined (and presented in Figure 3). At the ZIP code level, preference for provider ZIP codes range from 12 percent to 87 percent. Preference tended to decrease in areas that were further away from the center of the PCSA, with patients at the periphery more likely to travel to other PCSAs for care. For example, in the Middlebury PCSA, towns close to Middlebury (e.g., Cornwall, Ripton, and Weybridge) without other nearby options had a stronger preference for Middlebury than did those further from the town. Also note that the preference for Middlebury was lower in areas to the north (e.g., Ferrisburgh, Vergennes, and Bristol) where the Burlington and South Burlington providers are proximate options compared to areas in the south (e.g., (Orwell and Whiting) where there are few providers.
Preference Index
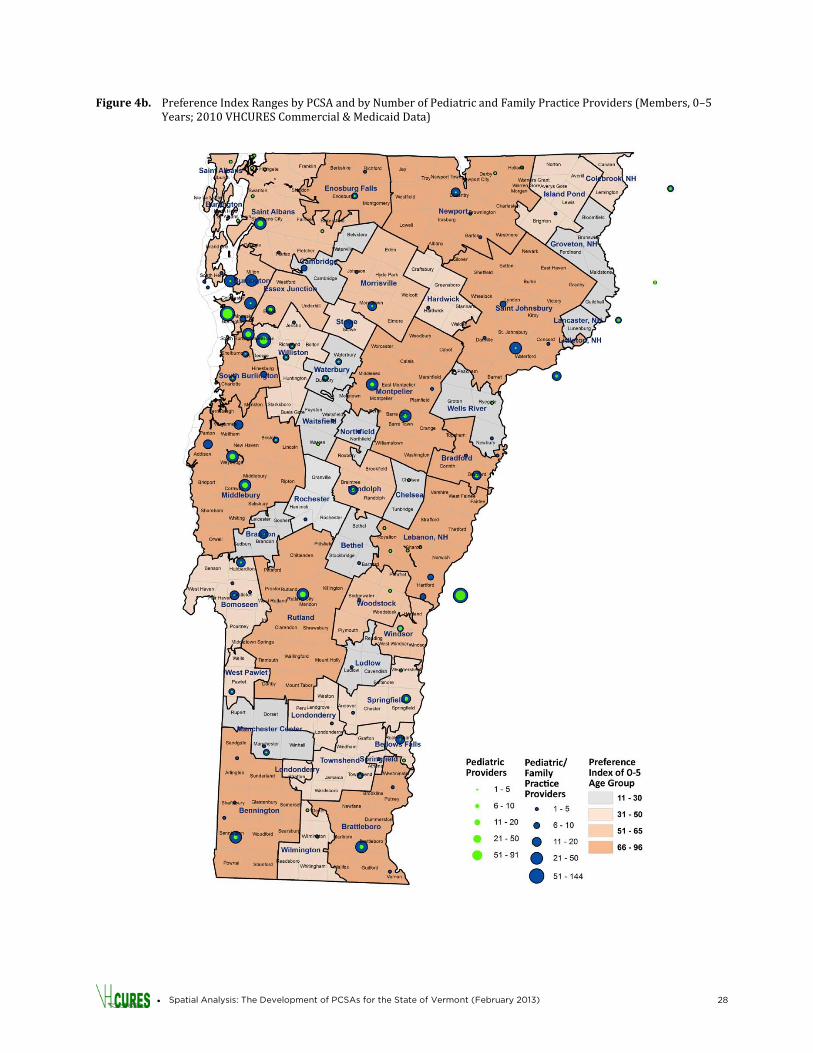
The preference index ranges for each of Vermont’s PCSAs are provided in Figure 4a. There was great variation in preference index summarized at the PCSA level — from as low as 23 percent to as high as 90 percent. Large towns surrounded by rural areas tended to have the highest preference indexes (e.g., Brattleboro, Bennington, Middlebury, and Montpelier). The preference indexes were somewhat lower in Chittenden County (i.e., Burlington, South Burlington, Essex Junction, and Williston), perhaps because patients in these PCSAs had a variety of choices for seeking care within reasonable driving distance. Preference indexes also tended to be low in some of the rural PCSAs in the center of the state (e.g., Bethel, Chelsea, Northfield, and Rochester) where options for other providers may be more limited. Some of the PCSAs assigned to New Hampshire providers had the lowest preference indexes (e.g., Wells River [27 percent], Lancaster [28 percent], Littleton [29 percent], and Groveton [32 percent]). Patients in these areas have a variety of options for care and split their preference among them, resulting in a weak preference index for the PCSA to which they were assigned. In contrast, the preference index for the Lebanon, New Hampshire, area was much higher (54 percent), indicating that patients living in Vermont close to Lebanon had a strong preference for the Lebanon-area practices, probably because Lebanon contains a major medical center (i.e., Dartmouth-Hitchcock Medical Center). The work group requested a review of PCSA assignment for young children where patterns of primary care seeking, availability of pediatricians, and travel time could be different than for adults. Figure 4b presents the preference indexes for these members (i.e., ages 0–5 years; referred to hereafter as “young children”). This age group was chosen for additional analysis because children under the age of five tend to have regular well child visits, whereas older children tend to visit their primary care provider less frequently. As with the pattern displayed by all members (Figure 4a), higher preference indexes were observed for young children living in larger towns surrounded by rural areas. Young children in rural PCSAs within the state had lower preference indexes. The map (Figure 4b) also shows the number of pediatric and family practice providers in each PCSA. The PCSAs with low preference indexes for young children tended to have a very small number of pediatricians and family practice providers.
• Spatial Analysis: The Development of PCSAs for the State of Vermont (February 2013) 26
Figure 3. Primary Care Service Areas in Vermont by Preference Fraction Method (All Members, 0–64 Years; 2010 VHCURES Commercial & Medicaid Data)

• Spatial Analysis: The Development of PCSAs for the State of Vermont (February 2013) 27
Figure 4a. Preference Index Ranges by PCSA (All Members, 0–64 Years; 2010 VHCURES Commercial & Medicaid Data)
• Spatial Analysis: The Development of PCSAs for the State of Vermont (February 2013) 28
Figure 4b. Preference Index Ranges by PCSA and by Number of Pediatric and Family Practice Providers (Members, 0–5 Years; 2010 VHCURES Commercial & Medicaid Data)

• Spatial Analysis: The Development of PCSAs for the State of Vermont (February 2013) 29
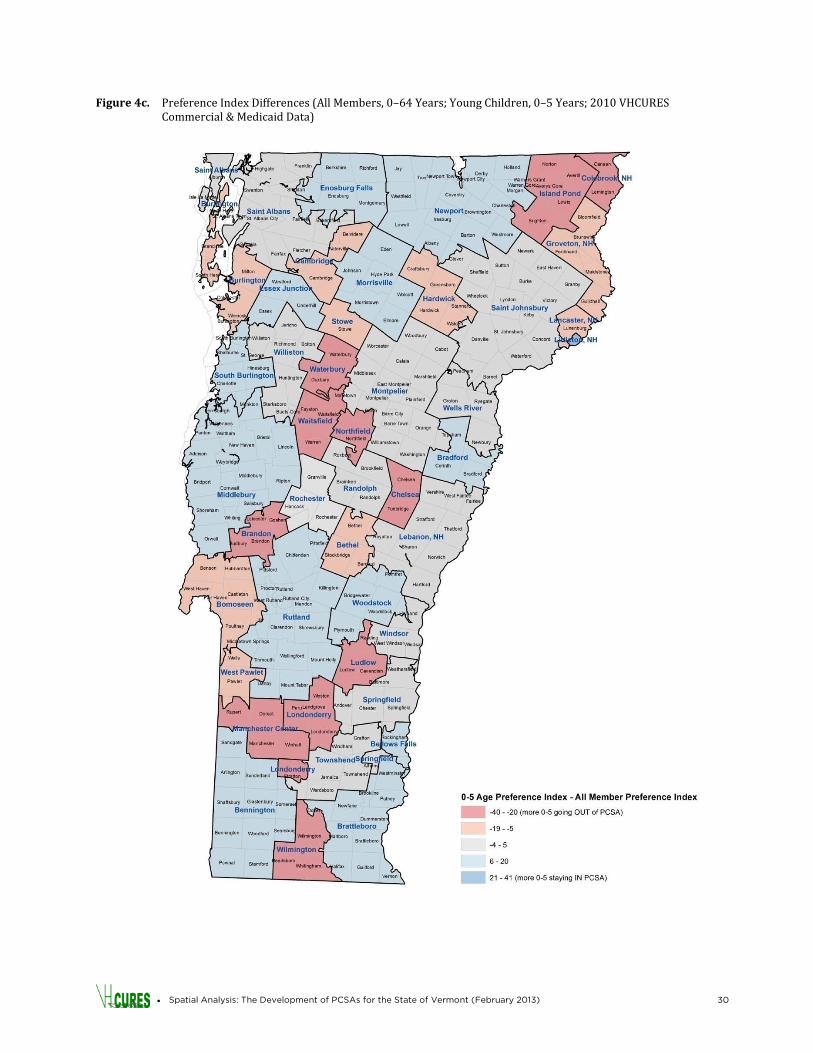
Figure 4c shows the difference between the preference indexes for all members (Figure 4a) and the preference indexes for young children (i.e., members ages 0–5 years; Figure 4b). High negative values (shaded red) indicate that a lower percentage of young children stayed within their PCSA for care compared to members of all ages. For areas shaded blue, the reverse was true. The high negative (red) values appeared predominately in rural areas in the center of the state, where there are few pediatric/family practitioners available (e.g., Island Pond, Londonderry, Ludlow, and Northfield), while the blue areas tended to have a greater network of pedicatric/family practice physicians (e.g., Bradford, Enosburg Falls, Newport). In general, it appears that members of the small, rural PCSAs were more likely to take their young children to larger, regional centers than was the all-member population. Part of the reason for this seems to have been lack of access to pediatric/family practitioners closer to home.
• Spatial Analysis: The Development of PCSAs for the State of Vermont (February 2013) 30
Figure 4c. Preference Index Differences (All Members, 0–64 Years; Young Children, 0–5 Years; 2010 VHCURES Commercial & Medicaid Data)
• Spatial Analysis: The Development of PCSAs for the State of Vermont (February 2013) 31
Population by PCSA
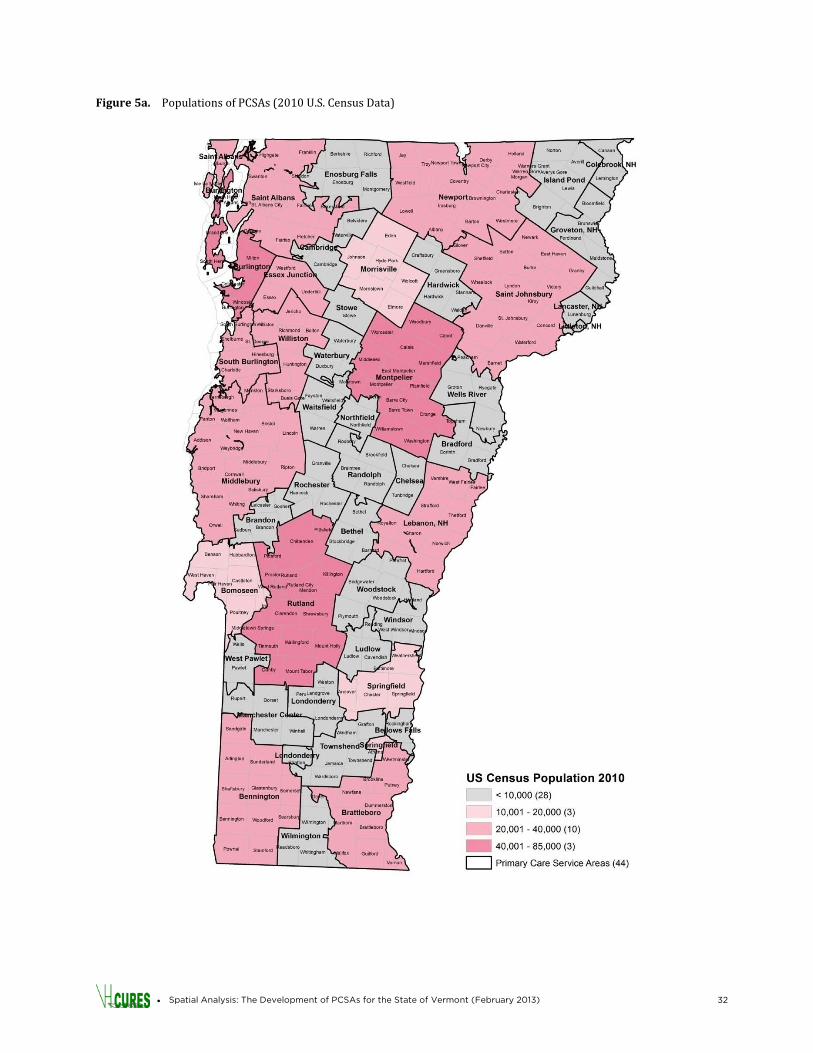
Figure 5a presents the U.S. Census population for Vermont by PCSA. The Burlington, Montpelier, and Rutland PCSAs had the largest populations (i.e., 40,000–85,000 people). There were 13 PCSAs with total U.S. Census populations between 10,000 and 40,000. A large majority of PCSAs — 28 of the 44 — had populations of fewer than 10,000 people (28 areas) and some had fewer than 1,000 people, reflecting the rural nature of the state.
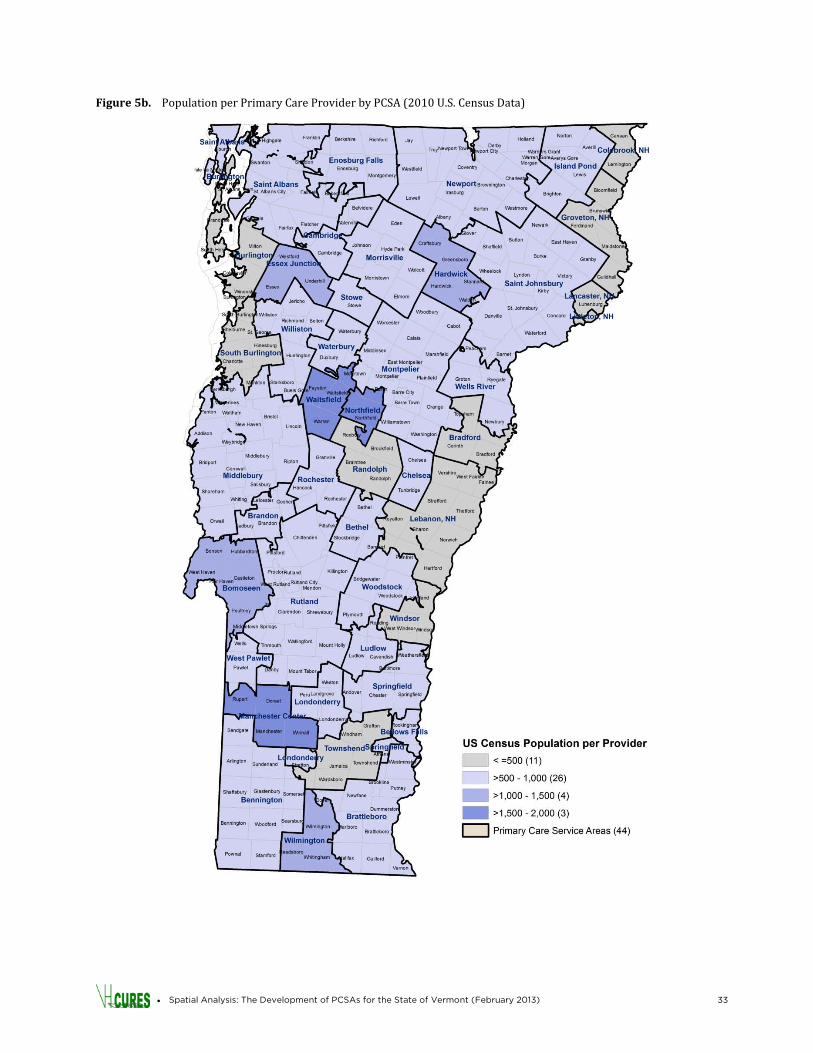
Population per Provider by PCSA
Figure 5b shows the total U.S. Census population per primary care provider in each of the PCSAs. This analysis looked only at the total number of providers and did not account for full-time equivalents (FTEs), so a provider was counted equally whether or not they worked full time or in multiple locations. The population per provider varied widely throughout the state. The ratio was low in Burlington and South Burlington (i.e., fewer than 500 people per provider) due to the large number of physicians practicing in the greater Burlington area. Population per provider was also very low in some of the PCSAs along the New Hampshire border, but this appears to have been due to artificially low population numbers for those PCSAs since New Hampshire residents are not included in the VHCURES data set but use the same providers. There were three PCSAs with 1,500–2,000 residents per primary care provider (i.e., Manchester Center, Northfield, and Waitsfield), and another four PCSAs with 1,000–1,500 people per provider (i.e., Bomoseen, Essex Junction, Hardwick, and Wilmington).
• Spatial Analysis: The Development of PCSAs for the State of Vermont (February 2013) 32
Figure 5a. Populations of PCSAs (2010 U.S. Census Data)
• Spatial Analysis: The Development of PCSAs for the State of Vermont (February 2013) 33
Figure 5b. Population per Primary Care Provider by PCSA (2010 U.S. Census Data)
• Spatial Analysis: The Development of PCSAs for the State of Vermont (February 2013) 34
Travel Time
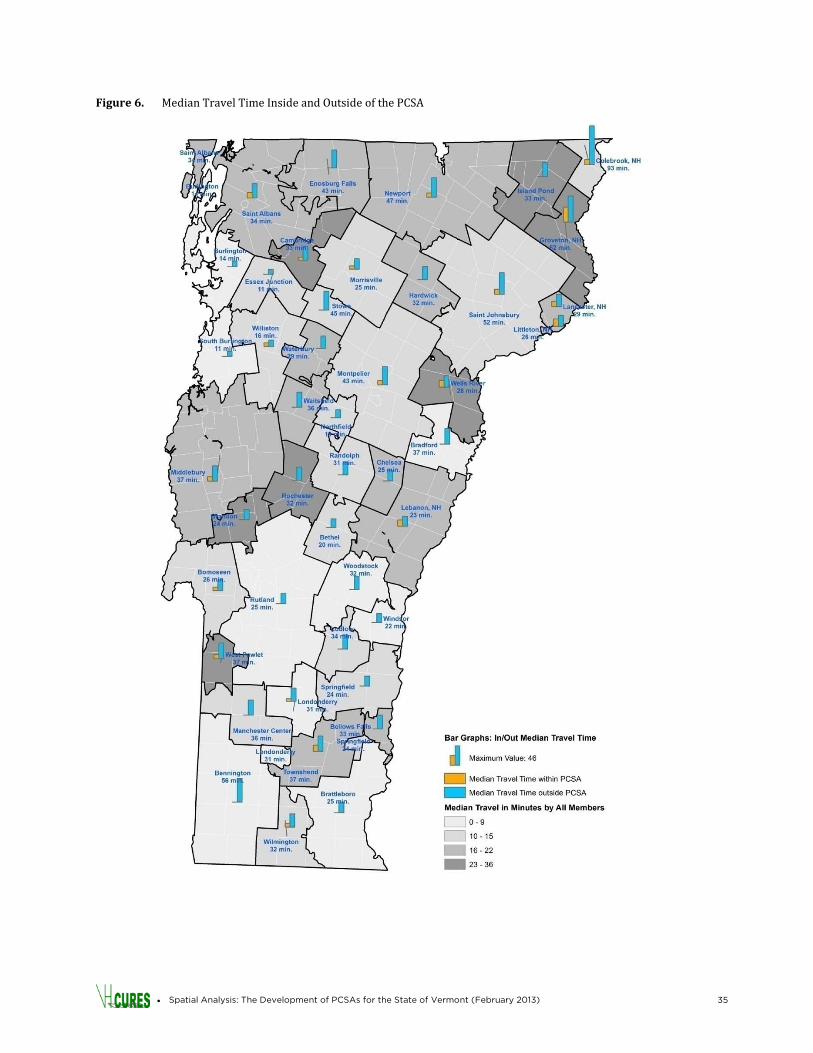
Another measure of access is the time that patients travel to primary care providers, as shown in Figure 6. This varied greatly statewide, with median travel time for all providers (both in and out of the PCSA) as high as 36 minutes (i.e., Grovetown) and as low as 11 minutes (i.e., South Burlington). PCSAs where the median travel time was greater than 23 minutes included Brandon, Cambridge, Groveton, Island Pond, Rochester, Wells River, and West Pawlet. These PCSAs tend to be rural and isolated from other primary care centers, and contained patients either willing to or required to travel a long time to access care. Travel time to providers outside of patients’ PCSAs also was evaluated. This varied greatly throughout Vermont. For the majority of PCSAs in Vermont, the median travel time out of the PCSA was between 20 minutes and 45 minutes. However, in the Burlington area PCSAs (i.e., Burlington, Essex Junction, South Burlington, and Williston), the median travel time outside of the PCSA was 16 minutes or less, indicating that members who travelled out of their PCSAs most often went to a neighboring PCSA in that region. Additionally, there were five PCSAs where median travel time beyond the PCSA was even greater than 45 minutes (i.e., Colebrook, New Hampshire [93 min.]; Groveton, New Hampshire [62 min.]; Bennington [56 min.]; St. Johnsbury [52 min.]; and Newport [47 min.]). For four of these five PCSAs (i.e., all except Groveton, New Hampshire), the preference of members to stay within their own PCSA for care was strong (i.e., greater than 51 percent).
• Spatial Analysis: The Development of PCSAs for the State of Vermont (February 2013) 35
Figure 6. Median Travel Time Inside and Outside of the PCSA
• Spatial Analysis: The Development of PCSAs for the State of Vermont (February 2013) 36
Expenditure Flows
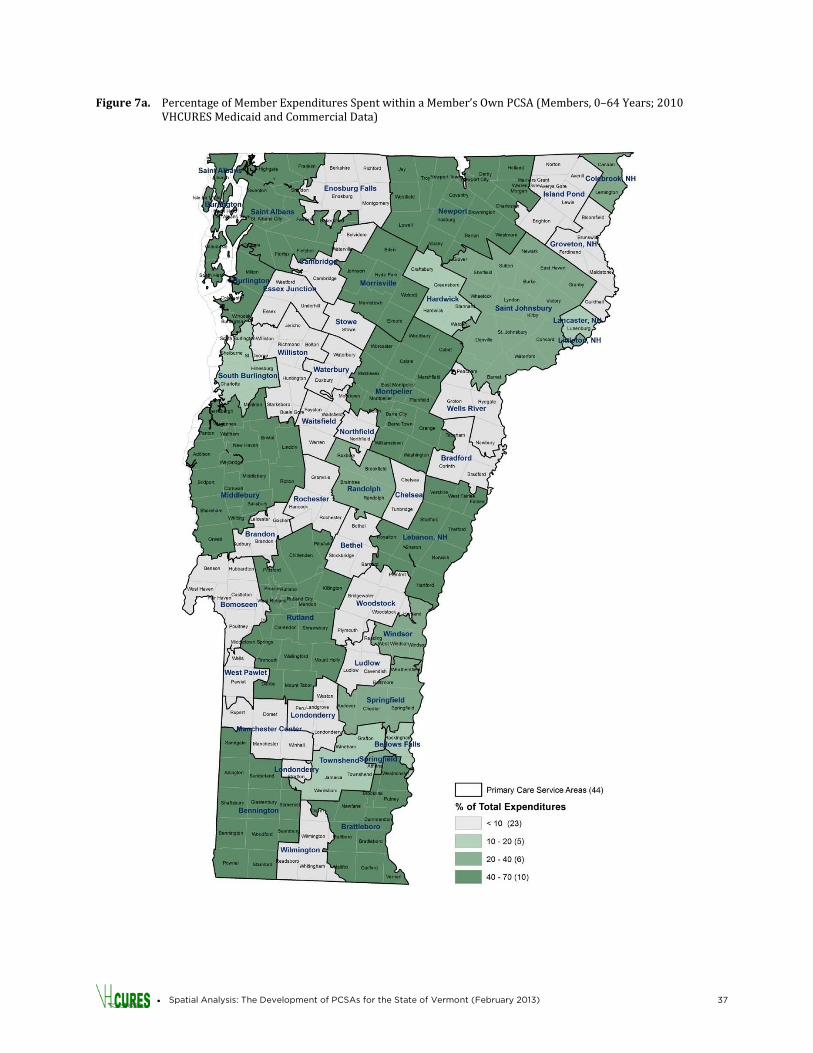
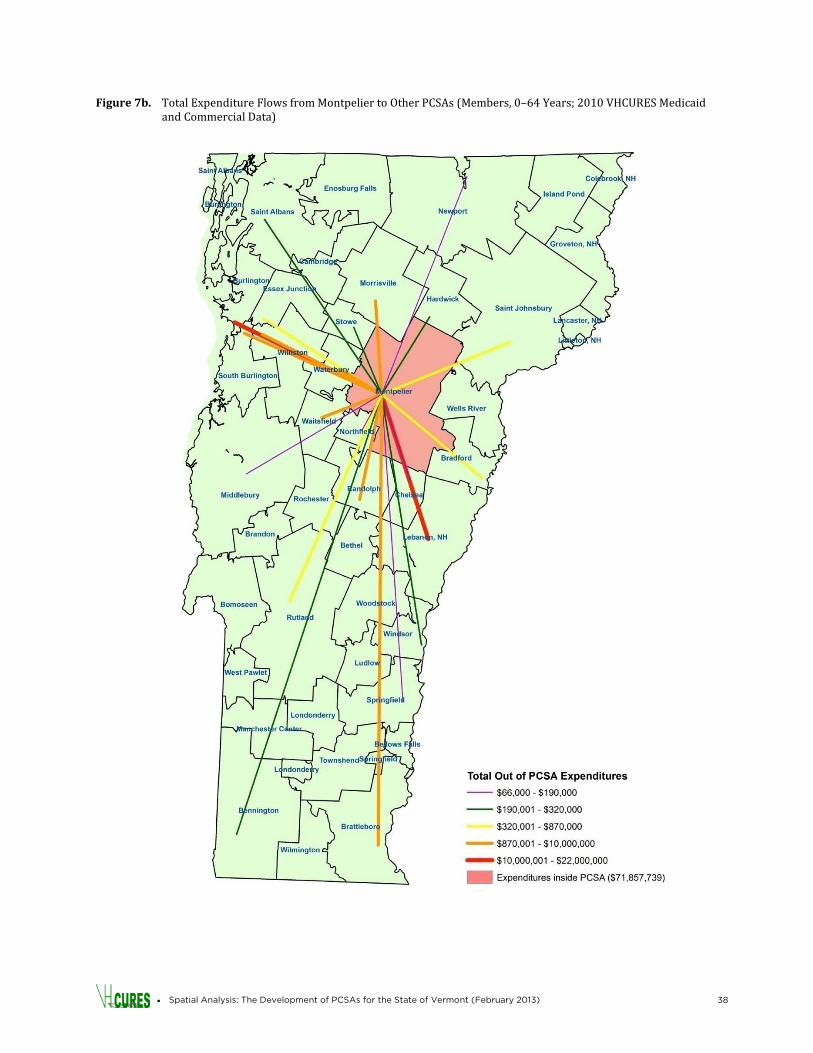
The percentage of expenditures that members spent within their PCSA was then calculated for each PCSA (see Figure 7a). The percentage of expenditures spent within a member’s PCSA displayed a broad range. For 23 of the 44 PCSAs, less than 10 percent of member expenditures stayed within the member’s PCSA. These 23 PCSAs, located throughout the state, tend to be rural (e.g., Bradford, Groveton, Manchester Center, and Northfield). For 10 PCSAs, in contrast, 40 percent – 70 percent of member expenditures stayed within the member’s PCSA (e.g., Bennington; Brattleboro; Burlington; Lebanon, New Hampshire; Middlebury, Rutland). The occurrence of hospitals in these PCSAs had a positive correlation with the large percentage of in-PCSA spending in these areas. Figure 7b shows an alternate visualization of expenditure flows using a spider diagram. Figure 7b focuses on the Montpelier PCSA and uses lines of different colors and thicknesses to show where Montpelier PCSA members’ expenditures (a total of $127.2 million) were spent throughout the state. Table 4a shows the actual dollar values spent in and outside of Montpelier PCSA by its members. More than half of Montpelier members’ expenditures remained within the Montpelier PCSA (i.e., $71.9 million or 56.5 percent). Another $21.8 million (17.2 percent) flowed to the Burlington PCSA, $13.3 million (10.4 percent) flowed to the Lebanon PCSA, and $6.1 million (4.8 percent) flowed to the Randolph PCSA. The other PCSAs received smaller levels of expenditures from Montpelier PCSA members. These findings suggest that Montpelier members tended to use primary care and hospital services in the Montpelier PCSA most frequently but that they also tended to travel to tertiary hospitals in Burlington and Lebanon (e.g., Dartmouth-Hitchcock) PCSAs for specialty care. Claims expenditures also flowed towards Gifford Hospital in Randolph for certain services such as maternity.
• Spatial Analysis: The Development of PCSAs for the State of Vermont (February 2013) 37
Figure 7a. Percentage of Member Expenditures Spent within a Member’s Own PCSA (Members, 0–64 Years; 2010 VHCURES Medicaid and Commercial Data)
• Spatial Analysis: The Development of PCSAs for the State of Vermont (February 2013) 38
Figure 7b. Total Expenditure Flows from Montpelier to Other PCSAs (Members, 0–64 Years; 2010 VHCURES Medicaid and Commercial Data)
• Spatial Analysis: The Development of PCSAs for the State of Vermont (February 2013) 39
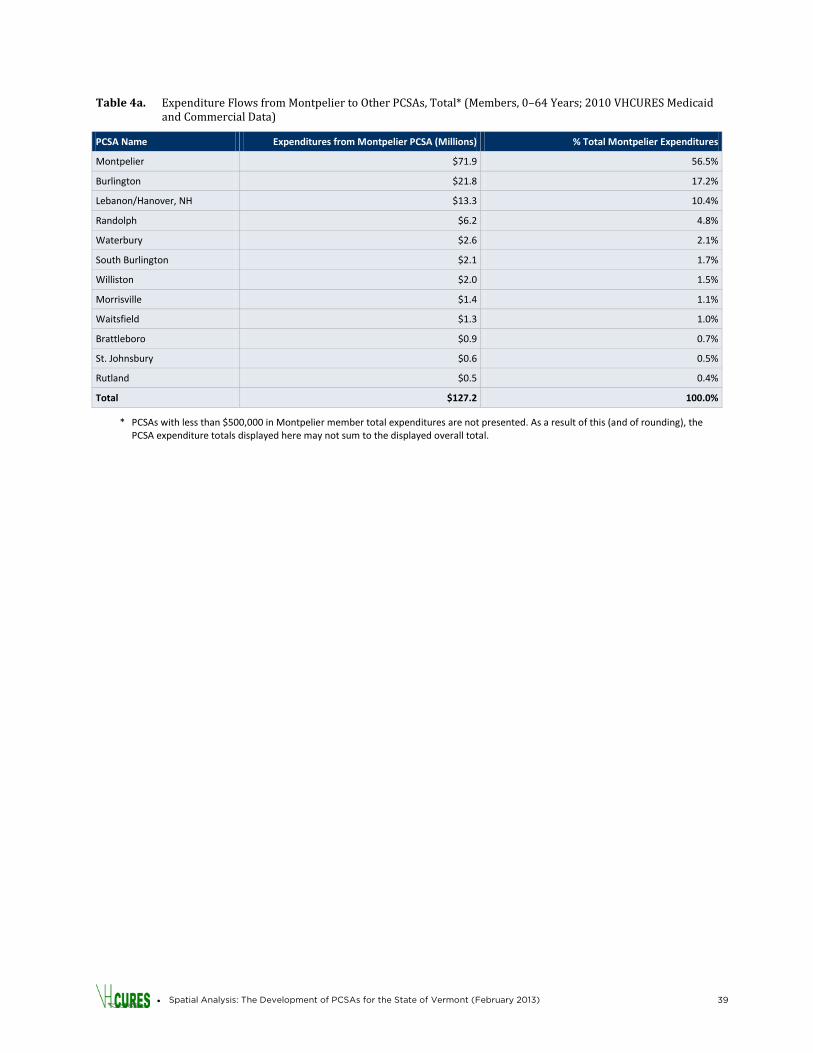
Table 4a. Expenditure Flows from Montpelier to Other PCSAs, Total* (Members, 0–64 Years; 2010 VHCURES Medicaid and Commercial Data)
PCSA Name Expenditures from Montpelier PCSA (Millions) % Total Montpelier Expenditures
Montpelier $71.9 56.5%
Burlington $21.8 17.2%
Lebanon/Hanover, NH $13.3 10.4%
Randolph $6.2 4.8%
Waterbury $2.6 2.1%
South Burlington $2.1 1.7%
Williston $2.0 1.5%
Morrisville $1.4 1.1%
Waitsfield $1.3 1.0%
Brattleboro $0.9 0.7%
St. Johnsbury $0.6 0.5%
Rutland $0.5 0.4%
Total $127.2 100.0%
* PCSAs with less than $500,000 in Montpelier member total expenditures are not presented. As a result of this (and of rounding), the PCSA expenditure totals displayed here may not sum to the displayed overall total.
• Spatial Analysis: The Development of PCSAs for the State of Vermont (February 2013) 40
A second spider diagram, Figure 7c, also was developed to visually present data on mental health expenditures for the Montpelier PCSA and its expenditure flows. The data for this map are presented in Table 4b. As with total spending, most of the $19.9 million in mental health expenditures by Montpelier PCSA members remained within the Montpelier PCSA (i.e., $12.9 million or 64.7 percent). Another $1.6 million (8.2 percent) flowed to the Waterbury PCSA (claims for this study pre-date Tropical Storm Irene and the destruction of the Vermont State Hospital in Waterbury), and $1.4 million (7.3 percent) flowed to the Burlington PCSA. The remainder of the Montpelier mental health spending was scattered throughout the state. Table 4b. Expenditure Flows from Montpelier to Other PCSAs, Mental Health Only* (Members, 0–64 Years; 2010
VHCURES Medicaid and Commercial)
PCSA Name Mental Health Expenditures from Montpelier PCSA % Montpelier Expenditures
Montpelier $12.9 64.7%
Waterbury $1.6 8.2%
Burlington $1.5 7.3%
Brattleboro $0.8 4.1%
Williston $0.8 3.8%
Lebanon/Hanover, NH $0.4 2.0%
Bradford $0.3 1.5%
Morrisville $0.3 1.4%
Randolph $0.3 1.3%
South Burlington $0.3 1.3%
Essex Junction $0.2 0.9%
Rutland $0.1 0.5%
Hardwick $0.1 0.5%
Total $19.9 100.0%
* PCSAs with <$100,000 in Montpelier member mental health expenditures are not presented. As a result (and due to rounding), expenditures may not sum to displayed total.
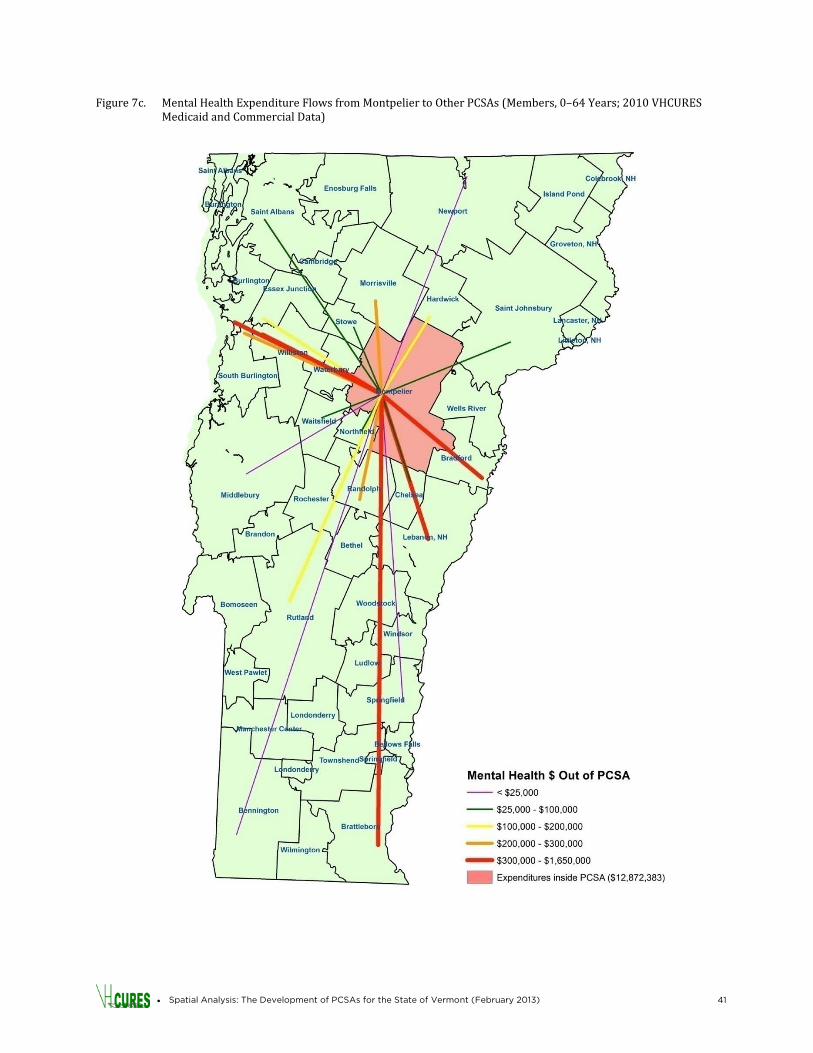
• Spatial Analysis: The Development of PCSAs for the State of Vermont (February 2013) 41
Figure 7c. Mental Health Expenditure Flows from Montpelier to Other PCSAs (Members, 0–64 Years; 2010 VHCURES Medicaid and Commercial Data)
• Spatial Analysis: The Development of PCSAs for the State of Vermont (February 2013) 42
DISCUSSION
Health reform efforts nationwide and in Vermont are emphasizing the importance of receiving care in the primary care setting. This study provides new information about where Vermont’s primary care providers are located and where Vermonters with commercial insurance and Medicaid coverage appear to be travelling to access primary care. As the State moves forward with its health care reform initiatives, the study provides a potential approach to support the analysis of primary care resources and access, utilization and expenditures, and needs. An updated and more comprehensive analytical framework could help the State to develop programs to organize and improve the primary care network and address gaps in coverage. This study identifies 44 PCSAs for Vermont using 2010 VHCURES data, which was enhanced with improved provider location information incorporating data from other provider data sources and GIS expertise with in-depth knowledge of Vermont. The methods used (e.g., plurality of member preference fractions) were taken from Dartmouth Institute methods used for national PCSA definitions based primarily on the Medicare population. This study has the advantage of access to commercial and Medicaid data for Vermont and includes information on children and a larger proportion of the Vermont population (about 75 percent). However, future inclusion of Medicare data and possibly data for uninsured Vermonters and those with military coverage are needed to develop a complete picture of primary care for the Vermont population. This study begins to explore other key issues around variation in access and utilization, including the per capita population per primary care provider in the PCSAs and claims expenditure flows. A sensitivity analysis was performed on the preference fraction method. The Dartmouth PCSA preference methodology is used to define PCSAs, effectively giving each individual one vote toward the PCSA assignment. Another method that was explored, but is not presented here, is to calculate preference based on visit counts (i.e., each visit gets one vote). If the PCSAs are developed that way, they would reflect the actual visits. Although the PCSAs would be weighted toward the patterns of high users, it could be argued that such weighting is indeed warranted since high users are more active in and connected to the health care system. The analysis was done both ways as a test, and though some ZIP codes changed PCSAs, the results were not substantially different. The reasearch team for this study in consulation with the Health Analysis Areas Work Group chose to use the preference fraction method because it was consistent with the Dartmouth Institute method used for the national PCSAs. An additional set of analyses might reveal preference fractions based on dividing member assignments by their category (i.e., Medicaid vs. commercial). Such an analysis might identify other interesting relationships regarding where members seek primary care. There are some limitations and cautions related to the 44 PCSAs defined for this study. In some cases, particularly in the rural, unpopulated areas, the preference for the PCSA was low, which means that many of the people assigned to that PCSA received primary care elsewhere. This should be taken into consideration when conducting geographic analyses on cost and utilization by PCSA and formulating conclusions about the providers in the PCSA. Also, some of the PCSAs have small populations (i.e., fewer than 10,000 people). It will be important to keep in mind that studies of subpopulations or of rare conditions by PCSA may be difficult due to small numbers.
• Spatial Analysis: The Development of PCSAs for the State of Vermont (February 2013) 43
There are a few other limitations to this study. Medicare data for 2010 were not available at the time of the study, so the population older than 65 years, which has the greatest utilization of health care, was not accounted for in the PCSAs. As with the Dartmouth Institute’s national PCSA project, members without a primary care visit were not included in this analysis. Certain age groups (e.g., adolescents and young adults) may be underrepresented in the analysis since they often have lower rates of primary care access during a single year. Additionally, health care providers and health care data are dynamic, and the current situation in 2013 regarding the number of providers in the PCSA could look different than 2010. Ideally, a methodology would be set up to regularly extract and query the VHCURES data and automate a reconcilation with other trusted provider data sources to reevaluate the PCSAs.
• Spatial Analysis: The Development of PCSAs for the State of Vermont (February 2013) 44
APPENDIX A – E&M VISIT CODES IDENTIFYING PRIMARY CARE VISITS
As noted earlier, this study identified primary care visits on medical claims using the following evaluation and management (E&M) codes:
• Evaluation and Management – Office or Other Outpatient Services
- New patient: 99201–99205
- Established patient: 99211–99215
• Consultations – Office or Other Outpatient Consultations
- New or established patient: 99241–99245
• Nursing Facility Services
- E & M new/established patient: 99304–99306
- Subsequent nursing facility care: 99307–99310
• Domiciliary, Rest Home (e.g., Boarding Home), or Custodial Care Service
- Domiciliary or rest home visit new patient: 99324–99328
- Domiciliary or rest home visit established patient: 99334–99337
• Home Services
- New patient: 99341–99345
- Established patient: 99347–99350
• Prolonged Services – Prolonged Physician Service with Direct (Face-to-Face) Patient Contact
- 99354 and 99355
• Prolonged Services – Prolonged Physician Service without Direct (Face-to-Face) Patient Contact
- 99358 and 99359
• Preventive Medicine Services
- New patient: 99381–99387
- Established patient: 99391–99397
• Counseling Risk Factor Reduction and Behavior Change Intervention
- New or established patient preventive medicine, individual counseling: 99401–99404
- New or established patient behavior change interventions, individual: 99406–99409
- New or established patient preventive medicine, group counseling: 99411–99412
• Other Preventive Medicine Services
- Administration and interpretation: 99420
- Unlisted preventive: 99429
• Spatial Analysis: The Development of PCSAs for the State of Vermont (February 2013) 45
• Newborn Care Services
- Initial and subsequent care for evaluation and management of normal newborn infant: 99460–99463
- Attendance at delivery (when requested by the delivering physician) and initial stabilization of newborn: 99464
- Delivery/birthing room resuscitation: 99465
• Federally Qualified Health Center (FQHC) – Global Visit (billed as a revenue code on an institutional claim form)
- Clinic visit by member to RHC/FQHC: 0521
- Home visit by RHC/FQHC practitioner: 0522
- Nursing home visit by RHC/FQHC practitioner: 0525
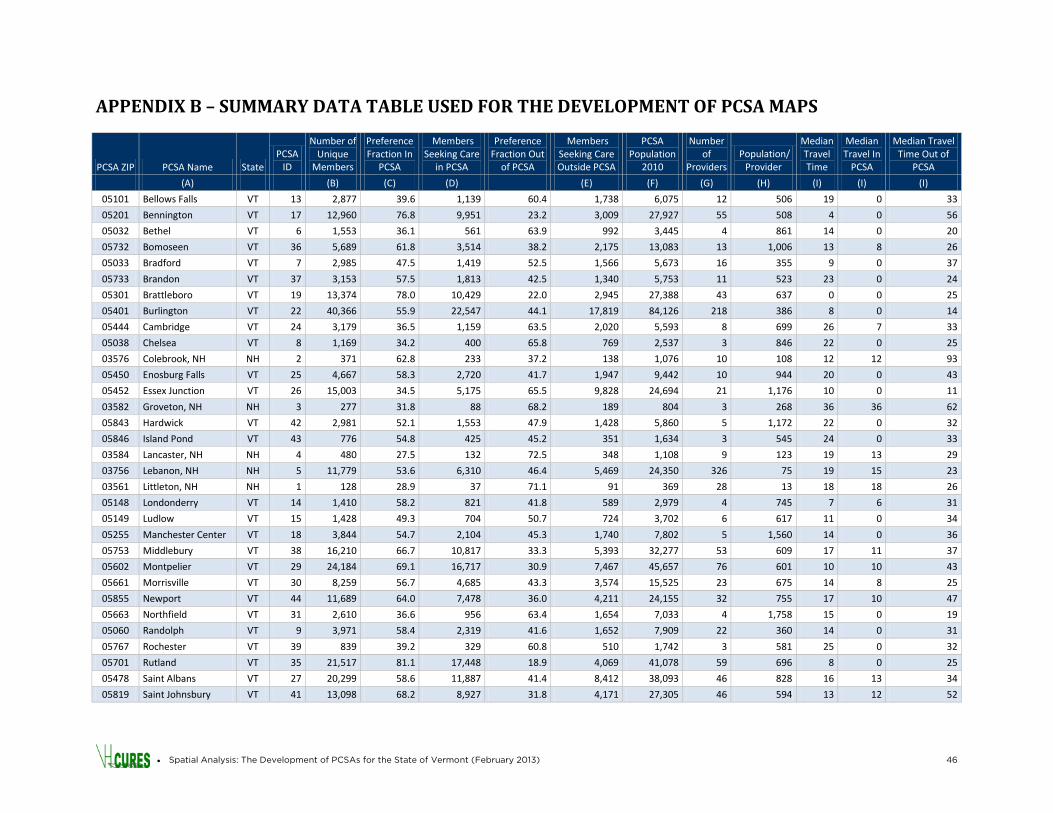
• Spatial Analysis: The Development of PCSAs for the State of Vermont (February 2013) 46
APPENDIX B – SUMMARY DATA TABLE USED FOR THE DEVELOPMENT OF PCSA MAPS
PCSA ZIP PCSA Name State PCSA
ID
Number of Unique
Members
Preference Fraction In
PCSA
Members Seeking Care
in PCSA
Preference Fraction Out
of PCSA
Members Seeking Care Outside PCSA
PCSA Population
2010
Number of
Providers Population/
Provider
Median Travel Time
Median Travel In
PCSA
Median Travel Time Out of
PCSA
(A) (B) (C) (D) (E) (F) (G) (H) (I) (I) (I)
05101 Bellows Falls VT 13 2,877 39.6 1,139 60.4 1,738 6,075 12 506 19 0 33
05201 Bennington VT 17 12,960 76.8 9,951 23.2 3,009 27,927 55 508 4 0 56
05032 Bethel VT 6 1,553 36.1 561 63.9 992 3,445 4 861 14 0 20
05732 Bomoseen VT 36 5,689 61.8 3,514 38.2 2,175 13,083 13 1,006 13 8 26
05033 Bradford VT 7 2,985 47.5 1,419 52.5 1,566 5,673 16 355 9 0 37
05733 Brandon VT 37 3,153 57.5 1,813 42.5 1,340 5,753 11 523 23 0 24
05301 Brattleboro VT 19 13,374 78.0 10,429 22.0 2,945 27,388 43 637 0 0 25
05401 Burlington VT 22 40,366 55.9 22,547 44.1 17,819 84,126 218 386 8 0 14
05444 Cambridge VT 24 3,179 36.5 1,159 63.5 2,020 5,593 8 699 26 7 33
05038 Chelsea VT 8 1,169 34.2 400 65.8 769 2,537 3 846 22 0 25
03576 Colebrook, NH NH 2 371 62.8 233 37.2 138 1,076 10 108 12 12 93
05450 Enosburg Falls VT 25 4,667 58.3 2,720 41.7 1,947 9,442 10 944 20 0 43
05452 Essex Junction VT 26 15,003 34.5 5,175 65.5 9,828 24,694 21 1,176 10 0 11
03582 Groveton, NH NH 3 277 31.8 88 68.2 189 804 3 268 36 36 62
05843 Hardwick VT 42 2,981 52.1 1,553 47.9 1,428 5,860 5 1,172 22 0 32
05846 Island Pond VT 43 776 54.8 425 45.2 351 1,634 3 545 24 0 33
03584 Lancaster, NH NH 4 480 27.5 132 72.5 348 1,108 9 123 19 13 29
03756 Lebanon, NH NH 5 11,779 53.6 6,310 46.4 5,469 24,350 326 75 19 15 23
03561 Littleton, NH NH 1 128 28.9 37 71.1 91 369 28 13 18 18 26
05148 Londonderry VT 14 1,410 58.2 821 41.8 589 2,979 4 745 7 6 31
05149 Ludlow VT 15 1,428 49.3 704 50.7 724 3,702 6 617 11 0 34
05255 Manchester Center VT 18 3,844 54.7 2,104 45.3 1,740 7,802 5 1,560 14 0 36
05753 Middlebury VT 38 16,210 66.7 10,817 33.3 5,393 32,277 53 609 17 11 37
05602 Montpelier VT 29 24,184 69.1 16,717 30.9 7,467 45,657 76 601 10 10 43
05661 Morrisville VT 30 8,259 56.7 4,685 43.3 3,574 15,525 23 675 14 8 25
05855 Newport VT 44 11,689 64.0 7,478 36.0 4,211 24,155 32 755 17 10 47
05663 Northfield VT 31 2,610 36.6 956 63.4 1,654 7,033 4 1,758 15 0 19
05060 Randolph VT 9 3,971 58.4 2,319 41.6 1,652 7,909 22 360 14 0 31
05767 Rochester VT 39 839 39.2 329 60.8 510 1,742 3 581 25 0 32
05701 Rutland VT 35 21,517 81.1 17,448 18.9 4,069 41,078 59 696 8 0 25
05478 Saint Albans VT 27 20,299 58.6 11,887 41.4 8,412 38,093 46 828 16 13 34
05819 Saint Johnsbury VT 41 13,098 68.2 8,927 31.8 4,171 27,305 46 594 13 12 52
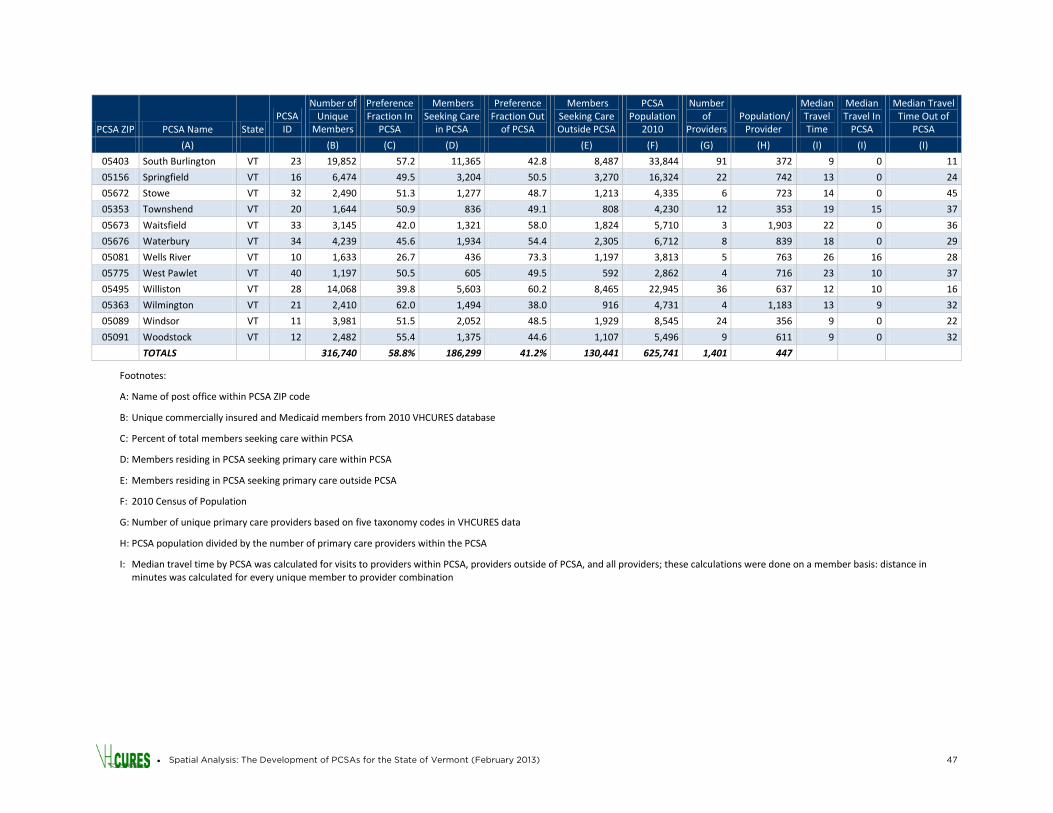
• Spatial Analysis: The Development of PCSAs for the State of Vermont (February 2013) 47
PCSA ZIP PCSA Name State PCSA
ID
Number of Unique
Members
Preference Fraction In
PCSA
Members Seeking Care
in PCSA
Preference Fraction Out
of PCSA
Members Seeking Care Outside PCSA
PCSA Population
2010
Number of
Providers Population/
Provider
Median Travel Time
Median Travel In
PCSA
Median Travel Time Out of
PCSA
(A) (B) (C) (D) (E) (F) (G) (H) (I) (I) (I)
05403 South Burlington VT 23 19,852 57.2 11,365 42.8 8,487 33,844 91 372 9 0 11
05156 Springfield VT 16 6,474 49.5 3,204 50.5 3,270 16,324 22 742 13 0 24
05672 Stowe VT 32 2,490 51.3 1,277 48.7 1,213 4,335 6 723 14 0 45
05353 Townshend VT 20 1,644 50.9 836 49.1 808 4,230 12 353 19 15 37
05673 Waitsfield VT 33 3,145 42.0 1,321 58.0 1,824 5,710 3 1,903 22 0 36
05676 Waterbury VT 34 4,239 45.6 1,934 54.4 2,305 6,712 8 839 18 0 29
05081 Wells River VT 10 1,633 26.7 436 73.3 1,197 3,813 5 763 26 16 28
05775 West Pawlet VT 40 1,197 50.5 605 49.5 592 2,862 4 716 23 10 37
05495 Williston VT 28 14,068 39.8 5,603 60.2 8,465 22,945 36 637 12 10 16
05363 Wilmington VT 21 2,410 62.0 1,494 38.0 916 4,731 4 1,183 13 9 32
05089 Windsor VT 11 3,981 51.5 2,052 48.5 1,929 8,545 24 356 9 0 22
05091 Woodstock VT 12 2,482 55.4 1,375 44.6 1,107 5,496 9 611 9 0 32
TOTALS
316,740 58.8% 186,299 41.2% 130,441 625,741 1,401 447
Footnotes:
A: Name of post office within PCSA ZIP code
B: Unique commercially insured and Medicaid members from 2010 VHCURES database
C: Percent of total members seeking care within PCSA
D: Members residing in PCSA seeking primary care within PCSA
E: Members residing in PCSA seeking primary care outside PCSA
F: 2010 Census of Population
G: Number of unique primary care providers based on five taxonomy codes in VHCURES data
H: PCSA population divided by the number of primary care providers within the PCSA
I: Median travel time by PCSA was calculated for visits to providers within PCSA, providers outside of PCSA, and all providers; these calculations were done on a member basis: distance in minutes was calculated for every unique member to provider combination