spand: shared passive network performance discovery...collected network characteristics are valid....
TRANSCRIPT

The following paper was originally published in theProceedings of the USENIX Symposium on Internet Technologies and Systems
Monterey, California, December 1997
For more information about USENIX Association contact:
1. Phone: 510 528-86492. FAX: 510 548-57383. Email: [email protected]. WWW URL: http://www.usenix.org/
SPAND: Shared Passive Network Performance Discovery
Srinivasan SeshanIBM T.J. Watson Research Center
Mark Stemm, Randy H. KatzUniversity of California at Berkeley
SPAND: Shared Passive Network Performance Discovery
Srinivasan [email protected]
Mark Stemm, Randy H. Katz{stemm,randy}@cs.berkeley.edu
IBM T.J. Watson Research CenterYorktown Heights, NY 10598
Computer Science DivisionUniversity of California at Berkeley
Berkeley, CA 94720
Abstract
In the Internet today, users and applications must oftenmake decisions based on the performance they expect toreceive from other Internet hosts. For example, userscan often view many Web pages in low-bandwidth orhigh-bandwidth versions, while other pages presentusers with long lists of mirror sites to chose from. Cur-rent techniques to perform these decisions are often adhoc or poorly designed. The most common solutionused today is to require the user to manually make deci-sions based on their own experience and whatever infor-mation is provided by the application. Previous effortsto automate this decision-making process have relied onisolated, active network probes from a host. Unfortu-nately, this method of making measurements has severalproblems. Active probing introduces unnecessary net-work traffic that can quickly become a significant part ofthe total traffic handled by busy Web servers. Probingfrom a single host results in less accurate informationand more redundant network probes than a system thatshares information with nearby hosts. In this paper, wepropose a system called SPAND (SharedPassiveNet-work PerformanceDiscovery) that determines networkcharacteristics by makingshared, passive measurementsfrom a collection of hosts. In this paper, we show whyusing passive measurements from a collection of hostshas advantages over using active measurements from asingle host. We also show that sharing measurementscan significantly increase the accuracy and timeliness ofpredictions. In addition, we present a initial prototypedesign of SPAND, the current implementation status ofour system, and initial performance results that show thepotential benefits of SPAND.
1. Introduction
In today’s Internet, it is impossible to determine inadvance what the network performance (e.g., availablebandwidth, latency, and packet loss probability)
between a pair of Internet hosts will be. This capabilityis missing in today’s suite of Internet services, and manyapplications could benefit from such a service:
• Applications that are presented with a choice ofhosts that replicate the same service. Specific exam-ples of this are FTP and Web mirror sites and Har-vest caches that contact the “closest” peer cache.Today, these applications rely on statistics such ashop count/routing metrics [9], round-trip latency [7],or geographic location [10]. However, each of thesetechniques has significant weaknesses, as we showin Section 2.
• Web clients that have a choice of contentfidelity todownload from a Web server, e.g., a full graphicsrepresentation for high-bandwidth connectivity or atext-only representation for low-bandwidth connec-tivity. Today, the user must manually select the fidel-ity of the content that they wish to view, sometimesmaking overaggressive decisions such as viewing noimages at all.
• Applications that provide feedback to the user thatindicates the expected performance to a distant site.For example, Web browsers could insert an informa-tive icon next to a hyperlink indicating the expectedavailable bandwidth to the remote site referred to bythe hyperlink.
Each of these applications needs the ability to determinein advance the expected network performance between apair of Internet hosts. Previous work in this area hasrelied onisolated, activenetwork probing from a singlehost to determine network performance characteristics.There are two major problems with this approach:
• Active probing requires the introduction of unneces-sary traffic into the network. Clearly, an approachthat determines the same information with a mini-mum of unnecessary traffic is more desirable. Wealso show later that this unnecessary traffic canquickly grow to become a non-negligible part of the

traffic reaching busy Web servers, reducing their effi-ciency and sometimes their scalability.
• Probing from a single host prevents a client fromusing the past information of nearby clients to pre-dict future performance. Recent studies [2][20] haveshown that network performance from a client to aserver is often stable for many minutes and very sim-ilar to the performance observed by other nearby cli-ents, so there are potential benefits of sharinginformation between hosts. In Section 3.2, we showexamples where using shared rather than isolatedinformation increases the likelihood that previouslycollected network characteristics are valid.
We are developing a system called SPAND (SharedPas-siveNetwork PerformanceDiscovery) that overcomesthe above problems of isolated active probing by col-lecting network performance informationpassively froma collection of hosts,caching it for some time andshar-ing this information between them. This allows a groupof hosts to obtain timely and accurate network perfor-mance information in a manner that does not introduceunnecessary network traffic.
The rest of this paper is organized as follows. InSection 2, we describe related work in more detail. InSection 3, we point out the advantages and challenges ofusing passive shared measurements over isolated activemeasurements. In Section 4, we present a detaileddesign of SPAND. In Section 5, we describe the imple-mentation status of SPAND and initial performanceresults, and in Section 6, we conclude and describefuture work.
2. Related Work
In this section, we describe in more detail previous workin network probing algorithms and server selection sys-tems.
2.1 Probing Algorithms
A common technique to estimate expected performanceis to test the network by introducing probe packets. Theobjective of these probes is to measure the round triplatency, peak bandwidth or available “fair-share” band-width along the path from one host to another
Probes to measure round-trip latency and peak band-width are typically done by sending groups of back-to-back packets to a server which echoes them back to thesender. These probes are referred to as NetDyn probes in[4], packet pair in [13], and bprobes in [6]. As pointedout in earlier work on TCP dynamics [12], the spacingbetween these packets at the bottleneck link is preservedon higher-bandwidth links and can be measured at the
sender.
If the routers in the network do not implement fair queu-ing, the minimum of many such measurements is likelyto be close to the raw link bandwidth, as assumed inother work ([4][6][19]). Pathchar [19] combines thistechnique with traceroute[22] to measure the link band-width and latency of each hop along the path from oneInternet host to another. Packet Bunch Mode (PBM)[20] extends this technique by analyzing various sizedgroups of packets inserted into the network back-to-back. This allows PBM to handle multi-channel links(i.e. ISDN connections, muiti-link Point-to-Point Proto-col (PPP) links, etc.) as well as improve the accuracy ofthe resulting measurements.
If routers in the network implement fair queuing, thenthe bandwidth indicated by the back-to-back packetprobes is an accurate estimate of the “fair share” of thebottleneck link’s bandwidth [13]. Another fair sharebandwidth estimator, cprobe [6], sends a short sequenceof echo packets from one host to another as a simulatedconnection (without minimal flow control and no con-gestion control). By assuming that “almost-fair” queu-ing occurs over the short sequence of packets, cprobeprovides an estimate for the available bandwidth alongthe path from one host to another. Combined with infor-mation from bprobes, cprobes can estimate the compet-ing traffic along the bottleneck link. However, it isunclear how often this “almost-fair” assumption is cor-rect and how accurate the resulting measurements are.TReno [15] also uses ICMP echo packets as a simulatedconnection, but uses flow control and congestion controlalgorithms equivalent to that used by TCP.
The problem with these methods is that they can intro-duce significant amounts of traffic that is not useful toany application. For example, pathchar sends at leasttens of kilobytes of probe traffic per hop, and a cprobesends 6 kilobytes of traffic per probe. This amount ofprobe traffic is a significant fraction (approximately20%) of the mean transfer size for many Web connec-tions ([1], [2]) as well as a significant fraction of themean transfer size for many Web sessions. We discuss inmore detail the l imitations of active probing inSection 3.3.
2.2 Server Selection Systems
Many server selection systems use network probingalgorithms to identify the closest or best connectedserver. For example, Carter et al. at Boston University[5] use cprobes and bprobes to classify the connectivityof a group of candidate mirror sites. Harvest [7] usesround-trip latency to identify the best peer cache fromwhich to retrieve a Web page. Requests are initiated to
each peer cache, and the first to begin responding with apositive answer is selected and the other connections areclosed. Other proposals [10] rely on geographic locationfor selecting the best cache location when push-cachingWeb documents.
There are also preliminary designs for network-basedservices to aid in server selection. IPV6’s Anycast[11][18] service provides a mechanism that directs a cli-ent’s packets to any one of a number of hosts that repre-sent the same IP addresses. This service uses routingmetrics as the criteria for server selection. The HostProximity Service (HOPS) [9] uses routing metrics suchas hop counts to select the closest one of a number ofcandidate mirror sites.
Cisco’s DistributedDirector [8] product relies on mea-surements from Director Response Protocol (DRP)servers to perform efficient wide area server selection.The DRP servers collect Border Gateway Protocol(BGP) and Interior Gateway Protocol (IGP) routingtable metrics between distributed servers and clients.When a client connects to a server, DistributedDirectorcontacts the DRP server for each replica site to retrieve
the information about the distance between the replicasite and the client.
The problem with many of these approaches is that one-way latency, geographic location, and hop count areoften poor estimates of actual completion time. Otherwork [5][17] shows that hop count is poorly correlatedwith available bandwidth, and one-way latency does nottake available bandwidth into account at all. Even thosesystems that provide better performance metrics [5] relyon each end host independently measuring network per-formance.
Another design choice to consider is where the systemmust be deployed. A system that is deployed only at theendpoints of the network is easier to maintain anddeploy than a system that must be deployed inside theinternal infrastructure, and a system that is deployedonly at the client side is easier to deploy than a systemthat relies on client and server side components.
Table 1 summarizes the previous work in this area. Thesignificant shortcomings of existing network perfor-mance discovery and server selection systems are:
System
What measured/used to identifyperformance
Additional trafficintroduced Notes
WhereDeployed
Bprobes, Cprobes Peak and AvailableBottleneck Bandwidth
Significant (~10K) Cprobes uses no flow/congestion control
Client Side
Packet Pair Available Bandwidth Little (~1K) Assumes per-flowfair queuing
Client Side
Pathchar Hop-by-hop linkbandwidth, latency
Significant (>10K) No congestion con-trol
Client Side
Packet BunchModes
Peak BottleneckBandwidth
Significant (~10K) Client Side
Treno Available Bandwidth Significant (>10K) Uses TCP Flow/Con-gestion Control
Client Side
IPV6 Anycast Routing Metric Little (routing data andqueries)
Internal Network
Harvest Latency Little (~1K) Server Side
HOPS Routing Metric Little (routing data andqueries)
Internal Network
DistributedDirector Routing Metric Little (routing data andremote queries)
Server Side andInternal Network
SPAND
AvailableBandwidth,Packet LossProbability
Little (local reportsand queries) Client Side
TABLE 1. Summary of Previous Work compared to SPAND
• Introduction of new traffic into the network that canquickly become significant when compared to “use-ful” traffic.
• Reliance on measurements from a single host, whichare more often redundant and inaccurate than mea-surements from a collection of hosts.
• Use of metrics such as hop count, latency, and geo-graphic location as imprecise estimates of availablebandwidth.
We discuss these shortcomings further in the next sec-tion.
3. Passive and Cooperative Measurements
The goal of our work is to provide a unified repositoryof actual end-to-end performance information for appli-cations to consult when they wish to determine the net-work performance to distant Internet hosts. Ourapproach addresses the shortcomings of previous workin 2 ways: (1) relying solely on passive rather thanactive measurements of the network, and (2) sharingmeasurement information between all hosts in a localnetwork region. In this section we show the potentialbenefits and challenges of using shared, passive mea-surements to predict network performance instead ofusing isolated, active measurements.
3.1 Network Performance Stability
In order for past transfers observed by hosts in a regionto accurately predict future performance, the networkperformance between hosts must remain relatively sta-ble for periods of time on the order of minutes. Withoutthis predictability, it would be impossible for sharedpassive measurements of the network to be meaningful.Past work has shown evidence that this is true for someInternet hosts [2][20]. We wanted to verify these resultsin a different scenario.
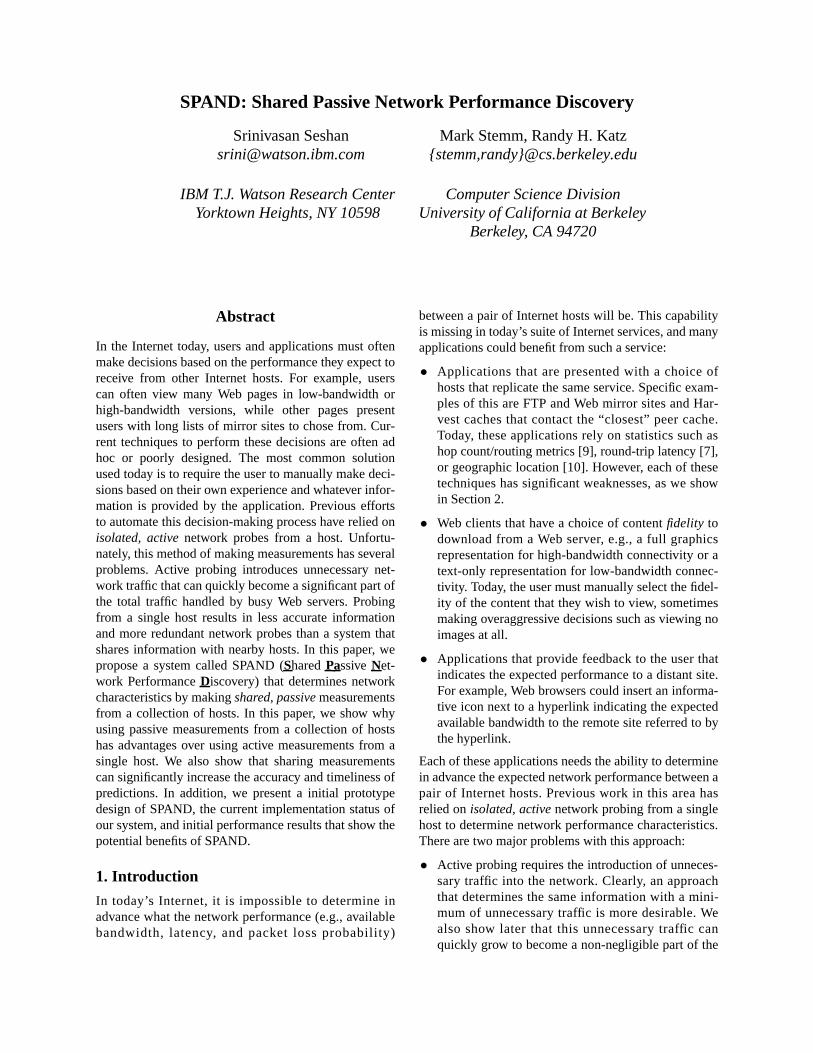
To understand more closely the dynamics of networkcharacteristics to a distant host, we performed a con-trolled set of network measurements. This consisted ofrepeated HTTP transfers between UC Berkeley andIBM Watson. For a 5 hour daytime period (from 9amPDT to 2pm PDT), a Web client at UC Berkeley period-ically downloaded an image object from a Web serverrunning at IBM Watson. Although this measurement isclearly not representative of the variety of connectivityand access patterns that exist between Internet hosts, itallowed us to focus on the short-term changes in net-work characteristics that could occur between a pair ofwell-connected Internet hosts separated by a large num-ber of Internet hops.
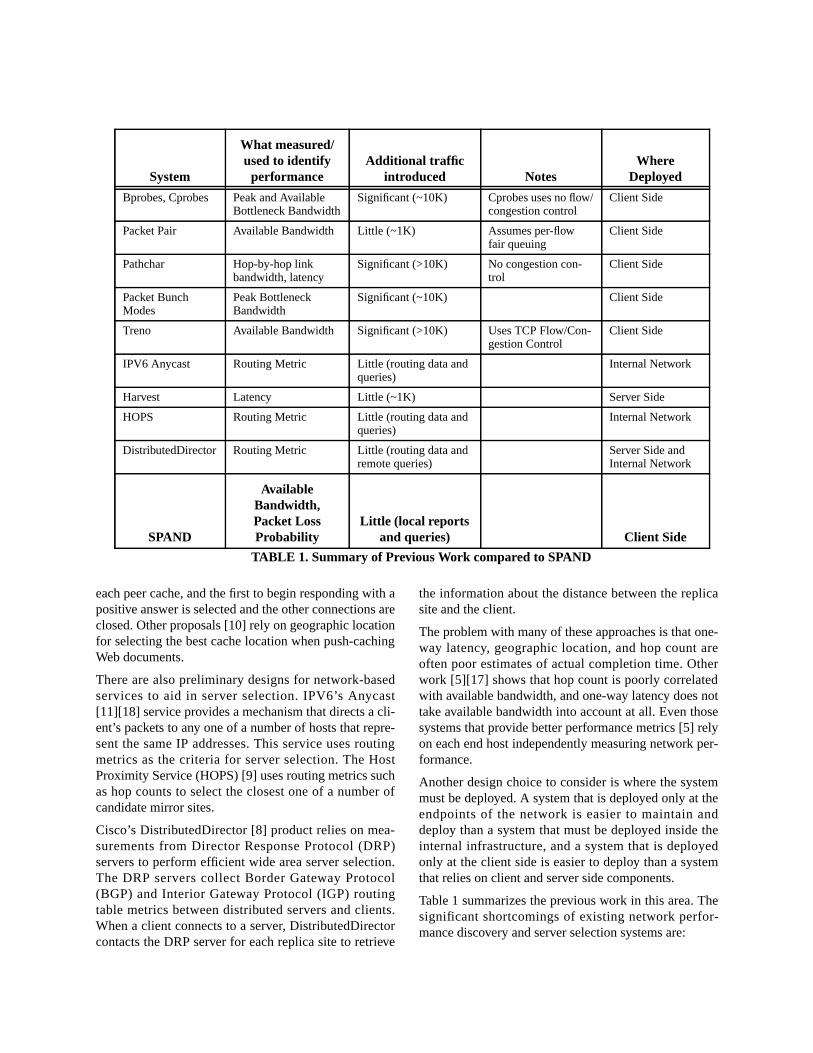
Figure 1 shows the raw throughput measurements as afunction of time over the 5 hour period. We see that inthe first 30 minutes of the trace, one group of measure-ments is clustered around 350 kilobits/sec (presumablythe available bandwidth on the path between UC Berke-ley and IBM). A smaller group of measurements haslower throughputs, at 200 kilobits/sec and lower. Thissecond group of connections presumably experiencesone or more packet losses. This clustering is moreclearly shown in Figure 2, the cumulative distributionfunction (CDF) of throughputs during the first 30 min-utes of the trace. As the day progresses, two thingschange. The available bandwidth decreases as the dayprogresses, and a larger fraction of transfers experienceone or more packet losses. This effect is shown inFigure 3, the cumulative distribution function ofthroughputs for the entire 5 hour period. More samplesare clustered around lower throughput values and thereis more variation in the available bandwidth. However,there is still a noticeable separation between the twogroups of throughput measurements.
0
50
100
150
200
250
300
350
400
450
0 2 4 6 8 10 12 14 16 18 20
GGGG
G
GG
GG
GGG
G
G
G
G
G
G
G
G
G
G
G
GG
G
GG
GGG
G
G
GG
G
G
G
GGGGGGGGGG
G
G
G
G
G
GG
G
G
GG
G
G
G
GGGG
G
G
G
G
GG
GGG
G
G
G
G
G
GG
G
G
GG
G
GG
G
G
G
G
G
G
G
G
G
GG
GG
GGG
G
G
G
G
GGGGGGG
G
G
G
G
GGG
G
GGGGG
G
G
G
G
G
G
GGGGG
G
G
G
G
G
GGGG
G
G
G
G
G
GGGG
GG
G
G
G
G
G
G
GG
GG
G
GG
G
GGGG
G
G
G
GG
G
G
GGGGGG
G
G
G
G
G
G
G
G
GG
G
G
GGGGG
G
GG
G
G
G
G
G
G
G
G
G
G
G
G
G
G
G
G
G
G
G
GG
G
G
GG
GG
G
G
GG
G
G
GG
G
G
G
G
G
G
G
G
GG
G
GG
G
G
G
GG
GG
GGGGGG
GG
G
G
G
G
GGG
GGG
G
G
G
G
G
G
G
G
GG
GG
G
G
G
G
G
G
G
G
G
G
G
G
G
G
G
G
G
G
G
G
G
G
G
G
G
G
G
G
G
G
GGG
GG
G
G
GG
GG
G
G
GG
G
G
G
G
G
G
G
G
G
G
G
G
G
G
G
G
GG
G
G
G
G
G
GG
G
G
G
G
G
G
G
G
GG
G
G
GGG
G
G
G
G
G
G
G
G
G
G
G
G
GG
GG
G
G
G
G
G
G
G
G
G
G
G
G
G
G
G
G
G
G
G
G
G
G
G
GG
G
G
G
G
GG
G
G
G
G
G
G
G
G
G
G
GG
G
G
G
G
G
G
G
G
G
GG
G
GGG
G
G
G
GGGG
GGG
G
GG
G
GG
G
GG
G
G
G
G
GG
G
GG
G
G
G
G
GGGGGG
G
G
G
G
GG
G
G
G
G
G
G
G
G
G
G
G
G
GG
G
G
G
GGGG
G
G
G
G
G
G
G
G
G
G
G
G
G
G
G
G
G
G
G
G
G
G
G
G
G
GG
G
G
G
G
GG
G
G
G
G
G
G
G
G
G
GG
G
G
G
GG
G
G
G
GGGG
G
G
GG
G
G
G
G
G
G
G
G
G
G
G
G
G
G
G
G
G
G
G
G
G
G
GG
GG
G
GG
G
G
G
G
G
G
G
G
G
G
G
G
GG
G
G
GG
G
G
GG
G
G
G
G
G
G
G
G
GG
G
G
GG
G
G
G
G
G
G
G
G
G
G
G
G
GG
G
G
G
GG
G
G
GG
G
G
G
G
G
G
G
G
G
G
G
G
G
GG
GG
G
G
G
G
G
G
G
G
G
G
G
G
G
G
G
G
GG
G
G
G
G
G
G
G
G
GGG
G
G
G
G
G
G
G
G
GG
G
G
G
G
G
G
GG
G
GG
G
G
G
G
G
G
G
G
G
G
GG
G
GGG
G
G
G
G
G
G
G
G
G
G
G
GG
G
G
G
G
G
G
G
GG
GG
G
G
G
GG
G
GG
G
G
G
G
GG
G
G
G
G
G
G
G
GG
G
GG
G
G
G
G
G
G
G
GG
G
G
G
G
G
G
G
G
GG
G
G
G
G
G
G
G
G
GG
G
G
G
GGG
G
G
G
G
G
G
G
G
G
GG
G
G
G
G
G
GG
G
G
G
G
G
G
G
G
G
G
G
G
G
G
G
G
G
G
G
G
G
G
G
G
G
G
G
G
GG
G
G
G
G
G
G
G
G
G
G
G
G
G
G
G
G
G
G
G
GG
GG
G
G
G
G
G
G
G
G
G
G
G
G
G
G
GG
G
G
G
G
G
G
G
G
G
G
G
G
G
G
G
G
G
G
G
G
G
G
G
G
G
G
G
G
G
G
G
G
G
G
G
G
G
G
G
G
G
G
G
G
G
G
G
G
G
G
G
G
G
G
G
G
G
G
G
GG
G
G
G
G
G
G
G
G
G
GG
G
G
G
G
G
G
G
G
G
G
G
G
GG
G
GG
G
G
G
G
G
G
GG
G
G
G
G
G
G
G
GG
G
G
G
G
G
G
G
G
G
G
G
G
G
G
GG
G
G
G
G
G
G
G
G
G
G
G
G
G
G
G
G
G
G
G
G
GG
G
G
G
G
G
G
G
G
G
G
G
G
G
G
G
G
G
G
G
G
G
GG
G
G
G
G
G
G
GG
G
G
GG
G
G
G
G
G
G
G
G
G
G
G
G
G
G
GGGG
G
G
G
G
G
G
G
G
G
GG
G
G
G
G
G
G
G
G
G
G
G
G
G
G
G
G
G
G
G
G
G
G
G
G
G
G
G
G
G
G
G
GG
G
GG
G
G
G
G
G
G
G
G
G
G
G
GG
G
G
G
G
G
GG
GG
G
G
GG
G
GG
G
G
G
G
G
G
G
G
G
G
G
G
G
G
G
G
G
G
G
G
G
G
G
G
G
G
G
G
G
G
G
G
G
G
G
G
G
G
G
G
G
G
G
G
G
G
G
G
G
G
G
GG
G
G
G
G
GG
G
G
G
G
G
G
G
GG
G
G
GG
G
G
G
G
G
GG
G
G
G
G
G
G
G
G
G
G
G
G
G
G
G
G
GGGGG
G
G
G
G
GG
G
GG
G
GG
G
G
G
G
G
G
G
G
GG
G
G
G
G
G
G
G
G
G
G
GG
G
G
G
GG
G
G
G
G
GG
G
G
G
G
G
G
G
G
G
G
G
G
G
G
G
G
G
G
G
G
G
G
G
G
G
G
G
G
G
G
G
G
G
G
G
GG
GG
G
G
G
G
G
G
G
G
GGG
G
G
G
G
G
G
G
G
G
G
GG
G
G
G
G
GG
G
G
G
G
G
G
G
G
G
G
G
G
GG
G
G
G
Elapsed Time (Thousands of Seconds)Thr
ough
put (
kilo
bits
/sec
)
Figure 1. Throughput from UC Berkeley to IBMduring a 5 hour daytime period
Throughput (kilobits/sec)
Cum
ulat
ive
Pro
babi
lity
Figure 2. CDF of throughput from UC Berkeley toIBM: initial 30 minutes
00.10.20.30.40.50.60.70.80.9
1
0 50 100 150 200 250 300 350 400 450

This distribution of performance suggests that althoughthe distribution of throughputs changes as the dayprogresses, a system like SPAND could still providemeaningful performance predictions. Although the per-formance distribution of the early part of the day and thelater part of the day are quite different, they each havelifetimes of tens of minutes or more. Even when aggre-gating all the different performance measurements forthe entire 5 hour period, approximately 65% of thethroughput samples are within a factor of 2 of themedian throughput.
3.2 Shared Measurements: Benefits and Challenges
Using shared rather than isolated measurements allowsus to eliminate redundant network probes. If two hostsare nearby each other in terms of network topology, it islikely that they share the same bottleneck link to aremote site. As a result, the available bandwidth theymeasure to this site is likely to be very similar [2].Therefore, it is unnecessary and undesirable for each ofthese hosts to independently probe to find this informa-tion--they can learn from each other.
To quantify how often this information can be sharedbetween nearby hosts, we examined Internet usage pat-terns by analyzing client-side Web traces. From thesetraces, we determined how often a client would need toprobe the network to determine the network perfor-mance to a particular Web server when shared informa-tion was and was not available.
More formally, for a single Web server, we can representthe list of arrival times from a single client (or a sharedcollection of clients) as a sequence (t1, t2,..., tn). If thedifference between ti+1 and ti is extremely small (lessthan ten seconds), we merge the events together into asingle Web browsing “session.” Clearly, the first arrivalalways requires a probe of the network. In addition, if
we assume that the time between significant networkchanges is a fixed value∆, then if ti+1-ti>∆, then the cli-ent must make a probe to determine the new networkcharacteristics. If ti+1-ti<∆, then no probe is necessary.As mentioned previously [2][20], an appropriate valuefor ∆ is on the order of tens of minutes.
Figure 4 shows the results of this analysis for a particu-lar client-side trace consisting of 404780 connectionsfrom approximately 600 users over an 80 hour timeperiod [23]. The x-axis represents the time∆ betweennetwork changes, and the y-axis represents the fractionof network probes that are necessary. There are twocurves in the figure. The upper curve represents thenumber of probes that are necessary if no sharingbetween clients is performed, and the lower curve repre-sents the number of probes that are necessary if clientsshare information between them. The upper curvebegins at∆=3D10 seconds because of the “sessionizing” ofindividual connections described above. We see that thenumber of probes that are necessary when clients sharenetwork information is dramatically reduced. This isevidence that a collection of hosts can eliminate manyredundant network probes by sharing information.
The use of shared measurements is not without chal-lenges, however. Measurements from arbitrary hosts in aregion cannot be combined. For example, it is necessaryto separate modem users within a local domain fromLAN users in the same domain, because the two sets ofusers may not share the same bottleneck link. Similarly,hosts in a local domain may use different TCP imple-mentations that result in widely varying performance.The challenge is that it is often difficult to determinewho the set of “similarly connected” hosts within anlocal domain are. We can use the topology of the localdomain along with post-processing on past measure-
0
0.1
0.2
0.3
0.4
0.5
0.6
0.7
0.8
0.9
1
0 50 100 150 200 250 300 350 400 450
Throughput (kilobits/sec)
Cum
ulat
ive
Pro
babi
lity
Figure 3. CDF of throughput from UC Berkeleyto IBM: full 5 hour period
Time between network changes
Fra
ctio
n of
pro
bes
nece
ssar
y
Without Sharing
WithSharing
Figure 4. The benefit of sharing. Figure shows thefraction of network probes that are necessary as a
function of the time between network state changes
0
0.1
0.2
0.3
0.4
0.5
0.6
0.7
0.8
0.9
1
1 10 100 1000 10000 100000
ments to determine which network subnets exhibit sig-nificantly different performance. The system can thencoalesce these subnets together into classes of equiva-lent connectivity and avoid aggregating measurementsfrom dissimilar hosts.
3.3 Passive Measurements: Benefits and Challenges
The use of passive measurements avoids the introduc-tion of useless probe traffic into the network. Thisadvantage over active probing systems comes at theexpense of making the job of measuring available band-width more difficult. However, this advantage is criticalsince probe traffic can sometimes become a measurablefraction of the traffic handled by busy Web servers. Forexample, consider the scenario of mirror sites that repli-cate the same content. In an active probing system, a cli-ent must first contact each of the mirror sites todetermine which mirror is the “best.” This slows downservers with probe-only traffic and limits the scalabilityof such a system.
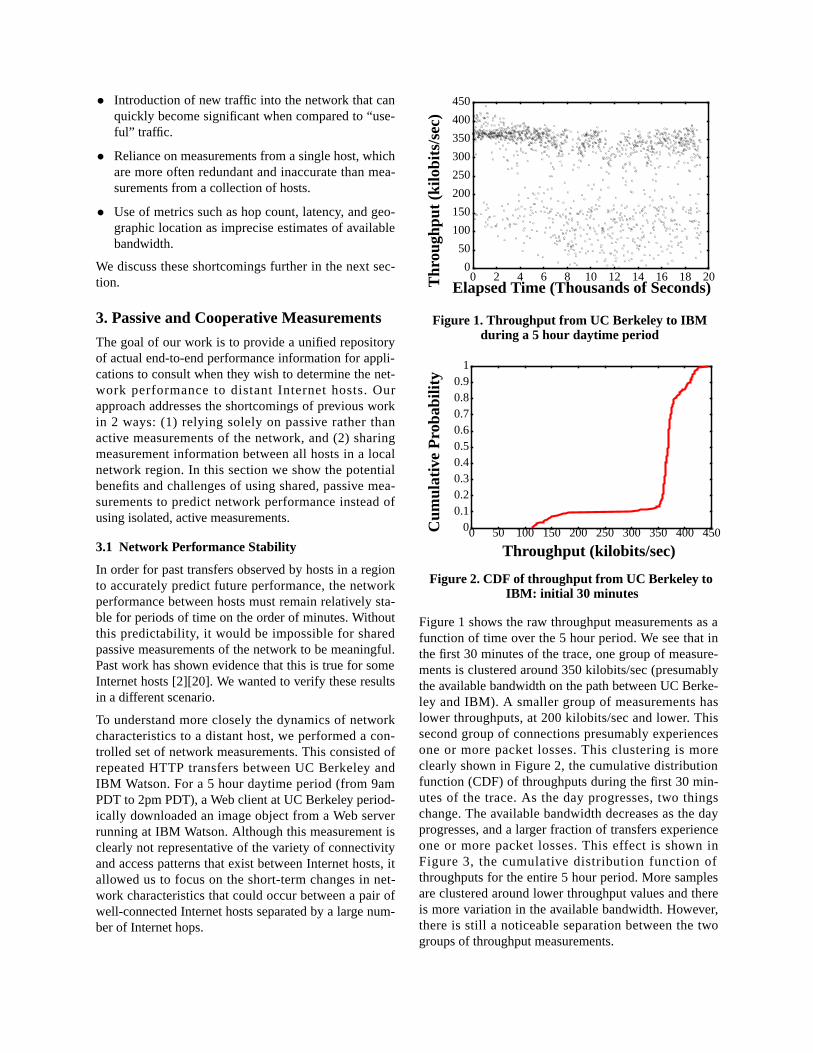
The following thought experiment shows why. Considera Web server with a variable number of mirror sites.Assume that each mirror site is connected to the Internetvia a 45 Mbit/second T3 link and assume that the meantransfer size is 100 kbytes and the mean probe size is 6kbytes. These are optimistic estimates; most Web trans-fers are shorter than 100 kbytes and many of the net-work probing algorithms discussed in Section 2.1introduce more than 6 kbytes. From a network perspec-tive, an estimate of the number of requests per secondthat the collection of mirrors can support is the aggre-gate bandwidth of the mirrors’ Internet links divided bythe sum of the average Web transfer size and any associ-ated probe traffic for the transfer. Figure 5 shows the
number of requests per second that such a system cansupport as a function of the number of mirror sites fortwo systems: one without probe traffic, and one withprobe traffic. We see that the system without probe traf-fic scales perfectly with the number of mirrors. For thesystem with probe traffic, however, for each Webrequest that is handled by a single mirror, a networkprobe must be sent to all of the other mirrors. On theserver side, this means that for each Web request a par-ticular mirror site handles, it must also handle a proberequest from clients being serviced at every other mirrorlocation. As the number of mirrors increases, the num-ber of requests served per second becomes limited bythe additional probe traffic.
There are challenges in using passive network measure-ments, however. Using passive rather than active mea-surements is difficult for several reasons:
• Passive measurements are uncontrolled experiments,and it can be difficult to separate network eventsfrom those occurring at the endpoints, such as a rate-limited transmission or a slow or unreachable server.
• Passive measurements are only collected when ahost contacts a remote site. In order to have timelymeasurements, hosts in a local domain must visitdistant hosts often enough to obtain timely informa-tion. If this is not true, the client may obtain eitherout-of-date information or no information at all.
For our purposes, there is no need to distinguishbetween network events and endpoint events. If aremote site is unreachable or has poor connectivitybecause it is down or overloaded, that information is justas useful. It is important to distinguish between rate-controlled and bulk transfer connections so the perfor-mance numbers from one are not used to estimate per-formance for the other. We can distinguish between rate-controlled and bulk transfer transmissions by using TCPand UDP port numbers and the application classesdescribed in Section 4.
To identify if passive measurements can provide timelyinformation, we must analyze typical Internet usage pat-terns and determine how often passive techniques leadto out-of-date information. We can use the results shownin Figure 4 to see this. We can model the arrival patternof clients as a sequence of times (t1...tn) as before. In thepassive case, when ti+1-ti>∆, instead of saying that anactive probe is necessary, we say that the passively col-lected information has become out of date. So the frac-tion of time that an active probe is necessary is exactlythe same as the fraction of time that passive measure-ments become out of date. As mentioned earlier, theappropriate value for∆ is on the order of tens of min-
0
100
200
300
400
500
600
700
800
900
0 2 4 6 8 10 12 14 16
With probe traffic
Without probe traffic
Number of mirror sites
Req
uest
s ha
ndle
d pe
r se
cond
Figure 5. The effect of probe traffic on scalability.Figure shows requests/second that mirrors can serve
as a function of the number of mirror sites
utes. We see that even a relatively small collection ofhosts can obtain timely network information when shar-ing information between them. If we assume that net-work conditions change approximately every 15minutes, then the passive measurements collected fromthis relatively small collection of 600 hosts will be accu-rate approximately 78% of the time. For larger collec-t ions o f hosts (such as domain-wide pass ivemeasurements), the availability of timely informationwill be even greater, as shown in Section 5.3.
4. Design of the SPAND System
In this section, we describe the design for SPAND,including steps for incremental deployment in existingnetworks.
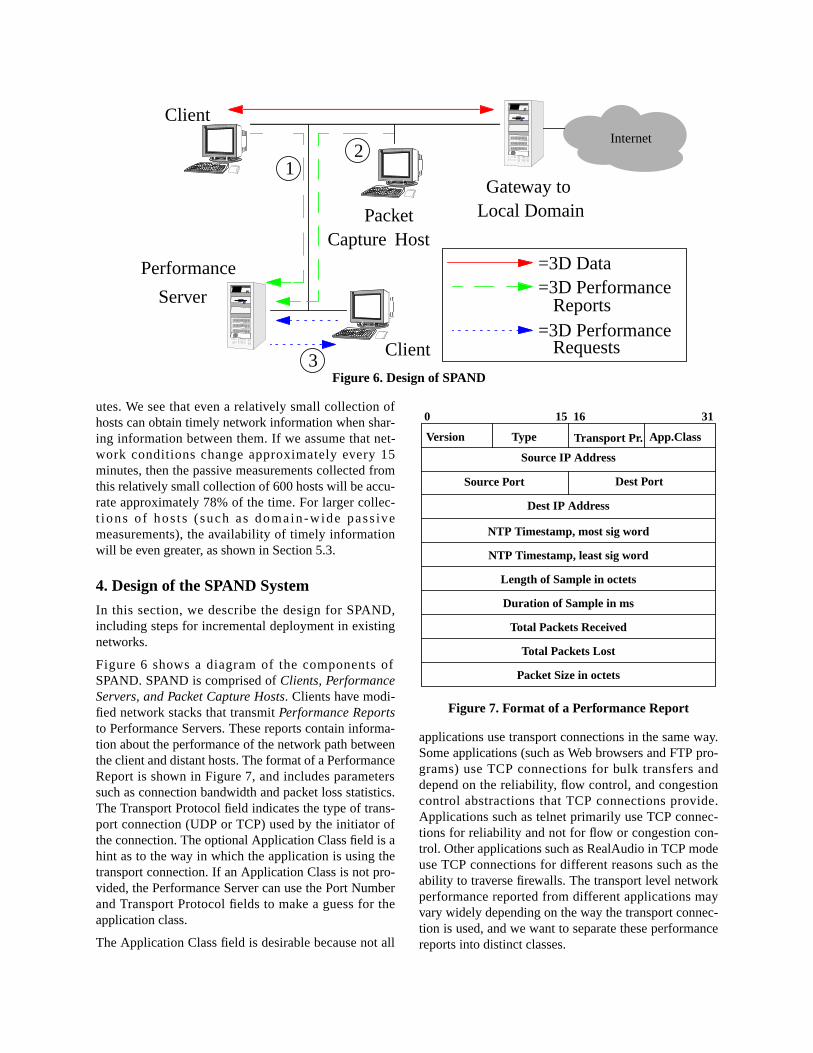
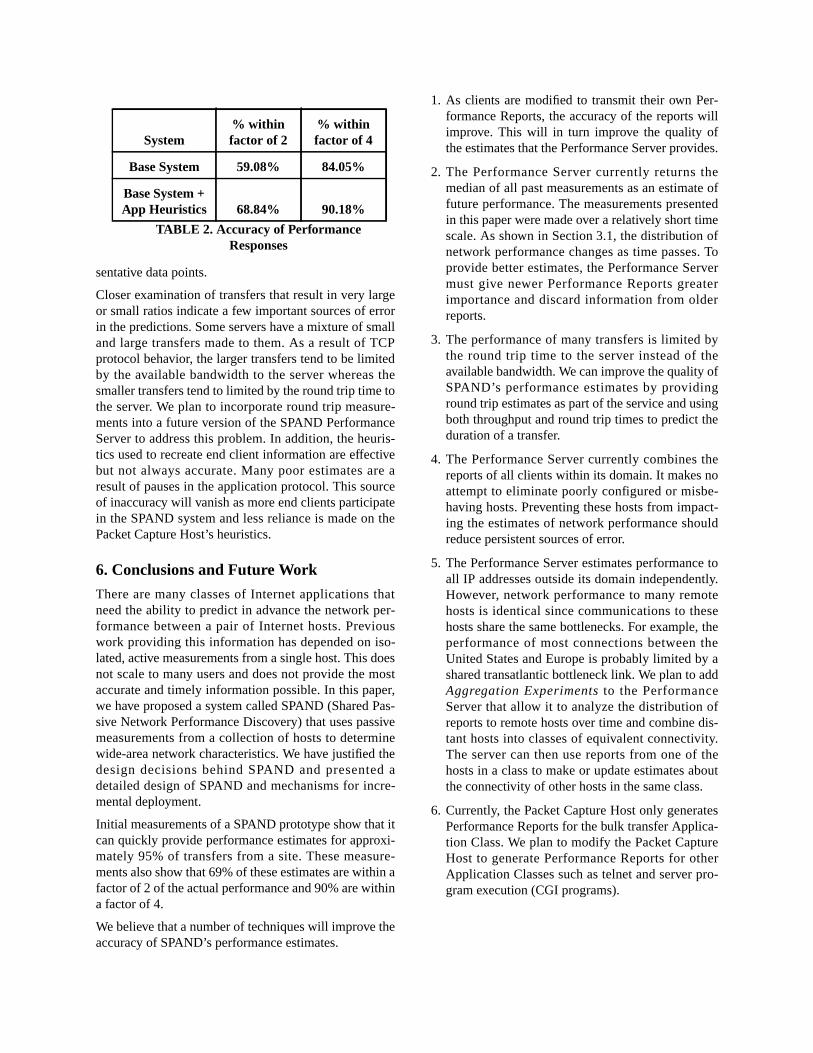
Figure 6 shows a diagram of the components ofSPAND. SPAND is comprised ofClients, PerformanceServers, and Packet Capture Hosts. Clients have modi-fied network stacks that transmitPerformance Reportsto Performance Servers. These reports contain informa-tion about the performance of the network path betweenthe client and distant hosts. The format of a PerformanceReport is shown in Figure 7, and includes parameterssuch as connection bandwidth and packet loss statistics.The Transport Protocol field indicates the type of trans-port connection (UDP or TCP) used by the initiator ofthe connection. The optional Application Class field is ahint as to the way in which the application is using thetransport connection. If an Application Class is not pro-vided, the Performance Server can use the Port Numberand Transport Protocol fields to make a guess for theapplication class.
The Application Class field is desirable because not all
applications use transport connections in the same way.Some applications (such as Web browsers and FTP pro-grams) use TCP connections for bulk transfers anddepend on the reliability, flow control, and congestioncontrol abstractions that TCP connections provide.Applications such as telnet primarily use TCP connec-tions for reliability and not for flow or congestion con-trol. Other applications such as RealAudio in TCP modeuse TCP connections for different reasons such as theability to traverse firewalls. The transport level networkperformance reported from different applications mayvary widely depending on the way the transport connec-tion is used, and we want to separate these performancereports into distinct classes.
ClientInternet
Performance
Client
Gateway toLocal Domain
=3D Data=3D Performance
=3D PerformanceReports
Capture HostPacket
Server
Figure 6. Design of SPAND
Requests
12
3
0 3115 16
Version Type Transport Pr.
Source IP Address
Source Port Dest Port
App.Class
NTP Timestamp, most sig word
NTP Timestamp, least sig word
Length of Sample in octets
Duration of Sample in ms
Total Packets Received
Total Packets Lost
Packet Size in octets
Figure 7. Format of a Performance Report
Dest IP Address

In addition, many applications may intermittentlychange the way in which a connection is used. Forexample, a passive FTP connection may switch fromtransporting control information to transferring bulkdata. Similarly, a persistent HTTP 1.1 connection mayhave idle “think” periods where the user is looking at aWeb page as well as bulk transfer periods. To properlyaccount for all these variations, we need applications totake part in the performance reporting process. Our tool-kit provides an API which enables applications to start ameasurement period on a connection as well as end themeasurement and automatically send a report to thelocal Performance Server.
A Performance Server receives reports from all clientsin a local area and must incorporate them into its perfor-mance estimates. The server maintains different esti-mates for different classes of applications as well asdifferent classes of connectivity within its domain. Inaddition, the Performance Server can also identifyreports that have possibly inaccurate information anddiscard them. Clients may later query the information inthe server by sending it a Performance Request contain-ing an (Address, Application Class) pair. The serverresponds to it by returning a Performance Response forthat pair, if one exists. This response includes the Per-formance Server’s estimates of available bandwidth andpacket loss probability from the local domain to thespecified foreign host. The request and response formatsare shown in Figures 8 and 9.
4.1 Mechanisms for Incremental Deployment
The system described in the previous section is an idealendpoint we would like to reach. In practice, it may bedifficult to immediately modify all client applications to
generate performance reports, especially since many cli-ents may need modifications to their protocol stacks tomake the statistics necessary for SPAND available. Toquickly capture performance from a large number of endclients, a Packet Capture Host can be deployed that usesa tool such as BPF [16] to observe all transfers to andfrom the clients. The Packet Capture Host determinesthe network performance from its observations andsends reports to the Performance Server on behalf of theclients. This allows a large number of PerformanceReports to be collected while end clients are slowlyupgraded. The weakness of this approach is that a num-ber of heuristics must be employed to recreate applica-tion-level information that is available at the end client.Section 5.2 describes these heuristics in more detail.
4.2 Example Scenario
This example scenario using Figure 6 illustrates the wayin which the agents that make up SPAND coordinate.Assume that a user is browsing the Web. As the user isbrowsing, the user’s application generates PerformanceReports and sends them to the local Performance Server(1 in the figure). Also, a Packet Capture Host deployedat the gateway from the local domain to the Internet gen-erates Performance Reports on behalf of the hosts in thedomain (2 in the figure). Later, some other user reachesa page where she must select between mirror locations.The Web browser makes a Performance Query to thelocal Performance Server and gets a response (3 in thefigure). The Web browser uses the PerformanceResponse to automatically contact the mirror site withthe best connectivity.
5. Implementation Status and Performance
In this section, we describe the current implementationstatus of SPAND and present initial performance mea-surements from a working SPAND prototype.
5.1 Implementation Details
SPAND is organized as a C++ toolkit that providesobject abstractions for the agents described above.Application writers can create objects for agents such asPerformanceReporter(), PerformanceReportee(), Perfor-manceRequestor(), and PerformanceRequestee() anduse these objects to make, send or receive reports, ormake queries about network performance. We also havepartial implementations of the toolkit in Java and Perl.
Using the SPAND toolkit, we have implemented thePacket Capture Host, Performance Server and a simpletext-based SPAND Client. We have also written severalclient applications that use the SPAND toolkit to makeuse of Performance Reports. We have written a HTTP
Figure 8. Format of a Performance Request
0 3115 16App. ClassVersion Type Protocol
Request IP Address
Figure 9. Format of a Performance Response
0 3115 16App. Class
Expected Available Bandwidth (kbits/sec)
Std Dev of Available Bandwidth (kbits/sec)
Expected Packet Loss Probability
Std Dev of Expected Loss Probability
Version Type Protocol
Response IP Address

proxy using the Perl libwww [14] library and theSPAND toolkit that modifies HTML pages to includeinformative icons that indicate the network performanceto a distant site mentioned in a hyperlink. This is not thefirst application of this type; others have been developedat IBM [3] and at Boston University [5]. However, ourapplication uses actual observed network performancefrom local hosts to make decisions about the icon toinsert in the HTML page.
We have also written a Java-based application thatallows the user to obtain an overview of the connectivityfrom a local domain to distant hosts. This applicationshows the number of performance reports collected forall hosts as well as the details about the reported net-work statistics for a given host. This tool was used togenerate the graphs in Section 3.1.
5.2 Packet Capture Host Policies
Because our Packet Capture Host is not located at endclients, it does not have perfect information about theway in which applications use TCP connections. Thiscan lead to inaccurate measurements of network charac-teristics such as bandwidth. For example, if a Webbrowser uses persistent or keep-alive connections tomake many HTTP requests over a single TCP connec-tion, then simply measuring the observed bandwidthover the TCP connection will include the gaps betweenHTTP requests in the total time of the connection, lead-ing to a reduction in reported bandwidth. To account forthis effect, we modified the Packet Capture Host to useheuristics to detect these idle periods in connections.When the Packet Capture Host detects an idle period, itmakes two reports: one for the part of the connectionbefore the idle period, and another for the part of theconnection after the idle period. The ratio measurementsin Section 5.3 include systems with and without the useof these heuristics. Another example is when CommonGateway Interface (CGI) programs are executed as partof HTTP requests. The idle time when the server is exe-cuting the CGI program leads to an artificially lowreported bandwidth and does not reflect the performanceof other HTTP requests to the same server. Ideally, thePacket Capture Host would treat these connections as adifferent Application class. For the purposes of thesemeasurements, however, the Packet Capture Hostexcluded the idle periods and generated multiple Perfor-mance Reports as above.
5.3 Performance
There are several important metrics by which we canmeasure the performance of the SPAND system:
1. How long does it take before the system can ser-vice the bulk of Performance Requests?
2. In the steady-state, what percentage of Perfor-mance Requests does the system service?
3. How accurate are the performance predictions?
To test the performance of our system, we deployed aPacket Capture Host at the connection between IBMResearch and its Internet service provider. Hosts withinIBM communicate with the Internet through the use of aSOCKSv4 firewall [21]. This firewall forces all internalhosts to use TCP and to initiate transfers (i.e. servers cannot be inside the firewall). The packet capture host mon-itored all traffic between the SOCKS firewall at IBMResearch and servers outside IBM’s internal domain.The measurements we present here are from a 3 hourlong weekday period. During this period, 62,781 perfor-mance reports were generated by the packet capture hostfor 3,008 external hosts. At the end of this period, thePerformance Server maintained a database of approxi-mately 60 megabytes of Performance Reports. Figure 10shows the cumulative number of reports generated andhosts reported about as a function of time.We see thatabout 10 reports are generated per second, which resultsin a network overhead of approximately 5 kilobits persecond. We also see that while initially a large numberof reports are about a relatively small number of hosts(the upward curve and leveling off of the curve), as timeprogresses, a significant number of new hosts arereported about as time progresses. This indicates that the“working set” of hosts includes a set of hosts who arereported about a small number of times. This finding isreinforced in Figure 11, which shows a histogram of thenumber of reports received for each host over the trace.We see that a large majority of hosts receive only a few
0
10
20
30
40
50
60
70
0 1 2 3 4 5 6 7 8 9 100
5
10
15
20
25
30
35
Elapsed Time (Thousands ofSeconds)
Hundreds of H
osts
Tho
usan
ds o
f Rep
orts
Hosts
Reports
Figure 10. Cumulative number of reports generatedand hosts reported about as a function of time

reports, while a small fraction of hosts receive most ofthe reports. The mean number of reports received perhost was 23.67 and the median number of reportsreceived per host was 7.
To test the accuracy of the system, we had to generate asequence of Performance Reports and PerformanceRequests to test the system. Since there are no applica-tions running at IBM that currently use the SPAND sys-tem, we assumed that each client host would make asingle Performance Request to the Performance Serverfor a distant host before connecting to that host, and asingle Performance Report to the Performance Serverafter completing a connection. In actual practice, appli-cations using SPAND would probably request the per-formance for many hosts and then make a connection toonly one of them. The performance of the SPAND sys-tem on this workload is summarized in Figures 12 and13.
When a Performance Server is first started, it has noinformation about prior network performance and can-not respond to many of the requests made to it. As theserver begins to receive performance reports, it is able torespond to a greater percentage of requests. Determiningthe exact “warmup” time before the Performance Servercan service most requests is important. Figure 12 showsthe probability that a Performance Request can be ser-viced by the Performance Server as a function of thenumber of reports since the “cold start” time. We saythat a request can be serviced if there is at least one pre-viously collected Performance Report for that host inthe Performance Server’s database. As we can see fromthe graph, the Performance Server is able to service 70%of the requests within the first 300 reports (less than 1minute), and the Performance Server reaches a steady-state service rate of 95% at around 10,000 reports(approximately 20 minutes). This indicates that when a
Performance Server is first brought up, there is enoughlocality in client access patterns that it can quickly ser-vice the bulk of the Performance Requests sent to it.
To measure the accuracy of Performance Responses, foreach connection we computed the ratio of the through-put returned by the Performance Server for that connec-tion’s host with the throughput actually reported by thePacket Capture Host for that connection. Figure 13 plotsthe cumulative distribution function of these ratios. Thex axis is plotted on a log scale to equally show ratiosthat are less than and greater than one. Table 2 shows theprobability that a Performance Response is within a fac-tor of 2 and 4 of the actual observed throughput. We seethat Performance Responses are often close to the actualobserved throughput. Obviously, different applicationswill have different requirements as to the error that theycan tolerate. Factors of 2 and 4 are shown only as repre-
02468
101214161820
1 10 102 103 104
Host Number
Fre
quen
cy (
Hun
dred
sof
Rep
orts
)
Figure 11. Histogram of number of PerformanceReports received per host. The x axis is on a log scale.
0
0.2
0.4
0.6
0.8
1
0 5 10 15 20Performance Reports (Thousands)
Pro
b. P
erf R
eque
st C
an b
eS
ervi
ced
Figure 12. Probability that a Performance Requestcan be Serviced as a function of the number of
Performance Reports.
0
0.2
0.4
0.6
0.8
1
1/64 1/4 1 4 16 64
Without App
With App Heuristics
Heuristics
Ratio of Expected to Actual Throughput
Cum
ulat
ive
Pro
babi
lity
Figure 13. CDF of ratio of expected throughput(as generated by the Performance Server) to
actual throughput (as reported by the client). Thex axis is on a log scale
1/16
sentative data points.
Closer examination of transfers that result in very largeor small ratios indicate a few important sources of errorin the predictions. Some servers have a mixture of smalland large transfers made to them. As a result of TCPprotocol behavior, the larger transfers tend to be limitedby the available bandwidth to the server whereas thesmaller transfers tend to limited by the round trip time tothe server. We plan to incorporate round trip measure-ments into a future version of the SPAND PerformanceServer to address this problem. In addition, the heuris-tics used to recreate end client information are effectivebut not always accurate. Many poor estimates are aresult of pauses in the application protocol. This sourceof inaccuracy will vanish as more end clients participatein the SPAND system and less reliance is made on thePacket Capture Host’s heuristics.
6. Conclusions and Future Work
There are many classes of Internet applications thatneed the ability to predict in advance the network per-formance between a pair of Internet hosts. Previouswork providing this information has depended on iso-lated, active measurements from a single host. This doesnot scale to many users and does not provide the mostaccurate and timely information possible. In this paper,we have proposed a system called SPAND (Shared Pas-sive Network Performance Discovery) that uses passivemeasurements from a collection of hosts to determinewide-area network characteristics. We have justified thedesign decisions behind SPAND and presented adetailed design of SPAND and mechanisms for incre-mental deployment.
Initial measurements of a SPAND prototype show that itcan quickly provide performance estimates for approxi-mately 95% of transfers from a site. These measure-ments also show that 69% of these estimates are within afactor of 2 of the actual performance and 90% are withina factor of 4.
We believe that a number of techniques will improve theaccuracy of SPAND’s performance estimates.
1. As clients are modified to transmit their own Per-formance Reports, the accuracy of the reports willimprove. This will in turn improve the quality ofthe estimates that the Performance Server provides.
2. The Performance Server currently returns themedian of all past measurements as an estimate offuture performance. The measurements presentedin this paper were made over a relatively short timescale. As shown in Section 3.1, the distribution ofnetwork performance changes as time passes. Toprovide better estimates, the Performance Servermust give newer Performance Reports greaterimportance and discard information from olderreports.
3. The performance of many transfers is limited bythe round trip time to the server instead of theavailable bandwidth. We can improve the quality ofSPAND’s performance estimates by providinground trip estimates as part of the service and usingboth throughput and round trip times to predict theduration of a transfer.
4. The Performance Server currently combines thereports of all clients within its domain. It makes noattempt to eliminate poorly configured or misbe-having hosts. Preventing these hosts from impact-ing the estimates of network performance shouldreduce persistent sources of error.
5. The Performance Server estimates performance toall IP addresses outside its domain independently.However, network performance to many remotehosts is identical since communications to thesehosts share the same bottlenecks. For example, theperformance of most connections between theUnited States and Europe is probably limited by ashared transatlantic bottleneck link. We plan to addAggregation Experiments to the PerformanceServer that allow it to analyze the distribution ofreports to remote hosts over time and combine dis-tant hosts into classes of equivalent connectivity.The server can then use reports from one of thehosts in a class to make or update estimates aboutthe connectivity of other hosts in the same class.
6. Currently, the Packet Capture Host only generatesPerformance Reports for the bulk transfer Applica-tion Class. We plan to modify the Packet CaptureHost to generate Performance Reports for otherApplication Classes such as telnet and server pro-gram execution (CGI programs).
System% withinfactor of 2
% withinfactor of 4
Base System 59.08% 84.05%
Base System +App Heuristics 68.84% 90.18%
TABLE 2. Accuracy of PerformanceResponses

7. Acknowledgments
Thanks to Vincent Cina and Nick Trio for providing theaccess necessary to install SPAND at IBM. Hari Bal-akrishnan, Steve Gribble, Todd Hodes, and VenkataPadmanabhan provided many useful comments on ear-lier versions of this paper that helped improve the pre-sentation. This work is supported by DARPA contractDAAB07-95-C-D154 and grants from the CaliforniaMICRO Program, Hughes Aircraft Corporation,Ericcson, and IBM. Mark is supported by an IBM fel-lowship.
8. References
[1] M Arlitt and C. L. Williamson. Web ServerWorkload Characterization: The Search for In-variants. InProc. ACM SIGMETRICS ’96, May1996.
[2] H. Balakrishnan, S. Seshan, M. Stemm, and R.H.Katz. Analyzing Stability in Wide-Area NetworkPerformance. InProc. ACM SIGMETRICS ’97,June 1997.
[3] R. Barrett, P. Maglio, and D. Kellem. How toPersonalize the Web. InProc. CHI ’97, 1997.
[4] J.C Bolot. End-to-End Packet Delay and Loss Be-havior in the Internet. InProc. ACM SIGCOMM’93, San Francisco, CA, Sept 1993.
[5] R. L. Carter and M. E. Crovella. Dynamic serverselection using bandwidth probing in wide-areanetworks. Technical Report BU-CS-96-007,Computer Science Department, Boston Universi-ty, March 1996.
[6] R. L. Carter and M. E. Crovella. Measuring bot-tleneck-link speed in packet switched networks.Technical Report BU-CS-96-006, Computer Sci-ence Department, Boston University, March1996.
[7] A. Chankhunthod, P. Danzig, C. Neerdaels, M.F.Schwartz, and K.J. Worrell. A Hierarchical Inter-net Object Cache. InProceedings 1996 USENIXSymposium, San Diego, CA, Jan 1996.
[8] Cisco Distributed Director Web Page. http://www.cisco.com/warp/public/751/distdir/in-dex.html, 1997.
[9] P. Francis. http://www.ingrid.org/hops/wp.html,1997.
[10] J. Gwertzman and M. Seltzer. The Case for Geo-graphical Push-Caching. InProc. Fifth IEEEWorkshop on Hot Topics in Operating Systems,May 1995.
[11] R. Hinden and S. Deering.IP Version 6 Address-ing Architecture. RFC, Dec 1995. RFC-1884.
[12] V. Jacobson. Congestion Avoidance and Control.In Proc. ACM SIGCOMM 88, August 1988.
[13] S. Keshav. Packet-Pair Flow Control.IEEE/ACMTransactions on Networking, February 1995.
[14] libwww-perl-5 home page. http://www.linpro.bo/lwp, 1997.
[15] M. Mathis and J. Mahdavi. Diagnosing InternetCongestion with a Transport Layer PerformanceTool . InProc. INET ’96, Montreal, Canada, June1996.
[16] S. McCanne and V. Jacobson. The BSD PacketFilter: A New Architecture for User-Level PacketCapture. InProc. Winter ’93 USENIX Confer-ence, San Diego, CA, January 1993.
[17] J. C. Mogul. Network Behavior of a Busy WebServer and its Clients. Technical Report 95/5,Digital Western Research Lab, October 1995.
[18] C. Partridge, T. Mendez, and W. Milliken.HostAnycasting Service. RFC, Nov 1993. RFC-1546.
[19] pathchar – A Tool to Infer Characteristics of In-ternet Paths. ftp://ee.lbl.gov/pathchar, 1997.
[20] V. Paxson.Measurements and Analysis of End-to-End Internet Dynamics. PhD thesis, U. C. Ber-keley, May 1996.
[21] Socks Home Page. http://www.socks.nec.com,1997.
[22] W. R. Stevens.TCP/IP Illustrated, Volume 1.Addison-Wesley, Reading, MA, Nov 1994.
[23] UC Berkeley Annex WWW Traces. http://www.cs.berkeley.edu/ gribble/traces/index.html,1997.