spad - nose cone design
TRANSCRIPT


i Contract No: N68335-05-C-0422 Contractor: KaZaK Composites, Inc Address: 10 F Gill Street, Woburn, MA 01801 Expiration Date of SBIR Data Rights: Jan 30, 2014 The Government’s rights to use, modify, reproduce, release, perform, display, or disclose technical data or computer software marked
with this legend are restricted during the period shown as provided in paragraph (b)(4) of the Rights in Noncommercial Technical Data
and Computer Software—Small Business Innovation Research (SBIR) Program clause contained in the above identified contract. No
restrictions apply after the expiration shown above. Any reproduction of technical data, computer software, or portions thereof marked
with this legend must also reproduce the markings.
Abstract
The Sonobuoy Precision Aerial Drop (SPAD) vehicle developed by KaZaK Composites,
launched from an aircraft will pilot a sensor package to the ocean surface. This project evaluates
a spring-loaded, an inflatable, a rubber, and a foam nose-cone concept for SPAD. Results from
aerodynamic analysis of the nose cone are used in structural analysis performed with
ANSYS. Fabrication and experimentation with selected concepts supports the analysis. The
rubber nose concept conforms with the requirements for structural integrity, weight,
functionality, and cost.

KaZaK Composites SBIR Data Rights Protected under DFARS 252.227.7018
ii
Acknowledgements
First, I would like to thank Tony DiCroce, John Schickling and Jerome Fanucci for their
assistance in finding a topic for my Major Qualifying Project. Without their help, I would never
have been introduced to KaZaK Composites and the SPAD program and for this I am extremely
grateful.
I would also like to thank Brian Smith and Stephen Shoenholtz. Their expertise in research
and development projects was an excellent guide in keeping me on track throughout the MQP. I
thank them for all of their technical assistance and their support.
Last, but certainly not least, I would like to thank Professor Gatsonis. His willingness to
advise a summer MQP and his constant patience in all that is an off campus project was all that I
could have asked him for and I thank him.

KaZaK Composites SBIR Data Rights Protected under DFARS 252.227.7018
iii
Table of Contents
Abstract ........................................................................................................................................... i
Acknowledgements ....................................................................................................................... ii
Table of Contents ......................................................................................................................... iii
List of Figures ................................................................................................................................ v
List of Equations ......................................................................................................................... vii
List of Tables .............................................................................................................................. viii
Chapter 1: Introduction ......................................................................................................... 1
1.1 Literature Review ............................................................................................................. 1 1.2 Project Objectives, Requirements and Approach ............................................................. 5
Objectives ............................................................................................................................... 5 Requirements .......................................................................................................................... 5
Approach ................................................................................................................................. 6
Chapter 2: Nose Cone Design ................................................................................................ 9
2.1 Spring-Loaded Nose ......................................................................................................... 9
2.1.1 Section One ............................................................................................................... 9 2.1.2 Section Two ............................................................................................................ 10
2.1.3 Section Three .......................................................................................................... 12 2.1.4 Section Four ............................................................................................................ 13
2.1.5 Base Plate ................................................................................................................ 13 2.1.6 Spring-Loaded Nose Assembly .............................................................................. 15
2.2 Inflatable Nose ............................................................................................................... 17
2.2.1 Inflatable Nose Assembly ....................................................................................... 17 2.2.2 Base Plate ................................................................................................................ 18
2.2.3 Inflatable Balloon.................................................................................................... 19 2.2.4 Pressurized Gas Bottle ............................................................................................ 19 2.2.5 Trigger Assembly.................................................................................................... 20
2.3 Rubber Nose ................................................................................................................... 21
2.4 Foam Nose...................................................................................................................... 22
Chapter 3: Aerodynamic Analysis ...................................................................................... 23
3.1 Methods .......................................................................................................................... 23
3.2 Procedure ........................................................................................................................ 25 3.3 Results ............................................................................................................................ 27
3.3.1 Conformity Analysis ............................................................................................... 27 3.3.2 Maximum Velocity Analysis .................................................................................. 28 3.3.3 Comparative Analysis ............................................................................................. 31

KaZaK Composites SBIR Data Rights Protected under DFARS 252.227.7018
iv
Chapter 4: Structural Analysis ............................................................................................ 33
4.1 Spring-Loaded Nose ....................................................................................................... 34 4.1.1 Mission Mode ......................................................................................................... 34 4.1.2 Weight Saving Tradeoff .......................................................................................... 41
4.1.3 Failure Mode ........................................................................................................... 46 4.2 Inflatable Nose ............................................................................................................... 48 4.3 Rubber Nose ................................................................................................................... 49
Chapter 5: Fabrication and Experimentation.................................................................... 51
5.1 Fabrication ...................................................................................................................... 51
5.1.1 Materials and Methods ............................................................................................ 52 5.2 Experimentation ............................................................................................................. 55
5.2.1 Foam Nose .............................................................................................................. 55
5.2.2 Rubber Nose............................................................................................................ 59
Chapter 6: Summary and Recommendations .................................................................... 66
6.1 Spring-Loaded Nose Cone ............................................................................................. 66
6.2 Inflatable Nose ............................................................................................................... 67 6.3 Rubber Nose ................................................................................................................... 67
6.4 Foam Nose...................................................................................................................... 68 6.5 Conclusion ...................................................................................................................... 68
Acronyms ..................................................................................................................................... 70
Appendix ...................................................................................................................................... 71
Navier-Stokes Equations (Anderson 2007) .............................................................................. 71
Shear Stress Equations for Fluid Flow (Anderson 2007) ......................................................... 72
References .................................................................................................................................... 73

KaZaK Composites SBIR Data Rights Protected under DFARS 252.227.7018
v
List of Figures
Figure 1-1: SPAD in compressed storage stage .............................................................................. 4
Figure 1-2: SPAD in extended flight configuration ........................................................................ 4
Figure 2-1: Spring Loaded Nose, Section One ............................................................................. 10
Figure 2-2: Spring Loaded Nose, Section Two ............................................................................ 11
Figure 2-3: Spring-Loaded Nose, Section Three .......................................................................... 12
Figure 2-4: Spring-Loaded Nose, Section Four ............................................................................ 13
Figure 2-5: Spring-Loaded Nose, Base Plate Section ................................................................... 14
Figure 2-6: Base-Plate to Sonobuoy Wind Flap Connection ........................................................ 15
Figure 2-7: Spring-Loaded Nose, Assembly at Full Compression and Total Extension .............. 16
Figure 2-8: Inflatable Nose Assembly (Pressure Switch Not Shown) .......................................... 18
Figure 2-9: Inflatable Nose Base Plate ......................................................................................... 18
Figure 2-10: Pressurized CO2 Gas Bottle ..................................................................................... 19
Figure 2-11: Inflatable Nose, Trigger Assembly .......................................................................... 20
Figure 2-12: Rubber Nose (Wind-Flap Attachment Not Shown) ................................................. 21
Figure 2-13: Foam Nose Assembly .............................................................................................. 22
Figure 3-1: GAMBIT Model of the Three-Dimensional SPAD Body with a Hemispherical Nose
Cone ...................................................................................................................................... 26
Figure 3-2: SPAD Wind Tunnel Model with Control Surfaces Attached and Deployed in MIT's
Wright Brothers Wind Tunnel (Courtesy of KaZaK Composites, Inc.) ............................... 28
Figure 3-3: CFD Derived Values for SPAD Nose Cone Pressure Distribution @ α=0°, V∞=110
mph ....................................................................................................................................... 29
Figure 3-4: Pressure Distribution about the SPAD Body @ α=0°, V∞=110 mph ........................ 30
Figure 3-5: Velocity Magnitude Profile Across the y-Direction from the SPAD Surface Outward
in the Vicinity of the Pitot Tube ........................................................................................... 31
Figure 3-6: GAMBIT Model of the Three-Dimensional SPAD Body with a Blunt Nose Cone .. 32
Figure 4-1: Deformation Distribution @ pmax & F1, Section1 ..................................................... 36
Figure 4-2: Equivalent Stress Distribution @ pmax and F1, Section one ...................................... 36
Figure 4-3: Deformation Distribution @ pmax and F1, Section two .............................................. 37
Figure 4-4: Equivalent Stress Distribution @ pmax and F1, Section two ...................................... 37
Figure 4-5: Deformation Distribution @ pmax and F2, Section three ............................................ 38
Figure 4-6: Equivalent Stress Distribution @ pmax and F1, Section three .................................... 38
Figure 4-7: Deformation Distribution @ pmax and F1, Section four ............................................. 39
Figure 4-8: Equivalent Stress Distribution @ pmax and F1, Section four ..................................... 39
Figure 4-9: Deformation Distribution @ F1. Base Plate .............................................................. 40
Figure 4-10: Equivalent Stress Distribution @ F1, Base Plate ..................................................... 41
Figure 4-11: Weight Saving Trade-off Study, Base Plate ............................................................ 42
Figure 4-12: Weight Saving Trade-off Study, Section two .......................................................... 43
Figure 4-13: Weight Saving Trade-off Study, Section three ........................................................ 44
Figure 4-14: Weight Saving Trade-off Study, Section four ......................................................... 45
Figure 4-15: Rubber Nose Cone Model Cross-Section ................................................................ 50
Figure 4-16: ANSYS Predicted Compression of Rubber Nose @ 40 lbs ..................................... 50
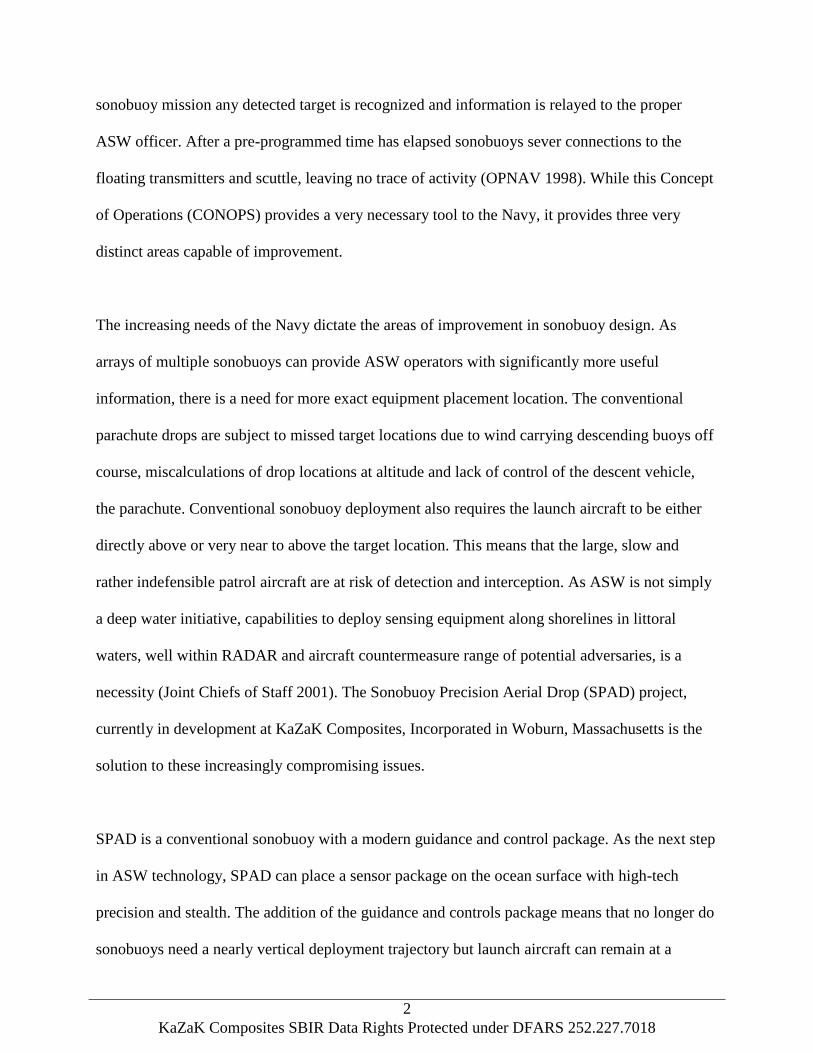
Figure 5-1: Model of the Foam/Rubber Nose Cone Base Mold ................................................... 52
Figure 5-2: Model of the Rubber Nose Cone Mold Insert ............................................................ 52

KaZaK Composites SBIR Data Rights Protected under DFARS 252.227.7018
vi
Figure 5-3: Cross-Section Sketches for Each Rubber Nose Fabricated. (a) The VytaFlex 50 lifted
0.5" (b) The VytaFlex60 lifted 0.2” (c) The VytaFlex60 lifted 0.6" and (d) The PMC-780
with no lift. ............................................................................................................................ 55
Figure 5-4: Foam Compression Set Testing Apparatus ................................................................ 56
Figure 5-5: Foam Vertical Compression Test Apparatus ............................................................. 57
Figure 5-6: Time to Rebound of Frozen and Room Temperature Foams..................................... 58
Figure 5-7: Force to Deflection Curve for Foam Noses ............................................................... 59
Figure 5-8: Vertical Compression Test Apparatus ....................................................................... 60
Figure 5-9: Force to Deform Curves for Each Rubber Nose Cone............................................... 62
Figure 5-10: Failure of the PMC-780 Rubber Nose Cone ............................................................ 63
Figure 5-11:(a) The physical model is subjected to a 41.21 lbf load and deforms 0.700". (b) The
ANSYS model is subjected to a 40.00 lbf load and deforms 0.730" .................................... 64
Figure 5-12: Sketch of Finalized Rubber Nose Geometry ............................................................ 65

KaZaK Composites SBIR Data Rights Protected under DFARS 252.227.7018
vii
List of Equations
Equation 2-1: Hemispherical Geometry Height ........................................................................... 11
Equation 3-1: The Continuity Equation in Integral Form ............................................................. 24
Equation 3-2: The Momentum Equation in Integral Form ........................................................... 24
Equation 4-1: Thread Stress Area ................................................................................................. 47
Equation 4-2: Pull-Out Force per Screw ....................................................................................... 47
Equation 4-3: Relationship between Pressure Inside of the Inflatable to the Volume Inside the
Inflatable due to a 12g CO2 Cartridge ................................................................................... 49

KaZaK Composites SBIR Data Rights Protected under DFARS 252.227.7018
viii
List of Tables
Table 2-1: Spring-Loaded Nose Slide Geometry by Section........................................................ 16
Table 2-2: Spring-Loaded Nose Cone Weights by Section .......................................................... 17
Table 3-1: Comparison of SPAD Drag Data @ α=0°, V∞=110 mph ........................................... 28
Table 3-2: Comparative Lift/Drag Data @ 350 mph .................................................................... 32
Table 4-1: Axial Force at pmax ...................................................................................................... 35
Table 4-2: Material Properties of ABS Plastic ............................................................................. 35
Table 4-3: Material Properties, Aluminum A6061 ....................................................................... 40
Table 4-4: Summary of Weight Saving Optimization by Section ................................................ 46
Table 4-5: #4-48 Screw Parameters .............................................................................................. 47
Table 4-6: Spring-Loaded Nose Failure Mode Analysis Results ................................................. 48
Table 4-7: Material Properties: Natural Rubber ........................................................................... 49
Table 5-1: Material Properties of Smooth-On Products ............................................................... 53
Table 5-2: Material Properties of Urethane Rubber ..................................................................... 61

KaZaK Composites SBIR Data Rights Protected under DFARS 252.227.7018
1
Chapter 1: Introduction
1.1 Literature Review
Since the World War II realization that sonobuoys were the ideal detection instrument for
submerged submarines, the United States Navy (USN) has used them as an integral component
for their Antisubmarine Warfare (ASW) practices. Just as RAdio Detection And Ranging
(RADAR) is the linchpin of military sensor equipment on and above the surface, SOund
Navigation and Ranging (SONAR) is the eyes and ears of the military under water. While USN
vessels are equipped with SONAR, the primary method for remote sensing is sonobuoy
technology (OPNAV 1998). Deployable from sea-level up to 30,000 feet in altitude, sonobuoys
extend sensing equipment under the sea surface and relay signal acquisition via a floating surface
transmitter to the proper ASW officers without the time consuming need and risk of deploying a
ship to the area.
Constructed primarily by three US companies, all sonobuoys conform to a standard set forth by
current naval ASW practices. Size, shape and functionality requirements dictate sonobuoy
design. As disposable assets that need to be fabricated in great quantity, manufacturing cost is a
driving factor in the design. Currently, sonobuoys are stored in the Sonobuoy Launch Tube
(SLT) for a foreseeable shelf life of up to five years. When duty calls, SLTs containing the
sonobuoys are loaded into the launchers aboard a launch platform, currently the P-3 Orion
aircraft. They are then flown to their destination where explosive charges eject the sonobuoys
from the SLTs and drop them via parachute to the sea surface. Once splashed down, sonobuoys
deploy underwater SONAR arrays and float transmitters on the surface. In the active phase of the
KaZaK Composites SBIR Data Rights Protected under DFARS 252.227.7018
2
sonobuoy mission any detected target is recognized and information is relayed to the proper
ASW officer. After a pre-programmed time has elapsed sonobuoys sever connections to the
floating transmitters and scuttle, leaving no trace of activity (OPNAV 1998). While this Concept
of Operations (CONOPS) provides a very necessary tool to the Navy, it provides three very
distinct areas capable of improvement.
The increasing needs of the Navy dictate the areas of improvement in sonobuoy design. As
arrays of multiple sonobuoys can provide ASW operators with significantly more useful
information, there is a need for more exact equipment placement location. The conventional
parachute drops are subject to missed target locations due to wind carrying descending buoys off
course, miscalculations of drop locations at altitude and lack of control of the descent vehicle,
the parachute. Conventional sonobuoy deployment also requires the launch aircraft to be either
directly above or very near to above the target location. This means that the large, slow and
rather indefensible patrol aircraft are at risk of detection and interception. As ASW is not simply
a deep water initiative, capabilities to deploy sensing equipment along shorelines in littoral
waters, well within RADAR and aircraft countermeasure range of potential adversaries, is a
necessity (Joint Chiefs of Staff 2001). The Sonobuoy Precision Aerial Drop (SPAD) project,
currently in development at KaZaK Composites, Incorporated in Woburn, Massachusetts is the
solution to these increasingly compromising issues.
SPAD is a conventional sonobuoy with a modern guidance and control package. As the next step
in ASW technology, SPAD can place a sensor package on the ocean surface with high-tech
precision and stealth. The addition of the guidance and controls package means that no longer do
sonobuoys need a nearly vertical deployment trajectory but launch aircraft can remain at a

KaZaK Composites SBIR Data Rights Protected under DFARS 252.227.7018
3
standoff range and place sensors up to 39 nautical miles away. Programmable waypoints in the
guidance system can assure that SPAD evades any enemy detection equipment providing little to
no knowledge of USN sensor equipment in the water.
The SPAD Aerial Deliver Vehicle (ADV) is mated with a conventional g-sized sonobuoy and
stowed in a SLT concurrent with all ASW practices. Where previous conventional drops would
require the P3 launch vehicle to fly directly to the destination, the SPAD program CONOPS
requires the P3 to fly up to altitude within range of the target and fire the same explosive charge
jettisoning SPAD from the SLT. The next stage of the mission replaces the conventional
parachute drop. SPAD gains velocity and deploys its control surfaces. As an unpowered glider
SPAD follows its GPS guided flight plan and reaches its target. Above the target location the
SPAD initiates a sonobuoy jettison maneuver clearing the ADV from the trajectory of the, now
uncontrolled, sonobuoy. At the point of separation the sonobuoy drop follows the conventional
para-drop procedure. Figure 1-1 and Figure 1-2 show the SPAD assembly on the following page.

KaZaK Composites SBIR Data Rights Protected under DFARS 252.227.7018
4
Figure 1-1: SPAD in compressed storage stage
Figure 1-2: SPAD in extended flight configuration
Ф4.728”
ADV
1.125”
G-Size Sonobuoy
R2.364 Retention Strap Wind Flap
Pitot Tube
Nose Cone

KaZaK Composites SBIR Data Rights Protected under DFARS 252.227.7018
5
1.2 Project Objectives, Requirements and Approach
Objectives
As an unpowered glider the SPAD design has an emphasis on the minimization of drag. This
requires certain streamlined shapes for the vehicle surface. This geometrical requirement dictates
shapes and sizes; however SPAD still has to fit within the restricted geometry of the SLT.
Breaking the vehicle up into two components; the sonobuoy, which is an off the shelf system that
cannot be altered in length, shape or size and the ADV which is geometrically comprised of the
wings and control surfaces, the ADV is the only component whose geometry can be altered. To
maximize the wing area, the wingspan must be maximized and thus the ADV must be at its
maximum allowable length. With a predetermined overall length this leads to a lack of room for
a streamlined nose cone. A design solution for a nose cone, that can pack within the available
geometry of the SLT yet retain the larger, drag minimized shape for flight is needed.
Requirements
As much of SPAD has already been designed and tested, wind tunnel analysis values that
provide lift, drag and moment coefficient for stability derivatives, which effect autopilot
response, have already been resolved. These stability controls would be costly to change. This
means that the SPAD wind tunnel model cannot be significantly changed without great cost to
the project. In order to maintain these wind tunnel values, unless analysis provides a better
solution, the nose cone must weigh, more or less, 0.36 pounds and must be hemispherical in
shape with a radius of 2.364 inches. The SPAD maximum design velocity is 350 miles per hour
(mph). As low speed wind tunnel testing topped out at 110 mph, test data must be resolved at the
maximum flight speed. This will provide values for pressure distributions over the nose cone in
flight giving a design requirement for structural stability. Preliminary data shows maximum

KaZaK Composites SBIR Data Rights Protected under DFARS 252.227.7018
6
pressure as 2.5 psi. The nose cone structure must not significantly deform under these flight
pressures. Significant deformation would be defined as anything that would affect the laminar
flow over the airframe and its control surfaces or increase the drag forces. Analysis must also
confirm that the nose cone design will not seriously effect Pitot tube location. The Pitot tube is
located 0.55” away from the SPAD surface; its location in the free stream must be confirmed as
the guidance system relies heavily on this device. The nose cone must have an attachment
interface to the sonobuoy wind flap, be able to survive a concussive launch shock of up to 20 Gs
and operate in a temperature range of -40° F to +135° F. As the inactive shelf life of sonobuoys
is 5 years, the design must remain viable for that period of compressed storage. Finally, as cost is
the driving factor in all projects but most specifically those that are high in quantity and
disposable, the nose cone must be capable of acquisition for a cost of fewer than 25 US dollars.
Approach
In order to design, analyze, fabricate and test possible nose cones for SPAD, the following
approach was taken:
1. Produce four design concepts, fundamentally different in nature, which meet the project
requirements.
2. Produce an aerodynamic analysis of the flow around the SPAD body.
3. Produce a structural analysis for each of the nose cone concepts resulting in rejection and
discontinuation of failing concepts.
4. Fabricate and physically test the remaining nose cone concepts resulting in a final
rejection and discontinuation of failing concepts.
5. Summarize the data gathered and conclude the best candidate for the SPAD nose cone.

KaZaK Composites SBIR Data Rights Protected under DFARS 252.227.7018
7
In order to produce the aerodynamic analysis about the SPAD body, the following approach was
taken:
1. Import the SPAD body geometry into the meshing software GAMBIT. By removing
small discontinuities in the SPAD surface, create a simplified, but similar, SPAD body
increasing solution speed.
2. Mesh the flow volume and create the boundary conditions in GAMBIT.
3. Import SPAD GAMBIT file into the numerical solver FLUENT and create a dynamically
similar environment to that of the 110 mph wind tunnel tests.
4. Verify the model accuracy by comparing numerically solved data with wind tunnel
recorded data.
5. Increase flow to SPAD maximum design speed and resolve the drag force, lift force, total
pressure distribution about the nose surface and the thickness of the viscous boundary
layer in the vicinity of the Pitot tube.
6. Evaluate the total pressure distribution about the nose for use in the structural analysis.
7. Evaluate the measured thickness of the viscous boundary layer to verify Pitot tube
location in the free stream flow.
8. Return to GAMBIT and create SPAD body with a blunt nose and mesh the flow volume
in the same manner as the original SPAD body to remove any meshing derived
inconsistencies.
9. Import the blunt nose SPAD into FLUENT and run analysis with identical conditions to
that of the hemispherical SPAD maximum speed analysis and resolve the blunt nose
SPAD drag forces and lift forces.
10. Evaluate and compare the lift/drag data for the blunt nose SPAD and the hemispherical
nose SPAD. Verify the need for a hemispherical nose cone.

KaZaK Composites SBIR Data Rights Protected under DFARS 252.227.7018
8
In order to produce the structural analysis of each nose cone concept, the following approach was
taken:
1. Determine the manner in which flight loads and storage loads will be applied to each
design concept and determine the manner in which the concepts can be analyzed
numerically.
2. Evaluate the structural integrity in the FEA solver ANSYS, for concepts capable of
numerical analysis, loaded with flight and storage forces.
3. Evaluate the remaining concepts capable of numerical analysis using a computational
method for structural integrity.
4. Reject and discontinue any concept which fails to meet the design requirements based on
the gathered data.
In order to fabricate and physically test the remaining nose cone concepts, the following
approach was taken:
1. Determine which nose cone concepts need to be fabricated based on data already
collected and determine manner in which each nose cone concept can be fabricated.
2. Produce prototype models.
3. Produce tests results for time to rebound and completeness of rebound by compression
set testing at variable temperatures.
4. Produce tests results for compression testing, comparable to the numerical test methods
in the structural analysis section.
5. Verify numerically solved compression test data with physical compression test data.
6. Reject and discontinue any concept which fails to meet the design requirements based on
the gathered test data.

KaZaK Composites SBIR Data Rights Protected under DFARS 252.227.7018
9
Chapter 2: Nose Cone Design
In attempt to design, fabricate and test a reliable nose cone within the limited time provided, four
different nose cones were conceptualized. This allowed time to be spent on improving good
design concepts rather than attempting to fix fundamentally faulty concepts. Four concepts were
made utilizing different structural designs, mechanics and material properties. The first of these
was a rigid, collapsible, mechanical structure which utilized the strength properties of rigid
materials. The second concept attempted to create a no-stress storage environment by the use of
an inflatable device. The final two designs attempted to employ the unique elastomeric
characteristics of urethanes. One of these designs relied on the strength, as well as the elasticity
of solid urethane rubber. The last of the design concepts was focused on the compressibility, and
resiliency, of urethane foam rubber. They are described in detail as follows.
2.1 Spring-Loaded Nose
The Spring-Loaded Nose employs the use of a spring-loaded four tier collapsible system that
extends to a designed height and compresses within the area of the first tier. As ABS plastic and
Aluminum alloy are the materials selected for the structural segments, this design offers a high
strength to weight ratio. With specifically engineered low solid thickness, high spring constant
wave springs; the structure can retain its shape against flight pressures of almost any airspeed.
2.1.1 Section One
Figure 2-1, shown on the following page, shows the first section of the nose cone geometry.
Allowing room for base plate thickness the section height is very important as all subsequent
sections need to fit within this geometry. A 1” height was chosen, allowing adequate room for
the base plate while maximizing the area for the other nose cone sections.

KaZaK Composites SBIR Data Rights Protected under DFARS 252.227.7018
10
Nose Section One
Material
Weight
Effective Surface Area
Height
Design Spring Load (F1)
pmax
ABS Plastic
0.066 lbs
14.853 in2
1.0 in
50 lbs
2.5 psi
Figure 2-1: Spring Loaded Nose, Section One
Four screws are sunk into the back side of section one providing a fixture to the base section.
Because of the necessary forces in the system larger screw diameters are needed to provide the
proper support. This leads to a build up of material around the screw hole locations. While the
screws are not 1” long this material was continued to the front end of the section to provide
sliding support for the system as well as to maintain a smooth, continuous surface on the outside
face to promote laminar flow effects.
A lip extends into the inner radius at the front end to provide a slide stop to contact section two.
There is no rear slide stop as section one lies flush against the base plate. The radius of curvature
of the hemisphere is centered along the center axis coincident with the rear plane of section one.
All subsequent radii reference this point in the assembly.
2.1.2 Section Two
Section two of the assembly is designed to sit flush with the base section while in full
compression and therefore can be 1” in height, just as high as section one. The equal heights of
sections one and two fill the maximum height set forth in the design requirements while still
Screw Hole
Front
Slide Stop
Slide Inner
Radius
Slide Outer
Radius

KaZaK Composites SBIR Data Rights Protected under DFARS 252.227.7018
11
allowing room for subsequent section geometry. When fully extended the rear slide stop of the
section is designed to rest in contact with the front slide stop of the previous section.
Nose Section Two
Material
Weight
Effective Surface Area
Height
Design Spring Load (F1)
pmax
ABS Plastic
0.096 lbs
7.103 in2
1.0 in
50 lbs
2.5 psi
Figure 2-2: Spring Loaded Nose, Section Two
Shown in Figure 2-2, the outer radius of section two is defined by the slide available outer radius
of section one; as is the inner radius by the slide available inner radius. From there the cone
geometry can be constructed.
Keeping in mind the available slide distance provided by section one, the hemisphere height of
section two can only equal the available slide distance minus the rear stop length.
nnn rssh ldh1
Equation 2-1: Hemispherical Geometry Height
To fit within the geometry of section one, material from section two is to be removed from the
areas where the screw supports are located in section one. These extrusions in section one
provide a beneficial side effect in that they create a rail for section two to ride on which
counteracts twisting inside of the assembly.
Material
removed due
to Sec.1
Rear Slide
Stop
Front Slide
Stop

KaZaK Composites SBIR Data Rights Protected under DFARS 252.227.7018
12
Section two is also equipped with a slide stop at the front end of the slide. However, this section
introduces the use of a rear slide stop. While this slide stop is necessary to prevent an
unintentional removal from the slide system of section three from section two, it takes much
needed space away from the slide distance; reducing the overall hemisphere height of the
subsequent section. Notches have also been removed from this slide stop to provide an
installation technique for the subsequent section.
2.1.3 Section Three
Section three, shown in Figure 2-3, is designed to rest flush with the front of the rear stop of
section two when in full compression. Because of this reduced slide distance caused by an
elevated rest height, there is less available clearance for the hemisphere.
Nose Section Three
Material
Weight
Effective Surface Area
Height
Design Spring Load (F1)
pmax
ABS Plastic
0.125 lbs
7.352 in2
0.9 in
50 lbs
2.5 psi
Figure 2-3: Spring-Loaded Nose, Section Three
When fully extended the rear slide stop of this section is also designed to rest in contact with the
front slide stop of the previous section. Notches have been removed from the slide stops to
provide installation to the previous section. A simple insertion and twist locks section three
within the slide stops of section two. There is no rail system as in section two to provide
Rear Slide
Stop
Front Slide
Stop

KaZaK Composites SBIR Data Rights Protected under DFARS 252.227.7018
13
rotational support, as forces will be loaded axially significant rotation forces should not be
incurred.
2.1.4 Section Four
Section four is the final stage of the nose cone assembly. Because of the maximization of the
previous three sections geometry, section four can remain relatively small. This small size is
beneficial as the compression spring is required to fit within the area provided by the distance
between the base plate and section four when fully compressed.
Nose Section Four
Material
Weight
Effective Surface Area
Height
Design Spring Load (F1)
pmax
ABS Plastic
0.069 lbs
5.366 in2
0.303 in
50 lbs
2.5 psi
Figure 2-4: Spring-Loaded Nose, Section Four
Shown in Figure 2-4, section four is equipped with a slide stop about the slide radius. This
prevents an accidental removal from the slide system rear as well as a stop height for full
extension. The backside of section four also provides a flat surface forming an area for the
compression spring to rest in. The height of this point at full compression is very important as it
cannot be smaller than the solid height of the spring.
2.1.5 Base Plate
Shown in Figure 2-5, the base plate is a very important component of the overall assembly. All
of the loading from the hemispherical sections will be applied on this section. This means the
Slide Stop
Spring
Attachment
Point

KaZaK Composites SBIR Data Rights Protected under DFARS 252.227.7018
14
base plate must be able to resist the maximum force applied by the compression spring at any
possible compression state as well as the forces exerted on the outside geometry cause by the
dynamic pressures of flight.
Base Section
Material
Weight
Effective Surface Area
Height
Design Spring Load (F1)
pmax
Aluminum A6061
0.223 lbs
1.62 in2
0.135 in
50 lbs
2.5 psi
Figure 2-5: Spring-Loaded Nose, Base Plate Section
Because of the high loads concentrated on the base plate, ABS plastic is unsuitable as the
strength and deformation properties simply to not meet the requirements. Aluminum alloy
A6061 was chosen as the lightweight, high strength material to use in the place of ABS plastic.
6061 aluminum was chosen as it is a common aerospace material that is lightweight, strong and
stiff. The material properties of A6061 allow the base plate to be very thin. This quality is
important as the available height for the base plate is only 0.125”.
The base plate has a constant diameter, sized to fit the maximum diameter of the section one.
Counter bored screw holes are located along an outer radius of the plate to form the attachment
with section one. A circular extrusion in the center of the base plate supports the compression
spring. Along a radius outside that of the outside radius of the compression spring there are two
slots. These slots provide an attachment point to the wind flap of the sonobuoy. Currently the
sonobuoy has retention straps that are locked into place by machine screws. These machine
Wave Spring
Pilot Shaft
Wind-Flap
Slide Lock
Screw Hole
Locations

KaZaK Composites SBIR Data Rights Protected under DFARS 252.227.7018
15
screws are to be replaced by machine shoulder screws. These shoulder screws will provide an
area for the base plate to attach. The base plate is designed to accept the shoulder screws inside
the base and upon rotation about the shared axis lock into place. The shoulder screw locks are
simple ramps with a physical barrier to allow one directional rotation. After the base plate is
fully rotated 45 degrees, a force greater than any exerted during a storage or active phase is
required to rotate the opposing direction. This attachment is shown in Figure 2-6.
Figure 2-6: Base-Plate to Sonobuoy Wind Flap Connection
2.1.6 Spring-Loaded Nose Assembly
While Figure 2-1 to Figure 2-5 show the collapsible sections and base plate of the spring-loaded
nose cone, Figure 2-7 on the following page shows the full assembly. As said previously, section
four fits inside of section three, section three fits inside of section two and so on. Each of the
connections between sections are sliding connections with end stops at the forward and aft ends
of the groove. Section one can be seen connected to the base via the 4 machine screws Between
the base plate section and section four there is a wave compression spring. Wave compression
springs are important to the design as they offer a very high force exertion from a very small
Sonobuoy
Wind Flap
Base
Plate
Shoulder
Screws
Retention
Strap
Slide Lock
Mechanism

KaZaK Composites SBIR Data Rights Protected under DFARS 252.227.7018
16
physical area compared to a normal compression spring. Wave springs can compress to the 0.7”
length provided by the assembly and extend to a 2.07” length while still exerting the required 50
lbf.
Figure 2-7: Spring-Loaded Nose, Assembly at Full Compression and Total Extension
Table 2-1 shows the relationship between inner and outer radii as well as slide distances for the
assembly. These relationships are crucial to maintain spherical geometry.
Section Height Available Slide
Distance
Front Stop Length
Rear Stop
Length
Outer Radius
Inner Radius
Slide Available
Outer Radius
Slide Available
Inner Radius
1 1.000 0.6 0.4 - - - 2.192 2.142
2 1.000 0.6 0.3 0.1 2.188 2.138 1.877 1.827
3 0.900 0.6 0.2 0.1 1.873 1.823 1.311 1.261
4 0.303 - - 1.306 1.256 - - -
* all dimensions are in inches ** inner and outer radii reflect a 0.002 tolerance
Table 2-1: Spring-Loaded Nose Slide Geometry by Section
Table 2-2 shows the weight of each section in tabular form. The current total weight is exceeding
the design requirements by 61%. A weight optimization must be completed in the design
analysis phase or else SPAD could become unstable in flight.
Wind-Flap
Shoulder Screws
Wave
Springs
Screw-Hole
Material
Exposed to
Flow

KaZaK Composites SBIR Data Rights Protected under DFARS 252.227.7018
17
Description Weight (lbs)
Section 1 0.066
Section 2 0.096
Section 3 0.125
Section 4 0.069
Base Plate 0.223
Total 0.579
Design Requirement 0.360
Weight Excess 0.219
Table 2-2: Spring-Loaded Nose Cone Weights by Section
2.2 Inflatable Nose
2.2.1 Inflatable Nose Assembly
The Inflatable Nose design is one of extremely minimized storage volume. However, adding to
the complexity it is made up of many individual components. In keeping with a cost minimized
design, the inflatable nose is centered around an off the shelf component, the compressed CO2
cartridge. The inflatable nose design is shown in Figure 2-8. While in the storage phase of the
mission the inflatable nose is to rest on the base plate structure. When entering the active flight
phase the inflatable nose is to be turned on via a pressure switch. The activation of this pressure
switch opens a connection between a battery and a resistor. The resistor then burns a cut-line
holding back a trigger spring. When released the trigger spring pierces a pressurized gas bottle
inflating the nose. Figure 2-8 shows the inflatable nose assembly on the following page.

KaZaK Composites SBIR Data Rights Protected under DFARS 252.227.7018
18
Figure 2-8: Inflatable Nose Assembly (Pressure Switch Not Shown)
2.2.2 Base Plate
The inflatable nose base plate is the largest component of the system. The design of the base
plate is to hold all the subsequent components in place as well as provide rigid support for the
assembly. Shown in Figure 2-9, the base plate is comprised of the gas bottle connection, the
firing pin swing arm hinge and the spring housing. The attachment point must differ from the
previous nose cone design as the inside volume of the inflatable must be pressure sealed from the
outside.
Figure 2-9: Inflatable Nose Base Plate
Pressure
Bottle
Piercing
Mechanism
Spring
Housing
Spring
Housing
Pivot
Point
Pressure
Bottle
Attachment

KaZaK Composites SBIR Data Rights Protected under DFARS 252.227.7018
19
To reduce cost, the base plate is to be one of the only parts to be manufactured for this assembly.
ABS plastic was chosen as the material for this section for its strength and weight properties. As
the base plate is not directly loaded by any forces of great magnitude the weight, strength and
stiffness of ABS is ideal.
2.2.3 Inflatable Balloon
The inflatable balloon, as seen as the transparent component in Figure 2-8 on the previous page,
is to be the second of the two components manufactured specifically for this application.
Constructed from a polymer material this very thin, very lightweight balloon will support all the
loads of the nose while in flight. As the balloon is to be attached to the base plate to form a
pressure seal, special focus must be given to this region as integrity must be maintained for the
duration of the flight phase. Any loss of pressure would be catastrophic for the SPAD flight
performance. Analysis will provide ideal attachment location and method.
2.2.4 Pressurized Gas Bottle
The pressurized gas bottle, shown in Figure 2-10, is the centerpiece of this design. To limit cost,
the component is designed to be an off the shelf integration. Standard 12g C02 bottles can be
purchased from a variety of distributors.
Figure 2-10: Pressurized CO2 Gas Bottle

KaZaK Composites SBIR Data Rights Protected under DFARS 252.227.7018
20
At a standard size of 3.5” x 1”, these bottles can be integrated into the assembly very easily. The
gas bottle is designed to fit within an attachment on the base plate. No gasket is necessary as the
compressed volume is to expel into the sealed nose chamber.
2.2.5 Trigger Assembly
The trigger assembly is one of the most complex components of this design. Shown in Figure
2-11, the trigger employs the use of a pressure switch to keep the system disarmed while in
storage. Upon exiting the launch tube the pressure switch is disengaged and current is able to
flow from a 9 volt battery to a 2 ohm resistor. The resistor is placed in close proximity to a twine
retention string. This retention string holds back the force of a compression spring. When the
resistor is supplied with current it heats up, cutting the retention string and sending the
compression spring outward. Prior proven use of a resistor heating element for this application
has been found in sonobuoy design. When the compression spring is extended it forces a pin to
pierce the pressure bottle exhausting pressurized gas into the balloon chamber. Analysis will
provide values for pressure within the inflatable chamber as well as values for compression
spring constant.
Figure 2-11: Inflatable Nose, Trigger Assembly
Pressure
Bottle
Piercing
Pin
Swing
Arm
Pivot
Point

KaZaK Composites SBIR Data Rights Protected under DFARS 252.227.7018
21
2.3 Rubber Nose
The Rubber Nose is completely dependant on the elastomeric structural and material properties
of solid urethane rubber. As natural and synthetic rubbers have long been used as materials for
controlled deformation in all sorts of temperatures and pressures, they are a proven material for
this application. For this design the rubber nose structure must be able to compress to
approximately 50% of its original height. For this much deformation a solid piece of rubber is
unsuitable as the forces would be too great for compression and the deformation undesirable. In
order to demonstrate the required deformation effects at the specific forces the rubber needs to be
hollowed out as shown in Figure 2-12.
Figure 2-12: Rubber Nose (Wind-Flap Attachment Not Shown)
In order to provide the proper deformation characteristics the rubber nose is designed to be
structurally sound at the maximum pressures about the outside surface in flight. Any excess of
the maximum flight pressure will cause a controlled structural failure in the form of buckling.
This is the basis of the design for the rubber nose to pack within itself.
In order to design this controlled buckling, analysis will provide optimal sidewall thickness and
geometry. Once compressed the elastomeric properties of the urethane rubber will allow the

KaZaK Composites SBIR Data Rights Protected under DFARS 252.227.7018
22
structure to rebound without any lasting geometrical changes or permanent material failures.
Attachment to the wind flap will be made via the same shoulder screws as in the spring design.
2.4 Foam Nose
The Foam Nose design is based on the elastomeric properties of urethane foams. As foam
density and elastic properties can almost be made-to-order, a foam nose could be a viable option
for its simplicity of manufacturing and basic operation. As foam is much less dense when
compared to rubber, the foam nose will be constructed out of a solid piece of foam and
deformation will be resisted by foam material properties alone. Foam is not marketed based on
numerical properties such as elastic modulus or Poisson’s ratio so different foams must be
experimentally tested for their compressive capabilities for analysis.
Figure 2-13: Foam Nose Assembly
Shown in Figure 2-13, the foam nose assembly is to be a solid piece of molded foam adhered to a
base plate. This plate is to fit the geometry of the surface of the hemisphere for continuity. Once
adhered to each other the assembly is to locked in place on the top of the wind flap via the same
shoulder screws as the rubber and spring designs.
Foam
Material
Base
Plate

KaZaK Composites SBIR Data Rights Protected under DFARS 252.227.7018
23
Chapter 3: Aerodynamic Analysis
The primary mission of SPAD is that of a flight vehicle. It is in this environment that the
structure encounters its primary loading. Due to the viscous stresses and pressures of fluid flow,
these load cause the collapse, and ultimate failure, of any nose cone design (Anderson 2007).
The viscous effects of air create a boundary layer separating regions of zero flow velocity to full
flow field velocity causing pressure drag, and in this application potentially inaccurate Pitot tube
measurement (Pope 1966). It is because of these very dynamic effects that the aerodynamics of
the SPAD must be analyzed. In order to create a structure that can withstand the pressures of an
incoming air flow the total pressure distribution about the SPAD body must be calculated. As a
final proof of concept the SPAD hemispherical nose will be compared to a blunt nose at
maximum speed demonstrating the essential need for a streamlined nose cone.
3.1 Methods
The method used in the analyses will be a Computational Fluid Dynamics (CFD) modeling
software, FLUENT. CFD numerical solvers have taken over as the primary first stage in
aerodynamic analysis (Anderson 2007). While bench top, wind tunnels and prototype testing are
still necessary in aerospace R&D much of the initial analysis can be modeled using numerical
solvers. CFD programming is rooted in the flow equations of fluid dynamics. Since SPAD is a
subsonic aerial vehicle, the flow is to be treated as an un-steady, three-dimensional,
incompressible, viscous flow. As the temperature is expected to change only by small increments
the flow can be defined by the Navier-Stokes equations of momentum and the continuity
equation alone. The energy equation would be introduced if compressibility effects were to be
taken into account. However, at low mach numbers air can be treated as incompressible

KaZaK Composites SBIR Data Rights Protected under DFARS 252.227.7018
24
(Anderson 2007). As the SPAD maximum design speed is mach 0.45 it is entering the arbitrarily
assigned compressible regime. Since this is the maximum speed of SPAD and it is only entering
the compressible regime, analysis treated air as incompressible for simplicity.
Continuity equations are employed as numerical representations of what has been found to be
fundamental laws of modern physics.
0SV
dt
dSV
Equation 3-1: The Continuity Equation in Integral Form (Anderson 2007)
These equations state that within a closed system there is mass and energy and they are constant.
In the application of fluid dynamics, the continuity equation states that the rate of mass entering
the system is the rate at which mass leaves the system. Shown in Equation 3-1, the continuity
equation states that the net mass flow out of the system is equal to the time rate of decrease of
mass inside the system. The above form represents the continuity equation for flows in general.
Terms can be removed and the equation simplified depending on the parameters of the flow.
viscous
SS
dpdt
FfdSVdSVV
Equation 3-2: The Momentum Equation in Integral Form (Anderson 2007)
Unsteady
Time Rate of
Change of
Momentum
Net
Momentum
Flow out of
CV
Pressure
Force
Body
Force
Viscous
Forces
Time Rate of
Decrease of
Mass in
System
Net Mass
Flow Out of
System

KaZaK Composites SBIR Data Rights Protected under DFARS 252.227.7018
25
The momentum equation, shown in
Equation 3-2 on the previous page, is derived from Newton’s Second Law of Motion, Force =
mass x acceleration (F = ma). Applied to fluid dynamics the equation states that total forces, F,
equal the total time rate change of momentum, Vmdt
d. From the momentum equation follows
the Navier-Stokes Equations. Solving these equations with the continuity equation provides the
solution to the fluid flow field (Anderson 2007). The solution to the momentum and continuity
equations, when solved simultaneously, will provide information for the flow around the SPAD
to be analyzed.
3.2 Procedure
These aerodynamic analyses will be performed in three stages. The first stage will confirm wind
tunnel testing values. This will provide proof that the analysis is concurrent with real physical
data. Since the wind tunnel data was taken at a flow velocity of 110 mph, this is the flow speed
selected for the first analysis. Drag values from the wind tunnel are to be compared with drag
values provided by CFD analysis at 110 mph. The second stage will analyze SPAD in a flow of
the maximum designed velocity of 350 mph. Lift and drag data will be recorded. Pitot tube
location will also be confirmed within the free stream. Most importantly for this section
however; the pressure distribution about the nose cone will be recorded. This will provide the
maximum pressure value that the nose cone will encounter in flight. From there a maximum
structural strength can be designed into the nose cone to minimize the compressed storage forces.
Lastly, SPAD with a hemispherical nose will be compared to a blunt nose SPAD at maximum
velocity. This will confirm the need for a specifically designed streamlined nose. Lift and drag

KaZaK Composites SBIR Data Rights Protected under DFARS 252.227.7018
26
data will be recorded from this analysis showing that range and maximum velocity would be
adversely affected in the case of a blunt nose SPAD.
In order to accomplish the above procedure the SPAD model must first be constructed in the
computer environment. To do this the software GAMBIT, which is packaged with FLUENT,
was used. GAMBIT allows physical models to be created in the virtual environment. Another
specific function of GAMBIT is to mesh the computer model. Meshing is very important to
computer analysis. As analysis requires fluid flows to be broken up into small elements, mesh is
the term describing and controlling the size and shape of these finite elements. For this particular
analysis SPAD was constructed in three-dimensional space. To do this the SPAD body model
was first imported into GAMBIT. Once in GAMBIT, SPAD was meshed. In order to aid in the
solution time the surface mesh on the SPAD was elected to be rather coarse. From there a flow
volume was created, shown in Figure 3-1.
Figure 3-1: GAMBIT Model of the Three-Dimensional SPAD Body with a Hemispherical
Nose Cone
80”
10”
Symmetry
Faces
Pressure
Outlet Pressure
Inlet
SPAD
Body

KaZaK Composites SBIR Data Rights Protected under DFARS 252.227.7018
27
The flow elements were finest right up to the SPAD body, 0.005 inches long. A size function
was created increasing the size of the mesh as the distance from the SPAD increased. In order for
the CFD solver to calculate boundary conditions, pressure inlets and outlets were defined as well
as the surrounding faces to be defined as symmetry faces and the SPAD was defined as a wall.
Defining faces as pressure inlets and outlets do exactly what they describe; they provide the
solver with a boundary condition for pressures which create a flow direction. Symmetry faces
create a slip condition. As the flow must be contained in a control volume for the equations of
fluid dynamics such as continuity and Navier-Stokes to yield solutions, symmetry faces contain
the flow volume within a bounding box while not allowing the effects of viscosity to be
represented on their faces. With the flow defined the mesh was created and exported into the
solver.
Once in the numerical solver the SPAD model had to be placed in the proper flow environment.
As SPAD is essentially a low velocity glider the flow was defined as a three-dimensional, un-
steady, viscous flow. In order for ease of solution the altitude was fixed at sea level providing a
PAtomospheric of 14.7 psi (Anderson 2007).
3.3 Results
This section explores the solution to each of the three CFD analysis runs. Raw data was
compiled and illustrated in figures or tabular form for simplicity.
3.3.1 Conformity Analysis
The first CFD solution of the SPAD was run at a flow velocity of 110 mph. This provided a
dynamically similar environment to the data collected by KCI at the MIT Wright Brothers Wind

KaZaK Composites SBIR Data Rights Protected under DFARS 252.227.7018
28
Tunnel in Cambridge, Massachusetts which is shown in Figure 3-2 on the following page. In this
analysis drag data is compared from both the numerical solution and the raw test data.
Figure 3-2: SPAD Wind Tunnel Model with Control Surfaces Attached and Deployed in
MIT's Wright Brothers Wind Tunnel (Courtesy of KaZaK Composites, Inc.)
Drag (lbs)
Wind Tunnel Value 0.35
FLUENT Value 0.34
Table 3-1: Comparison of SPAD Drag Data @ α=0°, V∞=110 mph
The above Table 3-1 shows the comparison of the drag data collected from the two different
processes, a physical flow environment and a virtual flow environment. Not that CFD requires
validation, however for this application it confirms that the computer model represents physical
model accurately.
3.3.2 Maximum Velocity Analysis
After the accuracy of the CFD model was confirmed, the second run provided an analysis for the
SPAD at its maximum design velocity. This produced the required lift and drag data, but more
importantly a view of the pressure distribution about the surface of the nose cone. Figure 3-3 on

KaZaK Composites SBIR Data Rights Protected under DFARS 252.227.7018
29
the following page shows this distribution. The nose cone was 2.364 inches in radius, so the
figure shows values from the tip of the nose cone, 2.364 inches, to the base of the nose cone, 0
inches. As preliminary data approximately predicted, the maximum total pressure that the nose
cone encounters is 2.4 psi. This pressure distribution provides loading criteria for structural
analyses of the nose cone.
Pressure Distribution on the Nose Cone
-1.5
-1
-0.5
0
0.5
1
1.5
2
2.5
3
3.5
0 0.5 1 1.5 2 2.5
Distance along x-Direction (in)
Pre
ssu
re (
ps
i)
Static Pressure Dynamic Pressure Total Pressure.
Figure 3-3: CFD Derived Values for SPAD Nose Cone Pressure Distribution @ α=0°, V∞=110
mph
The pressure distribution can also be displayed on the SPAD body itself. Together with the x-y
plot, the pressures experienced by SPAD at maximum design velocity can be interpreted. Figure
3-4 on the following page shows SPAD with static pressure contours about the body.
Nose Cone
Base
Nose Cone
Tip

KaZaK Composites SBIR Data Rights Protected under DFARS 252.227.7018
30
Figure 3-4: Pressure Distribution about the SPAD Body @ α=0°, V∞=110 mph
The above figure clearly shows that the highest pressure experienced by the SPAD nose cone is
focused at the center of the nose. From there the pressure quickly diminishes. When combined
with the dynamic pressure the total pressure is resolved.
The Pitot-tube location was also confirmed in this analysis. By mapping the velocity magnitude
from the surface of the SPAD body outward an approximate thickness of the viscous boundary
layer can be measured and the free stream can be located. This method can prove that the Pitot
tube is in the free stream (Schlichting 1968). The plot shows the velocity magnitude referenced
by the origin at the center of curvature of the SPAD body. Since the radius of the SPAD body

KaZaK Composites SBIR Data Rights Protected under DFARS 252.227.7018
31
was 2.364”, the Pitot tube is located at 2.914”, 0.55” away from the SPAD surface. Figure 3-5
shows that this location is well within the free stream flow.
Figure 3-5: Velocity Magnitude Profile Across the y-Direction from the SPAD Surface
Outward in the Vicinity of the Pitot Tube
3.3.3 Comparative Analysis
Finally, the SPAD hemispherical nose cone model was compared head to head with the SPAD
blunt nose model. The blunt nose model removed all of the 2.364 radius curvature. A simple
blunt nose was constructed to the minimal allowable height of 1.125 inches. Removing any sharp
edges the outermost circumference was filleted with a 0.5 inch radius. Shown in Figure 3-6 on
the following page, the SPAD blunt nose model was meshed identically to the SPAD
hemispherical nose model to eliminate any discontinuities due to changes in mesh size and
shape.
SPAD Surface
Pitot-tube location

KaZaK Composites SBIR Data Rights Protected under DFARS 252.227.7018
32
Figure 3-6: GAMBIT Model of the Three-Dimensional SPAD Body with a Blunt Nose Cone
The model was analyzed in an identical flow environment to the SPAD hemispherical nose cone
model. The results are shown in Table 3-2 with the results compiled from the Maximum Velocity
Analysis. When compared to the blunt nose model there is a clear need for a streamlined nose
cone. The drag force from the blunt nose posts an increase of 300% over the hemispherical nose.
As range is directly related to drag this increase in drag force alone would severely reduce the
maximum range in the SPAD CONOPS (Raymer 2006). For this reason, a streamlined nose cone
must be incorporated into the SPAD design. Simply leaving the nose as-is is not a viable option.
Lift (lbf) Drag (lbf)
SPAD Hemispherical Model 0.40 4.79
SPAD Blunt Model 0.35 14.37
Table 3-2: Comparative Lift/Drag Data @ 350 mph
Symmetry
Faces
Pressure
Outlet
Pressure
Inlet
SPAD
Body

KaZaK Composites SBIR Data Rights Protected under DFARS 252.227.7018
33
Chapter 4: Structural Analysis
After the aerodynamic analysis was completed, values regarding the loading of the nose cone
were resolved. From this loading data, structural analyses were able to be completed to
strengthen designs and prove their ability to resist these pressures. As each nose cone design is
fundamentally deferent from each other, they can not all be analyzed by employing the same
method. Tests have been selected in order to produce either comparable results or essential data
for each design type. Much like CFD, computer assisted engineering software can use Finite
Element Analysis (FEA) to provide numerical solutions to the mechanical environment. This
allows for models to be analyzed as to their physical strengths and weaknesses in the virtual
environment. As loads are introduced to a structure, FEA can calculate the resulting stresses and
deformations. By inputting material properties for each specific model, FEA can accurately
produce solutions providing necessary information about the design.
Three of the four designs were selected for a structural analysis. The design that was not selected
was the foam nose. This was because the material properties could not accurately be analyzed in
the FEA solver ANSYS, therefore the foam nose analysis was conducted in the experimentation
phase. The three designs that were selected were the Spring-Loaded Nose, the Inflatable Nose
and the Rubber Nose. The Spring-Loaded Nose is a rigid mechanical structure, so the benefits in
using FEA compared to bench-top testing are clear. Internal stresses and deformation effects can
easily be calculated using a numerical solver. The Inflatable Nose was not analyzed using FEA
but simply the inside pressure was resolved. The Rubber Nose was analyzed using FEA to
provide an initial design. Since the Rubber Nose is to be constructed out of a synthetic urethane

KaZaK Composites SBIR Data Rights Protected under DFARS 252.227.7018
34
rubber, the specific material properties are unknown and the numerical solver only provided
approximate solutions for deformation effects.
4.1 Spring-Loaded Nose
The aerodynamic analysis provided the loading distribution over the surface of the nose cone. A
constant 2.5 psi pressure over the entire nose cone surface was used in the Spring-Loaded Nose
cone analysis. A mission mode analysis was completed in order to prove the nose cone’s
viability as a design as well as a failure mode analysis to provide engineering margins of safety.
4.1.1 Mission Mode
For the mission specific variables such as pmax and F1 load, maximum deformation and
maximum equivalent stress have been evaluated via FEA. Acceptable maximum deformation has
been arbitrarily defined at 0.005”. Acceptable maximum equivalent stress has been arbitrarily
defined at 2,175 psi which provides a factor of safety of two.
Sections were first analyzed in the flow environment where they are only affected by the flow
pressures. This provided the necessary force information along the spring axis of the assembly
to properly size the wave spring. A break down of the axial forces by section is shown in Table
4-1 on the following page. Only section two through section four exert a force on the spring as
section one is supported directly by the base plate.

KaZaK Composites SBIR Data Rights Protected under DFARS 252.227.7018
35
Section Axial Force (lbf)
1 7.8542
2 9.8175
3 13.748
4 12.469
2-4 36.035
Total Assembly 43.7
Table 4-1: Axial Force at pmax
From this data a wave spring must be able to exert at least 36.035 lbf at the F1 position. A spring
was chosen to exert a 50 lbf. While the factor of safety is only 1.4 for the available spring force
to the force at pmax an oversized spring would result in an unnecessarily highly loaded system.
Sections were then analyzed for deformation effects and equivalent stress in the flow when it
would be affected by both the flow pressures as well as the force exerted by the load spring in
the F1 position. Table 4-2 shows the material parameters used to complete FEA calculations.
Young’s Modulus
Poisson’s Ratio
Density (ρABS)
Tensile Yield Strength (ABSY )
Operating Temperature Range
2.9008x10⁵
psi
0.394
3.685x10⁻²
lbm/in3
4351 psi
-180°F to 220°F
Table 4-2: Material Properties of ABS Plastic (ANSYS 2006)
Finite element analysis of the Sections, Figure 4-1 to Figure 4-8, show an exaggerated
representation with realistic numerical results of the distribution of both total deformation and
equivalent stress present in the above scenario.

KaZaK Composites SBIR Data Rights Protected under DFARS 252.227.7018
36
Figure 4-1: Deformation Distribution @ pmax & F1, Section1
Figure 4-2: Equivalent Stress Distribution @ pmax and F1, Section one

KaZaK Composites SBIR Data Rights Protected under DFARS 252.227.7018
37
Figure 4-3: Deformation Distribution @ pmax and F1, Section two
Figure 4-4: Equivalent Stress Distribution @ pmax and F1, Section two

KaZaK Composites SBIR Data Rights Protected under DFARS 252.227.7018
38
Figure 4-5: Deformation Distribution @ pmax and F2, Section three
Figure 4-6: Equivalent Stress Distribution @ pmax and F1, Section three

KaZaK Composites SBIR Data Rights Protected under DFARS 252.227.7018
39
Figure 4-7: Deformation Distribution @ pmax and F1, Section four
Figure 4-8: Equivalent Stress Distribution @ pmax and F1, Section four
The base plate was analyzed using a different method. With a spring selected and defined as 50
lbs in the F1 position and with dynamic pressure having little to no effect on the base plate,
analysis was completed to show total deformation and equivalent stress using only the spring
force as a load.

KaZaK Composites SBIR Data Rights Protected under DFARS 252.227.7018
40
Elastic Modulus
Poisson’s Ratio
Density (ρAA6061)
Yield Strength (6061AY )
Operating Temperature Range
10.2 x10⁶
psi
0.35
0.0975 lbm/in3
40,000 psi
-180°F to 220°F
Table 4-3: Material Properties, Aluminum A6061 (ANSYS 2006)
The material properties used to complete analysis of the base plate section are shown in Table
4-3. For analysis, the load was applied over the area in which the spring end occupies. The
supports, resisting the axial force, were positioned on the surface of each counter-bored screw
hole. The results, shown in Figure 4-9 and Figure 4-10, conclude that the base plate section
should be able to withstand the forces exerted on it for the duration of its mission as the
deformation and equivalent stresses are below minimums.
Figure 4-9: Deformation Distribution @ F1. Base Plate

KaZaK Composites SBIR Data Rights Protected under DFARS 252.227.7018
41
Figure 4-10: Equivalent Stress Distribution @ F1, Base Plate
4.1.2 Weight Saving Tradeoff
As stated in Section 2.1.6 the overall weight of the Spring-Loaded Nose is too heavy. 61% of this
mass must be removed without sacrificing substantial strength. FEA was used to produce
Material Removal vs. Strength Reduction curves in the form of deformation and stress increases.
Using these curves a maximum amount of material was able to be removed from certain sections
without compromising the structural integrity. Only sections 2-4 and the base plate underwent
this optimization as there was no excess of material to remove from section 1. Figures showing
the original and optimized geometries are shown in the appendix.

KaZaK Composites SBIR Data Rights Protected under DFARS 252.227.7018
42
Weight Saving Trade-off Study
0
5000
10000
15000
20000
25000
30000
35000
40000
0 0.020.04
0.060.08
0.10.12
0.14
Mass of Material Removed (lbs)
Eq
uiv
. S
tress (
psi)
0
0.005
0.01
0.015
0.02
0.025
0.03
0.035
0.04
To
tal
Defo
rmati
on
(in
)
Stress Deformation Moving Averages
Figure 4-11: Weight Saving Trade-off Study, Base Plate
Figure 4-11 shows the above stated relationship between material removed from the base plate to
the stress and deformation resultants. The data shows that as material is removed there is less
area to distribute the force and both the stress and deformation increase. There is a period where
material is continued to be removed and the stress and deformation seem to not increase by
much. It is the high end of this period where the maximum amount of material removed is
selected.
0.097 lbs was removed from the base plate section. That is a 43% reduction in part mass and an
overall assembly mass reduction of 17%.
Continuing with the trade-off study, section two was analyzed second. Material was sequentially
removed from the inside of the section. Sidewall thickness on the inside radius was kept at a

KaZaK Composites SBIR Data Rights Protected under DFARS 252.227.7018
43
constant of 0.05” and only the depth was changed. Four areas, symmetric about the center axis,
were where the material removal was focused.
Weight Saving Trade-off Study
0
200
400
600
800
1000
1200
1400
1600
1800
2000
0 0.005 0.01 0.015 0.02 0.025 0.03 0.035 0.04 0.045
Mass of Material Removed (lbs)
Eq
uiv
. S
tress (
psi)
0
0.002
0.004
0.006
0.008
0.01
0.012
To
tal
Defo
rmati
on
(in
)
Stress Deformation Moving Averages
Figure 4-12: Weight Saving Trade-off Study, Section two
Figure 4-12 shows the weight saving relationship for section two. Results show that material
removal has little to no effect on the overall strength of the section until 0.038 lbs of mass is
removed. At this point the well dug into the section has pierced the face of the opposing side.
Very quickly the section deforms under the newly created very high stress.
Creating a hole in the face of hemispherical face is not practical in the first place because of
undesirable aerodynamic effects; however, the trade-off study has shown that it also has
undesirable structural effects. Because of this, the depth of the well has been set at 0.55”, giving
plenty of clearance for the front face. This removes 0.029 lbs of material from the section. That

KaZaK Composites SBIR Data Rights Protected under DFARS 252.227.7018
44
is a 30% reduction in weight for the section and an overall 5% weight reduction for the
assembly.
Section three also underwent a weight optimization. Similar to section two, material was
removed from section three by the use of a well within the slide structure. However, since the
outside radius was constant for this section one continuous area was able to be removed.
Weight Saving Trade-off Study
0
100
200
300
400
500
600
0 0.005
0.010.015
0.020.025
0.030.035
0.040.045
0.050.055
0.06
Mass of Material Removed
Eq
uiv
. S
tress (
psi)
0
0.0005
0.001
0.0015
0.002
0.0025
0.003
To
tal
Defo
rmati
on
(in
)
Stress Deformation Moving Averages
Figure 4-13: Weight Saving Trade-off Study, Section three
Figure 4-13 shows the trade-off study for section three. Much like the previous section two, as
more material is removed from the slide portion of the section, the equivalent stress and total
deformation increase. This figure however shows a bump in the stress plot at 0.028 lbs of
material removed. At this point, enough material was removed to distribute the forces over less
of an area but not enough material was removed to let the section warp. Because of this stiffness

KaZaK Composites SBIR Data Rights Protected under DFARS 252.227.7018
45
and lack of material the stress plot spikes in this area. Ignoring this single effect, 0.045 lbs of
material removed was selected as the ideal value of mass.
Removing 0.045 lbs from section three is a 36% reduction. Overall this optimization reduced the
assembly mass by 8%.
The final section, section four, underwent an optimization as well. Being the smallest section
there was less material to remove, but an trade-off study was conclude to remove whatever
excess there was.
Weight Saving Trade-off Study
0
200
400
600
800
1000
1200
1400
0 0.005 0.01 0.015 0.02 0.025 0.03
Mass of Material Removed (lbs)
Eq
uiv
. S
tress (
psi)
0
0.001
0.002
0.003
0.004
0.005
0.006
0.007
To
tal
Defo
rmati
on
(in
)
Stress Deformation Moving Averages
Figure 4-14: Weight Saving Trade-off Study, Section four
Following the similar patterns of the previous sections, the results from the mass optimization
are shown in Figure 4-14. The results show an exponentially increasing total deformation while
equivalent stresses slowly increase as well. A mass of 0.019 lbs was chosen to be removed. This

KaZaK Composites SBIR Data Rights Protected under DFARS 252.227.7018
46
allowed for plenty of spring clearance, sidewall thickness as well as allowed for plenty of
material along the front face.
A 0.019 lbs mass removal is a 28% mass reduction for the section as well as a 3% reduction for
the entire assembly.
Section Original Weight (lbs) Optimized Weight (lbs) Percent Reduction
Base Plate 0.223 0.126 43%
Section 1 0.066 - 0%
Section 2 0.096 0.067 30%
Section 3 0.125 0.080 36%
Section 4 0.069 0.050 28%
Total 0.579 0.389 33%
Table 4-4: Summary of Weight Saving Optimization by Section
Through this optimization a total of 33% of the mass was removed. The system can still support
the required loads by not deforming significantly or failing. While the amount of material
removed was not enough to meet the required total mass of 0.36 pounds, no more material could
be removed without a complete redesign or possible failure of the structure.
4.1.3 Failure Mode
A failure mode analysis is a very simple way to improve a part design. Understanding at what
loading, what circumstance and where a part fails provides information on how to make that
specific part stronger, more durable and overall more useful to the system it is incorporated in.
Failure mode analysis also provides resultant margins of safety in part designs. Each part within
the Spring-Loaded Nose Cone assembly was evaluated using FEA to find failure points.
The first system to be analyzed was the screws that attach the base plate to section one. These
screws are to hold the force exerted by the compression spring when fully extended so their

KaZaK Composites SBIR Data Rights Protected under DFARS 252.227.7018
47
strength is critical to the assembly. 4-48 size screws are used Table 4-5 shows the screw
parameters.
#4-48 Screw
Effective Length 0.224”
Number of Threads per Inch 48
Major Diameter 0.112”
Number of Threads Engaged 10.8
Table 4-5: #4-48 Screw Parameters (Oberg 2000)
Equation 4-1 is used to find the thread stress area. This area is important because it is the
distribution of the load applied by the screw across the area of the material being screwed into. A
larger screw distributes a load across a larger area and thus decreases stresses (Hibbeler 2008).
2
9743.7854.
TPI
MTSN
DA
Equation 4-1: Thread Stress Area (Oberg 2000)
In this case, each screw needs to resist a minimum force of 12.5 lbf to counteract the spring.
Acceptable minimums were set at 25 lbf, giving a designed factor of safety of 2. Using results
from Equation 4-1, Equation 4-2 provides values for the force required to pull a screw from its
threads.
ETTSPO NAF
Equation 4-2: Pull-Out Force per Screw (Oberg 2000)
Given the parameters for a #4-48 screw and the material properties of ABS plastic, the thread
stress area was found to be 6.605x10⁻³
in2 leading to a screw pull-out force of 309 lbf. The
margin of safety provided by this screw design is 12.4.
The next failure analysis was directed at each individual section. FEA provides values
illustrating at what loading the sections would fail. Individual analyses were completed by

KaZaK Composites SBIR Data Rights Protected under DFARS 252.227.7018
48
applying increasing loads on the contact point where the spring force is applied as well as
increasing pressures on the outside surface geometry until failure. Table 4-6 shows the results of
these analyses.
Section Force to
Yield (lbf) Force to
Deformation (lbf) Pressure to
Deformation (psi)
1 560 275 23
2 900 600 55
3 625 450 90
4 375 200 70
Base Plate 430 -
Table 4-6: Spring-Loaded Nose Failure Mode Analysis Results
4.2 Inflatable Nose
The Inflatable Nose is not a rigid structure like the Spring-Loaded Nose. It is because of this fact
that it was not analyzed in the same fashion. The preliminary structural analysis of this nose cone
design was a simple proof of concept. As the design relied heavily on the use of off-the-shelf
components, the 12g CO2 cartridge was an integral part to the design. Therefore, the viability of
this component was analyzed.
The volume of C02 gas compressed in a 12g cartridge is a fixed value. Thus, when released all of
this volume is transferred to the inflatable structure. Pressures outside the inflatable reach 2.5 psi,
so the internal must be in moderate excess of this value. However, internal pressures can not be
too high as there would be a risk of blow out. Boyle’s Law states that 2211 VPVP , so the
following formula, Figure 4-3 on the following page, provides the pressure supplied to the
inflatable chamber after inflation.

KaZaK Composites SBIR Data Rights Protected under DFARS 252.227.7018
49
C
IV
P4200
Equation 4-3: Relationship between Pressure Inside of the Inflatable to the Volume Inside the
Inflatable due to a 12g CO2 Cartridge
The solution to Equation 4-3 results in a 152 psi internal pressure, well exceeding the 2.5 psi
pressure on the outside geometry. This pressure is simply too high. A typical car tire pressure is
only 32 psi. As the volume inside the nose cone is a fixed value, the compressed volume of the
CO2 cartridge must decrease for this concept to progress in design.
4.3 Rubber Nose
The Rubber Nose was the second model evaluated in the numerical solver. It was understood
from the conceptual phase that different types of rubber exhibit different material properties. As
there are various types of rubber, natural, vulcanized, urethane or silicone, the preliminary CAE
analysis was used to simply provide an approximation for the rubber nose cone geometry. As it
would have been expensive and time intensive to simply fabricate and test multiple nose cones
all with differing geometries, the approximate structural responses predicted in the solver
provided an element of speed of production that was needed.
Elastic Modulus 884.73 psi
Poisson’s Ratio 0.49
Density 3.613x10⁻²
lbm/in3
Tensile Yield Strength 1,339.7 psi
Table 4-7: Material Properties: Natural Rubber (ANSYS 2006)
In order to simplify the analysis the back was removed from the structure and just the nose cone
model alone was imported into the solver. A rubber material, shown in Table 4-7 and listed in
the ANSYS database, was selected for the material properties to be imported into the solver.

KaZaK Composites SBIR Data Rights Protected under DFARS 252.227.7018
50
While it was known that the material properties of this rubber would not be exactly the same as
the materials used in the fabrication stage it provided a general solution. A thick tip and base
structure were incorporated to produce different compressive effects. The thickness of the nose
cone side-wall was successively changed until results were as desired. It was found that adding a
reinforced circular mass in the front of the nose cone resulted in a very symmetrical compression
under applied operational loading. It was also found that building up mass from the base to a
certain height of the rubber nose encouraged the buckling at certain position. ANSYS predicted
that a 0.1 inch thick sidewall would produce the proper deformation and buckling effects in the
rubber nose.
Figure 4-15: Rubber Nose Cone Model Cross-Section
Figure 4-16: ANSYS Predicted Compression of Rubber Nose @ 40 lbs
sidewall
thickness
Reinforced tip

KaZaK Composites SBIR Data Rights Protected under DFARS 252.227.7018
51
Chapter 5: Fabrication and Experimentation
In order to form a more complete analysis of the nose cone designs there was a fabrication and
experimentation phase. This allowed for designs to be physically tested in the bench-top
environment as to their reactions to load forces and/or conformity to numerical predictions. The
spring-loaded cone was not one of these candidates. Due to time constraints and cost of
production, a spring-loaded nose cone was not a candidate for bench-top testing as the FEA
performed in Chapter 6 provided sufficient results. The inflatable nose was also not fabricated. It
was found that the excess of internal pressure and the shear complexity of the design hampered
the ability to construct a prototype model. The two remaining designs, the rubber nose and the
foam nose, were the two models that were fabricated. Since the conceptual phase it was known
that the specific material properties of solid rubber and foam rubber were variables that needed
to be solved. The fabrication and experimentation phase allowed for these last two designs to be
thoroughly analyzed.
5.1 Fabrication
The rubber nose and the foam nose were constructed using similar methods. First a mold of the
outside surface of the nose cone was constructed. Shown in Figure 5-1 on the following page, the
base model contained the outside geometry of the nose cone at a 2.364” radius.
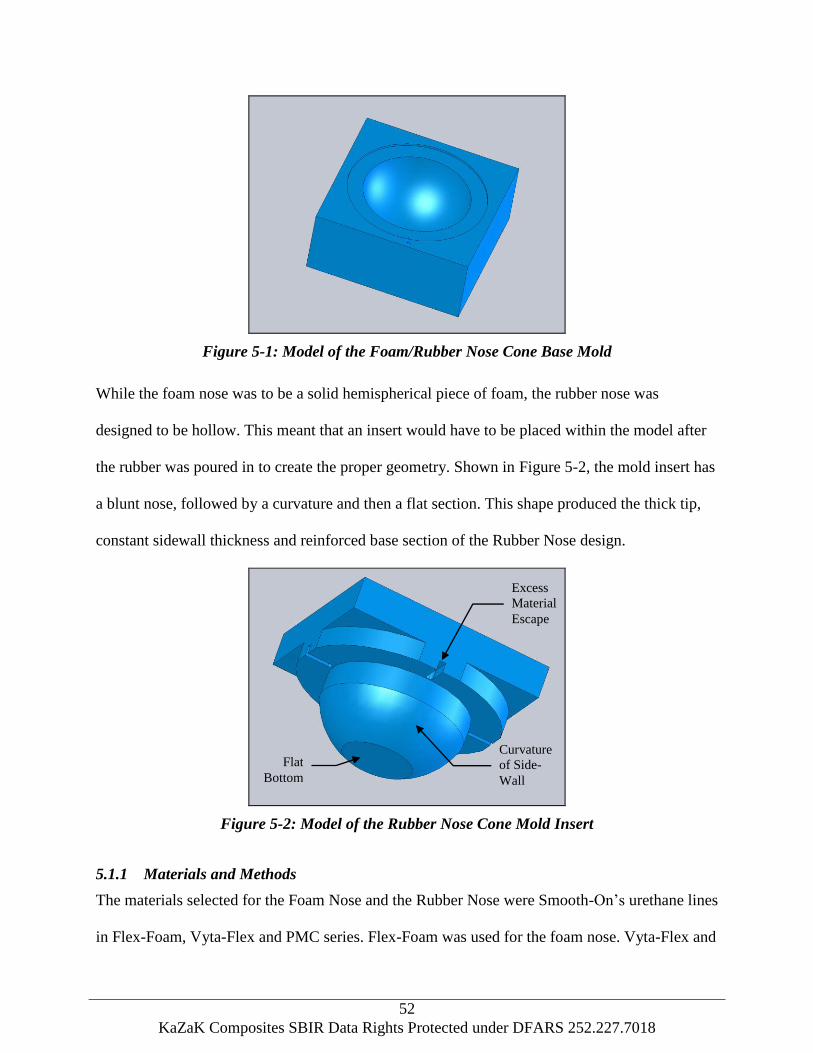
KaZaK Composites SBIR Data Rights Protected under DFARS 252.227.7018
52
Figure 5-1: Model of the Foam/Rubber Nose Cone Base Mold
While the foam nose was to be a solid hemispherical piece of foam, the rubber nose was
designed to be hollow. This meant that an insert would have to be placed within the model after
the rubber was poured in to create the proper geometry. Shown in Figure 5-2, the mold insert has
a blunt nose, followed by a curvature and then a flat section. This shape produced the thick tip,
constant sidewall thickness and reinforced base section of the Rubber Nose design.
Figure 5-2: Model of the Rubber Nose Cone Mold Insert
5.1.1 Materials and Methods
The materials selected for the Foam Nose and the Rubber Nose were Smooth-On’s urethane lines
in Flex-Foam, Vyta-Flex and PMC series. Flex-Foam was used for the foam nose. Vyta-Flex and
Flat
Bottom
Excess
Material
Escape
Curvature
of Side-
Wall

KaZaK Composites SBIR Data Rights Protected under DFARS 252.227.7018
53
PMC were used for the rubber nose. As each of these products are not marketed by publicizing
material properties such as elastic modulus or Poisson’s ratio but instead present hardness,
density and elongation at break; two foams and three rubbers were chosen to test out in the lab
environment. Each of these materials are shown in Table 5-1.
Density (in3/lb) Hardness (Shore A) Elongation at Break
FlexFoam V 275-300 - -
FlexFoam X 150-200 - -
VytaFlex 50 - 50A 400%
VytaFlex 60 - 60A 480%
PMC-780 - 80A 700%
Table 5-1: Material Properties of Smooth-On Products (Reynolds Advanced Materials 2008)
Each urethane nose was fabricated. The foam material was simply poured into the mold of the
outer geometry. The rubber material was poured into the base mold and the insert was placed
inside. After the published cure time had elapsed each nose was removed from the mold. As
prematurely testing the molded parts can yield inconsistent material properties cure time was
strictly adhered to.
It was very quickly found that the ANSYS prediction for the geometry of the rubber nose was
incorrect. This was due to the generalization assumed in Chapter 4: that each urethane rubber
would have similar material properties to natural rubber. A 1” thick sidewall produced a very
weak structure and it was obvious that this structure would not be able to withstand the pressures
encountered in flight. As the nose cone molds had already been fabricated and time was of the
essence, new molds could not be produced. For this reason a simple solution was employed.
Since the mold insert produced the tip thickness and sidewalls for the rubber nose, it was elected
that simply lifting the insert out of the base mold with the curing rubber inside would produce
thicker sidewalls. While this method created a variable sidewall thickness and a much thicker tip

KaZaK Composites SBIR Data Rights Protected under DFARS 252.227.7018
54
it produced much a stronger structure. Four different rubber noses were fabricated in this
manner. Figure 5-3 shows their geometries.
(a)
(b)
(c)

KaZaK Composites SBIR Data Rights Protected under DFARS 252.227.7018
55
(d)
Figure 5-3: Cross-Section Sketches for Each Rubber Nose Fabricated. (a) The VytaFlex 50
lifted 0.5" (b) The VytaFlex60 lifted 0.2” (c) The VytaFlex60 lifted 0.6" and (d) The PMC-780
with no lift.
5.2 Experimentation
Once the rubber nose and foam nose models were finished curing, there were two foam and four
rubber noses to test in the lab environment. The foam nose analyses focused on the ability of the
foam to rebound after a state of compressed storage as well as the ability to retain original
geometry under loads. The rubber nose analyses focused on increasing the accuracy of the results
produced using ANSYS in the ability to resist deformation under loading and the designed
ability to buckle. This was in order to produce the final rubber nose design, able to withstand the
pressures of flight and forces for storage, to be fabricated and tested.
5.2.1 Foam Nose
The foam in the Foam Nose is comprised of many open cell urethane foam pockets. It is the
material nature of these foam pockets to compress and stretch; the operation of the foam nose is
based on this fact. However, this random structuring also causes foam to randomly fail. When
compressed this causes an inability to rebound to an original geometry. Severe inability to
rebound would render a foam nose useless as a viable option as a nose cone. In order to test the

KaZaK Composites SBIR Data Rights Protected under DFARS 252.227.7018
56
ability of the foam to rebound under compressive forces compression set testing was undertaken.
Compression set testing compares the original geometry of the foam to the post-compressed
geometry of the foam. This yields a compression set value in the form of a percentage.
Compression testing was also employed to resolve the force versus deflection curves for each
foam density. FEA was not conducted with the Foam Nose due to the fact that after an
exhaustive search no procedure was found in order accurately model the hyperelastic responses
of foam.
5.2.1.1 Experimental Procedure
Figure 5-4 shows the apparatus used in the compression set testing of the foam. The four screws
provided the ability to uniformly compress each foam nose cone to a desired compressed length.
A height of 1.125”, the available area provided by the SLT, was used as the hold height for the
rebound tests.
Figure 5-4: Foam Compression Set Testing Apparatus
Compression set testing was conducted in order to resolve time to rebound and completeness of
rebound. As there is a projected five year shelf life in which the nose cone would be required to
Test
Cone
Test
Apparatus

KaZaK Composites SBIR Data Rights Protected under DFARS 252.227.7018
57
be held it its compressed state viability of design for this period of time must be confirmed. The
nose cone must rebound to the designed geometry within the short period of time when SPAD is
ejected from the SLT. The compression set tests were conducted at two separate temperatures to
also test the operational temperature range of the foam. The first test was conducted with the
foam held overnight at 70°F. The foam was then released from the test apparatus and the
rebound height was measured at 20 second increments. This method was duplicated after holding
the foam over night at 0°F.
Figure 5-5: Foam Vertical Compression Test Apparatus
The force to deflection curves were resolved by employing a different method. Forces were
applied to the nose cone along its center axis and deformation was measured at particular weight
increments. Figure 5-5 shows the test apparatus. A Carver 2’x2’ Laboratory Press was used to
apply the vertical loading. An Omegadyne, Inc. LCHD-3K load cell, rated from 0-3,000 lbs, was
used to measure the applied load. Vertical displacement measurements were displayed on the
MHC Industrial Supply gauge.
Load
Cell
Displacement
Gauge
Test
Cone
Load Cell
Display

KaZaK Composites SBIR Data Rights Protected under DFARS 252.227.7018
58
5.2.1.2 Results
The compression set testing for the foam noses yielded the foam rebound curves shown in Figure
5-6.
Foam Rebound
60.0
65.0
70.0
75.0
80.0
85.0
90.0
95.0
100.0
0 100 200 300 400 500 600 700 800
Time (s)
Pe
rcen
t R
eb
ou
nd
He
igh
t
FrozenFoam V FrozenFoam X FoamNose V FoamNose X
Figure 5-6: Time to Rebound of Frozen and Room Temperature Foams
Both the frozen and room temperature foams recover at least 95% of their original height by 6
minutes of elapsed time. As can be seen in the figure, the frozen foams took longer to rebound
than their room temperature models. This can partly be attributed to the moisture, held within the
open cell structures of the foam, freezing and holding the foam in its compressed state. While the
room temperature foam exhibited an almost full rebound instantly, the foam could not be used
successfully within the lower temperature ranges of operation as the rebound time is
substantially long.

KaZaK Composites SBIR Data Rights Protected under DFARS 252.227.7018
59
The force to deflection curves are shown in Figure 5-7. At 40lbs, the approximate flight loading,
the foam height was compressed to 50% of its original dimension
Force to Percent Deflection Curves
0.0
10.0
20.0
30.0
40.0
50.0
60.0
0.00 10.00 20.00 30.00 40.00 50.00
Force (lbs)
Perc
en
t D
isp
lacem
en
t
FoamNose X Foam Nose V
Figure 5-7: Force to Deflection Curve for Foam Noses
This means that foam with a greater density must be used in order to resist deformation when
flight loads are applied.
5.2.2 Rubber Nose
The rubber nose cones were analyzed in the bench-top environment. Unlike the foam noses, the
rubber noses were examined physically in conjunction with FEA. Since the concept of the rubber
nose was introduced it was known that the unknown specific material properties of synthetic
urethane rubbers used in this application would yield physical results inconsistent to the FEA
results of natural rubber. For this reason, these analyses attempted to improve the accuracy of the
FEA model in order to aid in the production of the final rubber nose geometry.

KaZaK Composites SBIR Data Rights Protected under DFARS 252.227.7018
60
5.2.2.1 Experimental Procedures
The analysis performed in Section 4.3 yielded results inconsistent with the physical model from
section 5.1.1. These inconsistencies were due to the fact that the natural rubber was the material
used to model the deformation effects of the urethane rubber noses. While it was assumed these
two different materials would have similar material properties, that assumption was proven
wrong in the fabrication stage. It was because of this that the first priority in the bench-top
testing of the rubber nose was to improve the FEA model to accurately produce results for
deformation effects concurrent with those of the physical tests. This was carried out by first
bench-testing the five rubber nose cones in controlled tests. These tests produced force to
deflection curves. Shown in Figure 5-8 is the test apparatus. Loads were applied by the Carver
2’x2’ Laboratory Press. An Omegadyne, Inc. LCHD-3K load cell provided the force
measurements while a MHC Industrial Supply gauge measured the displacement.
Figure 5-8: Vertical Compression Test Apparatus
This provided a similar and measurable loading environment to the numerical model resulting in
a similarly measured displacement result. Force measurements were recorded in a table for every
Load
Cell
Displacement
Gauge
Test
Cone Load Cell
Display

KaZaK Composites SBIR Data Rights Protected under DFARS 252.227.7018
61
0.1” of deformation. This data was then used to properly model each material in ANSYS. A
comparable environment was created within the virtual model in which loads were applied over a
controlled area 1” in radius to the top of the nose cone. The material properties were changed in
accordance with a material datasheet found for urethane materials of 50A, 60A and 80A
hardness shown in Table 5-2.
Shore A Hardness Modulus of Elasticity (psi)
50A 100
60A 300
80A 1000
Table 5-2: Material Properties of Urethane Rubber (Harkness Industries 2006)
At each force recorded from the bench-top test, the numerically solved deformation was
compared with the physical test. With the addition of the material properties of each specific type
of urethane rubber nose, the ANSYS model accurately represented the physically recorded
deformation.
The first analysis provided ANSYS with the required data to make its FEA solutions accurate.
The second analysis used this, now correct, solver to design the ideal geometry for the rubber
nose cone. The original design method was modified to fit the new rubber nose shape. Variables
were attached to the sidewall thickness, base height and tip thickness. Changing the values of
each of these resulted in very different effects. Increasing the size of the tip feature created a
larger area that did not buckle and held rigidity. Increasing the height of the thicker base raised
the height of the point at which the structure buckles. Modifying a combination of these variables
produced a numerical solution to the rubber nose cone structure that buckled when 50 lbs was
applied in a manner that was not disturbed the SLT geometry.

KaZaK Composites SBIR Data Rights Protected under DFARS 252.227.7018
62
5.2.2.2 Results
The bench-top compression tests yielded results for a compressive force versus deformation
curve. Each nose cone yielded very different results. This can be attributed to the varying nose
cone geometries as well as the material properties of the different urethanes. These results are
shown in Figure 5-9. The data shows that the PMC-780 is the ideal material for the rubber nose
cone as it holds rigidity up to about 50 lbs where it then fails structurally and collapses. This is
ideal as the structure can remain rigid for flight and then compress for storage at a minimal force
of 50 lbs applied to the tip.
Deformation Curves
0
0.2
0.4
0.6
0.8
1
1.2
1.4
1.6
1.8
2
0 50 100 150 200 250 300
Force (lbs)
Dis
pla
ce
me
nt
(in
)
VF50-.5 PMC-780-0 VF60-.6 VF60-.2
Figure 5-9: Force to Deform Curves for Each Rubber Nose Cone
The next best nose cone designs are the VytaFlex 50 lifted 0.5” and the VytaFlex 60 lifted 0.2”.
Each of these nose cones held geometry up to about 45 and 55 lbs respectively and then failed
structurally. The VytaFlex 60 lifted 0.6” is the clear underperformer of this test by holding
structural strength indefinitely. While the ability to not deform significantly is a requirement, the

KaZaK Composites SBIR Data Rights Protected under DFARS 252.227.7018
63
results for the VytaFlex 60 lifted 0.6” are undesirable as a nose cone that does not deform could
not pack within the available geometry of the SLT. Deformations only occur in this nose cone
through material, not structural, deformation. Through the results shown in the previous figure
alone it would appear that the ideal material is the PMC-780 nose cone. However, it was found at
removal from the test apparatus that the nose cone material had failed. Shown in Figure 5-10 are
the spider cracks that formed as a result of the compression test. While it was published that this
material had the ability to elongate to 700% its original length before failing, it is clear that the
PMC-780 cannot be considered a possible material to be used in the nose cone design for its high
risk of material failure.
Figure 5-10: Failure of the PMC-780 Rubber Nose Cone
For the above reason, the next best performing material, VytaFlex 60, was selected as the
material to construct the final rubber nose from. Shown in Figure 5-11 on the following page is
the ANSYS model next to the bench-top model for the VytaFlex 60 urethane nose. After the
incorporation of the correct material properties for 60A hardness urethane rubber into the
numerical solution, numerically predicted results correlated with physical test results. When

KaZaK Composites SBIR Data Rights Protected under DFARS 252.227.7018
64
loaded with approximately 40 lbs the physical model deflected 0.700” while the ANSYS model
deflected 0.730” As these two methods produced the same result it was decided that the
numerical model was now correct in its solution.
(a) (b)
Figure 5-11:(a) The physical model is subjected to a 41.21 lbf load and deforms 0.700". (b)
The ANSYS model is subjected to a 40.00 lbf load and deforms 0.730"
Once the numerical model was producing proper solutions, rubber nose cones of differing
geometry were able to be examined in ANSYS for their reactions to loading. The end product of
this method produced a nose cone whose geometry is shown in Figure 5-12.

KaZaK Composites SBIR Data Rights Protected under DFARS 252.227.7018
65
Figure 5-12: Sketch of Finalized Rubber Nose Geometry
Values were resolved through numerical analysis. The increase in material at the base to a height
of 0.86” provided the location of the buckle to not push rubber material out in the radial direction
but in the axial direction. This was so the nose cone would not get stuck within the limited radius
provided by the SLT. The thickened tip provided a uniform collapse. A 1.23” radius nose tip was
chosen for strength purposes; any greater of a radius and the nose cone would not buckle at the
designed load of 50 lbs, any smaller radius resulted in the buckle to form at a loading below 50
lbs.

KaZaK Composites SBIR Data Rights Protected under DFARS 252.227.7018
66
Chapter 6: Summary and Recommendations
The aim of this qualifying project was to create a viable design for the nose cone of the SPAD
vehicle. Mission requirements dictate that the nose cone be compressed while in an extended
state of storage and then extend for the flight phase. Four fundamentally separate designs were
conceptualized for the purpose of eliminating poor concepts and strengthening strong concepts.
The concepts considered were: 1) the spring loaded nose; 2) inflatable nose; 3) rubber nose; and
4) foam nose. Extensive testing was performed on each design concept. Each method of analysis
emphasized the comparable strengths and weaknesses of the four nose cone designs. Though the
scope of the project was limited from the beginning by the 10-week time constraint, during this
period of time, intensive design, fabrication and analyses took place. Despite the best efforts put
forth, several aspects of the four designs remain untested and underdeveloped. This section will
comment on a few of these areas and make recommendations to proceed.
6.1 Spring-Loaded Nose Cone
The Spring-Loaded Nose Cone design concept was to create a rigid structure that could fit the
required geometry while in flight and then collapse in on itself for storage. The structure of this
device was intensely analyzed within ANSYS. These analyses showed that the spring-loaded
nose could withstand the pressures of the flight environment very well and collapse to fit within
the required area. However, a prototype model was not constructed due to the time constraints.
Stereolithography (SLA) was evaluated as a method of construction. SLA could produce
accurate ABS prototype models. In order to fully examine the spring-loaded design, a prototype
must be made to prove that there are no undesirable effects contained within the sliding
mechanism.

KaZaK Composites SBIR Data Rights Protected under DFARS 252.227.7018
67
6.2 Inflatable Nose
The design of the inflatable nose was based on two main goals. The first was the creation of a
zero-stress storage environment. The second was that the components would be, for the most
part, off-the-shelf and readily purchased from distributors. While the design seemed complex,
prior proof was found of the pressure bottle piecing mechanism as well as the pressure switch.
The main drawback to this design was that the pressure bottle simply contained too much
pressure. A smaller volume pressure bottle that provides the proper pressure within the nose
chamber is needed to make the inflatable nose a potential candidate for application on the SPAD.
After a search for a smaller volume pressure bottle, no solution could be found and any attempt
to further the inflatable nose design was disbanded.
6.3 Rubber Nose
The Rubber Nose design concept was to create a ductile structure that could retain a designed
geometry for flight and then collapse for storage. The design was exhaustively tested for its
compression and rebounding capabilities. It was found that the structure responded very well
when flight loads were applied. It was also found that the forces required to pack the rubber nose
were very desirable. However, all these tests were conducted with the base of the rubber nose
removed. As the base is adhered to the cone section by the curing urethane alone, pull out tests
must be conducted to prove that the base of the rubber nose can withstand forces it will
encounter while in service. While the nose section of the rubber nose proved to be a very
desirable option for use on SPAD, the base of the rubber nose must be analyzed to consider the
rubber nose examined completely.

KaZaK Composites SBIR Data Rights Protected under DFARS 252.227.7018
68
6.4 Foam Nose
The Foam Nose was to be the simple solution. The elastomeric capabilities of foam were to
create a solid structure that could collapse in on itself. The design was thoroughly analyzed in the
bench-top environment and produced very undesirable results. It was found that the foam
densities selected deformed greatly when small pressures were applied. This deformation is
unacceptable while in flight. The foam noses also could not rebound to their original geometry
after a 24 hold time. Because of this, the ability to rebound at all after a 5 year hold period was
called into question. Since the foam nose cannot hold the required geometry, pack within the
proper dimensions or rebound fully after compression it is recommended that the foam nose not
be employed as a design solution for the SPAD nose.
6.5 Conclusion
The data acquired in the analyses of each nose cone concept clearly presents definite rejections
and possible candidates for application as the SPAD nose cone. The Inflatable Nose and the
Foam Nose are the two designs concepts in which enough cause was found to not pursue as
viable options. Since the volume of the pressure bottle was very quickly found to be in great
excess of the requirements, for time management purposes the inflatable nose analysis ended.
For that reason, no further analysis took place and recommendation cannot be given to use a
system which has not been tested in full. The Foam Nose however, was exhaustively tested. The
compression set results and the force to compress results show that this design could not
successfully be used as the SPAD nose as the rebound time is too long and the rebound geometry
does not match the design geometry. The Sping-Loaded Nose would be a very desirable option
as it fits all of the required design criteria. However, due to its multiple parts the cost of
production of each of the components must be reduced in order to make it the best design option.

KaZaK Composites SBIR Data Rights Protected under DFARS 252.227.7018
69
The design concept which best conforms to the design requirements is the rubber nose. Its
simplistic design creates an inexpensive component for SPAD that data shows can resist the
pressure of flight and still compress for storage. It is because of the above conclusions that the
Rubber Nose is recommended for further development as the SPAD nose cone.

KaZaK Composites SBIR Data Rights Protected under DFARS 252.227.7018
70
Acronyms
SPAD – Sonobuoy Precision Aerial Delivery
ADV – Air Delivery Vehicle
ASW – Anti-Submarine Warfare
SBIR – Small Business Innovation Research
R&D – Research and Development
SBA – Small Business Administration
RADAR – RAdio Detection and Ranging
SONAR – SOund Navigation and Ranging
SLT – Sonobuoy Launch Tube
CONOPS – Concept of Operations
MPH – Miles per Hour
CFD – Computational Fluid Dynamics
FEA – Finite Element Analysis
KCI – KaZaK Composites, Incorporated
GPS – Global Positioning System
PSI – Pounds per Square-Inch
CAE – Computer Aided Engineering

KaZaK Composites SBIR Data Rights Protected under DFARS 252.227.7018
71
Appendix
Navier-Stokes Equations (Anderson 2007)
zyxx
p
z
uw
y
uv
x
uu
t
u zxyxxx1
Momentum in the x-Direction
zyxy
p
z
vw
y
vv
x
vu
t
v zyyyxy1
Momentum in the y-Direction
zyxz
p
z
ww
y
wv
x
wu
t
w zzyzxz1
Momentum in the z-Direction

KaZaK Composites SBIR Data Rights Protected under DFARS 252.227.7018
72
Shear Stress Equations for Fluid Flow (Anderson 2007)
y
u
x
vyxxy
z
v
y
wzyyz
x
w
z
uxzzx
x
uxx 2V
y
vyy 2V
z
wzz 2V

KaZaK Composites SBIR Data Rights Protected under DFARS 252.227.7018
73
References
Anderson Jr., John D. (2007). Fundamentals of Aerodynamics. (4th
ed.). New York: McGraw
Hill.
ANSYS, Inc. (2006). ANSYS Mechanical (Release 11.0) [Computer Software]. Canonsburg, PA:
ANSYS, Inc..
Harkness Industries, Inc. (2006). Urethane Products Selector Guide. Retrieved July 22, 2008,
from: http://www.harknessindustries.com/pdfs/Product_Guide.pdf
Hibbeler, R.C. (2008). Mechanics of Materials (7th
ed.). Upper Saddle River: Pearson Prentice
Hall.
Oberg, Erik, F. D. Jones, & H.L. Horton (Eds.). (2000). Machinery’s Handbook (26th
ed.). New
York, NY: Industrial Press Incorporated.
OPNAV (September 1998). Approved Navy Training System Plan for the Navy Consolidated
Sonobuoys (N88-NTSP-A-50-8910B/A). United States: U.S. Government Printing
Office.
Pope, Alan. (1966). Wind-Tunnel Testing (2nd
ed.). United States of America: John Wiley &
Sons, Inc.
Raymer, Daniel P. (2006). Aircraft Design: a Conceptual Approach (4th
ed.). Reston: American
Institute of Aeronautics and Astronautics, Inc.
Reynolds Advanced Materials. (2008). Everything You Need for Mold Making & Casting.
Schlichting, Dr. Hermann. (1968). Boundary-Layer Theory (6th
ed.). United States of America:
McGraw Hill.
United States Office of the Joint Chiefs of Staff (2001). Joint Doctrine for Amphibious
Operations (JP-3-02). United States Navy.