sp16 sibc bain project final presentation
TRANSCRIPT

Spring 2016 Bain & Company Project
On Amazon’s Future Growth Potential
April 22nd, 2015

The Team
Ella Fennelly
Freshman
Business & Spanish
Chang Woo Jung
Sophomore
IT Management &
Chinese
Juan Pablo Borrero
Sophomore
Mathematics &
Actuarial Science
Jiayi Chen
Freshman
Accounting &
Economics
Laura Dillon
Sophomore
Mechanical
Engineering & ACMS
Jiale Hu
Freshman
Accounting & PoliSci
Dylan Naylor
Freshman
Accounting
Erica Siatczynski
Sophomore
IT Management
Gregory Trinkl
Sophomore
Accounting
2

3
Executive Summary
Client
•Amazon is the leading e-commerce and online auction service provider in the United States, currently adding various businesses in its portfolio to secure its future growth opportunities
Situation
•The company occupies several key businesses in a variety of industries including delivery service, web services, and media
•The company’s cost structure prevents Amazon from recovering its profit from variable expenses, raising a need for new revenue stream
Recommendation
•Amazon should enlarge its SVOD service with Prime Instant Video as a strategically aligned opportunity with high profit potential
•Amazon should do so by expanding within the Mexican market to maximize the synergy with its Prime membership model
4
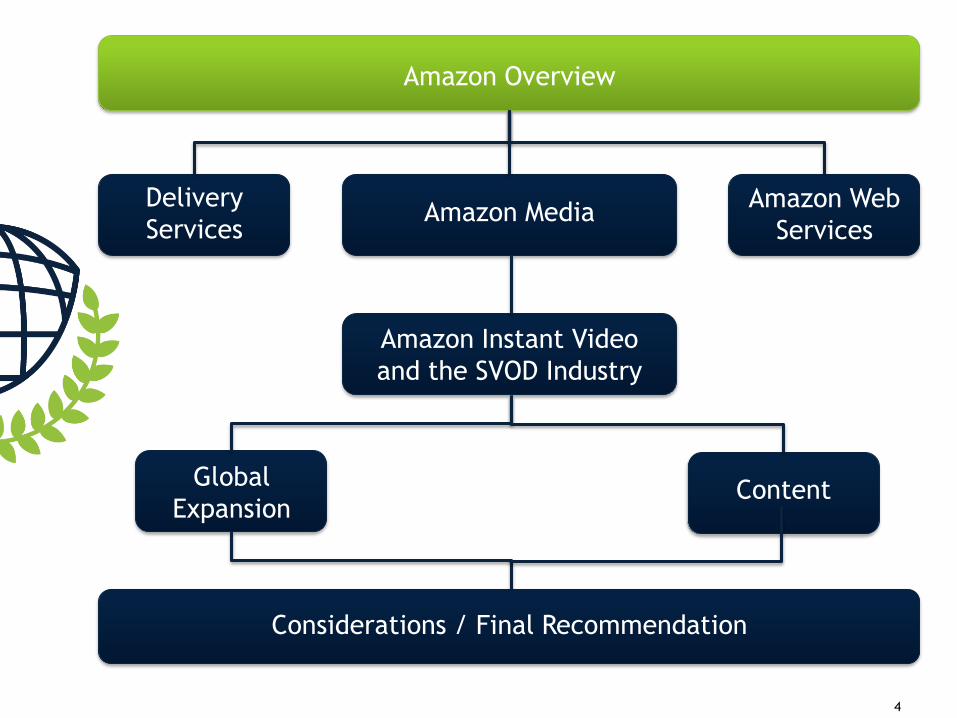
Amazon Overview
Delivery
ServicesAmazon Web
ServicesAmazon Media
Global
ExpansionContent
Considerations / Final Recommendation
Amazon Instant Video
and the SVOD Industry

Amazon, Yahoo Finance, Morning Star, Forbes
Amazon is recognized as a leading e-commerce company
with high growth potential
Amazon Key People
5
ChallengesCore Competencies
Jeffrey
Bezos
Founder &
CEO
Brian
Olsavsky
CFO
Jeffrey
Blackburn
Senior VP
Diego
Piacentini
Senior VP
Amazon has a high growth potential due to its innovative leaders and strong industry presence.
Founded in 1994 E-commerce company
High growth potential
company
Sells wide range of
consumer products
Investment mode prevents high profits
Low Gross Margin
Expenses overly dependent on fuel prices
Variable Delivery Costs
Must determine next profit generation model
Need of New Growth Vehicle
Reputation and name
recognition
Online customer
experience
Wide variety of products
and services
Investing in innovative technology
Amazon, Statista
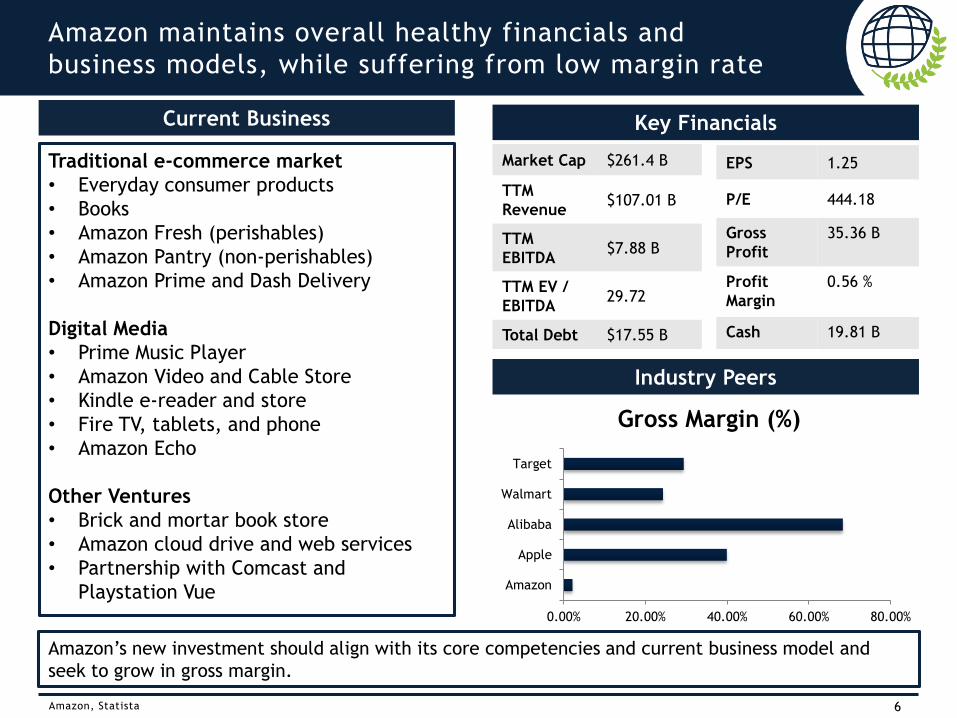
Amazon maintains overall healthy financials and
business models, while suffering from low margin rate
6
Amazon’s new investment should align with its core competencies and current business model and
seek to grow in gross margin.
Industry Peers
Current Business
Traditional e-commerce market
• Everyday consumer products
• Books
• Amazon Fresh (perishables)
• Amazon Pantry (non-perishables)
• Amazon Prime and Dash Delivery
Digital Media
• Prime Music Player
• Amazon Video and Cable Store
• Kindle e-reader and store
• Fire TV, tablets, and phone
• Amazon Echo
Other Ventures
• Brick and mortar book store
• Amazon cloud drive and web services
• Partnership with Comcast and
Playstation Vue
Key Financials
Market Cap $261.4 B
TTM
Revenue$107.01 B
TTM
EBITDA$7.88 B
TTM EV /
EBITDA29.72
Total Debt $17.55 B
EPS 1.25
P/E 444.18
Gross
Profit
35.36 B
Profit
Margin
0.56 %
Cash 19.81 B
0.00% 20.00% 40.00% 60.00% 80.00%
Amazon
Apple
Alibaba
Walmart
Target
Gross Margin (%)

Statista, Motley Fool, Amazon
Amazon’s growth rate has declined in recent years,
along with its lead over competitors
Situation
Analysis
7
Recommendation
An investment outside of the retail industry would create revenue growth for Amazon without a
dependency on its declining traditional e-commerce business.
• Amazon has grown at an high rate, but in
recent years, this rate has decreased
• Other companies have entered the e-
commerce market, closing the gap Amazon
had over competitors
• Amazon’s next investment should be
somewhere other than traditional e-
commerce business
26%
39%
29% 28%
40% 41%
27%22% 20% 20%
0%
10%
20%
30%
40%
50%
2006 2008 2010 2012 2014
Year Over Year Revenue Growth
0%
20%
40%
60%
2006 2007 2008 2009 2010 2011 2012 2013 2014
Amazon vs. U.S E-Commerce Growth Rate
U.S. E-Commerce Growth
Amazon E-Commerce Growth
Non-retailLow
variable costs
Immediate revenue boost

8IBIS World
The new investment strategy should concentrate more
on the revenue growth rather than cost-saving measures
3.4
8.9
71.4
0.8 1.64.6
9.3
0%
10%
20%
30%
40%
50%
60%
70%
80%
90%
100%
Cost Structure of e-Commerce Industry
Other
Rent &Utilities
Marketing
Depreciation
Purchases
Wages
RemainingProfit
•Amazon is basically an online auction, thus little saving opportunity in purchases
•Amazon’s need for quick delivery (Pantry/ Fresh/Dash) requires high rent and utilities and shipping fees
•Local service centers and warehousesincrease annual depreciation
Weak Pursuits for Amazon
•Should sell products that require minimal…
-Delivery cost
-Physical facilities
-Additional marketing
• New growth driver should retain high contribution margin by minimalizingvariable and fixed expenses
Strong Pursuits for Amazon
Amazon needs to create a new
revenue stream, which can leverage
profit generation.
9
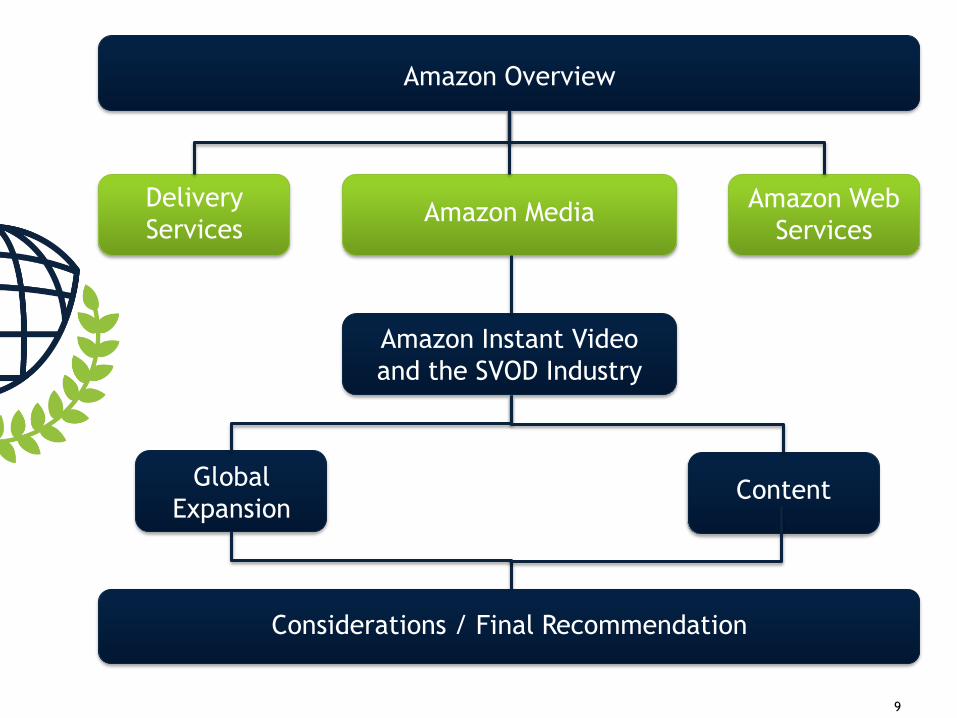
Amazon Overview
Delivery
ServicesAmazon Web
ServicesAmazon Media
Amazon Instant Video
and the SVOD Industry
Global
ExpansionContent
Considerations / Final Recommendation

10The Wall Street Journal, The Seattle Times, IBIS World
Investment in delivery service will force Amazon to
compete without enough infrastructure
Expanding its own delivery service in the long run would reduce operational costs; however, Amazon is not posed to
compete with the highly efficient US postal systems that are highly capital intensive with their vast networks.
International Expansion InitiativesAmazon’s Lack of Resources
Amazon Delivery Service
Past acquisitions
• Colis Privé: French parcel delivery company. Purchased 25% stake, now buying the rest.• Yodal: United Kingdom parcel-delivery company. Acquired the right to purchase 4.2%•Currently, negotiating to lease 20 Boeing 767 cargo jets
Benefits
• Establish customer network
• Optimize logistics
• Reduce operational costs
•Tame delivery expenses and rates
•Avoid logistics and communication difficulties between Amazon and delivery companies
UPS Inc, FedEx Corp, and the U.S. Postal Service deliver
the majority of Amazon’s packages.
35%
30%
17%
18%
U.S. Postal Service
UPS
FedEx
Regional shippers
•FedEx plans to spend an additional $4.6 billion on their network
•FedEx spent $10.8 billion on operational activity last year
Capital Intensity
•The major delivery companies have years of expertise on route efficiencies that Amazon would have to build
Information Intensity
8%
10%
12%
14%
16%
20121Q
20122Q
20123Q
20124Q
20131Q
20132Q
20133Q
20134Q
20141Q
Ratio of Shipping Cost to Total Revenue

11
Investment in web services does not provide enough
room for revenue growth
Drawbacks of Investing in AWS
AWS In Pole Position of the Market
The Seattle Times; Forbes ; TechRepublic; TechCrunch; Federal Reserve Bank
Due to AWS’s currently strong position and the Business-to-Business focus of the cloud computing industry, immediate
revenue growth or cost reduction is not likely.
Amazon
Google App Engine
Microsoft Azure
Rackspace Cloud
3Tera
RightScale
Joyent
0% 20% 40% 60%
Cloud Computing Market Penetration
1. AWS already dominates the cloud computing industry.
2. Entrenched market.
3. Possibility of businesses developing their own cloud services.
4. Risk and uncertainty associated with the boom and bust nature of the technology industry.
5. Rising threat of cyber crime.
6. Increased regulation on the horizon.
Cloud Computing Industry: 3 Models
• Hosts applications for customers
Software As a Service
• Underlying framework for customers applications
Platform As Service
• Host third party hardware for client applications
Infrastructure as a Service

12Amazon
Amazon Prime’s diverse benefits can generate alternative
spending for various offerings through subscription
•On eligible items to addresses in the contiguous U.S. and other shipping benefits.
FREE Two-Day Shipping
•Unlimited streaming of movies and TV episodes.
Prime Video
•Unlimited, ad-free access to hundreds of Prime Playlists and more than a million songs.
Prime Music
•Secure unlimited photo storage in Amazon Cloud Drive.
Prime Photos
•Get 30-minute early access to Lightning Deals on Amazon.com and new events on MyHabit.com.
Prime Early Access
Prime Pantry
Prime Exclusive Savings in
Video Games
Kindle First
Kindle Owners' Lending Library
Membership Sharing
Amazon Prime Amazon Prime is a membership program that gives customers access to streaming video, music, e-books, free shipping and a variety of other Amazon-specific services and deals

Amazon, Consumer Report, Macworld
Access to thousands of popular movies and TV shows with no additional cost
Add-on subscriptions from SHOWTIME, STARZ, etc.
Multiple Streaming Media Devices: Smart TVs,Blu-ray players, Game consoles (PlayStation, Xbox, Wii), iOS devices, Android devices
Among many Prime offerings, instant video and music still have potential as future revenue streams
Amazon Prime Instant Video is comparably more promising than Prime Music in terms of future profit opportunities
considering competitors within the industry and growth potentials.
Amazon Prime Instant Video
Instant Video Competitor: Netflix
Amazon Prime Instant
VideoNetflix
Selection Almost 3,500More than 7,500 HD
videos
Extras
Original Shows/ editor
recommendations/ other
Prime benefits
Popular original series
Convenience
Netflix is more convenient:
More devices are Netflix-ready/
videos easier to stream for Netflix
Cost $99/year $108/year
Amazon Prime Music
•For members in the U.S. and Puerto Rico
Unlimited, ad-free access to hundreds of Prime Playlists and more than a million songs
•Fire phone/ tablets/ TV
•Amazon Echo
•iOS devices
•Android smartphones and tablets (v.4.0 and above)
•PC & Mac
•Amazon website
Multiple Compatible devices support Amazon Music Prime Music
Music Streaming Service Market Share
45%
17%
16%
13%
7%
5%
0% 10% 20% 30% 40% 50%
Pandora
iHeartRadio
iTunes Radio
Spotify
AmazonMusic
Rhapsody
13

14
Amazon should invest in their media segment in
consideration of growth potential and available resources
Delivery Service Amazon’s web services
Drawbacks
Media
Opportunities
US Postal Systems is highly capital
intensive
Major delivery companies have years
of expertise on route efficiencies that
Amazon would have to build
AWS already dominates the cloud
computing industry, which implies low
room for growth
Due to high competition and efficiency
within the market there are tight
profit margins
Risk and uncertainty associated with
the boom and bust nature of the
technology industry and rising threat
of cyber crime
Rapid change in market from online
downloads to online streaming with
potential opportunities and large profit
marginsEntrenched market
Increasing size of market, penetration
rate and connectivity around the world
Room for improvements within the
company
Established costumer network and low
barriers to expand
Delivery Services Web Services Media
Expertise
Room for growth
Competition
Resources and
costumer network
Verdict High competition and low
expertise. The market is highly
efficient and capital intensive.
Limited room for growth
Entrenched market with low room
for improvements and growth. Not
many additional opportunities
compared to other segments
Large established costumer
network and resources with
tremendous room for growth.
15
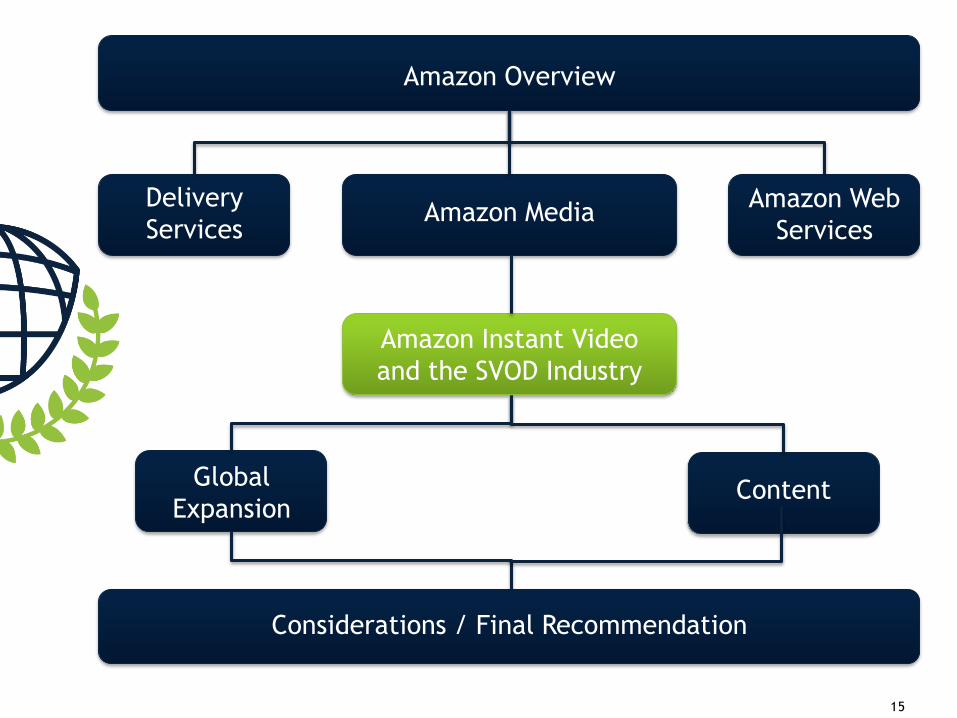
Amazon Overview
Delivery
ServicesAmazon Web
ServicesAmazon Media
Global
ExpansionContent
Considerations / Final Recommendation
Amazon Instant Video
and the SVOD Industry

The media and entertainment industry is expected to
keep growing at a steady pace over the next 5 years
PwC, Statistica
Key Trends
Internet penetration and connectivity
Technological improvements
Percentage of services conducted
online
Innovations and number of products
online
Growth drivers
Music
•11.2% CAGR to 2019 in digital music streaming
•Revenue by 2018: 1.78bn Streaming, 1.65bndownloading, 1.58bn physical
•Negative growth for digital downloads from 2.2bnin revenue in 2014 to 1.5bn in 2019
Video
•Electronic home video to overtake box office revenue by 2017
•Physical home video to decline -9.4% CAGR over the next 5 years
Television
•IPVT (Internet protocol television) to drive growth in the television segment.
•Penetration to rise from 9.8% of households in 2014 to 12.5% in 2019.
•Cable and satellite television are expected to decline.
The new entertainment and media landscape continues to change rapidly due to the increase of younger audiences
subscribing to digital platforms. Amazon’s expansion into online streaming will benefit from this steady growth.
16
0.
0.5
1.
1.5
2.
2.5
2015 2016 2017 2018 2019
Value of the global entertainment and media market from 2015 to 2019 (in trillion U.S.
dollars)

17Ooyala, American Bar, Morgan Stanley, Nielsen
Within the video media industry, Subscription Video on
Demand (SVOD) has exceptional market growth potential
0%
5%
10%
15%
20%
25%
30%
35%
40%
45%
50%
2011 2012 2013 2014 2015
A La Carte
MonthlySubscription
Purchase to Own
Industry Characteristics
Increasing Streaming Popularity
•High barriers to entry - high capital requirements, existing exclusive content rights, challenge of creating original content
•New entrants threaten substitution based on consumer price sensitivity
•Competition high with many players and similar content: 13 % of users use multiple streamers
•Original content is a key differentiator between services
Competitive Landscape
•45% of US households now use a SVOD service
•Live TV viewership has declined in the past 5 years by 1% YOY
•SVOD now accounts for 23% of total entertainment spending; 4x greater than spending in 2011
Rise of Subscription Video On Demand
Major Players
SVOD Market Breakdown
85%3%
10%2%
Netflix
Amazon
Hulu
Other
While there is a huge public attention on SVOD, current US market is saturated. Amazon should look for another place to grow.
18Morgan Stanley, PriceWaterHouseCoopers, Comscore, Netflix Annual Report
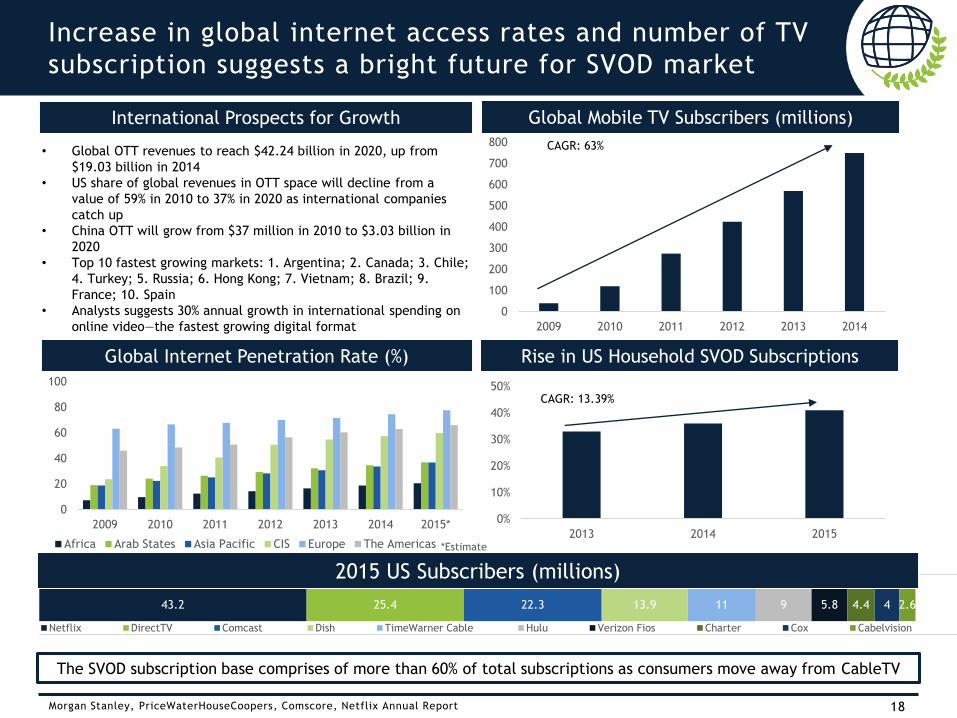
Increase in global internet access rates and number of TV
subscription suggests a bright future for SVOD market
0
20
40
60
80
100
2009 2010 2011 2012 2013 2014 2015*
Africa Arab States Asia Pacific CIS Europe The Americas
International Prospects for Growth
• Global OTT revenues to reach $42.24 billion in 2020, up from
$19.03 billion in 2014
• US share of global revenues in OTT space will decline from a
value of 59% in 2010 to 37% in 2020 as international companies
catch up
• China OTT will grow from $37 million in 2010 to $3.03 billion in
2020
• Top 10 fastest growing markets: 1. Argentina; 2. Canada; 3. Chile;
4. Turkey; 5. Russia; 6. Hong Kong; 7. Vietnam; 8. Brazil; 9.
France; 10. Spain
• Analysts suggests 30% annual growth in international spending on
online video—the fastest growing digital format0
100
200
300
400
500
600
700
800
2009 2010 2011 2012 2013 2014
Global Mobile TV Subscribers (millions)
Global Internet Penetration Rate (%)
CAGR: 63%
43.2 25.4 22.3 13.9 11 9 5.8 4.4 4 2.6
Netflix DirectTV Comcast Dish TimeWarner Cable Hulu Verizon Fios Charter Cox Cabelvision
0%
10%
20%
30%
40%
50%
2013 2014 2015
Rise in US Household SVOD Subscriptions
CAGR: 13.39%
The SVOD subscription base comprises of more than 60% of total subscriptions as consumers move away from CableTV
2015 US Subscribers (millions)
*Estimate

19FireOnlineVideo, Hollywood Branded Inc., StrategyAnalytics
In the SVOD market, Amazon faces great competition,
but has the potential for revenue growth
Strengths
•Established Prime users
•Offers more than streaming service: also rent/buy
Weaknesses• Limited global market
• APIV less frequently used by its users than Netflix (fewer marketing opportunities)
• Lack of response to its original content
Opportunities
•New “Streaming Partners Program”
• International Growth
•Occupies 38% of share of SVOD households in the US
Threats
•Competition (e.g. Netflix has better platform: its own CDN and technology for video delivery)
Amazon has had a firm step into the SVOD industry, while it still faces challenges from its major
competitors specifically in its production of original content and its global presence.
20
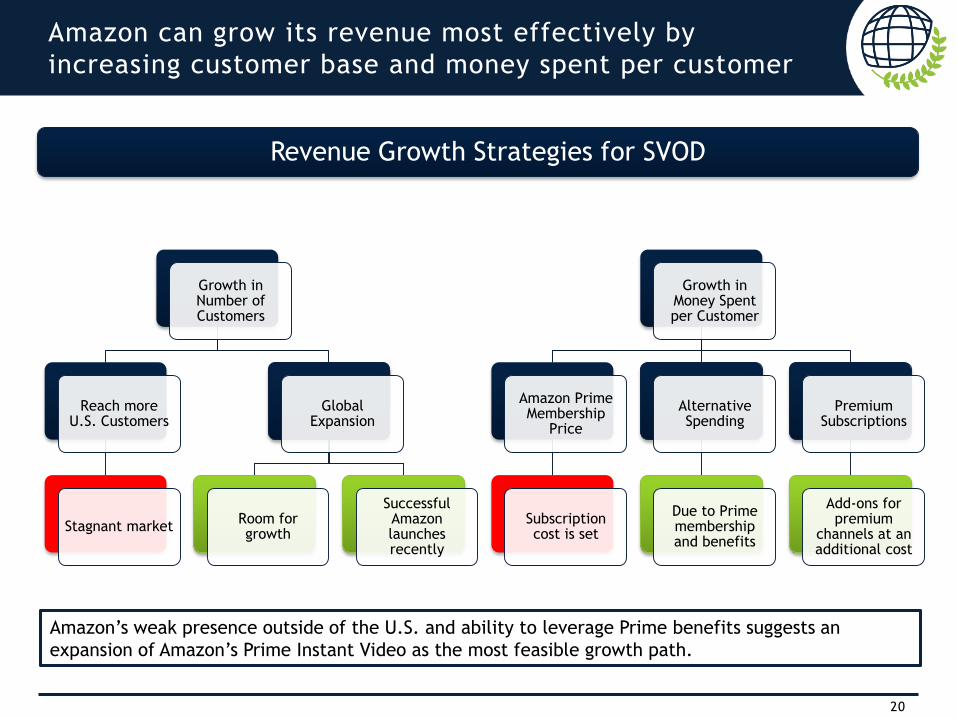
Amazon can grow its revenue most effectively by
increasing customer base and money spent per customer
Growth in Number of Customers
Reach more U.S. Customers
Stagnant market
Global Expansion
Room for growth
Successful Amazon launches recently
Growth in Money Spent per Customer
Amazon Prime Membership
Price
Subscription cost is set
Alternative Spending
Due to Prime membership and benefits
Premium Subscriptions
Add-ons for premium
channels at an additional cost
Revenue Growth Strategies for SVOD
Amazon’s weak presence outside of the U.S. and ability to leverage Prime benefits suggests an
expansion of Amazon’s Prime Instant Video as the most feasible growth path.

21
Amazon Overview
Delivery
ServicesAmazon Web
ServicesAmazon Media
Global
ExpansionContent
Considerations / Final Recommendation
Amazon Instant Video
and the SVOD Industry
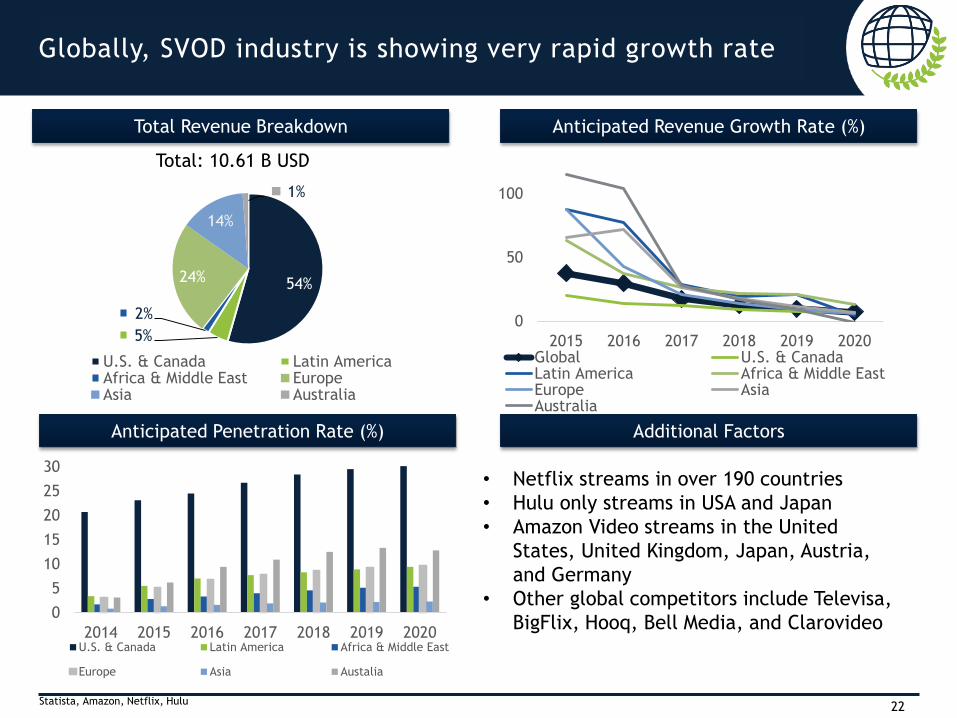
22Statista, Amazon, Netflix, Hulu
Globally, SVOD industry is showing very rapid growth rate
• Netflix streams in over 190 countries
• Hulu only streams in USA and Japan
• Amazon Video streams in the United
States, United Kingdom, Japan, Austria,
and Germany
• Other global competitors include Televisa,
BigFlix, Hooq, Bell Media, and Clarovideo0
5
10
15
20
25
30
2014 2015 2016 2017 2018 2019 2020U.S. & Canada Latin America Africa & Middle East
Europe Asia Austalia
54%
5%
2%
24%
14%
1%
Total: 10.61 B USD
U.S. & Canada Latin AmericaAfrica & Middle East EuropeAsia Australia
0
50
100
2015 2016 2017 2018 2019 2020Global U.S. & CanadaLatin America Africa & Middle EastEurope AsiaAustralia
Total Revenue Breakdown
Anticipated Penetration Rate (%)
Anticipated Revenue Growth Rate (%)
Additional Factors
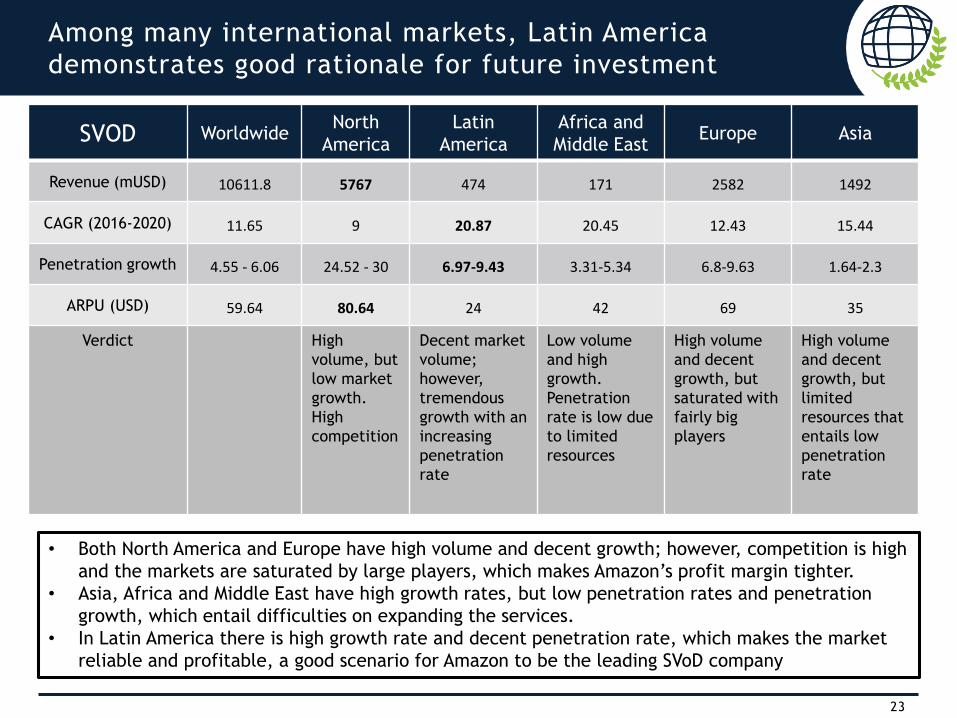
Among many international markets, Latin America
demonstrates good rationale for future investment
SVOD WorldwideNorth
America
Latin
America
Africa and
Middle EastEurope Asia
Revenue (mUSD) 10611.8 5767 474 171 2582 1492
CAGR (2016-2020) 11.65 9 20.87 20.45 12.43 15.44
Penetration growth 4.55 - 6.06 24.52 - 30 6.97-9.43 3.31-5.34 6.8-9.63 1.64-2.3
ARPU (USD) 59.64 80.64 24 42 69 35
Verdict High
volume, but
low market
growth.
High
competition
Decent market
volume;
however,
tremendous
growth with an
increasing
penetration
rate
Low volume
and high
growth.
Penetration
rate is low due
to limited
resources
High volume
and decent
growth, but
saturated with
fairly big
players
High volume
and decent
growth, but
limited
resources that
entails low
penetration
rate
• Both North America and Europe have high volume and decent growth; however, competition is high
and the markets are saturated by large players, which makes Amazon’s profit margin tighter.
• Asia, Africa and Middle East have high growth rates, but low penetration rates and penetration
growth, which entail difficulties on expanding the services.
• In Latin America there is high growth rate and decent penetration rate, which makes the market
reliable and profitable, a good scenario for Amazon to be the leading SVoD company
23

24Statista
Market breakdown of the SVOD market in Latin America shows
positive growth rates and increasing penetration rates
• Latin America displays a positive growth
rate relative to other international
markets
• However, the political climate of Brazil
and Argentina would not allow for an
effective expansion into the SVOD market
• Mexico had the largest international
Amazon launch
Anticipated Revenue Growth Rate
Anticipated Penetration Rate (%) Deciding Factors
3.4
5.57 7.7 8.3
8.9 9.4
02468
101214
2014 2015 2016 2017 2018 2019 2020
Argentina Brazil Mexico Latin America
19%
32%
49%
Total: 474.1 mUSD
Argentina Mexico Brazil
Total Revenue Breakdown
0
20
40
60
80
100
2015 2016 2017 2018 2019 2020
Argentina Brazil Mexico

Amazon, Bloomberg, Statista, Ooyala
Mexican market is emerging as the right place to
promote Prime SVOD subscription service
Netflix and Other Competitors
25
Amazon’s recent launch in Mexico provides an opportunity to expand its SVOD services into Latin America.
While the growth rate is expected to decrease (as it is across all regions), revenue is increasing and there are
currently few competitors
• Netflix’s market share has slipped from 64% to
56% in recent months
• Netflix offers 2,838 titles in Mexico,
compared to 7,202 in the United States.
• Clarovideo’s market share has increased from
32% to 40% since launching original content
Amazon Mexico SVOD in Mexico
Launched in June 2015 without Prime services
More product categories offered at debut than any other international launch
Offers free shipping on purchases of 599 pesos, about $38
Lacks access to U.S. offerings like Instant Video and Kindle Lending Library
88.682.1
2513.9 15.7 16.1
0
20
40
60
80
100
2015 2016 2017 2018 2019 2020
Revenue Growth Rate (%)
43.682.3
149.9187.3
213.5246.9
286.7
0
50
100
150
200
250
300
350
2014 2015 2016 2017 2018 2019 2020
Total Revenue (mUSD)

Amazon Overview
Delivery
ServicesAmazon Web
ServicesAmazon Media
Global
ExpansionContent
Considerations / Final Recommendation
26
Amazon Instant Video
and the SVOD Industry
27Business Insider
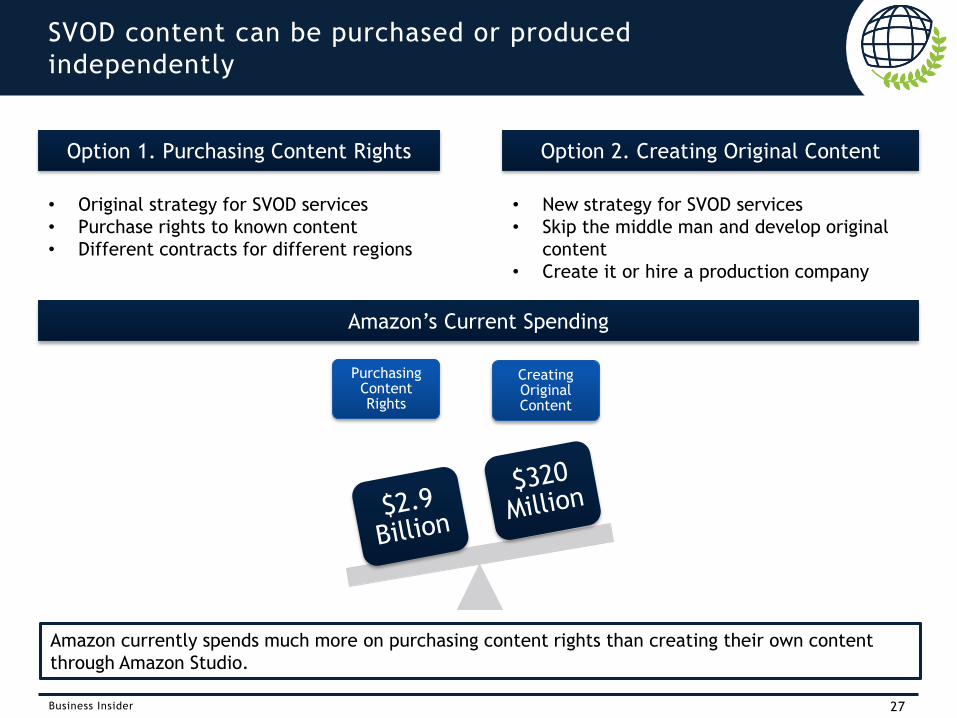
SVOD content can be purchased or produced
independently
Option 1. Purchasing Content Rights
• Original strategy for SVOD services
• Purchase rights to known content
• Different contracts for different regions
Creating Original Content
Purchasing Content Rights
Amazon’s Current Spending
Option 2. Creating Original Content
• New strategy for SVOD services
• Skip the middle man and develop original
content
• Create it or hire a production company
Amazon currently spends much more on purchasing content rights than creating their own content
through Amazon Studio.

28Business Insider, Netflix, Vulture
Purchasing content rights can be expensive but
dependable for Amazon in the saturated SVOD market
-
500
1,000
1,500
2,000
Q1'13
Q2'13
Q3'13
Q4'13
Q1'14
Q2'14
Q3'14
Q4'14
Q1'15
Q2'15
Q3'15
Q4'15
Netflix Licensing Costs (in Millions)
Add-On Subscriptions
• Launched in Spring 2015
• Prime members can subscribe to premium
content
• Premium channels still receive revenue
• Allows Amazon to stream content without
paying full price
• HBO deal likely over $100 million
Despite Netflix’s ability to spend large amounts on content, Amazon has stepped ahead of Netflix
through partnerships with premium channels. The purchase of content ensures customer access to
popular shows and helps build customer base.
Amazon needs more content
Premium channels need
more viewers
Amazon’s Content Rights
• Spent just under $3 billion purchasing
rights in 2015
• Successful in expanding content variety in
U.S.
• Costs will rise as Prime Video seeks to grow
and expand
29Business Insider, Amazon, Market Realist, Vulture
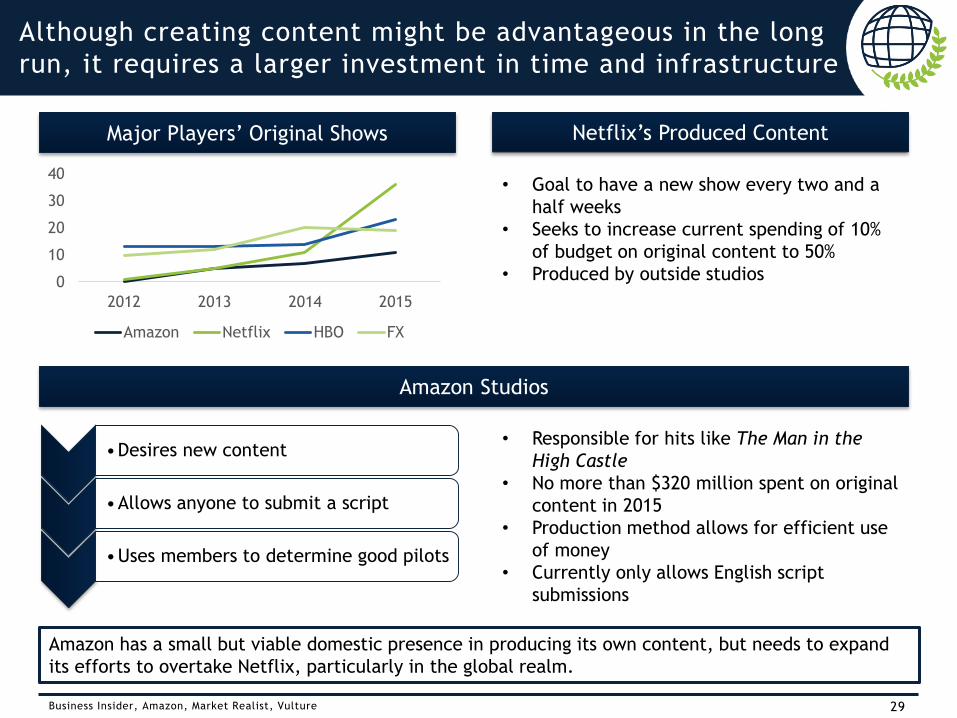
Although creating content might be advantageous in the long
run, it requires a larger investment in time and infrastructure
Amazon Studios
• Responsible for hits like The Man in the
High Castle
• No more than $320 million spent on original
content in 2015
• Production method allows for efficient use
of money
• Currently only allows English script
submissions
Netflix’s Produced Content
0
10
20
30
40
2012 2013 2014 2015
Amazon Netflix HBO FX
Major Players’ Original Shows
• Goal to have a new show every two and a
half weeks
• Seeks to increase current spending of 10%
of budget on original content to 50%
• Produced by outside studios
Amazon has a small but viable domestic presence in producing its own content, but needs to expand
its efforts to overtake Netflix, particularly in the global realm.
•Desires new content
•Allows anyone to submit a script
•Uses members to determine good pilots
30
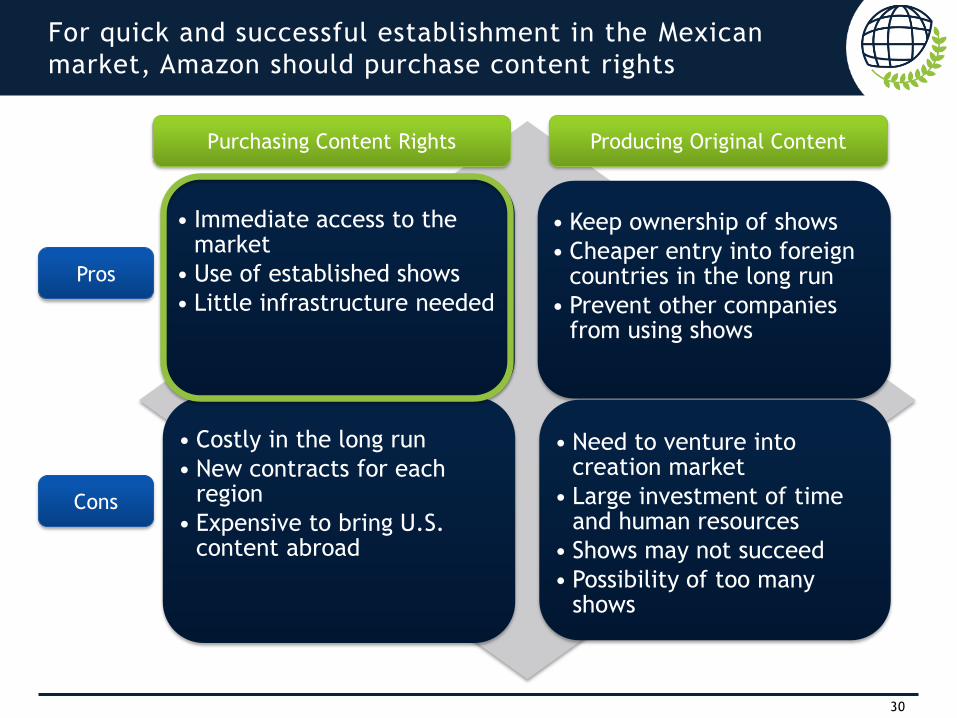
For quick and successful establishment in the Mexican
market, Amazon should purchase content rights
• Immediate access to the market
• Use of established shows
• Little infrastructure needed
• Keep ownership of shows
• Cheaper entry into foreign countries in the long run
• Prevent other companies from using shows
• Costly in the long run
• New contracts for each region
• Expensive to bring U.S. content abroad
• Need to venture into creation market
• Large investment of time and human resources
• Shows may not succeed
• Possibility of too many shows
Purchasing Content Rights Producing Original Content
Pros
Cons
31
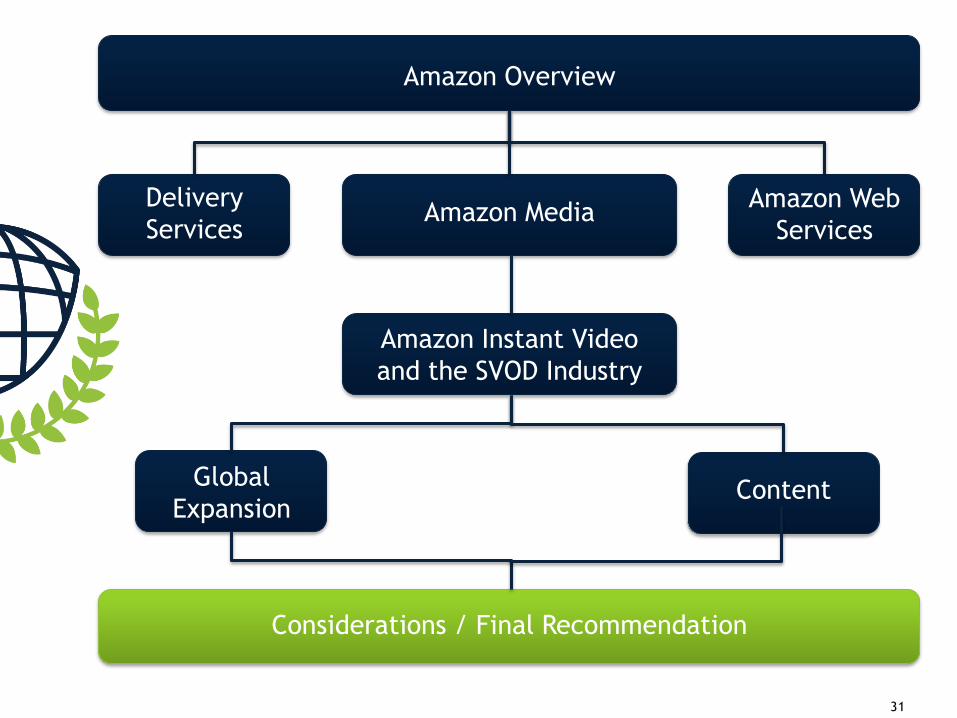
Amazon Overview
Delivery
ServicesAmazon Web
ServicesAmazon Media
Global
ExpansionContent
Considerations / Final Recommendation
Amazon Instant Video
and the SVOD Industry

IndexMundi; Geo-Mexico; Vulture; Amazon
Amazon should take time to deal with cultural barriers
in Mexico before providing local services
Likes/Dislikes
32
The cultural barriers which Amazon faces can be overcome through actions such as providing subtitles and purchasing
Mexican show television rights yet also through externals factors such as increased internet use and the Westernization
of Mexican culture.
Language Internet Use Penetration in Mexico
• 92.7% of Mexico’s inhabitants speak Spanish
only.
• Amazon Prime offers limited options for
subtitles(mostly in English) and does not
stream in different languages.
• However, this offers room for expansion:
subtitles and also purchasing of television
rights to Mexican shows. 0.00%
10.00%
20.00%
30.00%
40.00%
50.00%
60.00%
2009 2010 2011 2012 2013 2014 2015
• Internet access is vital for SVOD
• While 93% have televisions, 51.1% of
Mexicans use the internet and this is rising.
• Huge regional disparity of internet access
• Regions like Chiapas, Oaxaca, Guerrero
and Tlaxcala have very limited access to
internet with practically no household
access.
• Huge importance placed on family-
Mexicans are potentially less likely to buy
into SVOD fad as Americans/British.
• Nonetheless, Mexicans are fans of popular
American shows that Amazon provides
such as Criminal Minds & SpongeBob.
• Mexico City, Queretaro, and Monterrey
are becoming Americanized- vast numbers
of Americans settling in these areas post
retirement.

33Ooyala, Mexican Law Blog, Mexico News Daily
Mexican government opened up its SVOD market, positioning
Mexico as one of the most digitalized countries by 2024
Regulations
• Deregulation bill passed in 2013
• Created a new communications and media regulator, Federal Communications Institute (IFT)
• Allows foreign owners to have a 49% stake in broadcasting companies and up to 100% ownership in for telecoms
• In 2015 IFT established that SVOD is not a substitute to paid TV so antitrust proceedings do not apply for the SVOD market
• This resolution is a space of freedom that SVOD companies can enjoy to grow
Trends
In May 2013 Mexico ranked high in its “OTT Video Market Attractiveness Index”
Robust and burgeoning digital video market. CAGR exceeding 33% through 2018. Subscription video on demand will drive much of the market’s growth
In 2014 Mexico’s government purchased and planned to distribute more than 120,000 digital TVs
15 million households are expected to add digital TVs by 2020
Highlights
• In January 2016, the Mexican government took a
major step inviting to bid on a wholesale mobile
network.
• The intention is to provide high-speed, broadband
Internet access through a shared 4G mobile network
to at least 85% of the country’s population
• The government’s goal is to position Mexico as one of
the 15 most digitized countries by 2024

34
Amazon’s advance into the Mexico market should be a
clear-paced, effectively regulated process
Launch Amazon Prime
•Limited to Amazon Instant Video, Prime Photo storage, Prime Early Access
•No Free Two-Day Shipping to avoid logistical issues and costs
Release of Purchased Content
• Including popular U.S. and Mexican shows
•Some U.S. shows will include subtitles
•Will be an ongoing release
•Potentially movies as well
Extension of Amazon Studio
•Produce Mexican/Latin American content
•Allow Spanish scripts to be sent in
•Hire producers, etc. who are knowledgeable about the Mexican Media Industry
1. Accurate investigation of market drivers: when related new technology (e.g.
government-mandated 4G coverage) will be implemented and how well-informed
and receptive the public is to these technology updates
2. Regulation of implementation timeline to ensure continuous interest by Prime
members
3. Consistent release of new shows and movies
4. Creation of a Mexican-knowledgeable team of marketers and producers
Strategies for Successful Implementation

35Amazon, Internet Live Stats
Contribution Margin Analysis of Mexico Expansion w/
Prime Video presents positive contribution margin of
$600M and positive IRR
Scenario 1. Amazon stays in Mexican
market w/o Prime & media products Annual CM: 17.4m * $64 = $1.1B
Annual Contribution Margin / member Prime Video Non-Prime
Annual Prime Member Spend (stats from 2014) $1500 * 60% = $900 $650~660 * 60% = $400
* Contribution Margin 12.0% 16.0%
= Per Member Contribution $108 $64
+ Prime Annual Fee (only counts ordinary, no student fee) $5 monthly fee * 12 = $60 -
= Annual Contribution Margin $168 $64
Annual Value of Prime Video member compared to non-Prime member in Mexico
Scenario 2. Amazon runs Prime in Mexican
market Annual Contribution Margin:
(12.2m * $64) + (5.2m * $168) = $1.7B
Simple comparison shows positive contribution margin of $600m per year
IRR Analysis
-Scenario 1. Amazon stays in Mexican market w/o Prime & media products
-Scenario 2. Amazon runs Prime with media contents in Mexican market
Year 0 1 2 3 4 5
Cash (5.50B) 1.1B 1.21B 1.33B 1.46B 1.61B
IRR 6.60%
Year 0 1 2 3 4 5
Cash (10.2B) 1.7B 2.21B 2.87B 3.73B 4.86B
IRR 12.84%

Task: Develop a new growth driver for Amazon in light
of its difficulty in recovering profit due to its cost
structure
Given these findings and taking into account Amazon’s current investment
opportunities and management objectives with Prime subscription model, we
believe implementing Amazon Prime Instant Video in Mexico presents high
upside potential and makes long-term strategic sense
Ultimately
Strategic Rationale
Feasibility and Execution
Little chance of cost saving, need for new revenue stream
Continuing market growth of SVOD industry worldwide
High growth rate of 88.6% in Mexican SVOD market and Amazon’s market
competitiveness show compelling profit potential
Purchase of content rights is better for quick and effective market entry
Financial analysis shows $600m contribution per year and a 12.84% return
Gradual expansion of Prime subscription is required in response to cultural
& regulative barriers and execution risk
Spanish subtitles, Mexican TV shows, future original content, focus on
large and Americanized cities
36

37

38
Appendix: Financial Calculations
A. Simple comparison assuming Amazon penetrates Mexican market
- Benchmarking U.S market:
-Total Americans w/ Internet: 270m
-Total U.S Amazon Users: 120m, thus 120m / 270m = 44% of Americans w/ Internet will
use Amazon
-Total Prime membership: 54m, thus 54m / 120m = 45% of Amazon members use Prime
- Applying to Mexican market, assuming both countries have same demographic structure:
-*Dollar figures are decreased by 40% from U.S. values for cost of living adjustment
-Total Mexican Population w/ Internet Access: 58m, % of Mexicans w/ access who use
Amazon= 44%
-Total potential Amazon users: 58m * 30% (estimating 14% less than U.S.) = 17.4m
-Total potential Prime membership: 17.4m * 30% = 5.2m
B. IRR Analysis
-Assumptions
-Year to year avg. revenue growth rate: 10% (w/o Prime) / 30% (w/ Prime)
-Revenue growth rate takes account of the growth of user #
-Pricing model remains same ($60 for annual subscription of Prime in Mexico)
-Current annual CM (w/o Prime) = 17.4m * $64 = $1.1B
-Current annual CM (w/ Prime) = (12.2m * $64) + (5.2m * $168) = $1.7B
-Initial Investments: Scenario 1: $1.1B * 500%= $5.5B, Scenario 2: $1.7B * 600%= 10.2B
-estimated numbers come from e-commerce cost structure