sp 2 - home - productivity · web viewsp 2 – non-market sector productivity 1 non-market...
TRANSCRIPT

Non-market sector productivity
Shifting the Dial: 5 year Productivity Review — Supporting Paper No.2, Canberra, August 2017

ã Commonwealth of Australia 2017
ISBN 978-1-74037-625-9 (PDF)
Except for the Commonwealth Coat of Arms and content supplied by third parties, this copyright work is licensed under a Creative Commons Attribution 3.0 Australia licence. To view a copy of this licence, visit http://creativecommons.org/licenses/by/3.0/au. In essence, you are free to copy, communicate and adapt the work, as long as you attribute the work to the Productivity Commission (but not in any way that suggests the Commission endorses you or your use) and abide by the other licence terms.
Use of the Commonwealth Coat of Arms
For terms of use of the Coat of Arms visit the ‘It’s an Honour’ website: http://www.itsanhonour.gov.au
Third party copyright
Wherever a third party holds copyright in this material, the copyright remains with that party. Their permission may be required to use the material, please contact them directly.
Attribution
This work should be attributed as follows, Source: Productivity Commission, Non-market Sector Productivity, Shifting the Dial: 5 year Productivity Review, Supporting Paper No. 2.
If you have adapted, modified or transformed this work in anyway, please use the following, Source: based on Productivity Commission data, Non-market Sector Productivity, Shifting the Dial: 5 year Productivity Review, Supporting Paper No. 2.
An appropriate reference for this publication is:
Productivity Commission 2017, Non-market Sector Productivity, Shifting the Dial: 5 year Productivity Review, Supporting Paper No. 2, Canberra.
Publications enquiries
Media and Publications, phone: (03) 9653 2244 or email: [email protected]

The Productivity CommissionThe Productivity Commission is the Australian Government’s independent research and advisory body on a range of economic, social and environmental issues affecting the welfare of Australians. Its role, expressed most simply, is to help governments make better policies, in the long-term interest of the Australian community.
The Commission’s independence is underpinned by an Act of Parliament. Its processes and outputs are open to public scrutiny and are driven by concern for the wellbeing of the community as a whole.
Further information on the Productivity Commission can be obtained from the Commission’s website (www.pc.gov.au).

Contents
Key points 2
Measuring productivity in the non-market sector 3
1 Productivity and the non-market sector 3
2 Inputs and outputs have been rising 7
3 The workaround: using direct output measures 12
4 From theory into practice: existing non-market sector estimates 17
5 The direction and applications of future work 22
References 24
SP 2 – NON-MARKET SECTOR PRODUCTIVITY 1

Key points The productivity of the non-market sector — the health care and social services, education
and training, and public administration and safety industries — is not measured under the existing national accounts framework.
– Although it is likely that both outputs and inputs to the non-market sector have grown in recent years, the changing ratio between them — their productivity growth — remains unknown.
– The crux of the problem is the lack of price information for the predominantly government-subsidised services.
Measuring the productivity of the non-market sector is important, as it can provide an aggregate measure of the extent to which performance in the different industries has been improving and taxpayers have been getting increasing value-for-money.
– The sector also forms a large and growing part of the economy, increasing the relevance of measuring and monitoring its performance.
– Its inclusion in the national accounts is also necessary to ensure a complete picture of the Australian economy and to adhere to global standards for national accounts reporting.
There has been some global progress to develop a methodology for measuring non-market sector productivity through direct output measures.
– Although the methodology differs between countries, it generally involves directly identifying the output of the different industry sectors, adjusting that output for changes in quality over time and aggregating different outputs into a single weighted index.
The Australian Bureau of Statistics is currently working towards measuring the output of the health care sector by calculating health output on the basis of diseases-treated, although there are ongoing methodological issues and data limitations.
However, information on non-market sector productivity in the national accounts may not be detailed enough to provide much guidance for policy purposes.
– Many of the most important government choices occur at a micro-level, particularly those that lead to better outcomes for people (such as the best teaching methods, diffusion of good practice between service providers, market stewardship and the allocation of funding). More detailed indicators of non-market performance are needed for many of these choices.
1 PRODUCTIVITY REVIEW

Measuring productivity in the non-market sector
1 Productivity and the non-market sector
As part of the terms of reference for this inquiry, the Commission has been asked to analyse Australia’s productivity performance in both the ‘market’ and the ‘non-market’ sectors. A range of different measures outlining Australia’s productivity already exist, with their performance trends examined in chapter 1 of the main report.
However, the most commonly used measure of productivity — the Australian Bureau of Statistics (ABS) estimates of multifactor productivity (MFP) in the national accounts (a statistical summary of the economy and its components) — is confined to a subset of the economy referred to as the market sector. This measure of Australia’s productivity does not include the performance of the vitally important non-market sector — consisting of the health care and social services, public administration and safety, and education and training industries.
Why is non-market productivity not measured?
The main reason for the different treatment of the non-market sector relates to the availability of price data.
In the market sector, the exchange of goods and services takes place at observed, market-determined prices. The observability of prices is important because first, it ensures that the productivity relates to a ‘good’ that is actually good — that is, people only pay for things they value. In addition, prices solve another problem because they allow aggregation of heterogeneous goods and services into meaningful composites (box 1).
However, the goods and services provided by the health care and social services, public administration and safety, and education and training industries are often free of charge or heavily subsidised due to significant government involvement.1 Lacking prices in the
1 In practice, there are elements of the non-market sector that have private sector components (such as private schools), as well as elements of the market sector that are heavily subsidised (for example, public transport). However the three industries comprising the non-market sector are those where the effects of government subsidies are felt most strongly, as many of the observed ‘prices’ in the non-market sector are still artificially low, making output difficult to measure (ABS, sub. 42, p. 4).
SP 2 – NON-MARKET SECTOR PRODUCTIVITY 2

non-market sector, the natural basis for aggregation into composite output measures also disappears, and with it, easily calculable productivity measures.
Box 1 The importance of pricesAs an example of why observable market prices are important, consider a factory producing only 100 expensive SUVs and 100 cheap hatchbacks per year, but where prices are unknown.
In trying to meaningfully measure what the factory produces, it would not be correct to simply add up the number of cars produced and say that their production is 200 units, as consumers value SUVs and hatchbacks differently. For instance, if the factory decided to focus only on producing 200 SUVs and no hatchbacks, then the number of units produced would remain at 200, even though consumers would value the factory’s output more.
Prices solve the problem of trying to aggregate different types of goods and services into a single output measure by providing guidance on the relative value of different products. Thus, if the price of an SUV is three times that of a hatchback, then the factory’s output would have increased in value by 50 per cent from swapping to produce only SUVs.
Because of these difficulties, output estimates in the non-market sector have traditionally been based on the total cost of production (that is, the total cost of inputs, also known as an ‘output = input’ model). By definition, this means measured productivity growth is zero, as output growth is determined directly by growth in inputs (Dunleavy 2016; PC 2016).
There are also challenges in measuring the inputs to the non-market sector, such as adequate quality adjustment for labour inputs, difficulties measuring the actual value of capital services used and accounting and definitional differences that affect data collection. However, none of these difficulties are unique to non-market industries.
A range of other economic activities are also not measured within productivity statistics (box 2). However, for the purposes of this inquiry the discussion of the ‘non-market sector’ is confined to only those industries defined by the ABS as non-market and where governments set zero or highly regulated prices — namely, the health care and social services, public administration and safety, and education and training industries. Governments also control most of the levers shaping productivity in this sector in their role as purchasers, providers and regulators — making it readily amenable to policy action.
Why does it matter? — the importance of productivity measurement
Despite measurement difficulties, productivity in the non-market sector is important.
3 PRODUCTIVITY REVIEW

First, as many of the inputs to the non-market sector are funded by Australian taxpayers, productivity measures are important to demonstrate that taxpayers are obtaining good value for their money through the greatest possible output (Australian Government 2007; Gruen 2012).
SP 2 – NON-MARKET SECTOR PRODUCTIVITY 4

Box 2 Unmeasured, but not unimportantWithin the national accounts, the ownership of dwellings — measured as the housing services provided by dwellings — is another ‘industry’ that is also excluded from most productivity analysis. This is because the output of this ‘industry’ resembles the flow of services that is obtained from a durable good, involving no employment and hence no labour productivity.
Outside the national accounts, unpaid home production and volunteering are also not included in productivity measures, as they generally occur beyond the ‘production boundary’ and are not included in other national accounts measures either (such as GDP and GNI). Within this area (comprising activities such as childcare, community services, meal preparation, gardening, housework, and shopping) labour is unpaid and largely unobserved. For many people, the hours spent in such unpaid activities significantly exceed those spent in market production — this pattern is particularly prominent for women with child-caring responsibilities and people aged over 65 years. For example, a woman in a couple with children spends about 55 hours in unpaid work and just over 20 hours in paid work, on average, each week (Wilkins 2014).
It is difficult to measure the value of unpaid work given the absence of market-determined wages, but the evidence suggests that unpaid work is a profoundly important source of economic activity. In 2014, the ABS estimated that the market value of unpaid work, including time spent volunteering, was equivalent to between 40 to 60 per cent of GDP in 2006, depending on the method of estimation (ABS 2014).
The measurement of the productivity of unpaid work is even more challenging than obtaining approximate indicators of its value. Nevertheless, there is compelling evidence — both direct and indirect — that labour productivity has improved in many unpaid activities over the past century, due to the spread of labour-saving household appliances such as dishwashers and washing machines. However, the gains (at least in the United States) seem largely confined to the period preceding the 1980s.
While the contribution of home production activities to the economy has been historically undervalued in economic statistics, the growing trend of households outsourcing these activities to the market sector as female workforce participation increased has brought some of them into measures of the observed economy (most notably the increase in formal childcare).
In addition to home production, some new types of products can also be difficult to measure — most notably the provision of free digital services, such as social media sites or web search functions — as well as activities that are uncounted because of their illegal nature (for example, illicit drug production and the cash economy).
Sources: ABS (2000, 2014, 2016b), Baxter (2002), Bridgman (2016), Wilkins (2014).
5 PRODUCTIVITY REVIEW

Second, measures of productivity and other performance metrics can be used to help identify the drivers of efficiency and the subsequent policy levers that can systematically improve outcomes for users of any given resources. This information can be used to improve outcomes for the consumers of government services, such as improved medical interventions, teaching in schools or fire services (box 3). While governments will undoubtedly increase funding for critical services like health as the population ages, obtaining better outcomes for a given amount of resources reduces the adverse effects of any rationing of funding.
Box 3 Fire and rescue service productivityFire and rescue services across Australia — part of the public administration and safety industry — deliver rapid and reliable help in fire and accident emergencies, as well as protecting the population from hazardous materials, providing community education facilities and investigating and researching the causes of fires.
These outputs have genuine value to the community, but fire and rescue services generally do not charge a price for their services, commonly providing them free of charge with funding sourced indirectly, such as from state or local governments or from mandatory insurance or property levies. As the value of much of this funding (that is, their inputs) is currently used as a measure of their output (under the ‘output = input’ model), it is difficult to determine if the services provided are value for money or if they can be improved.
As an example, consider two similar fire stations, one of which decides to invest in a new fire truck to improve response times, while the other invests the same amount of money in additional specialised training for its firefighters.
Unless information was collected about outputs (such as response times or injury rates) and outcomes (such as measures of fire security in the community or of property, environmental and personal losses from fires), it is difficult to assess the additional benefit — if any — from the taxpayer-funded investments in each station. Observers would only know that the new fire truck and the additional training increased the inputs of the fire stations, but not whether their fire and rescue capabilities actually improved.
Furthermore, if other fire stations were interested in knowing which investment (new fire trucks or additional training) had a greater effect on improving fire and rescue services for the community, there would be no way to objectively determine this without productivity statistics.
Sources: ABS (2013), SCRGSP (2016).
Third, the non-market sector is also a driver of productivity for other parts of the economy. For example, education increases people’s skills (human capital), improving their subsequent job prospects, productivity and wages in the market sector.
SP 2 – NON-MARKET SECTOR PRODUCTIVITY 6

Finally, the non-market sector is both large and growing, and so the resource costs of low productivity are very large. The non-market industries form a vital part of the economy, contributing over $280 billion to industry production in 2015-16, making up 20.3 per cent of total production.2 This is up from 17.2 per cent of total industry production in 1990 (figure 1), with the recent strong growth projected to continue. This is particularly true for the health care and social services sector, due to Australia’s ageing population and increased demand for health services as Australians get wealthier. These drivers will continue to increase the relative size of the non-market sector over the coming decades (ABS 2016a; Australian Government 2015).
Figure 1 Non-market sector growthFinancial year ending
Real industry gross value added per capita ($)a Proportion of total industry output (%)b
Jun-
...
Jun-
...
Jun-
...
Jun-
...
Jun-
...
Jun-
...
Jun-
...
Jun-
...
Jun-
...2,000
2,500
3,000
3,500
4,000
4,500
5,000
Public administration and safety Education and training Health care and social assistance
a Measured by chain volumes. b Measured in current value terms.
Sources: ABS 2016, Australian System of National Accounts, 2015-16, Cat. no. 5204.0, October (table 5); ABS 2016, Australian Demographic Statistics, Jun 2016, Cat. no. 3101.0, December (table 1).
2 Measured by industry gross value added (GVA) at current prices, including 6.4 per cent for public administration and safety, 5.8 per cent for education and training and 8.1 per cent for health care and social services, based on shares of current price total industry GVA, excluding ownership of dwellings.
7 PRODUCTIVITY REVIEW
J J J J J J J J J J J J J J4
5
6
7
8
9

2 Inputs and outputs have been rising
A starting point for any investigation of non-market sector productivity is to examine trends in output and input measures — it is changes in the ratio between them that determines productivity growth.
Labour inputs
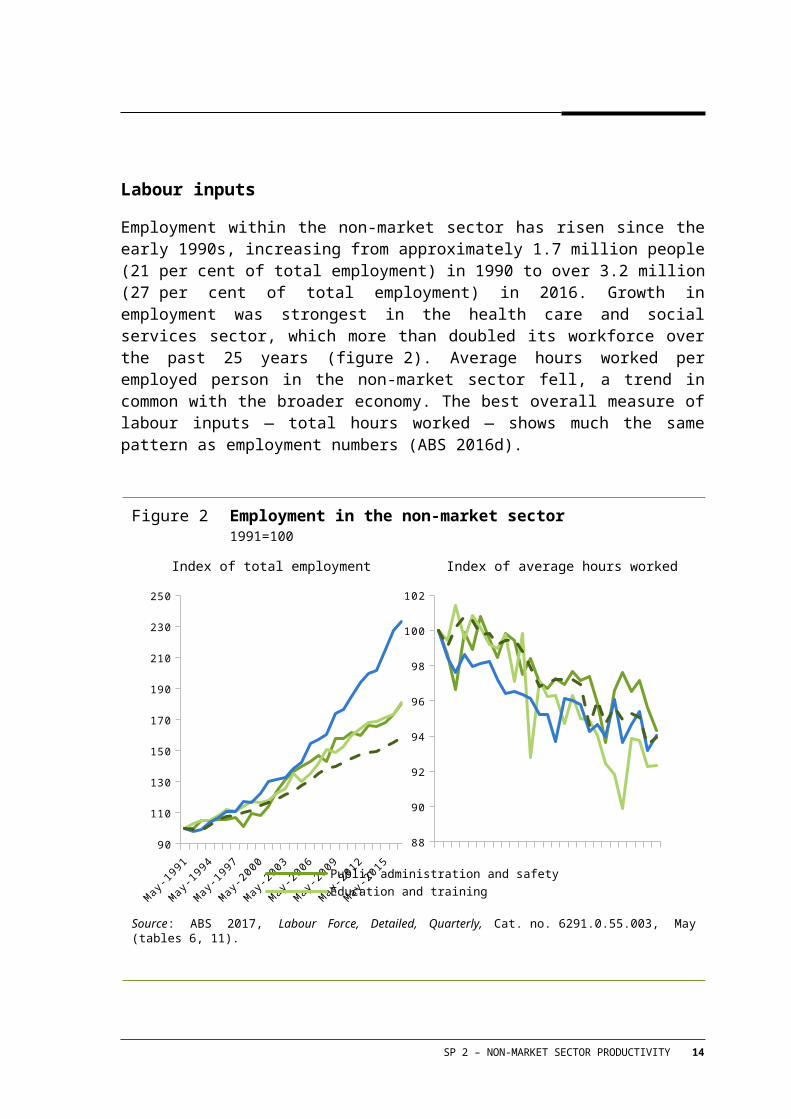
Employment within the non-market sector has risen since the early 1990s, increasing from approximately 1.7 million people (21 per cent of total employment) in 1990 to over 3.2 million (27 per cent of total employment) in 2016. Growth in employment was strongest in the health care and social services sector, which more than doubled its workforce over the past 25 years (figure 2). Average hours worked per employed person in the non-market sector fell, a trend in common with the broader economy. The best overall measure of labour inputs — total hours worked — shows much the same pattern as employment numbers (ABS 2016d).
Figure 2 Employment in the non-market sector1991=100
Index of total employment Index of average hours worked
May-199
1
May-199
4
May-199
7
May-200
0
May-200
3
May-200
6
May-200
9
May-201
2
May-201
590
110
130
150
170
190
210
230
250
Public administration and safety Education and trainingHealth care and social assistance Total employment
Source: ABS 2017, Labour Force, Detailed, Quarterly, Cat. no. 6291.0.55.003, May (tables 6, 11).
SP 2 – NON-MARKET SECTOR PRODUCTIVITY 8
88
90
92
94
96
98
100
102

Capital inputs
As with employment, capital inputs have been rising in the non-market sector, evidenced by strong growth in gross fixed capital expenditure and growing net capital stocks (figure 3), the latter of which more than doubled from 1990-91 to 2015-16.3
Industry-level output trends
Australia has experienced uninterrupted population growth and increases in economic prosperity over the past 25 years. These factors alone have increased the total demand for non-market services, as more people, with more money to spend, have demanded more health care, education and public administration services. In addition, an ageing population has further increased demand for health care and social services. Decreased growth in demand for education and training — as there are proportionally fewer school-age children — provided only a small offset to this broader trend, in part because of considerable growth in the tertiary education sector (Australian Government 2015).
Figure 3 Capital inputs for the non-market sectora
1990=100, financial year ending
Index of gross fixed capital formation Index of net capital stock
Jun-
1990
Jun-
1993
Jun-
1996
Jun-
1999
Jun-
2002
Jun-
2005
Jun-
2008
Jun-
2011
Jun-
2014
0
100
200
300
400
500
600
700
Public administration and safety Education and training Health care and social assistance
a Measured by chain volumes.
3 In the market sector, the ABS measures capital inputs as the weighted average of chain volume measures of the productive capital stock of different asset types, using rental prices for weights. In figure 3, the capital stocks are the ABS’s measure of the total capital stock for each sector (which, absent measures of rental prices for the non-market sector is the only data that allows comparisons between sectors).
9 PRODUCTIVITY REVIEW
90
140
190
240
290
340
Figure 3 Capital inputs for the non-market sectora
1990=100, financial year ending
Source: ABS 2016, Australian System of National Accounts, 2015-16, Cat. no. 5204.0, October (table 58).
There have also been major technological improvements and cumulative increases in knowledge over this period, which should have increased the value of the non-market sector’s output. Although evidence of increased quality in the education and public administration sectors is difficult to identify, the quality of health care provision has advanced immensely in recent decades.
Health care and social services outputs
In health care and social services, the quantity of outputs across a wide range of industry activities has grown rapidly over recent years:
The number of procedures undertaken in hospitals has increased from nearly 11 million in 2000-01 to over 20 million in 2014-15 (AIHW 2017a).
Emergency department presentations at public hospitals rose from 5.7 million per year in 2008-09 to 7.4 million in 2014-15 (AIHW 2013, 2015).
Individual services accessed under the Medicare Benefits Scheme (such as GP or specialist consultations) rose from 147 million in 1990-91 to 384 million in 2015-16, with the proportion of the population accessing such services also increasing from 85.9 per cent to 89.3 per cent (DoH 2016a).
Total Pharmaceutical Benefits Scheme (PBS) prescription volumes increased from 155 million in 2001-02 to 208 million in 2015-16 (DoH 2003, 2016b).
The number of permanent clients in residential aged care facilities rose to 235 000 in 2015-16, up from 137 000 in 1994-95 (SCRGSP 1997, 2017).
The total number of ambulance incidents has increased to over 3.4 million in 2015-16, up from about 2.5 million in 2005-06 (SCRGSP 2016, 2017).
Quality in the health care sector, with its myriad array of medical advances over past decades, has increased rapidly as well. The improved quality of care provided to patients is suggested by measures of life expectancy at birth, which between 1990 and 2013 rose by
SP 2 – NON-MARKET SECTOR PRODUCTIVITY 10

5.8 years for males and 3.9 years for females (AIHW 2017b).4 While this significant increase is also a result of factors other than the contribution of the health care sector (including a cleaner environment and reduced smoking rates), improvements in the quality of medical care are nevertheless an important contributor (Atkinson 2005; Schreyer 2008).
Other select indicators of improvements in the quality of health care services include decreased age-standardised mortality rates (from 604 per 100 000 people in 2007 to 545 in 2014), reduced rates of perinatal deaths within 4 weeks of birth (from 9.9 per 1000 births in 2004 to 7.9 in 2015) and a decline in the proportion of patients waiting more than 365 days for elective surgery (from 4.6 per cent in 2005-06 to 1.8 per cent in 2014-15, although median wait times remain largely unchanged) (SCRGSP 2016, 2017).
The magnitude of the improvements in health care quality over recent decades is perhaps best illustrated by an anecdote from former US Treasury Secretary Larry Summers (2015), who asked an audience whether they would rather have 2015 health care at 2015 prices, or 1980 health care at 1980 prices. After the majority of the audience chooses the 2015 option, he concludes that, although difficult to measure, health care productivity has thus probably increased over the period, through rapidly rising quality and better outcomes.
Education and training outputs
In the education sector, there are also indications that output quantity has increased, with the total number of full-time equivalent students in primary and secondary schools rising from 3.3 million in 2001 to 3.8 million in 2016 (ABS 2017). Student numbers in universities have also increased to over one million equivalent full-time student loads (EFTSL) in 2015, up from approximately 650 000 in 2003 (DET 2005, 2016).
Changes in the outcomes and quality of education provided in Australia are more difficult to observe, as adequate indicators are harder to find. Student test results that are designed to be comparable across time, such as the OECD’s Programme for International Student Assessment (PISA) — which tests 15 year-olds around the world on mathematics, science and reading — show continued decline on average educational outcomes, with average student results dropping from 530 points in 2000 to 502 in 2015. This decline has not occurred to the same extent in most other OECD countries (OECD 2016; Thomson, De Bortoli and Underwood 2016).
By contrast, results from the annual National Assessment Program – Literacy and Numeracy (NAPLAN) examinations, which tests students in years 3, 5, 7 and 9 on their reading, writing, spelling, grammar/punctuation and numeracy skills, are mixed. Students in year 3 have shown consistent improvement across all topics since testing began in 2008.
4 Life expectancy at birth was 80.1 years for males and 84.3 years for females in 2013.
11 PRODUCTIVITY REVIEW
However, there have been no substantive changes in average literacy results for other grades, although their numeracy test results have improved marginally (ACARA 2016).
Public administration and safety outputs
In significant parts of the public administration and safety industry (which covers a wide range of community and government provided services) measures of total output quantity have fallen. This is particularly prevalent in the emergency services, where improved prevention has generally resulted in fewer emergencies. For example, fewer fire emergencies has meant that the total number of non-bushfire incidents attended by fire service organisations has fallen from 63 068 in 2005-06 to 55 754 in 2014-15. Although this represents a decrease in direct output from fire and rescue services, fewer emergencies is undoubtedly a good outcome for the community, with the number of fire deaths each year falling from 188 in 1985 to 97 in 2015. Similarly, improved road safety has resulted in fewer road crash extrications by fire and rescue services — down from 9940 in 2005-06 to 7668 in 2015-16 — while community outcomes have improved through a substantially lower number of road traffic deaths — falling from 3001 in 1986 to 1257 in 2015 (SCRGSP 2016, 2017).
For the policing and justice systems, outputs can often be difficult to measure, and of those that can be measured, the story is quite mixed. For instance, while the number of legal defendants whose cases were finalised by the court system remained largely stagnant between 2010-11 and 2014-15, the total number of prisoners in Australia’s prison system increased markedly over the past decade, from nearly 26 000 in 2006 to almost 39 000 in 2016 (ABS 2016c, 2016e).
Community perceptions of the quality of policing services provided in Australia are also mixed. In the National Survey of Community Satisfaction with Policing, the proportion of people who were very satisfied with the services provided by the police increased from 20.6 per cent in 2010-11 to 28.9 per cent in 2015-16, while the proportion who felt unsafe at home alone during the night fell from 5.8 per cent in 2010-11 to 4.8 per cent in 2015-16. However, over the period from 2009-10 to 2015-16, the proportion of people who felt safe in public places during the night fell — from 59.8 per cent to 51.7 per cent when walking alone and from 29.5 per cent to 24.3 per cent on public transport (SCRGSP 2017).
3 The workaround: using direct output measures
Given the importance of the non-market sector, considerable work has been undertaken on a number of levels, both internationally and within Australia, to attempt to overcome the difficulties of measuring the output of the non-market sector.
SP 2 – NON-MARKET SECTOR PRODUCTIVITY 12

Generally, the favoured approach has been the ‘direct’ method — where the volume of different (heterogeneous) goods and services are counted and aggregated, with weights based on their relative prices. This method is distinguished from the ‘indirect’ method used for market sector estimates in the national accounts — where the total nominal revenue (the market value, a combination of price and volume) of the industry’s output is known for each year and changes in prices over time are removed, leaving only volume measures.
Progress in developing output measures in the non-market sector has been slow. The need to address measurement problems was recognised almost 25 years ago and there have been a number of attempts to make progress, internationally and by individual countries, on the issue:
In 1993, the United Nations — supported by the Commission of the European Communities, the International Monetary Fund (IMF), the Organisation for Economic Co-operation and Development (OECD) and the World Bank — adopted a new System of National Accounts (SNA), which recommended that countries move away from the ‘output = input’ methodology where possible, and instead seek to directly measure the output of the non-market sector (UN 1993).
In 2001, the European Commission developed a detailed handbook on price and volume measures in national accounts, with a special emphasis on direct measures of the outputs of services (including non-market services) (Eurostat 2001).
In 2005, an independent review in the United Kingdom (the Atkinson Review) examined the measurement of government inputs and outputs and recommended that the scope of collected data be expanded and more analysis be done to determine government sector productivity (Atkinson 2005).
In 2010, the OECD published a handbook to provide guidance for the measurement of health and education services across jurisdictions (Schreyer 2010).
The methodology of direct output measures
Despite recent progress, the direct measurement of non-market sector outputs faces several challenges before it can be used to estimate MFP growth alongside measures for market sector goods in the national accounts.
Identifying an output
The use of direct measures of output is only possible where the government-provided services in the non-market sector have an identifiable output. Atkinson (2005) Lee (2008) differentiate non-market services between:
13 PRODUCTIVITY REVIEW
individual services that are rivalrous (consumption by one consumer prevents consumption by others) and excludable (it is possible to prevent people having access to it) with an identifiable output; and
collective services that are non-rivalrous and non-excludable, are delivered simultaneously to many consumers and that generally do not have an identifiable output.
Although the distinction between the two service types is not always clear, an example of an individual service could include a doctor’s appointment, where the provider can refuse to provide the service (excludable) and provision to one consumer at a given time prevents provision to another (rivalrous). By contrast, the peculiar aspect of collective services (such as national defence or government policy-making) is that all people consume the same amount of these services.
The key issue is the value each person places on this consumption. Not only is measuring this difficult in its own right, but measures of the total value of a good are not equivalent to the price determined in a market for a good (most people pay less for a good than the value they place on it — otherwise they would not buy it).
Most research efforts to develop a direct output measure have focused on the health care and education sectors, as these sectors more often provide individual services, and so are more easily measured and tallied. Comparisons of providers of individual services also offer significantly more scope to identify a range of meaningful performance indicators for each provider — such as the productivity of hospital theatres for given surgical procedures. This information can be used in a myriad of ways to gauge value for money and effectiveness of parts of the non-market sector and improve outcomes and cost-effectiveness (SP 3).
Conversely, there has only been limited analysis of the public administration and safety industry, in part because providers tend to supply monopolistic collective services. However, some aspects of the public administration and safety industry may be measurable — for example, Dunleavy (2016) suggests that the output of tax or welfare agencies could be measured by the number of products (different taxes or benefits) provided to or received from each client. In practice though, output in the industry generally continues to be measured by the ‘output = input’ method instead, which Diewert (2011) describes as an acceptable indicator of output where a lack of information makes other methods impossible or impractical.
The type of direct measures of non-market sector output needed depends on the particular industry and the nature of the goods and services it provides. For example, in the health care industry, Lee (2008) identifies the best unit of output as the ‘health care pathway’, which is all of the parts of treatment provided to a person with a specific diagnosis. Where
SP 2 – NON-MARKET SECTOR PRODUCTIVITY 14

this is difficult to determine due to disparate information sources, individual health care activities provided during that pathway can be used instead.
For the education sector, by contrast, Lee (2008) suggests that the ideal measure of output quantity across the entire sector is the number of pupil-hours or full-time equivalent students (although this fails to capture any element of quality — see below).
Aggregating outputs across industries
A major challenge is to aggregate the disparate services provided by an entire industry into a single, meaningful output index. For example, consider the difficulty of combining together the very different types of output provided by hospitals and aged care facilities, in order to create a single index for the output of the health care and social services industry.
In the market sector, different outputs can largely be expressed in monetary terms with market prices reflecting their relative importance to consumers, and so forming the ‘weights’ by which outputs are aggregated. This is not possible in the non-market sector due to the lack of prices as an indicator of value. Instead, output measures are generally weighted using one of two methods: based on the relative costs of inputs — relying on competitive market conditions (where marginal cost equals marginal value) within the government-dominated industries — or using price-weights from the private sector provision of similar non-market services — assuming that there are comparable private providers and the quality of private and public provision is the same (Douglas 2006).
Incorporating changing service quality
The measurement of non-market sector output is further complicated by changes in the nature of the goods and services produced over time. From a productivity point of view, any improved quality of services provided by the non-market sector could be as equally desirable as any increased quantity of services delivered. That is, consumers value the improved nature of goods and services, not just having more of them, so quality change should be captured by indicators of output value. For example, although more surgeries (increased output quantity) for a given level of inputs would be a productivity improvement for a hospital, the output value of those surgeries is also improved when they have a higher survival rate or reduced recovery times (improved output quality).
The issue of quality adjustment in productivity measures is also a problem for the market sector as changes to the nature of products that are difficult to reflect in output indexes occur across the entire economy. However, the issue is arguably more acute for the non-market sector, as it generally produces services rather than goods (so the nature of their output is inherently less observable) and there are no prices that have already incorporated quality changes (Dunleavy 2016; Schreyer 2008).
15 PRODUCTIVITY REVIEW

To account for ongoing quality improvements in direct measures of non-market sector output, the volume measures can be adjusted for quality in several different ways. Methods include:
capturing part of the quality change by differentiating as many qualities of a product as possible. This results in products of different quality being treated as entirely separate products, such that a shift to the higher quality product versions can be observed.
taking into consideration the effect of the service on the marginal outcome of the consumer, particularly with relation to its degree of ‘success’ (Atkinson 2005; Eurostat 2001; Schreyer 2010).
Quality adjustment for health care
For the health care sector, one suggested measurable unit of service is the ‘quality-adjusted numbers of completed treatments of particular diseases or of activities to prevent a disease’ (Schreyer 2010). Another suggestion incorporates a range of quality adjustment indicators for the ‘health care pathway’ output measure, including:
differentiation between different activities (such as division into specific diagnosis related groups for hospital care)
post-treatment health status and survival rates
process quality indicators (for example, vaccination take-up rates or at-risk patient monitoring in primary care)
patient experience indicators (for example, timing and convenience of appointments or cleanliness of hospitals) (Lee 2008).
Implementing such measures still faces considerable information challenges and there is an ongoing debate about the most practical way to measure health care services: by the volume of health care activities (such as the number of hospital procedures or GP visits) or the volume of ‘health care pathways’ provided (such as the number of cancer or cardiac arrest patients treated). This latter approach is also known as the ‘diseases-managed’ approach, and has a range of advantages and disadvantages, discussed in box 4.
SP 2 – NON-MARKET SECTOR PRODUCTIVITY 16

Box 4 Diseases-managed vs. activities-provided methodsThe major difference between the activities-provided and diseases-managed methods of directly measuring non-market output is in the way that substitution between different types of treatment for the same disease affects the estimates of productivity. Under the activities-provided model, moving a patient out of high-cost treatment methods (such as in-patient hospital facilities) and onto low-cost methods (such as drug treatments administered by a GP) would generally not be recognised as a productivity gain, only as a change in the demand for each service. By contrast, under the diseases-managed approach, moving from a high-cost to a low-cost treatment method is a substantial productivity gain, as the cost of the treatment is reduced, while the patient presumably receives a similar or better level of service.
For similar reasons, the diseases-managed methodology can better account for the changing utilisation of treatments (the number of activities during an episode of care). As an example Aizcorbe (2013) discusses a reduction in the number of procedures needed to treat an ear infection. Under the activities-provided method, this would count as reduced output, whereas the diseases-managed methodology would treat it as reduced cost of a single output.
An additional difference between the methodologies is that the activities-provided method does not use any information about the particular disease being treated, although the extent to which a particular health care service is productive depends on the condition being treated. Aizcorbe, Retus and Smith (2008) cite the example of an additional night in hospital for a patient who has had a routine appendectomy; that extra night would generally be more beneficial for a patient who has had quadruple bypass surgery, as their risk of post-surgery complications is greater.
Another area where the diseases-managed methodology and the activities-provided methodology also differ is the management of service costs where the patient suffers from more than one illness (such co-morbidities are relatively common and can be particularly prevalent among the elderly). The activities-provided methodology is not affected by this issue. By contrast, the diseases-managed method has to assign co-morbidity spending to disease categories by relying on a ‘primary’ diagnosis, which can create varying and subjective outcomes. An example used by Aizcorbe, Retus and Smith (2008) is the difficulty of allocating the cost of a GP visit among different disease categories for a diabetic who also suffers from heart disease.
A related difficulty of the diseases-managed approach is that it is heavily reliant on adequate data sources to allocate spending and identify diseases across patients. This is simpler in the US health care system (where private insurance companies track insured patients closely) than in Australia, where services can be provided through a range of different private and public systems, with only limited communication between them. However, the continued rollout of the My Health Record system across Australia will help to remedy this issue (chapter 2 of the main report).
Sources: Aizcorbe (2013), Aizcorbe, Retus and Smith (2008), Dunn, Rittmueller and Whitmire (2015).
17 PRODUCTIVITY REVIEW

Quality adjustment for education
Similar to health care, quality in the education sector can be accounted for through differentiation, such as by accounting for different types or levels of schooling (that is, differentiating between primary, secondary and tertiary level students) (Lee 2008).
However, adequate measures of the ‘success’ of education and training output are problematic. Intuitively available indicators, such as improved exam scores or smaller class sizes, are often uncorrelated with actual education quality, unless other factors can be controlled for (ABS 2001).
Test scores in particular are subject to a range of factors well beyond the control of teachers (such as innate ability, effort and parental influence). Further, many exams — such as tertiary entrance exams — are not intended for comparison across time, only across a given cohort, as the content of an exam changes from year to year meaning that changes in average performance may simply be a result of an easier or harder exam that year.
Similarly, by themselves, smaller class sizes are an inadequate quality measure because their benefits depend on the age and disadvantage of the child, the teaching methods used by teachers, and the subject matter — as discussed in the meta-analysis of Whitehurst and Chingos (2011) and Zyngier (2014). For example, even if the benefits are weak or nonexistent for the ‘average’ student, there is reasonable evidence that smaller classes for disadvantaged children in the first four years of school produce good outcomes when supported by pedagogies that make use of smaller class sizes. Accordingly, evidence of positive, negative or no impacts of class size for students on average is uninformative about policy-relevant effects for some sub-groups. In effect, there are multiple markets for which school sizes have relevant impacts.5
4 From theory into practice: existing non-market sector estimates
Progress in Australia
The ABS has undertaken substantial work on measuring the non-market sector’s productivity over recent years. This is part of a long-term goal to further develop the national accounts and create a more reflective and robust measure of the economy. The development of productivity estimates began in the wake of the 1993 SNA, leading to the publication of experimental MFP estimates for each of the 12 market sector industries
5 Whether or not it is worth investing in smaller classes, even in the context in which they have some beneficial outcomes, is another matter, and depends on whether better outcomes could be achieved through alternatives. It is important to distinguish between the measurement of quality improvements in productivity analysis and the policy question of whether such quality improvements should be sought.
SP 2 – NON-MARKET SECTOR PRODUCTIVITY 18

in 2005. These MFP estimates are now published alongside the other national accounts data and since 2010 have been expanded to include four additional industries — rental, hiring and real estate services, professional, scientific and technical services, administrative and support services, and other services — following the introduction of the new industry classifications in ANZSIC 2006 (ABS 2007, 2010, 2016b; Zheng 2005).
Direct non-market output estimates
For the non-market sector, the ABS started collecting and aggregating direct volume measures of output for health and education in 2001 (with a time series back to 1993-94). Although these direct volume measures are unpublished and not used as a direct output measure for any productivity analysis (due to their lack of adjustment for quality changes), they are used to determine growth in volume for the health and education industries, helping to refine the ‘input = output’ methodology.
The direct output measures of health care come from a range of sources to cover the entire health care portion of the health care and social services industry (but there are no output measures for the social services portion, which remains input-based). These (unpublished) measures include:
an average-cost-weighted index of the number of episodes (separations) for hospitals, classified by over 660 different Australian National Diagnostic Related Groups, but not including outpatient episodes provided by hospitals (due to data limitations)
a cost-weighted index of the number of patient-days categorised by level of care is used for nursing homes
a fee-weighted index of the numbers of attendances for GPs and medical specialists (for example, in obstetrics, anaesthetics, diagnostic imaging and surgical operations)
a fee-weighted index of the number of tests conducted is used for pathologists
administrative data deflated by relevant price indexes are used for dental, optometry, community health, paramedical, veterinary and ambulance services.
Output estimates for education reflect the different aspects of the education sector. Estimates are mainly based on annual full-time equivalent student enrolments, weighted together by the cost of service provision, while university research is estimated by weighting together data for the number of publications and student research completions. Due to data limitations, output measures for pre-schools and ‘other’ education services are still derived using the traditional input-based methodology.
The effect of using direct output measures compared with input-based methods was a sizable change in the growth of measured output for the industries (figure 4). While the
19 PRODUCTIVITY REVIEW

gross value added of the health care and social services industry had grown by an average of 1.6 per cent per annum between 1993-94 and 1999–2000 under the input-based method, this was revised to a much higher growth rate of 4.0 per cent after the changes in output measurement. Similarly, the growth rate of gross value added in the education sector between 1993-94 and 1999–2000 increased modestly with the new methodology, from 1.5 per cent to 1.9 per cent per annum (ABS 2001; Douglas 2006).
Figure 4 Comparator indexes of GVA for health and education sectors1998-99 = 100
Health and community services Education services
1993-94
1994-95
1995-96
1996-97
1997-98
1998-99
1999-00
80
85
90
95
100
105
1993-
941994-
951995-
961996-
971997-
981998-
991999-
00
90
92
94
96
98
100
102
Source: ABS 2001, Australian National Accounts: National Income, Expenditure and Product, March 2001, Cat. no. 5206.0.
The ABS separately investigated output volume measures for the justice sector, including police, justice services, and corrective centres, and constructed a range of experimental indexes. Output of justice services was measured by the number of cases finalised, broken down by court level and jurisdiction. Corrective centre output was measured by the number of prisoner days in various kinds of detention programmes. The output measure of police services was based on estimates of the number of investigations completed. However, because of significant difficulties with obtaining adequate data, particularly for police services, the paper concluded that input-based measures should remain for the justice sector, pending improved data sources (Northwood et al. 2001).
SP 2 – NON-MARKET SECTOR PRODUCTIVITY 20

In an attempt to measure the output of the public administration and safety industry, the ABS also produced unpublished estimates of volume output measures for the Australian Taxation Office (ATO) and Centrelink in 2003. The new measures were based on the individual services that each organisation delivered to governments, businesses and the community. For example, the services of the ATO included minutes and briefings for government and the registration and processing of business and individual tax claims. Similarly, the outputs of Centrelink were the processing of customer’s claims for welfare benefits and providing ongoing services to benefit recipients. While the initial results were reportedly promising, the data sources were underdeveloped and required a longer period of examination before they could be published (Trewin 2004).
Reinvigorated efforts to develop direct non-market measures
More recently, the ABS has been engaged in renewed efforts to deliver improved output measures across the non-market sector. In particular, the ABS plans to develop output estimates for the health care sub-industry, before moving onto the education industry and then the social services sub-industry.6
For the health care sub-industry, the ABS is currently working towards a measure of health output calculated on the basis of completed courses of treatment (the diseases-managed approach), rather than the current practice of summing up the number of procedures administered (an activities-provided approach). This approach includes identifying potential data sources (such as state administrative health data), allocating health care expenditure between diseases, constructing price indexes and determining output estimates by disease. The stated aim of these output measures is to facilitate the development of productivity statistics alongside the national accounts, in order to ‘assist policymakers to better understand the nature of increases in health expenditure in terms of quantity growth or pure price growth … [and] support more effective targeting of government resources for Australia’s health industry.’ (ABS, sub. 42, pp. 10–11)
Much of the ABS’s recent work was motivated by continued international developments, as well as a 2010 House of Representatives Standing Committee on Economics report into raising productivity growth in Australia. This report recommended that the ABS investigate ways to develop better service sector MFP estimates, including for the non-market sector (Standing Committee on Economics 2010).
6 The ABS has ‘no current plans’ to develop public administration and safety industry output estimates in the near future, due to the inherently difficult nature of that industry (ABS, sub. 42, p. 10-11).
21 PRODUCTIVITY REVIEW

International estimates
Several other jurisdictions have made considerable progress in the past few years towards publishing estimates on non-market sector productivity, using a variety of different methods.
United Kingdom
Following the release of the Atkinson Review in 2005, the United Kingdom has made substantial progress towards developing direct measures of output for the non-market sector. The Office of National Statistics (ONS) has published experimental estimates of public sector productivity alongside the UK national accounts data, with 90 per cent of the health care industry and 75 per cent of education now covered by a range of direct, quality-adjusted output measures. Basic quantity output measures are also estimated for public order and safety, adult social care, social security administration, 40 per cent of children’s social care and the remainder of the education sector, but these measures are not adjusted for quality (ONS 2017a, 2017b).
Initial results from the UK analysis show mixed productivity improvements. Average annual health care productivity growth (using the mostly quality-adjusted measures) was 0.9 per cent each year between 1997 and 2014, while for education there was no net productivity gain over the same period because inputs and outputs grew in lockstep (ONS 2017a). Productivity growth for the entire public sector (when measured by direct quality-adjusted output) was close to zero over the period from 1997 to 2013 (figure 5).
SP 2 – NON-MARKET SECTOR PRODUCTIVITY 22

Figure 5 UK productivity growth rates and indexes for quality-adjusted (QA) and non-QA total public services1997-2014
1997
1998
1999
2000
2001
2002
2003
2004
2005
2006
2007
2008
2009
2010
2011
2012
2013
70
80
90
100
110
120
-3
-2
-1
0
1
2
QA productivity - Growth rate (RHS) Non-QA productivity -Growth rate (RHS)QA productivity - Index (LHS) Non-QA productivity - Index (LHS)
Inde
x (1
997=
100)
Gro
wth
rat
e (%
)
Source: (ONS 2017a).
New Zealand
Following developmental work over the previous decade, in 2013, Statistics NZ published initial estimates of productivity for the education and health care industries using select direct measures of output, such as the number of cost-weighted equivalent full-time students (EFTS) for education output. These estimates indicated that productivity in the education industry fell by about 1.5 per cent annually between 1996 and 2011, while growing at an average annual rate of 0.8 per cent in the health care industry. Although the direct output measures used by Statistics NZ were largely unadjusted for quality and may not have been relevant to some activities, the experimental estimates form a foundation for further development (Statistics NZ 2010, 2013).
United States
The United States has also been moving towards new measures of non-market sector productivity, with a particular focus on the US health care industry, estimated to be worth 17.4 per cent of US GDP in 2013. In 2015 the Bureau of Economic Analysis (BEA), in
23 PRODUCTIVITY REVIEW

collaboration with the National Academy of Sciences and the Bureau of Labour Statistics, launched a ‘health care satellite account’ (HCSA) to test new methods for analysing health care statistics before adding them to the core national accounts. The BEA’s methodology uses the diseases-managed approach to measure the output of the health care system on the basis of how many diseases are treated (Dunn, Rittmueller and Whitmire 2015; Washington, Jackson and Wasshausen 2015).
5 The direction and applications of future work
Productivity estimates in the national accounts are good to know …
Historically, the national accounts have been used to summarise economic events and analyse an economy’s wealth and component factors to provide useful information for the formulation of macroeconomic policy (ABS 2016b). Improvements in measures of outputs and productivity for the non-market sector would (imperfectly) plug a gap in the national accounts and help to provide a better understanding of the Australian economy and how it functions. Better measures would also provide a ‘rough and ready’ indicator that the sector’s performance was improving. Conversely, sustained low growth in productivity might reflect sluggish technological progress and weak diffusion of best-practice — which would warrant close policy attention (as has occurred for the MFP slowdown in the market sector).
Australia also needs to catch up to progress made elsewhere, particularly in the United Kingdom and New Zealand, in order to adhere to international standards for best-practice national accounting.
… but not vital to improve outcomes
While creating MFP estimates as part of the national accounts is important for understanding the state of the economy and to identify trends that should be further investigated, such measures have limitations. Besides the methodological flaws discussed above, more critically, MFP estimates for each of the non-market sectors in the national accounts have very limited policy applications. In particular, they would likely be too broad to provide decision-makers with the insights they need to improve outcomes for consumers and taxpayers. As a result, such estimates would not be able to drive productivity improvements, as they do not provide enough detail to identify the specific areas that need to be improved within each industry. More granular indicators of productivity and other performance metrics (for example, outcome effectiveness, value-for-money, marginal effects of more or fewer resources) are much better suited to identify specific areas that need to be improved in the non-market sector (SP 3).
SP 2 – NON-MARKET SECTOR PRODUCTIVITY 24

This distinction between measuring productivity for national accounts purposes and measuring it for the purpose of improving performance and service delivery outcomes was acknowledged in the OECD’s 2010 handbook on measuring non-market sector productivity (Schreyer 2010). Similarly, in the United Kingdom, Atkinson (2005) recognized that no single number, however carefully constructed, can fully capture the performance of complex public services with multiple objectives, so it is not only necessary to estimate a single aggregated figure for each of the non-market sector industries, but also to measure outputs in sufficient detail to determine the outcomes from individual decisions and policy changes.
Further, the two goals — productivity measurement at the macro-level through the national accounts and at a more micro-level through performance metrics — are not necessarily mutually exclusive. A proliferation of high quality data and research relating to the inputs, outputs and productivity of individual non-market service providers can lead to greatly improved measures of sector-wide productivity in the national accounts, as the more detailed picture of micro-level performance can help to inform an industry-wide estimate.
CONCLUSION 2.1
Development of better measures of the output and productivity of the non-market sector at the national accounts level would improve the understanding of the state of the economy and help identify any troubling trends in performance that would warrant further investigation. However, more granular indicators of productivity and performance in specific parts of the non-market sector are needed to inform policy choices.
25 PRODUCTIVITY REVIEW

References
ABS (Australian Bureau of Statistics) 2000, Unpaid Work and the Australian Economy, 1997, October, Cat. no. 5240.0.
—— 2001, Australian National Accounts: National Income, Expenditure and Product, Mar 2001, June, Cat. no. 5206.0.
—— 2007, Information paper: Experimental Estimates of Industry Multifactor Productivity, September, Cat. no. 5260.0.55.001.
—— 2010, Experimental Estimates of Industry Multifactor Productivity, 2008-09, February, Cat. no. 5260.0.55.002.
—— 2013, Australian and New Zealand Standard Industrial Classification (ANZSIC), 2006 (Revision 2.0), June, Cat. no. 1292.0.
—— 2014, Spotlight on National Accounts: Unpaid Work and the Australian Economy, May, Cat. no.5202.0.
—— 2016a, Australian System of National Accounts, 2015-16, October, Cat. no. 5204.0.
—— 2016b, Australian System of National Accounts: Concepts, Sources and Methods, 2015, March, Cat. no. 5216.0.
—— 2016c, Criminal Courts, Australia, 2014-15, March, Cat. no. 4513.0.
—— 2016d, Labour Force, Australia, Detailed, Quarterly, Aug 2016, September, Cat. no. 6291.0.55.003.
—— 2016e, Prisoners in Australia, 2016, December, Cat. no. 4517.0.
—— 2017, Schools, Australia, 2016, February, Cat. no. 4221.0.
ACARA (Australian Curriculum, Assessment and Reporting Authority) 2016, Time series — NAPLAN results, www.reports.acara.edu.au/Home/TimeSeries (accessed 15 December 2016).
AIHW (Australian Institute of Health and Welfare) 2013, Australian Hospital Statistics 2012-13: Emergency Department Care, October.
—— 2015, Emergency Department Care 2014-15: Australian Hospital Statistics, November.
—— 2017a, Procedures data cubes.
SP 2 – NON-MARKET SECTOR PRODUCTIVITY 26

—— 2017b, Supplementary data for life expectancy, Dataset.
Aizcorbe, A. 2013, Recent Research on Disease-Based Price Indexes: Where Do We Stand?, July, Bureau of Economic Analysis, United States.
——, Retus, B. and Smith, S. 2008, Toward a Health Care Satellite Account, May, Bureau of Economic Analysis, United States.
Atkinson, T. 2005, Atkinson Review: Final Report - Measurement of Government Output and Productivity for the National Accounts, United Kingdom.
Australian Government 2007, Intergenerational Report 2007, April.
—— 2015, 2015 Intergenerational Report: Australia in 2055, March.
Baxter, J. 2002, ‘Patterns of change and stability in the gender division of household labour in Australia, 1986–1997’, Journal of Sociology, vol. 38, no. 4, pp. 399–424.
Bridgman, B. 2016, ‘Home productivity’, Journal of Economic Dynamics and Control, vol. 71, pp. 60–76.
DET (Department of Education and Training) 2005, Selected Higher Education Statistics — 2004 Student data: All student Load.
—— 2016, Selected Higher Education Statistics — 2015 Student data: All student load.
Diewert, W.E. 2011, ‘Measuring productivity in the public sector: Some conceptual problems’, Journal of Productivity Analysis, vol. 36, no. 2, pp. 177–191.
DoH (Department of Health) 2003, Pharmaceutical Benefits Scheme - Expenditure and Prescriptions twelve months to 30 June 2003.
—— 2016a, Annual Medicare Statistics, August.
—— 2016b, Pharmaceutical Benefits Scheme expenditure and prescriptions twelve months to 30 June 2016, December.
Douglas, J. 2006, Measurement of Public Sector Output and Productivity, Policy Perspectives Paper, November, NZ Treasury, Wellington, NZ.
Dunleavy, P. 2016, Public sector productivity: Measurement challenges, performance information, and prospects for improvement’, presented at The 12th Annual Meeting of the OECD Senior Budget Officials Performance and Results Network, Paris, November.
Dunn, A., Rittmueller, L. and Whitmire, B. 2015, Introducing the New BEA Health Care Satellite Account, January, Bureau of Economic Analysis, United States.
27 PRODUCTIVITY REVIEW

Eurostat 2001, Handbook on Price and Volume Measures in National Accounts, European Commission, Luxembourg.
Gruen, D. 2012, The importance of productivity’, presented at Productivity Commission – Australian Bureau of Statistics Productivity Perspectives Conference, 20 November.
Lee, P. 2008, Measuring Non-market Output and Productivity, December, Paper prepared for Economic Measurement Group meeting, Office for National Statistics.
Northwood, K., Hinchcliffe, C., Henderson, L. and Rawnsley, T. 2001, Experimental Output Measures for the Australian Justice Sector, 1993-94 and 1998-99, August, Cat. no. 1351.0.55.003, Australian Bureau of Statistics.
OECD (Organisation for Economic Co-operation and Development) 2016, Programme for International Student Assessment (PISA), Dataset, www.oecd.org/pisa/data/ (accessed 14 December 2016).
ONS (Office for National Statistics) 2017a, Public Service Productivity Estimates: Total Public Service, UK: 2014, 6 January, United Kingdom.
—— 2017b, UK Productivity Introduction: Oct to Dec 2016, 5 April, United Kingdom.
PC (Productivity Commission) 2016, PC Productivity Update 2016.
Schreyer, P. 2008, Output and outcome — Measuring the production of non-market services, presented at 30th General Conference of The International Association for Research in Income and Wealth, Portoroz, Slovenia, August.
—— 2010, Towards Measuring the Volume Output of Education and Health Services: A Handbook, OECD Statistics Working Papers, 2010/02, OECD Publishing, Paris.
SCRGSP (Steering Committee for the Review of Government Service Provision) 1997, Report on Government Services 1997, Productivity Commission.
—— 2016, Report on Government Services 2016, Productivity Commission.
—— 2017, Report on Government Services 2017, Productivity Commission.
Standing Committee on Economics 2010, Inquiry into Raising the Productivity Growth Rate in the Australian Economy, 28 April, House of Representatives.
Statistics NZ 2010, Measuring Government Sector Productivity in New Zealand: a Feasibility Study, March, New Zealand.
—— 2013, Education and Health Industry Productivity 1996–2011, April, New Zealand.
SP 2 – NON-MARKET SECTOR PRODUCTIVITY 28

Summers, L. 2015, Reflections on the productivity slowdown, presented at Making Sense of the Productivity Slowdown, United States, Peterson Institute for International Economics, 16 November.
Thomson, S., De Bortoli, L. and Underwood, C. 2016, PISA 2015: A First Look at Australian Student’s Performance, December, Australian Council for Educational Research.
Trewin, D. 2004, ‘Measurement of services: Recent ABS experience’, Statistical Journal of the United Nations Economic Commission for Europe, vol. 21, pp. 277–290.
UN (United Nations) 1993, System of National Accounts.
Washington, P., Jackson, D. and Wasshausen, D. 2015, Disease-Based Health Care Measures and the Industry Economic Accounts, November, Bureau of Economic Analysis.
Whitehurst, G. and Chingos, M. 2011, Class Size: What Research Says and What it Means for State Policy, May, Brookings Institution.
Wilkins, R. 2014, ‘Time spent in paid and unpaid work’, Families, Incomes and Jobs, Volume 9: A Statistical Report on Waves 1 to 11 of the Household, Income and Labour Dynamics in Australia Survey, University of Melbourne.
Zheng, S. 2005, Estimating Industry-Level Multifactor Productivity for the Market-Sector Industries in Australia: Methods and Experimental Results, Research Paper, July, Cat. no. 1351.0.55.004, Australian Bureau of Statistics.
Zyngier, D. 2014, ‘Class size and academic results, with a focus on children from culturally, linguistically and economically disenfranchised communities’, Evidence Base, no. 1, pp. 1–23.
29 PRODUCTIVITY REVIEW