improving service sector productivity: the economic imperative
TRANSCRIPT

Improving service sector productivity: the economic imperativeJune 2017

Improving service sector productivity: the economic imperative
June 2017

About this publication Improving service sector productivity: the economic imperative © CEDA 2017 ISBN: 0 85801 313 4
The views expressed in this document are those of the authors, and should not be attributed to CEDA. CEDA’s objective in publishing this collection is to encourage constructive debate and discussion on matters of national economic importance. Persons who rely upon the material published do so at their own risk.
Designed by Robyn Zwar Graphic Design
Photography: All images: iStock Photo Library.
About CEDACEDA – the Committee for Economic Development of Australia – is a national, independent, member-based organisation providing thought leadership and policy perspectives on the economic and social issues affecting Australia.
We achieve this through a rigorous and evidence-based research agenda, and forums and events that deliver lively debate and critical perspectives.
CEDA’s membership includes 750 of Australia’s leading businesses and organisations, and leaders from a wide cross-section of industries and academia. It allows us to reach major decision makers across the private and public sectors.
CEDA is an independent not-for-profit organisation, founded in 1960 by leading Australian economist Sir Douglas Copland. Our funding comes from membership fees, events and sponsorship.
CEDA – the Committee for Economic Development of Australia Level 13, 440 Collins Street Melbourne 3000 Australia Telephone: +61 3 9662 3544 Email: [email protected] Web: ceda.com.au

I M P R O V I N G S E R V I C E S E C T O R P R O D U C T I V I T Y : T H E E C O N O M I C I M P E R A T I V E
3
Foreword 6
Executive summary 7
Recommendations 10
Contributions 12
CEDA overview 16
Section 1.0 Productivity of health services 27
1.1 Business and managerial system innovation in the health sector 28
Rohan Mead, Group Managing Director, Australian Unity
1.2 Improving the productivity of health services 35
Professor Jane Hall, Professor of Health Economics, Centre for Health Economics Research and Evaluation, University of Technology Sydney
Associate Professor Kees van Gool, Deputy Director, Centre for Health Economics Research and Evaluation, University of Technology Sydney
Section 2.0 Productivity of education services 47
2.1 Education and training enabling productivity in services industries 48
Maria Spies, General Manager, Learning & Teaching Services, Navitas; and Head of Digital Learning Futures, Navitas Ventures
Kadi Taylor, Head, Strategic Engagement and Government Relations, Navitas
Helen Zimmerman, Chief Corporate Affairs Officer, Navitas
Contents

I M P R O V I N G S E R V I C E S E C T O R P R O D U C T I V I T Y : T H E E C O N O M I C I M P E R A T I V E
4
Section 2.0 Productivity of education services …cont
2.2 Australian university productivity; some food for thought 65
Professor Leo Goedegebuure, Director, LH Martin Institute
Associate Professor Ian Marshman, Honorary Principal Fellow, Melbourne Centre for the Study of Higher Education, Melbourne University
2.3 Case study: exporting VET into India 77
Sue Freeman, CEO and Managing Director, First Impressions Resources
Section 3.0 Productivity of financial services 87
3.1 Productivity and growth in financial services 88
Amy Auster, Deputy Secretary, Economic Division, Victorian Department of Treasury and Finance
with co-authors: Anthony Cussen and Chris Judde, Senior Economists, Victorian Department of Treasury and Finance
Section 4.0 Productivity of tourism 101
4.1 Tourism productivity: key drivers and impediments 102
Dr Andreas Chai, Senior Lecturer, Griffith Business School, Griffith University
4.2 Case study: Tasmania driving innovation in the visitor economy 112
Professor Richard Eccleston, Director, Institute for the Study of Social Change, University of Tasmania; and Professor of Political Science, University of Tasmania
Dr Anne Hardy, Senior Lecturer, University of Tasmania; and Director, Tourism Research and Education Network (TRENd)
Dr Dugald Tinch, Lecturer in Resource Economics, Tasmanian School of Business and Economics

I M P R O V I N G S E R V I C E S E C T O R P R O D U C T I V I T Y : T H E E C O N O M I C I M P E R A T I V E
5
Section 5.0 Productivity of professional services 117
5.1 Productivity in accounting services 118
Karen McWilliams, Leader, Policy and Thought Leadership, Chartered Accountants Australia and New Zealand
Section 6.0 Productivity of transport infrastructure and logistics 129
6.1 Freight transport and logistics services: emerging issues 130
Dr Don Gunasekera, Research Fellow, Centre for Supply Chain and Logistics, Faculty of Science, Engineering and Built Environment, Deakin University
Dr Hermione Parsons, Director, Centre for Supply Chain and Logistics, Faculty of Science, Engineering and Built Environment, Deakin University
6.2 Changed conditions ahead 145
Michele Huey, Group General Manager, Strategy, Transurban
Section 7.0 Digital future of services 155
7.1 Is digitisation about to make the service sector more productive? 156
Professor Beth Webster, Director, Centre for Transformative Innovation, Swinburne University
Acknowledgements 161

I M P R O V I N G S E R V I C E S E C T O R P R O D U C T I V I T Y : T H E E C O N O M I C I M P E R A T I V E
6
Paul McClintock AO, National Chairman, CEDA
CEDA’s major report for 2017 focuses on the service sector because the majority of Australian workers are engaged in service industries, which in turn generate the largest component of national wealth. In addition, this is a sector with significant growth potential as Australia is increasingly exporting services.
However, if Australia is to remain internationally competitive and maintain strong economic growth, our productivity performance must improve.
This report examines impediments, drivers and options for improving productivity across key sectors, in particular:
Health;
Education and training;
Financial services;
Tourism;
Professional services; and
Transport infrastructure and logistics.
CEDA’s report also looks at the digital future of the service sector and innovation.
Rapid technological change, along with globalisation, provide the biggest challenges and also opportunities for the service sector in Australia. Embracing technological change and ensuring industry and government have an innovation mindset will be key to our success.
There is no doubt this will be a difficult road. Some of the biggest sectors in services have significant components that are government controlled and involve more than one tier of government, such as in health and education, making reform, as we have seen in recent years, all the more difficult.
I would like to thank Alan Mitchell, CEDA consultant for this project, for drawing together the CEDA overview and recommendations, and the contributing authors who have made this report possible.
I would also like to thank the CEDA Research and Policy Committee and members of the CEDA advisory group, formed specifically to oversee this report, for their input.
While change is challenging, and must be undertaken with caution to avoid unintended, it is nonetheless vital. While mining and manufacturing are regularly on the national agenda, the service sector has received less attention. Given the importance of the sector to our current and future prosperity, that needs to change.
This report offers a number of suggestions for reform and areas that require greater focus and I hope it will help generate discussion and refocus attention on this impor-tant topic.
Foreword

I M P R O V I N G S E R V I C E S E C T O R P R O D U C T I V I T Y : T H E E C O N O M I C I M P E R A T I V E
7
S E C T I O N ? . ?
Executive summary
This report is about the service sector and its productivity, which would be
important in any circumstances. But it will be now read in the context of the two
economic revolutions currently reshaping the Australian economy.
The first is the industrial revolution that is centred on Asia and has spread to emerging market economies in Latin America, Eastern Europe and Africa.
China and the other emerging market economies have added more than one billion men and women to the global manufacturing workforce, dramatically increasing the global supply of manufactured goods and triggering a period of major structural change in the advanced economies.
Manufacturing is now rapidly migrating from the high-income economies to the emerg-ing markets, where new factories built for the export market team modern western technology with cheap labour and large economies of scale.
For countries like Australia this means an increasing dependence on their service industries for economic growth and trade.
The second revolution is of course the digitalisation of information and communica-tions technology. It is accelerating the shift from manufacturing to services in Australia by allowing firms to spread their production chains across the world. It is also expos-ing a rapidly widening range of Australian service industries to global competition.
The Organisation for Economic Co-operation and Development (OECD) estimates that 15 per cent to 20 per cent of total employment in services in the US, Western Europe, Australia and Canada eventually could be subject to “offshoring”.1 Alan Blinder, a former vice-chairman of the US Federal Reserve, estimates that offshoring could end up threatening almost a third of all US jobs.2

I M P R O V I N G S E R V I C E S E C T O R P R O D U C T I V I T Y : T H E E C O N O M I C I M P E R A T I V E
8
E X E C U T I V E S U M M A R Y
Public policy, therefore, has a strong interest in maximising the productivity of the service industries both to help fill the gap in national income growth left by manufactur-ing, and to strengthen trade-exposed service industries as well as the manufacturers, miners and agri-businesses that consume services as intermediate inputs.
But, as the contributors to this report make clear, this is not a straightforward exercise. In several of our largest service industries, including finance and insurance, productiv-ity is very difficult to measure reliably.
In many service industries the problem begins with measuring output, because the value of the output is determined very largely by its quality. That quality may be quite evident to the person receiving the service, but it can be almost impossible for an outsider to measure. The problem of measuring quality is not confined to services, but it is more severe in the case of services.
One generally good guide to quality and, therefore, output in the service sector is the price consumers are willing to pay. But several of our largest service industries, including health care and education for domestic students, are largely outside the market sector of the economy: there are no comprehensive sets of genuinely market-determined prices.
Of course, the absence of market-set prices does not stop us increasing efficiency, but the result may be no more meaningful than “productivity” increases in the prover-bial Soviet fashion goods factory.
A key issue arising from this report, therefore, is the role that markets do or might play.
The main theme of Rohan Mead’s chapter is the case for increasing competition and driving business system innovation in health care. Amy Auster also stresses in her chapter on the finance sector the need for the government to implement the competi-tion-related recommendations of the Murray report.
In their paper on health care, Professor Jane Hall and Associate Professor Kees van Gool stress the need for allocative efficiency as well as increased productivity. Allocative efficiency means allocating resources to produce what consumers want. However, they also warn of the difficulties of creating efficient markets for health care services – an issue with which reformers have long been wrestling.
There also is a stronger appreciation of need for care in opening tertiary education and training to the full blast of market forces following the failure of poorly thought out reforms to vocational education and training (VET) and the Abbott Government’s ill-fated proposal to deregulate university fees. In their paper, Professor Leo Goedegebuure and Associate Professor Ian Marshman propose a form of outcomes-based funding similar to that subsequently announced by the Turnbull Government as part of a range of measures to raise productivity.
Turning to public infrastructure, Michele Huey’s paper on Transurban’s test of road user-charges suggests that the public might be more willing to consider reform than most politicians believe. It would be good if that proved to be the case. Governments are investing huge sums on new roads in the congested capital cities. But, to pose a question raised by the Productivity Commission: how do we know what infrastructure we need when we are not making efficient use of the infrastructure we already have?
The challenges in the market sector obviously are different to those in the non-mar-ket services, but they can be no less daunting. For confirmation of that, read Sue Freeman’s account of exporting retail training services to India.
Of course, the market and non-market sectors also are deeply interconnected.
I M P R O V I N G S E R V I C E S E C T O R P R O D U C T I V I T Y : T H E E C O N O M I C I M P E R A T I V E
9
E X E C U T I V E S U M M A R Y
In their paper, Maria Spies, Kadi Taylor and Helen Zimmerman highlight the crucial role vocational and higher education will play in supporting productivity growth in the more labour-intensive service sector.
As Dr Don Gunasekera and Dr Hermione Parsons explain, the road freight transport and logistics services sector is facing a major adjustment to the new generation of ICT-based technologies. With a large number of small and medium sized enterprises and an ageing workforce, the industry will need the support of a strong vocational training system.
The road freight sector also has a big stake in reforms that will allow us to use our existing roads more efficiently, and in a system of road charging that will provide effi-cient signals and money to invest in additional capacity.
At the same time, Dr Andreas Chai’s contribution on tourism productivity shows another industry in need of high quality vocational training services.
Tourism is on a roll, and the Tracer Tourism Tracking Project developed in Tasmania and outlined in the paper by Professor Richard Eccleston, Dr Anne Hardy and Dr Dugald Tinch is an example of technological change that, to recast Professor Beth Webster’s phrase, is revolutionising rather than annihilating.
No doubt there are many accountants and other trade-exposed service providers who currently feel marked for annihilation. However, it is hard to think of a better response than that proposed by Karen McWilliams in her chapter on accounting. Accountants, she says, will have to meet the pressure from Asian competitors and technological change by being more innovative and by transforming themselves so that they remain valued by business, government and the community.
Endnotes
1 Van Welsum, D. Reif, X., 2005. Potential Offshoring: Evidence from Selected OECD Countries. OECD
2 Blinder, A.S., 2005. Fear of Offshoring. Princeton University.

I M P R O V I N G S E R V I C E S E C T O R P R O D U C T I V I T Y : T H E E C O N O M I C I M P E R A T I V E
10
S E C T I O N ? . ?
Recommendations
The service sector’s capacity to exploit the opportunities offered by the digital revolu-tion and offshoring will depend on its ability to adjust to their challenges.
Drawing on the insights of Chapter 5.1, Productivity in Accounting Services, the government should:
Resist inevitable pressure to place barriers in the way of change;
Seek out opportunities to remove existing barriers with the assistance of
Productivity Commission inquiries where appropriate;
Support greater transparency of health information; and
Drive productivity gains through business system innovation in health care.
In particular, the government should reject calls to follow the example of other nations in using regulations, taxes, subsidies and government purchases to favour the use of Australian-produced services.
Instead, the government should remove existing regulatory barriers to the importa-tion of foreign services by, for example, unilaterally accelerating the liberalisation of the provision of foreign air services in Australia.
And, as the nation’s largest consumers of services, governments should themselves embrace disruptive technologies and use services produced offshore in order to provide better value for taxpayers.
At the same time, governments should ensure that they and their non-market service industries provide appropriate support for industries seeking to meet the new challenges.

I M P R O V I N G S E R V I C E S E C T O R P R O D U C T I V I T Y : T H E E C O N O M I C I M P E R A T I V E
11
Government health, education and immigration policies should recognise that produc-tivity growth in the labour-intensive service sector will depend heavily on private and public investment in “human capital”.
Drawing on Chapter 4.1, Tourism productivity: key drivers and impediments, and Chapter 6.1, Freight transport and logistics services: emerging issues, the federal and state governments should:
Ensure that both the immigration and industrial relations systems provide access
to skilled foreign workers where needed;
Task their own vocational and training systems with providing high quality
support for industries seeking to upgrading their skills; and
Consider a system of periodic independent reviews, as recommended by the
Murray inquiry for the financial sector, to ensure that appropriate government
support is being delivered as intended.
The government should also seek to increase the productivity and allocative efficiency of its own human services, while protecting and improving the equity of the system.
Drawing on the Chapter 1.1, Business and managerial system innovation in the health sector, and Chapter 1.2, Improving the productivity of health services, governments should:
Begin the long task of engaging the public in a serious discussion about the
challenges and future of the health care system, as recommended by Professor
Hall. It should start with a comprehensive Productivity Commission inquiry into
health care;
Seek to increase competition in health care by promoting a more effective role
for private health insurance and expanding the role of the private hospital sector;
Develop payment methods that shift the incentives from volume to value in
health outcomes; and
Extend the use of efficient prices, now implemented in public hospital funding,
across the rest of the health care system.
At the same time, Chapter 2.2, Australian university productivity; some food for thought, offers a number of useful suggestions to build on the university reform. These include:
Increasing the efficiency and effectiveness of university governance and
administration;
Ensuring that universities fully embrace the opportunities provided by the digital
revolution, including those that threaten current management and work practices
by moving further beyond the traditional teaching models; and
Streamlining current research processes.
R E C O M M E N D A T I O N S

I M P R O V I N G S E R V I C E S E C T O R P R O D U C T I V I T Y : T H E E C O N O M I C I M P E R A T I V E
12
Business and managerial system innovation in the health sector
For the government, some of the biggest challenges in services are in the non-market sector, which is dominated by health care and education.
Rohan Mead, Group Managing Director of Australian Unity, argues that the health system is overwhelmingly an arrangement of producer interests that put the interests of patients second and downplays palpable waste and inefficiency. Encouraging com-petition, he says, is the fastest way to get innovation and deliver greater user choice.
Improving the productivity of health services
Professor Jane Hall, Professor of Health Economics, Centre for Health Economics Research and Evaluation; and Associate Professor Kees van Gool, Deputy Director, Centre for Health Economics Research and Evaluation, University of Technology Sydney, warn that the health care budget will come under pressure from expensive new technologies, public demand and population ageing. And, like Rohan Mead, they argue that consumers’ interests must be paramount.
Increased productivity, they say, is the easiest way to meet the cost pressures, but it is not enough. Allocative efficiency – to ensure the outputs produced provide the highest social value – is the other part of the picture.
Contributions
I M P R O V I N G S E R V I C E S E C T O R P R O D U C T I V I T Y : T H E E C O N O M I C I M P E R A T I V E
13
C O N T R I B U T I O N S
Education and training enabling productivity in service industries
The education sector already has grasped the opportunities of Asia’s industrial revolu-tion: education is our third largest export industry. However, at the same time, the education system must itself transform to produce workers with the skills to thrive in a continuously changing environment. Maria Spies, General Manager, Learning & Teaching Services, Navitas and Head of Digital Learning Futures, Navitas Ventures; Kadi Taylor, Head, Strategic Engagement and Government Relations, Navitas; and Helen Zimmerman, Chief Corporate Affairs Officer, Navitas stress the critical role of education and training in raising productivity in the service sector, and facilitating structural change in Australia.
Australian university productivity; some food for thought
Associate Professor Ian Marshman, Honorary Principal Fellow, Melbourne Centre for the Study of Higher Education, Melbourne University; and Professor Leo Goedegebuure, Director, LH Martin Institute stress the challenges in measuring productivity in higher education. Still, they point to the significant success of the universities in lifting their measured productivity, and highlight the opportunities for further gains: outcomes-based funding, modernised employee relations, streamlining research processes, more effective administration, and embracing the digital revolution.
Case study: exporting VET into India
Sue Freeman, CEO and Managing Director, First Impressions Resources (FIR) dis-cusses the experience of Australian retail training organisation FIR’s expansion into India. The chapter provides a case study in practicalities and challenges in exporting educational services to countries where there is a demand for world-class training. Ms Freeman provides advice and cautions for Australian companies looking to export education services into different countries and cultures.
Productivity and growth in financial services
Measured productivity growth in the financial sector has been four and a half times that of the economy’s market sector.
Amy Auster, Deputy Secretary, Economic Division, Victorian Department of Treasury and Finance (with co-authors Anthony Cussen and Chris Judde, Senior Economists, Victorian Department of Treasury and Finance) argues that the strong productivity growth may be due partly to technological change and innovation and its diffusion across the sector. Another important enabler is competition. The Financial System Inquiry found competition to be generally adequate, but recommended a review of competition in the sector every three years.

I M P R O V I N G S E R V I C E S E C T O R P R O D U C T I V I T Y : T H E E C O N O M I C I M P E R A T I V E
14
C O N T R I B U T I O N S
Tourism productivity: key drivers and impediments
Tourism has been growing at three times the rate of the economy and is now one of our top export earners. But Dr Andreas Chai, Senior Lecturer, Griffith Business School, Griffith University, can see potential constraints on growth including inadequate infra-structure, the unavailability of quality training, labour shortages, high staff turnovers, and an increasing reliance on less skilled part-time workers. The rise of the “gig” job market poses a further challenge for managers.
Case study: Tasmania driving innovation in the visitor economy
Professor Richard Eccleston, Director, Institute for the Study of Social Change, University of Tasmania and Professor of Political Science, University of Tasmania; Dr Anne Hardy, Senior Lecturer, University of Tasmania and Director, Tourism Research and Education Network (TRENd); and Dr Dugald Tinch, Lecturer in Resource Economics, Tasmanian School of Business and Economics, report on the Tracer Tourism Tracking Project, which uses a tourist-tracking app and GPS technology to track individual tourist movements over an extended period. The pilot project in Tasmania revealed infrastructure bottlenecks, underused facilities, and long day trips from cities rather than the use of regional accommodation. All of this gives the industry data with which to plan its investment and marketing strategies.
Productivity in accounting services
Accounting has been hit by the offshoring revolution as well as the new generation of digital automation. According to Karen McWilliams, Leader, Policy and Thought Leadership, Chartered Accountants Australia and New Zealand, “robotic process auto-mation will significantly disrupt the offshoring model”. However, in a new twist, some of the offshore locations are automating. But where does that leave the Australian accounting firm? According to the author, “automation and offshoring provide the retained team with the opportunity to refocus on higher value tasks and enhanced finance business partnering”. That will require new skills and, no doubt, see more intense competition between the accountants and other business service providers.
Freight transport and logistics: emerging issues
Efficient freight transport and logistics services are crucial to the nation’s supply chains, but Dr Don Gunasekera, Research Fellow, Centre for Supply Chain and Logistics, Faculty of Science, Engineering and Built Environment, Deakin University; and Dr Hermione Parsons, Director, Centre for Supply Chain and Logistics, Faculty of Science, Engineering and Built Environment, Deakin University warn that the sec-tor’s productivity growth is slowing and it faces major challenges. One is infrastructure: better prioritising of public infrastructure investment, they say, is a key to improving transport productivity. The other challenge is the need for skilled labour and training for the sector to adopt the new and emerging digital technologies.

I M P R O V I N G S E R V I C E S E C T O R P R O D U C T I V I T Y : T H E E C O N O M I C I M P E R A T I V E
15
C O N T R I B U T I O N S
Changed conditions ahead
Michele Huey, Group General Manager, Strategy, Transurban, explores productivity in the transport sector, with a particular focus on road infrastructure and Transurban’s experience. With service sector jobs predominately based in cities, Australia’s cities are growing rapidly. With half of all population growth happening in suburbs more than 20 kilometers away from city centres, road networks are straining under the commuter task. This chapter discusses some of the technologies that will improve commuter flow; funding options – such as changes to fuel excise – that could generate greater revenue for this sector; and ways to optimise our existing infrastructure.
She reports the encouraging results of the first real-world test of user-pays road charging in Australia. At the start of the test most participants preferred the current system of road charges. By the end, a majority expressed a preference for user-pays road charges.
Is digitisation about to make the service sector more productive?
Professor Beth Webster, Director, Centre for Transformative Innovation, Swinburne University, dismisses one piece of folklore and qualifies two popular “facts” about services.
The folklore is that service sector is a productivity laggard which means slower eco-nomic growth. The evidence is that services productivity growth is no slower than in the rest of the economy.
As for the digital revolution, it has the power to both revolutionise as well as annihilate occupations – an important qualification to the popular “fact” that digital disruption will wipe out large numbers of jobs.
Acknowledgements
CEDA wishes to acknowledge the input and expert advice from the CEDA Advisory Group in the development of this policy perspective. The CEDA Advisory Group con-sisted of:
Vivianne Arnold, President, Australian Services Roundtable;
Professor Allan Fels AO, Professorial Fellow, University of Melbourne;
Professor Kevin Fox, Director, Centre for Applied Economic Research, UNSW; and
Dr Jenny Gordon, Principal Adviser Research, Productivity Commission.
These distinguished experts provided guidance in the creation of the report and input into the final recommendations. However, the final report is entirely the responsibility of CEDA and of the individual authors.

I M P R O V I N G S E R V I C E S E C T O R P R O D U C T I V I T Y : T H E E C O N O M I C I M P E R A T I V E
16
S E C T I O N ? . ?
The service sector, long disparaged as a productivity laggard, is now set to play a
more central role in Australia’s future economic performance.
Fortunately, new data show that productivity in the service industries is growing more strongly than previously thought. As Professor Beth Webster points out in Chapter 7.1, business services such as wholesale trade, information and telecommu-nications, professional and technical services and real estate services tend to record higher than average productivity growth.
At the same time, globalisation and technological change have seen services emerge as the fastest growing component of global trade.
Nevertheless, there are major challenges for both the service sector and governments.
The economy’s adjustment to the expansion of manufacturing in Asia has further to go. Industries like steel are hanging on life support in Australia and other high-income economies. At the same time, employment in services and professions under pres-sure from low cost digital imports will contract, while other services and manufacturers better suited to the new economic environment will need to expand.
CEDA overview
Alan Mitchell CEDA Consultant

I M P R O V I N G S E R V I C E S E C T O R P R O D U C T I V I T Y : T H E E C O N O M I C I M P E R A T I V E
17
C E D A O V E R V I E W
If the Australian government repeats the successful strategy of the Hawke, Keating and Howard governments it will embrace rather than resist change in order to ensure that Australia maximises the opportunities created by the growth of China, India and our other Asian trading partners. This would allow the economy to fully exploit its rela-tive abundance of skilled labour and natural resources, which gives it a comparative advantage in the production of high-end goods and services for Asia’s burgeoning middle class.1
The government should start by seeing imports of services and goods for what they really are – not the unfortunate cost of gaining access to export markets, but the chance for Australian industry and consumers to acquire goods and services that can be produced more efficiently overseas, and the opportunity for Australia to specialise in the production of the things it produces most efficiently.
As Karen McWilliams says in Chapter 5.1, changes underway in accounting, automa-tion and offshoring provide Australian accountants with the opportunity to refocus on higher value tasks and enhanced finance business partnering.
The service industry can take comfort from the experience of the manufacturing sector after the tariff reform of the 1980s and 1990s. Manufacturing exports increased, in part because of the more competitive real exchange rate and the increased specialisa-tion in the parts of manufacturing in which we had a comparative advantage.2
A challenge for government is to eliminate unnecessary barriers to trade. In the case of services this will include regulations and institutional arrangements, many of which were designed with no thought of the possibility of trade, but now restrict the access of foreign professionals and other service providers to the Australian market.
The second, and hardly less daunting, challenge for governments will be managing the reform of the part of the service sector they directly control.
Almost a quarter of Australia’s service sector output is in the “non-market” sector of the economy where, despite the involvement of the private sector, prices are deter-mined predominantly by government rather than the market.
This sector is dominated by health, social assistance and education, which are major industries in their own right, while health care and education also make major contri-butions to the output and productivity of the wider economy.
Education already is Australia’s third largest export earner and, with the signing of the China-Australia free trade agreement, China also is seen as a major market for Australian health care services.3
The performance of these industries will become more important as the economy depends more on the growth of the service sector. Being labour intensive, service industries rely heavily for their productivity growth on investment in “human capital”, which includes public spending on health and education.
Yet attempts at reform in health and education have been sporadic, in some cases hatched in secrecy and haste as part of the budget process, and frequently have been defeated by the resistance of vested interests and, too often, by the discovery of likely unintended consequences.
Another important hurdle to reform is the difficulty in measuring productivity. This is a challenge across the service sector, but it is more severe in the non-market sector where there are no market-set prices to signal consumer preferences, to detect varia-tions in quality (as perceived by consumers), and to measure intangible outputs.
I M P R O V I N G S E R V I C E S E C T O R P R O D U C T I V I T Y : T H E E C O N O M I C I M P E R A T I V E
18
C E D A O V E R V I E W
An overview of the service sector
Like most high-income economies, Australia is a service-based economy, and it is likely to become more so with the growth of Asia’s middle class export market.
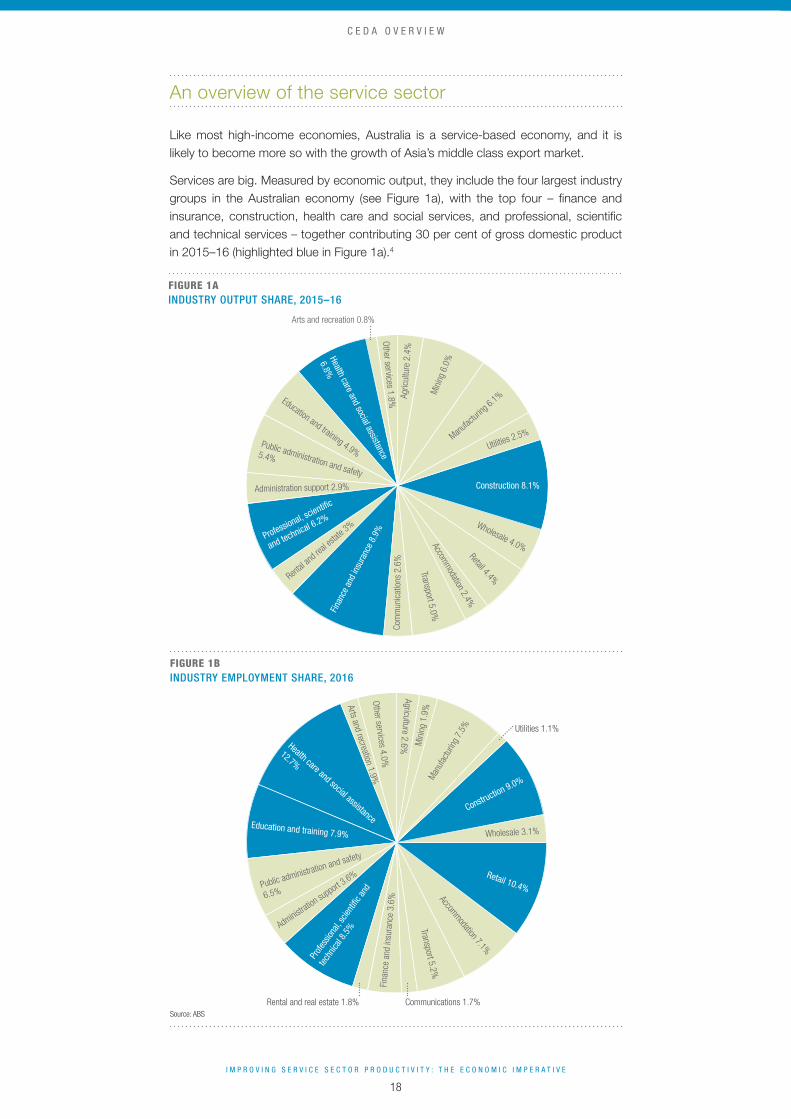
Services are big. Measured by economic output, they include the four largest industry groups in the Australian economy (see Figure 1a), with the top four – finance and insurance, construction, health care and social services, and professional, scientific and technical services – together contributing 30 per cent of gross domestic product in 2015–16 (highlighted blue in Figure 1a).4
FIGURE 1A INDUSTRY OUTPUT SHARE, 2015–16
FIGURE 1B INDUSTRY EMPLOYMENT SHARE, 2016
Source: ABS
Other services 1.8%
Arts and recreation 0.8%
Health care and social assistance
6.8%
Education and training 4.9%Public administration and safety
5.4%
Administration support 2.9%
Professional, scientific
and technical 6.2%
Rental a
nd re
al esta
te 3%
Finan
ce a
nd in
sura
nce
8.9%
Com
mun
icat
ions
2.6
%
Transport 5.0%Accom
modation 2.4%
Retail 4.4%
Wholesale 4.0%
Construction 8.1%
Utilities 2.5%Manufa
cturin
g 6.1%M
inin
g 6.
0%
Agric
ultu
re 2
.4%
Other services 4.0%
Arts and recreation 1.9%
Health care and social assistance
12.7%
Education and training 7.9%
Public administration and safety
6.5%
Administratio
n support
3.6%
Profe
ssion
al, sc
ientifi
c and
techn
ical 8
.5%
Rental and real estate 1.8%
Fina
nce
and
insu
ranc
e 3.
6%
Communications 1.7%
Transport 5.2%Accommodation 7.1%
Retail 10.4%
Wholesale 3.1%
Construction 9.0%
Utilities 1.1%
Man
ufac
turin
g 7.
5%
Min
ing
1.9%
Agriculture 2.6%

I M P R O V I N G S E R V I C E S E C T O R P R O D U C T I V I T Y : T H E E C O N O M I C I M P E R A T I V E
19
C E D A O V E R V I E W
Indeed, both the manufacturers and the mining industry produced less economic output than the smallest of the big four service industry groups, professional, scientific and technical services, in that year.
Altogether the service industries account for almost 70 per cent of total economic output and 87 per cent of employment.i The largest service industry group, finance and insurance, accounts for 8.9 per cent of total economic output, which in 2015–16 was almost 1.5 times the output shares of both manufacturing and mining.
Services also include the nation’s five biggest employers (see Figure 1b), with health care and social services (12.7 per cent of employed), retailing (10.4 per cent), con-struction (8.8 per cent), professional scientific and technical services (8.5 per cent) and education and training (7.9 per cent) together accounting for almost half of Australia’s total employment (highlighted blue in Figure 1b).5
And, despite their reputation for being productivity-growth laggards, the service sector was among our strongest performers in the period 2007–08 to 2015–16. As can be seen in Figure 2, construction, wholesale, retail, communications, finance and insur-ance, rental and real estate, and “other services” all outperformed the market sector as a whole.6
FIGURE 2 MULTIFACTOR PRODUCTIVITY GROWTH, 2007–08 TO 2015–16 (YOY)
Source: ABS
Per cent
–4
–3
–2
–1
0
1
2
3
4Market sector
ServicesGoods
Agric
ultu
re
Min
ing
Man
ufac
turin
g
Utilit
ies
Cons
truct
ion
Who
lesa
le tr
ade
Reta
il tra
de
Acco
mm
odat
ion
and
food
Tran
spor
t
Com
mun
icat
ions
Fina
nce
and
insu
ranc
e
Rent
al a
nd re
al e
stat
e
Prof
essi
onal
, sci
entif
ic a
nd te
chni
cal
Adm
inis
tratio
n su
ppor
t
Arts
and
recr
eatio
nal
Othe
r ser
vices
All m
arke
t sec
tor
1.81
–0.10
–2.00–2.47
0.83
2.17
1.15
–0.10
–0.80
1.151.42
2.89
0.29
–2.73
–0.30
0.46 0.29
i Services broadly defined include the utilities and construction. The “pure” services together account for almost 60 per cent of economic output and 80 per cent of employment.

I M P R O V I N G S E R V I C E S E C T O R P R O D U C T I V I T Y : T H E E C O N O M I C I M P E R A T I V E
20
C E D A O V E R V I E W
Over the longer term, Figure 3 shows that average multifactor productivity growth in seven service industry groups equalled or exceeded that of the market sector as a whole over the period since 1995–96.
Productivity growth also compares well with US services, as shown in Figure 4a. However, the comparison of productivity levels in 2005 is less flattering, as shown in Figure 4b.7 The data is dated, but the message is still important.
A decade later the eminent US economist Robert Gordon would show that about half of the gap between the US and European labour productivity could be explained by the lagging productivity performance of Europe’s retail industry.8
FIGURE 3 MULTIFACTOR PRODUCTIVITY GROWTH RELATIVE TO MARKET SECTOR 1995–96 TO 2015–16
Source: ABS
Per cent
–3.0
–2.5
–2.0
–1.5
–1.0
–0.5
0.0
0.5
1.0
1.5
2.0
2.5
Other s
ervice
s
Arts a
nd re
creati
on
Admini
strati
on su
pport
Profes
siona
l, scie
ntific
and t
echn
ical s
ervice
s
Renta
l and
real
estat
e
Finan
ce an
d ins
uranc
e
Telec
ommun
icatio
ns an
d med
ia
Trans
port a
nd st
orage
Acco
mmodati
on an
d foo
d Re
tail
Wholes
ale
Constr
uctio
n
Utilitie
s
–2.3
0.5
2.0
0.6
0.1 0.1 0.0
1.5
–2.2
–0.4
–1.0–1.2
–0.4
FIGURE 4A US AND AUSTRALIAN SERVICES MULTIFACTOR PRODUCTIVITY GROWTH 1991–2014*
*Australia, year to June. ** US includes real estate. Sources: ABS, US Bureau of Labor Statistics
Per cent, YOY
–1.5
–1.0
–0.5
0.0
0.5
1.0
1.5
2.0
2.5
3.0
US
Australia
Financeand
insurance**
Information media and
telecommunications
Transport and
storage
RetailWholesaleConstructionUtilities

I M P R O V I N G S E R V I C E S E C T O R P R O D U C T I V I T Y : T H E E C O N O M I C I M P E R A T I V E
21
C E D A O V E R V I E W
According to Gordon, the key to the high US retail productivity was “big box” retailing which, in Europe, could not easily fit into the more compact cities. US-style big box retailing also is uncommon in Australia, where until recently new entrants to the retail market had to run the gauntlet of anti-competitive planning regulations.9
The service sector’s real output has grown faster than gross domestic product because demand for services has increased disproportionately with real incomes. Estimates of the responsiveness of demand for services to changes in income, made by a predecessor of the Productivity Commission back in the 1980s, suggested rela-tively high income elasticities of demand. For example for air transport, the income elasticity was 2.2, meaning a one per cent increase in real income would result in more than a two per cent increase in demand for air transport. Other high elasticity estimates included repairs (1.4), finance (1.4) and business services (1.3), as well as goods such as consumer durables (1.5) and private vehicles (1.2).10
FIGURE 4B AUSTRALIAN LABOUR PRODUCTIVITY LEVEL RELATIVE TO US, 2005
Source: Aust. Treasury
FIGURE 5 DEMAND FOR OUTPUT 2013–14 (%)
Source: ABS
Per cent
0
20
40
60
80
100
120
Commun
icatio
ns
Constr
uctio
n
Utilitie
s
Governm
ent
Health
Educ
ation
Wholes
ale
Prope
rty an
d bus
iness
servi
ces
Retai
l
Trans
port
Culture
Finan
ce
Acco
mmodati
on
102.496.2 95.1 94.7
79.3 76.471.3 68.8 66.8
59.152.2 51.9 49.7
0 20 40 60 80 100
ExportsInvestmentGovernmentconsumption
Private consumption
Intermediate inputs
Utilities and construction
Social services
Personal services
Producer services
Distribution services
Manufacturing
Mining
Agriculture 63
27
52
46
76
28
7
47 5 0 48 0
24 66 1 2
64 2 60
14 2 6 2
36 3 6 9
18 1 7 22
1 80 64
10 60 21

I M P R O V I N G S E R V I C E S E C T O R P R O D U C T I V I T Y : T H E E C O N O M I C I M P E R A T I V E
22
C E D A O V E R V I E W
The service sector also is a major supplier of intermediate inputs to the economy’s other sectors, as shown in Figure 4. And, partly because of that, it contributes more to exports than is apparent from the trade statistics. The OECD estimates of trade by value suggest that the service sector contributed about 40 per cent of Australia’s cross-border exports in 2011, compared with its direct contribution in that year of just 16 per cent.11
In 2015–16, services directly accounted for 22 per cent of exports recorded in the balance of payments.
There are four modes by which Australian services directly enter international trade: conventional over-the-border sales to foreigners, sales to foreign visitors (as in tourism and education), sales by Australian business representatives going abroad, and sales by the foreign subsidiaries or joint ventures of Australian enterprises.12 The last of those avenues is likely to play an important role in the export of high-value business services to China and the rest of Asia.
When direct and indirect contributions to exports are taken into account, the service sector has been our biggest export earner.13
Discussion
In the long run, the growth of both multifactor productivity and capital per worker explain most of the difference in living standards between the rich and poor economies.14
Service sector productivity and allocative efficiency matter as much for advanced economies like Australia as manufacturing productivity and allocative efficiency matter for the industrialised emerging market economies.
And they will matter more for Australia in the decades ahead as demographic change and slower projected labour productivity conspire to slow the growth of Australia’s per capita national income to rates not seen since the troubled 1970s.15
However, wringing higher meaningful rates of productivity growth out of the labour-intensive service sector will be a more technically difficult task than reforming the goods sector in the 1980s and 1990s.
As already discussed, the problem starts with measuring productivity, a concept developed in the industrial era, in the modern service industries.
Productivity is the ratio of economic output to the factors of production – capital, labour and intermediate inputs – that make it possible. Productivity growth therefore is the difference between the output and input growth rates.
There are multiple measures of productivity, from the commonly used labour pro-ductivity which measures output per hour worked, to total factor productivity, which measures output against the inputs of all production factors: labour, capital and intermediate inputs. The Australian Bureau of Statistics’ estimates of multifactor pro-ductivity measure output against the inputs of the primary factors, labour and capital.
But what exactly is the output from a consultation between a doctor and patient, or between lawyer or financial advisor and client, and how do we measure it? How do we know if it is high or low, or growing or falling? The differences, more often than not, are a matter of quality. And what meaning does an increase in productivity have if the extra services produced are not what consumers want? This is a key issue in the non-market services.

I M P R O V I N G S E R V I C E S E C T O R P R O D U C T I V I T Y : T H E E C O N O M I C I M P E R A T I V E
23
C E D A O V E R V I E W
There often are simple indicators of productivity: students to teachers, patients treated per doctor and so on. But productivity estimates can be very misleading if they do not take account of qualitative differences.
Australia is not the only economy struggling with these issues.
One of the many explanations for the slowdown in US measured productivity growth, which began long before the global financial crisis, is that a steadily rising share of US output is being produced in the service sector where output is more difficult to measure.
American economist Zvi Griliches, in his presidential address to the American Economic Association, pointed to the increasingly important but “unmeasurable” sectors of the economy and warned that the economy had “shifted into uncharted waters”.16
As it happens, Australia’s most difficult to measure sector contains two huge indus-tries: health care and education. They are a part of government-provided human services, and they are largely outside the market sector. Where there are no market prices for output, costs become the measure of output, and measured productivity growth is zero.
There are two ways to lift productivity: by increasing efficiency, which can take us only as far as the current technological frontier, or by innovation that pushes the frontier outwards. We don’t need the market to achieve either result. But neither of these supply-side advances tells us what additional goods and services we should produce with our enhanced productivity.
For that we need consumers to signal their preferences. We need prices generated by the interaction of the supply and demand sides of efficient markets to determine how to allocate our resources, as well as to measure changes in economic output (nominal output deflated by the general increase in costs) and quality (as indicated by changes in relative prices).17 And, of course, we need government taxes and transfer payments to ensure that the whole community can participate in the markets.
In his chapter on health care, Rohan Mead argues for the injection of greater com-petition into the industry as a means of encouraging greater efficiency and consumer choice. He cites the call by the Harper competition policy review for greater consumer choice in government human services including health care.
The mantra consistently offered about Australia’s health care system, he says, too easily accepts the primacy of producer interests over those of the patient, and downplays its palpable waste and inefficiency. Innovation in managerial and business systems in health care, he continues, has been glacial by comparison with innovation in medicine.
In their accompanying paper, Professor Jane Hall and Associate Professor Kees van Gool approach the issue of consumer interest by stressing the need for greater alloca-tive efficiency as well as productivity.
If the primary objective of health care is better health, she argues, the value of all that activity should be measured in better health outcomes: “The discussion of productivity is strictly a focus on technical efficiency; allocative efficiency is the other part of the picture.”
However, she is less confident about the power of the market to produce the desired result. The problem, she goes on to explain, is that in health care we don’t have effi-cient markets because consumers don’t know what treatment they need. They rely on the advice of the sellers – their medical practitioners. Any attempt to increase the role of consumer choice therefore needs to be approached with care.

I M P R O V I N G S E R V I C E S E C T O R P R O D U C T I V I T Y : T H E E C O N O M I C I M P E R A T I V E
24
C E D A O V E R V I E W
The need to better inform the choices facing consumers, insurance funds and governments has led health economists to develop more reliable indicators of the cost-effectiveness of health care outputs. One important measure of effectiveness is the Quality Adjusted Life Year (QALY) developed by US economist Alan Williams. This measures the output in terms of the life-years added by a health intervention adjusted for the quality of that life.
For governments the imbalance between producer and consumer information and bargaining power in the health care market raises spectre of US-style cost inflation. The attraction of Medicare, with its waiting lists and restricted choices, has been its successful cost control. Yet, it appears there still may be scope for an increase in competition.
Attempts to find a private market solution have revolved around health insurance, par-ticularly the development of budget-holding insurers that would purchase health care services on behalf of their members.
A recent example of this was the review led by Dr Christine Bennett for the Rudd government. The 2009 Bennett report urged the redesign of Medicare to allow greater consumer choice, competition and innovation. It proposed continued universal health insurance delivered by competing public and private insurers, purchasing Medicare health services from the public and private health care systems, and funded by the Commonwealth on a risk-adjusted basis for each member. The intention would be to increase competition in the supply of health care services in a way that would pass part of the benefit on to consumers.
However, like Professor Hall, Dr Bennett stressed the complexity of the task.18
Health care is in the non-market sector for a reason, and so is most of education.
As best as anyone can measure, university productivity has been growing at an impressive rate.
The most recent study, by ANU’s Professor Keith Houghton and Amir Moradi-Motlagh and Professor Christine Jubb at Swinburne University of Technology, estimates the multifactor productivity of Australia’s universities grew at an impressive 2.6 per cent a year between 2007 and 2013, mainly as a result of technological progress, including the use of information technology in teaching and research, and changes in enterprise agreements.19
The study makes the best of the data available: total expenses as a proxy for the inputs, and full-time equivalent students and weighted publications as proxies for teaching and research.
But, as Professor Leo Goedegebuure and Associate Ian Marshman point out in their chapter on university productivity, any productivity estimates are likely to be affected by the inherent difficulty of measuring university outputs and inputs. These difficulties include the multi-product nature of the enterprises, and the importance of the quality of both outputs and inputs, including the quality of the students who are co-producers of university outputs.
Undoubtedly, as Professors Goedegebuure and Ian Marshman say, the universities have made considerable advances on the output side over the past decade. Research performance, as assessed under the Excellence in Research for Australia program, shows the number of students and university revenue have increased strongly.
But their point regarding the ambiguity of the output and input data remains.

I M P R O V I N G S E R V I C E S E C T O R P R O D U C T I V I T Y : T H E E C O N O M I C I M P E R A T I V E
25
C E D A O V E R V I E W
In a 2015 speech, Professor Gary Banks AO, a former chairman of the Productivity Commission and now Dean of the Australia and New Zealand School of Government, expressed concern that the universities’ dependence on profitable foreign students and the acceptance of lower ATAR entry scores for domestic students may have led to a lowering of academic standards. He claimed that some universities appeared to be using their teaching courses as cash cows, and accused the universities of degrading the teaching of economics partly because of the limited foreign student demand – a change that, he believed, would take its toll on the suitability of entrants to the public service.20
Professors Goedegebuure and Marshman argue the universities have maintained appropriate admission practices, but say that open-ended funding based solely on volume and not on outputs is bad public policy. They suggest that funding for teaching and learning should be partly linked to student retention and graduation rates. That, of course, is akin to the reform subsequently announced by the government but which carries an additional sting in the tail by making the universities accountable for the employment outcomes of their graduates.
That suggests the government may be concerned about the direction of academic standards.
Care also is needed in utilising private investors to fund government infrastructure. The criteria for infrastructure investment should embrace more than the potential to turn a profit. When, in their chapter on road freight and logistics, Dr Gunasekara and Dr Parsons call for better prioritising of public infrastructure investment, it was invest-ment based on rigorous cost-benefit analysis that they had in mind. Bumping road projects up the priority list because there are “tollable”, or funding new infrastructure by privatising existing infrastructure with legislated monopoly rights are inferior options to simply funding properly selected infrastructure by government borrowing.
More general road user charges are a different issue, and Michele Huey’s discussion of Transurban’s trial of road charging in Melbourne includes the encouraging news that a majority of the participating motorists left the experiment expressing a preference for user-charges over traditional road charges. Unfortunately, these surprisingly open-minded motorists seemed to baulk at the idea of congestion pricing, which could add more to the efficiency of the road network.
Measuring productivity in the market sector can be almost as difficult as in the non-market human services. Finance and insurance is a case in point. But there are far fewer concerns about letting markets and competition drive efficiency and resource allocation. The concern is more likely to be lack of competition.
As Amy Auster reminds us, the Financial System Inquiry led by David Murray described competition in the financial services sector as “adequate”, and devoted 12 of its 44 recommendations to ensuring the ongoing competitiveness of the sector.
The government has acted earlier than expected on one important recommendation by asking the Productivity Commission to conduct the first triennial review of competi-tion in the financial system.
The decision comes when the major banks’ returns on equity – which in the past have been high by international standards – have fallen sharply as they have raised additional capital required by the prudential regulator. It was accompanied by the announcement of the new levy on the major banks’ liabilities, which the government also presented as a boost to competition.

I M P R O V I N G S E R V I C E S E C T O R P R O D U C T I V I T Y : T H E E C O N O M I C I M P E R A T I V E
26
C E D A O V E R V I E W
The Commission’s review no doubt will test that claim, as well as the hopes that digital technology will facilitate the entry of significant new competition.
David Norman of the Reserve Bank’s Financial Stability Department argues that the major banks’ returns on equity are unlikely to return to their former levels without the banks taking additional risk or achieving substantial productivity gains.21
But perhaps the most contentious of all the competition policy issues in the service sector will be those thrown up by the newly trade-exposed services, like the accoun-tants who feature in Karen McWilliams’ chapter.
There is no doubting the extent of disruption that is befalling these service provid-ers, or the pressures that will be put on government. But the only long-term solution consistent with Australia fully capitalising on Asia’s growth is for Australian industries to adjust.
We need the trade-exposed services to become aggressive exporters themselves into an international market that, like manufacturing before it, is likely to become increas-ingly marked by niche specialisation and intra-industry trade.
We also need increased outbound foreign investment by service industries as they establish offices and partnerships in Asia’s markets. Foreign investment is the prin-cipal means by which businesses establish a commercial presence to deliver service exports to a foreign market.
That, in turn, may constrain our ability to reject Asian foreign direct investment in Australia.
Endnotes
1 Asian Development Bank, 2010. Key Indicators for Asia and the Pacific 2010, page 3.
2 Gordon Menzies, G & Heenan, G. 1993. Explaining the Recent Performance of Australia’s Manufactured Exports. RBA
3 Brown, K. & Van Nieuwenhuizen, S. 2006. Australia-China Healthcare Opportunities. China Studies Centre, University of Sydney.
4 Australian System of National Accounts 2015-16, ABS 5204.0
5 Labour Force, Australia, Detailed, Quarterly May 2016, ABS 6291.0.55.003
6 Estimates of Industry Multifactor Productivity Australia, 2016, ABS 5260.0.55.002
7 Young, A. et al., 2008. International comparison of industry productivity, Economic Roundup Issue 3, Treasury.
8 Gordon, R.J, 2004. Why was Europe Left at the Station when America’s Productivity Locomotive Departed? NBER
9 Productivity Commission, 2011. Performance Benchmarking of Australian Business Regulation: Planning, Zoning and Development Assessments Vol1, page 277
10 Productivity Commission, 2002. Australia’s Service Sector: A Study in Diversity, page 26.
11 Thirwell, M., AIBS 2015: Services, foreign affiliates and FATs, Australian Trade and Investment Commission.
12 Productivity Commission 2002, op. cit., page 63.
13 Ibid., page 65.
14 Krugman, P. 1994. The Age of Diminishing Expectations, MIT Press.
15 Australian Treasury, 2015. Tax Discussion Paper, page 10.
16 Productivity Commission 2002, op. cit, page 87.
17 ONS Productivity Handbook, page 74.
18 National Health and Hospitals Reform Commission, Final Report 2009.
19 Houghton, K. et al., Productivity analysis of Australian universities, Pacific Accounting Review.
20 Banks, G.2015 Public Policy and the Universities: resolving the ‘tensions’. ANZSOG
21 Norman, D. 2017. Returns on Equity, Cost of Equity and the Implications for Banks, RBA.
22 Productivity Commission, 2002, page 64.

27
1.1 Business and managerial system innovation in the health sector Rohan Mead
1.2 Improving the productivity of health services Professor Jane Hall Associate Professor Kees van Gool
Productivity of health services
SECT ION
1.0

I M P R O V I N G S E R V I C E S E C T O R P R O D U C T I V I T Y : T H E E C O N O M I C I M P E R A T I V E
28
Rohan Mead is the group
managing director of Australian
Unity. Australian Unity is a
national health, wealth and living
company, offering products and
services, including private health
insurance and health care services, to about 300,000
members and nearly one million customers. Mr Mead
is also chairman of the Business Council of Australia’s
Healthy Australia task force and a member of its
Indigenous Engagement task force. He is a director of
the Centre for Independent Studies and the Business
Council of Co-Operatives and Mutuals.
1.1Business and managerial system
innovation in the health sector
Rohan Mead

I M P R O V I N G S E R V I C E S E C T O R P R O D U C T I V I T Y : T H E E C O N O M I C I M P E R A T I V E
29
S E C T I O N 1 . 1
Introduction
There is a mantra consistently offered about Australia’s health system, one that has too easily taken hold and been subjected to too little scrutiny.
Australia’s health system is world class, the mantra goes. Yes, some improvements and efficiencies could be found, but Australians can rest assured they have access to high quality, affordable care delivered by a combination of public and private resources. The underlying, unstated theme is “at least we aren’t in America”.
This view lets the Australian health sector, both public and private, off too lightly. It underestimates the impact of demographics, including a population ageing profile no longer looming but actually upon us. It fails to acknowledge the current health sector is still designed around a 200-year history of acute and episodic treatment rather than the 21st century demand drivers of older people living with multiple chronic conditions. It too easily accepts the historical primacy of producer interests over those of the patient. And it downplays palpable waste and inefficiency in the health sector diverting crucial resources away from those needing care.
On this last point alone, the Productivity Commission suggests “the efficiency of the health sector could be increased by up to 20 per cent by bringing performance up to best practice across a range of areas”.1
And Professor Bruce Robinson, who headed the Federal Government’s Medical Benefits Scheme Review Taskforce, said it “has been estimated that 30 per cent or more of health expenditure is wasted on services, tests and procedures that provide no or negligible clinical benefit, and in some cases might be unsafe and could actually cause harm to patients”.2
In other words, there is ample scope for improving the sector to deliver more value to consumers. The difficulty is where to start. In recent history, attempts at funda-mental reform have been floated, such as then-Prime Minister Kevin Rudd’s 2007 push to change federal-state responsibilities for health and hospital care. The Turnbull Government is currently looking for more incremental reform, such as reviewing the Medical Benefits Scheme listings and the Prostheses List to find savings.3
In discussing the “how” of improving the health care sector, innovation becomes a fundamental part of the discussion. But what are we talking about when we talk about innovation in health care?
There has been an emphasis toward “molecular” innovation in the health care sector. Much is made of the latest drug or miniature device or piece of robotic operating equipment as confirming evidence for an innovative health care culture. Make no mistake that these breakthroughs can be critically important for those directly affected. But we should be looking at innovation through a much wider lens.
Innovation in health care needs to reorientate toward business system innovation. This is where a true step change in health care can occur. This is the best chance for the “triple aim” of health care’s improvement movement – improved patient experience, improved population health and reduced per capita cost of health care.
What do I mean by business system innovation? Let’s look to the past to imagine the future. Imagine summoning Alexander Graham Bell from the grave and transport-ing him into a modern, yet average, Australian household, its occupants a group of millennials. We ask him to find the device he is credited with inventing in 1876, the telephone. Bell is stumped. There is nothing remotely like his invention. Then Bell is
I M P R O V I N G S E R V I C E S E C T O R P R O D U C T I V I T Y : T H E E C O N O M I C I M P E R A T I V E
30
S E C T I O N 1 . 1
directed to the tiny rectangle sitting on the coffee table before him. He is incredulous, and even more so when it is explained just what this device can do, and how much it cost.
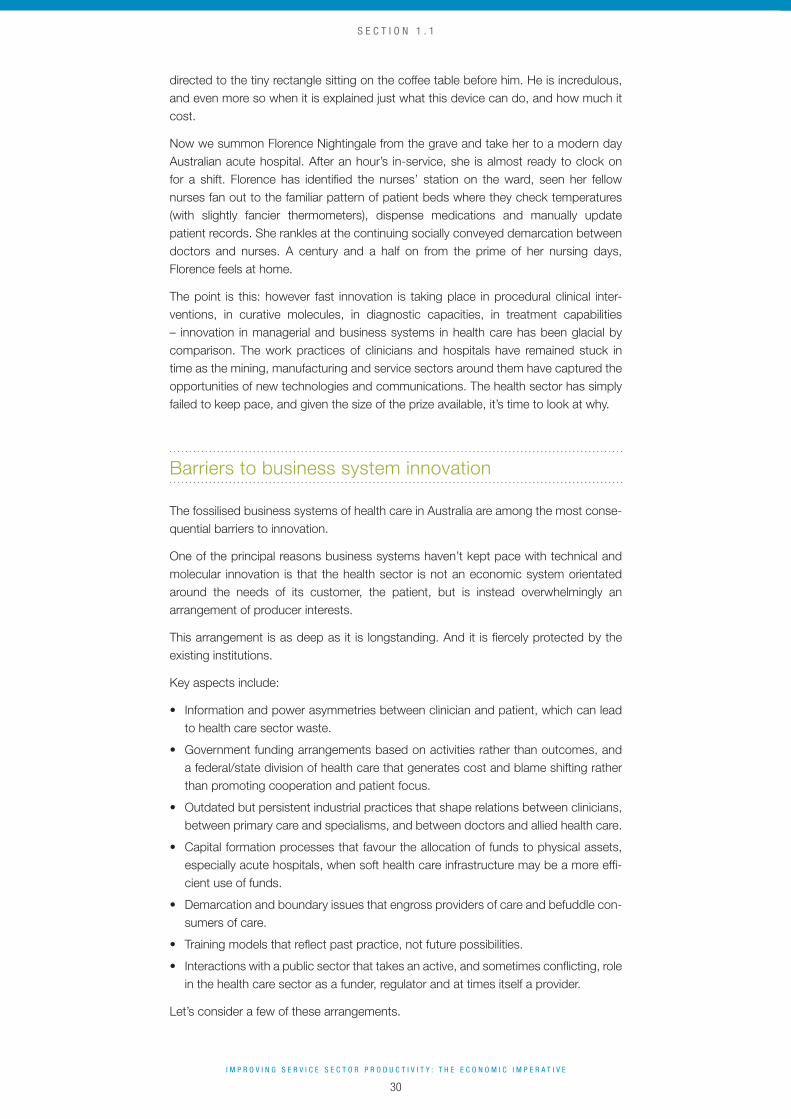
Now we summon Florence Nightingale from the grave and take her to a modern day Australian acute hospital. After an hour’s in-service, she is almost ready to clock on for a shift. Florence has identified the nurses’ station on the ward, seen her fellow nurses fan out to the familiar pattern of patient beds where they check temperatures (with slightly fancier thermometers), dispense medications and manually update patient records. She rankles at the continuing socially conveyed demarcation between doctors and nurses. A century and a half on from the prime of her nursing days, Florence feels at home.
The point is this: however fast innovation is taking place in procedural clinical inter-ventions, in curative molecules, in diagnostic capacities, in treatment capabilities – innovation in managerial and business systems in health care has been glacial by comparison. The work practices of clinicians and hospitals have remained stuck in time as the mining, manufacturing and service sectors around them have captured the opportunities of new technologies and communications. The health sector has simply failed to keep pace, and given the size of the prize available, it’s time to look at why.
Barriers to business system innovation
The fossilised business systems of health care in Australia are among the most conse-quential barriers to innovation.
One of the principal reasons business systems haven’t kept pace with technical and molecular innovation is that the health sector is not an economic system orientated around the needs of its customer, the patient, but is instead overwhelmingly an arrangement of producer interests.
This arrangement is as deep as it is longstanding. And it is fiercely protected by the existing institutions.
Key aspects include:
Information and power asymmetries between clinician and patient, which can lead to health care sector waste.
Government funding arrangements based on activities rather than outcomes, and a federal/state division of health care that generates cost and blame shifting rather than promoting cooperation and patient focus.
Outdated but persistent industrial practices that shape relations between clinicians, between primary care and specialisms, and between doctors and allied health care.
Capital formation processes that favour the allocation of funds to physical assets, especially acute hospitals, when soft health care infrastructure may be a more effi-cient use of funds.
Demarcation and boundary issues that engross providers of care and befuddle con-sumers of care.
Training models that reflect past practice, not future possibilities.
Interactions with a public sector that takes an active, and sometimes conflicting, role in the health care sector as a funder, regulator and at times itself a provider.
Let’s consider a few of these arrangements.

I M P R O V I N G S E R V I C E S E C T O R P R O D U C T I V I T Y : T H E E C O N O M I C I M P E R A T I V E
31
S E C T I O N 1 . 1
Clinician/patient relationship
The interaction a patient may have with a specialist is instructive of a broader malaise. How is a patient referred to a specialist? The answer is most often through the rec-ommendation of a GP. But on what criteria? Does a patient know, or do they feel empowered to ask? Even if the patient has an idea which specialist he or she wants to use, how are they making that judgement? It may have come from the recommenda-tion of a friend or colleague, but are there any objective criteria, such as procedure success rates, that they have access to? Is the specialist’s “gap fee”, the amount beyond what he or she claims from the government for the service, more or less than his or her colleagues? If a specialist orders tests, who owns the information?
Taking this line of questioning further, how can a patient know the procedure they are about to undergo, or the prosthetic device they are having implanted, is their best option? Is there any available data on this, or is the clinician’s word their only source of information? There has been some recent excellent work in this space from the Australian Commission on Quality and Safety in Healthcare. The Commission estimates that preventable adverse events in Australia add between six and 10 per cent to the costs of the system, that is between $10 billion and $15 billion.
There are relatively simple business system fixes that can help a patient answer a number of these crucial questions. But there is powerful resistance to moves to empower the patient in this way.
Industrial practices
Industrial practices in the health care sector are all too often steeped in the history of producer interest at the expense of the patient.
There are a range of “scope of practice” issues that could be appropriately rethought in the light of 21st century understandings. While the GP’s place is often rightly at the centre of patient care, surely they could do more for more if freed up from the tasks well within the capability of others in the health sector, such as nurses.
A similar argument can be mounted for industrial practices inside hospitals, which are too often built around the working day of the staff rather than the preferences of the patient. Catering is but one example.
These are on paper simple and manageable operational changes, but are unfortu-nately redolent with historical, and powerful, producer interests. But the size of the prize for change to even these straightforward areas is enormous when you multiply small changes through a $160 billion per annum system.
It is time to cast a more critical eye over the power some of these producers wield.
Case study of waste in health care
Australian Unity recently asked its members to share their
experiences of waste in the health care system. One member wrote:
“ My father fell and broke his femur in March 2015. He was
admitted to the general hospital. His medicine that he had been
taking at home was not able to be used in the hospital so he
was dispensed another lot. He was then transferred to another
hospital, then a rehab centre, then another rehab centre, back to
the general hospital and then to a nursing home. Every time he
was transferred to another institution the same applied. When he
eventually settled, we had this great bag of drugs that he was not
able to use and had to be disposed of. What a waste of resources
and money.”

I M P R O V I N G S E R V I C E S E C T O R P R O D U C T I V I T Y : T H E E C O N O M I C I M P E R A T I V E
32
S E C T I O N 1 . 1
Government’s role
The splayed nature of health care across all levels of government, and the structural rigidity the federal system imposes, lets government at each level off the hook when it comes to business system innovation in health care. As but one example, Medicare reimbursements still depend primarily on face-to-face medical consultations. This dampens innovation in areas like telehealth, which may be more convenient for older Australians and those living in rural and regional areas.
Like the private sector, government too can clearly benefit from business and manage-rial innovation. Professor Ian Harper’s review of competition policy in 2016 had some welcome ideas in this regard.
The path forward to better health care through business system innovation
The path to better health care is clear.
Our health sector should have the consumer, not the provider, as the focus. If this sounds trite, recall the powerlessness of a hospital patient wanting a meal outside of normal serving times, or being one of the 11 per cent of Australian patients having an adverse event during an overnight hospital stay.4
Our health sector should move from managing supply (as measured by volume of health services provided), to actively managing demand, as measured by improved health outcomes. To best achieve this, our health sector should be data driven and integrated, so a patient has timely access to a range of information, including cost, to ensure optimum care. And it should direct its hard and soft infrastructure provision to addressing these conditions rather than the current focus on acute hospital care.
These parameters help set a framework for some suggested business system innova-tion in health care.
First, the health sector must pursue every opportunity to foster and encourage com-petition, rather than continuing to allow the providers of care (including government) to control too much of the health care market. Encouraging competition is the fastest way to encourage innovation and deliver greater user choice. This is one of the key messages arising from Ian Harper’s Competition Policy Review.5 Harper’s conclusion that “innovation in service provision should be stimulated, while ensuring minimum standards of quality and access in human services” is an entreaty to government in its future policy formation.
“Governments need to allow room for providers to innovate in response to changing user demands, and to benchmark the performance of providers, credibly threatening to replace those that do not meet the needs of users,” Harper concludes.6
To support this, there must be a greater focus on getting performance information in health care into the hands of patients, as well as into the hands of clinicians and providers of care. And there must be more efficient use of information across the sector, including cooperation between different parts of the system in its effective dissemination.

I M P R O V I N G S E R V I C E S E C T O R P R O D U C T I V I T Y : T H E E C O N O M I C I M P E R A T I V E
33
S E C T I O N 1 . 1
Performance and quality information can put patients on a more solid footing, which can in turn deliver more patient choice. And it can drive business efficiencies through the minimisation of waste. Making health information more accessible across the board, subject to an appropriate privacy framework, contributes to future innovation.
A start has been made on this. The Australian Commission on Quality and Safety in Health Care has in recent times seen the creation of the Atlas of Healthcare Variation. The atlas presents a clear picture of substantial variation in health care use across Australia, in areas such as antibiotic prescribing, surgical, mental health and diagnos-tic services. While the Atlas is only just at the start of its development, it should help drive behaviour change among clinicians and practitioners, and see consumers with more information at their disposal to ask pertinent questions. This is true business system innovation.
More public reporting of performance and cost data, from hospitals through to clini-cians can drive efficiency, empower consumers and encourage innovation. The mining sector and its safety record now, compared to decades prior, is a prime example of the impact of improved performance measurement regimes.
The health care sector should, like other sectors of the economy, be incentivised to modernise existing clunky business systems and take advantage of the new tech-nology available. Not diagnostic technology, but accounting and telecommunications technology. One example would be to change the Medicare reimbursement system away from its current default setting of in-person consultations. Taking greater advan-tage of digital business models could substantially lower the costs and increase the effectiveness of providing primary care.
Incentives can drive innovation directly. If reimbursement is based on outcomes, not activity, particularly also in the treatment of chronic conditions where more than one health care provider might be required, the environment for innovation is created. Moving faster to outcomes based reimbursement across the health system would be an important paving stone in the path forward, and bundled, to better health care through innovation.
Conclusion
One in every 10 dollars in the Australian economy is spent in the health care sector.7 Yet compared to other economic sectors, such as mining, manufacturing and other services, it has not kept pace in terms of business system innovation. This cost is huge, both to overall productivity of the nation and to individual wellbeing.
Australia can do better. We need to take the learnings from other industrial and mana-gerial areas, and apply them in health care. We need to open up access to information to patients and to the public, both in terms of sharing health information between practitioners, and more broadly regarding performance of institutions and individual clinicians. We need to create incentives, such as outcomes-based funding, that drive valuable change in century old business practices.
This way, valuable innovation can be given a chance to thrive, to the benefit of patients, taxpayers and the economy as a whole.

I M P R O V I N G S E R V I C E S E C T O R P R O D U C T I V I T Y : T H E E C O N O M I C I M P E R A T I V E
34
S E C T I O N 1 . 1
Endnotes
1 Productivity Commission Research Paper “Efficiency in Health” April 2015, p9
2 Health Minister Sussan Ley media release Sep 27, 2015 (though the 30 per cent figure has been contested by the Australian Medical Association)
3 Health Minister Sussan Ley media release Dec 19, 2016
4 Australian Institute of Health and Welfare, Australia’s Health 2016, Section 6.14
5 Harper, Competition Policy Review, March 2015, p36
6 Ibid, p35
7 Australian Institute of Health and Welfare: Health Expenditure Australia 2014–15
I M P R O V I N G S E R V I C E S E C T O R P R O D U C T I V I T Y : T H E E C O N O M I C I M P E R A T I V E
35
Professor Jane Hall is one of the
most high profile health economists
in Australia with an international
reputation built on both research
contribution and policy analysis.
She has been appointed as a
Distinguished Professor in the Business School at the
University of Technology Sydney, where she is a member
of the Centre for Health Economics Research and
Evaluation (CHERE). She has worked across many areas
of health economics, including health technology
assessment, measurement of quality of life, health
workforce, financing and funding and comparative policy
analysis.
She is recognised as one of the key commentators on
health policy in Australia, particularly on health reform and
funding issues.
Associate Professor Kees van Gool
is a health economist with extensive
experience in international, national
and regional health policy research.
He is the Deputy Director of
the Centre for Health Economics
Research and Evaluation, based at the University of
Technology Sydney. He leads a team of researchers
working on the financing and economics of the Australian
Health Care system, including a special focus on primary
care. He was a lead investigator in two independent
reviews of the Extended Medicare Safety Net conducted
for the Department of Health and has been a chief
investigator on a number of competitive grants. He has
worked extensively on cancer care, screening, cystic
fibrosis and policy evaluation.
1.2Improving the productivity
of health services
Professor Jane Hall Associate Professor Kees van Gool

I M P R O V I N G S E R V I C E S E C T O R P R O D U C T I V I T Y : T H E E C O N O M I C I M P E R A T I V E
36
Why does it matter?
Health services are a significant sector of the Australian economy. Australian health spending, at 10 per cent GDP, is not high by international standards; indeed the Australian system already performs well in terms of its overall cost, its health outcomes whether measured by life expectancy or disability free life years, access to high quality services and modern technology, and its financing.1 But the sector faces significant challenges. Most of the financing comes from governments, around 68 per cent of the total, making it a large spending program for both the Commonwealth and states at a time when government budgets face continuing deficits. Costs will continue to rise, driven by more expensive technologies and services, rising incomes and expectations, and an ageing population. The ageing population contributes not just to the increasing demand for health care but also to the shrinking tax base, as Australia’s tax revenues are heavily reliant on income taxes.2
Not surprisingly, treasurers and finance ministers would like to reduce expenditures, or at least hold the growth in public expenditure. Improved productivity can increase the amount of health services delivered to the community without requiring more capital and labour in their production.3 This is far more politically popular than cutting services, which affects not just patients and their families but also health care providers. Health care expenditure ends up in private income: medical services expenditure is doctors’ income; pharmaceutical expenditure is drug company revenue.
S E C T I O N 1 . 2
FIGURE 1 OECD % GDP VS LIFE EXPECTANCY
Source: OECD
AUS
AUT
BEL
BRA
CAN
CHL
CHN COL
CRI DNK
EST
FIN
FRA
DEU GRC
HUN
ISL
IND
IDN
ISR ITA
JPN
KOR
LVA LTU
LUX
MEX
NLD NZL NOR
POL
PRT
RUS
SVK
SVN
ESP CHE
TUR
GBR
USA
R2 = 0.51 65
70
75
80
85
0 1000 2000 3000 4000 5000 6000 7000 8000 9000 10,000
Life expectancy in years
Health spending per capita (USD PPP)
CZE
SWE
IRL
AUS AustraliaAUT AustriaBEL BelgiumBRA BrazilCAN CanadaCHL ChileCHN ChinaCOL ColombiaCRI Costa Rica
CZE Czech Rep.DNK DenmarkEST EstoniaFIN FinlandFRA FranceDEU GermanyGRC GreeceHUN HungaryISL Iceland
IND IndiaIDN IndonesiaIRL IrelandISR IsraelITA ItalyJPN JapanKOR KoreaLVA LatviaLTU Lithuania
LUX LuxembourgMEX MexicoNLD NetherlandsNZL New ZealandNOR NorwayPOL PolandPRT PortugalRUS Russian Fed.SVK Slovak Rep.
SVN SloveniaZAF South AfricaESP SpainSWE SwedenCHE SwitzerlandTUR TurkeyGBR United KingdomUSA United States

I M P R O V I N G S E R V I C E S E C T O R P R O D U C T I V I T Y : T H E E C O N O M I C I M P E R A T I V E
37
S E C T I O N 1 . 2
Productivity and efficiency
Productivity growth occurs when there is an improvement in the technical efficiency of converting inputs into outputs. Health care inputs are: labour, specialised health care workers such as medical practitioners, nurses, and non-specialised staff such as accountants, IT staff, receptionists; capital including specialised machines such as MRIs, pathology analysers, and buildings such as hospitals; and goods and services such as drugs, bandages, food.4
The health sector is labour intensive. Labour productivity is measured as overall amount of output produced per unit of labour worked. The quantity of labour is gen-erally measured as the number of full time equivalent employees weighted by that professional group’s average cost. Labour productivity may increase due to improve-ments of the management of resources (such as better work flows), improvements in human capital (better education), but often as a result of an increase in capital invest-ment (more equipment or more technologically advanced equipment that leads to increased output without the need to increase labour). A major example in increasing labour productivity in the health sector was the development of automated pathology testing, which reduced the need for human handling of specimens and allowed signifi-cant increases in the volume of tests that could be run and the time required.
Although labour productivity is important, it is only part of the picture. The measure of multifactor productivity is a better guide to overall productivity. It combines the quantity of all inputs (labour, capital, and goods and services) with the total quantity of output, adjusted for quality. Productivity does not measure whether inputs have been pur-chased at the lowest possible cost, so health service efficiency could be improved through, for example, better purchasing arrangements but not captured in productivity measures.
The output of health services is the volume of services produced. Health services comprise a range of activities, from visits to general practitioners, to complex surgical procedures requiring sophisticated hospital services. This makes it difficult simply to aggregate numbers and come up with a meaningful measure of outputs. The analysis of hospital activity has become increasingly sophisticated and robust over the last 30 years in moving from a focus on inputs, such as hospital bed-days, to outputs measured as complexity weighted cases treated, generally described as Diagnosis
FIGURE 2 AVERAGE COST PER HOSPITAL SEPARATION OVER TIME BASED ON THE NATIONAL WEIGHTED ACTIVITY UNIT
Source: IHPA
$
$3644
$4002
$3789
$4290$4377
$4525$4588
$4524
3500
4000
4500
5000
2006–07 2007–08 2008–09 2009–10 2010–11 2011–12 2012–13 2013–14

I M P R O V I N G S E R V I C E S E C T O R P R O D U C T I V I T Y : T H E E C O N O M I C I M P E R A T I V E
38
S E C T I O N 1 . 2
Related Groups (DRGS) or case mix.5 Hospital activity represents about 40 per cent of health sector expenditure so there are good measures of output and hence productiv-ity for a large component of health services. Unfortunately, output measurement in the other 60 per cent is where hospital activity measurement was 30 years ago, a long way from allowing an accurate assessment of productivity.
Other lessons from hospital productivity
It is important to recognise the interdependency of various parts of the health system. The productivity of one part will be affected by the performance in another service. One example is hospital and community care; hospital productivity will be reduced if patients cannot be discharged quickly because the community services are lacking. Better throughput of facilities can be achieved by queuing, but making patients wait longer to see their GP, cancellations of elective surgery, or slow turnaround in emer-gency departments are not considered better service provision.
Increasing attention is being paid to providing better care, not just more care. For example, complications that occur as a result of treatment (such as hospital acquired infections) will increase the volume of services (becasuse they require more treatment) but are not an improvement in productivity. Thus the analysis of productivity must address issues of quality.6,7
Adding value through improved outcomes
It seems self-evident that the purpose of health care is to improve health, rather than to increase the volume of hospital admissions, the number of visits patients make to doctors or the number of X-rays.8 If the primary objective of health care is better health, then the value of all that activity should be measured in better health outcomes. The discussion of productivity is strictly a focus on technical efficiency; allocative efficiency is the other part of the picture. Allocative efficiency means that outputs produced provide the highest social value. In terms of the health sector then, the highest value care is that which contributes the most to better health and the best investment gives the highest return in health outcomes for the resources committed.
However, while the distinction between technical and allocative efficiency is clear in theory, it is much harder to make such a clearcut division in practice. It helps to think about the health production function. There are primary inputs (labour, capital) which are combined into intermediate outputs (for example, pathology tests) which are then combined to yield activities (such as hospital admissions) which combine again to produce final outputs in tems of episodes of care. Those episodes of care result in changes in health outcomes, that is conceptualised in terms of survival, physical, emotional and social wellbeing. These different dimensions of health then must be valued; how does an improvement in mobility compare to a change in cognitive func-tion. Finally there is the contribution of health to social welfare. It is a complex function with challenges in identification, measurement and valuation at every step.
The idea that value should be assessed by the contribution to life years and quality of life has become well established over the last 30 years.9 A great deal of research effort has been devoted to developing robust measurements of this with the most commonly used metric the quality adjusted life year (or QALY). The basis of this approach is that additional survival and improvements in health related quality of life can be combined into one measure and the incremental cost of a new program/treatment/procedure can be compared with its incremental gains in QALYs.10 If the incremental cost per QALY is lower than the society’s willingness to pay for an additional QALY, then the new treatment is a good buy; if it is higher it does not represent good value for money.

I M P R O V I N G S E R V I C E S E C T O R P R O D U C T I V I T Y : T H E E C O N O M I C I M P E R A T I V E
39
S E C T I O N 1 . 2
Economic evaluation is, according to one expert commentator, “the most advanced application of productivity measurement in the health sector”.11
Why is such a technically sophisticated approach needed to ensure value for money in health care? In a well functioning market, value is determined by what consumers are prepared to pay. Of course, there is a great deal of economic debate about whether such a perfect market can ever be achieved; but it is clear it is not achievable in the health care market. Health care consumers are not good judges of the effectiveness of health care in improving their health. Generally the consumption of health care can be characterised as a “bad” rather than a “good”, and individuals seek health care to improve their health but rely on the advice of professionals as to which treatments are appropriate. Even specialised and highly trained medical providers do not just know treatment effectiveness but rather rely on the body of scientific medicine, the result of a good deal of medical research.
Beyond health outcomes
Among the challenging issues in economic evaluation is the extent to which other ben-efits, non-health aspects, should be included in the assessment of value and society’s willingness to pay.12 One approach is to say that the benefits of health care should be anything that individuals value. However, patients and their families are willing to pay for many services or treatments that are generally not provided by the public purse; cosmetic surgery for purely personal vanity is a clear example. The social willingness to pay for new drugs that reduce side-effects may well depend on the severity and fre-quency of the side-effect. The introduction of new techniques such as keyhole surgery or robotic assisted procedures may aid post-surgical recovery but this may provide marginal gains in most measures of health outcome. At what point does this become sufficiently valuable to warrant the deployment of scarce health care resources? New drugs may be easier to swallow, quite literally, and while a patient may be prepared to pay for this individual benefit, the social willingness to pay could be much less.13
Dynamic efficiency involves improving efficiency over time. In health care, this means being able to invest in new technologies and new modes of service delivery, which often require new training for those working with them. Health care as a sector is char-acterised by rapid technological change. New technological developments provide new possibilities, improving the treatment available to existing patients; an efficient system will have the flexibility to adopt these rapidly and appropriately. But technologi-cal developments can also create new groups of patients; those who would previously have not been considered for a risky treatment but also those who would previously
FIGURE 3 MEASURING QUALITY OF LIFE AND LIFE YEARS (ILLUSTRATIVE GRAPH TO EXPLAIN CONCEPT)
Source: Adapted from Morris et al 2012, Economic Analysis in Health Care (2nd edition)
B
A
Quality of life measure
Years
Compared to A, Scenario B extends life and increases quality of life

I M P R O V I N G S E R V I C E S E C T O R P R O D U C T I V I T Y : T H E E C O N O M I C I M P E R A T I V E
40
S E C T I O N 1 . 2
have died but can now be kept alive for longer. Hence technological advance is con-sidered the most important driver of expenditure growth. Perversely these gains may actually look like less efficiency with the costs of inputs increasing but population health reducing. Dynamic efficiency also covers the education of the future health workforce. A service without students being trained or interns gaining supervised experience may appear more efficient in a static view, but it would leave the service unable to operate in the future. Similarly an investment in research adds to current costs/inputs but the main payoff is realised in the future.
Health system performance
Australian governments have converged on the use of performance rather than pro-ductivity; and a National Health Performance Framework was agreed in 2001 (there have been various developments in the use of frameworks and reporting since then).14 The agreed objectives of the system are that:15
Australians are born and remain healthy;
Australians receive appropriate high quality and affordable primary and community health services;
TABLE 1 INTERNATIONAL HEALTH SYSTEM PERFORMANCE INDICATORS AND RANKINGS
Indicator Life expectancy
at 65 – men
Life expectancy
at 65 – women
Share of out of pocket medical
expenditure in household consumption
Waiting times for cataract
surgery – median
Waiting times for
knee replacement –
median
Asthma and COPD hospital
admission
30-day case-fatality
for AMI (admission-
based)
30-day case-fatality for ischemic
stroke (admission-
based)
Breast cancer survival
Health expenditure per capita
Australia 3 7 22 8 12 29 1 20 5 13
Canada 10 10 11 2 4 18 11 26 8 10
France 2 2 3 n.a. n.a. 7 17 13 n.a. 12
Germany 16 22 5 n.a. n.a. 21 25 8 15 6
Netherlands 16 20 2* n.a. n.a. 11 20 12 16 4
New Zealand
8 17 9 7 5 30 10 14 12 18
Sweden 10 17 26 n.a. n.a. 13 2 8 1 5
United Kingdom
14 23 3 4 2 22 20 19 21 19
United States
22 25 14 n.a. n.a. 25 5 3 2 1
Note: Countries are listed in alphabetical order. The number in the cell indicates the position of each country among all countries for which data is available (lowest rank possible is 34).
For the expenditure indicator, the bottom third countries are those with highest per capita health expenditure
* The ranking for the Netherlands is overrated as it excludes compulsory co-payments to health insurers (if these were included, this would move the Netherlands in the middle third category).
Source: Adapted from OECD, Health at a Glance 2015.
Top third performers Middle third performers Bottom third performers

I M P R O V I N G S E R V I C E S E C T O R P R O D U C T I V I T Y : T H E E C O N O M I C I M P E R A T I V E
41
S E C T I O N 1 . 2
Australians receive appropriate high quality and affordable hospital and hospital related care;
Australians have positive health care experiences that take into account individual circumstances and care needs;
Australians have a health system that promotes social inclusion and reduces disad-vantage, especially for Aboriginal and Torres Strait Islander Australians; and
Australians have a sustainable health system.
This is a great deal broader than gains in health outcomes achieved by health services. It recognises the issue of long term performance and the need for dynamic efficiency, already identified here. It reflects the increasing concern that services should be patient centred, although that notion is difficult to operationalise. Finally, and although not explicit, it identifies the goal of healthy lives, which may be due as much to social and economic circumstances as they are the result of health care.
Universal health coverage and equity
The missing piece in those objectives is any explicit commitment to equity, although one could read “Australians” as implying all Australians. Most approaches to health system performance include equity.16 The United Nations Sustainable Development Goals sets universal health coverage as a goal for all nations.17 There are two aspects to this, access and financial burden, though of course the two are linked. The initial aims of Medibank/care included equitable financing, universal access and efficiency across the system.18 Equitable financing is important in the context of Australia which has a high reliance of consumer out-of-pocket costs and that has been the fastest growing component of Australian health expenditure.19 The overall level of out-of-pocket costs is not in itself a satisfactory indicator of financial burden; for example low out-of-pocket costs because individuals cannot afford to pay and then do not get services is hardly a reflection of good performance.20 Nonetheless, any proposals which increase the reliance on private spending with the aim of efficiency should be assessed carefully for their impact on the whole of system goals.
FIGURE 4 RATE OF HEALTH CARE EXPENDITURE GROWTH BY SOURCE OF FUNDS (CURRENT PRICES, 2003–04 = 100)
Source: AIHW
0
50
100
150
200
250
Individuals
Health insurance funds
State/territory and local
Australian Government
2014–152013–142012–132011–122010–112009–102008–092007–082006–072005–062004–05

I M P R O V I N G S E R V I C E S E C T O R P R O D U C T I V I T Y : T H E E C O N O M I C I M P E R A T I V E
42
S E C T I O N 1 . 2
Improving performance
The overall performance of the system – and the country’s total health care expendi-ture – is the result of many individual decisions, of patients, of providers, and funders. Government policy sets the framework in which those decisions are made. There is discretion for the individual actors in that decision making, and decisions are influ-enced by many factors including but not limited to financial incentives.21 The impact of financial incentives has been both over- and under-estimated. Over-estimated in that changes to payment methods, such as many “pay for performance” schemes, have had marginal or negligible effects and under-estimated in that changes to payments have had much greater effects than forecast.
Financial incentives
Many payment systems have traditionally focused on fee for service, which is in essence payment for inputs, which tends to drive increases in the volume of inputs.22
A great deal of attention has been paid recently to the extent of low value interventions with the conclusion being that if this could be eliminated it would have a significant reduction in the costs of medical care. Australia has been at the forefront of the move to identify low value interventions and is currently implementing this approach in its review of the 5700 items on the Medical Benefits Schedule, though current progress demonstrates that this may be less productive of savings than first predicted.23 It is rare that a single item is unequivocally of no value for anyone under any circumstances. If it is, it will fall into disuse so savings will be hard to achieve. Removing low value items from the schedule may have unintended consequences if providers change charging practices or substitute other diagnostics or procedures, or switch to a more expen-sive location of care (such as from community to hospital). It is extremely difficult to manage inputs in such a complex process as health care, without considering incen-tives (financial and otherwise). There is a clear need for whole of system thinking to underlie changes in policy and practice.
There has been growing interest in the potential benefits of employing more sophis-ticated payment models for health care providers that combine different approaches – such as blending fee for service with rewards for achieving targets – that overcome the disadvantages and unintended consequences of simple payment mechanisms. Overall, the effect has been modest with limited evidence of impact on better health outcomes. However, there has been so much variation in the setting, the size of the payment or penalty, and to which group it was directed, it is not surprising that it is so difficult to draw general conclusions. Australia was a relatively early adopter of pay for performance in primary care, with the Practice Incentives Program and other targets; however, the financial incentives were relatively modest, were more likely to be claimed by larger and better organised practices, and have proved difficult to evaluate. It is still true to say that the financial incentives in the Australian system, by and large, encour-age volume rather than appropriateness, quality or effective substitution of workforce or location.24
On the other hand, changes in payment methods can lead to unintended conse-quences, which generally means much greater volumes of service delivery (and spending) than intended by the policy. One danger is that pay for performance will introduce financial rewards for activities that providers were already doing. Frequently administrative data records what is paid for rather than what it is done, which limits the monitoring of changes. Another example is the introduction of the Extended Medicare Safety Net, which achieved a reduction in out of pocket costs for some, but induced other changes in provider charges that created unpredicted levels of expenditure.25

I M P R O V I N G S E R V I C E S E C T O R P R O D U C T I V I T Y : T H E E C O N O M I C I M P E R A T I V E
43
S E C T I O N 1 . 2
Similarly, the implementation of higher payments for GP out of hours urgent care did not so much encourage existing GPs to improve access to care but stimulated a new category of after hours service providers, again with an unexpected increase in volume and hence expenditure.26
Financial incentives should become much more focused on what we want the system to deliver, rather than on inputs or volumes. The establishment of Australian health care homes now underway is a start in this reorientation. Although described as a part capitation model, it is also a trial of bundled payments in this case focused around the patient with specific needs. This is intended to encourage flexibility and innovation in how services are delivered.27
Prices
The outcomes focus is about allocative efficiency but that does not mean technical efficiency can be ignored. One commentary on why the US system was so expensive summed up its message quite simply: it’s the prices, stupid.28 The US pays more for its services and its inputs than comparable countries. The lesson here is that prices still matter. The concern with value-based purchasing is that it focuses attention on not paying more for a QALY (or unit of benefit) than society’s willingness to pay. But that shadow price is not the price that should be paid, it is the maximum price. Interestingly paying for value could mean that the same drug could be charged at two very differ-ent rates depending on the patient group using it. The right price is the technically efficient cost, as that will maximise the return on the social investment. There is a loss in efficiency if the prices paid are not the efficient cost of production. One area where gains could be made is prices paid for pharmaceuticals.
There is a need for some mechanism to bring allocative and technical efficiency together. The most promising approach is through commissioning, where a manager has responsibility for a defined population or set of activities and a budget so that the opportunity costs are explicit. Commissioning of health services describes the function of planning and purchasing the range of services. The National Health Service (NHS) introduced a separation between the functions of purchasing and providing health services in 1990.29 It allowed a demarcation between operating services (technical effi-ciency) and what services should be provided (allocative efficiency). The term is now being used increasingly in the Australian context. What starts to become clear is that in a complex system there are different managerial levels, with different goals. A well designed health system will ensure compatibility of incentives across these different levels.
Better data, more available
There is widespread agreement that more use should be made of the substantial amounts of data collected in health services,30 particularly in ensuring timely and accurate feedback to clincians and managers. They are interested in comparative performance and keen to perfom as well or better than their peers. There is also a strong commitment to public reporting, to ensure accountability. The extent to which consumers actually use such information in making their choices about care is not well established, and more research on this decision making behaviour is warranted.
Recent reports have drawn attention to one area in which there is very little infor-mation available to consumers: the market for specialists. Information about prices and waiting lists would be valuable to patients and GPs. Information that focuses on the patients’ perspective is also missing, in particular, Patient Reported Outcome Measures (PROMS) and Patient Reported Experience Measures (PREMs).31

I M P R O V I N G S E R V I C E S E C T O R P R O D U C T I V I T Y : T H E E C O N O M I C I M P E R A T I V E
44
S E C T I O N 1 . 2
High cost patients
Health care expenditure is highly skewed, with a small proportion of patients account-ing for the bulk of spending, even at older ages; 25 per cent of the population aged over 45 is responsible for 80 per cent of the spending.32 Increasing age explains some of this, as does increasing numbers of chronic conditions. This has encouraged a focus on this high needs group with attempts to develop chronic disease manage-ment programs that reduce the need for services, particularly hospital admissions. Overall, these programs have not been unequivocally successful in reducing costs. So this may not prove an easy means of improving productivity.
Time to death is also able to explain these high costs (but not entirely); most health care expenditure is generated at the end of life, and most of that in hospitals. Most Australians die in a hospital or aged care facility, though for most the preferred place of death is home.33 This raises the question of whether resources could be reallocated from institutional services to community support with an overall improvement in end of life care.
More integrated approaches to funding and financing
Currently the focus on inputs means that services are specified as, for example, hospital services or ambulatory care. Location, funding and the source of finance determines this; states are responsible for public hospitals with contributions from the Commonwealth, private hospitals are the responsibility of the Commonwealth, primary medical care is funded by the Commonwealth, other community services by the states. This introduces rigidities, which in worst-case scenarios lead to inefficient delivery and cost-shifting.
The resolution of this would be a national funding pool that would support a compre-hensive set of health services. The implications of this approach will require a revision of Commonwealth-state financial arrangements. This approach was in fact raised as a
FIGURE 5 CONCENTRATION OF HEALTH CARE EXPENDITURE
Source: 45 and Up
Cumulative % of yearly health expenditure
Cumulative % of population (lowest yearly health expenditure first)
Line of equality
Cumulative share ofyearly health expenditure
0
10
20
30
40
50
60
70
80
90
100
0 10 20 30 40 50 60 70 80 90 100

I M P R O V I N G S E R V I C E S E C T O R P R O D U C T I V I T Y : T H E E C O N O M I C I M P E R A T I V E
45
S E C T I O N 1 . 2
possibility for hospital services in the Federation White Paper.34 It would have been an interesting start to what could have become a more outcomes focused approach to funding health care.
This in itself does not resolve the level of contibutions from each of level of government, which will remain unresolved as long as health remains a major expenditure program financed from general tax revenue. There is evidence that the Australian public would support a hypothecated tax for health care from a recent survey.35 Further evidence for this public attitude is the lack of opposition to increases in the Medicare levy, although as noted before this is not a hypothecated tax. A similar proposal has also been raised in the context of the NHS.36
Conclusion
As the US President has recently discovered, health policy is very complex. It is extraordinarily easy to identify problems in the current way of managing the system, much more difficult to identify solutions, and a herculean task to reach political and community agreement on the way forward. “Repeal” is easy; “replace” is a whole lot different. Improving health system performance is key to ensuring that the Australian health system is able to deliver its goals of a healthy life and universal health cover at a cost that the economy can support. Strategies should encompass:
Payment methods that move incentives from volume to value in health outcomes;
Recognition that the increasing corporatisation of service provision presents new challenges in designing policy;
Extending the focus on paying the efficient price from public hospitals to all other health care services;
Encouraging community debate about what Australia wants from its health care system, including expectations around end of life care and dying;
Removing artificial barriers between funding from different levels of government; and
Exploring revenue raising instruments that do not enhance inequities and increase co-payments.
Acknowledgements
The authors are grateful to Professor Rosalie Viney and Professor Michael Woods for
their valuable comments on previous drafts of this paper. Any remaining errors remain
the responsibility of the authors.

I M P R O V I N G S E R V I C E S E C T O R P R O D U C T I V I T Y : T H E E C O N O M I C I M P E R A T I V E
46
S E C T I O N 1 . 2
Endnotes
1 Australian Institute of Health and Welfare. (2014). Australia’s Health 2014. Section 9.2 Retrieved from http://www.aihw.gov.au/australias-health/2014/
2 van Gool K, Woods M, Hall J, Haas M, Yu S. (2015). Sustainability, efficiency and equity in health care: The role of funding arrangements in Australia. Australian Healthcare and Hospitals Association Pathways to Reform Series. No 1. accessed at https://ahha.asn.au/sites/default/files/docs/policy-issue/pathways_to_reform_-_funding_phns_and_bundled_payments.pdf
3 Productivity Commission 2015, Efficiency in Health, Commission Research Paper, Canberra.
4 Triplett JE, (2011). Health System Productivity. In Glied S, Smith PC, (eds). The Oxford Handbook of Health Economics. Oxford University Press
5 Triplett JE, (2011). Ibid
6 Office for National Health Statistics. (2014) Public service productivity estimates: healthcare 2014. Accessed at https://www.ons.gov.uk/economy/economicoutputandproductivity/publicservicesproductivity/articles/publicservicesproductivityestimateshealthcare/healthcare2014#public-service-healthcare-productivity-overview 13 March 2017
7 Australian Commission on Safety and Quality in Health Care, 2017. Hospital Acquired Complications. Accessed at: https://www.safetyandquality.gov.au/our-work/information-strategy/indicators/hospital-acquired-complications 13 March 2017
8 Berwick DM, (2005). Measuring NHS productivity. British Medical Journal 330:975.
9 Williams A (1985). Economics of coronary artery bypass grafting. British Medical Journal. 291:736.
10 Rowen D, Brazier J (2011) Health Utility Measurement in . In Glied S, Smith PC, (eds). The Oxford Handbook of Health Economics. Oxford University Press.
11 Smith PC, (2010). Measuring Productivity in Health Services. Journal of Health Services Research and Policy 15:1
12 Payne K, McAllister M, Davies LM, (2013). Valuing the economic benefits of complex interventions: when maximising health is not sufficient. Health Economics: 22:258-71
13 R de Abreu Lourenco, M Haas, J Hall, R Viney. Valuing Meta-Health Effects for Use in Economic Evaluations to Inform Reimbursement Decisions: A Review of the Evidence. PharmacoEconomics, 2017. 35: 347.
14 Productivity Commission. SCRGSP (Steering Committee for the Review of Government Service Provision) 2016, Report on Government Services 2016, vol. E, Health, Productivity Commission, Canberra.
15 Papanicolas I (2013). International frameworks for health system comparison. In Papanicolas I and Smith PC. Health System Performance Comparison. Open University Press.
16 World Health Organization United Nations Sustainable Development Goal. Accessed at http://www.who.int/universal_health_coverage/en/ 13 March 2017.
17 Scotton RB, Deeble JS. (1968) Compulsory health insurance for Australia. Australian Economic Review, 4th quarter, 9–16.
18 van Gool K, Woods M, Hall J, Haas M, Yu S. (2015). Op cit
19 Hall JP. ( 2013). A tale of out of pocket health care spending. Medical Journal of Australia. 199 (7): 442–443
20. van Gool K, Woods M, Hall J, Haas M, Yu S. (2015). Op cit
21. Hall J, van Gool K. (2016) Paying hospitals for quality: can we buy better care? Medical Journal of Australia. 205 (10 Supp) S27–29
22 Hall J, van Gool K, and the REFinE Team. (2016) Paying for Primary Health Care: Financial incentives for efficiency, equity and sustainability. REFinE-PHC Report. Available at: http://www.uts.edu.au/research-and-teaching/our-research/health-economics-research-and-evaluation/our-research/working
23 Medical Benefits Schedule Review Taskforce (2016). Interim Report. Accessed at: http://www.health.gov.au/internet/main/publishing.nsf/content/26CEC8388EE86854CA2580210016EF82/$File/MBS-Review-Interim-report-Final-%204%20Oct.pdf 13 March 2017
24 Hall J, van Gool K, and the REFinE Team. 2016 op. cit.
25 van Gool KC, Savage EJ, Viney RC, Haas MR, Anderson R. (2009) Who’s getting caught? An analysis of the Australian Medicare Safety Net. The Australian Economic Review, 42, 2, 143-154.
26 Jackson C. (2014). Review of after hours primary health care. Accessed at: http://www.health.gov.au/internet/ministers/publishing.nsf/Content/health-mediarel-yr2014-dutton065.htm 16 March 2017
27 Turnbull M, Ley S, A healthier Medicare for chronically-ill patients. Media release. 31 march 2016. Accessed at: http://www.health.gov.au/internet/ministers/publishing.nsf/Content/health-mediarel-yr2016-ley021.htm
28 Anderson GF, Reinhardt U, Hussey PS, Petrosyan V. (2003). It’s the prices, stupid: why the United States is so different from other countries. Health Affairs. 22,3;89-105
29 The King’s Fund. Clinical commissioning: what can we learn from previous models? Accessed at www.kingsfund.org.uk/topics/nhs-reform/white-paper/gp-commissioning
30 Productivity Commission. SCRGSP (2016). Op cit
31 NSW Agency for Clinical Innovation. Patient Reported Measures. Accessed at https://www.aci.health.nsw.gov.au/resources/integrated-care/aci/patient-reported-measures
32 Hall J, van Gool K. (2016) Ageing, entitlement and funding health care. In (ed) J Piggott, I McDonald and H Kendig Population and Ageing and Australia’s Future. ANU Press.
33 Hall J, van Gool K. (2016) ibid.
34 Department of Prime Minister and Cabinet (2014). Reform of the Federation white paper. Issues paper 3, Roles and responsibilities in health. Accessed at: http://trove.nla.gov.au/work/192554502?q&sort=holdings+desc&_=1489620385672&versionId=211034933 17 March 2017.
35 Borg, K. and Compton S. 2015. Australia’s Comparative Advantage: Public Preference Study. The Social Research Centre. Australian Council of Learned Academies: www.acola.org.au
36 Layard R (2017) Is it time for a dedicated tax to fund the NHS? British Medical Journal 356; j471.

47
2.1 Education and training enabling productivity in service industries Maria Spies, Kadi Taylor, Helen Zimmerman
2.2 Australian university productivity; some food for thought Professor Leo Goedegebuure Associate Professor Ian Marshman
2.3 Case study: exporting VET into India Sue Freeman
Productivity of education services
SECT ION
2.0

I M P R O V I N G S E R V I C E S E C T O R P R O D U C T I V I T Y : T H E E C O N O M I C I M P E R A T I V E
48
2.1Education and training enabling productivity in service industries
Maria Spies Kadi Taylor
Helen Zimmerman
Maria Spies is General Manager, Learning & Teaching Services
at Navitas and Head of Digital Learning Futures at Navitas
Ventures. Since 2009, Ms Spies has led Navitas’ Learning and
Teaching function, driving innovation across curriculum,
teaching and the student experience. The unit delivers
academic development, learning design and learning
technology services to Navitas’ global network of colleges.
She also leads the digital learning futures portfolio for Navitas Ventures, which
focuses on investing, partnering and incubating ideas, people and organisations that
represent the future of education.
Ms Spies has worked in tertiary education for 20 years in Australian public and private
sector organisations, holding various learning and teaching innovation and education
management roles. She holds a Bachelor of Arts, a Master of Adult Education and is
currently pursuing a Doctorate in Education.

I M P R O V I N G S E R V I C E S E C T O R P R O D U C T I V I T Y : T H E E C O N O M I C I M P E R A T I V E
49
Helen Zimmerman is Chief Corporate Affairs Officer at Navitas. Ms
Zimmerman has worked in leadership roles in Australian public and
private education for over 35 years. Since 2005 she has held executive
roles with Navitas, an Australian top 100 Company and global
education provider.
Ms Zimmerman is a former President of the International Education Association of Australia
and a current member of the Victorian and NSW international education advisory boards. She
chairs the Australian Business and Community Network and sits on the Jobs for NSW Board.
She is a member of the NSW State Advisory Council of CEDA and an Honorary Senior Fellow
of the LH Martin Institute of the University of Melbourne.
S E C T I O N 2 . 1
Introduction
The knowledge economy will be the key to Australia’s future prosperity, as service industries take over from resources and manufacturing as a source of growth. Human capital development, focused government policy, and new collaborative mindsets are needed to fuel productivity in this sector and meet the demands for a new way of working.
In the post-mining boom era, gains in Australia’s economic productivity will be tied to how well we can harness the service industries, knowledge and innovation.
These elements are all inextricably linked and underpinned by education and training – in itself Australia’s largest service industry export. The impacts of globalisation and digital disruption bring opportunities and challenges for the current system.
Education and training within the service sector is both a national imperative for Australia’s domestic economy and a high-value export opportunity, necessitating alignment of public policy, business, educators and the community. Technology will transform the way we provide face-to-face and borderless education.
Kadi Taylor is Head of Strategic Engagement and Government Relations
at Navitas. Her role is to support the development and articulation of
Navitas’ public policy and advocacy positions. She works to connect
colleagues and partners with opportunities, ideas and insights.
She joined Navitas having previously spent 12 years working on
international education issues within the Australian Government. Ms Taylor led Austrade’s
development of AIE2025 and the education-related research and analysis. Prior to Austrade,
she worked for 10 years in the international arm of the Department of Education and Training.
She holds a Master of Strategic Studies with Merit (Australian National University), Bachelor of
Communication (University of Canberra) and Diploma of Government.

I M P R O V I N G S E R V I C E S E C T O R P R O D U C T I V I T Y : T H E E C O N O M I C I M P E R A T I V E
50
S E C T I O N 2 . 1
This chapter examines these interdependencies by addressing the following questions:
What is the role of education and training in driving productivity in the service sector?
How can the export of education and skills in the service sector drive Australian prosperity and growth?
How is the world of work changing, and what does this mean for the skills that will be needed in the future?
Is our current education and training system set up not only to keep pace with these changes, but also to get ahead of them?
What are the risks and threats to the established education system and existing education exports if we cannot adapt?
What can we do to ensure our education system delivers the skills needed in the future workforce and continues to power Australia’s service sector?
Education and training to drive productivity in the Australian service sector
For many reasons, Australia still lives up to its “lucky country” label: a highly skilled workforce, globally connected population, robust political and economic institutions, rich natural resources and positioned on the doorstep of Asia – the world’s eco-nomic engine room. Despite waves of global economic turbulence over the past two decades, our economy has prospered and we have maintained our high standard of living.
However, when author Professor Donald Horne originally coined this phrase it was with a sense of irony. He has said he was talking about a “not too clever country… in particular the lack of innovation in Australian manufacturing and some other forms of Australian business, banking for example…”1
If Australia is to maintain economic growth and create higher paying and rewarding jobs through innovation, it will need “to invest heavily in economic infrastructure and its human capital.”2 This means a focus on education and training. From early child-hood education to life-long learning, education is the major enabler of human capital in societies and economies; it drives productivity improvements that provide sustained economic growth and higher standards of living.
Investing in human capital development to drive productivity becomes more essential when we consider two stark realities. First, Australia’s workforce participation rates are declining due to our ageing population. Second, commodity price falls and the end of the mining boom will negatively impact our terms of trade.3
American economist Paul Krugman sums up the centrality of productivity to growth with his observation: “Productivity isn’t everything, but in the long run it is almost everything. A country’s ability to improve its standard of living over time depends almost entirely on its ability to raise its output per worker.”4
“ Ultimately, each country’s prosperity depends on how many of its people are in work and
how productive they are, which in turn rests on the skills they have and how effectively
those skills are used. Skills are a foundation of decent work.”
International Labour Organization 5

I M P R O V I N G S E R V I C E S E C T O R P R O D U C T I V I T Y : T H E E C O N O M I C I M P E R A T I V E
51
S E C T I O N 2 . 1
Productivity, human capital and learning
So how do we improve productivity? A large body of evidence establishes a significant and positive association between the knowledge, skills, competencies and capabilities acquired or enhanced through learning and productivity for individuals, firms and the economy as a whole.6
For individuals, wages are a good indicator of the productivity effects of learning. Studies suggest that, on average, an additional year of learning increases an indi-vidual’s wage by between five and 16 per cent. At a business and national level, there is a positive correlation between learning and productivity in cross-country studies.7
A 2015 study by Deloitte Access Economics undertaken on behalf of Universities Australia also points to the significant contribution that higher education and research make to Australian society and the economy.8 It showed the skills and knowledge generated by teaching and learning, research discovery and adoption, and community service activities of Australian universities are a direct and significant driver of growth in incomes, output and employment across the Australian economy.9
Deloitte estimated the value added by university education to the productive capacity of the nation as $140 billion in GDP in 2014 – and found Australia’s GDP is 8.5 per cent higher due to the impact education has on the productivity of workers with a university qualification.
University research also has a positive effect on multifactor productivity – the amount produced given the number of hours worked and capital employed in production. It estimates “the benefits of improved productivity from increased investments in univer-sity research were equivalent to almost a third of the average living standards growth experienced over the past 30 years”.10 Education and training clearly plays a major role in addressing Australia’s productivity imperative.
Boosting service productivity through education and training
In an increasingly complex world of work, we will require higher order technical skills, expert knowledge and enterprise capabilities – increasing demand for vocational edu-cation and training (VET), higher education and lifelong learning.
There is already high demand by industry for VET in Australia. More than a quarter (26.8 per cent) of the working age population undertook VET in 2015. Total VET activ-ity was some 4.5 million enrolments, of which 66 per cent was delivered by private providers and 21 per cent was provided by TAFE institutes.11
Service industries will have the greatest demand for skilled labour. The NSW Business Chamber highlights research by Tourism Research Australia which estimates “a national skills shortage equivalent to 30,000 tourism and hospitality workers by 2020” and advocates for addressing the shortfall by boosting participation in vocational path-ways to work through modernised traineeships and apprenticeships.12
In higher education, current trends indicate demand will rise by a third by the year 2025: that’s 2.1 million more higher education qualifications than are currently delivered.13

I M P R O V I N G S E R V I C E S E C T O R P R O D U C T I V I T Y : T H E E C O N O M I C I M P E R A T I V E
52
S E C T I O N 2 . 1
Service industries will have the greatest demand for skilled graduates over the next 10 years, with these top five industries requiring over 30 per cent more higher education graduates:
Education and training;
Health care and social assistance;
Professional, scientific and technical services;
Public administration and safety; and
Financial and insurance services.14
Professor Bruce Rasmussen wrote in 2015 “the depth, quality and relevance of our education system is critical to cultivating the skills necessary for a country to develop a globally competitive service sector portfolio. Given the strategic role of these ser-vices as engines of modern economic growth it would indeed be unfortunate to be left behind.”15 The role of education and training in this is two-fold. It must deliver the skills the service industry needs now and in the future, and it must do so in a way that builds the human capital of those sectors to drive productivity. This is not a straightforward task.
More sophisticated skills are needed for the 21st century knowledge economy. Future employers require “a workforce of creative, innovative and highly adaptable knowl-edge-workers.”16 The education sector is still determining how best to impart these skills.
What’s more, productivity improvements in the service industries are generally assumed to be low as they are mostly labour intensive, and service delivery is relatively fixed.17
One way productivity can be improved (although difficult to quantify) is through improvement in the quality of outputs.18 That is, “knowledge, ideas and techniques can be used by many people at the same time for different purposes – and ideas can be combined to produce new ideas. To the extent that knowledge, ideas and techniques build on each other, they provide the basis for self-sustaining and on-going improvements in productivity and economic growth.”19
Education and training has always been the way new knowledge is created, shared and used. Productivity gains in the service sector – and the economy generally – will be delivered through investments in Australia’s human capital from pre-school through to life-long learning.
Exporting education and skills in service industries to drive prosperity and growth
As the first section of this chapter shows, education and training underpins Australia’s human capital development, and therefore drives productivity – particularly in the service industries. However, education is not only an enabler of the service sector. It’s a driving force of export value in its own right, worth over $21.8 billion in 2016.20
The phrase “international education is Australia’s largest service export” has become ubiquitous. Borne out of the education reforms of the 1980s, international education has had a meteoric rise and has an even brighter future. Deloitte’s Positioning for pros-
perity? Catching the next wave names international education as one of the “Fantastic Five” – five sectors that will collectively match the impact of the mining sector today.21

I M P R O V I N G S E R V I C E S E C T O R P R O D U C T I V I T Y : T H E E C O N O M I C I M P E R A T I V E
53
S E C T I O N 2 . 1
There are two components to Australia’s international education system:
Onshore delivery in Australia – international students on a student visa, studying at a regulated institution for a defined period of time; and
Borderless education – formal and informal learning, provided face-to-face in another market or online.
Onshore international education
Onshore delivery remains the core of the Australian international education industry. In 2016, international student numbers and related export earnings reached new highs with 554,179 international students in Australia, a 10 per cent increase on the previous year.22
Australian institutions also continue to deliver strong learning experiences and outcomes. A recent survey of 65,000 students showed a record nine out of 10 inter-national tertiary students were either satisfied or very satisfied with the education they had received in Australia.23
In 2016 there was a 17 per cent increase in the export value of international educa-tion. International education also contributed more than 130,000 jobs to the Australian economy in 2014–15, accounting for 1.3 per cent of Australia’s total employment.24
There are also a number of associated economic benefits. Friends and relatives visit students in Australia, adding $282 million in 2014–15 in tourism expenditure.25 Non-student visa holders also study English, contributing an additional $205 million in education-related export revenue for the same period.26 Finally, the revenue from inter-national students undertaking study tours at Australian public schools was estimated to be worth $14 million in 2015.27
Moreover, international education enhances the skills and productivity of the Australian workforce. The international student body in 2015 is estimated to contribute approxi-mately 130,000 skilled migrants to the Australian workforce once they graduate. Deloitte Access Economics values this increase in human capital at approximately $8.7 billion in additional GDP.28
Borderless education
Traditionally known as transnational education, borderless education is both formal and informal learning delivered face-to-face in market, or online. It may also include global services to the education and training sector, government or not-for-profit sector consultancies, or partnerships with industry and employers.
Australia has great potential to leverage its reputation for quality education and training by developing technology-enabled, scalable education platforms.
In 2015, Deloitte Access Economics and EduWorld estimated the potential market size for borderless education to be over one billion learners by 2025. If Australia cap-tures even one per cent, it would equate to 11 million learners globally – and a 10 per cent share would exceed 110 million learners. It is a substantial export opportunity.
Australia is well-positioned to meet the growing demand for education and training in emerging economies, particularly the large numbers of learners in countries across the Asia Pacific, Middle East and Latin America.29 According to KPMG’s 2016 report The
Global Demand for Skills, skills shortages and strong demand for training across coun-tries in these regions match Australia’s strengths in training capacity and reputation,

I M P R O V I N G S E R V I C E S E C T O R P R O D U C T I V I T Y : T H E E C O N O M I C I M P E R A T I V E
54
S E C T I O N 2 . 1
such as transport and logistics, aged care, tourism, childcare, construction, retail and wholesale, food and beverage and health services.30
Globally, investment in education totals a significant $5 trillion per annum.31 TechCrunch recently highlighted the incredible potential of educational technology (edutech), with investment in edutech set to reach $252 billion globally by 2020.”32
FIGURE 1 KEY INDUSTRIES ACROSS MARKETS OF INTEREST
Source: KPMG, The Global Demand for Skills: A report for the Department of Education and Training’s International Skills Training Initiative, November 2016
Agric
ultu
re
Basi
c m
anuf
actu
ring
Adva
nced
man
ufac
turin
g
Hote
ls a
nd a
ccom
mod
atio
n
Child
car
e
Aged
car
e
Food
and
bev
erag
e
Tour
ism
Reta
il an
d w
hole
sale
Tran
spor
t and
logi
stic
s
Heal
th s
ervic
es
Cons
truct
ion
South Asia
India
Bangladesh
Sri Lanka
Pakistan
Middle East
United Arab Emirates
Saudi Arabia
Egypt
Latin America
Chile
Colombia
Mexico
Peru
Brazil
Asia Pacific
China
Thailand
Korea
Solomon Islands
Indonesia
Malaysia
Singapore
Vietnam
Australia’s strength in training/industry
Key:
Industry demand: Very strong Strong Moderate Demand not identified
Australia’s strength in training/industry:
Very strong – Strong – Moderate

I M P R O V I N G S E R V I C E S E C T O R P R O D U C T I V I T Y : T H E E C O N O M I C I M P E R A T I V E
55
S E C T I O N 2 . 1
“ The rise of a new education and learning world has begun… Just as digitalisation has
transformed the financial services (fintech) industry, it too will soon have its progressive grip
wrapped around education.”
TechCrunch, 2016
Australian education providers, investors, and innovative education businesses and start-ups will need to work together to realise edutech’s potential for Australia’s eco-nomic prosperity. EduGrowth33 is one example of this. A major sector-led initiative, it is a national, not-for-profit accelerator and incubator dedicated to the Australian edutech sector, which arose out of Austrade’s 10-year market development roadmap for inter-national education.34 As a network of public and private education providers (including higher education, vocational training, K-12 and early childhood learning) it creates an ecosystem with edutech founders, start-ups and the investor community.
Onshore and borderless – both in-market delivery and scalable, tech-enabled – international education will play a long-term role in driving Australia’s knowledge and innovation based economy as well as export revenue.
The changing world of work and what it means for future skills
There are moments in time when the type and pace of change in the way we work is so radical that its very nature is revolutionised. This is one of those periods.
Just as in the past, it has been prompted by significant advancements in technology – steam power, electricity, mass production, and more recently computer adoption and automation.
Today, workforces around the world are already being impacted by technology. While it affects jobs such as machinery operators, secretaries, clerks, labourers and techni-cians, it also creates new demand for higher order skills and interpersonal capabilities in the service industries.
Over the past few years, exponential advances in how humans and machines connect and relate are heralding the beginning of another revolution, referred to as a Fourth Industrial Revolution.35 Progress with artificial intelligence is contributing to a social transformation “happening 10 times faster and at 300 times the scale, or roughly 3000 times the impact” of the Industrial Revolution.36
The Institute for the Future and the University of Phoenix Research Institute have iden-tified six disruptive forces that will create the need for a new set of skills and aptitudes for future workers:
Extreme longevity;
Rise of smart machines and systems;
Computational world;
New media ecology;
Super-structured organisations; and
A globally connected world.37
As with previous revolutions, jobs will disappear while new ones will appear. However,

I M P R O V I N G S E R V I C E S E C T O R P R O D U C T I V I T Y : T H E E C O N O M I C I M P E R A T I V E
56
S E C T I O N 2 . 1
in the transition to the new economy the impact in human terms will be profound. It is estimated that 40 per cent of jobs in Australia are at risk of being highly affected by computerisation and automation by 2030.38 Across the European Union, employment in manufacturing, the primary sector and utilities is expected to decline by five to 15 per cent in the coming decade alone.39 Driverless transport, drones and advanced robotics are perhaps the most visible examples of low-skilled job automation. “Our economy is evolving in ways that will make it more and more difficult for people with lower levels of education to find jobs and support themselves”.40
Creative and professional industries are also not exempt. Automation is likely to affect any tasks that are routine and rules-based, and even those tasks that can be done better and faster with networked cognition. Innovation is already being crowd-sourced by NASA to improve spaceship systems and interpret satellite data.41
Meanwhile, business productivity has fallen behind technological progress. The gap between our increasingly sophisticated technologies and the amount of work actu-ally performed is already “resulting in income inequality, wage stagnation, and social unrest around the world.”42
Deloitte’s 2017 report, Global Human Capital Trends, emphasises the need for work-forces to transition to a world in which “the term workforce no longer simply refers to human resources, but cognitive systems, machines and robots too”.43 Human Resources will need to adopt new processes to manage organisations as highly interconnected networks. As markets prioritise the value of intellectual property and services over physical or capital goods, companies with relatively low productivity will lose out at increasing rates.
However, as Figure 2 and Figure 3 show, while we know there is a gap between technology change and business productivity, as individuals we are much quicker to adopt. People already use technology to make their everyday lives more efficient, and businesses are following – albeit at a slower pace. Public policy – including changes to regulation, trade, income inequality and immigration – is lagging far behind.
With its robust vocational and higher education sector and highly educated workforce, Australia has the potential to overcome these challenges. Tertiary qualification rates have grown each year since 2001 and are well above the OECD average.44 Existing roles are already evolving into ones with higher skills needs, and new roles for gradu-ates are continuing to grow. Less than one in 10 businesses have cut back graduate recruitment in the past year, while nearly one in three expanded their intakes.45
However, employers are struggling to find workers with the appropriate enterprise skills, and traditional education pathways appear to be failing to prepare people to navigate complex careers that move across a range of industries and professions over a lifetime. In a cross-industry survey of 500 British organisations, 69 per cent of busi-nesses were not confident there would be enough people with the correct skills to fill their high-skilled jobs.46
Businesses are now looking for graduates with the right attitudes and aptitudes to be productive in the workplace – far fewer are concerned about formal qualifications.47
For Australia’s powerhouse service sector, how do we address this gap in the skills and capabilities needed?

I M P R O V I N G S E R V I C E S E C T O R P R O D U C T I V I T Y : T H E E C O N O M I C I M P E R A T I V E
57
S E C T I O N 2 . 1
New capabilities
While routine tasks are likely to be automated, capabilities for “novel and adaptive thinking” will be increasingly important.48 Analysing job ads over the past three years, Alpha Beta and the Foundation for Young Australians identified a new set of essential “enterprise skills” – also referred to as “21st century skills” or “transferable skills” – that offer significantly more pay.49 These skills are not role- or industry-specific, but endur-ing capabilities such as problem solving, financial literacy, digital literacy, teamwork, communication, intercultural skills, creativity, critical thinking and presentation skills. Many of these skills are critical to service industries – such as additional languages and intercultural skills in tourism or health services.
FIGURE 2 WHAT APPEARS TO BE HAPPENING
Source: Deloitte University Press | dupress.deloitte.com
FIGURE 3 WHAT IS REALLY HAPPENING
Source: Deloitte University Press | dupress.deloitte.com
Rate of change
Time
Technology change
Business productivity
Gap in business performance potential
, sensors, AI, cognitive computing
Access to technology by consumers globally
Technology infiltrates home and political life
Rate of change
Technology
Individuals
Businesses
Public policy
HR’s opportunity is to help close the gaps among technology, individuals, businesses, and society and governments.
1970s 1980s 1990s 2000s 2010s Today
Curve 1
Curve 2
Curve 3
Curve 4

I M P R O V I N G S E R V I C E S E C T O R P R O D U C T I V I T Y : T H E E C O N O M I C I M P E R A T I V E
58
S E C T I O N 2 . 1
The Business Council of Australia has produced a similar set of “work-ready” skills employers seek beyond a formal qualification.50 These include sense-making, social intelligence, design mindset, computational thinking, new media literacy, cross cultural competency and virtual collaboration.51
Digital skills are already recognised as critical for productive workers of the future, and they go beyond knowing how to use particular applications or tools. The World Economic Forum refers to these skills as digital intelligence, underpinned by eight interconnected areas such as digital identity, digital emotional intelligence, digital com-munication and digital rights.52
“ Digital intelligence or ‘DQ’ is the set of social, emotional and cognitive abilities that enable
individuals to face the challenges and adapt to the demands of digital life.”53
New mindsets
As the speed of change increases, learned skills in specific tasks will also become redundant more quickly. A digitally enabled workforce not only has the transferrable skill of digital literacy, but a mindset that is adaptable, resilient and accepts fluidity in norms.54
Resilience and adaptability are essential traits as the typical learner profile extends beyond millennials to older, lifelong learners. Episodic learning through traditional edu-cation models will be replaced by continuous learning driven by a constant need for new knowledge. At a policy level, governments and industries will need to assess how the peer-to-peer and “gig” economy works for all parties, and develop industrial relations frameworks for these new worlds of work.
New competency assessments
New skills and mindsets will also need to be measured and qualified differently. While the need for recognised training and qualifications shows no signs of slowing down,55 traditional institutions will need to transform from a producer-driven business model, to “one that is increasingly shaped by student and consumer demands”.56 It is also important, as identified in a recent Mitchell Institute report, that measures which capture broader cognitive, social and emotional dimensions of a learner’s develop-ment are tracked at a national level and measured in a consistent manner.57 Learners are already disillusioned with graduate outcomes and employers are demanding better assessment of enterprise skills and competencies. Competing in a global market requires new, pragmatic frameworks to accurately assess competency with a view that extends beyond one-off pass-or-fail performances to lifelong learning and improvement.58

I M P R O V I N G S E R V I C E S E C T O R P R O D U C T I V I T Y : T H E E C O N O M I C I M P E R A T I V E
59
S E C T I O N 2 . 1
Keeping pace with change; getting ahead of changes
The world of work is changing very quickly, but education models are not – they were set up for a different era. In 2011, Christensen, Johnson and Horn outlined how modern education systems, influenced by the early industrial factory system, remain stuck in a model of standardisation, “categorising students by age into grades and then teaching batches of them with batches of material.”59 From primary schooling through to tertiary education and training, education models have failed to provide individualised, differentiated instruction in a meaningful, consistent and scalable way.
Learners are often exposed to a one-size-fits-all experience and perfunctory assess-ments of skills so disconnected from real world projects that their qualifications no longer match employer needs or expectations. Industry is already moving away from seeing the degree as an indicator of skills – for example, in 2016 one-third of gradu-ates hired into KPMG’s audit division did not have a business or accounting degree.60 KPMG is making deliberate efforts to enhance transferable skills, diversity and inno-vation by seeking graduates with stronger mathematics and information technology skills, as well as study experience in areas ranging from environmental science to Mandarin, counter terrorism to social work.
Digital skills are imperative to this workforce. Another major accounting and profes-sional services firm, PwC, is investing in re-training programs to improve existing staff’s technology skills.61
Adjacent models are emerging, mostly through experimentation with new technology. Massive Open Online Courses (MOOCs) have attracted significant public attention and, while they have had trouble finding a sustainable business model, verified certifi-cates and digital credentialing indicate progress in this space.62 This is one example of a move away from provider-centred educational models, towards personalised, just-in-time and continuous learning. Other examples include alternative approaches such as boot camps,63 which, in other jurisdictions, are being considered for government funding given their recognised role in training the workforce for new jobs.64
“New models of tertiary education are coming, ready or not.”
New Zealand Productivity Commission Report, March 2017 65
Within the current education system, recommendations for radical changes are gaining momentum. New Zealand’s Productivity Commission’s March 2017 inquiry into its tertiary education system highlighted the need for new models. The Commission’s recommendations included abolishing University Entrance, making it easier for learn-ers to transfer between courses, making it easier for new providers to enter the system and facilitating more and faster innovation by tertiary education providers.66
While there is no doubt about the individual, social and economic benefits of tertiary education,67 it is also clear that level and speed of innovation required to keep pace with the number of people that will need re-skilling over the next two to 10 years will not come from within the existing system. Therefore, it is imperative that the tertiary education sector embraces new models and reimagines its own boundaries to remain relevant. Many established institutions are taking up this challenge and innovating. Two recent examples include the University of New South Wales partnering with Open Learning to transition 600 courses onto an online platform, which will replace lectures, and La Trobe University launching the Career Ready app to develop the enterprise skills required by employers.68 More of this innovation will be required, along with cre-ative policy, collective will and swift action.

I M P R O V I N G S E R V I C E S E C T O R P R O D U C T I V I T Y : T H E E C O N O M I C I M P E R A T I V E
60
S E C T I O N 2 . 1
Failure to adapt: risks to the education system and education exports
Complacency, resistance to change and a lack of concerted action all threaten Australia’s relevancy and ability to power our own and other economies through the provision of high quality, accessible education. These mindsets and approaches rep-resent risk, particularly as emerging economies look to Australia to provide education and training across a variety of service sectors.69
One major threat to the existing sector is the traction that alternative credentialing and verification is already gaining with employers. Established education providers cannot ignore this trend. While an Australian qualification is still regarded as high quality, valued and desirable, only innovation will ensure Australian credentials, regardless of form, continue to meet the changing needs of learners, industries, economies and countries.
Lack of technology-led investment in education business models also poses a risk to the entire Australian education sector. Over the next 15 years, global economic value from technological change is estimated to double and, as it takes years for thriving start-up ecosystems to develop, Australia needs to invest now.70
Other countries, particularly the US and China, are already making substantial invest-ments in educational technologies and ecosystems to meet the needs of a global learner population who now have access to the internet. In 2015, China spent over $1.3 billion (US$1 billion) in edutech investments.71 Education is at the heart of China’s strategy to transition from a manufacturing economy to a service economy.72
“ Those countries that fail to boldly and immediately invest in start-up ecosystems, and thus
fail to produce startups, will experience economic stagnation.”
Global Startup Ecosystem Report 2017 73
The education industry is changing shape. Traditional boundaries are being re-defined as new providers enter the market, including tech companies who can use their expertise and platforms to capture millions of learners globally. They do not fit into existing sector frameworks.
For example, Lynda.com is making significant headway into corporate training with its strategy to capture the $30 billion professional certification market. Its co-founders believe their platform and similar technologies can solve the skills gap, noting this to be “one of the leading social issues of our time”.74
Although they currently operate at the edges of the tertiary sector, these new platforms and engines will soon be able to deliver educational experiences and credentials that are desired by both learners and employers. They represent a threat to the value and relevance of existing credentials, which is a foundation of Australia’s tertiary education sector.
“ Rather than comprehensive and bold policy, say for the education sector as a whole, we
tend more to separateness, incrementalism, atomisation and variable, often inconsistent,
approaches…”
Former Chief Scientist of Australia, Professor Ian Chubb AC 75

I M P R O V I N G S E R V I C E S E C T O R P R O D U C T I V I T Y : T H E E C O N O M I C I M P E R A T I V E
61
S E C T I O N 2 . 1
Ultimately, Australia’s education and training system and exports are under threat if the sector does not take consolidated action. Likewise, the combative and short-term nature of Australia’s political system has left us without a clearly articulated, non-parti-san, long-term plan to ensure meaningful work and a high standard of living in the age of the Fourth Industrial Revolution.
Ensuring our education system delivers skills for the future workforce
Five priorities for action
Powering international education – International education can be a leading industry in Australia’s transition from primarily a resource-based economy to a knowledge-based economy. However, complacency and inaction are major potential risks if not addressed now. Take the 940,00076 international learners forecast to be in Australia in 2025. They will need safe and affordable housing, opportunities for meaningful work and work experience, and most importantly a community that accepts and welcomes their contribution to local towns and cities. Realising the potential of borderless edu-cation requires anticipating and responding to learner-led demand and collaborating across and beyond the sector to respond.
The education-work nexus – In a global review of tertiary education, the OECD articulated the need for a range of strategies to align education and workforce needs. These include coordinated labour market and education policies, improved data and analytics about graduate outcomes, strengthened career services, and the inclusion of labour market perspectives in policy development and institutional governance.77
Recognising that learning is lifelong, institutions and governments must promote transferable skills and studies. Inter-organisational cooperation can build seamless transitions – between institutions and new providers, and qualifications and credentials – including between VET and higher education and critically between the education sector, employers and industries.
Technology-led innovation – Advances in technology, such as cloud computing, mobility and big data along with the vast reduction in technology costs over the past 15 years provide the foundation for genuine transformation of the global education sector.
Technology can provide scale, access and personalised, engaged learning by creating customised learning experiences for each learner. These platforms will tailor learning delivery, support and feedback to align with learner-specific motivations, types of intel-ligence, or learning styles.78
Sector-wide support for technology led innovation, such as we have seen with the launch of EduGrowth, is critical if Australia is to keep pace with advances in other countries and maintain relevance to a global market of learners.
Reimagining sector boundaries – Traditional models of education are under stress. Criticised for not meeting future workforce needs, where constant change and con-stant learning is the norm, alternative models and new providers are making headway. Billions of investment dollars are flowing into the edutech sector as technology com-panies see the potential to serve millions of learners globally.

I M P R O V I N G S E R V I C E S E C T O R P R O D U C T I V I T Y : T H E E C O N O M I C I M P E R A T I V E
62
S E C T I O N 2 . 1
The education sector, governments and the policymakers must embrace alternate models and expand the framework within which the ‘tertiary education sector’ cur-rently operates. Ultimately, to ignore social and economic trends including the ways in which people want to learn and gain skills, is to put at risk a huge opportunity for Australia to maintain and advance its most important service industry.
Australia’s national imperative – The Australian Government’s National Innovation and Science Agenda (NISA) is a key part of Australia’s agenda for the future, outlining a bold and positive framework for change with its four focus areas of culture and capital; collaboration; talent and skills; and government as an exemplar. However, it overlooks a core element of Australia’s innovation infrastructure. Despite the fundamental role VET plays in skilling, upskilling and reskilling today’s workforce, particularly the service industries, “VET is completely – and remarkably – absent in the NISA narrative”.79 It is imperative that education and training policy has a central place in any national blueprint for the future.
Australia’s economic prosperity and the wellbeing will be dependent on how well we can harness the service sector, knowledge and innovation in the Fourth Industrial Revolution. The scale and urgency of transforming our industries, workforces and systems requires collective will, strong leadership, clear direction, integrated approaches and non-partisan, aligned policy at all levels of government.

I M P R O V I N G S E R V I C E S E C T O R P R O D U C T I V I T Y : T H E E C O N O M I C I M P E R A T I V E
63
S E C T I O N 2 . 1
Endnotes
1 Australian Government. ‘The Lucky Country’, accessed at www.australia.gov.au/about-australia/australian-story/lucky-country, 3 April
2 CEDA 2016, ‘Overview’, Australia’s economic future: an agenda for growth, CEDA: page 8
3 The importance of universities to Australia’s prosperity: A report prepared for Universities Australia, October 2015, Deloitte Access Economics: page 48
4 Paul., Krugman, The Age of Diminished Expectations, 1994, MIT Press: page 11
5 A Skilled Workforce for Strong, Sustainable and Balanced Growth: A G20 Training Strategy, International Labour Organization, Geneva, 2011
6 Human capital and productivity literature review, March 2013, Australian Workforce and Productivity Agency: pages 3 and 4
7 Australian Workforce and Productivity Agency, Human capital and productivity literature review, March 2013, Pages 3-6 available at https://docs.education.gov.au/system/files/doc/other/human-capital-and-productivity-literature-review-march-2013.pdf
8 Deloitte Access Economics, The importance of universities to Australia’s prosperity: A report prepared for Universities Australia, October 2015 available at www.universitiesaustralia.edu.au/news/commissioned-studies/The-Importance-of-universities-to-Australia-s-prosperity#.WN2IU_l96Uk
9 ibid
10 Ibid, page 49
11 NCVER 2016, Australian Vocational Education and Training Statistics: total VET students and courses 2015, NCVER, Adelaide
12 NSW Business Chamber, NSW Visitor Economy, On the Move Mid-Term Report Card, March 2017.
13 ibid, page ix
14 https://www.universitiesaustralia.edu.au/news/commissioned-studies/The-Importance-of-universities-to-Australia-s-prosperity#.WNuAURKGORs The importance of universities to Australia’s prosperity: A report prepared for Universities Australia, October 2015 Deloitte Access Economics: Page 46.
15 Australia’s five pillar economy: services, Bruce Rasmussen, May 2015, The Conversation
16 Ibid
17 Labour and skills forecasting for the Services industries: Productivity in the service industries, October 2010, , M, Long and C., Shah, Service Skills Australia: Page 13
18 Ibid: page ii
19 Ibid: page 12
20 New record for international education exports, Senator Simon Birmingham, February 2017
21 Positioning for prosperity? Catching the next wave, 2014, Deloitte
22 International student sector smashes records, Senator Simon Birmingham, February 2017
23 Ibid
24 The value of international education to Australia, Deloitte, 2015, Australian Government Department of Education and Training: page 1
25 Ibid: page 43–44
26 Ibid: page 10–11
27 Ibid: page 1
28 Ibid: page 3
29 Global demand for service skills puts Australia in the box seat, Senator Simon Birmingham, March 2017
30 KPMG, The Global Demand for Skills: A report for the Department of Education and Training’s International Skills Training Initiative, November 2016.
31 Edtech is the next fintech, David Bainbridge, August 2016, TechCrunch
32 Ibid
33 www.edugrowth.com.au
34 www.austrade.gov.au/Australian/Education/Services/Australian-International-Education-2025
35 The Fourth Industrial Revolution, Klaus Schwab, World Economic Forum
36 Richard Dobbs, James Manyika & Jonathan Woetzel, No Ordinary Disruption: The Four Global Forces Breaking All the Trends, 2015. McKinsey Global Institute & PublicAffairs: New York.
37 The Re-working of “Work”, Institute for the future, 2011
38 Australia’s Future Workforce?, CEDA, 2015: Chapter 4
39 European Sectoral Trends: The Next Decade, May 2016, European Centre for the Development of Vocational Training (CEDEFOP)
40 Andrew Yang, https://thinkgrowth.org/silicon-valley-is-right-our-jobs-are-already-disappearing-c1634350b3d8; https://obamawhitehouse.archives.gov/sites/whitehouse.gov/files/documents/Artificial-Intelligence-Automation-Economy.PDF
41 Prizes, Challenges, and Crowdsourcing Advance NASA’s Mission and Outreach, April 2016
42 Rewriting the rules for the digital age, 2017 Deloitte Global Human Capital Trends
43 Ibid
44 ABS, Education and Work, Australia, May 2014. Catalogue Number 6227.0. Canberra: Australian Bureau of Statistics, 2014.
45 The Right Combination, CBI/ Pearson Education and Skills Survey, July 2016
46 Ibid
47 Ibid
48 Future Work Skills 2020, Institute for the Future for the University of Phoenix Research Institute
49 The New Basics: Big data reveals the skills young people need for the New Work Order, Foundation for Young Australians

I M P R O V I N G S E R V I C E S E C T O R P R O D U C T I V I T Y : T H E E C O N O M I C I M P E R A T I V E
64
S E C T I O N 2 . 1
50 Being Work Ready: A Guide to What Employers Want, Business Council of Australia, May 2016
51 Future Work Skills 2020 report, Institute for the Future for the University of Phoenix Research Institute, 2011
52 8 digital skills we must teach our children, World Economic Forum, June 2016
53 Ibid
54 Tomorrow’s Digitally Enabled Workforce, CSIRO, January 2016
55 Higher Education Funding in Australia: A review of reviews from Dawkins to today, Australian Government Department of Education and Training, 2015
56 https://www.eiuperspectives.economist.com/sites/default/files/EIU_AcademicPartns_WEBr1.pdf Higher education in the 21st century: Meeting real-world demands, The Economist Intelligence Unit, 2014
57 www.mitchellinstitute.org.au/wp-content/uploads/2017/03/Preparing-young-people-for-the-future-of-work.pdf The Mitchell Institute, March 2017. Page 8.
58 A pragmatic guide to competency: Tools, Frameworks and Assessment, BCS – The Chartered Institute for IT, 2011
59 Christensen, C. M., Johnson, C. W. & Horn, M. B. (2011) Disrupting Class: How Disruptive Innovation Will Change the Way the World Learns, 2nd edition, New York: McGraw-Hill.
60 KPMG’s new auditors don’t have accounting degrees, Agnes King, Australian Financial Review February 2016
61 Ibid
62 MOOC Trends in 2015: Big MOOC Providers Find their Business Models, Dhawal Shah, December 2015
63 Boot Camp classes may offer a peek at the future of higher ed, Bob Sullivan, CNBC, June 2015
64 Hillary Clinton touts entrepreneurship, tech education at Denver’s Galvanize, Greg Avery, Denver Business Journal, June 2016
65 New models of tertiary education, New Zealand Productivity Commission, March 2017
66 Ibid
67 Jeff Borland, Peter Dawkins, David Johnson and Ross Williams, Returns to Investment in Higher Education, Melbourne Institute Report, The University of Melbourne, 2000
68 KPMG, The Global Demand for Skills: A report for the Department of Education and Training’s International Skills Training Initiative, November 2016.
69 KPMG, The Global Demand for Skills: A report for the Department of Education and Training’s International Skills Training Initiative, November 2016.
70 Global Startup Ecosystem Report 2017, Startup Genome in association with Crunchbase
71 Mega-Rounds Boost Global Ed Tech Funding To New Record, CB Insights, January 2016
72 Education is China’s secret weapon for tech dominance, Sylvain Kalache, Venture Beat, September 2016
73 Global Startup Ecosystem Report 2017, Startup Genome in association with Crunchbase
74 Why LinkedIn spent big on Lynda.com, Matt Kapko, CIO, April 2015
75 Remarks at the Australian Labor Party National Skills Summit, Canberra. March 2017
76 This is achieved with a compounding annual growth rate of just 3.8 per cent from 2015 levels. https://www.austrade.gov.au/australian/education/services/australian-international-education-2025/growth-and-opportunity/growth-and-opportunity” Growth and opportunity in Australian international education, Deloitte Access Economics and EduWorld, 2015
77 OECD, Thematic Review of Tertiary Education, OECD, 2008. Available at http://www.oecd.org/education/skills-beyond-school/thematicreviewoftertiaryeducation.htm
78 Christensen, C. M., Johnson, C. W. & Horn, M. B. (2011) Disrupting Class: How Disruptive Innovation Will Change the Way the World Learns, 2nd edition, New York: McGraw-Hill.
79 Goedegeburre L, and Schubert R, ‘Vocational Education and the Innovation Agenda: Towards the Creation of Effective Eco-Systems’, www.lhmartininstitute.edu.au/userfiles/files/Blog/voc-ed-in-the-innovation-agenda-LG%2BRS.pdf, p 10

I M P R O V I N G S E R V I C E S E C T O R P R O D U C T I V I T Y : T H E E C O N O M I C I M P E R A T I V E
65
Professor Leo Goedegebuure is Director at the LH Martin
Institute for Tertiary Education Leadership and Management,
where he is active in the field of higher education policy
research and management. Prior to his move to Australia in
2005, Professor Goedegebuure was Executive Director of the
Center for Higher Education Policy Studies (CHEPS) at the
University of Twente, Netherlands, Europe’s largest research centre in this field.
His research interests are in the areas of governance and management, both at the
systems and institutional level, system dynamics including large scale restructuring
policies, university-industry relationships, and institutional mergers. He has worked
as an expert on governance and management in Central and Eastern Europe, the
Russian Federation, Africa, South East Asia and South America on projects initiated
by the European Commission, the World Bank and UNESCO.
Over his career, Professor Goedegebuure has published some 15 books and over
100 articles, book chapters and papers on higher education policy, mergers, quality
assessment, evaluation research, differentiation, system dynamics, engineering
education, institutional management and comparative research.
2.2Australian university productivity;
some food for thought
Professor Leo Goedegebuure Associate Professor Ian Marshman

I M P R O V I N G S E R V I C E S E C T O R P R O D U C T I V I T Y : T H E E C O N O M I C I M P E R A T I V E
66
Associate Professor Ian Marshman joined the
University of Melbourne in 1990 and was
appointed Senior Vice-Principal (“Chief Operating
Officer”) in March 1999. In this role he was
accountable for the overall administration and
operational management of the university, and
during this period he played a major role in: reforming the university’s
administration; implementing new administrative systems and
processes; planning and reforming budgets; developing the Melbourne
Scholarships program and student-facing aspects of the Melbourne
Model; and planning and implementing major university projects.
Associate Professor Marshman retired from that role in July 2015 and
now serves as an Honorary Principal Fellow and Associate Professor at
the Melbourne Centre for the Study of Higher Education. He is Board
Chair of the headspace Youth Mental Health Foundation, Chair of the
Melbourne Dental Clinic, a board member of the Melbourne Theatre
Company and a board member of the Queen’s College Council.
S E C T I O N 2 . 2
Introduction
Universities are – and have been since the second half of the 20th century – a distinct part of the Australian economy. Except for the Australian National University, all are established by state and territory legislation and subject, to a greater or lesser extent, to regulatory compliance and oversight by the Commonwealth/states/territories. On average, universities receive 39.5 per cent of their revenue from the Australian Government and a further 17.8 per cent of revenue via Commonwealth Government guaranteed payments relating to student HECS and fee-paying loans.1 This combina-tion of revenue sources has been in operation since the implementation of the Dawkins reforms in the late 1980s.2
However, increasingly Australian universities are encouraged to be entrepreneurial and generate significant revenue flows from other sources. This is particularly true for the development and growth of the international student market. While the exact size and economic impact of international education remains somewhat of a contested issue, there is no doubt that it is one of Australia’s top five export industries, commonly reported as the third after iron ore and coal.3 More recently the international revenue stream has been complemented with philanthropy, industry engagement and com-mercialisation of research – all key examples of significant levels of non-government funding growth. It serves to highlight the fact that Australian universities slowly but steadily are following the path of diversifying income sources (for an elaboration, read Creating Entrepreneurial Universities; Organisational pathways to transformation).4

I M P R O V I N G S E R V I C E S E C T O R P R O D U C T I V I T Y : T H E E C O N O M I C I M P E R A T I V E
67
S E C T I O N 2 . 2
In examining productivity within the university sector, it is helpful to view the current state of play from three distinct perspectives. This chapter will first discuss revenue side productivity, with the starting question of: how has the sector travelled in this respect over the last 10 years? It then will look at cost management efficiency, with a view to answering the question: what has happened in terms of efficient use of academic and administrative resources? The chapter finishes by discussing the effectiveness of the policy framework universities operate in. Before getting into these questions, however, there is a brief discussion of the concept of productivity in higher education.
Productivity in higher education
Productivity in higher education is not as straightforward a concept as one might think. While its definition is simple enough, namely an economic measure of output per unit of input, the two core elements of outputs and inputs are problematic in a higher education context. As the late William Bowen notes in his Tanner lecture at Stanford University, 10–11 October 2012, “it is maddeningly difficult in the field of education to measure both ‘outputs’ and ‘inputs’ – even within a single institution, never mind across institutions serving different missions”.5
This is due to:
The multi-product nature of higher education “producing” teaching, research and engagement;
The need to incorporate the quality dimension of these outputs;6 and
A set of factors that inexorably push up the costs of higher education.
Bowen7 identifies the “set of factors” as a combination of the nature of knowledge-intensive industries and of systemic inefficiencies. For knowledge-intensive industries such as universities, it is far less easy to replace human input and labour with auto-mated processes as we have seen happening in other industries. This tendency, labelled the “cost disease”, results in average production costs increasing more per annum for this sector than for all other non-knowledge intensive industry sectors. As to systemic higher education inefficiencies, these relate to an ingrained desire to “buy the best”, and supply-side problems combined with a mismatch between students and institutions. Inefficiencies are related to the sub-optimal way in which many insti-tutions are managed, often translated as the need to “adopt a more business-like approach”, the fact that universities by-and-large are good at adding things but not at subtracting, and the scope of program offerings which are often not aligned with needs or economies. The desire to buy the best partly is inherent in the “nature of the beast” but partly also driven by the steep stratification found in many higher education systems, the increasing importance given to rankings, and the isomorphic pressures resulting in imitating those higher up the pecking order by those positioned at the lower end. The latter has been aptly coined the “reputation race” by Frans van Vught.8
Finally, supply side problems reflect the increasing time it takes students to complete (time-to-degree) and the lower completion rates across systems, which are related to sub-optimal student choice in selecting an appropriate institution that reflects their capabilities and abilities (mismatch).

I M P R O V I N G S E R V I C E S E C T O R P R O D U C T I V I T Y : T H E E C O N O M I C I M P E R A T I V E
68
S E C T I O N 2 . 2
Although the examples above are drawn from US literature and context, they are equally applicable to the Australian context. In a 2002 interview for the BHERT news-letter, Gavin Moodie and Glyn Davis reflect on the productivity gains made across the sector since 1995 and the need for a more aligned Commonwealth governance framework. Fifteen years later this article appears as relevant as it was then. Indeed, productivity gains have been significant, but ingrained institutional and systemic issues have remained. Empirical studies indicate that overall the sector has demonstrated strong productivity increases since the late 1990s.9 Increases that are primarily the result of technological change, such as the adoption of ICT in education and the rise of e-learning combined with strong improvements in research outputs, rather than administrative efficiencies. This will be elaborated on later in the chapter.
Current performance in securing productivity
In assessing productivity within Australian universities, it is instructive to review perfor-mance from three distinct perspectives: institutional outputs, cost side effectiveness, and effectiveness of the over-arching national policy framework.
Looking at trends over the decade 2005–2014, Australian universities have made considerable advances on the output side. Australian university research performance is assessed through a national Excellence in Research for Australia (ERA) assess-ment exercise. ERA 2015 followed similar reviews in 2010 and 2012. For 2015, research outputs had increased by 29.7 per cent from 2010 (and 4.7 per cent since 2012), the number of patents had increased by 39 per cent (23 per cent since 2012) and measures of “research esteem” were assessed as increasing by 22 per cent (10 per cent since 2012).10 In teaching and learning the number of enrolled students increased from 944,977 in 2004 to 1,373,230 in 2014, an increase of 45.3 per cent. Financially, university revenues have been reported as increasing at an annual rate in constant dollars of more than 3.8 per cent per annum (7.5 per cent in dollars of the day) over the decade 2004–14,11 notably a period that included significant funding shocks associated with the Global Financial Crisis.
Taken together, these results signify a period of substantial growth in activity and outputs. The overall impact has been an increasing national improvement in global higher education rankings as best indicated by Table 1, based on the Academic Ranking of World-class Universities (ARWU) that essentially is a research performance based ranking, but also one that is the least subject to data manipulation and other sorts of market driven vagaries that are part and parcel of most other ranking systems. The table shows a significant increase in both the number of Australian universities in the top 500 world class universities and a steady climb up the quality ladder. Having over 50 per cent of the nation’s universities in this elite gathering is no mean feat at all. The table also shows that in terms of both the number of universities and the increase in ranking position, Australia’s performance in relation to its regional counterparts is only surpassed by China. In this we do need to take account of the small scale of the university sector in Hong Kong and Singapore, but it nevertheless is a significant achievement.

I M P R O V I N G S E R V I C E S E C T O R P R O D U C T I V I T Y : T H E E C O N O M I C I M P E R A T I V E
69
S E C T I O N 2 . 2
On the cost side, the sector’s performance appears mixed. The significant increases in research output and student enrolments have been achieved with a smaller rate of increase in academic staff numbers and associated staffing costs. Over the decade 2004–14 academic staff numbers across the sector increased by 35.8 per cent, i.e. from 41,179 to 56,091 FTE.12 Academic staff employment costs have increased by 36.2 per cent.13 The additional use of more flexible employment practices, notably increasing levels of casualisation of the academic workforce (i.e. staff employed on short-term fixed term contracts to cover defined teaching commitments) and a greater designation of teaching only roles (i.e. excluding the research expectations of the tradi-tional academic role) have delivered overall increases in academic productivity.
On the other hand, improvements in administrative productivity appear to have proceeded at a slower pace than other industry equivalents. In 2004 universi-ties employed 50,573 administrative staff (EFT) with salary and other expenses amounting to 27 per cent of total expenditure. A decade later in 2014 Australian uni-versities employed 66,860 EFT administrative staff, with associated costs comprising 26.2 per cent of total expenditure.14 Despite a significant increase in overall activity, little efficiency dividend appears to have been captured in the administration area (although several major initiatives at administrative reform now appear under way across the sector).
At the financial level, a significant improvement in university bottom lines has occurred over the decade. In 2004, the total operating result for the sector as a whole was reported as being a surplus of $0.66 billion. By 2014 the aggregate surplus had increased to around $1.88 billion. Interestingly, this level of surplus was achieved by 2009, with little variation subsequently at the aggregate level.15 This suggests a desired level of operating surplus had been attained and that the sector had become comfortable in redirecting to other uses operating surpluses above this level.
TABLE 1 COUNTRY COMPARISONS ARWU 2006–10
Hong Kong Korea Japan China Singapore Australia Malaysia
06 10 16 06 10 16 06 10 16 06 10 16 06 10 16 06 10 16 16
1–50 – – – – – – 2 2 2 – – – – – – – – 1 –
51–100 – – – – – – 4 3 2 – – 2 – – 1 2 3 5 –
101–150 – – 1 – 1 1 3 1 1 – – 4 1 1 1 3 2 2 –
151–200 1 1 – 1 – 2 – 3 1 1 2 3 – – – 1 2 – –
201–300 2 3 3 2 3 3 3 1 3 4 5 9 – 1 – 3 2 6 –
301–400 2 1 1 3 3 3 8 7 3 2 3 13 1 – – 2 4 7 –
401–500 – – 1 3 3 2 12 8 4 2 12 10 – – – 5 6 2 3
Total 5 5 6 9 10 11 32 25 16 9 22 41 2 2 2 16 17 23 3
Source: LH Martin Institute based on ARWU 2006-2016 data.

I M P R O V I N G S E R V I C E S E C T O R P R O D U C T I V I T Y : T H E E C O N O M I C I M P E R A T I V E
70
S E C T I O N 2 . 2
At the policy framework level, as indicated previously in this chapter, the sector has operated in a relatively constant environment. The one major change has been the introduction of the demand-driven system, which has deregulated the numbers of domestic undergraduates Australian universities can enrol, although the price charged for these places remains regulated. While fee-paying places for both domestic and international students are now fully deregulated, significant regulatory constraint applies to the way government-subsidised places are allocated across sub-bachelors, graduate and, to a lesser extent, bachelors programs. These constraints appear to be inhibiting innovation and entrepreneurship at the institutional level, with universities seeking to experiment in ways that don’t include the standard “Australian educational template” being subjected to further controls on the number and nature of places available. This perpetuates the perception of a one-size-fits all policy framework that limits opportunities for sectoral diversity or differentiation based on mission, strategy or outcomes.
In contrast research and research training have operated for a substantial period under a more performance-based framework with funding for research infrastructure and research training directly linked respectively to success against key research output measures and higher degree completions.
Five key areas for delivering greater productivity
Against this background there appear to be five contemporary “big ticket” areas for productivity improvement in Australian higher education. It should be noted that some of these, either directly or tangentially, are the subject of a Ministerial Review of Higher Education Funding initiated by the Minister for Education in May 2016,16 with the out-comes at the time of writing anticipated to be linked to the 2017 Federal Budget. It is possible that some of these opportunities will be the subject of broader discussion and debate in the months ahead. But it should also be noted that, given the extremely ordinary success rates in implementing significant policy reform over the last 10 years, we feel inclined once more to hedge our bets.
In our federal system, the separate accountabilities for planning and funding the higher education and vocational education and training (VET) sectors continues to be a major source of productivity weakness, from both national and private citizen perspectives. There is still no coherent national policy that embraces both higher education and VET in the context of 21st century challenges. Nor is there an integrated national policy within higher education or VET that informs the entities’ operational framework. The framework is fragmented and, at best, a patchwork of ill-fitting individual components.
As a result, Australian university research is now very substantially cross-subsidised from the higher tuition fees that research universities can command for international enrolments. In turn the increases in international student enrolments are dependent on a globally attractive migration and visa eligibility regime. Elsewhere there appears to be a significant oversupply of graduates across many disciplines,17 while workforce short-ages are present in a number of traditional VET areas. Although workforce planning is a notoriously difficult (if not impossible) area of public policy, the absence of a coherent and inclusive national policy framework embracing both higher education and VET is a serious shortcoming, the solution to which would offer enormous productivity returns.
Within higher education itself five key opportunities for productivity improvement are set out below.

I M P R O V I N G S E R V I C E S E C T O R P R O D U C T I V I T Y : T H E E C O N O M I C I M P E R A T I V E
71
S E C T I O N 2 . 2
Opportunity one: some element of outcomes based funding for government subsidised teaching and learning
Since 2009 the number of domestic students enrolled in university courses has increased by 24.3 per cent.18 Masked by this average are some massive variations in increased enrolments. While seven universities have increased enrolments by 12 per cent or less, some seven universities have succeeded in increasing enrolments by more than 35 per cent, two by more than 80 per cent.19
Universities have generally shown themselves to be responsible in maintaining appro-priate admissions practices. However, the fact remains that an open-ended funding entitlement based solely on volume and not on outputs is bad public policy. The financial temptations are readily apparent. Earlier this year, reacting to media concerns about a decline in standards, the Federal Minister for Education published updated details of student completion rates, identifying universities with high attrition rates.
Significant improvement in teaching and learning productivity would be achieved if a portion of the funding universities receive for this activity were linked to retention and graduation rates. Over time an outcomes-based measure such as graduate employ-ment rates might be added. There are significant international references to ward off the argument that tying outcomes and outputs to financial incentives results in a nega-tive quality spiral.
Australian universities have demonstrated considerable agility in being able to adapt to changing funding incentives. A modest change of the funding formula to include a focus on outputs, and outcomes, would lead to greater discernment in admission practices, more attentive monitoring of student progress, improved student support and further emphasis on career outcomes. Students, institutions and the nation gen-erally would all benefit.
Opportunity two: modernisation of the employee relations framework
Notwithstanding a small number of exceptions, employee relations across Australian higher education remain embedded within a culture that harks back to the industrial era of the 1980s and 1990s. Although the proportion of staff who are union members is now relatively small, the industry-focused National Tertiary Education Union has been successful in asserting significant sectoral leadership in framing the workplace relations agenda since the introduction of enterprise bargaining. An employee-based association representing most but not all universities, the Australian Higher Education Industrial Association (AHEIA), rounds out the higher education “IR club”.
Skilful union negotiation has resulted in typically long and procedurally detailed agreements, rates of salary increases that have often exceeded national averages (notwithstanding the retention of historic annual incremental advancement provisions for most staff), common rates of salary increase for academic and administrative staff, which generally disregard local relativities for generic occupational groups and in some institutions overly prescriptive specification of academic workload expectations.

I M P R O V I N G S E R V I C E S E C T O R P R O D U C T I V I T Y : T H E E C O N O M I C I M P E R A T I V E
72
S E C T I O N 2 . 2
The result is a one-size-fits-all approach that constrains the matching of workforce arrangements to local settings, forcing universities to seek sub-optimal workarounds such as increasing casualisation of the workforce. Significant salary differentials apply in a number of occupational categories between what the market pays for profes-sional and administrative designations and the pay and conditions of “higher education workers”.
Significant opportunity presents for those universities with the willingness and stamina to work with their own staff – and desirably with their union representatives – to develop a workplace relations framework that, while rewarding staff fairly, is aligned with the strategy and circumstances of the particular institution. Such an approach would likely see an increase in employment certainty for academic staff and allow institutions to more effectively embrace the impact of the digital revolution and the workforce challenges it represents to the traditional allocation of functions between research and teaching, and the academic and professional domains.
Opportunity three: reforming cumbersome research processes
For a significant proportion of academic staff, research activity and success are primary career drivers. In this area, their focus rests principally on the annual research grant rounds conducted by the national NHMRC and ARC granting agencies.
Increasing competition for grants, coupled with what is now at best a stagnant pool of funds available for publicly funded research, has led to low levels of grant success and, in many cases, lower levels of grant funding. While success rates vary from year to year, an overall success rate of one in six or seven is now the norm. For several grant categories, the quantum of funds allocated is little more than $100k per annum, for up to three years.
From a cost effectiveness perspective, in the larger research-intensive universities typically 30 to 40 per cent of research and teaching staff are annually preparing, sub-mitting and reviewing research grant applications, a process that anecdotally is said to consume six to 10 weeks of an active academic researcher’s year. A 2012 study estimating the time spent on preparing grant proposals for the NHMRC claims 550 working years were involved in this process.20 It is apparent from this that the opportu-nity cost of the grants administration process probably runs the risk of exceeding the direct benefits of grant success.
While academic staff hold enormous reverence for the peer review process they compete in for research grants, and gain high esteem upon attaining grant success, one wonders how low success rates need to fall before policymakers and university leaders alight upon a more cost-effective allocation methodology.
Given the advent of the triennial ERA research assessment exercise with its detailed assessment of disciplinary research performance at institutional level, would a more cost-effective approach be to allocate a far greater proportion of research funding directly to institutions based on ERA performance? Desirably, funds might be allocated over a longer five to seven-year period so as to encourage a greater maturation of genuine research development, coupled with a stringent ex-post international review process. Institutions might then be held rigorously to account for developing and maintaining a coherent research strategy, responding to national research priorities where applicable, delivering substantial research outcomes and demonstrating their impact.

I M P R O V I N G S E R V I C E S E C T O R P R O D U C T I V I T Y : T H E E C O N O M I C I M P E R A T I V E
73
S E C T I O N 2 . 2
Opportunity four: a sharper focus on organisational design and administrative effectiveness
Although 39.5 per cent of university revenue comes directly from the public purse, there is remarkably little review of the effectiveness in which those funds are deployed. One of the fundamental and enduring tenets of university management is that “univer-sities tend to spend what they earn”. Rarely do universities go seriously into the red. However, they also seem adept in expending receipts above what is deemed to be an acceptable level of operating surplus. Indeed, the industrial framework they operate in encourages reporting of only modest surpluses.
This sustained period of revenue growth has meant universities have had little incen-tive to review back office costs and organisational structures. They weren’t forced to go through the cost reviews that business and industry launched in response to changing economic conditions since the Global Financial Crisis.
This lack of appetite for reform is often manifested at the governance level where appointment to a university council can still be perceived as a trophy appointment that recognises achievement in domains other than higher education. The manner in which university governing bodies are appointed has not necessarily advanced the prevailing concept of skills-based boards. Governing bodies infrequently include higher educa-tion expertise beyond ex officio and other internal appointments. This has tended to leave organisational issues, including the relative merits of administrative and structural reform, securely with executive leadership.
Within the higher education sector most universities participate in an informal but externally commissioned administrative staff benchmarking exercise, through the Uniforum collaboration. Using an activity-based costing methodology the Uniforum survey indicates a 25 per cent differential between the most efficient and the least efficient university administrations.
Over the past three years an increasing sense of urgency about the need to make further investment in research, teaching and learning – in large part driven by a desire to maintain or strengthen relative international standing – has stimulated Australian universities to examine the efficiency of their administrations and back office func-tions. Some are also rationalising historically large and complex academic structures. Progress is occurring.
However, compared to the vigorous cost cutting and restructuring that has taken place within the private sector – including, of course, mergers and amalgamations – there remains enormous scope with Australian higher education to reduce overhead expenditure, apply from business and industry contemporary models for the delivery of back office and support functions, embrace digital alternatives to past administra-tive practices and shift to leaner, more expert governance and executive management models.

I M P R O V I N G S E R V I C E S E C T O R P R O D U C T I V I T Y : T H E E C O N O M I C I M P E R A T I V E
74
S E C T I O N 2 . 2
Opportunity five: mainstreaming the digital revolution
Australian universities have to-date been remarkably successful in avoiding coming to terms with the challenges and opportunities that the digital revolution presents.
To be fair, this appears to be more a global phenomenon than something idiosyn-cratically Australian. It is remarkable that to-date global higher education has largely avoided the massive disruption that the digital revolution has inflicted on other sectors, some closely linked to education.
In fact, for many universities the response to date has been to seek to shore up the traditional model, with an even greater emphasis on the campus-based experi-ence, the strengthening of “bricks and mortar” delivery of student services and a newly embraced commitment to increase exponentially the availability of student accommodation.
Australian universities have responded with alacrity to what have proven to be non-threatening-to-core-business initiatives such as massive open online courses (MOOCs). Some are building relatively small niche online products, predominantly in the graduate area. Relatively few have seriously embraced the digital revolution head-on, either in the teaching and learning or back office domains.
The upshot of this is that, despite notable experiments, the academic year remains largely the same as it has been for the past 30 years – a two semester year that involves direct teaching for a maximum of 24–26 weeks in aggregate, coupled with formal examination periods. As a result, substantial resources – both human and capital – remain under-utilised for large chunks of the year, in the belief that this is the most effective means of enabling academic staff to deliver on research objectives. Strong staff and union resistance to the consideration of alternatives serves to rein-force the validity of the status quo.
Student assessment is another example of the reluctance of institutions to embrace change. Where formal examinations are still required, an apparent reluctance to iden-tify other approaches designed to protect academic integrity means that the current generation of students brought up in the digital era is often required to become familiar with submitting handwritten answers.
While structural reform of this nature that disturbs traditional management and work practices will never be easy, particularly in organisations where the nature of academic engagement relies so much on certainty and continuity, the fact remains that a totally new research-intensive or teaching-focused university would never start with the model that most Australian universities continue to embrace. (Bond University with its far greater focus on the student experience and the adoption from the outset of a three-term year is an example of what a fresh approach can deliver.)
The digital revolution and the expectations of the millennial generation, which has grown up in a more virtual world, provide the stimulus for Australian universities to reconceive the manner they deliver core programs in. In doing so they can realise significant productivity improvements.
In fact, there remains a huge dividend for those universities which properly secure first mover advantage in transitioning to a more digitally-enabled world, as for example Deakin University is demonstrating.

I M P R O V I N G S E R V I C E S E C T O R P R O D U C T I V I T Y : T H E E C O N O M I C I M P E R A T I V E
75
S E C T I O N 2 . 2
Conclusion
A review of higher education productivity encourages a critical dissection of current performance and the identification of numerous and significant areas for improvement. While in no way diminishing the validity of such assessments, it remains important to recognise that Australian universities, in aggregate, have proved themselves to be remarkably successful, internationally competitive and resilient.
Australia can justifiably be proud of the higher education sector it has.
Nevertheless, there are major areas where significant productivity advances remain feasible. There are some where the potential remains largely unexplored. In contrast to other sectors and higher education in other global regions, Australian universities were essentially spared the buffeting of the Global Financial Crisis. Instead steady but regular increases in revenue have allowed Australian universities to deliver on strategic goals without having to resort to uncomfortable conversations about whether time-honoured practices should endure in what is likely to be a much more changing and changeable future.
This chapter has sought to provide a brief synopsis of the current state of play in terms of university productivity. It has sought to identify areas that warrant close and immediate attention. It would seem there are a number of straws in the wind. Further productivity improvement may soon be coming to a university near you, but it will be an uphill battle unless the overarching policy framework is aligned to stimulate and reward differentiated institutional missions and associated performances.

I M P R O V I N G S E R V I C E S E C T O R P R O D U C T I V I T Y : T H E E C O N O M I C I M P E R A T I V E
76
S E C T I O N 2 . 2
Endnotes
1 Australian Government (2016a). Department of Education and Training: Finance 2015 – Financial Reports of Higher Education Providers, November 2016. Canberra.
2 Croucher, G., S. Marginson, A. Norton, and J. Wells (Eds.) (2013). The Dawkins revolution: 25 years On. Melbourne: Melbourne University Press.
3 Davis, D. and B. Mackintosh (Eds.) (2011). Making a Difference: Australian international education. Kensington: University of New South Wales Press.
4 Clark, B.R. (1998). Creating Entrepreneurial Universities; Organisational pathways to transformation. Oxford: Pergamon Press.
5 Bowen, W.G. (2012). Costs and Productivity in Higher Education. The Tanner Lectures on Human Values. Stanford University, October 10–11. Stanford.
6 Sullivan, T.A., C. Mackie, W.F. Massy and E. Sinha (2012). Improving Measurement of Productivity in Higher Education. Washington: The National Academies Press.
7 Bowen, W.G. (2012). Costs and Productivity in Higher Education. The Tanner Lectures on Human Values. Stanford University, October 10-11. Stanford.
8 Vught, F. A. van (2008). Mission diversity and reputation in higher education. Higher Education Policy, 21 (2), pp. 151–174.
9 Moradi-Motlagh, A., C. Jubb and K. Houghton (2016). Productivity Analysis of Australian Universities. Pacific Accounting Review 28 (4), pp. 386–400.
10 Australian Research Council (2015). State of Australian University Research 2015-16 Vol 1 ERA National Report, Section 1 ERA 2015 National Overview. Canberra.
11 Marshman, I. and F. Larkins (2016). Financial Health of Australian Universities, LH Martin Institute Insights Blog. September 2016. Melbourne.
12 Australian Government (2015). Department of Education and Training Selected Higher Education Statistics – 2015 Staff Data and 1997 to 2007 Staff Data. Canberra.
13 Australian Government (2014a). Department of Education and Training, Finance 2014. Canberra.
14 Australian Government (2014b). Department of Education Higher Education Statistics – Staff Data. Canberra.
15 Australian Government (2014a). Department of Education and Training, Finance 2014. Canberra.
16 Australian Government (2016b). Driving Innovation, Fairness and Excellence in Australian Higher Education, May 2016. Canberra.
17 Quality Indicators or Learning and Teaching, 2016 Graduate Outcomes Survey, November 2016 reports a decline in full-time employment for undergraduates from 85.2% in 2008 to 70.9% in 2016; for postgraduates, a decline from 90.1% to 85.1% has occurred over the same period. For teacher graduates (primary teachers in particular) see Australian Government Productivity Commission Research Report: Schools Workforce, April 2012: dental and journalists see Alan Montague, The Conversation 11 August 2014; for law graduates see Australian Financial Review 22 October 2015 Too Many Law Graduates and Not Enough Jobs by Edmund Tadros and Katie Walsh
18 Larkins, F. and I. Marshman (2016a). Domestic Student Load and Financing Trends for the Deregulated Demand-Driven Australian Universities, LH Martin Insights Blog, 22 June 2016. Melbourne.
19 Larkins, F. and I. Marshman (2016b). Domestic Student Load and Financing Trends at Individual Australian Universities LH Martin Institute Insights Blog, 20 July 2016. Melbourne.
20 Herbert, D.L., A.G. Barnett, Clarke P and N. Graves. On the time spent preparing grant proposals: an observational study of Australian researchers. BMJ Open 2013 (3).

I M P R O V I N G S E R V I C E S E C T O R P R O D U C T I V I T Y : T H E E C O N O M I C I M P E R A T I V E
77
Sue Freeman is currently a director of four
companies – First Impressions Resources; the
Australian Retail College India; First Impressions
Resources India; and Swift eLearning.
Sue leads the Queensland Skills and Education
Consortium, established in January 2016, the
consortium is a collaboration of private and public vocational education
providers working together to meet the skilling challenges in India. This
follows four years of offshore delivery in India through the Australian
Retail College. Ms Freeman actively contributes to a range of vocational
education boards and committees, and was Deputy Chair of the
Queensland Government Training and Employment Recognition Council,
2003–2012, overseeing the quality and registration of training providers.
She is an active Australian Council Private Education and Training
(ACPET) member. She has recently been appointed to the Australian
Government’s Council for International Education and is a member of the
Queensland International Education and Training Advisory Group (IETAG),
bringing diverse industry voices and guidance to government.
2.3Case study:
exporting VET into India
Sue Freeman
I M P R O V I N G S E R V I C E S E C T O R P R O D U C T I V I T Y : T H E E C O N O M I C I M P E R A T I V E
78
Introduction
First Impressions Resources (FIR) is a retail specialist training organisation. Over the last 29 years the organisation has built a brand that works closely with many of its international and national retailers to deliver and support a range of accredited and non-accredited talent development programs in Australia.
In the Australian accredited training space, FIR offers from Certificate II to Diploma level qualifications in retail, pharmacy, business, and training and education, as well as assessment training packages.
The Australian retail sector, like its international counterparts, has been undergoing significant change over the last decade. The predominant growth sectors have been global brands and omni-channel players, whereas many of Australia’s local traditional retailers have struggled with economic pressures and changing consumer habits. About eight years ago this drove FIR to look closely at the future of the Australian retail market and, by association, what the organisation’s own future may look like.
In 2008, FIR took a global look at which of the performing retail markets it wanted to examine more closely. India was, at that time, the second fastest growing market after China. As FIR had never worked with International students, FIR management decided it was more manageable to start researching a country where English was spoken in the corporate space, and therefore decided upon India. Around the same time, the Queensland Department of Education was looking to place a research intern from India in an organisation that could provide them with a real-life project. That person was with FIR for three weeks and during that time the organisation put together an analysis of the existing vocational education training (VET) system in India, and the providers offering retail.
That research confirmed FIR’s desire to more closely examine India and so the organ-isation and its business partner embarked on their first visit to India.
The journey
FIR began with the Global Skills Summit in Delhi in 2008, where retail was one of the four industries profiled. The summit led to connections with key stakeholders in the Indian retail industry, industry associations and Indian government representatives.
In the comprehensive joint ministerial statement issued by the Australian and Indian governments in 2010, a number of significant areas of cooperation and opportunities for collaboration were outlined within the vocational education and training sectors. Of particular interest for FIR was the establishment of industry skills councils, a shift to a competency based approach and the partnership opportunities for institutions from each country.
Subsequently FIR was invited to showcase the national retail qualification pathway to visiting Indian government and industry representatives on a visit in 2010.
S E C T I O N 2 . 3

I M P R O V I N G S E R V I C E S E C T O R P R O D U C T I V I T Y : T H E E C O N O M I C I M P E R A T I V E
79
The organisation then undertook an independent research visit to India to examine the applicability of the Australian Retail Training Package to the Indian retail context. This expanded on extensive desktop research that FIR had already undertaken. FIR found getting in to meet with Heads of Human Resources in Industry relatively easy, and was supported by three industry associations. The Heads of Human Resources in Industry remain to this day keen to meet with international organisations to find ways to resolve their challenges in on-boarding and upskilling the workforce. It became apparent through this research that the industry was informed about the retail training package and the qualification pathways in Australia.
The research undertaken highlighted some key areas for skills development in India and considerable similarities between the two countries’ retail sectors and was cap-tured in the report, Growing a Retail Workforce: A Strategy for India and Australia. This report highlighted the significant opportunity for Indian industry to adapt Australia’s retail training package and models of vocational education and training to meet its skills development needs. This required consideration of a range of factors by industry, government and educators.
FIR identified 12 recommendations for government, industry and educators.
All of this confirmed that there was significant opportunity to adapt Australia’s retail training package for the Indian market’s purpose to meet its skills development needs. There were variances in what the Australian and Indian retail sector needed. FIR needed to provide a greater introduction to what the retail sector was, add in an “English for the workplace” component, and build in a greater component on employability skills in order to equip learners for the transition from rural and regional backgrounds to work in Tier-1 (population of 100,000 and above) and Tier-2 cities (population of 50,000 to 99,999).
During the repeat visits to India, FIR visited skilling sites to see whether competency delivery existed. This included visits to large government-backed institutes, smaller NGO-sponsored groups and charity-based groups. Much of the workforce for the retail sector was being sourced in regional areas, therefore FIR needed to understand the challenges of delivery to these cohorts. The quality of delivery varied greatly and the use of the word “skilling” was accurate in some courses and not in others, for example, where there was no evidence of exposure to the industry through real or simulated workplaces.
This orientation helped form FIR’s delivery offerings and produced a range of potential partners. In 2011 FIR needed to make decisions surrounding who to partner with, so returned to India to find an organisation with vision and shared similar values.
Around this time there was an increasing focus and commitment by the Indian Central Government to the skill development sector, and the National Skills Development Council (NSDC) was developing Sector Skills Councils (SSC), including one for retail. These SSC had the role of negotiating the National Occupational Standards and developing standards for training partners linked to an affiliation process.
There were strong similarities with the Australian system. Service Skills Australia – at that time under Jeanette Allen’s leadership – was very proactive in working with the relevant bodies in India to participate in the development of their model.
S E C T I O N 2 . 3

I M P R O V I N G S E R V I C E S E C T O R P R O D U C T I V I T Y : T H E E C O N O M I C I M P E R A T I V E
80
Barriers FIR faced in the Indian market
Establishing FIR’s Indian company brought many challenges. The organisation had to decide how to invest, the board structure, and develop a shareholder agreement. Fortunately, FIR had identified an Indian firm in Delhi with a Brisbane counterpart. It was important for FIR to have transparency and to develop understanding for its Australian Board.
These obstacles contributed to the time it took to commit to investing in India. However, one of the key stumbling blocks was identifying who would pay in this market. The increased focus on skills by the Indian Government and the training initia-tives being rolled out did go some way to paving the entry point. FIR formed two companies in India, First Impressions Resources (100 per cent owned) and its joint venture Australian Retail College (ARC).
While much has been written about the hundreds of millions that need to be skilled in India and this contributes to great enthusiasm around the sector, student acquisition, price point and scalability remain the greatest challenges. Scalability is a necessity for viability, and if you are considering partnering with a government body – and you can’t scale up your delivery model – no one wants to know you.
S E C T I O N 2 . 3
TABLE 1 SECTOR SKILLS COUNCILS (SCC)
*Approved in 2014–15
Source: Website – Indian Ministry of Skill Development and Entrepreneurship
Priority sector Auto Media and entertainment Logistics Life sciences Hydrocarbons*
Retail Health care Construction Hospitality Management*
IT/ITeS Gems and jewellery Food processing Textiles and handlooms Chemical and petrochemicals*
Leather Apparels Strategic manufacturing*
Electronics Handicrafts Allied manufacturing
BFSI Power Furniture and furnishing
Iron and steel Education
Large workforce Rubber Telecom Aerospace and aviation Sports*
Capital goods Mining Paintings and coatings*
Agriculture Instrumentation
Culture
Informal sectors Security Plumbing Beauty and wellness Culture
Domestic workers*
2010–11 2011–12 2012–13 2013–14 2014–15 and beyond
New sectors such as green jobs, PwD targeted for FY 2015–16

I M P R O V I N G S E R V I C E S E C T O R P R O D U C T I V I T Y : T H E E C O N O M I C I M P E R A T I V E
81
Taking a risk-averse approach
FIR’s focus has been to build a model that can be scaled up but to take the time to get the model and product right, and to provide real employment outcomes. It has taken a lot more time than anticipated for the company; in FIR’s original planning the projections were based on viability in two years and profitability in three. Being risk-averse is not an approach that is common in India, but it is one that is proving to serve FIR well. There are many examples of groups that have done deals, promised huge numbers, sold off skilling franchises and then all has turned to tears. FIR’s approach has been initially costlier, but has given the company control and minimises fallout when problems are encountered. However, for FIR, it has meant that profitability is still one to two years away.
Understanding India and being an employer there takes time. FIR management made the decision to place themselves in India for lengthy periods and often. They spent the first three months of 2013 in Andhra Pradesh (AP) finding premises, arranging fit-outs and recruiting staff, which gave them firsthand experience to the skilling challenges of India, particularly in blue collar trades.
Being an international company is expensive. Companies should be mindful of this in planning how to operate abroad. Staff expect bigger salaries, contractors over-quote and landlords turn opportunistic at the thought of a foreign tenant. These are all reasons to consider an Indian partner, which is how FIR entered the market.
New industry standards
By 2014, progress had been made in the Indian ecosystem for skilling, making it somewhat clearer for new entrants into the market. Unfortunately, in some cases, FIR entered the market before many of the advances. The introduction of retail standards and the affiliation requirements both emerged when the organisation was well under-way with establishing its presence in India. This meant that much of what FIR was working toward required realignment and rewriting to present its programs to fit with the National Occupational Standards.
The changes were not always vast, but some entailed exact requirements in terms of equipment and simulated environments. Stipulations that would have saved time and money if they had been identified months prior. In this instance, being ahead of the game added to FIR’s costs.
FIR initially went with a live broadcast system, delivering via a hub-and-spoke model. This provided the opportunity to maximise the skills of a Master Retail Trainer with support from an on-ground site trainer at each location. The system FIR chose had been used in traditional teaching classrooms, and so the organisation worked with its suppliers to adapt it to the skilling sector. This provided its own challenges, in part due to India’s intermittent internet access and power outages. The range of languages spoken within a short distance also detracted from the smooth flow of each session.
Political challenges
During FIR’s first two years, the state of AP experienced increased political disrup-tion, a situation that had been occurring at a minor level for many years. This unrest ramped up and ultimately resulted in bifurcation and the establishment of Telangana as another state of India. FIR averaged two days a week where one or two of its sites had to close during the unrest. Because of FIR’s hub-and-spoke model with a live broadcast by an industry expert, this proved to be logistically challenging, costly and ultimately unworkable.
S E C T I O N 2 . 3

I M P R O V I N G S E R V I C E S E C T O R P R O D U C T I V I T Y : T H E E C O N O M I C I M P E R A T I V E
82
S E C T I O N 2 . 3
Sector No. of qualification packs
Aerospace and aviation 7
Agriculture 141
Apparel, made-ups and home furnishing 45
Automotive 199
Beauty and wellness 60
Banking, financial services and insurance 12
Capital goods 56
Construction 93
Domestic worker 4
Electronics and hardware 147
Food processing 44
Furniture and fittings 5
Gems and jewellery 90
Green jobs 10
Handicrafts and carpets 118
Health care 28
Infrastructure equipment 29
TABLE 2 SECTORS AND NUMBER OF QUALIFICATION PACKS AVAILABLE IN INDIAN VET SYSTEM
Workplace culture, while not a barrier, is different in India. During the recruitment phase for FIR trainers and centre managers, FIR was frequently told stories about employers who don’t pay their staff in the skills sector. To FIR, this lack of respect and trust that exists in the employer-employee relationship was very evident.
From the outset, the organisation was determined to provide an international work-place. FIR has a flat management structure in its Australian business, and one that promotes on performance. FIR has a staff share scheme and provides an environment that is high on trust. While it couldn’t start with such a culture in place in India, it is the direction FIR chose to head.
However, this did not prove an easy fit between the direction and the reality of the more traditional hierarchical style of leadership, and FIR was unable to develop the leadership team it required to deliver on this plan until it could place an Australian team on the ground. The staff have now embraced what they see as a much fairer and more empowering workplace.
The Indian vocational skilling market is still evolving. Infrastructure in the form of policy, guidelines and programs are being rolled out at an amazing pace. What has been achieved in developing qualification packs for a wide range of sectors is impressive.

I M P R O V I N G S E R V I C E S E C T O R P R O D U C T I V I T Y : T H E E C O N O M I C I M P E R A T I V E
83
S E C T I O N 2 . 3
Sector No. of qualification packs
Instrumentation, automation, surveillance and communication 5
Iron and steel 49
IT-ITES 84
Leather 50
Life sciences 61
Logistics 44
Management, entrepreneurship and professional 4
Media and entertainment 51
Mining 46
Paints and coatings 14
Plumbing 25
Power 29
Retail 13
Rubber 148
Security 8
Sports 4
Strategic manufacturing 2
Telecom 40
Textile and handlooms 68
Tourism and hospitality 63
People with disability 6
As at 10 February 2017 India had 1896 Qualification Packs (QPs) developed across 39 sectors
Source: NSDC QP-NOS, Curriculum & Content List as on 10 February 2017
Given the scale of this progress there are many teething problems. The introduction of government-funded training had the immediate impact of wiping out FIR’s fledgling fee paying market. At the same time, FIR was approached by the state government to upskill its trainers; FIR’s industry focus and competency based approach was being noticed.
Payment in a timely manner remains an ongoing challenge for the organisation, requir-ing continual investment to compensate for poor cash flow. Because of this issue, FIR has taken on the majority share of the business. These cash flow issues continue and have driven FIR to look at other models for achieving scale, including closing several of its original sites and starting to deliver through existing facilities and partnering models. These changes have reduced the need for investment in infrastructure.

I M P R O V I N G S E R V I C E S E C T O R P R O D U C T I V I T Y : T H E E C O N O M I C I M P E R A T I V E
84
S E C T I O N 2 . 3
One of the challenges has been FIR’s specialisation. The organisation has delivered many programs across five states in the retail and trainer development space success-fully, only to be asked by the funding bodies to broaden its offering to other sectors. Being agile and quick to respond is proving critical.
Drivers behind FIR’s entry into the Indian market
As previously indicated, the Australian retail sector – like its international counterparts – has undergone significant change over the last decade and FIR was keen to see if an industry specialist provider was a viable export.
Establishing a 100 per cent owned foreign entity along with a joint venture provided the necessary controls and some comfort for investment. The high regard for the VET sector and its industry-led approach contributed to FIR’s decision to develop an off-shore delivery model.
Over the last four years, the organisation has benefitted from the support of Austrade and the Queensland Trade Commission Office. Opportunities for Australian institutes exist in many areas of the skills ecosystem, but due to many of the challenges it can be a long road to commercial success.
In line with Austrade’s Australian International Education (AIE) 2025 vision, one oppor-tunity FIR took to overcome some of the hurdles of India was to work together with multiple institutes. This reduced overheads, made offerings more appealing to gov-ernment and business, and allowed businesses to set up in multiple areas thereby reducing the dependence on any one vertical.
The Queensland Skills and Education Consortium was established in January 2016 by ARC to respond to an opportunity in Kerala to deliver a wide range of high quality courses under a government program called the ASAP program.
The Queensland Skills and Education Consortium is a group of high performing Registered Training Organisations (RTOs) based in Queensland. The primary focus of the consortium is to deliver industry relevant skills programs that lead to employment. To date, Trade and Investment Queensland (TIQ) has provided a coordinating and introductory role to support the establishment of the consortium, marketing support and on ground government to government representation. It’s a demand-driven model; membership is sought based on expertise to deliver on known projects and members must meet set criteria to be a part of the consortium.
The establishment of the consortium has been timely in a climate of growing interest in increasing Australia’s delivery of offshore education and training. Since launching, interest in the consortium has been high, both in India and in Australia. Speaking opportunities to outline the structure and success of the consortium, while somewhat premature, have highlighted the interest in this area.
The other consortium FIR is working on involves the mobility of workers to Gulf coun-tries from India, providing Australian standard skilled manpower to specific corporates. This is in a nascent stage; however, the expectation is it will also provide a platform for growing FIR’s student market in India, maintaining a high-quality approach.

I M P R O V I N G S E R V I C E S E C T O R P R O D U C T I V I T Y : T H E E C O N O M I C I M P E R A T I V E
85
S E C T I O N 2 . 3
Broader implications for emerging offshore education markets
While it is early days, to FIR, the consortium approach appears to enable the organisa-tion to: implement a wider range of programs that are more in line with Indian pricing; share corporate services and collective costs through an Indian based business; and conversely provide a softer, supported market entry for other Australian businesses.
Our government and policymakers are aware that India is in the sights of many coun-tries as a growth market, and that the relationship at the Australian and Indian Central Government level is critical to supporting Australian businesses in these ventures. India’s vision for meeting the future demand of the global labour market aligns with the need for international standards of skilling. Australia’s participation in offshore skilling to date has been minimal.
The dialogue between Australia and India, while it is becoming more robust, appears to be lacking an outcomes-focus and a shared vision.
There is evidence that at this level Australia has not achieved the same level of engage-ment as the UK, Germany and Singapore, despite having our VET system held in such high regard. There is much to be done on mutual recognition, quality and compliance systems and in providing and testing working models. India and the UK have devel-oped a suite of 82 Transnational Standards.
Assisting Australian businesses as they move offshore to achieve a skilled workforce is one area where much more work can be done and providing pathways to higher education through increased offshore delivery is another. To achieve this, we require those promoting education offshore to develop a current understanding of the value and role of VET in building organisational capability.
Back home, there is a need for Australian training packages to take a global view of skills if we wish to leverage our reputation for a world-class VET system. Full qualifications delivered offshore may not be the solution; however, Australian Units of Competency would be a great place to start.
TABLE 3 AUSTRALIAN OFFSHORE DELIVERY VET 2016
Per cent
Victoria 77
New South Wales 8
Queensland 6
Western Australia 7
Other 2
* Data is not inclusive of non-award enrolments for 57,000 students. This includes massive open online course (MOOCS) executive education and joint program delivery.
Source: Commonwealth Department of Education and Training 2016 – Overseas Students

I M P R O V I N G S E R V I C E S E C T O R P R O D U C T I V I T Y : T H E E C O N O M I C I M P E R A T I V E
86
S E C T I O N 2 . 3
The recent acknowledgment by Australia of the growing importance of offshore delivery is certainly encouraging and there is great potential for growth. However, this requires successful engagement at government, industry and institute level.
To only look at what Australia can grow through India is short sighted; India is proving to be adept at leaping over many of Australia’s past systems to new solutions.

87
3.1 Productivity and growth in financial services Amy Auster with co-authors: Anthony Cussen and Chris Judde
Productivity of financial services
SECT ION
3.0

I M P R O V I N G S E R V I C E S E C T O R P R O D U C T I V I T Y : T H E E C O N O M I C I M P E R A T I V E
88
Amy Auster is a thought leader and strategic
advisor to business executives and policy
makers, with deep expertise in the Asia
Pacific region and the financial services
industry.
Ms Auster has worked as an economist and
commentator across Australia, Asia, the US and South America.
She is currently Deputy Secretary, Economic at the Department of
Treasury and Finance in Victoria. She has previously lead the
Australian Centre for Financial Studies as Executive Director; the
Foundation for Development Cooperation as Principal Consultant,
and worked as an economist, strategist and senior executive for
ANZ Banking Group during the bank’s expansion into Asia. She is
an Adjunct Senior Research Fellow at Monash University in the
Monash Business School.
3.1Productivity and growth
in financial services
Amy Austerwith co-authors:
Anthony Cussen and Chris Judde, Senior Economists, Victorian Department of Treasury and Finance

I M P R O V I N G S E R V I C E S E C T O R P R O D U C T I V I T Y : T H E E C O N O M I C I M P E R A T I V E
89
S E C T I O N 3 . 1
Introduction
The financial services and insurance sector stands out as one of the most important industrial sectors in the Australian economy. Financial services is the largest single sector in the Australian economy on a gross value added basis, and it is also esti-mated to be one of the most highly productive.
Beyond this, the financial services and insurance sector performs critical economic functions through the:
Intermediation of savings between households and firms;
Accumulation of wealth; and
Mitigation and pricing of risk.
A financial sector that can exhibit stable and positive productivity growth over time is as much in the interest of the broader economy as is to the participants in the sector itself.
In Australia, productivity growth in the financial services sector has been in positive territory for the vast majority of the past two decades and more, aside from a brief blip in the wake of the global financial crisis. The sector remains a major employer with consistently high labour productivity growth in what is largely a skilled workforce. The size and strength of the sector has contributed at least in part to Australia being one of only four Organisation for Economic Co-operation and Development (OECD) econo-mies that saw consistently positive productivity growth in the five years to 2015.1
Among other attributes, financial services is one of the few major service sectors in Australia for which both labour productivity and multifactor productivity are measured. This chapter presents an analysis of productivity trends in the financial services sector and identifies insights that may be unique to financial services, and others that may be applied to other service sectors more broadly.
First, the chapter provides a brief overview of the financial and insurance services sector in Australia. This overview highlights the size and diversity of the sector, and the significance of its role for the broader economy. It then delves into the measure-ment of productivity in the sector, and finds that financial services share some of the same challenges on productivity measurement that are commonly found in services more broadly. Building on the work undertaken by the Productivity Commission and others, this chapter hypothesises that one factor supporting the high rate of productiv-ity growth in financial services may be related to the reputational strength of Australia’s financial services sector, with value created through goodwill.
Finally, the chapter identifies the likely role of capital deepening as contributing to an increasingly productive labour force in financial services. It then discusses factors that may have supported technological innovation and diffusion, and other factors that may have inhibited it. The chapter concludes with suggested directions for policy initiatives that may further support productivity growth in the sector in the future.

I M P R O V I N G S E R V I C E S E C T O R P R O D U C T I V I T Y : T H E E C O N O M I C I M P E R A T I V E
90
S E C T I O N 3 . 1
Financial services in the Australian economy
The financial services sector in Australia is a collection of three subsectors: banking and finance; superannuation and funds management; and insurance. Collectively, these three industries support critical economic functions. They intermediate savings between households and firms; support wealth accumulation and inter-generational wealth transfer; and allow for the mitigation and pricing of risk. Financial services firms have overseen growth in total household and business financial assets from $690 billion in 1990 to $5.4 trillion today. Together, the financial services industry is the largest industrial sector in the Australian economy, accounting for 9.5 per cent of the economy on a gross value added basis.
The financial services sector is also a major employer, employing nearly 430,000 people at present, or 3.6 per cent of total employment. Despite growth in the overall sector, the share of national employment attributable to financial services has declined from a peak of nearly five per cent reached in 1980. The share of employment is above the national average in New South Wales and Victoria, where the majority of large financial service firms are located.
FIGURE 1 COMPOSITION OF THE AUSTRALIAN ECONOMY BY INDUSTRY SHARE OF GROSS VALUE ADDED, 2015–2016 (PER CENT)
Source: ABS Cat. No. 5220.0, 2015-16, Table 10.
Note: “Other services” here includes the categories ownership of dwellings, arts and recreation services and other services.
Other services 12.6%Health care and social assistance
7.3%
Education and training 5.2%
Public administration and safety
5.8%
Administrative and support services 3.1%
Profes
siona
l, scie
ntific
and
techn
ical s
ervice
s 6.6%
Rental, hiring and real estate services 3.2%
Fina
ncia
l and
insu
ranc
e se
rvic
es
9.5%
Information media and telecommunications 2.8%
Transport, postal
and warehousing 5.3%
Accommodation and food services 2.5%
Retail trade 4.7%
Wholesale trade 4.3%
Construction 8.7%
Electricity, gas, water and waste services 2.6%
Manufa
cturin
g 6.6%M
inin
g 6.
4%
Agriculture, forestry and fishing 2.6%

I M P R O V I N G S E R V I C E S E C T O R P R O D U C T I V I T Y : T H E E C O N O M I C I M P E R A T I V E
91
S E C T I O N 3 . 1
Perhaps contrary to perceptions driven by attention to the “Big Four” Australian banks, the financial services industry is quite diverse. When considered by number, by far the largest outright number of firms are “other auxiliary finance and investment firms” – in other words, firms that provide auxiliary services to the main firms that offer banking, superannuation or insurance products. The core banking, superannuation and insur-ance firms comprise less than 15 per cent of financial services firms in number.
FIGURE 2 HISTORY OF FINANCIAL SERVICES EMPLOYMENT IN AUSTRALIA
Source: ABS Cat. No. 6291.0.55.003, November 2016, Table 5
FIGURE 3 COMPOSITION OF EMPLOYING AUSTRALIAN FINANCIAL SERVICES BUSINESSES BY SUB-SECTOR, JUNE 2016
Source: ABS Cat. No. 8165.0, June 2016, Tables 2 and 3 (ABS Counts of Australian Businesses, adjusted for non-employing firms)
Auxiliary insurance services
8.59%
Other auxiliary finance and investment services 45.65%
Financial asset broking services
6.46%
Superannuation funds11.12%
General insurance 1.44%Health insurance 0.14%Life insurance 0.33%
Financial asset investing23.35%
Non-depository financing 1.60%
Other depository financial intermediation 0.51%
Credit union operation 0.22%
Banking 0.51%
0
50
100
150
200
250
300
350
400
450
500
'000s
Financial services employment (LHS) Percentage of total Australian employment (RHS)
%
0
1
2
3
4
5
6
1984 1988 1992 1996 2000 2004 2008 2012 2016

I M P R O V I N G S E R V I C E S E C T O R P R O D U C T I V I T Y : T H E E C O N O M I C I M P E R A T I V E
92
S E C T I O N 3 . 1
The data offers a further surprise in that the sector is dominated by small and medium sized firms – in terms of overall firm numbers. Based on the ABS Counts of Australian Businesses, 96.5 per cent of employing businesses in the financial services industry as at June 2016 had between one and 19 employees. Just three per cent of employ-ing businesses had between 20 and 199 employees, while 0.5 per cent of employing businesses had more than 200 employees.
This feature is similar to most other sectors in the Australian economy. According to the Reserve Bank of Autralia, small and medium sized firms account for around 60 per cent of total economic output and 70 per cent of total employment.
We have seen how Australia’s financial services sector is large, diverse and dominated by small and medium sized firms. It has also participated in and supported signifi-cant growth in the stock of financial assets of the economy, which have risen from 170 per cent of GDP in 1990 to about 325 per cent of GDP today.
Finally, ABS data suggest that the financial services sector has enjoyed very strong productivity growth relative to other market sectors. Figure 5, which is based on ABS multifactor productivity estimates, illustrates the outperformance of multifactor productivity (MFP) in the financial services sector when compared with the broader market sector (which includes all industries except for health, education and public administration and safety). The divergence has been particularly pronounced since the mid-2000s, with MFP for the overall market sector remaining broadly flat while MFP in financial services has increased by about 35 per cent over the period.
FIGURE 5 MULTIFACTOR PRODUCTIVITY, FINANCIAL SERVICES AND MARKET SECTOR, AUSTRALIA
Sources: ABS Cat. No. 5655.0, ABS Cat. No. 5260.0.55.002
FIGURE 4 COMPOSITION OF EMPLOYING AUSTRALIAN FINANCIAL SERVICES BUSINESSES BY EMPLOYMENT SIZE RANGES, JUNE 2016
Source: ABS Cat. No. 8165.0, June 2016, Tables 2 and 3
%
0
20
40
60
80
100
200+ Employees20–199 Employees1–19 Employees
Financial services multifactor productivity
index = 100 in 1994–95
0
20
40
60
80
100
120
140
160
180
2015–16
2014–15
2013–14
2012–13
2011–12
2010–11
2009–10
2008–09
2007–08
2006–07
2005–06
2004–05
2003–04
2002–03
2001–02
2000–01
1999–00
1998–99
1997–98
1996–97
1995–96
1994–95
Market sector multifactor productivity

I M P R O V I N G S E R V I C E S E C T O R P R O D U C T I V I T Y : T H E E C O N O M I C I M P E R A T I V E
93
S E C T I O N 3 . 1
The challenges of measurement
Productivity is a core concept in economics, broadly defined as a measure of output volume per one unit of input volume. Achieving strong productivity growth is a central goal of economic policy, as poor productivity growth over time leads to stagnation in real national income and a decline in living standards. The two commonly used measures of productivity are labour productivity (the amount of goods and services produced by an hour of labour) or the more comprehensive MFP (the growth in value-added that is not explained by growth in labour and capital inputs). Shifts in MFP, and particularly the relative use of labour versus capital inputs, can provide insights into the decision-making efficiency and management quality of firms.
Measuring productivity in a modern, service-based economy presents challenges, however, for both outputs and inputs. The quantification of goods outputs by volume (particularly when they can be assumed to be of uniform type and quality) is a rela-tively simple exercise; quantifying output as it relates to the volume of services is less straightforward. On the inputs side, MFP relies upon an estimation of capital input, such as plant and equipment. In services, calculating the value of capital accumulation and inputs can be difficult.
These challenges are even more pronounced in the digital age, where services may be transacted by two parties on a platform provided by a third party that is powered by software provided by a fourth party on a device produced by a fifth party and where none of the individual parties are physically located in the same jurisdiction. There is an emerging body of literature examining measurement issues in the digital economy, but work in this field is nascent.3
The financial services sector is prone to similar challenges in measuring productivity. In a paper published last year, the Productivity Commission undertook an extensive review of the measurement of productivity in the financial services sector in Australia. An important element of the review was analysis that demonstrated that measure-ment of output in financial services is distorted by the accounting of sales revenue, in that much of the “output” for financial services is interest income that is derived from margins on the assets held on the balance sheet. Because of this feature, output becomes “imputed” as an estimated value rather than an actual value. The the Productivity Commission found that imputed output accounts for 65 per cent of the measured production of financial services, with significant variation in that figure across the three major sub-segments of banking, superannuation/funds management and insurance.
The conclusion of the Productivity Commission’s report was that both the level and the rate of growth of productivity in the financial services sector may be overstated over time, to the extent that the imputed output is correlated with margins that respond autonomously to external events such as financial crises or natural disasters, and are not a productivity gain resulting from improved utilisation of capital or labour.
Figure 6 plots multifactor productivity growth in financial services against growth in financial assets as a share of the Australian economy. The fact that this measure of productivity has kept pace with the financial stock over time supports the Productivity Commission’s finding that some of the sector’s strong productivity gains over time may be the result of balance sheet growth rather than productivity growth, per se.

I M P R O V I N G S E R V I C E S E C T O R P R O D U C T I V I T Y : T H E E C O N O M I C I M P E R A T I V E
94
S E C T I O N 3 . 1
Ebbs and flows in productivity over time
The Productivity Commission review of sector productivity also highlights the variability in productivity growth in financial services over time. Figure 7 illustrates this point by presenting the annual growth rates in the labour productivity growth and MFP growth indices for financial services on a rolling three year average basis. The rate of growth since the late 1990s has ranged from more than 10 per cent per annum to slight contractions, and suggests a cyclical pattern of expansion and contraction.
The Productivity Commission’s reflection that this variability may arise from changes in interest income from financial assets held on balance sheet is logical. At the same time, it may also be argued that the variation in interest income reflects the value add of the sector in managing financial assets. Margins expand in times of greater economic or financial stress, as customers perceive greater value from placing their assets in a perceived safe set of hands. In times of less stress, more risk-seeking behaviour eventuates and margins reduce. The profitability and measures of value add may be determined by these margins, but the margins themselves may also be understood to be a proxy measure of productivity of a financial firm – a residual related to reputation and goodwill. In that sense, the productivity growth of Australia’s financial services sector may be from factors including institutional arrangements, effective regulation and good management – all of which have contributed to the strong credit ratings of the major banks, the high global ranking of the superannuation system and the prudential strength of the insurance sector.
FIGURE 6 HISTORY OF TOTAL FINANCIAL ASSETS AND MULTIFACTOR PRODUCTIVITY FOR THE FINANCIAL SERVICES INDUSTRY
Sources: ABS Cat. No. 5655.0, ABS Cat. No. 5260.0.55.002
Financial services multifactor productivity (RHS)
Index = 100 in 2014–15% of nominal GDP
Financial total household and business financial assets (LHS)
0
50
100
150
200
250
300
350
2015–16
2014–15
2013–14
2012–13
2011–12
2010–11
2009–10
2008–09
2007–08
2006–07
2005–06
2004–05
2003–04
2002–03
2001–02
2000–01
1999–00
1998–99
1997–98
1996–97
1995–96
1994–95
1993–94
1992–93
1991–92
1990–91
1989–900
20
40
60
80
100
120

I M P R O V I N G S E R V I C E S E C T O R P R O D U C T I V I T Y : T H E E C O N O M I C I M P E R A T I V E
95
S E C T I O N 3 . 1
Figure 7 somewhat bears out this hypothesis. As we can see, identified periods of financial stress have been largely followed by periods of rising productivity in the sector. At the same time, financial shocks do not appear to have had a uniform impact upon firm behaviour, at least as indicated by the direction or pace of productivity growth in sector.
Major periods of policy reform such as the introduction of mandatory superannuation, the Wallis Inquiry and the FSI led by David Murray AO (Murray Inquiry) also do not appear to have had a uniform impact on productivity growth trends. It is interesting to note, however, that major inquiries have commenced in periods when productivity growth in the sector was low. This is perhaps not coincidental, given the importance of the financial system to the smooth functioning of the economy and its status as a major employer. It does appear that productivity gains were made in the period fol-lowing these two major initiatives of reform, but the pace and timing of that growth is variable.
The chart also includes a couple of critical technological innovations that also coincide with turning points in the rate of productivity growth.
A final observation on this chart is the variation in the relative pace of and turning points in multifactor productivity growth versus labour productivity growth. The rates of growth are highly coincident, with labour productivity growth rates exceeding those of MFP. While labour productivity growth has been higher, multifactor productivity growth appears to lead shifts in rates of change for labour productivity growth. This suggests some level of firm determination over the level of productivity, through adjustments to capital that generate more output from labour in response to changes in their operat-ing environment. In the period since the Global Financial Crisis, the gap between the rate of growth in labour productivity and MFP has closed.
FIGURE 7 AUSTRALIAN FINANCIAL SERVICES PRODUCTIVITY GROWTH (ROLLING THREE-YEAR AVERAGE)
Source: ABS Cat No. 5220.0, 5260.0.55.002 (2015-16), 6220.0, Treasury and Finance calculations.
GFC
Recession and Superannuation Industry Act
HIH collapse and “tech wreck”
Multifactor productivity
Labour productivity
Per cent (rolling three year average)
–2
0
2
4
6
8
10
12
2015–16
2014–15
2013–14
2012–13
2011–12
2010–11
2009–10
2008–09
2007–08
2006–07
2005–06
2004–05
2003–04
2002–03
2001–02
2000–01
1999–00
1998–99
1997–98
1996–97
1995–96
1994–95
1993–94
1992–93
Asia financial crisis, Wallis Inquiry and
BPay launched
Financial System Inquiry (Murray)
Banking apps launched

I M P R O V I N G S E R V I C E S E C T O R P R O D U C T I V I T Y : T H E E C O N O M I C I M P E R A T I V E
96
S E C T I O N 3 . 1
Figure 8 presents labour productivity and multifactor productivity over the past 25 years, taking 1990–1991 as a base year. Here we can see the effect of the accumula-tion in labour productivity growth over time. The degree of imputation in estimating multifactor productivity has a lesser implication for labour productivity. Is there anything we can surmise about labour productivity in the financial services sector by scratching further into the relationship between labour and capital outputs in this sector?
Labour versus capital
To delve into the detail of labour productivity, we examine the capital stock to labour ratio and the capital services to labour ratio in the financial services sector. Capital stock in financial firms can be thought of as the assets that enable the activity of financial services firms – buildings, technology and fitouts. Capital services reflects the utilisation of the capital stock. As Figure 9 highlights, in Australia we have seen the capital stock to labour ratio in the financial services sector remain essentially flat since the early 1990s, with even a small decline noted since 2005. That is, the ratio of labour output for capital stock has not changed significantly over the past several decades. Meanwhile, the ratio of capital services to labour has nearly doubled over that period. So while the value of capital stock (or capital formation) may have grown apace with labour, the ability of the sector to increase its output per unit of labour input has doubled. A significant capital deepening seems to have occurred.
Again the financial services sector is a special case in relation to capital deepening. Across all industrial segments, capital formation may include items such as new plant and equipment, new manufacturing investment or smarter and faster machines. How can buildings, fitout and IT lead to a vastly more productive labour force in financial services?
FIGURE 8 LABOUR AND MULTIFACTOR PRODUCTIVITY IN FINANCE AND INSURANCE
Source: ABS Cat No. 5220.0, 5260.0.55.002 (2015-16), 6220.0
Index = 100 in 1990–91
Multifactor productivity
0
50
100
150
200
250
300
2015–16
2014–15
2013–14
2012–13
2011–12
2010–11
2005–06
2000–01
1995–96
1990–91
Labour productivity

I M P R O V I N G S E R V I C E S E C T O R P R O D U C T I V I T Y : T H E E C O N O M I C I M P E R A T I V E
97
S E C T I O N 3 . 1
Innovation and diffusion
Financial products and services are intangible; the “goods” produced these days are largely electronic and the only real assets to speak of are the buildings that house companies and the information technology systems that are used to allow the busi-nesses to run. The hypothesis therefore arises that – though we cannot see it and are unable to measure it – the growth in productivity in financial services may also be attributed to innovation and technological change, and the diffusion of innovation across the sector.
It is important to note that technologically-driven improvements in productivity arise from both the pace of innovation and its rate of take-up among firms. A significant amount of effort and attention has gone into the innovation of new technological advancements in the financial sector in Australia. The so-called fintech sector – a mar-riage of finance and technology – is growing quickly and will play a significant role in the future productivity growth of the sector. It was interesting to note that the last ABS Census of firms recorded a marked increase in the number of small firms in financial services between 2012 and 2016.
However, firms do not need to be innovating new technology themselves in order to increase their productive capacity; they merely need to be early adopters and enthusi-astic promoters of new technology. In fact, the literature suggests that larger firms that have more scope to invest in new or emerging technology – or the economies of scale to deploy them in a significant way – are often at the forefront of productivity growth and are the first to benefit from the gains in labour productivity that result.
While Figure 9 indicates that significant capital deepening appears to have occurred in the financial services sector over the past 25 years, the gains to labour output from capital have moderated since the GFC. Indeed, the capital stock to labour ratio has declined slightly since its peak in 2005. The small gap between rates of labour pro-ductivity growth and MFP growth since the GFC as shown in Figure 9 hints that gains from investment in capital may be attenuating in the current environment. And yet, the advance of the digital economy and internet of things suggests the technological frontier is as important as ever in productivity for firms.
FIGURE 9 CAPITAL TO LABOUR (HOURS WORKED) RATIO, FINANCIAL SERVICES, AUSTRALIA
Sources: ABS Cat. No. 5204.0, ABS Cat. No. 5260.0.55.002, ABS Cat. No. 6202.0 Table 19
Index = 100 in 1990–91
Capital stock to labour ratio
2015–16
2014–15
2013–14
2012–13
2011–12
2010–11
2005–06
2000–01
1995–96
1990–91
Capital services to labour ratio
0.0
0.5
1.0
1.5
2.0
2.5

I M P R O V I N G S E R V I C E S E C T O R P R O D U C T I V I T Y : T H E E C O N O M I C I M P E R A T I V E
98
S E C T I O N 3 . 1
Enablers of and barriers to technological diffusion
One of the notable enablers of technological diffusion and innovation in financial services is the effect of clustering. The financial services sector is particularly prone to benefit from clustering given its search for – as Professor Michael E. Porter has described – cheaper sourcing of inputs, access to information, coordination with related companies, access to a deep pool of talent and access to a deep and special-ised supplier base.5
The Productivity Commission review of financial sector productivity further underlined this point with the observation that the financial services sector features high use of its own outputs as inputs into the sector – in other words, that the sector has a strong practice of outsourcing services from other financial firms given the level of specialisa-tion across the three subsectors. The ability to develop close relationships with nearby firms for specialised services allows increased efficiency across a cluster of firms in a sector.
Clustering is almost an embedded feature of the Australian business landscape, given Australia’s very high level of urbanisation relative to most other jurisdictions globally. The effect of clustering appears, for example, in the Bloomberg Innovation Index which puts Australia 20th out of 50 countries on innovation. Australia’s ranking was boosted by high marks for research and development intensity (14), high tech density (16), researcher concentration (15) and overall productivity (2) – all cluster-oriented factors – while faring less well in manufacturing value-add (47) and patent activity (32).6
The financial services sector is one area that may be benefitting from the population density in urban centres. As an example of this feature, Figure 10 illustrates the share of employment in financial services that is located in New South Wales and Victoria – at around 70 per cent, well beyond these two states’ share of the population.
A second enabler of technological diffusion is an educated, tech savvy population. This is important not just for the supply of staff to financial services firms, but for cus-tomers who will be open to early adoption of new technology and the processes and systems that surround it. As an example, Ernst & Young’s FinTech Adoption Index (survey undertaken in late 2015) surveyed “digitally active” people in Australia, Canada,
FIGURE 10 PROPORTION OF NATIONAL FINANCIAL SERVICES EMPLOYMENT IN VICTORIA AND NSW
Source: ABS Cat. No. 6291.0.55.003, November 2016, Table 5
%
1984 1988 1992 1996 2000 2004 2008 2012 2016
60
62
64
66
68
70
72
74

I M P R O V I N G S E R V I C E S E C T O R P R O D U C T I V I T Y : T H E E C O N O M I C I M P E R A T I V E
99
S E C T I O N 3 . 1
Hong Kong, Singapore, the UK and the US. Of all those surveyed, 15.5 per cent had used at least one fintech product in the past six months. Across the entire survey, just over half of the adults under the age of 54 with income of $196,643 (US$150,000) or more had used a fintech product, with the most popular products being those that enable payment of goods or services; transfer money between accounts; or send funds overseas. Australia’s take up of fintech was slightly below the average, at 13 per cent. Canada was the only country to score behind Australia in this regard.7 The less demanding customers are of technologically-driven products and services in the digital space, the slower the rate of productivity growth may be.
A third and critical enabler of technological diffusion is competition. The EY report noted that the obstacle most often cited to using a new fintech product or service was ignorance – those surveyed did not know the product existed. This speaks to the structure of the industry itself. An industry sector needs to have firms that are large enough to build economies of scale with new technology and management practices – and market them to their customers – if new technology is to take hold. It also needs to have competition from smaller and medium sized firms to incentivise larger firms to take the risk of investment in new technology and management practices.
Although Australia’s financial services sector has great diversity in the number and size of firms, there is more concentration in terms of assets held in a handful of large institutions. The question of the degree of competition and concentration in the finan-cial services sector was considered at length in the 2014 FSI led by David Murray AO. Competition featured significantly in the terms of reference of the inquiry, and was identified by the inquiry as one of two general themes of focus in the final report.
The inquiry concluded that while competition in the financial services sector is generally adequate, the sector featured high concentration and increasing vertical integration in parts of the sector over time.8 Of the 44 recommendations in the final report, 12 were directly aimed at ensuring ongoing competitiveness in the sector.
Of these 12 recommendations, roughly half were aimed at supporting competitive neutrality through regulatory changes, and changes to the structure of regulators themselves in relation to expectations and funding. Most of these recommendations were accepted by government, and many – particularly in relation to regulatory man-dates and funding changes – are still in the process of being implemented.
The other half of the recommendations related to competition. The panel acknowl-edged the increasingly important role of data in the financial system as a source of competitive strength. This again reflects the growing role of fintech and technology generally, where data analytics and algorithms are increasingly deployed by firms to offer more finely tuned products and services to customers. These reforms – ideas such as creating a federated-style model of trusted digital identities, increasing access to and use of data, comprehensive credit reporting, technology neutrality and an update of the 2009 Cyber Security Strategy – have proven more challenging and are still under development.
As an example, the Productivity Commission’s Data Availability and Use final report was just recently published in March 2017, more than two years after its initiation was recommended by the FSI. This is but one reminder of the time lags that can accom-pany areas of major productivity-enhancing reform.
The FSI also recommended that government should undertake a review of the state of competition in the financial services sector every three years. The FSI issued its final report in November 2014, making the end of this year three years since the FSI assessed the level of competition in the sector.

I M P R O V I N G S E R V I C E S E C T O R P R O D U C T I V I T Y : T H E E C O N O M I C I M P E R A T I V E
100
S E C T I O N 3 . 1
With the FSI recommendations still in process of review and implementation, a com-petition review in 2017 may not reveal much change in the landscape that the FSI reviewed in 2014. Nonetheless, ongoing review serves as a reminder of the important role of competition – both among firms within the sector and firms seeking to disrupt the sector – in maintaining strong productivity growth in the financial services sector.
The financial services sector has risen to many productivity challenges over the past two decades. In future, the sector’s productivity performance will be heavily influenced by technological developments and the implementation of the endorsed recommendations contained in the FSI and Competition Policy Review. As the FSI report highlighted: “The innovative potential of Australia’s financial system and broader economy can be supported by taking action to ensure policy settings facilitate future innovation that benefits consumers, businesses and government.”
It is expected that the Productivity Commission will commence examining the state of competition in the financial system by the end of 2017. This inquiry will assist commu-nity understanding if the Productivity Commission can highlight the link between tighter prudential controls and the level of competition and innovative in the sector. Striking the balance between these objectives will go a long way to determining Australia’s future productivity performance.
Endnotes
1 OECD Compendium of Productivity Indicators 2016, Growth in GDP per capita, productivity and unit labour costs
2 Zhao, Barnes, Gordon, Munoz, Hunter, “Productivity in Financial and Insurance Services” Productivity Commission Staff Research Note, February 2016
3 See for example Byrne, Fernald, Reinsdorf, “Does the United States Have a Productivity Slowdown or a Measurement Problem?” FEDS working paper 2016-2017 and Kauffman and Kriebel, “Modeling and Measuring the Business Value of Information Technology,” NYU Working Paper No Is-88-24
4 Dr Martin Parkinson, CEDA State of the Nation Keynote Dinner Address, 10 October 2016
5 Professor Michael E Porter, “Clusters and the New Economics of Competition,” Harvard Business Review 1998
6 Bloomberg Innovation Index, January 2016
7 EY FinTech Adoption Index, 2016
8 Financial System Inquiry Final Report, November 2014: http://fsi.gov.au/files/2014/12/FSI_Final_Report_Consolidated20141210.pdf

101
4.1 Tourism productivity: key drivers and impediments Dr Andreas Chai
4.2 Case study: Tasmania driving innovation in the visitor economy Professor Richard Eccleston Dr Anne Hardy Dr Dugald Tinch
Productivity of tourism
SECT ION
4.0

I M P R O V I N G S E R V I C E S E C T O R P R O D U C T I V I T Y : T H E E C O N O M I C I M P E R A T I V E
102
Dr Andreas Chai is a Senior Lecturer in
Economics and member of the Griffith Institute
for Tourism. He is an applied microeconomist who
has previously worked at the Productivity
Commission and the Commonwealth Treasury.
Dr Chai has published in the Journal of Economic
Perspectives and the Cambridge Journal of Economics and has worked
on various consulting projects and grants for clients including the
United Nations Industrial Development Organization, the Asia-Pacific
Economic Cooperation (APEC) Secretariat, the French Ministry of
Education, the National Climate Change Adaptation Facility, IP Australia,
and the Queensland Government. Together with Earthcheck, he recently
completed a report on Developing the Tourism Workforce of the Future
in the APEC Region for the APEC Tourism Working Group.
4.1Tourism productivity:
key drivers and impediments
Dr Andreas Chai
I M P R O V I N G S E R V I C E S E C T O R P R O D U C T I V I T Y : T H E E C O N O M I C I M P E R A T I V E
103
S E C T I O N 4 . 1
Introduction
The tourism industry is a prominent driver of employment and output growth in Australia’s post-mining boom economy. While Australia’s gross domestic product (GDP) growth was steady at 2.4 per cent between 2014–15 and 2015–16, tourism’s gross value added (GVA) grew by more than double this rate, at 6.1 per cent.1 This performance was mainly driven by demand: domestic tourism consumption increased by 4.7 per cent per annum, while international tourism consumption grew by 10.1 per cent. Many are hopeful that this rapid growth will help soak up excess labour being shed by the resources sector.2 This growth also stands in stark contrast to conditions during the mining boom, when the industry was facing a combination of rising wages and a drop in demand due to the appreciation of the Australian dollar, which triggered a simultaneous decline in both international and domestic tourism demand in some regions.3
However, future growth does not come without its challenges. Tourism is a labour intensive, seven-day-a-week industry, which depends on an adequately supplied and skilled workforce to service its global customer base.4 A recent Deloitte report signals that the industry is facing clear growth constraints in light of an estimated shortage of around 38,000 workers and a rising job vacancy rate.5 Others have pointed to growth constraints in the form of insufficient investment in transport infrastructure, such as airport and cruise ship terminals, and the slow rate of liberalisation in international air service arrangements that could dampen growth in international visitor numbers.6 In the long run, the eventual introduction of some form of carbon tax could also put major upward pressure on input costs.7 Several of these issues are widely discussed and have been addressed in the whole-of-government Tourism 2020 strategy.8
Bearing these factors in mind, this chapter takes a fresh look at productivity trends in the tourism sector. These trends reveal that tourism labour productivity growth tends to grow between average to below-average levels. While consistent with international trends, this chapter argues that more can be done to boost labour productivity moving forward by improving the quality of training opportunities and the management of casual workers. This chapter also discusses the workforce ramifications of digitisation and the rise of the sharing economy. While digitisation is widely discussed, many of the adaption strategies are couched in terms of managing the impact on demand by developing new marketing and promotion strategies on the international level. This chapter highlights three important implications for the management and future com-position of the tourism workforce.
Current productivity trends
As a service sector offering relatively intangible outputs, any analysis of productivity trends must come with strong health warnings. In order to measure productivity, it is necessary to control for changes in the quality of the output. In this regard, the quality of services offered in the tourism industry are not easy to quantify. A classic example is extended trading hours. While this makes shopping more convenient for customers, sales per hour worked declines. Another example is luxury retail shops, such as Gucci or Prada. Here plenty of staff can be observed in the shop who are very busy doing not much at all. While the casual economist would label this a waste, the marketing expert would point out that having a large number of retail staff present on the shopfloor may

I M P R O V I N G S E R V I C E S E C T O R P R O D U C T I V I T Y : T H E E C O N O M I C I M P E R A T I V E
104
S E C T I O N 4 . 1
act as a signal of quality to consumers.9 Having several attendants present while a customer buys a $6000 Python Tote handbag is efficient, if that is what it takes to get a customer to buy a $6000 handbag.
Health warnings aside, productivity growth in the tourism sector can be summarised as performing between average to below-average levels, relative to other industries. Concerning labour productivity, Figure 1A reports GVA per hour worked in the tourism sector as reported in the Tourism Satellite Account.10 Since 2000, the overall growth in GVA per hour worked in tourism is about 17 per cent. In other words, the output of tourism services sold per hour of work has increased by 17 per cent. This represents an average annual increase of 1.04 per cent from 2000 levels. This is roughly in line with the growth rate in the market sector, which grew by 1.6 per cent in the same period. Between 2004–05 to 2007–09, labour productivity was somewhat above the average trend. Much of this productivity growth was in the accommodation and road transport services industry, which masked declines in labour productivity in other parts of the tourism sector.11
FIGURE 1A GROWTH IN GVA PER HOUR WORKED FOR TOURISM AND SELECTED SUBSECTORS
Source: ABS Tourism Satellite Account (5249.0: Table 16).
Note: 2014–15 is the reference year for GVA per hour.
FIGURE 1B GROWTH IN GVA PER HOUR WORKED FOR TOURISM AND SELECTED SUBSECTORS
Source: ABS 5204.0 Australian System of National Accounts, Table 15.
Note: The reference year 2014 for GVA per hour.
% change
–6
–4
–2
0
2
4
6
8
Market sector
Tourism
1997–98
1998–99
2000–01
1999–00
2001–02
2002–03
2003–04
2004–05
2005–06
2006–07
2007–08
2008–09
2009–10
20010–11
2011–12
2012–13
2013–14
2014–15
40
50
60
70
80
90
100
110
Transport
Accommodation
Retail
Jun-
1995
Jun-
1996
Jun-
1997
Jun-
1998
Jun-
1999
Jun-
2000
Jun-
2001
Jun-
2002
Jun-
2003
Jun-
2004
Jun-
2005
Jun-
2006
Jun-
2007
Jun-
2008
Jun-
2009
Jun-
2010
Jun-
2011
Jun-
2012
Jun-
2013
Jun-
2014
Jun-
2015

I M P R O V I N G S E R V I C E S E C T O R P R O D U C T I V I T Y : T H E E C O N O M I C I M P E R A T I V E
105
S E C T I O N 4 . 1
Figure 1B presents GVA per hour worked for the three largest subsectors: retail trade, accommodation and food, and transport*. Labour productivity in the accommodation sector has historically performed above average, whereas labour productivity in the retail sector has lagged. This below-average performance by retail is typically attrib-uted to online sales increasing at the expense of traditional bricks and mortar stores.12 The above-average performance in the accommodation sector is likely due to the strong increase in tourism demand. The number of international short-term visitors to Australia grew by around 55 per cent to around 7.8 million visitors between 2000–01 to 2015–16. As shown in Table 1, of all tourism-related sectors, the accommodation sector experienced the greatest increase in demand with spending on accommoda-tion services growing by 78 per cent to around 5.8 billion dollars 2015–16.
The most recent data from the National Accounts reveal no significant deviations from these long-term trends, with both labour productivity and multifactor productivity growing relatively slowly in the accommodation and food sector, as well as the retail sector. There has been a decline in both of these indicators in the transport sector (see Figure 2). Multifactor productivity growth has been consistently declining across the Australian economy, which is thought to be due to either a slowdown in the pace of adopting productivity-enhancing technological innovations or less rapid efficiency improvements for capital and labour employment.13 This figure also shows that while this performance appears to be close to or just below market sector average, there are major differences in productivity trends across the economy. Therefore, making comparisons with average trends should be treated with caution given that wider structural changes are taking place in the national economy. In line with many other developed economies, the service sector in the economy is rapidly expanding, while the primary and secondary industries are in decline.
2001–02 2015–16 Per cent change
Selected Tourism Products $m $m
Accommodation services 3258 5818 +79
Imputed and actual rent on vacation homes 2945 4231 +44
Takeaway and restaurant meals (c) 13,504 14,212 +5
Taxi fares 312 381 +22
Local area passenger transportation 231 424 +84
Long distance passenger transportation (b) 6296 9799 +56
Motor vehicle hire and lease 610 984 +61
Travel agency and tour operator services 1764 3029 +72
Recreational, cultural and sporting services 2368 3818 +61
Gambling and betting services 1051 1160 +10
Source: ABS Tourism Satellite Account (5249.0: Table 10).
Note: Reported in 2014–2015 dollars.
TABLE 1 GROWTH RATE ON SPENDING ON SELECTED TOURISM PRODUCTS
* Because this data is not sourced from the Tourism Satellite Account, it is worth noting that not all the activities within these sectors are related to tourism.

I M P R O V I N G S E R V I C E S E C T O R P R O D U C T I V I T Y : T H E E C O N O M I C I M P E R A T I V E
106
FIGURE 3 WAGE GROWTH IN THE RETAIL, ACCOMMODATION AND TRANSPORT SECTORS, 2008–16
Source: ABS 6345.0 Wage Price Index, Australia
S E C T I O N 4 . 1
All in all, this average to below-average performance is consistent with interna-tional trends in tourism productivity growth.14,15 In fact, it has been reported that the Australian tourism industry is even 27 per cent more productive than global competi-tors in the industry.16
Given that tourism is a labour intensive industry, one potential cause of slow produc-tivity growth could be rapid wage growth. Labour’s share of total input costs in this sector is relatively high. For the three main tourism-related sectors – retail, accom-modation and food, and transport – these shares are 68.6 per cent, 59.6 per cent and 49.7 per cent, respectively.17 Figure 3 shows wage growth in tourism has been around average compared with private industries,18 although wage growth in transport was higher during the mining boom. More recently, wages in accommodation and food,
FIGURE 2 PRODUCTIVITY GROWTH BY INDUSTRY, 2014–15 TO 2015–16
Source: ABS 5260.0.55.002, Table 1 and 6.
Note: Quality adjusted hours worked basis.
–10 –5 0 5 10 15
Labour productivity
Multifactor productivity
Agriculture, forestry and fishing
Mining
Manufacturing
Electricity, gas, water and waste services
Construction
Wholesale trade
Retail trade
Accommodation and food services
Transport, postal and warehousing
Information, media and telecommunications
Financial and insurance services
Rental, hiring and real estate services
Professional, scientific and technical services
Administrative and support services
Arts and recreation services
Other services
16 market sector industries
2008 2009 2010 2011 2012 2013 2014 2015 2016
0
1
2
3
4
5
6
7
8
9
10
%
All private industries
Accomodation food
Retail
Transport

I M P R O V I N G S E R V I C E S E C T O R P R O D U C T I V I T Y : T H E E C O N O M I C I M P E R A T I V E
107
S E C T I O N 4 . 1
and retail sector have been growing above average in 2015 and 2016. This could account for slow labour growth in recent years (see Figure 2).
Beyond wages, another important clue for slow productivity growth can be found in the changing composition of the tourism workforce. The tourism industry is dominated by small-to-medium sized enterprises (SME) where jobs tend to be relatively seasonal and businesses experience high staff turnover rates. In a recent survey, 51 per cent of tourism businesses reported difficulty in recruiting, while 31 per cent reported difficulty in retaining staff.19 In particular, while employment is growing, much of this growth is coming from strong growth in the number of part time workers in the sector (see Table 2). The greatest increase in part time workers is in the food and retail sector where the number of part time employees rose by over 67 per cent between 1997–98 to 2015–16. This could hamper productivity growth as there is some evidence that part time workers are significantly less likely to be involved in work-related training or skills improvement programs.20,21 Faced with casual staff, business investment in human capital is risky, as employers express concern that skilled workers could be poached by their competitors.22
TABLE 2 PART TIME EMPLOYMENT TRENDS IN TOURISM, 1997–98 TO 2015–16
Tourism sector1997–98
‘0002015–16
‘000Per cent change
Accommodation 78.9 82.8 4.9
Cafes, restaurants and takeaway food services 96.5 161.7 67.6
Clubs, pubs, taverns and bars 29.9 32.6 9.0
Rail transport 2.8 2.7 –3.6
Road transport and transport equipment rental 18.2 21.4 17.6
Air, water and other transport 36.1 36.6 1.4
Travel agency and tour operator services 28.9 39.0 34.9
Cultural services 5.6 10.7 91.1
Casinos and other gambling services 3.6 2.6 –27.8
Sports and recreation services 9.8 18.7 90.8
Retail trade 80.8 102.2 26.5
Education and training 32.3 45.3 40.2
All 423.5 556.3 31.4
Source: The Australian Bureau of Statistics’ Tourism Satellite Account.
Note: Tourism part time employed persons is derived by multiplying the number of part time employed persons in the industry by the proportion of total
value added of the industry which is related to tourism.

I M P R O V I N G S E R V I C E S E C T O R P R O D U C T I V I T Y : T H E E C O N O M I C I M P E R A T I V E
108
S E C T I O N 4 . 1
Slow productivity growth could also be related to the quality of tourism and hospitality training programs. A recent report commissioned by Austrade on Tourism Careers in Australia23 noted that there exists widespread concern among tourism employers about the current quality of tourism and hospitality training programs. The concerns included:
Courses that are not necessarily based on specific workplace needs;
Trainers that lack practical industry experience and training that is too theoretical;
Hospitality courses that do not dedicate sufficient time to industry placements;
An insufficient focus on computer/IT skills; and
At TAFE, a perception of students having the attitude that they need to attend but not necessarily learn.
A key challenge is to encourage the involvement of tourism businesses in designing curricula and delivering relevant training programs.
The impact of digitisation and the sharing economy
To achieve long run gains in productivity it is vital for any industry to adopt new cost saving technologies and grow the skills base of its workforce. In this context, we now turn to discuss three key ways in which digitisation and the sharing economy will impact the productivity of the tourism workforce. CEDA’s 2015 report, Australia’s
Future Workforce?,24 highlighted how digitisation will have major ramifications for labour productivity in a range of industries, including the tourism industry. While the advent of the internet revolution is more than two decades old, recent years have wit-nessed major advances in the portability of computing and the connectivity of people, supply networks, assets and markets. Through these advancements, a number of digital platforms, such as Uber, allow consumers to engage in the market economy by “sharing” access to under-utilised assets, such as their houses, cars, carparks and savings.
First, it’s clear that digitisation will drive up demand across the economy for workers with e-marketing skills, web and animation design and information technology (IT) support capability. For tourism, the internet is the top source for both leisure and busi-ness travel planning.25 As recognised in the Toursim 2020 plan, tourism SMEs will need to dedicate more resources to develop and maintain an engaging online pres-ence to remain viable in a highly competitive international tourism sector. Of particular importance will be the digitisation of local culture in a way that highlights the unique features of a travel destination to visitors using geolocation technology on portable devices, such as smartphones. The European Union has developed initiatives and guidelines for digitising European culture to make its cultural heritage more widely available. This includes using digital object identifiers (DOIs) to tag cultural artefacts and museum catalogues and linking them together via an online platform that allows users to explore and discover local culture via portable devices.26 This raises the question of what kind of digital infrastructure the Australian tourism industry needs to ensure it can offer similar connectivity and attract workers with the relevant digital skills from other industries.

I M P R O V I N G S E R V I C E S E C T O R P R O D U C T I V I T Y : T H E E C O N O M I C I M P E R A T I V E
109
S E C T I O N 4 . 1
Second, automation presents both opportunities and risks for the tourism sector. It is clear that routine tasks are more susceptible to automation as the nature of the task can be easily codified. These tasks are generally characteristic of low- and middle-skilled jobs or activities.27 In the case of the tourism industry, which is com-posed of retail, transport and accommodation workers, there exist several prominent examples. For example, the role of travel intermediaries has changed as new online search technologies have enabled customers to search and organise their own flights more efficiently. Self-driving cars may impact the role of taxi drivers and chauffeurs. Increasing automation is good news for productivity as it will help boost labour pro-ductivity by reducing the share of labour dedicated to low-skill tasks.28 However, productivity can only grow if the sector has the capacity to attract skilled workers required to develop, implement and administer these technologies in the long run. Also, as more low-skilled jobs become redundant, there may be an opportunity for the industry to redirect these workers via suitable career progression plans, training packages and career pathways to more high skilled jobs. To properly manage this transition, the industry needs to ensure that viable career pathways exist between skilled and non-skilled occupations within the sector. This can be done by providing more information about key job opportunities and careers within the sector, as well as working with young workers in the industry to raise awareness about tourism’s future workforce needs.
Third and finally, with these disruptions a new cohort of workers is emerging in the tourism sector – the “gig” workers. Understanding the motivators of this growing cohort of freelance workers is key to ensuring that they operate efficiently, remain engaged and are properly integrated into the industry. This growth enables business to shift some risks to subcontracted workers and stimulates productivity by enabling businesses to avoid costly protections and guarantees to workers in standard employ-ment arrangements.29 Studies suggest that many of these workers are new in that they were not previously employed by other firms in the tourism industry, but rather entered the workforce as they prefer flexible working arrangements.30 In this sense, the job benefits of greater flexibility also come with greater risks in terms of more vola-tile income flows and greater management responsibility. This could explain why the majority of subcontractors in the US report dissatisfaction with their jobs and would not choose to engage in similar work in the future.31 In this regard, the industry has to do more to improve job satisfaction by supporting and training gig workers to effec-tively manage their business risks by improving their financial planning and accounting skills, and helping them navigate through business and income insurance options.

I M P R O V I N G S E R V I C E S E C T O R P R O D U C T I V I T Y : T H E E C O N O M I C I M P E R A T I V E
110
S E C T I O N 4 . 1
References
Autor, D. 2015, ‘Why are there still so many jobs? The history and future of workplace automation’, Journal of Economic Perspectives, vol. 29, no. 3, pp. 3–30.
Burgess, S. S., Sellitto, C. C., Buultjens, J. J., & Cox, C. C. (2015, July). How Australian SMEs engage with social media. In Proceedings of the European conference on e-learning (pp. 45-51).
Coase, Ronald, ‘The Problem of Social Cost’ Journal of Law and Economics 3 (1960): 15
Coelli, M. and Borland, J. 2015, Job Polarisation and Earnings Inequality in Australia, 24 February, University of Melbourne.
Deloitte Access Economics, (2016). Economic effects of ridesharing in Australia. [online] Sydney: Deloitte Access Economics. Available at http://www2.deloitte.com/au/en/pages/economics/articles/economic-effectsridesharing-australia-uber.html
Djellal, F., & Gallouj, F. (2009). Measuring and improving productivity in services: issues, strategies and challenges. Edward Elgar Publishing.
Estêvão, J. V., Carneiro, M. J., & Teixeira, L. (2014). The Evolving Value of eTourism for Suppliers and Visitors. Hospitality, Travel, and Tourism: Concepts, Methodologies, Tools, and Applications: Concepts, Methodologies, Tools, and Applications, 131.
Haven, C., & Jones, E. (2004, April). ASSESSMENT OF THE LABOUR MARKET AND SKILLS NEEDS OF THE TOURISM AND RELATED SECTORS IN WALES. In Cardiff: Tourism Training Forum for Wales.
Loosemore, M., & Andonakis, N. (2007). Barriers to implementing OHS reforms–The experiences of small subcontractors in the Australian Construction Industry. International Journal of Project Management, 25(6), 579-588.
Lowe, P (2012) The Changing Structure of the Australian Economy and Monetary Policy. Address to the Australian Industry Group 12th Annual Economic Forum. Sydney – 7 March 2012
Mitas, O., van der Ent, M., Peeters, P., and Weston, R. 2015, Research for TRAN Committee – The Digitisation of Tourism Enterprises, Directorate General for Internal Policies, European Parliament, viewed 30 June 2016, http://www.cstt.nl/userdata/documents/ep2015-digitisationtourism-ipol_ida(2015)563420_en.pdf
Murphy, H. C., & Chen, M. M. (2014). Online information sources used in hotel bookings examining relevance and recall. Journal of Travel Research, 0047287514559033.
Open.edu.au. (2016). Taxi Drivers - Career Advice and Salary Guide - Open Universities Australia. [online] Available at: https://www.open.edu.au/careers/transport/taxidrivers [Accessed 21 Sep. 2016].
Uber Global. (2015). In the Driver’s Seat: A Closer Look at the Uber Partner Experience. [online] Available at: https://newsroom.uber.com/in-the-drivers-seatunderstanding-the-uber-partner-experience/ [Accessed 21 Sep. 2016].
Williams, C. L., & Connell, C. (2010). “Looking good and sounding right” aesthetic labor and social inequality in the retail industry. Work and Occupations, 37(3), 349-377.
Endnotes
1 Australian Bureau of Statistics (2016) Australian National Accounts: Tourism Satellite Account. 5249.0. accessed at: http://www.abs.gov.au/AUSSTATS/[email protected]/DetailsPage/5249.02015-16?OpenDocument
2 Morrison, S (2016) Australia: A strong and transitioning economy. http://sjm.ministers.treasury.gov.au/files/2016/04/2016-012.pdf
3 Dwyer, L., Pham, T., Jago, L., Bailey, G., & Marshall, J. (2016). Modeling the Impact of Australia’s Mining Boom on Tourism: A Classic Case of Dutch Disease. Journal of Travel Research, 55(2), 233-245.
4 Austrade (2015) Austrade submission to the Productivity Commission’s research into Australia’s international tourism industry: trends, drivers and barriers to growth. Comment 19. http://www.pc.gov.au/research/completed/international-tourism/comments/submissions/submission-counter/sub019-international-tourism.pdf
5 Deloitte 2015, Australian Tourism Labour Force Report 2015-2020, Deloitte Access Economics, viewed 25 April 2016, https://www.tra.gov.au/documents/Australian_Tourism_Labour_Force_FINAL.PDF
6 PwC (2015), A Smart Move - Future Proofing Australia’s Workforce by Growing Skills in Science, Technology, Engineering and Maths (STEM), April.
7 Dwyer, L., Forsyth, P., & Spurr, R. (2012). Wither Australian tourism? Implications of the carbon tax. Journal of Hospitality and Tourism Management, 19(1), 15-30.
8 Tourism Australia (2011) Tourism 2020: Whole of government working with industry to achieve Australia’s tourism potential. http://www.tourism.australia.com/documents/Tourism_2020_overview.pdf
9 Williams, C. L., & Connell, C. (2010). “Looking good and sounding right” aesthetic labor and social inequality in the retail industry. Work and Occupations, 37(3), 349-377.
10 Australian Bureau of Statistics (2016) Australian National Accounts: Tourism Satellite Account. 5249.0. accessed at: http://www.abs.gov.au/AUSSTATS/[email protected]/DetailsPage/5249.02015-16?OpenDocument
11 Tourism Research Australia (2010) Tourism Productivity in Australia, Tourism Research Australia, Canberra
12 Tourism Research Australia (2014) Tourism Productivity Update, Tourism Research Australia, Canberra
13 D’Arcy, P. and L. Gustaddon (2012) Australia’s Productivity Performance and Real Incomes, RBA Bulletin, June Quarter.
14 Smeral, E. (2007). The productivity puzzle in tourism. Productivity in Tourism: Fundamentals and Concepts for Achieving Growth and Competitiveness. International Tourism Research and Concepts, 27-39.
15 Smeral, E. (2009). Growth accounting for hotel and restaurant industries. Journal of travel research, 47(4), 413-424.
16 Austrade (2017) Why Australia? Benchmark Report 2017.
17 Department of Industry, Innovation and Science (DIIS) (2016), Australian Industry Report 2016, viewed 1 Feburary 2017, https://industry.gov.au/Office-of-the-Chief-Economist/Publications/AustralianIndustryReport/index.html
18 Australian Bureau of Statistics (2016) Australian National Accounts: Tourism Satellite Account. 5249.0. accessed at: http://www.abs.gov.au/AUSSTATS/[email protected]/DetailsPage/5249.02015-16?OpenDocument
19 Deloitte 2015, Australian Tourism Labour Force Report 2015-2020, Deloitte Access Economics, viewed 25 April 2016, https://www.tra.gov.au/documents/Australian_Tourism_Labour_Force_FINAL.PDF

I M P R O V I N G S E R V I C E S E C T O R P R O D U C T I V I T Y : T H E E C O N O M I C I M P E R A T I V E
111
S E C T I O N 4 . 1
20 Arulampalam, W., & Booth, A. L. (1998). Training and labour market flexibility: is there a trade-off?. British Journal of Industrial Relations, 36(4), 521-536.
21 Booth, A. L., Francesconi, M., & Frank, J. (2002). Temporary jobs: stepping stones or dead ends?. The economic journal, 112(480), F189-F213.
22 Blake, A., Sinclair, M. T., & Soria, J. A. C. (2006). Tourism productivity: evidence from the United Kingdom. Annals of Tourism Research, 33(4), 1099-1120.
23 Colmar Brunton (2016) Austrade Tourism and Hospitality Careers Reports. Project AUSTR003. https://www.austrade.gov.au/Australian/Tourism/Policy-and-Strategy/labour-and-skills
24 CEDA (2015) Australia’s Future Workforce? ISBN: 0 85801 300 2. http://adminpanel.ceda.com.au/FOLDERS/Service/Files/Documents/26792~Futureworkforce_June2015.pdf
25 Buhalis, D., & Law, R. (2008). Progress in information technology and tourism management: 20 years on and 10 years after the Internet—The state of eTourism research. Tourism management, 29(4), 609-623.
26 European Commission 2016. Implementation of Commission Recommendation on the digitisation and online accessibility of cultural material and digital preservation: Progress Report 2013-2015. Directorate-General for Communications Networks, Content and Technology.
27 Productivity Commission 2016, Digital Disruption: What do governments need to do?, Commission Research Paper, Canberra.
28 Bostrom, N. 2014, Superintelligence: Paths, Dangers, Strategies, 1st edn, Oxford University Press.
29 Isaac, E. (2014). Disruptive Innovation: Risk-Shifting and Precarity in the Age of Uber. Berkeley Roundtable on the International Economy BRIE Working Paper, 7.
30 MacCulloch, R. and Di Tella, R. (n.d.). The Consequences of Labor Market Flexibility: Panel Evidence Based on Survey Data. SSRN Electronic Journal.
31 Deloitte (2016) https://www2.deloitte.com/us/en/pages/about-deloitte/articles/press-releases/deloitte-survey-workplace-culture-important-to-independent-contractors.html?nc=1

I M P R O V I N G S E R V I C E S E C T O R P R O D U C T I V I T Y : T H E E C O N O M I C I M P E R A T I V E
112
4.2Case study: Tasmania driving
innovation in the visitor economy
Professor Richard Eccleston Dr Anne Hardy
Dr Dugald Tinch
Professor Richard Eccleston is Professor of Political Science and founding
Director of the Institute for the Study of Social Change at the University of
Tasmania. He is a specialist in comparative political economy. He takes a keen
interest in Tasmanian politics and is a respected commentator on local and
national political affairs. He is especially interested in research and strategies
that can contribute to a more prosperous and sustainable community.
Dr Anne Hardy is a Senior Lecturer at the University of Tasmania and the
Director of the Tourism Research and Education Network (TRENd). Dr Hardy’s
research interests are neo-tribal marketing, the self-drive tourism market and
stakeholder perspectives of tourism development. Her most recent award
winning research project used GIS and app technology to track the movement
of tourists through the entire region of Tasmania, Australia.

I M P R O V I N G S E R V I C E S E C T O R P R O D U C T I V I T Y : T H E E C O N O M I C I M P E R A T I V E
113
Dr Dugald Tinch is a Lecturer in Resource Economics at the
Tasmanian School of Business and Economics. His recent
research has been focused in the field of ecosystem services
and he has recently secured funding relating to Antarctica and
Tasmanian tourism. He is a multidisciplinary researcher who is
published in economics, policy and ecology literature.
S E C T I O N 4 . 2
Introduction
Tourism is now Australia’s second most valuable export industry and is a particularly important driver of economic and employment growth in regional communities.
Nowhere is this truer than Tasmania, where tourist numbers have increased by 40 per cent over the past five years, making a significant contribution to the island state’s economic recovery along the way.
While few dispute the size and significance of the sector, the innovative use of technol-ogy to enhance the visitor experience and create value has largely been limited to marketing and to transforming the relationship between tourism operators and their customers.
Technology may have revolutionised the way we plan and book our holidays, not to mention the way that we travel, but industry and government alike have been much slower to embrace technology to analyse and respond to more systemic trends in this large and dynamic sector.
A team of researchers from the University of Tasmania, headed by project leaders Professor Richard Eccleston and Dr Anne Hardy, are challenging this very traditional approach to tourism market research and the rest of the world is watching.
The technology challenge
The Tracer Tourism Tracking Project was established in 2015 as a partnership between the Tasmanian Government, the tourism industry and a research team at the University of Tasmania’s Institute for the Study of Social Change.
The project secured funding from the Sense T program – a successful collaboration between the University of Tasmania, CSIRO and the Tasmanian and Commonwealth Governments to develop sensing technologies and data analytics to improve busi-ness decision making and productivity. The project had the simple aim of establishing whether sensor-based data could be used to meet the tourism industry’s research needs.
The simple but stunning answer was a resounding “yes”.

I M P R O V I N G S E R V I C E S E C T O R P R O D U C T I V I T Y : T H E E C O N O M I C I M P E R A T I V E
114
S E C T I O N 4 . 2
Professor Eccleston said the first industry consultation resulted in the remarkably simple, yet significant challenge the industry issued: “Can you provide detailed analy-sis of how different types of tourists travel around the state over an extended period?”
It sounded simple, but it turned out to be the holy grail of tourism research.
This data can be used to plan public infrastructure, private investment, identify market trends and evaluate marketing strategies. Perhaps more importantly, rich data on how visitors travel through a region and when and where they stop allows the industry to better serve their specific needs, enhancing the visitor experience.
Individual businesses and attractions have excellent detailed knowledge on their cus-tomers but more systematic data on how visitors move around a region is poor and the research techniques used to try to understand visitor dynamics are archaic, having changed little in decades.
The fact that tourism authorities both in Australia and abroad continue to survey tour-ists in departure lounges about where they have been is quite extraordinary given both the cost involved and the fact that retrospective surveys are notoriously inaccurate.
Tourism Tracer’s disruptive approach
At first blush it seemed like a simple challenge. There are billions of smart phones on the planet and few tourists in 2017 will step outside the front door of their Airbnb without their personal device in hand.
However, the problem is that obtaining meaningful, continuous data has been much more challenging. For example, it is very easy to track the broad flows of people in a region using their smart phones but this data is little use for tourism research unless it is linked to the basic socio-demographic profile of the tourist being tracked.
The obvious solution was to develop a tourist tracking app that combined the latest GPS technology with a short survey in order to analyse the complex relationship between travel patterns and different types of visitors. Again, this sounds simple but few research teams had been able to successfully recruit visitors and persuade them to download and run a tracking app for an extended period of time.
Despite these challenges, and by using a combination of smart recruiting and an incentive of free mobile data, the project tracked the precise movements of almost 500 groups travelling within Tasmania for periods of up to 14 days.
This project pilot conducted in the early months of 2016 was the largest study of its type ever to be conducted, both in terms of the length of time tourists were tracked and also in terms of the study’s focus on an entire island. Using the data collected the team has been determining who goes to specific regions, how long they stop and what infrastructure they are using.
Myth busting
The data and analysis generated by the project has attracted international interest as well as receiving a national innovation award along the way.
The response of the CEO of the Tasmanian Tourism and Industry Council was typical: “The results are stunning, it’s clear that tourism research has finally entered the digital age.”

I M P R O V I N G S E R V I C E S E C T O R P R O D U C T I V I T Y : T H E E C O N O M I C I M P E R A T I V E
115
FIGURE 1 SNAPSHOT OF TOURISM TRACER ANIMATION OF TRAVEL IN TASMANIA
Source: www.tourismtracer.com
After six months of intensive analysis, the project team has not only provided detailed insights into preferred travel routes within Tasmania but, as is often the case with big data sets, has helped address a range of significant industry questions and challenges that were not a part of the original project brief.
For example, the project has provided new insights into both infrastructure bottlenecks as well as facilities that are underused by tourists, data which will enable the industry to invest in areas where there is clear demand.
The study was also able to highlight that the many visitors to Tasmania’s regional tourist attractions were embarking on long day trips from the state’s major cities rather than staying overnight in regional communities, suggesting the need for more regional accommodation and strategic marketing.
Beyond broad trends, the data is being used to address a host of specific industry and policy questions, such as analysing risky driving behaviour and to enable individual businesses to get a better appreciation of their guests’ travel itineraries and needs.
While originally conceived as a pilot, the data from the first phase of the project clearly demonstrated the value of the tourist tracking data and its almost unlimited potential to address industry questions and drive innovation in the sector.
Scaling up
Following their successful large-scale pilot study the research team is now focused on scaling up the project in order to provide high quality data on tourist behaviour on a sustainable basis.
Reflecting this aim, the tourist tracking team has three key goals for the next 12 months.
First the team will work with the Tasmanian Government to significantly increase the research program in Tasmania in order to track a representative sample of visitors to the island state on a continuous basis.
Second, the team will work selectively with external partners to use the sophisticated data gathering and analysis techniques developed by the team during the pilot to analyse tourist movements in other jurisdictions.
S E C T I O N 4 . 2

I M P R O V I N G S E R V I C E S E C T O R P R O D U C T I V I T Y : T H E E C O N O M I C I M P E R A T I V E
116
“While we have been inundated with requests from around the world to enter into partnerships and collaborations, as a research group we have decided to grow the research program incrementally by forming a strategic partnership with Tourism Skåne, the government tourism agency responsible for tourism development in Southern Sweden,” Professor Eccleston said.
The model in this instance will link the Tourism Tracer technology to Tourism Skåne’s existing travel apps that provide visitor information. Not only will the partnership enable the University of Tasmania team to refine their technology and methods, but it also highlights how innovative technology products and research services can be exported. In this case, real time data from Scandinavia will be analysed in Hobart.
The third element of the Tourism Tracking program is the development of a high quality and usable dashboard, designed by the project’s Hobart-based technology partners Ionata Digital, to visualise the data in a user-friendly manner that is accessible and useful for the broader tourism industry in Tasmania and beyond. The simple goal here is to translate the massive amount of data generated by the project into analysis which is of value to industry.
Since its inception, the tracking project has used existing question banks to ensure it complements existing data sets. Consequently, the dashboard has the unique ability to link the tracking data with existing datasets such as the Tasmanian Visitor Survey and the Australian Tourism Data Warehouse. This will allow operators to locate their business on an interactive map and understand precise visitor flows, such as where visitors have been prior to their business and where they travel afterwards. This will enhance co-marketing opportunities and give the industry in Tasmania a distinct com-petitive advantage. Other functions will include visualisation of broader visitor patterns through the state according to demographic factors and longitudinal trends in travel patterns, which will be built upon over time.
The end game
The Tracer Tourism Tracking project is a clear example of how technology can be used to drive innovation in the service economy, which also highlights the importance of structured collaboration between industry, government and the university sector. Whereas business to business innovation often occurs spontaneously, data gathering and analysis to capture the dynamics on an entire services sector demands careful planning and collaboration to ensure that the analysis is both robust and address industry and policy needs.
Having worked through these issues and having completed a successful large scale pilot study the Tracer Tourism Tracking team is now poised to provide high quality travel data for governments and operators both across Australia and abroad. Not only has the Tasmanian research team pushed tourism research into the digital age, but your next holiday to Tasmania may be even more enjoyable as a result.
References
Tourism Tracer Website: www.tourismtracer.com
The Institute for the Study of Social Change, University of Tasmania: http://www.utas.edu.au/social-change
Ionata Digital: https://ionata.com.au/ (Project technology partners)
Video summary of the project https://www.youtube.com/watch?v=aAJsVZjuZBE
S E C T I O N 4 . 2

117
5.1 Productivity in accounting services Karen McWilliams
SECT ION
5.0
Productivity of professional services

I M P R O V I N G S E R V I C E S E C T O R P R O D U C T I V I T Y : T H E E C O N O M I C I M P E R A T I V E
118
Karen McWilliams oversees policy and advocacy
work in sustainability, integrated reporting and
ethics at Chartered Accountants Australia and
New Zealand. Based in Sydney, she is also
responsible for delivering related thought
leadership initiatives through the future[inc] series.
With over 17 years’ experience in a variety of business and advisory
roles, Ms McWilliams started her career in the specialist field of audit
and has held positions with WorleyParsons, Ernst and Young, and
Deloitte in London.
Ms McWilliams is a Fellow Chartered Accountant with the Institute of
Chartered Accountants in England and Wales, a member of Chartered
Accountants Australia and New Zealand and holds a Master of Arts in
Mathematical Sciences from the University of Oxford.
5.1Productivity in
accounting services
Karen McWilliams
I M P R O V I N G S E R V I C E S E C T O R P R O D U C T I V I T Y : T H E E C O N O M I C I M P E R A T I V E
119
S E C T I O N 5 . 1
A world changing; an industry transforming
This chapter was intended to start with a discussion about the status quo of account-ing services in Australia. However, the current state is difficult to define because it is constantly evolving. In Australia and around the world, jobs and workplaces are changing faster than ever before and the accounting profession, as part of the global corporate environment, is no different. Technology, globalisation and changes to where and when people work are transforming the industry and creating new oppor-tunities. As the world of business evolves, so too does the work and expectations of accountants.
Accountants play a crucial role in helping businesses succeed and contribute to the world in a positive way. They work in many roles, providing advice both within organ-isations and externally. For the purposes of this chapter, the term accounting services covers both accounting practices and the finance functions within an organisation. The Department of Employment states there were 188,100 accountants in Australia at November 2015,1 with close to 50 per cent female and over 80 per cent working full time.2 The future growth prospects are high, with forecast numbers of accountants expected to be 219,300 by 2020.
However, in the most recently available figures from the Australian Bureau of Statistics, multifactor productivity declined by 4.3 per cent in 2014–15 for professional, scientific and technical services. A large proportion of Australia’s 188,100 accountants work in this sector. This represented the largest decrease for any sector and was the largest fall for the sector since 1995–96, attributable to strong negative growth in gross value added (–4.0 per cent). Labour productivity also declined by 3.5 per cent on an hours-worked basis.3
Given the recent decline in multifactor productivity, the accounting services sector has more to do to contribute to Australia’s economic growth. However, it is important not to focus on these measures of productivity of the sector alone. Accountants don’t just exist for themselves but also to serve the wider community. But to grow and meet the future needs of the community, the profession can’t just strive to be more efficient and effective at the same things.4 Instead, it will need to be more innovative and transform itself so that it remains valued by business, government and the community.5
Drivers and barriers of productivity
Technology as a productivity driver is nothing new and emerging technologies are cur-rently transforming almost every industry, including the accounting industry. What will be new in the future is that technology-driven productivity improvements are expected to have a very high impact on the professional services industry over a very short period.6
Globalisation is transforming the business landscape and impacting the accounting profession. People, organisations and places around the world are more closely linked than ever before.
“Any work that can be done on a computer can be done anywhere in the world.”7

I M P R O V I N G S E R V I C E S E C T O R P R O D U C T I V I T Y : T H E E C O N O M I C I M P E R A T I V E
120
S E C T I O N 5 . 1
The rise of the “virtual global worker” has been highlighted as having the potential to significantly disrupt the labour market.8 Accounting firms and finance functions now have access to a larger pool of global talent, including via offshoring, whether this be through offshore providers, overseas operations or freelancers.
And while technology and globalisation have the potential to drive future productivity improvements, disclosure overload and red-tape will act as a barrier. Evolving busi-ness models are also changing the expectations placed on accountants.
“ All professional accountants will be expected to look beyond the numbers, collaborate with
other parts of the business and think and behave more strategically.”9
Technological transformation
Technologies such as data analytics, cloud computing and social media are already enabling accounting professionals to work in different ways. Employees aren’t con-fined to the same office every day – they can access company files and connect with colleagues and customers anytime, from anywhere around the globe. This flexibility is giving employees more choice and helping them improve their productivity and work-life balance.
Increasingly businesses are using automated, often cloud-based software to provide basic accounting services, such as bookkeeping and routine tax preparation, because it can be simpler and cheaper for them. This has reduced demand for some lower-value accounting services, such as data entry, bookkeeping and accounting clerical work. Software as a service (SaaS) has significant potential to increase productivity in the accounting profession. In particular, it reduces technology costs, enabling smaller accounting firms to compete with larger firms on a more level playing field.
Artificial intelligence (AI) and machine learning have the potential to make an even greater impact on the accounting profession and workplace polarisation. AI consti-tutes machines carrying out human tasks and decisions, and machine learning refers to the application of AI to allow machines to access data and learn for themselves. However, AI can’t think creatively or intuitively and can’t apply the professional scepti-cism and judgement required from professional accountants. Use of AI will enable these higher skilled employees to become more productive10 and there will also be the opportunity for some of those with medium-skilled jobs to increase their skill level.11 In the future, it is likely that AI will provide advice or recommendations to assist the human decision-maker. This will lead to better decisions as the recommendations will be based on the analysis of large amounts of data.
Case study – Xero and machine learning
“ Because accounting is a fairly low vocabulary, tight domain, (Xero) is getting extraordinary
results from basic machine learning. So much so that we think over the next few years
we can get rid of coding. Small businesses won’t need to code transactions anymore.”
After analysing more than three million transactions – and correcting the data that had
already been collected – Xero Founder, Rod Drury says Xero is nearly in a position to offer
automatic coding.
In Drury’s brave new world, the accountant’s role becomes one of quality control and
certification of the automatic accounting processes, rather than that of number cruncher.
“ The professional comes in to monitor and fix so that the quality of everybody’s books is
really good.”12

I M P R O V I N G S E R V I C E S E C T O R P R O D U C T I V I T Y : T H E E C O N O M I C I M P E R A T I V E
121
S E C T I O N 5 . 1
Technology is not just driving this transformation but also aiding it. When interpreted and analysed appropriately, “big data” has the potential to provide real insight into business drivers and shape future strategy. Accountants can use the analysis that big data provides to add value to their business and clients.
Another new technology aiding the transformation of the accounting profession is blockchain.
“ Blockchain has its origins in accounting; it is a technology built around an auditable record
of financial transactions.”13
It therefore makes sense for the accounting profession to look at how it can change the way they work. Blockchain is a distributed ledger that was created to underpin cyptocurrencies, like bitcoin, where no trusted central party exists. Business is cur-rently exploring the potential applications for blockchain. The successful ones will be those that effectively harness blockchain’s key value drivers of veracity, transparency and disintermediation. The applications are underpinned by two core functions that blockchain technology offers: recordkeeping and transaction-settling.14
Application of these new technologies in combination makes them more powerful. These technologies will have a disruptive impact on the accounting sector, but one which could have significant gains from a productivity perspective.
The rise of offshoring and outsourcing
A growing number of businesses are offshoring and outsourcing services. Offshoring can play a key role in addressing future productivity challenges, enabling organisa-tions to operate more efficiently, maximising the value-add of the existing workforce and assisting organisations to be internationally competitive.16 Many accounting firms and finance functions outsource certain accounting services, for example business analytics, risk and compliance, and data entry to offshore locations often in low-cost economies such as China, India and the Philippines.
The benefits of offshoring and outsourcing for organisations can include:17
Lower labour costs;
Improving processes and developing more efficient methods to complete existing tasks;
Increased flexibility and scalability of your operations;
The ability to locate business functions closer to local markets; and
Gaining access to a more diverse pool of skills and capabilities.
There are also potential risk factors involved, such as financial, regulatory or reputa-tional risks. Given the investment and commitment required to make an offshoring or outsourcing model work, it is not necessarily the best option for all organisations.
Case study – Commonwealth Bank and blockchain
The Commonwealth Bank of Australia has been involved in the first trade finance
transaction as one of two independent banks using a combination of blockchain, smart
contracts and the internet of things to facilitate the transaction. Using the smart contracts
on a specialist blockchain technology system, the contract codifying the letter of credit
was created. The goods were tracked by connecting the goods container to the internet of
things, and once it reached a certain location, the smart contract was triggered to release
the payment.15

I M P R O V I N G S E R V I C E S E C T O R P R O D U C T I V I T Y : T H E E C O N O M I C I M P E R A T I V E
122
S E C T I O N 5 . 1
Offshoring provides opportunities to “onshore” quality accounting services and business advice work. Onshore accountants offer excellent customer service and high-value strategic services to their customers, which cannot be easily offshored or automated.
However, the offshoring model is undergoing rapid change. There is greater com-petition for skilled employees in the offshore locations, which is increasing employee turnover. This is unattractive for organisations offshoring and so investment will be needed in career development for offshore employees to improve retention.18 Robotic process automation will also significantly disrupt the offshoring model, as many of the tasks which are offshored become automated instead. However, some organisations are looking to their offshore provider to introduce automation to them and facilitate its development.19
Disclosure overload and red-tape
We are likely to see increased regulation in relation to issues such as tax avoidance, with governments taking action to limit base erosion and profit-shifting, and also anti-money laundering, which has seen greater focus as a result of the Panama Papers revelations.
Reporting for organisations is probably at the highest level it’s ever been, especially for large, leading organisations. Annual reports are long and organisations also face a growing list of mandatory and voluntary additional reporting obligations to government bodies and NGOs. This excessive volume and technical jargon used in financial state-ments also limits their relevance and functionality.
Professional accountants working in accounting firms and finance functions find them-selves faced with a high volume of compliance related work. This in turn reduces the time they have available for value adding to their organisation or clients. It is critical to find the right balance between conformance and performance for their organisation to retain trust and integrity in financial information while increasing the productivity of the sector. While the right balance will differ between organisations, embedding compli-ance controls into business processes will ensure compliance is aligned with business strategy but not a primary driver of strategy.20
Changing expectations
Business models are becoming more complex and new ones are continuously emerg-ing, such as Fintech and the peer to peer economy. And as business evolves, so too will the expectations placed on accountants. The expected high standards of integ-rity, independence and professional scepticism will remain. However, they will need to meet the requests of an increasingly diverse group of stakeholders demanding comprehensive and forward-looking information in real time.21 The changing business models will also bring new regulations that accountants will be expected to comply with.
As a result of complex business models, diverse stakeholders and new regulations, accountants will need new capabilities in addition to their existing ones, this may include addressing the changing nature of risk – such as in areas including sustain-ability; climate change; cyber threats and artificial intelligence. Accountants will also need to know how to use reporting as a strategic tool to be more forward looking and aligned to the business, the applications of blockchain, the benefits of cloud comput-ing and how to analyse big data.

I M P R O V I N G S E R V I C E S E C T O R P R O D U C T I V I T Y : T H E E C O N O M I C I M P E R A T I V E
123
S E C T I O N 5 . 1
Implications for accounting firms and finance functions
Organisations should not exclusively focus on cost savings as this would be detrimen-tal to the long-term sustainability of the organisation. Instead, a productivity strategy should be focused on ensuring that revenue growth is accelerating at a faster rate than costs.22 Culture, talent and technology will be critical success factors in a produc-tivity strategy.
It won’t be only incremental changes required; to really improve productivity, there will also need to be fundamental and transformational changes to the way accounting firms and finance functions operate.
New technology
In the accounting and professional services industry, organisations either need to start retraining employees or hiring people with analytical skills – the data scientists. With real time data, accounting professionals can provide strategic insight and trusted business advice. For businesses, the money they save by automating certain services frees up funds they can spend on higher-value services. Building strong relationships will be a key capability with accountants seen as trusted strategic business advisors.
Accounting firms and finance functions will need to consider how the new technolo-gies can be applied to their business. For example:
Where can automation be implemented in the organisation, for example, procure to pay, order to cash and record to report?
How can mobile technology be used to widen access to data and apps?
Could blockchain be applied to the business?
How can big data be used to provide actionable insights that drive decisions and growth?
When it comes to the finance function, investing in new technlogy has historically been a tough sell unless the return on investment to the organisation is clearly understood. Central to this will be greater collaboration and mutual understanding between the finance and IT functions in an organisation, for example CFO and CIO. Studies have shown the CFO-CIO relationship is becoming closer and more collaborative.23 This will enable the organisation to ensure IT investment drives business value, provides a holistic view of the digital threats and opportunities and will help connect teams and break down siloes in the business.24
New skills and business models
As the work performed by accountants changes, so will the skills they need to do the work. Employers in the accounting sector are already seeking attributes such as critical thinking and decision-making skills, strong communication skills and those who are focused on ethics.25 Ethics is one of the most important issues for graduates who want to work in an environment where they feel their work has purpose and meaning.26
Automation and offshoring provide the retained team the opportunity to refocus on higher value tasks and enhanced finance business partnering. Finance business partnering involves finance and accounting professionals working closely with man-agers and business operations to help improve decision making and performance.

I M P R O V I N G S E R V I C E S E C T O R P R O D U C T I V I T Y : T H E E C O N O M I C I M P E R A T I V E
124
S E C T I O N 5 . 1
Business partnering widens the career opportunities for finance professionals, provid-ing a path to senior management. For accounting firms, automation and offshoring enable employees to progress faster up the career ladder, possibly skipping the first few rungs.
For both situations, this changes the skills employers are looking for when recruiting new people into their organisation. This will have implications for individuals working in accounting as well as for education institutions training the next generation of accoun-tants. New skills won’t just be important to those at graduate level either, there will be a much higher level of retraining, reskilling and continuous life-long learning for all employees in the future.
Accounting firms and finance functions will also need to adapt their own business model to meet changing expectations and increase productivity. They will need a strat-egy that focuses on gaining efficiencies in compliance and administrative functions and explores how to create new value by providing advice through data and insights. For accounting firms, there is also a flow-through benefit to broader productivity as their advice improves the productivity of their clients. Given the contribution of SMEs to the Australian economy, the potential impact of this on productivity is huge.
Diversity
Diverse and inclusive workplaces increase employee engagement and productivity.27 Diversity is indicative of strong governance and values within organisations. Inclusive leadership is key to meeting the challenges and uncertainty of the future and the whole organisation has a role to play in being more inclusive. With the globalisation of markets, remote working and offshoring, specific skills, such as cultural intelligence and global market knowledge, will be critical to allow organisations to keep pace with these changes.
The accounting industry has a relatively diverse workforce. For example, there are more women working in accounting (49.3 per cent) compared to the percentage for all occupations (46.1 per cent).28 However, progress towards achieving inclusiveness and reducing the gender gap remains slow and there is more work to be done.
Flexible working
Technology is changing how we work and workplaces are becoming much more flex-ible. In the workplace of the future, employees aren’t restricted by location – they can work anywhere, anytime. Research has shown that there are a number of benefits for individuals, teams and organisations when employees are enabled to work flexibly.29
These include increased output and teamwork and more effective and improved client and stakeholder service.
It is up to employers to challenge themselves to change how they operate in order to accommodate this flexibility. There can be outdated mindsets, where managers or clients still believe they should be able to contact their employee or accountant anytime Monday–Friday, 9–5 and are concerned if they can’t see or reach them in the office. Employers need to focus instead on output, and trust their employees to achieve it in the way that is most efficient for them. In accounting firms, part of this transformation is a growing shift from time-based billing to fixed pricing, based on the value add to the business.

I M P R O V I N G S E R V I C E S E C T O R P R O D U C T I V I T Y : T H E E C O N O M I C I M P E R A T I V E
125
S E C T I O N 5 . 1
Implications for government policy
Education sector
Education institutions will need to respond to demands from employers as to the skills they require from graduates. An education framework needs to be adopted to produce graduates at all levels with the required skill sets to ensure maximum relevance and fit for current and future employment opportunities in Australia.31 The current model of undertaking an accounting based degree and then post graduate qualification may need to change. In overseas jurisdictions, like the UK, accounting candidates don’t need to have an accounting or commerce-focused degree.
There will be increased demand for data science and analysis skills. This need is growing already but it could be a base level skill set for future graduates. Additional skills will be those which can’t be so easily replicated by AI, such as relationship build-ing, strategic thinking and creativity. As Einstein famously said:
The value of an education in a liberal arts college is not the learning of many facts but the
training of the mind to think something that cannot be learned from textbooks.32
As technology hastens the rapid pace of change, training the mind to think will be critical for future prosperity. The ability to quickly adapt and continuously up-skill will be lifetime assets.33
The education sector will therefore need to consider how it enables lifelong learning, including in the accounting sector.
Regulatory settings
Government needs to create policy settings that enable organisations to operate in the most efficient manner, helping to lift productivity across the broader economy.34 Trying to retain all jobs in Australia won’t improve productivity, especially with generally higher local wages. Instead some businesses will offshore or automate lower value services and specialise in being providers of higher value services, including to other
Case study – Bean Ninjas and fixed fee accounting
A public practice in Queensland is firmly embracing compliance work – one small niche of
compliance – and using modern technology to build a contemporary model for traditional
accounting work.
Bean Ninjas works only with online businesses, such as e-commerce sites, software
providers or digital agencies. It organises the books for its clients for a set fee for
service, rather than invoicing based on hours worked – or based on how much a client
might be able to pay. Clients choose a plan that includes various levels of support with
reconciliations, sales tax and management reports. And it’s all done in the cloud.
This business model gives clients cost certainty, helps the firm refine its offering to a well-
defined market and allows its owners to achieve a better work-life balance than many of
their accounting colleagues.30

I M P R O V I N G S E R V I C E S E C T O R P R O D U C T I V I T Y : T H E E C O N O M I C I M P E R A T I V E
126
S E C T I O N 5 . 1
countries.35 Government should not create barriers that would prevent this two-way services trade from operating. The messaging used by government in relation to off-shoring and automation will also be key to avoid protectionism and cries of Australian job losses.
Accounting practices provide a vital economic benefit to business and consumers. The past few years have seen an increasing level of regulatory complexity and burden in Australia. Increased financial and compliance costs ultimately reduce productivity, competition and the delivery of affordable, high quality services to the public. With the accounting sector rapidly transforming, existing business models changing and becoming more complex, and new business models emerging, it is reasonable to expect that new regulations will continue to be introduced.
Government needs to simplify and streamline regulatory settings, and take a holistic approach to ensure that increasing regulatory complexity and burden does not drive accounting practices out of the market.
Government should also examine the extent to which the present regulatory settings unnecessarily encumber technology uptake. For example, these could include pru-dential, corporate, taxation, financial advice and auditor regulations. They will need to be proactive in adjusting settings in response to new business models and to seize the opportunities presented by new technologies.36 Regulators will also need to work collaboratively with organisations to ensure the adoption of new technologies creates opportunities for them to work more productively, while maintaining the necessary levels of supervision and oversight.
Consideration will also need to be given to regional issues. Accountants provide valu-able services to our rural and regional communities. While these communities are facing the same productivity challenges as their city dwelling counterparts, the solu-tions offered by government may not be as varied or flexible. Government will need to consider how to boost regional economic development through investment, increased migration and by considering innovative policies.37
Digital government and reducing red tape
The digitalisation of forms and information has largely been achieved. The Etax and myGov initiatives have significantly reduced the personal tax filing burden for individu-als and tax agents. Continuity and expansion of these initiatives is important for the future. However, more difficult decisions will need to be made in order to: improve online systems and service quality; address growing cybersecurity and data privacy risks; achieve greater efficiencies in public service delivery; and increase compliance cost savings to citizens and businesses.
Better information sharing between governments, along with appropriate privacy safe-guards, is needed. The reporting obligations of organisations to government can be reduced by enabling them to report their information once with multiple government departments accessing that single source.
Greater alignment of common definitions and terminology (such as employment and small business) across all relevant legislation will be needed. Terms have the potential to be used inconsistently in reporting requirements in Australia’s state, territory and federal legislation. For example, there are more than 136 unique terms to describe the information subject to audit, and 101 unique descriptions of the auditor and his or her qualification. This may result in confusion and leads to additional business costs.38

I M P R O V I N G S E R V I C E S E C T O R P R O D U C T I V I T Y : T H E E C O N O M I C I M P E R A T I V E
127
S E C T I O N 5 . 1
Conclusion
“ The secret of success is not in predicting the future, it’s about creating people who can
thrive in a future that cannot be predicted.”39
The accounting industry is being shaped by major global and local trends and these are already transforming the way accountants work. These megatrends create opportunities to significantly improve productivity for the sector. A key challenge for accounting firms and finance functions will be to identify their future value proposition and transform so they remain valued by business, government and the community.
While technical skills will remain important, there will be increased focus on higher value work to provide greater critical insight and strong relationship building. Dealing with the uncertainty of the future requires a unique mindset. Organisations will need to seek and retain employees who can demonstrate strategic thinking, business acumen and leadership capabilities and contribute to a diverse and inclusive workplace.
Fundamental changes are likely to be needed to many operating models to embrace the opportunities of new technologies and maximise the outputs and efficiencies of highly skilled employees. Regulatory settings need to enable organisations to operate in the most efficient way. And education institutions will need to prepare the future workforce for the new ways of working. Productivity increases in the accounting sector can also have a positive effect on other sectors of the economy, multiplying the impact.
Accountants will still be accountants in the future. But the work they perform will con-tinue to evolve, as it has done in the past, to meet the future needs of businesses and the communities in which they operate.
Endnotes
1 Australian Government, Department of Employment November 2015, “Professional, Scientific and Technical Services – Australian Jobs 2016” accessed at https://australianjobs.employment.gov.au/jobs-industry/professional-scientific-and-technical-services, 20 February 2017
2 Australian Government, “Job Outlook –Accountants” accessed at http://joboutlook.gov.au/pdf.aspx?pdf=2211, 20 February 2017
3 Australian Bureau of Statistics, 5260.0.55.002 - Estimates of Industry Multifactor Productivity, 2014-15’ accessed at http://www.abs.gov.au/AUSSTATS/[email protected]/Previousproducts/5260.0.55.002Main%20Features12014-15?opendocument&tabname=Summary&prodno=5260.0.55.002&issue=2014-15&num=&view, 20 February 2017
4 edited by Evans, E., Burritt, R. and Guthrie, J. 2015 Future Proofing the Profession: Preparing Business Leaders and Finance Professionals for 2025, Chartered Accountants Australia and New Zealand p5
5 ibid p5
6 Roos G. 2015 “Technology-driven Productivity Improvements in the Professional Services Industry” Future Proofing the Profession: Preparing Business Leaders and Finance Professionals for 2025, Chartered Accountants Australia and New Zealand p42
7 Dawson R 2015 “what is the future of work” Future Proofing the Profession: Preparing Business Leaders and Finance Professionals for 2025, Chartered Accountants Australia and New Zealand p27
8 Chartered Accountants Australia and New Zealand 2016 The Future of Work: How can we adapt to survive and thrive? p56
9 ACCA, 2016, Drivers of change and future skills accessed at http://www.accaglobal.com/content/dam/ACCA_Global/Technical/Future/pi-highlights-professional-accountants-the-future.pdf p5 21 February 2017
10 Roos G. 2015 “Technology-driven Productivity Improvements in the Professional Services Industry” Future Proofing the Profession: Preparing Business Leaders and Finance Professionals for 2025, Chartered Accountants Australia and New Zealand p42
11 ibid p43
12 Watson, A, 2017 “Xero founder Rod Drury on AI and the future of accounting” Acuity Magazine accessed at https://www.acuitymag.com/technology/xero-founder-rod-drury-on-accounting-and-artificial-intelligence 21 February 2017
13 Chartered Accountants Australia and New Zealand 2017 The future of blockchain: The application and implications of distributed ledger technology p15
14 Ibid p18

I M P R O V I N G S E R V I C E S E C T O R P R O D U C T I V I T Y : T H E E C O N O M I C I M P E R A T I V E
128
S E C T I O N 5 . 1
15 Chartered Accountants Australia and New Zealand 2017 The future of blockchain: The application and implications of distributed ledger technology p27 and Eyers, J. (2016) ‘CBA blockchain deal creates the future of trade finance’, Australian Financial Review, accessed at http://www.afr.com/technology/cba-blockchain-deal-creates-the-future-of-trade-finance-20161021-gs7w98 20 February 2017
16 ibid p37
17 Chartered Accountants Australia and New Zealand 2016 Business briefing – will offshoring and outsourcing be effective for your organisation? p5
18 Chartered Accountants Australia and New Zealand 2016 What is the future for offshoring? p36
19 ibid p35
20 AICD, 2004, All Eyes on the CFO review accessed at http://www.companydirectors.com.au/director-resource-centre/publications/company-director-magazine/2000-to-2009-back-editions/2004/october/all-eyes-on-the-cfo-aicd-review 28 February 2017
21 ACCA, 2016, Drivers of change and future skills accessed at http://www.accaglobal.com/content/dam/ACCA_Global/Technical/Future/pi-highlights-professional-accountants-the-future.pdf p5 21 February 2017
22 Jones Lang Lasalle, April 2014, Perspectives on Productivity: Corporate Australia p10 accessed at http://www.jll.com.au/australia/en-au/Documents/Marketing%20Collateral/AU-PerspectivesonProductivity-v5.pdf 20 February 2017
23 EY, CFO-CIO: a growing collaboration, 2017 accessed at http://www.ey.com/gl/en/issues/managing-finance/ey-cfo-program-partnering-for-performance-the-cfo-and-cio-a-growing-collaboration 27 February 2017
24 ibid
25 edited by Evans, E., Burritt, R. and Guthrie, J. 2015 Future Proofing the Profession: Preparing Business Leaders and Finance Professionals for 2025, Chartered Accountants Australia and New Zealand p17
26 Dale, J “Preparing Business Leaders and Accountants for Future Financial Leadership. Ibid p89
27 Chartered Accountants Australia and New Zealand 2016 The Future of Work: How can we adapt to survive and thrive? p51
28 Australian Government, ‘Job Outlook –Accountants’ accessed at http://joboutlook.gov.au/occupation.aspx?search=alpha&tab=stats&cluster=&code=2211&graph=GE 21 February 2017
29 Australian Government, Workplace Gender Equality Agency, Employee flexibility toolkit accessed at https://www.wgea.gov.au/sites/default/files/Flexibility_employee_toolkit.pdf 20 February 2017
30 Watson, A, Feb/Mar 2017 “Making it work” Acuity Magazine p37 accessed at http://acuity.realviewdigital.com/#folio=36 20 February 2017
31 Roos G. 2015 “Technology-driven Productivity Improvements in the Professional Services Industry” Future Proofing the Profession: Preparing Business Leaders and Finance Professionals for 2025, Chartered Accountants Australia and New Zealand p47
32 Frank, P, 1947, Einstein: His Life and Times Translated from German by George Rosen, Edited and Revised by Shuichi Kusaka, p185, Published by Alfred A. Knopf, New York. (Verified with scans) accessed at http://quoteinvestigator.com/2016/05/28/not-facts/#note-13710-2 20 February 2017
33 Chartered Accountants Australia and New Zealand 2015 Disruptive technologies, Risks and opportunities. How can New Zealand make the most of them? p45
34 Chartered Accountants Australia and New Zealand 2016 What is the future for offshoring? p7
35 ibid p9
36 Chartered Accountants Australia and New Zealand 2015 Disruptive technologies, Risks and opportunities. How can New Zealand make the most of them? p45
37 ibid p45
38 Chartered Accountants Australia and New Zealand 2016, ‘Australian Financial Reporting Framework Reform’ accessed at https://www.charteredaccountantsanz.com/member-services/technical/reporting/australian-financial-reporting-framework-reform 20 February 2017
39 Chartered Accountants Australia and New Zealand 2016, ‘The Future Auditor’ accessed at https://www.charteredaccountantsanz.com/news-and-analysis/insights/future-inc/the-future-auditor 20 February 2017

129
6.1 Freight transport and logistics services: emerging issues Dr Don Gunasekera Dr Hermione Parsons
6.2 Changed conditions ahead Michele Huey
SECT ION
6.0
Productivity of transport infrastructure and logistics

I M P R O V I N G S E R V I C E S E C T O R P R O D U C T I V I T Y : T H E E C O N O M I C I M P E R A T I V E
130
Dr Don Gunasekera is a Research
Fellow with the Centre for Supply
Chain and Logistics at Deakin
University. He has had wide
research and policy experience
working in a range of organisations
including the Australian Bureau of Agricultural and
Resource Economics, CSIRO, the Productivity Commission,
the National Competition Council, the Department of
Environment and Heritage, the Australian Bureau of
Meteorology and Victoria University. During 2006–09,
Dr Gunasekera was the Chief Economist at the Australian
Bureau of Agricultural and Resource Economics. He has a
PhD in Economics from the Australian National University
and has completed the Senior Managers in Government
Program at Harvard University.
Dr Hermione Parsons is the
Director of the Centre for Supply
Chain and Logistics at Deakin
University and Chairperson of the
Supply Chain Advisory Network
involving businesses representing
each point of the international supply chain. She has more
than 20 years of executive management experience in
public and private sector organisations with responsibility
for: port landside logistics, multimodal infrastructure,
competition, regulation, supply chain reengineering,
perishable food supply chains and industry government
relations. Dr Parsons has led many projects relating to
“whole of supply chain” integration and complexity
nationally and internationally. She has a PhD in Supply
Chain from Monash University.
6.1 Freight transport and logistics
services: emerging issues
Dr Don Gunasekera Dr Hermione Parsons

I M P R O V I N G S E R V I C E S E C T O R P R O D U C T I V I T Y : T H E E C O N O M I C I M P E R A T I V E
131
S E C T I O N 6 . 1
Introduction
The effective operation of domestic and international supply chains is only possible if components and finished goods can be moved to and from production points to the consumer in a predictable and timely manner. An efficient freight transport and logistics services sector “makes the connections” by planning, organising and manag-ing the movement of goods. Freight transport is the physical movement of goods from origin to destination. This process involves four main modes of transport: air, sea, rail and road. Logistics is the systematic organisation of goods and services (often across multiple modes of transport) and involves operational reliance, the creation of effective relationships and the use of essential business tools (for example, information tech-nology, communications, planning, scheduling, booking and optimisation systems) to achieve commercially successful integration of public and private sector operations along a supply chain.
The freight transport and logistics sector, in essence, provides a series of services such as transportation, warehousing, and brokerage, that move goods and establish supply chains across and within borders. This sector is also a part of the broader service sector as it cannot operate without integration with other services such as information technology (IT), finance, marketing, and government regulatory services. The freight transport and logistics services sector is anchored to the fixed and physi-cal network of seaports, airports and other transport modal networks.1 The ability to manage freight transport and logistics processes in today’s domestic and international supply chain and logistics business environment is a critical factor in local, regional and national competitiveness.
The freight transport and logistics services sector has expanded
Most freight enters and leaves Australia through container ports which are located in capital cities. Much of that freight is delivered within the city where it lands or departs. Apart from bulk commodity minerals, most freight is moved by road. Geographically, 20 per cent of road freight (measured in tonne kilometres) occurs within the four capital cities with major container ports –Sydney, Melbourne, Brisbane and Perth (Fremantle). A further 11 per cent is within other urban areas. Around 19 per cent is carried between capital cities. The remaining 50 per cent by volume is freight to or from non-capital cities, and includes minerals and agricultural exports.2
The freight transport and logistics services sector has been expanding; freight volumes have risen considerably over the past two decades and are forecast to double in the next two decades. This has been driven partly by increasing imports and rising freight volumes of commodity exports, particularly minerals.
Population growth and the associated demand for imports over the medium to long term will generate strong pressure both to make best use of the freight transport and logistics services infrastructure base that already exists, and to add to the capacity of that base.3 It is important to recognise that some sections of this base, such as transport infrastructure, particularly for rail and secondary road networks, are already in poor or declining condition.4
The focus of this chapter is on emerging issues related to productivity in the freight transport and logistics services sector in Australia. In the next section, recent trends in some of the key features of the sector are briefly canvassed. This is followed by

I M P R O V I N G S E R V I C E S E C T O R P R O D U C T I V I T Y : T H E E C O N O M I C I M P E R A T I V E
132
S E C T I O N 6 . 1
the importance of the productivity imperative. The productivity experience in the freight transport and logistics services sector is discussed in the next section. After this, the key drivers of productivity growth are discussed. The barriers to productivity enhancement, the related challenges and the way forward are highlighted in the final section.
Recent trends
The freight transport and logistics services sector was estimated to account for 8.6 per cent of GDP in 2013, contributing $131.6 billion to the Australian economy.5
According to the latest ABS 2014 Survey of Road Freight Movements, the estimated total road freight task in 2014 was 195.62 billion tonne kilometres. This comprised of 2.13 billion tonnes of goods uplifted and 17.21 billion freight vehicle kilometres travelled. Intrastate road freight movements accounted for the majority of total road freight movements, with 133 billion tonne kilometres of freight moved intrastate. This included 2.04 billion tonnes of goods uplifted and 14.32 billion freight vehicle kilome-tres travelled.6
The freight transport task to increase considerably over the medium to long term
It was estimated that the total road freight transport task in Australia would increase from around 135.5 billion tonne kilometres in 2000 to 295.4 billion tonne kilometres by 2020, an average annual growth rate of four per cent. The articulated truck task was estimated to grow from around 106 billion tonne kilometres to over 250 billion tonne kilometres over the same period – or by 4.5 per cent per year. Over that period, it has been assumed, based on historical trends, that the average load carried by articulated trucks would increase by 1.64 per cent per year, from around 17.6 tonnes in 2000 to 26.6 tonnes in 2020. The average vehicle kilometres travelled by articulated trucks is also assumed to grow strongly, from 84,000 kilometres per year to 107,000 kilometres per year. These trends imply that the number of articulated trucks required to undertake the freight transport task would increase from 63,000 to 88,700 vehicles by 2020.7,8
It is estimated that the overall domestic freight transport task in Australia has grown by 50 per cent over the past decade and is forecast to grow by another 26 per cent in the coming decade.9 Furthermore, growth in Australia’s freight transport task is projected to continue over the next two decades with total domestic freight projected to grow by 80 per cent between 2010 and 2030.10
Some estimates indicate that the freight transport task facing Australia will increase from 503 billion tonne kilometres per year in 2008 to 1540 billion tonne kilometres per year in 2050, a threefold jump.11

I M P R O V I N G S E R V I C E S E C T O R P R O D U C T I V I T Y : T H E E C O N O M I C I M P E R A T I V E
133
S E C T I O N 6 . 1
The productivity imperative
Increasing urbanisation and population growth accompanied by growth in the freight task is expected to impose increasing pressure on Australia’s ports and landside trans-port networks resulting in rising congestion levels and urban encroachment. These constraints tend to hinder the productivity of Australia’s freight transport networks and impose economic, social and environmental costs to industries and communities.
Increasingly, a high level of interoperability and visibility across both modes and juris-dictions in Australia is required to move freight to where it is needed, at the time it is needed, with minimal cost, time and energy consumption, maximum safety and visibility.12
The growing freight transport task and tapering productivity across Australian indus-tries highlight the need to accelerate any cost reductions and efficiencies available to increase productivity in order to remain competitive in highly competitive global markets.
Understanding of productivity drivers to improve operational and policy decision making
The performance of the freight transport and logistics services sector impacts pro-ductivity in other sectors. Freight transport and logistics services are important inputs when measuring productivity across a range of other industries. However, as freight transport and logistics services continue to grow in the Australian economy, it is becoming increasingly important to monitor and assess productivity drivers within the freight transport and logistics services themselves to assist with related operational and policy decisions.
It is important to recognise that productivity in the freight transport and logistics services sector and the productivity improvements will be guided by a range of stake-holders. These include commercial freight transport and logistics operators and freight owners and governments (including the regulators) who make decisions individually or as a group along the relevant supply chains.
Many of the activities of the freight transport and logistics services sector are under-taken by small and medium sized private firms. However, the delivery and the efficiency of the services of the sector depends on government provisions and interventions in a number of domains. For example, private and commercial freight transport and logis-tics firms use publicly funded or regulated infrastructure. International trade of goods is processed by public sector border control agencies. Freight transport and logistics services are regulated with fiscal, environmental, safety, land use and competition objectives.
Better understanding and assessing of the role of productivity drivers such as regu-latory changes, technological advances, changes to management practices and investment initiatives in the freight transport and logistics services sector can help identify and encourage relevant actions and reforms to improving productivity in the sector. For example, this may involve private sector firms choosing whether to invest in networks or upgrade freight transport infrastructure, or freight transport and logistics operators deciding whether to upgrade their vehicle fleets or retrofit their existing fleet with new technology based on current and expected growth.13

I M P R O V I N G S E R V I C E S E C T O R P R O D U C T I V I T Y : T H E E C O N O M I C I M P E R A T I V E
134
S E C T I O N 6 . 1
Productivity experience
Productivity in the freight transport and logistics services sector relates to the efficiency of transforming inputs such as warehouses, storage facilities, distribution centres, freight transport vehicles and related equipment and employees (by volume of hours worked or the value of those worked hours, i.e. wages) into the delivery of services that results from the operational processes along the supply chains.
There are no specific estimates of productivity available for the freight transport and logistics services sector. However, the closest approximation comes from productiv-ity growth estimates for transport, postal and warehousing industries published by the Australian Bureau of Statistics (ABS).14 Although the aggregated nature of these estimates is a limitation, they provide broad insights into the nature of productivity patterns in the sector as a whole.
Heavy vehicle productivity has increased over the past several decades
During the past three decades, the road freight task in Australia has increased six-fold. Over the same period total kilometres travelled by commercial vehicles has increased only three-fold. This implies a near two-fold increase in average heavy vehicle produc-tivity. This implied rise in heavy vehicle productivity is due to several factors. These include relaxation of heavy vehicle mass and dimension regulations, and permitting larger, more productive vehicles wider access to the road network. In particular, the availability and use of larger heavy vehicle configurations – such as six-axle articulated trucks, (introduced in the 1970s) and B-doubles (introduced in the late 1980s) – with higher mass carrying capacity has facilitated both rapid growth in the articulated truck freight task and the transfer of freight from smaller to larger articulated trucks.15
Table 1 provides key measures of productivity growth in the freight transport and logis-tics sector based on ABS estimates for the recent six productivity cycles.16 These include gross value added (GVA), hours of work (unadjusted), capital services, labour productivity, capital productivity and multifactor productivity (MFP). Table 1 contains information on annual average changes from 1985–86 to 2015–16. It is important to
Element Productivity growth cycles Mean
From 1985–86 1988–89 1993–94 1998–99 2003–04 2007–08 1985–86
To 1988–89 1993–94 1998–99 2003–04 2007–08 2015–16 2015–16
Gross value added (GVA) 3.6 2.3 4.6 4.0 5.0 1.5 3.5
Hours of work (unadjusted) 0.9 0.3 2.7 1.1 3.1 1.2 1.6
Capital services 3.7 2.4 2.2 4.1 6.3 4.1 3.8
Labour productivity 2.8 2.1 1.9 2.9 1.9 0.1 2.0
Capital productivity –0.1 –0.1 2.3 –0.1 –1.2 –2.4 –0.3
Multifactor productivity (MFP) 1.6 1.3 2.1 1.8 0.7 –0.9 1.1
Source: ABS (2016)
TABLE 1 AVERAGE ANNUAL GROWTH IN PRODUCTIVITY MEASURES OF AUSTRALIA’S FREIGHT TRANSPORT AND LOGISTICS SECTOR, 1985–2016 (PER CENT)

I M P R O V I N G S E R V I C E S E C T O R P R O D U C T I V I T Y : T H E E C O N O M I C I M P E R A T I V E
135
S E C T I O N 6 . 1
recognise that these estimates relate to the transport, postal and warehousing indus-try category of the ABS Australian and New Zealand Standard Industry Classification (ANZSIC). This ABS industry category covers road, rail and air transport, postal, and courier pick-up and delivery services, transport support services and warehousing and storage services. It is assumed here that the estimates presented in Table 1 largely correspond to that of the freight transport and logistics services sector.
Gross value added has grown steadily
Gross value added (GVA) by the freight transport and logistics sector grew at 3.5 per cent per year from 1985–86 to 2015–16, with relatively higher GVA growth recorded during 1993–94 to 1998–99, 1998–99 to 2003–04 and 2003–04 to 2007–08 periods.
Growth in hours worked in the sector has varied
Hours of work undertaken in the freight transport and logistics sector have grown at 1.6 per cent per year during the 1985–86 to 2015–16. In 1993–94 to 1998–99 and 2003–04 to 2007–08 periods, the rate of growth of the number of hours worked in the sector has been comparatively high at 2.7 per cent and 3.1 per cent respectively.
The annual growth in hours worked in the sector was particularly low in the 1985–86 to 1988–89 and 1988–89 to 1993–94 productivity cycles (0.9 per cent and 0.3 per cent respectively), which lowered the average for the whole period.
Growth in productive capital has risen considerably
Productive capital in the freight transport and logistics sector has grown at 3.8 per cent over 1985–86 to 2015–16. In more recent years, growth in productive capital has increased considerably – from 3.7 per cent, 2.4 per cent and 2.2 per cent for the first three productivity cycles to 1998–99, and then approximately doubling to 4.1 per cent, 6.3 per cent and 4.1 per cent for more recent cycles.
Labour productivity growth has been volatile across productivity cycles
Labour productivity in the freight transport and logistics sector has grown slowly over the period 1985–86 to 2015–16. Labour productivity increased by about two per cent per year over this period.
Growth in labour productivity in the sector has been slowing in recent productivity cycles. Labour productivity growth in the freight transport and logistics sector has been fairly volatile across productivity cycles, but one per cent per year in the most recent productivity cycle is the lowest of the past six cycles (see Table 1) and is a somewhat steeper decline from the preceding cycle.
Growth in capital productivity has fallen
Capital productivity has declined by an average of 0.3 per cent per year between 1985–86 to 2015–16 in the freight transport and logistics sector. Changes in the growth of capital productivity in the sector have been quite volatile, often close to zero, however, rising at 2.3 per cent per year in the 1993–94 to 1998–99 productivity cycle and falling to -2.4 per cent per year in the most recent cycle.

I M P R O V I N G S E R V I C E S E C T O R P R O D U C T I V I T Y : T H E E C O N O M I C I M P E R A T I V E
136
S E C T I O N 6 . 1
Growth in multifactor productivity has slowed down recently
Over the period 1985–86 to 2015–16, multifactor productivity grew by an average of 1.1 per cent per year. Multifactor productivity in the sector has declined in the three most recent productivity cycles. Relative growth of MFP in the freight transport and logistics sector has declined sharply during the current productivity cycle, falling to -0.9 per cent per year, well below the long-term average of 1.1 per cent.
One of the reasons for MFP slowing in recent productivity cycles is likely to be capital deepening, which reflects the rise in the amount of capital available per worker. As shown in Table 1, the growth in the amount of capital available has risen considerably over the recent productivity cycles. This has coincided with the substantial increases in public road and rail investment since 2007–08. Another likely reason for the recent slowdown in MFP in the transport and logistics sector is the slowdown in labour pro-ductivity in recent productivity cycles. Revisions by the ABS to the statistical series have reduced the volatility of productivity measures and smoothed the recent decline in MFP. Better prioritising of public infrastructure investment is a key area where mea-sures to improve transport productivity has been suggested.17,18,19
The Logistics Performance Index (LPI), estimated by the World Bank, is one of the internationally compared indicators of logistics and transport performance which provide assessments of a wide range of countries including Australia.20
LPI summarises the performance of countries through six components that capture the most important aspects of the logistics environment.
These components include:
Customs: efficiency of the customs clearance process;
Infrastructure: quality of trade and transport-related infrastructure;
International shipments: ease of arranging competitively priced shipments;
Logistics quality: competence and quality of logistics services;
Tracking and tracing: ability to track and trace consignments; and
Timeliness: frequency with which shipments reach the consignee within the sched-uled or expected time.
The performance score is evaluated using a five-point scale where one is the lowest score and five is the highest score. LPI scores are presented with 80 per cent con-fidence intervals.21 The overall LPI is aggregated as a weighted average of the six components of logistics performance.22
International comparisons indicate room for improvement
In 2016, out of 160 countries Australia was ranked 19 with an overall LPI score of 3.79. Australia is also within the top LPI quintile of countries. The performance of border agencies and infrastructure is the lowest among all quintiles of countries includ-ing Australia.23 The quality of logistics services tends to be lower than the general performance across all quintiles of countries in 2016.24
Figure 1 presents Australia’s overall LPI scores with confidence intervals from 2007 to 2016, and a weighted average across 2010, 2012, 2014, and 2016 scores. The overall score is based on the scores of the six LPI components shown in Figure 2. The weights used in each year’s scores in each component include: 6.7 per cent for 2010, 13.3 per cent for 2012, 26.7 per cent for 2014, and 53.3 per cent for 2016. In this way, the most recent data carry the highest weight.25

I M P R O V I N G S E R V I C E S E C T O R P R O D U C T I V I T Y : T H E E C O N O M I C I M P E R A T I V E
137
FIGURE 2 AUSTRALIA’S LPI COMPONENT SCORES, 2007–16
Source: Arvis et al (2016)
S E C T I O N 6 . 1
FIGURE 1 AUSTRALIA’S OVERALL LPI SCORE (WITH LOWER AND UPPER BOUNDS), 2007–16
Source: Arvis et al (2016)
Note: the weighted average for 2010–2016 = 3.93.
3.50
3.55
3.60
3.65
3.70
3.75
3.80
3.85
3.90
3.95
4.00
LPI score
Upper boundMiddle bound Lower bound
20162014201220102007
3.88
3.70
3.79
3.95
3.73
3.843.82
3.63
3.73
3.88
3.74
3.81
4.00
3.58
3.79
Customs Infrastructure International shipments
Logistic competence Tracking and tracing Timeliness
Mean LPI Score for 2010–16
2014 2016201220102007
3.58
3.76 3.77 3.75 3.75
3.65
3.783.83
4
3.823.72
3.78
3.4
3.523.633.6
3.85
3.54
2014 2016201220102007 2014 2016201220102007
2014 2016201220102007 2014 2016201220102007 2014 2016201220102007
3.0
3.2
3.4
3.6
3.8
4.0
4.2
4.4
3.0
3.2
3.4
3.6
3.8
4.0
4.2
4.4
3.68
3.873.97
3.873.79 3.81
3.87
4.1
4.16
4.054 4.04
3.84
4.06
3.58
3.86
3.70
3.79

I M P R O V I N G S E R V I C E S E C T O R P R O D U C T I V I T Y : T H E E C O N O M I C I M P E R A T I V E
138
S E C T I O N 6 . 1
Over the past decade, the overall LPI of Australia has remained broadly unchanged with the average score varying between 3.73 and 3.84, and a weighted average of 3.93 (across 2010, 2012, 2014, and 2016 periods). These figures and Australia’s LPI rankings when compared to those of several other countries (see Table 2) show that there is considerable scope for improvement. Australia’s overall LPI scores and ranking is well below that of comparable countries such as Canada, the UK and Japan (see Table 3). There are several areas – including competence and quality of logistics services and the ability to track and trace consignments – where Australia was ranked low relative to other comparable countries. In order to remain globally competitive, improvements are urgently required in these essential areas.
Year LPI Customs Infrastructure International shipments
Logistics competence
Tracking and tracing
Timeliness
2016 19 22 18 21 17 19 21
2014 16 9 12 18 17 16 26
2012 18 16 18 28 16 19 17
2010 18 14 18 3 17 20 18
2007 17 17 20 12 19 12 20
Source: Arvis et al (2016)
TABLE 2 AUSTRALIA’S LOGISTICS PERFORMANCE, 2007–16 (RANK-WISE)
Year Australia Canada UK Japan South Korea
2016 19 14 8 12 24
2014 16 12 4 10 21
2012 18 14 10 8 21
2010 18 14 8 7 23
2007 17 10 9 6 25
Source: Arvis et al (2016)
TABLE 3 LOGISTICS PERFORMANCE OF AUSTRALIA, CANADA, UK, JAPAN AND SOUTH KOREA, 2007–16 (RANK-WISE)

I M P R O V I N G S E R V I C E S E C T O R P R O D U C T I V I T Y : T H E E C O N O M I C I M P E R A T I V E
139
S E C T I O N 6 . 1
Drivers of productivity growth
Technological advances, changes to management practices (including skills and com-petency levels) and appropriate regulatory changes are likely to be key productivity drivers in the freight transport and logistics services sector.
The increasing need to embrace technological innovations
Technological innovations relating to the freight transport and logistics services sector are wide ranging. They can range from intermodal visibility and traceability data use systems (for example, relating to data collected from on-board systems such as radio-frequency identification (RFID), other radio frequency tracking tags, barcodes), interoperability of cloud/web services, driverless trucks and other vehicles, automa-tion, smart infrastructure in the form of digital technologies to road-mounted cameras and sensors. Innovations such as drone technology and robotics are now entering into the sector. Some predictions indicate that wide scale use of driverless truck technol-ogy in Australia will be implemented within a decade.26
The continuing growth in digital business activities and e-commerce has raised the importance of visibility and traceability of the movement of goods. However, there is lack of visibility and traceability in freight transport and logistics management along many supply chains.
Inconsistency and non-uniformity in relation to messaging of cargo and container data and lack of interoperability of IT systems between the relevant freight transport and logistics services across supply chains can lead to inefficiencies and productivity losses. Intermodal visibility and supply chain traceability using technologies that rely on uniform and consistent data messaging play a key beneficial role. They enable the use of uniform data and information standards to associate a cargo item with a transport asset (such as pallet, container, ship, truck) in a supply chain event (for example, truck/train arrival, truck loading) in real time across supply chains. This can enable productiv-ity improvements in the freight transport and logistics sector.
Use of relevant and appropriate information and communications technology (ICT) enables firms to share and integrate information across their supply chain by linking electronic applications. Freight transport and logistics assets such as vehicles, con-tainers or pallets can be tracked and associated with the freight occupying the asset, the location and the current operational status. Multiple attributes such as weight, temperature and inspection data can be associated with the vehicle, container, pallet as well as to the individual items of freight, providing assurance for customers. These functions help improve productivity in the sector by accelerating any cost reductions and efficiencies available, in order to remain competitive.
There is evidence that application of IT-enabled freight transport and logistics in trading firms can result in improvement in cost performance. The IT application can either directly or indirectly result in more revenues, lower administration costs, better asset utilisation at a lower cost and more customer satisfaction.27,28 Major global logistics firms and retailers now rely on complex and integrated IT systems to remain competi-tive in international markets.
Local freight transport and logistics firms too are gradually realising the use of digital devices, sensors and data methods to connect networks – linking the physical environ-ment to collect data and turn them into useful information. Growth of these analytics will help increase product and event visibility, traceability as well as risk management and agility along increasingly complex supply chains.

I M P R O V I N G S E R V I C E S E C T O R P R O D U C T I V I T Y : T H E E C O N O M I C I M P E R A T I V E
140
S E C T I O N 6 . 1
Recent case study analysis of enhanced visibility technologies in the Australian freight transport and logistics sector has shown that the dynamic capabilities of service providers can be enhanced through improved planning, reduced turnaround times at cargo delivery and pick up points, and reduced cargo delivery in full on time (DIFOT) failures. This analysis has also indicated that the productivity “penalty” extrapolated for small-to-medium enterprises (SMEs) in the freight transport and logistics sector due to inability to integrate incompatible data visibility formats in Australia is around $1.6 billion; whereas the cost to integrate to a common standard using enhanced visibility technologies is estimated at one-quarter of that figure, or $407.5 million, to deliver tangible benefits.29
Growing requirement to improve the skills and competency levels of the workforce
Transporting, storing, and handling goods are labour-intensive activities. The availabil-ity of skilled staff is thus an important determinant of productivity performance. In this context, at least four operational categories of personnel have been discussed in the literature. These include: operations staff such as truck drivers or warehouse pickers; administrative staff such as logistics /distribution planners, expediters or warehouse clerks; logistics supervisors such as warehouse shift leaders or logistics/distribution controllers; and logistics managers such as those responsible for transport, ware-housing operations or supply chain management.30 Qualified staff in these categories are generally scarce, yet demand for them is growing rapidly in larger businesses. This issue is particularly prevalent in SMEs, which account for the majority of the employ-ment in the freight transport and logistics sector in Australia. These constraints will have a bearing on the productivity of freight transport and logistics operations and the quality of the services, and the gap in this area between SMEs and corporate logistics providers is growing.
During the period June 2011 to June 2015, there were 84,545 firms in the transport and logistics sector in Australia with 97.9 per cent small, 1.9 per cent medium and 0.2 per cent large businesses. The transport and logistics sector employs around 485,000 people across occupations including transport, warehousing, logistics, storage, han-dling and distribution.31 With the increasing changes to the nature of activities in the sector including the adoption of e-commerce and other digital trading platforms along the supply chains, there is a growing need for upskilling workers to adapt to evolving technology and systems.
There is a recognition that even high-quality hard infrastructure is unable to substitute or replace operational excellence, which is based on the professional skills and com-petency levels of service providers, well-functioning soft infrastructure, and efficient business and administrative processes.32
One of the challenges for freight transport and logistics operators in the context of supply chain management is to undertake a range of activities to cope with the links between a large geographic area or market (with complex supply chains involving a large set of suppliers) and a small number of sites/locations (warehouses, factories, or shops) where time of delivery is of key importance. The management of this complex interaction of space, scale and time calls for skilled firms and, in particular, those able to manage and apply space-scale-time sensitive technologies including the emerging digital and information platforms. Although ICT is critical in all types of freight transport and logistics links, it plays a more central role as the tasks involve high levels of inter-firm coordination across many origins and destinations.33

I M P R O V I N G S E R V I C E S E C T O R P R O D U C T I V I T Y : T H E E C O N O M I C I M P E R A T I V E
141
S E C T I O N 6 . 1
Increasing uptake of technology is driving the requirement for higher order skills in the sector, as well as new skills such as those needed for maintenance and programming of automated equipment. Computerisation and automation have altered the nature of work in the freight transport and logistics services sector. Specialised and higher-level computer skills, problem-solving and analytic skills, and more sophisticated contract management practices are driving a more integrated approach to freight transport and logistics management.34
Disruptive technologies (for example, drone parcel delivery; automation, robotics, Uber and other service platforms) and the internet of things (for example, digital devices, sensors and data methods that connect networks) will have an effect on the freight transport and logistics workforce, driving demand for new skill sets to effectively manage and operate within changing environments.35 In this operating environment, firms need their workforce to be agile and responsive to meet the skills demands created by new technologies, automation and other innovations as they evolve.36 Raising skills and competency levels in the freight transport and logistics services sector is a major challenge that requires attention both by the industry and governments.
Appropriate regulatory changes will help boost productivity
The current regulatory arrangements in the freight transport and logistics services sector mainly focus on promoting safety, asset protection and fair market competi-tion.37 Regulatory changes in the freight sector could generally affect the workforce. For example, fatigue management in the sector may require firms to upskill or retrain workers to meet these requirements. Australia’s preparedness for global system changes (such as adoption of global data standards for cargo and goods) is also critical as firms don’t want to be hindered by regulatory barriers that stop competi-tion beyond Australia’s borders. Harmonisation between international and domestic regulatory arrangements in the freight transport and logistics services will be critical.38
It is expected that electronic work diaries (EWDs) will contribute to a reduction in heavy vehicle crashes, due to better management of driver fatigue and compliance with fatigue rules. In particular, EWDs will enhance compliance and improve safety in several ways: improved data accuracy and transparency to drivers, transport operators and authorised officers; provision of real time data which enables transport operators to respond immediately to actual breaches and monitor performance over time; and in-vehicle driver information, which enables drivers to plan their work and rest and take action when alerted to an imminent or actual breach. According to the National Heavy Vehicle Regulator, EWDs will be introduced in 2017 as a voluntary alternative to written work diaries.39

I M P R O V I N G S E R V I C E S E C T O R P R O D U C T I V I T Y : T H E E C O N O M I C I M P E R A T I V E
142
S E C T I O N 6 . 1
Key challenges and the way forward
Addressing the barriers to technology uptake is a challenge
As indicated earlier, technology as a key driver can help enhance the productivity in the freight transport and logistics services sector by providing real-time visibility, effi-cient data exchange, and greater flexibility to respond to unexpected changes along supply chains. However, the uptake of recent ICT related technological advances in the freight transport and logistics sector has been low. This can be due to user-related, technology-related, and policy-related barriers.40
The user-related barriers comprise of economic, operational and managerial bar-riers. They relate to a firm’s operating environment. The size of the firm plays a major role in the level of ICT implementation. For example, SMEs are more likely to have constraints on financial, human resources and ICT expertise. This could result in a greater likelihood of being less able to “afford” appropriate solutions by SMEs compared to larger firms. The economic and financial factors are another barrier, including considerable investment requirements, the implementation costs, managing and maintenance costs, as well as the unfavourable financial conditions of relevant firms. Operation-related constraints include human capital issues such as difficulty in employing qualified personnel, lack of ICT specialists and personnel skill shortage to operate new applications, as well as insufficient ICT-oriented training and educational activities. SMEs may suffer disproportionately from these types of barriers. Managerial constraints may relate to the uncertainty of commercial success with regard to ICT applications, including a lack of knowledge on payback period and unclear returns on investment, unfamiliarity with the commercially available ICT applications and difficulty in quantifying the potential benefits of ICT applications.41
The technology-related constraints prevent firms making full use of ICT applications, including issues such as interoperability of systems, ICT integration, standardisation, security and data protection.42
The ageing workforce, and attracting and retaining suitably skilled staff are major challenges
Given the limited uptake of technological innovations, there are several challenges for workforce development including skills and competency upgrading in the freight trans-port and logistics services sector. These include an ageing demographic; low levels of recruitment of young people; current and emerging skills shortages; globalisation of the labour market; and low levels of innovation. There are concerns about attracting staff with the right mix and levels of skills; retaining staff; and achieving productivity improvements with current staff and current skill levels.43
At present, the freight transport and logistics services sector faces a recruitment chal-lenge. Attracting, training and retaining young workers to undertake a career in the freight transport and logistics services sector is proving to be a challenge. Increasing use of sub-contracting and labour hire, and other forms of employment engagement within the sector is compounding this issue.

I M P R O V I N G S E R V I C E S E C T O R P R O D U C T I V I T Y : T H E E C O N O M I C I M P E R A T I V E
143
S E C T I O N 6 . 1
A more diverse workforce will benefit the sector
In relation to skills and competency upgrading in the freight transport and logistics sector, better understanding the skills gaps within the sector and then skilling the workforce in preparation for emerging changes will be an essential part of workforce planning. Firms will also need high quality training that allows for flexibility in training options. Strategies to attract different sections of the broader community (including more females and young people, and people from culturally and linguistically diverse groups) in the freight transport and logistics workforce would benefit in this regard.44
The authors wish to thank Rose Elphick-Darling, Rodney Maddock and Michael Smith
for their useful comments and suggestions on earlier drafts of this paper. Assistance of
Waseem Khan and Varuni Jayasooriya is also gratefully acknowledged.
Endnotes
1 O’Connor, K, Derudder, B & Witlox, F 2016, “Logistics Services: Global Functions and Global Cities”, Growth and Change, vol. 47, no. 4, pp. 481-496.
2 Terrill, M Emslie, O & Coates, B 2016, Roads to riches: better transport investment, Grattan Institute, Melbourne, ISBN: 978-1-925015-84-3
3 Ibid, p. 24
4 Infrastructure Australia 2016, Australian Infrastructure Plan, Australian Government, accessed at http://infrastructureaustralia.gov.au/policypublications/publications/files/Australian_Infrastructure_Plan.pdf, 30 December.
5 Transport and Logistics Industry Skills Council Ltd 2015, Connecting Australia – Transport and Logistics, Canberra.
6 Bureau of Infrastructure, Transport and Regional Economics 2014, BITRE STATISTICAL ALERT – Road Freight Movement Survey, 2014, Release of ABS Survey of Road Freight Movements, 29 October 2015. accessed at https://bitre.gov.au/statistics/alert/files/stats_brief_road_fms_2014.pdf 30 December.
7 Bureau of Transport and Regional Economics 2002, Greenhouse Emissions Projections, Report 107, AGPS, Canberra
8 Mitchell, D 2010, Heavy vehicle productivity trends and road freight regulation in Australia, Australasian Transport Research Forum 2010 Proceedings, 29 September – 1 October 2010, Canberra, Australia. Publication website: http://www.patrec.org/atrf.aspx
9 National Transport Commission 2016, Who Moves What Where – Freight and Passenger Transport in Australia, Melbourne.
10 Bureau of Infrastructure, Transport and Regional Economics 2014, Freightline 1, 2014.
11 PricewaterhouseCoopers 2009, Meeting the 2050 Freight Challenge, Sydney.
12 National Transport Commission 2016, National Land Transport Productivity Framework Issues Paper, August.
13 Ibid, p. 8
14 Transport and Logistics Industry Skills Council Ltd 2013, Productivity and Productivity Growth in the Australian Transport and Logistics Industries, June, accessed at http://tlisc.org.au/wp-content/uploads/2014/04/Productivity-Report-read-view.pdf 30 December.
15 Mitchell, D, op cit, p. 1.
16 ABS (Australian Bureau of Statistics) 2016, Cat. No.5204 and 5260, (5260.0.55.002 - Estimates of Industry Multifactor Productivity, 2015–16.
17 ABS 2015, 5260.0.55.002 Estimates of Industry Multifactor Productivity, Australia, accessed at http://www.abs.gov.au/ausstats/[email protected]/mf/5260.0.55.002 30 December.
18 National Transport Commission, op cit, p 9.
19 Bureau of Infrastructure, Transport and Regional Economics 2014, Information Sheet 55 – Infrastructure, Transport and Productivity, Canberra.
20 In the international questionnaire, respondents evaluate six core components of logistics performance in up to eight of their main overseas partner countries. In the domestic questionnaire, respondents are asked to provide qualitative and quantitative data on the logistics environment in the country in which they work.
21 The LPI uses standard statistical techniques to aggregate the data into a single indicator. The statistical aggregation produces an overall LPI index that is close to the simple average of country scores across the six LPI components. To account for the sampling error created by the LPI’s survey-based dataset, LPI scores are presented with approximate 80 per cent confidence intervals. These intervals yield upper and lower bounds for a country’s LPI score and rank.
22 Arvis, J-F, Saslavsky, D, Ojala, L, Shepherd, B, Busch, C, Raj. A & Naula, T 2016, Connecting to compete 2016: Trade logistics in the global economy: the logistics performance index and its indicators. The World Bank. accessed at https://wb-lpi-media.s3.amazonaws.com/LPI_Report_2016.pdf 30 December.
23 Ibid, p. 9.
24 Ibid, p. 12.
25 Ibid, p. 51
26 In Australia, self-driving trucks are closer than you think. 2016. accessed at https://www.allianz.com.au/carinsurance/news/in-australia-selfdriving-trucks-are-closer-than-you-think 30 December.

I M P R O V I N G S E R V I C E S E C T O R P R O D U C T I V I T Y : T H E E C O N O M I C I M P E R A T I V E
144
S E C T I O N 6 . 1
27 Wong, C. W. Y, Lai, K-H & Teo, T S H 2009, ‘Institutional Pressures and Mindful IT Management: The Case of a Container Terminal in China’, Information & Management, vol. 46, no. 8, pp. 434-41.
28 Tongzon, J, Chang, Y-T. & Lee, S-Y 2009, ‘How Supply Chain Oriented in the Port Sector?’, International Journal of Production Economics, vol. 122, no. 1, pp. 21-34.
29 Elphick-Darling, R, Gunasekera, D & Ghalebeigi, A 2017, Investigating the potential benefits of enhanced end to end supply chain visibility, Austroads, ISBN 978-1-925451-57-3
30 Arvis et al, op cit, p. 33.
31 Australian Industry Standards Ltd 2016, Transport and Logistics Workplan, Training Product Review Plan 2016-17 – 2019-20, accessed at http://www.australianindustrystandards.org.au/wp-content/uploads/2016/08/20160929_TLI_Workplan_Web.pdf 30 December.
32 Arvis et al, op cit, p. 3.
33 O’Connor et al, op cit, pp. 484-485.
34 Ibid, p. 4
35 Ibid, p. 9
36 Ibid, p. 15
37 National Transport Commission, op cit, p. 5
38 Ibid, p. 10
39 National Heavy Vehicle Regulator 2017, A voluntary alternative to the written work diary, accessed at https://www.nhvr.gov.au/safety-accreditation-compliance/fatigue-management/electronic-work-diaries-ewds 10 February.
40 Harris, I, Wang, Y & Wang, H 2015, ‘ICT in multimodal transport and technological trends: Unleashing potential for the future’, International Journal of Production Economics, vol. 159, pp 88-103.
41 Ibid, p. 93
42 Ibid, p. 94
43 Morris, J & Kazalac, L 2009, Addressing workforce issues in the road freight sector, Paper presented at the 32nd Australian Transport Research Forum, accessed at http://atrf.info/papers/2009/2009_Morris_Kazalac.pdf 30 December.
44 Australian Industry Standards Ltd, op cit, p. 15.

I M P R O V I N G S E R V I C E S E C T O R P R O D U C T I V I T Y : T H E E C O N O M I C I M P E R A T I V E
145
Michele Huey joined Transurban, Australia’s
largest publicly listed infrastructure company,
in January 2015 as Group General Manager –
Strategy, responsible for the company’s
long-term strategy, sustainability and network
planning and traffic modelling to support its
motorway networks across Australia and the US. Previously, she was
Group Head of Procurement and Group Head of Transformation at
Lend Lease Corporation, where she was responsible for establishing
and executing a global business transformation program and driving
industry-leading procurement and supply chain practices across the
infrastructure and property sectors. Prior to this, Ms Huey was a
Principal at global management consultancy Booz & Company, where
she led strategy-based business transformation programs.
6.2Changed conditions
ahead
Michele Huey

I M P R O V I N G S E R V I C E S E C T O R P R O D U C T I V I T Y : T H E E C O N O M I C I M P E R A T I V E
146
S E C T I O N 6 . 2
Introduction
As Australia’s labour force has transitioned away from primary industries and into service industries, cities have become increasingly important as powerhouses of the Australian economy.
Today, the vast majority of Australians work in the service sector across household services (including accommodation and food services, education, health, recreation and other services), business services (information technology, media and communi-cation, finance, real estate services, professional services and administrative services), and public administration. The service sector accounts for about three-quarters of Australia’s GDP and an even larger share of employment.1 These industries have been estimated to account for more than 85 per cent2 of Australia’s labour force and repre-sent jobs that are predominantly based in cities.
As a result, Australia’s cities are growing at a rapid rate. It has been estimated that more than 65 per cent of Australians now live in cities where 80 per cent of jobs are concentrated.3 By 2061, three quarters of the population is expected to live in capital cities.4
While Australia becomes increasingly urbanised, a significant proportion of the popula-tion also commutes daily into the city centre where the majority of service sector jobs are located. Research from industry think tank the Grattan Institute has shown more than half of Australia’s employment growth is occurring less than 10 kilometres from the city centre, but more than half of all population growth is happening in suburbs more than 20 kilometres away.5 The reality is that today, in our biggest cities less than 10 per cent of all jobs can be reached within a 45-minute drive for people living in outer areas.6
Road and public transport networks are straining under the commuter task and general expan-sion in economic activities as our economies grow. Perhaps as a result of cities’ rapid growth, there is a sense that Australia is experiencing an infrastructure deficit, which Infrastructure Partnerships Australia has estimated could be as large as $800 billion.7 Road congestion has been estimated to cost $15 billion each year as we pay the consequence for workers and freight idling in traffic.8 The latest projections put the cost to our economy and living stan-dards at $53 billion by 2031 when our cities will face debilitating congestion levels.9
Governments are well aware of the issues we face relating to increasing congestion and continue to invest heavily in enhancing and expanding transport services. Over the past decade, government spending on new transport infrastructure has been very high by international standards and the highest in Australia’s history (since records were first collected in 1987).10 They are also looking at creating regional hubs or poly-centric cities to help ease the commuter task.
Rural Australia
While road and traffic conditions in Australian
cities are a high-profile and significant concern for
governments, rural communities face significant
issues relating to accessibility and the quality of
road networks. In many rural areas, public transport
services are not regular or non-existent in remote
areas, making roads the dominant or, possibly,
the only mode of transportation. The quality and
accessibility of rural road networks continues to be a
challenge facing Australia.

I M P R O V I N G S E R V I C E S E C T O R P R O D U C T I V I T Y : T H E E C O N O M I C I M P E R A T I V E
147
S E C T I O N 6 . 2
While these measures are expected to address some of the strains, transport demand will likely continue to grow, creating new challenges for our networks. Transurban’s traffic modelling has shown that by 2035 Sydney motorists will spend up to 110 hours a year in traffic on average. While on some of the very worst routes motorists could be spending up to two hours for what is a 40-minute trip outside of peak periods. Importantly, congestion is not limited to road networks. Public transport systems are also experiencing significant variations in passenger numbers during peak and off-peak periods. A focus for government and road operators is ensuring that existing road infrastructure is being optimised and the application of roadside and back-office technologies has played a key role in increasing efficiency of transport networks.
Smart-motorway systems such as variable speed technologies, dynamic lane-use management and variable messaging are examples of the types of technolgies that are being used to improve safety, traffic flow and responsiveness to real-time conditions. For example, in Melbourne, the Monash-CityLink-West Gate corridor incorporates a freeway management system to enhance traffic flow and safety along that corridor. The coordinated ramp metering alone has increased traffic throughput by five to 20 per cent during congested periods.
While new technologies continue to provide opportunities to improve traffic flow without necessarily building more physical roads or adding new lanes, other tech-nologies have emerged that are eroding our traditional funding source in fuel excise. Recent CSIRO modelling highlighted the adoption of fuel-efficient and electronic vehicles as key factors in reducing fuel excise revenues,11 and impacting the amount of funding available to government. For example, every time a 20-year-old sedan is replaced with a late model car, the Federal Government loses approximately $350 of fuel excise per annum due to the improved fuel efficiency of newer model vehicles. In the case of electric cars, no contribution to transport infrastructure is made under the current fuel excise regime. While this is a commendable environmental outcome, it is disastrous for Australia’s existing funding model.
Currently fuel excise represents 57 per cent of all road-related funding.12 Other funding sources include registration and licencing fees, which are collected at the state gov-ernment level. This collection of opaque and indirect fees and charges that comprise Australia’s main sources of road-related revenue are inherently inequitable.
Fuel excise applies a standard rate per litre of fuel consumed, which means that vehicles taking the same road journey are charged differently, depending on their fuel efficiency. While there are exemptions in place for certain vehicle types and condi-tions (such as fuel for off-road driving), essentially motorists with less fuel-efficient and typically older-model vehicles are being charged at a higher rate than those with more fuel-efficient and typically newer vehicles for equivalent usage of the road networks, raising equity concerns for the community as a whole.
Additionally, to compensate for reductions in funding from diminishing fuel excise reve-nues, state governments have progressively increased vehicle registration and licence fees. With charges generally set at fixed rates, existing registration and licence fees also present equity challenges, with infrequent and low-demand motorists subsidising frequent, high-demand motorists.

I M P R O V I N G S E R V I C E S E C T O R P R O D U C T I V I T Y : T H E E C O N O M I C I M P E R A T I V E
148
S E C T I O N 6 . 2
While introducing a sustainable and equitable funding source to meet our infrastructure needs is critical, we must also continue to look for opportunities to use our existing transport infrastructure more efficiently. Workday morning and afternoon peaks extend travel time, reduce journey time predictability and impact productivity and the experi-ence of road users. Outside of peak periods, road networks are under-utilised. These inefficiencies present opportunities for easing congestion (refer Figure 1).
To tackle these issues, we need to reform the way we pay for roads to provide a fair and sustainable system that is built on a principle of those who benefit, pay. This will allow us to invest in and use infrastructure more efficiently and provide an equitable funding stream that is aligned with actual road use.
For many years, road funding reform has been steadily gaining momentum. Nationally significant bodies such as Infrastructure Australia, the Productivity Commission, the Australian Automotive Association and Infrastructure Partnerships Australia among others have all advocated for change. These groups have highlighted Australia’s demographic changes, stretched government budgets, declining fuel excise and the inequity of the current system as worthy triggers for reform. In addition, Infrastructure Australia in its Australian Infrastructure Plan (2016) identified the funding system for land transport as “the most significant opportunity for public policy reform in Australia’s infrastructure sectors”, with potential for a broader pricing system based on user-pays principles.
While this groundswell provided impetus for change, without understanding Australians’ views and behaviour towards road pricing systems, reform would always remain theoretical.
To help move the debate forward, in 2016, Transurban completed the first real-world test of user-pays road charging in Australia. Conducted over 17 months, 1635 motor-ists from the Greater Melbourne region drove 12 million kilometres under a range of charging options. The study tested user-pays as an alternative to the current funding model and also trialled two demand management charging approaches. It was designed to meet three objectives:
FIGURE 1 AUSTRALIAN CITY TRAFFIC PROFILE ON AN AVERAGE WORK DAY
Source: Transurban (2016). For illustrative purposes only
Hour of day Under-utilised road capacity
1 2 3 4 5 6 7 8 9 10 11 12 13 14 15 16 17 18 19 20 21 22 23 24
Vehi
cles
per
hou
r

I M P R O V I N G S E R V I C E S E C T O R P R O D U C T I V I T Y : T H E E C O N O M I C I M P E R A T I V E
149
S E C T I O N 6 . 2
To gauge motorists’ knowledge and understanding of our current road-funding system and assess their attitudes and preferences toward user-pays charging options;
To understand motorists’ behavioural responses to different charging and imple-mentation options; and
To prove that technology is not a barrier to implementing a practical user-pays system.
Two road-charging models with distinct purposes were tested consecutively:
Usage-based model – this model tested participant responses to a user-pays funding approach that is more transparent and sustainable as a funding source. Three usage-based charging options were tested: charge per kilometre; charge per trip; and flat rate (capped kilometres).
Congestion-based model – this model tested how motorists responded to demand-management pricing signals to reduce road use in highly congested geographies or at peak travel times. Two congestion-based charging options were tested: cordon (area); and time of day.
Through a series of attitudinal surveys conducted over the course of the study, we saw a significant swing in participants’ preference from the current system, which they initially knew little about, to a user-pays model. This shows that, by experiencing a different way of paying for their road use, participants could see the benefit of a direct and transparent user-pays model over the current system of opaque fees and charges. Specific results from the usage-based and congestion-based models are discussed in the following sections.
Sustainable funding source
The study showed that a user-pays road-funding model would work in Australia and could provide a sustainable, fair and flexible funding system that grew with demand (refer to Figure 2).
FIGURE 2 POTENTIAL FUNDING FROM A USER-PAYS SYSTEM COMPARED WITH EXISTING FUEL SYSTEM
Source: Transurban analysis; Bureau of Infrastructure, Transport and Regional Economics, Australia Infrastructure Yearbook 2015; CSIRO (report for the NTC),
Projecting future road transport revenues 2015–2050, May 2015
* Taxes and duties for specific purposes such as GST, fringe benefits tax, tolling revenue, luxury car tax or passenger vehicle customs duty not included.
^ Assumes real revenues other than fuel excise remain constant.
0
5000
10,000
15,000
20,000
25,000
30,000
35,000
40,000
45,000
50,000
Year
2015 2020 2025 2030 2035 2040 2045 2050
Funding ($millions)
Projected fuel excise
Potential funding range of a user-pays charging system keeping pace with demand(projected vehicle kilometres travelled used as a proxy for demand)
Projected total road-related revenue(includes fuel excise)*^

I M P R O V I N G S E R V I C E S E C T O R P R O D U C T I V I T Y : T H E E C O N O M I C I M P E R A T I V E
150
S E C T I O N 6 . 2
It showed participants were open to trying a more direct and transparent way of paying for their road use and that the different charging options tried by participants did not impede their usual driving behaviours. The charging options used in the study broadly reflected current levels of national road-related expenditure, and did not repre-sent specific policy recommendations. Through raising or lowering the charging levels, particular behaviours could be amplified or, similarly, the needs of specific community groups addressed.
Of the usage-based options, the charge per kilometre was the most popular, poten-tially due to its simple and easy-to-understand nature, with 59 per cent of participants preferring it over all the options tested, compared with 21 per cent for the charge per trip option and 20 per cent for the flat rate.
Highlighting the power of information sharing and practical experience in building awareness, a series of attitudinal surveys conducted at key points throughout the study shows a considerable shift in participant preference towards a user-pays model over the current system of opaque fees and charges. At the start of the study, 85 per cent of participants were comfortable with the current funding system. However, after experiencing alternative ways of paying for their road use, 60 per cent said they preferred a user-pays system (refer to Figures 3 and 4).
Managing demand
A user-pays funding system could also be adapted to assist with managing traffic across road networks through the use of pricing signals to modify behaviours in highly congested geographies or during peak travel times. This would add to the suite of tools available to policymakers to manage demand, including behavioural change initiatives, communication programs and the provision of alternative transport modes. Only a small percentage shift in travel patterns is required to achieve peak spreading and make a considerable difference to the overall demand profile of the road network.
FIGURE 4 PARTICIPANTS’ PREFERENCES IN FUNDING SYSTEM AFTER TRIALLING USER PAYS
Source: Melbourne Road Usage Study
FIGURE 3 PARTICIPANTS’ COMFORT WITH THE CURRENT SYSTEM BEFORE TRIALLING USER PAYS
Source: Melbourne Road Usage Study
Percentage of participantsPercentage of participants
PreferencePreference
0
10
20
30
40
50
60
70
80
Don't knowCurrent systemUsage charging0
10
20
30
40
50
60
70
80
90
100
Don't knowNot comfortableComfortable

I M P R O V I N G S E R V I C E S E C T O R P R O D U C T I V I T Y : T H E E C O N O M I C I M P E R A T I V E
151
S E C T I O N 6 . 2
Industry bodies have suggested that even a five per cent change in traffic levels during peak periods would increase traffic speeds by 50 per cent. This variation is similar to the traffic flow changes commonly observed during school holiday periods.
The study showed that cordon charging could be effective in Australia as a conges-tion management tool, with a subset of participants reducing their road use within the central city during peak periods.
Of the 319 participants who completed trialling cordon charging, 51 per cent did not enter the cordon at peak times during the baseline period, with many not entering the area at all during the study. The group of participants who entered the cordon as part of their usual driving habits appeared to have reduced their weekly cordon travel by 10 to 15 per cent when driving under the cordon charging option.
Despite the observed downward trend for the participants who entered and travelled around the Melbourne CBD cordon, the road usage for the group in aggregate, including those who never entered the cordon, remained largely unchanged during the application of a cordon charge. This result supports the view that demand-management tools need to be specific and targeted to those who would respond to this charging signal. While cordon charging was applied to the easily recognisable boundary of Melbourne’s CBD for the purpose of the study, cordon charging does not necessarily need to be limited to city centres. It also has application for other areas experiencing temporary or sustained congestion.
In contrast, the time-of-day charging option applied one peak and one off-peak rate to all road usage regardless of location. The study’s testing of behavioural responses to time-of-day charging showed no overall substantial change in participants’ usual driving patterns when the option was applied. This does not necessarily mean that time-of-day charging would not have application in Australia, but rather, the charging signal needs to be clearer for users, and more specific in application before it can effectively address demand issues for targeted geographic zones or roads. Time-of-day charging has already been successfully implemented internationally.
FIGURE 6 PARTICIPANTS’ COMFORT WITH TIME-OF-DAY CHANGING AFTER EXPERIENCING THE OPTION
Source: Melbourne Road Usage Study
FIGURE 5 PARTICIPANTS’ COMFORT WITH CORDON-CHANGING AFTER EXPERIENCING THE OPTION
Source: Melbourne Road Usage Study
Percentage of participants
Response
0
10
20
30
40
50
60
Don’t knowNot comfortableComfortable
Percentage of participants
Response
0
10
20
30
40
50
60
70
Don't knowNot comfortableComfortable

I M P R O V I N G S E R V I C E S E C T O R P R O D U C T I V I T Y : T H E E C O N O M I C I M P E R A T I V E
152
S E C T I O N 6 . 2
System design
Study participants provided insights into several elements that need to be considered in the design and implementation of any new system, which are discussed throughout this section.
Transparency and awareness
By trialling a direct and transparent way of paying for their road use, study participants became more aware of their driving behaviours. Participants had a low awareness of their road use with only 20 per cent accurately stating how many kilometres they drove or trips they made each week, month or year. By experiencing a user-pays system over the duration of the study, participants became more aware of their road use, with one in two reporting their awareness had increased (47 per cent).
Participants were three times more likely to look at the travel statements they received in the mail rather than visit the study website to monitor their road use (94 per cent versus 31 per cent) and gained more information from that direct and proactive com-munication channel. Through exposure to information, participants’ understanding of the current road-funding system also increased by 23 per cent.
With this understanding came greater appreciation of today’s challenges. Thirty-five per cent of participants who were uncomfortable with the current system said so because they believed the system should be user-pays. This contrasts with only 11 per cent for those who had not experienced a charging option. While achieving an understanding of the current road-funding system was important for participants to recognise the need for reform, ultimately their awareness of their own road use only increased after they had experienced a more transparent system.
Thirty per cent of participants said they changed their road use during the study. Participants who trialled the usage and congestion-based options reported greater use of alternative transport modes. Of those who provided details, 30 per cent said they had used more public transport; 23 per cent said they walked more; and five per cent said they cycled more.
Practical access to alternative transport modes emerged as a key factor in determin-ing participants’ ability and willingness to change their road use. Wider societal factors, such as flexibility in work hours, also played a role. Ensuring Australians can make genuine choices about how and when they use the roads will be critical in meeting the demand-management objectives of any new system.
Fairness
In the design of a sustainable and equitable funding system, a broad range of con-siderations will need to be taken into account. In the area of equity, the system needs safeguards and measures in place to protect vulnerable groups.
Through the qualitative surveys, study participants expected any new system would be fair for all users, including regional drivers, and could provide adequate protec-tions for the vulnerable. They also expected that with the introduction of any new system, existing road-related charges would be eliminated and funding raised would be hypothecated into transport networks.

I M P R O V I N G S E R V I C E S E C T O R P R O D U C T I V I T Y : T H E E C O N O M I C I M P E R A T I V E
153
S E C T I O N 6 . 2
Technology
Participants showed openness to trialling new technologies, including in-vehicle GPS technology. Two types of in-vehicle GPS devices were used in the study to accommo-date the wide range of models in Australia’s existing vehicle fleet. These included the OBD-II GPS device and the Plug-in GPS device. Eighty-four per cent of participants were comfortable with the GPS devices used in the study (refer to Figure 7) and 82 per cent felt that the devices accurately measured their road usage.
These devices transmitted 16 locational and operational data-points every 60 seconds, amounting to one billion data points over the course of the study. More than 99 per cent of the confirmed travel data was considered valid. Practical implementa-tion measures, such as an agreed approach for telematics, software configuration, vehicle compatibility and device installation among many others, would need to be considered in the design and selection of technologies to achieve the scale required for a broad-based user-pays system.
Privacy and information security
While participants were generally comfortable with the technology system used in the study, they reinforced the importance of personal information security and pro-tection in any system design. Sixty-three per cent of participants said they would
FIGURE 7 PARTICIPANTS’ COMFORT WITH THE GPS DEVICES USED IN THE STUDY BY DEVICE TYPE
Source: Melbourne Road Usage Study
0
10
20
30
40
50
60
70
80
90
100
Should be smallerEasily dislodged
Response
OtherNo problems
OBD-II GPS device
Plug-in GPS device
Percentage of Participants
FIGURE 8 PARTICIPANTS’ THOUGHTS ON HAVING THE DEVICES IN THEIR CAR INDEFINITELY*
*Participants could provide multiple answers
Source: Melbourne Road Usage Study
Percentage of Participants
Response
0
20
40
60
80
Something elseWould be a hassle
Primary question
Other
Device asthetics
Privacy
Wouldn’t bother me/would be ok

I M P R O V I N G S E R V I C E S E C T O R P R O D U C T I V I T Y : T H E E C O N O M I C I M P E R A T I V E
154
S E C T I O N 6 . 2
be comfortable having the GPS device in their car indefinitely (refer Figure 8), while 13 per cent mentioned privacy and data security concerns. This highlights the need for further work towards solutions that are acceptable to the community as a whole.
Conclusion
The Melbourne Road Usage Study provides encouraging signs that Australians are ready to start talking about road-funding reform and willing to try a user-pays system. The path ahead will be challenging, but we believe Australia has a unique opportunity to take advantage of the imminent arrival of new transport technologies as a catalyst for rethinking the transport system as a whole and creating a sustainable, fair and flexible funding future.
Setting clear objectives for a user-pays system will underpin its effectiveness. The extent to which addressing congestion is prioritised alongside the objective of restoring a sustainable funding base for Australia’s road networks will be an important consider-ation for policymakers. While the primary focus of the study was on road charging, the learning extended to other areas of infrastructure planning. The study highlights the need for a coordinated approach across the different modes of transport that provide Australians with the choice they need to initiate change.
Finally, the study emphasised the importance of bringing the wider community into the discussion. We believe the more time Australians have to understand the issues we face in transport, the more motivated they become to see change. Through build-ing an understanding of the challenges in the existing system and gaining first-hand experience in user-pays road-charging options, many of our participants developed an appetite for a funding future that is fair, flexible and sustainable. As the study showed, Australians are willing to start talking about funding reform and we should all be ready to listen.
Endnotes
1 As at February 2007
2 Australian Parliament House of Representatives Inquiry Report, Servicing our future, 2007
3 Grattan Institute, Mapping Australia’s Economy: cities as engines of prosperity, 2014
4 Infrastructure Australia, Population Estimates and Projections, Australian Infrastructure Audit Background Paper, 2015
5 The Grattan Institute, City Limits, 2015
6 Ibid
7 Infrastructure Partnerships Australia, Submission to Australia’s Future Tax System Review Panel, October 2008
8 Infrastructure Australia, Australian Infrastructure Audit, 2015
9 Ibid
10 The Grattan Institute, Roads to Riches: Better Transport Investment, 2016
11 CSIRO (report for NTC), Projecting future transport revenues 2015–2050, 2015
12 Bureau of Infrastructure, Transport and Regional Economics, Australia Infrastructure Yearbook, 2015

155
7.1 Is digitisation about to make the service sector more productive? Professor Beth Webster
Digital future of services
SECT ION
7.0

I M P R O V I N G S E R V I C E S E C T O R P R O D U C T I V I T Y : T H E E C O N O M I C I M P E R A T I V E
156
Professor Beth Webster is a member of the CEDA
Council on Economic Policy (CCEP), which comprises
some of Australia’s best and brightest policy minds,
and guides CEDA’s research agenda.
Professor Webster is the Director of the Centre for
Transformative Innovation at Swinburne University of
Technology. She is also Pro Vice-Chancellor for Research Impact and Policy.
She holds a B. Economics and M. Economics (Monash University) and a PhD
in economics (University of Cambridge). She has authored over 100 articles
on the economics of innovation and firm performance and has been
published in RAND Journal of Economics, Review of Economics and
Statistics, Oxford Economic Papers, Journal of Law & Economics, Cambridge
Journal of Economics and Research Policy. She has been appointed to a
number of committees including the Bracks’ review of the automotive
industry; Lomax-Smith Base funding Review; CEDA Advisory Council; the
Advisory Council for Intellectual Property; President, European Policy for
Intellectual Property Association; and General Secretary, Asia Pacific
Innovation Network.
7.1Is digitisation about to make the service sector more productive?
Professor Beth Webster

I M P R O V I N G S E R V I C E S E C T O R P R O D U C T I V I T Y : T H E E C O N O M I C I M P E R A T I V E
157
S E C T I O N 7 . 1
Introduction
There are three regularly trotted out “facts” about the economic performance of the service sector: service employment is about to plummet because digital technologies will take jobs; service sector productivity growth is low and dragging the rest of the economy down; and the service sector is the fastest growing part of the economy.
Each fact has some element of truth, but each should be understood in context and not taken at face value. Let’s examine these in turn. First, we need to be clear about what we mean by production and productivity. All products – goods and services – are produced by the application of labour services to natural resources (including the sun). Full stop, end of story. Technologies, machines, and robots are all products of human labour. Labour consists of geniuses who make major breakthroughs, lesser mortals who make incremental improvements and the bulk of us who supply the physical grunt. Natural resources are fixed and when we say we are producing goods, we are really just transforming some of this matter into different forms.
Productivity is a ratio of the quantity of labour services that go into a value chain and the quantity of goods and services coming out the other end. It does not increase when we cut wages. Given that natural resources do not change over time, the only source of increased productivity is an improvement in the quality of labour services. We can achieve higher productivity by working faster but most of us would prefer to do this by working smarter – that is by accumulating useful knowledge and applying it to the production process. Enter digital technologies.
Is service employment about to plummet due to digital disruption?
Anecdotes suggest that the scope of digital technologies use is growing exponentially. Digital sensors allow farmers to apply individualised amounts of water and fertiliser to each plant; optimise the diet of cows as they are being milked; and provide the real-time home care information that enables elderly people to live on their own. Digital technologies, when combined with 3D printing, allow manufacturers to create esoteric spare parts and components on the spot, thereby alleviating the need to warehouse large numbers of items (or wait for parts to be shipped). Examples where the internet has permitted safe, quality assured exchange between peers are manyfold – from Airbnb and Uber, to Gumtree and Ebay.
Computers have been used in mechanical, routine-based occupations such as accounting, logistics, telecommunications, CAD-CAM and robotics for many decades. More recently, digital technologies, in the form of machine learning, have been trans-forming the oldest of professions – medicine and the law. Up until now, these services have been considered the preserve of those with experiential knowhow and nuanced interpretation. This is changing as machine-learning methods have partially automated tasks by detecting patterns and inferring rules from data.
A classic example from law is eDiscovery, which is a digital tool used to assist lawyers in searching through emails and piles of office documents to find clinching evidence (looking for the proverbial needle in a haystack). In medicine, machine-learning algo-rithms are increasingly being used to help perform radiological diagnoses. They can be trained to classify medical scans as normal or diseased, or to quantify the size of diseased areas.

I M P R O V I N G S E R V I C E S E C T O R P R O D U C T I V I T Y : T H E E C O N O M I C I M P E R A T I V E
158
S E C T I O N 7 . 1
Although the term “machine learning” has recently entered popular lexicon, its algorithms have been used for 20 years in spam filters. In fact, digital technologies per se have been with us for 70 years. Their building blocks were invented post- World War II during the heyday of American research and scientific development at Bell Labs. As smaller, cheaper and faster mainframes were developed, certain markets and occupations were either revolutionised or annihilated – such as in the 1980s, when digital technology effectively eliminated the labour market for clerical workers.
Nonetheless, from the perspective of the whole production and consumption system, the progress of digital technologies has been slow. Global positioning technology is a good example. Although satellites were used since the 1960s to provide market intelligence for producers (giving US farmers advice on what and how many crops their competitors were growing, for example), it took until the 2010s for satellite-aided location services to become ubiquitous and part of consumers’ daily lives.
One thing that may accelerate this change is the ability of digital technologies to diffuse quickly and cheaply. More and more digital disruption is being triggered by innovative software, such as travel search engines and language translation services, rather than hardware. Since software can be shifted into large-scale production much faster than hardware, this accelerates the pace of disruption.
From an economic perspective, these technological changes can have two types of impact. First, they can reduce the cost of producing existing products. Examples here include agricultural goods, treatments for disease, legal contracts, and retail ser-vices. We expect to see this to flow through to a reduction in related employment (unless demand is very responsive to price reduction). Secondly, they can lead to the development of new products, such as smart phones, sourced provedore and video-on-demand. We expect to see this flow through to an increase in employment. Hence, it does not necessarily follow that an industry subject to digital disruption will lose workers. Which brings us to the second “fact” about the low productivity in the service sector.
Is service productivity growth low?
Nobel Prize-winning economist Robert Solow famously said, “You can see the computer age everywhere but in the productivity statistics”. There is an old and com-monly held view that productivity growth is slower in the service sector,1 especially in the health and finance sectors. Authors are a bit unclear, however, about whether they mean measured productivity or actual productivity. However, the folklore about measured productivity growth in services being low is out of date. There are many reports presenting estimates of Australian and overseas productivity by sector2,3 and the general finding is that the service industries do not have slower productivity than the primary and secondary industries. In fact, business services such as wholesale trade; information and telecommunications; professional and technical services; and real estate services tend to record higher than average productivity growth.
However, there is consensus that productivity in the service sector is harder to measure and herein lies the variability of the productivity measures. The problem is that output across heterogeneous products is based on total revenue. Revenue may rise because businesses are selling more or selling better quality products (both measures of higher output) but revenue may also rise because of inflation (not related to output). To separate inflation from an improvement of quality, we need a measure of quality that is independent of the time workers spend producing the product, their wages, and the price paid. In industries where products are mass produced in batches, such as most
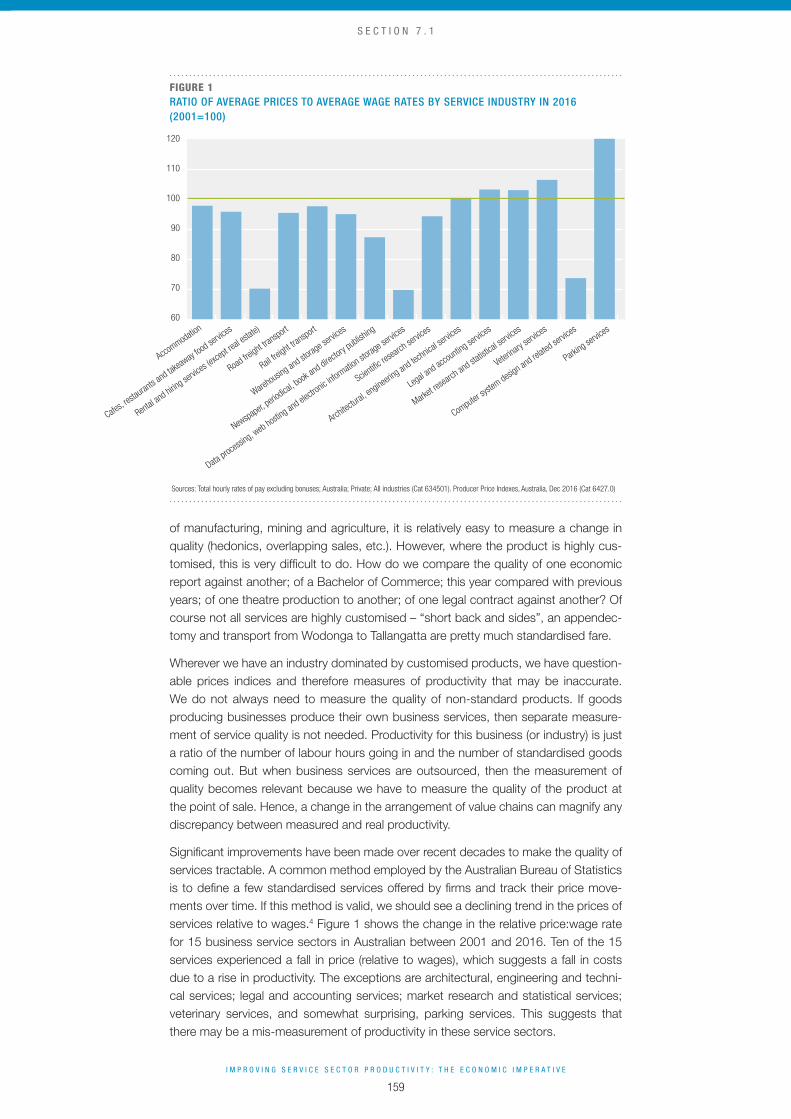
I M P R O V I N G S E R V I C E S E C T O R P R O D U C T I V I T Y : T H E E C O N O M I C I M P E R A T I V E
159
S E C T I O N 7 . 1
of manufacturing, mining and agriculture, it is relatively easy to measure a change in quality (hedonics, overlapping sales, etc.). However, where the product is highly cus-tomised, this is very difficult to do. How do we compare the quality of one economic report against another; of a Bachelor of Commerce; this year compared with previous years; of one theatre production to another; of one legal contract against another? Of course not all services are highly customised – “short back and sides”, an appendec-tomy and transport from Wodonga to Tallangatta are pretty much standardised fare.
Wherever we have an industry dominated by customised products, we have question-able prices indices and therefore measures of productivity that may be inaccurate. We do not always need to measure the quality of non-standard products. If goods producing businesses produce their own business services, then separate measure-ment of service quality is not needed. Productivity for this business (or industry) is just a ratio of the number of labour hours going in and the number of standardised goods coming out. But when business services are outsourced, then the measurement of quality becomes relevant because we have to measure the quality of the product at the point of sale. Hence, a change in the arrangement of value chains can magnify any discrepancy between measured and real productivity.
Significant improvements have been made over recent decades to make the quality of services tractable. A common method employed by the Australian Bureau of Statistics is to define a few standardised services offered by firms and track their price move-ments over time. If this method is valid, we should see a declining trend in the prices of services relative to wages.4 Figure 1 shows the change in the relative price:wage rate for 15 business service sectors in Australian between 2001 and 2016. Ten of the 15 services experienced a fall in price (relative to wages), which suggests a fall in costs due to a rise in productivity. The exceptions are architectural, engineering and techni-cal services; legal and accounting services; market research and statistical services; veterinary services, and somewhat surprising, parking services. This suggests that there may be a mis-measurement of productivity in these service sectors.
FIGURE 1 RATIO OF AVERAGE PRICES TO AVERAGE WAGE RATES BY SERVICE INDUSTRY IN 2016 (2001=100)
Sources: Total hourly rates of pay excluding bonuses; Australia; Private; All industries (Cat 634501). Producer Price Indexes, Australia, Dec 2016 (Cat 6427.0)
60
70
80
90
100
110
120
Parking se
rvices
Computer
system
design an
d relate
d servic
es
Veterinary
servic
es
Market r
esearc
h and sta
tistica
l servic
es
Legal a
nd accou
nting servic
es
Architec
tural, en
gineering an
d technica
l servic
es
Scientific
resear
ch servic
es
Data proc
essing, w
eb hosting an
d electro
nic inform
ation sto
rage s
ervice
s
Newspaper,
periodica
l, book
and direc
tory publish
ing
Warehousin
g and sto
rage s
ervice
s
Rail frei
ght transport
Road fre
ight transport
Rental and hirin
g servic
es (ex
cept re
al esta
te)
Cafes, r
estauran
ts and tak
eaway
food se
rvices
Accommodatio
n

I M P R O V I N G S E R V I C E S E C T O R P R O D U C T I V I T Y : T H E E C O N O M I C I M P E R A T I V E
160
S E C T I O N 7 . 1
Is the service sector the fastest growing part of the economy?
This chapter has hinted at the somewhat fuzzy nature of how we define and measure the service sector. Industry classifications are organised around the type of product produced for sale or distribution to clients. If the main product (by revenue) produced by a business is intangible, then the business is allocated to the service sector. This principle leads to some oddities (a car for sale is a good, but a car for lease is a service) but the taxonomy coincides with common sense and serves us well. As we become wealthier, we tend to want to consume services rather than wanting to consume more goods, and hence we see a faster growth in tourism, hospitality, entertainment and health services, inter alia, relative to manufacturing.
However, there are classes of changes that can affect measurement and therefore affect the headline trends. Goods industries that outsource their business services, such as cleaning, data analysis, accounting and legal, will appear to shrink when in fact there has just been a re-classification of activities. When integrated into the business, the activities will appear as part of the main activity of the business (say manufacturing) but after outsourcing, they will be part of the business service sector. Similarly, manufacturing businesses, which outsource the assembly of a product to East Asia, may lose their “manufacturing” classification and be deemed “wholesale trade” or “professional services” even though they are still designing and selling goods. As the structure of value chains become more globally integrated and specialised, this change could have significant effect on our aggregate data. Nonetheless, to my knowledge, there is no assessment of the size of this effect.
Finally, the prediction is that manufacturing will one day consume only one to two per cent of the workforce. This is a good thing. The boring, repetitive and dangerous jobs will be eliminated as production systems use artificial intelligence to become more automated, customised and sensitive to individual requirements. How well we manage this transition – in the sense of preserving worker dignity – depends on the ability of civic institutions, government and workers to make the transition from traditional jobs to the newly emerging analytic, creative or human-centred work. The market, for all its virtues, does not have a good track record for delivering fairness and respect for the least organised. It is up to us to decide when we use the market and when we intervene.
Endnotes
1 Bosworth, B.P. and Triplett, J.E., Productivity in the services sector, https://www.brookings.edu/research/productivity-in-the-services-sector/
2 Cobbold, T. and Kulys, A., Australia’s Industry Sector Productivity Performance, Productivity Commission, http://www.pc.gov.au/research/supporting/industry-performance/aispp.pdf
3 Australian Bureau of Statistics, 2016, Cat. 5260.0.55.002 Estimates of Multifactor Productivity, http://www.abs.gov.au/ausstats/[email protected]/0/E95A0098761C9EC9CA25807D00172D73?Opendocument
4 Exceptions are when prices rise due to an increase in the market power of the industry and a rise in the (traded) price of inputs. In this simple exercise we do not condition for these factors.

I M P R O V I N G S E R V I C E S E C T O R P R O D U C T I V I T Y : T H E E C O N O M I C I M P E R A T I V E
161
S E C T I O N ? . ?
Acknowledgements
CEDA would like to acknowledge the following members
and individuals who contributed to CEDA’s general
research fund between 1 May 2016 and 1 May 2017.
CEDA undertakes research with the objective of delivering
independent, evidence-based policy to address critical
economic issues and drive public debate and discussion.
It could not complete its research agenda without the
support of these contributions.

I M P R O V I N G S E R V I C E S E C T O R P R O D U C T I V I T Y : T H E E C O N O M I C I M P E R A T I V E
162
A C K N O W L E D G E M E N T S
National
ABB Australia
ACIL Allen Consulting
Advisian
AECOM
AEMO
AGL
Allens
APA Group
Ashurst
Australia Post
Australian Catholic University
Australian Rail Track Corporation
AustralianSuper
Bendigo Bank
Broadspectrum
Bupa
Cardno
Chartered Accountants Australia and New Zealand
Clayton Utz
Commonwealth Bank of Australia
CPB Contractors
CSIRO
Deloitte
EY
Ferrier Hodgson
First State Super
Fragomen
G4S Australia and New Zealand
GHD
HASSELL
Herbert Smith Freehills
Jacobs
John Holland
KinCare
Lendlease
McConnell Dowell
McKinsey & Company
Microsoft
Mitsubishi Australia
National Australia Bank
Navitas
Nous Group
PPB Advisory
PwC Australia
Reserve Bank of Australia
Rio Tinto
RSM
SEEK
Serco
Shell Australia
Siemens
Stellar Asia Pacific
Stockland
Transdev
Transurban
TRILITY
Uber
UniSuper
Woods Bagot
WSP Australia

I M P R O V I N G S E R V I C E S E C T O R P R O D U C T I V I T Y : T H E E C O N O M I C I M P E R A T I V E
163
A C K N O W L E D G E M E N T S
ACT
Australian Bureau of Statistics
Australian National University
Defence Housing Australia
Federal Department of Industry, Innovation and Science
University of Canberra
NSW
Aconex
ARITA - Australian Restructuring Insolvency & Turnaround Association
Arts NSW
Australian Energy Market Commission
Australian Nuclear Science and Technology Organisation
Australian Payments Clearing Association
Barangaroo Delivery Authority
BRI Ferrier
Business Events Sydney
Cannings Communications
CBRE
Anna McPhee
Talal Yassine, OAM
City of Parramatta
City of Sydney
Clean Energy Finance Corporation
Coal Services
Consult Australia
E3 Advisory
EIG
Energy Consumers Australia
Essential Energy
Four Seasons Hotel Sydney
GlaxoSmithKline
Holcim (Australia)
Hunter Water Corporation
IAG
Infrastructure Australia
Insurance & Care NSW (icare)
Johnson & Johnson
Macquarie Group
Maddocks
Mainsheet Capital
Marsh
McCullough Robertson Lawyers
National Insurance Brokers Association of Australia
NSW Department of Family and Community Services
NSW Department of Finance, Services and Innovation
NSW Department of Premier and Cabinet
NSW Treasury
NSW Treasury Corporation
Plenary Group
Port Authority of New South Wales
Port of Newcastle
Randstad
Royal Bank of Canada
Snowy Hydro
Sydney Airport
Sydney Water
Systra Scott Lister
TAFE NSW
TBH
The Benevolent Society

I M P R O V I N G S E R V I C E S E C T O R P R O D U C T I V I T Y : T H E E C O N O M I C I M P E R A T I V E
164
A C K N O W L E D G E M E N T S
The BPAY Group
The GPT Group
The Star Entertainment Group
The University of Sydney
Thorn Group
Thought Broker
TransGrid
Transport for NSW
University of Newcastle
University of Technology Sydney
University of Wollongong
UNSW Australia
UrbanGrowth NSW
Visa
Water NSW
Western Sydney University
Wollongong City Council
NT
Developing East Arnhem Limited
QLD
Accenture Australia
Adani Mining
Arcadis Australia Pacific
Aurizon
Bank of Queensland
Bond University
Brisbane Airport Corporation
Brisbane Convention and Exhibition Centre
Brisbane Girls Grammar School
Brisbane Marketing
Burrell Stockbroking and Superannuation
Robyn Stokes
Churches of Christ in Queensland
Community Services Industry Alliance
ConocoPhillips
Construction Skills Queensland
Energy Queensland
Gadens
Griffith University
Hastings Deering
Ipswich City Council
James Cook University
Law In Order
Local Government Association of Queensland
Lutheran Community Care
McCullough Robertson Lawyers
Morgans
New Hope Group
NOJA Power
Open Minds
Port of Brisbane
QIC
QSuper
Queensland Competition Authority
Queensland Department of Agriculture and Fisheries
Queensland Department of Energy and Water Supply
Queensland Department of Environment and Heritage Protection
Queensland Department of Infrastructure, Local Government and Planning

I M P R O V I N G S E R V I C E S E C T O R P R O D U C T I V I T Y : T H E E C O N O M I C I M P E R A T I V E
165
A C K N O W L E D G E M E N T S
Queensland Department of State Development
Queensland Department of the Premier and Cabinet
Queensland Department of Transport and Main Roads
Queensland Law Society
Queensland Resources Council
Queensland Treasury
Queensland Treasury Corporation
Queensland Urban Utilities
QUT
Robert Walters
Sarina Russo Group
South Bank Corporation
South Burnett Regional Council
Suncare Community Services
Suncorp Group
SunWater
Super Retail Group
TechnologyOne
The Star Entertainment Group
Toowoomba and Surat Basin Enterprise
Toowoomba Regional Council
Townsville City Council
Trade and Investment Queensland
Tri-Star Petroleum Company
University of Southern Queensland
USC
Wiggins Island Coal Export Terminal
SA
Adelaide Airport
Adelaide Festival Centre
Babcock International
Bedford Group
Business SA
CanDo Group
Coopers Brewery
ElectraNet
Executive Leadership Connection
Funds SA
Health Partners
Hughes Public Relations
InterContinental Adelaide
Investment Attraction South Australia
Life Without Barriers
Morton Philips
NCVER
OZ Minerals
Philmac
RAA of SA
Royal Institution of Australia
SA Department of the Premier and Cabinet
SACE Board of SA
Scope Global
Seeley International
SMS Management & Technology
South Australian Water Corporation
Statewide Superannuation Trust
TAFE SA
Thomson Geer

I M P R O V I N G S E R V I C E S E C T O R P R O D U C T I V I T Y : T H E E C O N O M I C I M P E R A T I V E
166
A C K N O W L E D G E M E N T S
TAS
Aurora Energy
MyState
Tasmanian Department of Premier and Cabinet
Tasmanian Department of State Growth
University of Tasmania
VIC
.au Domain
Aconex
AusNet Services
Australian Energy Council
Australian Unity
BASF Australia
Benetas
Box Hill Institute
Cabrini Health
Alexander Gosling, AM
City of Ballarat
City of Greater Geelong
City of Port Phillip
City of Wodonga
Clean Energy Council
CoINVEST
Colin Biggers & Paisley
CPA Australia
CQ University
CSL
Data #3
EPA Victoria
Epworth HealthCare
Ericsson
Extent Heritage
ExxonMobil
Fair Work Ombudsman
Fed Square
Gilbert + Tobin
GTA Consultants
Homesafe Solutions
IAG
IFM Investors
Independent Schools Victoria
Jemena
Jo Fisher Executive
L.E.K. Consulting
La Trobe University
Life Without Barriers
Maddocks
Master Builders Association of Victoria
Melbourne Polytechnic
Melbourne Water Corporation
Mercy Health and Aged Care Group
Metro Trains Melbourne
Mitchell Institute
Newgate Communications
Origin Energy
PGA Group
Phillip Island Nature Park
Pinnacle Group
Pitcher Partners
Pitt & Sherry
Plenary Group

I M P R O V I N G S E R V I C E S E C T O R P R O D U C T I V I T Y : T H E E C O N O M I C I M P E R A T I V E
167
Programmed Group
RMIT University
Royal Automobile Club of Victoria
RPS
S&P Global Ratings
SED Advisory
Skybus
Smarketer
Spotless
Sustainability Victoria
Swinburne University of Technology
The Future Fund
Toyota
Treasury Corporation of Victoria
United Energy and Multinet Gas
Victoria University
Victorian Department of Education and Training
Victorian Department of Environment, Land, Water and Planning
Victorian Department of Premier and Cabinet
VicTrack
Visa
Western Water
WA
ATCO
Austal
BHP Billiton
BP Australia
Brightwater Care Group
Brookfield Rail
Cameco Australia
CBH Group
Peter Leonhardt
Chevron Australia
CITIC Pacific Mining
City of Fremantle
City of Joondalup
Clifford Chance
CommunityWest
Corrs Chambers Westgarth
Curtin University
DuPont
Edith Cowan University
Grain Industry Association of WA
INPEX
Jackson McDonald
Main Roads, Western Australia
Milwaukee Tools Australia
NGIS Australia
Oracle
Public Sector Commission
RAC of WA
Resource Capital Funds Management
Road Safety Commission
Shire of Serpentine-Jarrahdale
A C K N O W L E D G E M E N T S

I M P R O V I N G S E R V I C E S E C T O R P R O D U C T I V I T Y : T H E E C O N O M I C I M P E R A T I V E
168
Silver Chain
Sinosteel Australia
South Regional TAFE
Squire Patton Boggs
Synergy
Syrinx Environmental
Telethon Kids Institute
The Bethanie Group
WA Department of Agriculture and Food
WA Department of Commerce
WA Department of Finance
WA Department of Health
WA Department of Mines and Petroleum
WA Department of Planning
WA Department of State Development
WA Super
Wellard
Wesfarmers
Western Power
Woodside Energy
NationalLevel 13 440 Collins Street Melbourne VIC 3000 GPO Box 2117 Melbourne VIC 3001 Telephone 03 9662 3544 Email [email protected]
New South Wales and the ACTLevel 14 The John Hunter Building 9 Hunter Street Sydney NSW 2000 GPO Box 2100 Sydney NSW 2001 Telephone 02 9299 7022 Email [email protected]
QueenslandLevel 17 300 Adelaide Street Brisbane QLD 4000 GPO Box 2900 Brisbane QLD 4001 Telephone 07 3229 9955 Email [email protected]
South Australia and the Northern TerritoryLevel 5 2 Ebenezer Place Adelaide SA 5000 Telephone 08 8211 7222 Email [email protected]
Victoria and TasmaniaLevel 13 440 Collins Street Melbourne VIC 3000 GPO Box 2117 Melbourne VIC 3001 Telephone 03 9662 3544 Email [email protected]
Western AustraliaLevel 5 105 St Georges Terrace Perth WA 6000 PO Box 5631 St Georges Tce Perth WA 6831 Telephone 08 9226 4799 Email [email protected]