southwest minnesota economic and business conditions ... · pdf filesouthwest minnesota...
TRANSCRIPT

Southwest MinnesotaEconomic and Business Conditions ReportFirst Quarter 2016
This issue is part of a series for the six planning areas of Minnesota – Central, Northeast, Northwest, Southeast, Southwest, and Twin Cities.
The Southwest Minnesota Planning Area consists of 23 counties: Big Stone; Blue Earth; Brown; Chippewa; Cottonwood; Faribault; Jackson; Lac qui Parle; Le Sueur; Lincoln; Lyon; Martin; Murray; Nicollet; Nobles; Pipestone; Redwood; Rock; Sibley; Swift; Waseca; Watonwan; and Yellow Medicine.

1
TABLE OF CONTENTS
Executive Summary ................................................................................1
Southwest Minnesota Leading Economic Indicators Index ....................2
Southwest Minnesota Business Filings ...................................................4
Southwest Minnesota Labor Market Conditions ..................................11
Southwest Minnesota Bankruptcies .....................................................16
Economic Indicators .............................................................................17
Sources ................................................................................................. 19
Executive Summary
Economic conditions are expected to improve in Southwest Minnesota over the next several months according to the predictions of the St. Cloud State University (SCSU) Southwest Minnesota Index of Leading Economic Indicators (LEI). A strengthening rural outlook, a recent increase in new business filings, and fewer initial jobless claims in the first quarter helped drive the leading index higher. A small reduction in residential building permits in Mankato served as a drag on the leading index in the first quarter.
There were 665 new business filings with the Office of the Minnesota Secretary of State in Southwest Minnesota in the first quarter of 2016 — representing 3.6 percent fewer new filings than one year earlier. There were 56 new regional business incorporations in the first quarter, a 9.7 percent decrease from one year ago. New LLC filings in Southwest Minnesota fell by 3.5 percent—decreasing to 391 in the first quarter of 2016. New assumed names totaled 190 in the first quarter—2.1 percent fewer filings than in March 2015. There were twenty-eight new filings for Southwest Minnesota non-profits in the first quarter—one less than one year earlier.
Employment of Southwest Minnesota residents expanded by 0.7 percent over the year ending March 2016. 1,574 more Southwest Minnesota residents have jobs than did one year earlier. The regional unemployment rate was 4.9 percent in March, an increase from a 4.7 percent reading in March 2015. Initial claims for unemployment insurance fell by 152 from year-ago levels in March—an 11.4 percent decrease. The Southwest Minnesota labor force rose by 2,075 (a 0.9 percent increase) over the year ending March 2016 and regional job vacancies approached multi-year high levels. Southwest Minnesota bankruptcies inched a little higher in the first quarter of 2016.
There was mixed economic performance in the Mankato/North Mankato Metropolitan Statistical Area (MSA)—the largest market in Southwest Minnesota. On the positive side, average hourly earnings rose, employment increased, and the labor force expanded. However, this was offset by a decline in the length of the workweek, a lower value of residential building permits, higher initial jobless claims, a larger unemployment rate, and lower new business filings.

2
Southwest Minnesota Leading Economic Indicators Index
Components of SCSU Southwest Minnesota Leading Economic Indicators Index
Component of Index Contribution to LEI, 1st quarter 2016 Contribution to LEI, 4th quarter 2015Rural Mainstreet Index 6.20 -9.34
Southwest Minnesota initial claims for unemployment insurance 7.06 4.84
Southwest Minnesota new filings of incorporation and LLCs 1.94 -3.54
Mankato MSA single-family building permits -0.19 13.15
TOTAL CHANGE 15.01 5.11
The SCSU Southwest Minnesota Leading Economic Indicators (LEI) index is designed to predict performance of the regional economy with a four-to-six month lead time. The LEI rose by 15.01 points in the first quarter and is now 1.9 percent lower than one year earlier. As can be seen in the accompanying graph, the LEI in Southwest Minnesota has been highly variable since the end of the Great Recession but has slowly drifted downward since the end of 2013.
SCSU Southwest Minnesota Leading Economic Indicators Index (December 1999=100)
Year
Inde
x

3
Leading Economic Indicators Index
The Southwest Minnesota LEI has four components, three of which increased in the first quarter. A recent increase in new business filings for incorporation and LLC helped lift the index, but a smaller number of Mankato/North Mankato Metropolitan Statistical Area (MSA) single family residential building permits weighed on the LEI. A decrease in in the number of initial jobless claims contributed favorably to the index. The Rural Mainstreet Index from Creighton University uses survey data from rural bankers and business leaders in towns with average population of 1,300 in ten Midwestern states. This index is used as a proxy for economic performance in the rural counties of Southwest Minnesota. This index also had a favorable impact on the LEI in the most recent quarter.
2016 2015 Percentage Change
Rural Mainstreet Index, Creighton UniversityMarch 44.7 50 -10.6%
Southwest Minnesota initial claims for unemployment insuranceMarch 1,181 1,333 -11.4%
Southwest Minnesota new filings of incorporation and LLCsFirst Quarter 447 467 -4.3%
Mankato MSA single-family building permitsMarch 12 10 20.0%
Southwest Minnesota Leading Economic Indicators IndexMarch (March 1999 = 100) 186.3 190.0 -1.9%
SCSU Southwest Minnesota Leading Economic Indicators Index

4
Southwest Minnesota Business Filings
Total New Business Filings—Southwest Minnesota Planning Area (12-month moving total)
Quarter I: 2015
II: 2015
III: 2015
IV: 2015
I: 2016
2016 Quarter I: Percent change from prior year
Southwest Minnesota Total New Business Filings 690 646 518 550 665 -3.6%
The graphs in this section show the 12-month moving total for the various new business filings in Southwest Minnesota that are registered with the Office of the Minnesota Secretary of State. Total new business filings fell by 3.6 percent from year earlier levels in the first quarter. After rising since the beginning of 2014, this series now appears to have peaked out in the middle months of 2015. Note that the abrupt increase in new filings in the middle of 2008 is largely a result of increased new LLC filings. This outlier is related to considerably higher filings in the construction industry and appears to be a one-time only transitory event seen in the data in all regions of Minnesota (although less so in the southwest region).
Year
Filin
gs

5
Business Filings
New business incorporations trended downward sharply in Southwest Minnesota from 2005 to 2011, then levelled off until 2013. Since that time, the downward trend has resumed. First quarter 2016 new regional incorporations decreased by 9.7 percent compared to the same quarter in 2015.
Quarter I: 2015
II: 2015
III: 2015
IV: 2015
I: 2016
2016 Quarter I: Percent change from prior year
Southwest Minnesota New Business Incorporations 62 59 34 61 56 -9.7%
New Incorporations—Southwest Minnesota Planning Area (12-month moving total)
Year
Filin
gs

6
Business Filings
New Limited Liability Companies—Southwest Minnesota Planning Area (12-month moving total)
Quarter I: 2015
II: 2015
III: 2015
IV: 2015
I: 2016
2016 Quarter I: Percent change from prior year
Southwest Minnesota New Limited Liability Companies 405 359 321 291 391 -3.5%
There has been a move in Southwest Minnesota, as in the rest of the state, away from traditional incorporation and towards the limited liability company (LLC). While new business incorporations remain an important indicator of new business formation in Southwest Minnesota, LLCs are increasingly useful in evaluating regional economic performance. As seen below, there is considerable upward trend in LLCs in Southwest Minnesota since 2005. However, this trend may have peaked out in the middle months of 2015. New LLC filings fell by 3.5 percent compared to one year earlier in the most recent quarter.
Year
Filin
gs

7
Business Filings
First quarter assumed names fell by 2.1 percent compared to the same period in 2015. As can be seen in the accompanying figure, while this series has been very volatile in recent years, new assumed names are little changed since the beginning of 2013.
New Assumed Names—Southwest Minnesota Planning Area (12-month moving total)
Quarter I: 2015
II: 2015
III: 2015
IV: 2015
I: 2016
2016 Quarter I: Percent change from prior year
Southwest Minnesota New Assumed Names 194 200 132 163 190 -2.1%
Year
Filin
gs

8
Business Filings
There were 28 newly registered non-profits in the first quarter. This is one less than one year ago. As can be seen in the graph below, the non-profits series has increased considerably since the beginning of 2014.
New Non-Profits—Southwest Minnesota Planning Area (12-month moving total)
Quarter I: 2015
II: 2015
III: 2015
IV: 2015
I: 2016
2016 Quarter I: Percent change from prior year
Southwest Minnesota New Non-Profits 29 28 31 35 28 -3.4%
Year
Filin
gs

9
Business Filings
The first map shown below is a visual representation of new business formation around the Southwest Minnesota planning area in the first quarter of 2016. The densest areas of new business formation are in the Mankato metro. Little pockets of new business formation can also be found in Marshall, Worthington, New Ulm, and St. Peter. Well-traveled roadways are also a predictor of new business formation in Southwest Minnesota.
Southwest Minnesota Planning Area--New Business Formation--Quarter 1: 2016
10
Business Filings
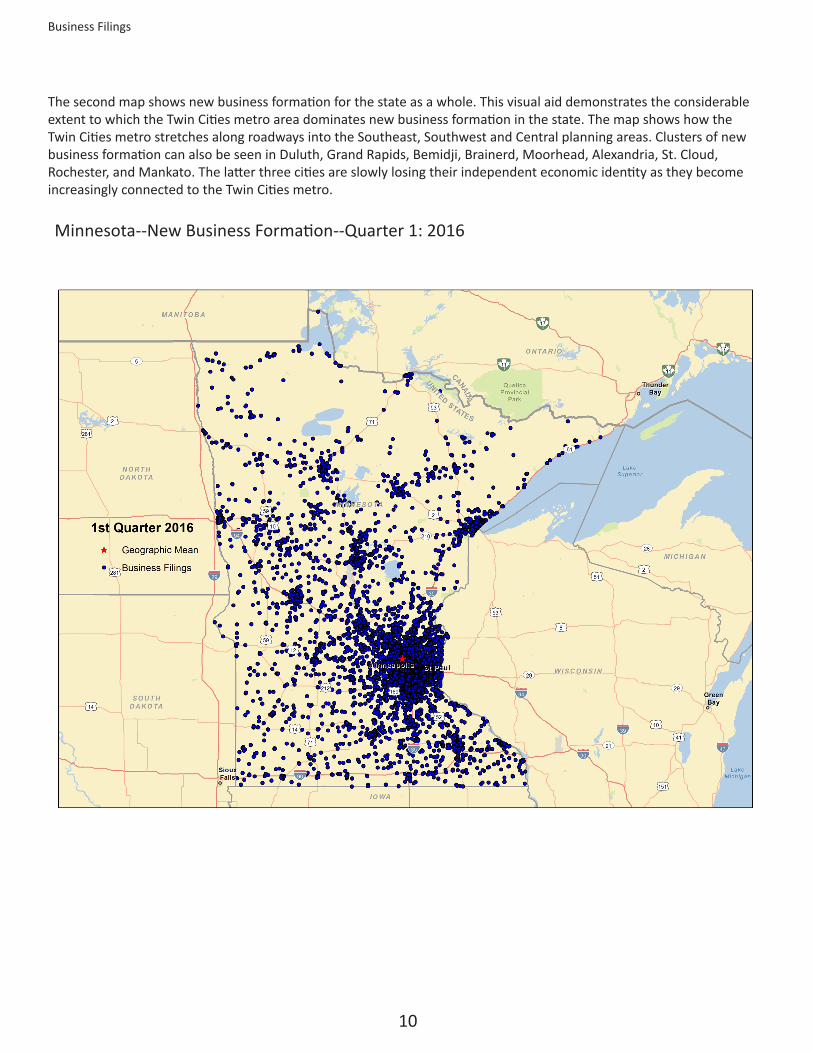
The second map shows new business formation for the state as a whole. This visual aid demonstrates the considerable extent to which the Twin Cities metro area dominates new business formation in the state. The map shows how the Twin Cities metro stretches along roadways into the Southeast, Southwest and Central planning areas. Clusters of new business formation can also be seen in Duluth, Grand Rapids, Bemidji, Brainerd, Moorhead, Alexandria, St. Cloud, Rochester, and Mankato. The latter three cities are slowly losing their independent economic identity as they become increasingly connected to the Twin Cities metro.
Minnesota--New Business Formation--Quarter 1: 2016

11
Southwest Minnesota Labor Market ConditionsEmployment of residents of the Southwest Minnesota planning area grew 0.7 percent over the past year. As can be seen in the accompanying graph, the 12-month moving employment average trended upward from the middle of 2014, but has declined in the two recent quarters. Using non-seasonally adjusted data, Southwest Minnesota planning area employment in March 2016 (see accompanying table) was 216,210, an increase of 1,574 over the prior year.
Note: seasonally adjusted labor market data are typically not available to evaluate regional economic performance so some series have been created to illustrate seasonal patterns of the regional labor market. Graphs of these indicators are found in this section of the report. Tabular data are not seasonally adjusted.
Employment—Southwest Minnesota Planning Area (12-month moving average)
Month March2015
October 2015
November 2015
December 2015
January 2016
February 2016
March2016
Employment (Not seasonally
adjusted)214,636 222,054 219,468 218,343 216,983 213,958 216,210
Year
Empl
oym
ent

12
Labor Market Conditions
Empl
oym
ent
The seasonally adjusted unemployment rate in Southwest Minnesota may have bottomed out in the third quarter of 2015. Both the seasonally and non-seasonally adjusted unemployment rates rose in the first quarter. The non-seasonally adjusted measure now stands at 4.9 percent — an increase from the 4.7 percent rate recorded in March 2015. Note that an increase in the planning area labor force may help explain this rise in the regional unemployment rate.
Unemployment Rate, seasonally adjusted—Southwest Minnesota Planning Area
Month March2015
October 2015
November 2015
December 2015
January 2016
February 2016
March2016
Unemployment rate(not seasonally adjusted) 4.7% 2.9% 2.9% 3.9% 4.9% 4.8% 4.9%
Year
Une
mpl
oym
ent r
ate

13
Labor Market Conditions
New claims for unemployment insurance in March 2016 were 11.4 percent lower than one year earlier. The accompanying graph shows a seasonally adjusted series of initial unemployment claims. This series drifted upward in 2015 but has declined in recent months.
Total Initial Claims for Unemployment Insurance, seasonally adjusted—Southwest Minnesota Planning Area
Month March2015
October 2015
November 2015
December 2015
January 2016
February 2016
March2016
Initial claims(Not seasonally adjusted) 1,333 1,229 2,830 3,366 2,053 1,319 1,181
Year
Clai
ms

14
Labor Market Conditions
The number of job vacancies per 100 unemployed remained elevated in last year’s fourth quarter (this is the most recently available data). The labor shortage in this region persists—there are nearly as many jobs available as there are unemployed people to fill these jobs. With a job vacancy rate approaching 100, the Southwest region has a job vacancy rate that is the third highest of any of Minnesota’s six planning areas. Only the Twin Cities and Southeast planning areas have a higher rate of job vacancies. Seasonally adjusted unemployment data are used in constructing the chart below. None of the figures reported in the table are seasonally adjusted.
Quarter 2013:II 2013:IV 2014:II 2014:IV 2015:II 2015:IV Job Vacancies per 100 Unemployed 45.32 55.49 73.58 97.46 89.44 96.43
Job Vacancies per 100 Unemployed--Southwest Minnesota Planning Area
Quarter
Vaca
ncie
s
15
Labor Market Conditions
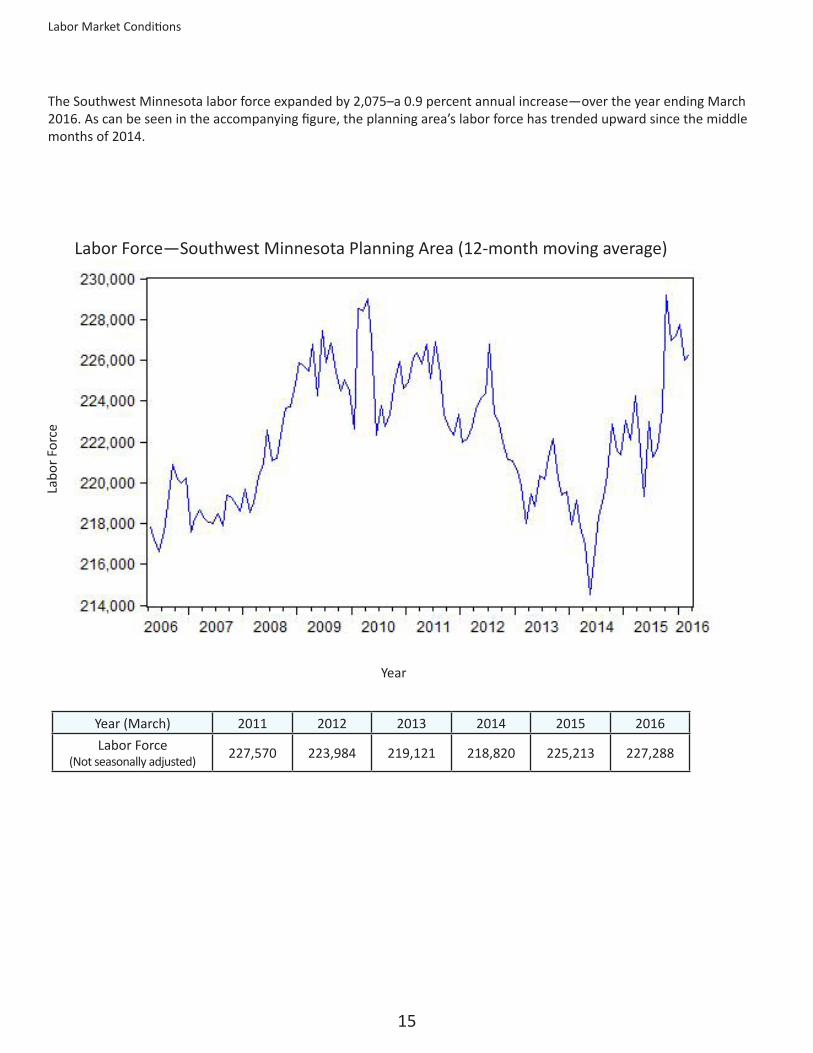
The Southwest Minnesota labor force expanded by 2,075–a 0.9 percent annual increase—over the year ending March 2016. As can be seen in the accompanying figure, the planning area’s labor force has trended upward since the middle months of 2014.
Labor Force—Southwest Minnesota Planning Area (12-month moving average)
Year (March) 2011 2012 2013 2014 2015 2016Labor Force
(Not seasonally adjusted) 227,570 223,984 219,121 218,820 225,213 227,288
Year
Labo
r For
ce

16
The figure below shows the 12-month moving total for Southwest Minnesota bankruptcies since the second quarter of 2007 (shortly before the beginning of the Great Recession). As can be seen in the figure, this moving total increased until the end of 2009, and steadily declined until the fourth quarter of last year. With 510 bankruptcies over the past twelve months, the level of bankruptcies in Southwest Minnesota has started rising. The level of annual bankruputcies in the first quarter of 2016 is now higher than that which was observed the prior year. This is the only one of Minnesota’s planning areas to begin experiencing rising bankruptcies.
Southwest Minnesota Bankruptcies (12-month moving total)
Southwest Minnesota Bankruptcies
Year (First Quarter) 2011 2012 2013 2014 2015 2016Annual Bankruptcies(Not seasonally adjusted) 997 847 725 639 504 510
Quarter
Bank
rupt
cies
17
Economic Indicators
Mankato-North Mankato MSA Indicators Period Covered Current
Period Prior Year Annual Percent Change
Long-Term Average (since 1999, unless noted)
Labor Market
Employment March 2016 (m) 56,132 55,372 1.4% ↑ 0.9%
Goods-Producing Employment March 2016 (m) 9,357 9,728 -3.8% ↓ -0.7%
Average Weekly Work Hours - Private Sector March 2016 (m) 30.0 31 -3.2% ↓ 32.4 (since 2008)
Average Earnings Per Hour - Private Sector March 2016 (m) $22.86 $22.04 3.7% ↑ -0.2% (since 2008)
Unemployment Rate March 2016 (m) 3.5% 3.3% NA ↑ 4.4%
Labor Force March 2016 (m) 60,808 59,501 2.2% ↑ 0.8%
Initial Jobless Claims March 2016 (m) 353 280 26.1% ↑ NA
Business Formation
Total New Business Filings First Quarter 2016 (q) 200 215 -7.0% ↓ 163 (since 2000)
New Business Incorporations First Quarter 2016 (q) 10 18 -44.4% ↓ 27 (since 2000)
New Limited Liability Companies First Quarter 2016 (q) 117 123 -4.9% ↓ 74 (since 2000)
New Assumed Names First Quarter 2016 (q) 62 65 -4.6% ↓ 54 (since 2000)
New Non-profits First Quarter 2016 (q) 11 9 22.2% ↑ 7 (since 2000)
Mankato / North Mankato Residential Building Permit Valuation,in thousands
March 2016 (m) 2,642 3,569 -26.0% ↓ NA
Mankato / North Mankato Cost of Living Index Annual Average 2015 94.5 95.1 -0.6% ↓ NA
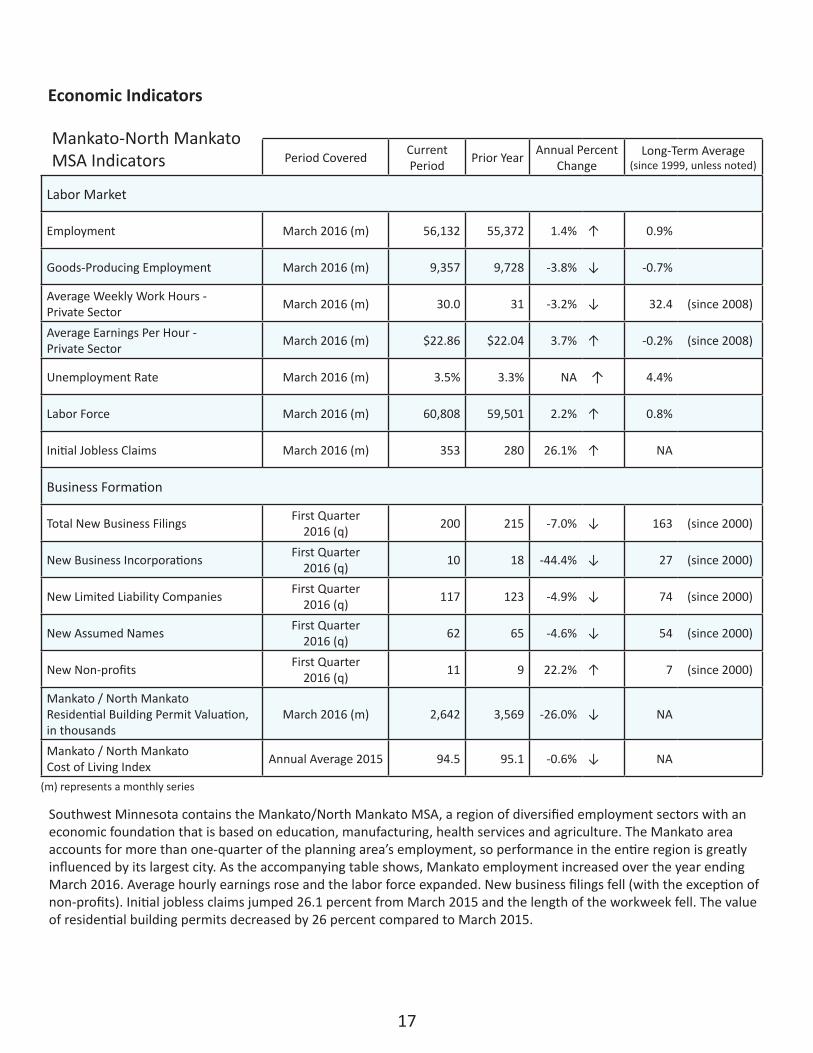
Southwest Minnesota contains the Mankato/North Mankato MSA, a region of diversified employment sectors with an economic foundation that is based on education, manufacturing, health services and agriculture. The Mankato area accounts for more than one-quarter of the planning area’s employment, so performance in the entire region is greatly influenced by its largest city. As the accompanying table shows, Mankato employment increased over the year ending March 2016. Average hourly earnings rose and the labor force expanded. New business filings fell (with the exception of non-profits). Initial jobless claims jumped 26.1 percent from March 2015 and the length of the workweek fell. The value of residential building permits decreased by 26 percent compared to March 2015.
(m) represents a monthly series

18
Economic Indicators
State and National Indicators
Across the state there was growth in payrolls and higher earnings per hour in the private sector over the past twelve months. The seasonally adjusted unemployment rate inched up over the past twelve months and average weekly hours worked in the private sector declined. Indicators from the Federal Reserve Bank of Philadelphia suggest improved current and future conditions in the state economy (although the leading indicators index was lower than last year). The Minnesota Business Conditions index surged in recent months. Milk prices were 9.2 percent lower than one year ago in March. This has been a particularly difficult period for those who make a living in milk production. Enplanements at the Minneapolis-St. Paul airport increased by 2 percent over the last twelve months.
On balance, the national economic indicators reported in the table suggest improved economic activity in recent months. While industrial production was lower and stock prices fell, most of the indicators showed strength. Employment, consumer expenditures, and income all experienced growth over the recent quarter and the national unemployment rate stabilized. Retail sales have shown some recent weakness and oil prices have stabilized in recent months (which is a welcome sign in the domestic energy sector). New building permits were much stronger than one year ago as residential construction continues to recover from historically low levels during the Great Recession.
MINNESOTA Indicators Mar 2016 Dec 2015 Mar 2015
Change from one
quarter agoAnnual Change
Nonfarm payroll employment, SA 2,876,500 2,875,700 2,845,500 0.3% 1.1%Average weekly hours worked, private sector 33.5 33.7 33.9 -0.6% -1.2%Unemployment rate, seasonally adjusted 3.7% 3.7% 3.6% NA NAEarnings per hour, private sector $26.82 $26.36 $26.32 1.7% 1.9%Philadelphia Fed Coincident Indicator, MN 177.73 176.69 173.74 0.6% 2.3%Philadelphia Fed Leading Indicator, MN 1.42 1.06 1.89 33.4% -24.9%Minnesota Business Conditions Index 50.7 39.4 50.0 28.7% 1.4%Price of milk received by farmers (cwt) $15.80 $17.00 $17.40 -7.1% -9.2%Enplanements, MSP airport, thousands 1,662.9 1,429.0 1,629.6 16.4% 2.0%
NATIONAL Indicators Mar 2016 Dec 2015 Mar 2015
Change from one
quarter agoAnnual Change
Nonfarm payroll employment, SA, thousands 143,774 143,146 140,972 0.4% 2.0%Industrial production, index, SA 103.4 104.1 105.5 -0.7% -2.0%Real retail sales, SA ($) 187,831 188,936 186,219 -0.6% 0.9%Real personal income less transfers ($, bill.) 11,821.5 11,737.8 11,422.4 0.7% 3.5%Real personal consumption expenditures ($, bill.) 11,397.1 11,358.5 11,104.4 0.3% 2.6%Unemployment rate, SA 5.0% 5.0% 5.5% NA NANew building permits, SA, thousands 19,300 17,620 17,477 9.5% 10.4%Standard & Poor’s 500 stock price index 2,022 2,054.1 2,080 -1.6% -2.8%Oil, price per barrel in Cushing, OK $37.55 $37.19 $47.82 1.0% -21.5%

19
Sources
The Southwest Minnesota Quarterly Economic and Business Conditions Report is a collaboration between the Office of the Minnesota Secretary of State and the School of Public Affairs Research Institute (SOPARI) of St. Cloud State University. All calculations and text are the result of work by SOPARI, which is solely responsible for errors and omissions herein.
Text authored by Professors King Banaian and Rich MacDonald of the Economics Department of St. Cloud State University. Research assistance provided by Paul Ryan, Alex Franta, and Joseph Kucan. Professor David Wall of the SCSU Geography Department provided GIS assistance.
Sources
Council for Community and Economic Research: Cost of Living Index.
Creighton University Heider College of Business: Minnesota Business Conditions Index, Rural MainStreet Index.
Federal Reserve Bank of Philadelphia: Minnesota Coincident Indicator Index, Minnesota Leading Indicators Index.
Federal Reserve Board of Governors: Industrial Production.
Institute for Supply Management: Manufacturing Business Survey, Purchasing Managers Index.
Metropolitan Airports Commission: MSP Enplanements.
Minnesota Department of Employment and Economic Development (and U.S. Department of Labor Bureau of Labor Statistics):
Average Hourly Earnings, Average Weekly Work Hours, Employment, Initial Claims for Unemployment Insurance, Job Vacancies, Labor
Force, Manufacturing Employment, Unemployment Rate.
Office of the Minnesota Secretary of State: Assumed Names, Business Incorporations, Limited Liability Companies, Non-Profits.
Standard & Poor’s: Standard & Poor’s 500 Stock Price Index.
Thomson Reuters and University of Michigan: Index of Consumer Sentiment
U.S. Bankruptcy Courts: Bankruptcies
U.S. Bureau of Census: Durable Goods Orders, Housing Permits, Residential Building Permits, Retail Sales.
U.S. Department of Agriculture: Milk Prices.
U.S. Department of Commerce Bureau of Economic Analysis: Real Personal Consumption, Real Personal Income, Real Wages and
Salaries.
U.S. Energy Information Administration: Oil Prices.