southern power distribution company of a.p limited
TRANSCRIPT

SOUTHERN POWER DISTRIBUTION
COMPANY OF A.P LIMITED
19-13-65/A, Vidyut Nilayam, Srinivasapuram, Tirupati (www.apspdcl.in)
Aggregate Revenue Requirement and Tariff Proposal for
the Retail Supply Business for FY 2020-21
2nd December 2019

BEFORE THE HONOURABLE ANDHRA PRADESH ELECTRICITY REGULATORY
COMMISSION
AT ITS OFFICE AT 4th FLOOR, SINGARENI BHAVAN, RED HILLS, HYDERABAD
FILING NO.______/2019
CASE NO. _______/2019
In the matter of:
Filing of the ARR application in respect of Retail Supply Business and proposed Tariffs for the
FY 2020-21 in accordance with the “Andhra Pradesh Electricity Regulatory Commission (Terms
And Conditions For Determination Of Tariff For Wheeling And Retail Sale Of Electricity)
Regulation, 2005 and amendments issued from time to time” by the Southern Power Distribution
Company of Andhra Pradesh Limited (‘APSPDCL’ or ‘the Company’ or ‘the Licensee’) as the
Distribution and Retail Supply Licensee.
In the matter of:
SOUTHERN POWER DISTRIBUTION COMPANY OF ANDHRA PRADESH LIMITED
… Applicant
AFFIDAVIT OF APPLICANT VERIFYING THE APPLICATION ACCOMPANYING
FILING AS PER TERMS AND CONDITIONS OF TARIFF FOR WHEELING AND RETAIL
SALE OF ELECTRICITY
I, Bathula Lalitha, D/o of Late Sri Bathula Raja Rao, aged about 51 years working for gain at the
Southern Power Distribution Company of Andhra Pradesh Limited do solemnly affirm and say as
follows:
1 I am the Chief General Manager / RAC of APSPDCL, the Licensee that has, vide the Honourable
Commission’s approval in proceedings no. APERC/Secy/Engg/No.6 dt.31.3.2000, been granted
the distribution and retail supply functions that APTransco was authorised to conduct or carry out
under the Act and the license, with respect to the business of distribution and retail supply of
electricity in the Southern distribution zone in Andhra Pradesh. On December 27, 2000, the
Honourable Commission has awarded a Distribution and Retail Supply License to APSPDCL, to
be effective from April 1, 2001. I am competent and duly authorised by APSPDCL to affirm,
swear, execute and file this affidavit in the present proceedings.
2 As such, I submit that I have been duly authorised by the Board of Directors of APSPDCL to submit
the application, as per Terms and Conditions of Tariff for Wheeling and Retail Sale of Electricity
(Regulation 4 of 2005) of APSPDCL for the FY 2020-21 to the Honourable Commission.
3 I submit that I have read and understood the contents of the appended application of APSPDCL.
The facts stated in the application are true to the best of my knowledge, which are derived from the
official records made available and certain facts stated are based on information and advice which,
I believe to be true and correct.


iii
BEFORE THE HONOURABLE ANDHRA PRADESH ELECTRICITY REGULATORY
COMMISSION
AT ITS OFFICE AT 4th FLOOR, SINGARENI BHAVAN, RED HILLS, HYDERABAD -04
FILING NO.______/2019
CASE NO. _______/2019
In the matter of:
Filing of the ARR application in respect of Retail Supply Business and proposed Tariffs for the
FY 2020-21 under multi-year tariff principles in accordance with the “Andhra Pradesh
Electricity Regulatory Commission (Terms And Conditions For Determination Of Tariff For
Wheeling And Retail Sale Of Electricity) Regulation, 2005 and First Amendment Regulation,
2014” by the Southern Power Distribution Company of Andhra Pradesh Limited (‘APSPDCL’
or ‘the Company’ or ‘the Licensee’) as the Distribution and Retail Supply Licensee.
In the matter of:
SOUTHERN POWER DISTRIBUTION COMPANY OF ANDHRA PRADESH LIMITED
… Applicant
The Applicant respectfully submits as under:
1 This filing is made by the SOUTHERN POWER DISTRIBUTION COMPANY OF ANDHRA
PRADESH LIMITED (APSPDCL) under Section 61 of the Electricity Act 2003 for
determination of the Aggregate Revenue Requirement and Tariff for the Retail Supply Business
for the year FY 2020-21.
2 The licensee has adopted the following methodology to arrive at the ARR for retail supply business.
Distribution Cost: The licensee has adopted the distribution cost for FY 2020-21 as approved
in the Wheeling Tariff Order (Distribution Business Tariff Order) for 4th MYT control period
(FY 2019-20 to 2023-24). The Distribution cost approved for FY 2020-21 is Rs. 4178.00 Cr.
Transmission Cost: The licensee has estimated the transmission cost for FY 2020-21 which
is the second year of 4th Control period (FY 2019-20 to FY 2023-24) as per the Transmission
Tariffs Order, dt. 8th March, 2019. The estimated transmission cost of APSPDCL is Rs.1304.58
Cr for the FY 2020-21.
SLDC Cost: The licensee has estimated the SLDC cost for FY 2020-21 which is the second
year of 4th Control period (FY 2019-20 to FY 2023-24) as per the SLDC Order, dt. 8th March,
2019. The estimated SLDC cost of APSPDCL is Rs.21.56 Cr for the FY 20-21.

iv
PGCIL and ULDC Costs: The licensee has considered PGCIL and ULDC Charges as per the
CERC Regulations. The projected PGCIL and ULDC Costs for FY 2020-21 is Rs. 1166.31 Cr.
and Rs.2.94 Cr. respectively.
Distribution losses: The licensee has considered losses for H2 FY 2019-20 as per APERC
approved values and projected for FY 2020-21. The following table provides the voltage level
losses considered by the APSPDCL for projecting the energy requirement for H2 FY 2019-20
and FY 2020-21:
Transmission losses: The Licensee has considered the actual losses for H1 FY 19-20 and
approved losses of 3.17% in the Tariff Order FY 2019-20 for H2FY 2019-20 and FY 2020-21.
PGCIL Losses: The Licensee has considered the external (PGCIL) losses as approved by the
Hon’ble Commission at 3.17% in the Tariff Order for FY2019-20 and FY2020-21.
3 Filing of Retail Supply ARR for FY 20-21
As per Regulation No. 4 of 2005, the licensee is required to file the Aggregate Revenue
Requirement (ARR) for Retail Supply Business and Tariff proposal for the entire control period
i.e., for the period from FY 2019-20 to FY 2023-24. However, the licensee requested the
Honourable Commission to allow for submission of the ARR and Tariff filing for Retail Supply
Business for FY 2020-21 on yearly basis.
The Honourable Commission has been kind enough in granting permission to submit the ARR
& Proposed tariff filings in respect of the Retail Supply Business for FY 2020-21 instead of total
control period of FY 2019-20 to FY 2023-24 vide APERC Proceeding No.T-83/2019, Dt. 28-8-19.
4 Performance Analysis of APSPDCL for the previous year FY2018-19 and current year FY 2019-20
Performance Analysis: A brief analysis of the licensee business for FY 2018-19 and FY 2019-20 is
as follows:

v
Revenue
The table below shows a comparison of the revenue from various consumer categories as approved in
the Tariff Order and as billed (FY 2018-19) and expected to be billed (FY 2019-20) by APSPDCL.
Category Wise Revenue: (Figures shown in Rs Crores)
5 Retail Supply Business True-up for FY 2018-19 and Provisional True-up for FY 2019-20
The licensee has submitted the True-up petition for FY 2018-19 before the Honourable
Commission on 07-11-2019. The provisional True-up of power purchase cost for FY 2019-20 is
given below.
Rs. Crs.
2019-20
Particulars Approved Present Estimate Diff.
Power Purchase/Procurement Cost 16805.80 20404.12 3598.32
The station wise estimated power purchase cost for FY 2019-20 is as per Retails Supply Format No.1.4
PP Cost. The licensee prays that the Honourable Commission may approve the provisional true-up of
Rs.3598.32 Crs. on account of power purchase cost variation.
6 ARR Projections for FY 2020-21
Sales Estimates for FY 2020-21
The licensee has adopted a modified trend approach for projecting the category-wise sales for the
ensuing year. As the name suggests, the licensee has considered the historical growth trend observed
in the sales of categories for the last 5 years from FY 2014-15 to FY 2018-19 and the same has been
applied to compute the sales for H2 FY 2019-20 also for FY 2020-21. The sales so computed are

vi
moderated based on the other relevant inputs such as underlying economic growth drivers, number of
pending applications etc. The historical sales growth of 8 districts are used to project the sales of 8
districts for H2 FY 2019-20 & FY 2020-21. The total sales forecast for key categories is as follows:
Due to optimum energy availability in the state, the licensee is not considering any load relief in H2 of
FY 2019-20 and FY 2020-21.
Yearly Growth Rate:
Number of hours of Supply to LT Agricultural Consumers in FY 2020-21:
The licensee would like to continue with existing 9 hours of power supply to agricultural consumers
in FY2020-21.
Revenue estimate at Current Tariffs for APSPDCL in FY 2020-21
Revenue projected at current tariffs incl. NTI is Rs.18247.33 Crs. Revenue from key categories at
current tariff for FY 2020-21 is shown below:

vii
Power Purchase Requirement and Cost Estimate for the state of Andhra Pradesh for FY 2020-21
Subsequent to the bifurcation of the erstwhile State of Andhra Pradesh as per the Andhra
Pradesh Reorganization Act, 2014 (Central Act No. 6 of 2014, dated 01.03.2014), the Southern Power
Distribution Company of AP Ltd. (APSPDCL) and the Eastern Power Distribution Company of AP
Ltd. (APEPDCL) emerged as the Distribution Licensees of the present State of Andhra Pradesh. As
per section 92 read with the Twelfth Schedule of the above Act, the districts of Anantapur and Kurnool
which were within the jurisdiction of the erstwhile APCPDCL (Central Power Distribution Company
AP Ltd., now TSSPDCL (Southern Power Distribution Company of Telangana Limited)) were
transferred to the APSPDCL (Southern Power Distribution Company of AP Ltd.). Further, as per the
G.O.Ms. No.20 (dated 08.05.2014), 17.45% share of power held by the erstwhile APCPDCL was
transferred to APSPDCL based on the last 5 years’ average consumption of Anantapur and Kurnool
districts at the time of bifurcation. After factoring the above transfer, the present DISCOMS
(Distribution Companies) of Andhra Pradesh have 46.11% share of power out of the share held by
the erstwhile four Distribution Companies in the Power Stations of Central Sector. With effect from
June 2017, power from APGENCO stations is being fully availed by the AP DISCOMs without
allocation to TS DISCOMs and vice-versa. Presently the shares of APEPDCL and APSPDCL
(Distribution Companies of AP) in the Power Purchase Agreements (PPAs) is 34.27% & 65.73%
respectively. The details of capacities being availed by APDISCOMs from various power stations
have been described in the subsequent paragraphs.
The following are the key assumptions considered by the licensee with regard to power purchase
availability by the licensee –
APGENCO STATIONS
APDISCOMS have been purchasing power from APGENCO Stations based on the long term
PPAs/approval of Hon’ble APERC. From FY 2014-15, APDISCOMs have been availing 100%
power from APGENCO Hydel stations and similarly TSDISCOMs have been availing 100% power
from TSGENCO Hydel Stations. Further, as per the directions of Government of Andhra Pradesh,
APGENCO implemented Power Regulation to TSDISCOMS (Distribution Companies of Telangana)
from their thermal stations w.e.f 11.06.2017 due to the non-payment of dues by TSDISCOMs.
Similarly, TSGENCO (Telangana State Generating Company) also regulated Power from their
thermal stations to APDISCOMS w.e.f the same date. In view of the Power Regulation to
TSDISCOMs, APGENCO requested APDISCOMS to avail 100% power from their thermal Stations.
Accordingly, APDISCOMs have been purchasing 100% Power from APGENCO thermal Stations
since 11.06.2017. Further, as of now, APDISCOMs are not availing any power from TSGENCO.
New Power Plants, Dr.NTTPS-V and DSSTPS-II are expected to be commissioned by Oct’20.
APDISCOMS propose to purchase the power from these plants subject to the approval of Hon’ble
APERC.
CENTRAL GENERATING STATIONS
APDISCOMS have been purchasing power from Central Generating Stations controlled/owned by GoI
based on the long term PPAs. The list of the Stations along with the APDISCOMs’ share of power
from these Stations (as per the Regional Energy Account issued by SRPC for the month of Sep’19) are
indicated in the following table. Further, APDISCOMs have been purchasing bundled power from

viii
thermal Stations of NTPC which was allocated by MOP/GOI against the solar power procurement by
APDISCOMs under JNNSM Phase I &II. NNTP (New Neyveli Thermal Plant) of NLC is expected to
be commissioned by Dec’19.
GAS – OLD INDEPENDENT POWER PRODUCERS
GGPP (Godavari Gas Power Plant-216.824 MW, formerly GVK PHASE-I)
The PPA with GVK-I expired on 19.06.2015. Subsequently, APDISCOMs bought the power plant on
22.04.2016 and renamed it as GGPP. The plant is being operated by the employees deputed from
APGENCO. GoAP vide letter dated 04.05.2018 approved the proposal of APDISCOMs to hand over
the plant to APGENCO. The process of handing over the plant is under progress. APDISCOMs are at
present dispatching the energy from this plant based on the approval given by Hon’ble APERC in the
Retail Tariff Order for FY 2019-20. APDISCOMs propose to avail the power from this plant during
FY 2020-21 also subject to the approval of Hon’ble APERC.
SPGL (Spectrum Power Generation Limited-205.187MW)
Upon the expiry of PPA with the plant on 18.04.2016, APDISCOMs proposed to renew the PPA for
a further period of 15 years and accordingly sent the proposal to GoAP for consent. If the consent is
received from GoAP, APDISCOMs will file the draft PPA before Hon’ble APERC for approval.
APDISCOMs are at present purchasing the power from this plant at the rates approved in the Retail
Tariff Order for FY 2019-20. Pending permission from GoAP, APDISCOMs propose to purchase the
power from this plant during FY 2020-21 also subject to the approval of Hon’ble APERC.
GAS – NEW INDEPENDENT POWER PRODUCERS
APDISCOMs of erstwhile united AP State entered into long term PPAs with GVK Extension (220
MW), GVPGL(GMR Vemagiri Power Generation Limited-370 MW), Gouthami CCPP(464 MW) and
Konaseema Gas Power Limited(444.08 MW). These new IPPs were commissioned during the years
2006 (GVPGL), 2009 (GVK Extension, Gouthami CCPP) and 2010 (Konaseema Gas Power Limited).
After bifurcation of AP State, APDISCOMs of the present AP State were allocated 46.11% of share of
capacity in these plants. The Natural gas supplies from RIL KG D-6 fields to the aforesaid IPPs became
zero w.e.f. 01.03.2013. As a result, there is no generation from these plants as of now. Further, there
is no official communication from MoP&NG on the availability of natural gas to these plants. The e-
bid RLNG Scheme ended by 31.03.2017and MoP/GOI has not extended the scheme. Therefore,
APDISCOMs are not proposing to procure any power from these plants. Further, APDISCOMs are
not presently paying any fixed charges to these plants.
APGPCL (AP GAS POWER CORPORATION LIMITED)
APGPCL is a joint sector gas-based power project. APDISCOMs are availing power from this
project to the extent of APTRANSCO’s equity share in the project.

ix
OTHER RENEWABLE ENERGY PLANTS
APDISCOMs are having PPAs with the following Other Renewable Energy plants (stable energy
producing plants) for the second half of FY 2019-20 and FY 2020-21as given below. Renewable
Energy based projects have been allocated to the APDISCOMs based on location basis (see Go Ms
No 116, Dt 1-10-2019).
VARIABLE RENEWABLE ENERGY PLANTS
APDISCOMs are having PPAs with the following class of Variable Renewable Energy/ Non-
Conventional based Projects for the second half of FY 2019-20 and FY 2020-21as given below.
Renewable Energy based projects have been allocated to the APDISCOMs based on location basis
(see Go Ms No 116, Dt 1-10-2019). Further the Solar PPA in respect of Ghani project has been
assigned to APSPDCL instead of APEPDCL vide the amendment PPA entered into between M/s
NTPC and APSPDCL on 18-11-2019. The Amendment is effective from 1st April 2018.
VARIABLE RENEWABLE ENERGY
In view of variable nature of generation with a character of non-dispatchability, the availability from
VRE sources has not been considered for Power Purchase Cost calculations. The energy from VRE
sources cannot be scheduled for day ahead or week ahead planning. The generation from these sources
is considered as inadvertent/infirm in nature. As such the generation from VRE sources will be used
subject to its availability as per grid code
ENERGY REQUIREMENT
The DISCOM wise Energy Requirement are tabulated below.
DISCOM FY 2019-20H2 FY 2020-21
APEPDCL 11925.7
26358.53
APSPDCL 21385.7
43618.65
Total 33311.3
69977.18
The energy requirement of APDISCOMs has been arrived at by grossing up the sales with appropriate
transmission and distribution losses. The external losses (PGCIL losses) on the power purchased from
CGS (excluding NTPC Simhadri-I), KSK Mahanadi and Sembcorp Energy India Limited have also
been factored for arriving at the above energy requirement.
VRE SUBSIDY
The highest technical authority in the Country i.e. the Central Electricity Authority (CEA) has
identified the VRE integration cost by the RE rich states such as AP for accommodating the Renewable
Energy duly backing down the conventional generation. The consumption of this VRE in place of
dispatchable energy will entail the following subsidy.
FY 2019-20 H2 – Rs Crs FY 2020-21 Rs Crs
Minimum Rs 1062.62 Cr Rs. 2324.66 Cr
Maximum Rs 1592.70 Cr Rs 3498.90 Cr.

x
This additional burden has to be made good through a special provision of subsidy in the name of
VRE subsidy. This is in addition to the aforementioned power purchase cost and paid directly by
Govt. of A.P to developers.
PP COST SUMMARY
Based on the availability, requirement and costs for each source, the summary of power purchase cost
for Andhra Pradesh for H2 FY 2019-20 is projected as follows:
FY 2019-20 H2
Source Energy
Availability
Energy
Dispatch
(MU)
Total Cost (Rs
Crs)
Per Unit Cost
(Rs/kWh)
APGENCO Thermal
and DSTPP-I &II 14,561.38 14,561.38 7,592.04 5.21
APGENCO Hydel 1,444.98 1,444.98 294.77 2.04
CGS 9,561.09 9,483.69 4,076.61 4.30
APGPCL 39.96 39.96 15.68 3.92
IPPs – Gas 909.62 909.36 291.98 3.21
KSK Mahanadhi 1,485.12 1,485.12 634.13 4.27
Sembcorp Energy 1,007.05 1007.05 374.19 3.72
Market Purchases 188.35 4,378.07 2118.99 4.84
Gross Purchases 29,197.55 33,309.61 15,398.39 4.62
Based on the availability, requirement and costs for each source, the summary of power purchase
cost for Andhra Pradesh for FY 2020-21 is projected as follows:
FY 2020-21
Source Energy
Availability
Energy
Dispatch (MU) Cost (Rs Crs)
Per Unit Cost
(Rs/kWh)
APGENCO Thermal
and DSTPP-I &II 37,114.68 36,230.71 19,604.92 5.41
APGENCO Hydel 3,137.50 3,137.50 601.41 1.92
CGS 18,806.38 18,358.87 8,585.90 4.68
APGPCL 86.78 86.78 43.09 4.97
IPPs – Gas 1,981.07 1,981.07 650.96 3.29
Other Renewable
Energy Sources 338.03 338.03 174.71 5.17
KSK Mahanadhi 2,978.40 2,978.40 1,328.34 4.46

xi
FY 2020-21
Source Energy
Availability
Energy
Dispatch (MU) Cost (Rs Crs)
Per Unit Cost
(Rs/kWh)
Sembcorp Energy 1,916.54 1,916.54 747.73 3.90
Market Purchases 4949.36 2133.17 4.31
Total Purchases 66,359.38 69,977.26 33,870.23 4.84
Average Revenue Realized vs Average CoS break up for APSPDCL in FY 2020-21
Average Revenue Realisation (ARR) for FY 2020-21 through proposed tariffs is Rs.4.94/kWh
Average Cost of Supply (CoS) for APSPDCL - Rs. 7.36/kWh
Average CoS break-up (per unit of Sales) for APSPDCL is as follows:-
The estimated revenue gap for the licensee for FY 2020-21 is as follows:
xii
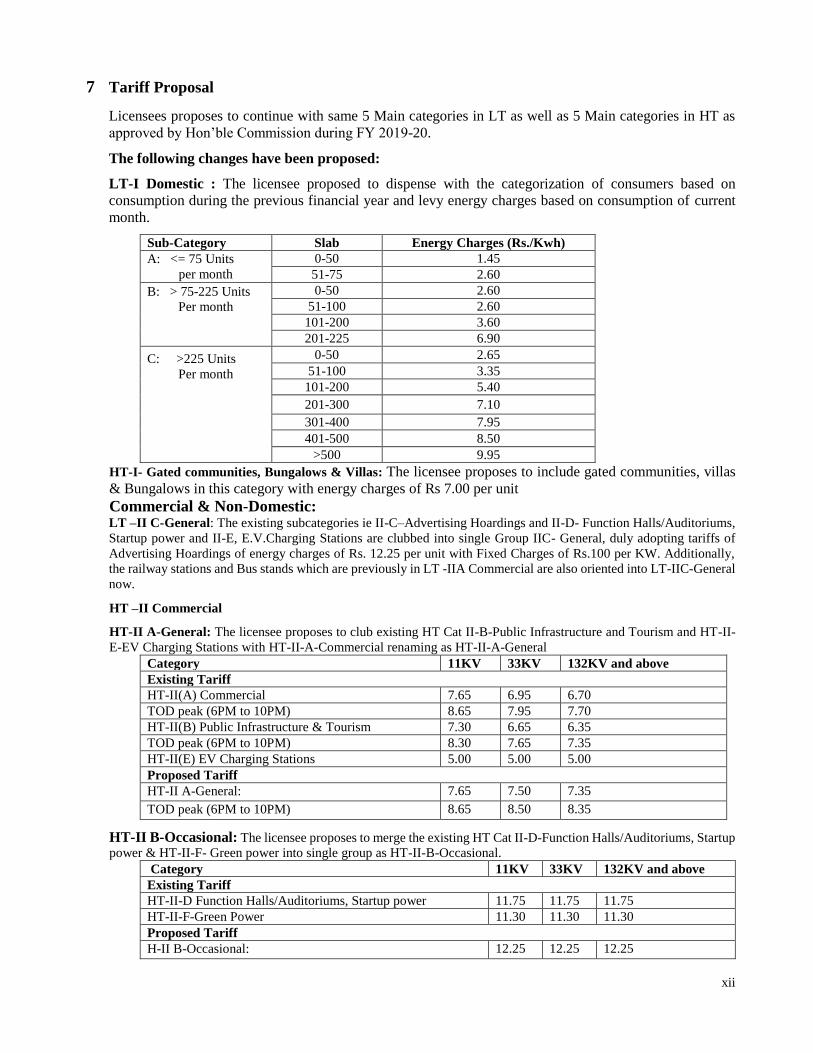
7 Tariff Proposal
Licensees proposes to continue with same 5 Main categories in LT as well as 5 Main categories in HT as
approved by Hon’ble Commission during FY 2019-20.
The following changes have been proposed:
LT-I Domestic : The licensee proposed to dispense with the categorization of consumers based on
consumption during the previous financial year and levy energy charges based on consumption of current
month.
Sub-Category Slab Energy Charges (Rs./Kwh)
A: <= 75 Units
per month
0-50 1.45
51-75 2.60
B: > 75-225 Units
Per month
0-50 2.60
51-100 2.60
101-200 3.60
201-225 6.90
C: >225 Units
Per month
0-50 2.65
51-100 3.35
101-200 5.40
201-300 7.10
301-400 7.95
401-500 8.50
>500 9.95
HT-I- Gated communities, Bungalows & Villas: The licensee proposes to include gated communities, villas
& Bungalows in this category with energy charges of Rs 7.00 per unit
Commercial & Non-Domestic: LT –II C-General: The existing subcategories ie II-C–Advertising Hoardings and II-D- Function Halls/Auditoriums,
Startup power and II-E, E.V.Charging Stations are clubbed into single Group IIC- General, duly adopting tariffs of
Advertising Hoardings of energy charges of Rs. 12.25 per unit with Fixed Charges of Rs.100 per KW. Additionally,
the railway stations and Bus stands which are previously in LT -IIA Commercial are also oriented into LT-IIC-General
now.
HT –II Commercial
HT-II A-General: The licensee proposes to club existing HT Cat II-B-Public Infrastructure and Tourism and HT-II-
E-EV Charging Stations with HT-II-A-Commercial renaming as HT-II-A-General
Category 11KV 33KV 132KV and above
Existing Tariff
HT-II(A) Commercial 7.65 6.95 6.70
TOD peak (6PM to 10PM) 8.65 7.95 7.70
HT-II(B) Public Infrastructure & Tourism 7.30 6.65 6.35
TOD peak (6PM to 10PM) 8.30 7.65 7.35
HT-II(E) EV Charging Stations 5.00 5.00 5.00
Proposed Tariff
HT-II A-General: 7.65 7.50 7.35
TOD peak (6PM to 10PM) 8.65 8.50 8.35
HT-II B-Occasional: The licensee proposes to merge the existing HT Cat II-D-Function Halls/Auditoriums, Startup
power & HT-II-F- Green power into single group as HT-II-B-Occasional.
Category 11KV 33KV 132KV and above
Existing Tariff
HT-II-D Function Halls/Auditoriums, Startup power 11.75 11.75 11.75
HT-II-F-Green Power 11.30 11.30 11.30
Proposed Tariff
H-II B-Occasional: 12.25 12.25 12.25

xiii
III Industry: HT-III-A : Industry (General) : The licensee proposes to withdraw the load factor incentive scheme for FY 2020-21
HT-III-C-Energy Intensive Industries: The licensee proposes to incorporate a condition to Energy Intensive industries as
follows:
“If the monthly consumption of Energy Intensive Industries falls below 85% Load utilization factor during any billing month,
the consumer shall be billed in HT-III-A-Industry General Category in the billing month”.
IV-Institutional:
LT – Institutional-A-Utilities: The Licensee proposes that the existing subcategories of Panchayats,
Municipalities & Municipal Corporations of IV-A- Street lighting & IV-B-CPWS/PWS schemes and
LT-IV-C-NTR Sujala Pathakam are clubbed into one subcategory and renaming as LT-IV –
Institutional-A-Utilities and the regrouping as Panchayats and Urban Local bodies as follows:
Category Fixed Charges per month
(Rs./HP or KW)
Energy Charges
(Rs per Unit)
Existing Tariff
LT-IV- A- Street lighting (i) Panchayats 75 5.95 (ii) Municipalities 75 6.50 (iii) Municipal Corporations 75 7.05 IV- B- CPWS/PWS Schemes (i) Panchayats 75 4.85 (ii) Municipalities 75 5.95 (iii) Municipal Corporations 75 6.50 IV- C- NTR Sujala Pathakam 10 4.00
Proposed Tariff
LT-IV-A-Utilities
Panchayats 75 7.00
Urban Local bodies 75 7.00
LT – Institutional-B-General: The Licensee proposes renaming of the existing subcategories of IV-
D-General purpose as LT-IV –Institutional-B-General with tariffs as given below:
Category Fixed Charges per month
(Rs./HP or KW)
Energy Charges
(Rs per Unit)
Existing Tariff
LT-IV- D- General purpose 30 7.25
Proposed Tariff
LT-IV-B-General 75 7.00
IV-HT-Institutional:
HT IV-A-Utilities: The Licensee proposes the existing subcategory HT-IV-B-CPWS/PWS Schemes
to be renamed as HT IV-A-Utilities and proposes an increase energy charges 11KV – Rs.7.95, 33KV -
Rs.7.25 & 132KV - Rs.7.00 per unit with fixed charges Rs.475 / KVA / Month.
HT IV-B-General : The Licensee proposes to introduce new category with Govt. offices, Govt.
educational institutions / Hostels, Govt. Hospitals & Charitable institutions with tariff as given below:
Category Fixed Charges per month
(Rs./HP or KW)
Energy Charges
(Rs per Unit)
Existing Tariff (II (A) Commercial)
11 KV 475 7.65
33 KV 475 6.95

xiv
Category Fixed Charges per month
(Rs./HP or KW)
Energy Charges
(Rs per Unit)
132 KV 475 6.70
Proposed Tariff (IV-B General)
11 KV 475 7.95
33 KV 475 7.25
132 KV 475 7.00
HT IV-D-Railway traction: The Licensee proposes to increase in energy charges from Rs. 3.75
to 6.50 per unit.
V-Agriculture and related:
LT-V-Agriculture and related: LT-V-A-Corporate Farmers: The licensee proposes a flat rate
Tariff of Rs. 200/HP/Month in place of energy charges of Rs. 2.50 per unit. LT-V-D-Hatcheries,
Feed Mixing Plants and Floriculture: The licensee proposes an increase in Energy Charges from
Rs. 3.85 to 4.50 per unit
HT-V-Agriculture and related:
HT-V-B-Hatcheries, Feed Mixing Plants and Floriculture: The licensee proposes an increase in
Energy Charges from Rs. 4.85 to 5.25 per unit
HT-V-C-Lift Irrigations: The licensee proposes an increase in Energy Charges from Rs. 5.80 to
7.15 per unit
RECSOs: The activity of RESCOs is similar to that of the Licensee in implementing similar tariffs
as approved by the Hon’ble commission wherein RESCOs draw power from Licensee as
determined by the Commission. In order to encourage a competitive spirit on par with DISCOM,
the Licensee proposes to increase Resco Tariff Rs 3.50 per unit each for both RESCOs.
8 Cross Subsidy Surcharge
The licensee has calculated the cross surcharge subsidy based on the formula specified in the
revised National Tariff Policy issued on 28.01.16.
As per the said Tariff Policy, the surcharge is to be computed as per the following formula;
S= T – [C/ (1-L/100) + D+ R]
Where,
‘S’ in Rs./unit is the Cross Subsidy Surcharge ,
‘T’ is the tariff payable by the relevant category of consumers in Rs./unit, including reflecting the
Renewable Purchase Obligation,
‘C’ is the per unit weighted average cost of power purchase by the Licensee, including meeting the
Renewable Purchase Obligation in Rs./unit ,
‘D’ is the aggregate of transmission, distribution and wheeling charge applicable to the relevant
voltage level in Rs./unit and ‘L’ in percentage is the aggregate of transmission, distribution and
commercial losses, applicable to the relevant voltage level and
‘R’ is the cost of carrying regulatory assets in Rs./kWh.
Provided that the surcharge shall not exceed 20% of the tariff applicable to the category of the
consumers seeking open access.

xv
The category-wise CSS computation for APSPDCL for FY 2020-21 is as follows:
9. Additional Surcharge
The Licensee filed for Additional Surcharge of Rs. 0.95 per unit in petition for ARR of FY
2018-19. The Hon’ble Commission disallowed it with following comments:
“the Licensees have not been able to demonstrate the above conclusively, as the parameters
for grant of additional surcharge prescribed by section 42(4) read with clause 8.5.4 of the
National Tariff Policy, 2016 are not satisfactorily established to exist to sustain such a claim.
Therefore, the Commission is not rendering any decision on the eligibility or otherwise of the
licensees to collect such additional surcharge from a consumer or any class of consumers for
FY2018-19 in the present
consideration. However, the licensees are at liberty to move an appropriate application for the
purpose in accordance with law sufficiently supported by the relevant data and material which
may be considered on merits.”
Hence, the Licensee requests the Hon’ble Commission to determine the methodology for
determination of the Additional Surcharge. Based on the methodology, the Licensee shall file the
Additional Surcharge in supplementary filings.


APSPDCL Page 1
Contents
1 Introduction ______________________________________________________________ 3
1.1 Filings based on Multi-Year Tariff (MYT) Principles __________________________________ 3
1.2 Filing Contents _______________________________________________________________ 3
2 Analysis of expected performance for Current Year FY 2019-20 for Retail Supply Business 5
2.1 Introduction _________________________________________________________________ 5
2.2 Operating Performance ________________________________________________________ 5 2.2.1 Energy Balance _____________________________________________________________________ 5 2.2.2 Distribution Loss ____________________________________________________________________ 5 2.2.3 Metered Sales _____________________________________________________________________ 6 2.2.4 Agricultural Sales ___________________________________________________________________ 6
2.3 Financial Performance _________________________________________________________ 7 2.3.1 Revenues _________________________________________________________________________ 7 2.3.2 Expenditure and Revenue Gap ________________________________________________________ 7
3 Power Purchase Cost for Current Year (FY 2019-20) Second Half and Ensuing Year (FY 2020-21) _____________________________________________________________________ 8
3.1 INTRODUCTION ______________________________________________________________ 8
3.2 CONTRACTED CAPACITY BY DISCOMS ____________________________________________ 8
3.3 AVAILABILITY _______________________________________________________________ 12
3.4 POWER PURCHASE COST ______________________________________________________ 15
3.5 PP COST SUMMARY __________________________________________________________ 20
3.6 VARIABLE RENEWABLE ENERGY SUBSIDY ________________________________________ 21
4 Losses __________________________________________________________________ 24
4.1 DISCOM losses ______________________________________________________________ 24
4.2 TRANSCO losses _____________________________________________________________ 24
4.3 Losses external to APTRANSCO system __________________________________________ 24
5 Expenditure Projections for APSPDCL _________________________________________ 25
5.1 APTransco Charges __________________________________________________________ 25
5.2 PGCIL and ULDC Charges ______________________________________________________ 25
5.3 SLDC Charges _______________________________________________________________ 26
5.4 Distribution Costs ___________________________________________________________ 26
5.5 Interest on Consumer Security Deposits _________________________________________ 27
5.6 Supply Margin ______________________________________________________________ 27
5.7 Other Costs ________________________________________________________________ 28
5.8 Summary of ARR ____________________________________________________________ 30
6 Revenue Projections _______________________________________________________ 31
6.1 Sales Forecast ______________________________________________________________ 31 6.1.1 Trend Method ____________________________________________________________________ 31 6.1.2 LT Sales forecast ___________________________________________________________________ 32 6.1.3 Temporary Supply _________________________________________________________________ 37 6.1.4 HT sales forecast __________________________________________________________________ 38

APSPDCL Page 2
6.2 Revenue from Current Tariffs __________________________________________________ 45 6.2.1 Detailed category wise Revenue computation ___________________________________________ 48 6.2.2 Low Tension Categories _____________________________________________________________ 48 6.2.3 High Tension Categories ____________________________________________________________ 50
7 Average Revenue Realized vs Average CoS break up for APSPDCL in FY 2020-21 _______ 53
8 Performance Parameters ___________________________________________________ 54
9 Cost of Service for FY 2020-21 _______________________________________________ 69
10 Retail Supply Business True-up for FY 2018-19 and True-up for FY 2019-20 : __________ 71
11 Tariff Proposals for FY 2020-21 ______________________________________________ 72
12 Determination of Cross Subsidy Surcharge for FY 2020-21 _________________________ 77
13 Additional Surcharge ______________________________________________________ 79
14 Prayer __________________________________________________________________ 80
Retail Supply Formats _______________________________________________________ 81

APSPDCL Page 3
1 Introduction
1.1 Filings based on Multi-Year Tariff (MYT) Principles
The Andhra Pradesh Electricity Regulatory Commission framed the “Terms and Conditions
for determination of Tariff for Wheeling and retail supply of electricity” Regulation 4 of 2005 and
First Amendment Regulation 2014 (“Regulation 1”), lays down the principles for determination of
Aggregate Revenue Requirement (ARR) for (a) Distribution Business and (b) Retail Supply
Business of the licensees. The ARR so determined for each of the businesses will form the basis
for fixation of charges for wheeling and for retail sale of electricity.
In the Regulation, the Commission has also laid down the procedures for filing under multi-
year tariff principles. The multi-year period is defined as the Control Period and the first Control
Period is defined as the three year period starting from financial year 2006-07 and continuing till
the end of financial year 2008-09. The second control period was defined as the five year period
starting from FY 2009-10 to FY 2013-14. The third control period was defined as the five year
period starting from FY 2014-15 to FY 2018-19. The current filing pertains to the forth Control
Period (FY 2019-20 to FY 2023-24). The Commission has specified in Para 6.2 of the Regulation
the following procedure for ARR filing for the distribution and retail supply business:
“The ARR filing for the Distribution business shall be for the entire Control Period. For
the Retail Supply business the ARR filing will be on annual basis …...”
The current filing follows the principles laid down under this Regulation for determination of
the ARR for the retail supply business for the year FY 2020-21, which is the second year of the
fourth Control Period.
1.2 Filing Contents
The filing is structured in the following way:
Section 2 provides analysis of expected performance for FY 2019-20 for Retail supply Business
comprising:
- Operating Performance
- Financial Performance
A brief analysis of the financial and operational performance of the licensee during FY 2018-
19 and FY 2019-20 (with projections for second half of FY) are given.
Expenditure Projections
o Power Purchase Cost
Power Purchase and Procurement Cost
o Transmission Charges

APSPDCL Page 4
o PGCIL & ULDC Charges
o SLDC Charges
o Distribution Cost
o Interest on Consumer Security Deposits
o Supply Margin
o Other Costs
o Aggregate Revenue Requirement for Retail Supply Business
Revenue Projections
o Sales Forecast
o Revenue from Current Tariffs
o Non-tariff Income at Current Charges
o Revenue at Current Tariffs and Charges
o Revenue from RE certificates
o Revenue from Cross Subsidy Surcharge
Revenue Gap
o Revenue Deficit / Surplus at Current Tariff and Charges
o Proposals to handle the Deficit / Surplus
o Government Subsidy Requirement
Other Filings
Cross Subsidy Surcharge
The sales forecast has been used to determine the revenue from tariff for retail sale of electricity
for the second year of the fourth control period i.e. FY 2020-21 and the energy input required for
meeting the demand. The power procurement plan is based on the availability of the generation
sources during FY 2020-21, cost of procurement (fixed, variable and others) and the merit order
dispatch of various sources to meet the demand expected during various months.
Due to reorganization of the State of Andhra Pradesh, two districts i.e., Anantapur & Kurnool
districts were merged into APSPDCL w.e.f 02-06-2014. In this context, for FY 2014-15 (during
Apr & May, 2014) all the figures / data considered are actuals and pertains to six districts of
APSPDCL (viz., Krishna, Guntur, Prakasam, SPSR Nellore, Chittoor& Kadapa). And from June,
2014 onwards all the figures pertain to entire eight districts of APSPDCL including newly added
Anantapur & Kurnool districts.

APSPDCL Page 5
2 Analysis of expected performance for Current Year FY 2019-20
for Retail Supply Business
2.1 Introduction
This chapter analyses the performance of the licensee during the Current Year as compared to the
previous year. Only the key operating and financial parameters have been considered for this
analysis.
2.2 Operating Performance
2.2.1 Energy Balance
2.2.2 Distribution Loss
As seen from the above table, the actual losses for the FY 2018-19 is 8.26% and reduced compared
to previous year loss of 8.31%. The licensee is expected to meet voltage wise loss level targets set
by the Honourable APERC. The licensee has taken following steps to reduce the losses further.
Strict monitoring of feeders to ensure the assured number of hours of supply to agricultural
sector.
Reduction of both technical and commercial losses by vigorously conducting 11 KV feeder
wise energy audits around 1764 Nos. feeders in the company.
Year
Actual No. of 11 KV
T& Mhq. feeders for
which energy audit
done
11 KV 2 MVAR
capacitor banks
added to the system
Additional 33/11
KV sub-stations
charged Excl. EHT
(%)
Incl. EHT
(%)
FY 2009-10 14.03 12.98 823 90
FY 2010-11 13.37 12.21 853 122 13
FY 2011-12 12.53 11.29 866 136 67
FY 2012-13 11.87 10.71 966 193 128
FY 2013-14 11.84 10.68 1024 35 208
FY 2014-15 11.72 10.33 1348 75 75
FY 2015-16 9.57 8.47 1424 35 33
FY 2016-17 9.54 8.47 1563 30 30
FY 2017-18 9.56 8.31 1636 112 112
FY 2018-19 9.45 8.26 1764 32 32
FY 2019-20 (H1) 9.21 8.17 1764 39 39

APSPDCL Page 6
Erection of additional substations, DTRs, 11KV capacitor banks and bifurcation of feeders,
etc.,
HVDS conversion of balance agricultural pumpsets.
Moving to monthly billing across the DISCOMS and rolling out of IR port meters or other
new metering technologies.
During the year 2011-12, 866 Nos. 11 KV Town & MHQ feeders were considered for energy audit
whereas during the FY 2018-19, 1764 Nos. feeders are available in E-AUDIT for which energy
audit is done on regular basis at corporate office level.
32 Nos. additional 11 KV 2 MVAR capacitor banks were proposed for erection during the FY 2018-
19 and completed.
For the year 2018-19, 32 Nos. additional 33/11KV sub-stations were charged and for the year
FY2019-20, 99 Nos. additional 33/11 KV sub-stations are proposed out of this 39 Nos. were already
charged to reduce over loaded substations, 33 KV & 11 KV lines and to maintain good voltage
profiles at the consumers end.
2.2.3 Metered Sales
As can be seen from the table above (Table No.2.2.1), in 2018-19, the percentage of metered sales
is 65.89 % as against 66.41% during 2018-19.
The total load curtailment (due to Load relief) during FY 2018-19 is 28.78 MU, which is very
negligible and which is due to certain emergencies. In FY 2019-20, the metered sales are expected
to increase by 2048.71 MU over 2018-19 levels, which is 8.18 % increase and also the percentage
metered sales is expected to change from 65.89% (FY 2018-19) to 67.71% (FY 2019-20).
2.2.4 Agricultural Sales
In the previous year 2018-19 the actual Agriculture Consumption is 9832.49 MU. In the current
year FY 2019-20 (H1), the agriculture consumption is 4127.11 MU and the projection for the entire
year is 9656.87 MU, which is 154.11 MU (1.62%) excess over the approved agricultural sales.

APSPDCL Page 7
2.3 Financial Performance
2.3.1 Revenues
For the key categories, the licensee has estimated the revenue as below:
The actual revenue during FY 2018-19 is Rs. 15641.84 crores (including non-tariff income). The
NTI during FY 2018-19 is Rs.898.52 crores. During FY 2019-20, the estimated revenue from sale
of power (inclusive of Non-tariff income) is Rs. 17259.06 crores. The expected NTI during FY
2019-20 is Rs. 943.45 crores.
2.3.2 Expenditure and Revenue Gap
The following table provides an overview of APSPDCL’s financial performance for the current
year and compares it with the APERC orders:

APSPDCL Page 8
3 Power Purchase Cost for Current Year (FY 2019-20) Second Half
and Ensuing Year (FY 2020-21)
3.1 INTRODUCTION
Subsequent to the bifurcation of the erstwhile State of Andhra Pradesh as per the Andhra Pradesh
Reorganization Act, 2014 (Central Act No. 6 of 2014, dated 01.03.2014), the Southern Power
Distribution Company of AP Ltd. (APSPDCL) and the Eastern Power Distribution Company of
AP Ltd. (APEPDCL) emerged as the Distribution Licensees of the present State of Andhra
Pradesh. As per section 92 read with the Twelfth Schedule of the above Act, the districts of
Anantapur and Kurnool which were within the jurisdiction of the erstwhile APCPDCL (Central
Power Distribution Company AP Ltd., now TSSPDCL (Southern Power Distribution Company of
Telangana Limited)) were transferred to the APSPDCL (Southern Power Distribution Company
of AP Ltd.). Further, as per the G.O.Ms. No.20 (dated 08.05.2014), 17.45% share of power held
by the erstwhile APCPDCL was transferred to APSPDCL based on the last 5 years’ average
consumption of Anantapur and Kurnool districts at the time of bifurcation. After factoring the
above transfer, the present DISCOMS (Distribution Companies) of Andhra Pradesh have 46.11%
share of power out of the share held by the erstwhile four Distribution Companies in the Power
Stations of Central Sector. With effect from June 2017, power from APGENCO stations is being
fully availed by the AP DISCOMs without allocation to TS DISCOMs and vice-versa. Presently
the shares of APEPDCL and APSPDCL (Distribution Companies of AP) in the Power Purchase
Agreements (PPAs) is 34.27% & 65.73% respectively. The details of capacities being availed by
APDISCOMs from various power stations have been described in the subsequent paragraphs.
3.2 CONTRACTED CAPACITY BY DISCOMS
3.2.1 APGENCO STATIONS
APDISCOMS have been purchasing power from APGENCO Stations based on the long
term PPAs/approval of Hon’ble APERC. From FY 2014-15, APDISCOMs have been
availing 100% power from APGENCO Hydel stations and similarly TSDISCOMs have
been availing 100% power from TSGENCO Hydel Stations. Further, as per the directions
of Government of Andhra Pradesh, APGENCO implemented Power Regulation to
TSDISCOMS (Distribution Companies of Telangana) from their thermal stations w.e.f
11.06.2017 due to the non-payment of dues by TSDISCOMs. Similarly, TSGENCO
(Telangana State Generating Company) also regulated Power from their thermal stations
to APDISCOMS w.e.f the same date. In view of the Power Regulation to TSDISCOMs,
APGENCO requested APDISCOMS to avail 100% power from their thermal Stations.
Accordingly, APDISCOMs have been purchasing 100% Power from APGENCO thermal
Stations since 11.06.2017. Further, as of now, APDISCOMs are not availing any power
from TSGENCO.
New Power Plants, Dr.NTTPS-V and DSSTPS-II are expected to be commissioned by
Oct’20. APDISCOMS propose to purchase the power from these plants subject to the
approval of Hon’ble APERC.

APSPDCL Page 9
Status of present and proposed capacities being availed/to be availed by APDISCOMs in
APGENCO Stations and Interstate Hydel Projects are indicated in the following table.
Station Capacity(MW)
Thermal
Dr. NTTPS-I, II, III(6 x 210MW) 1260
Dr. NTTPS-IV(1 x 500MW) 500
RTPP-I(2 x 210MW) 420
RTPP-II(2 x 210MW) 420
RTPP- III (1 x 210MW) 210
RTPP- IV(1x 600MW) 600
DSSTPS-I (2 x800MW) 1600
DSSTPS-II(1x800 MW) (To be Commissioned) 800
Dr.NTTPS-V(1x800 MW)(To be Commissioned) 800
Total Thermal 6610
Hydel
Donkarayi Canal PH (1 x 25MW) 25
Upper Sileru HES (4 x 60MW) 240
Lower Sileru HES (4 x 115MW) 460
Srisailam Right Bank PH (7 x 110MW) 770
Nagarjuna Sagar right canal PH (3x30MW) 90
PABR (2 x 10MW) 20
Mini Hydel Station (2 x 0.5MW) 1
Nagarjuna Sagar Tail Pond PH (2 x 25MW) 50
Interstate Hydel Projects
Machkund, Orissa (AP share 70%) 84
T.B. Station, Karnataka (AP share 80%) 57.6
Total Hydel including Interstate Projects 1797.6
Total APGENCO 8407.6
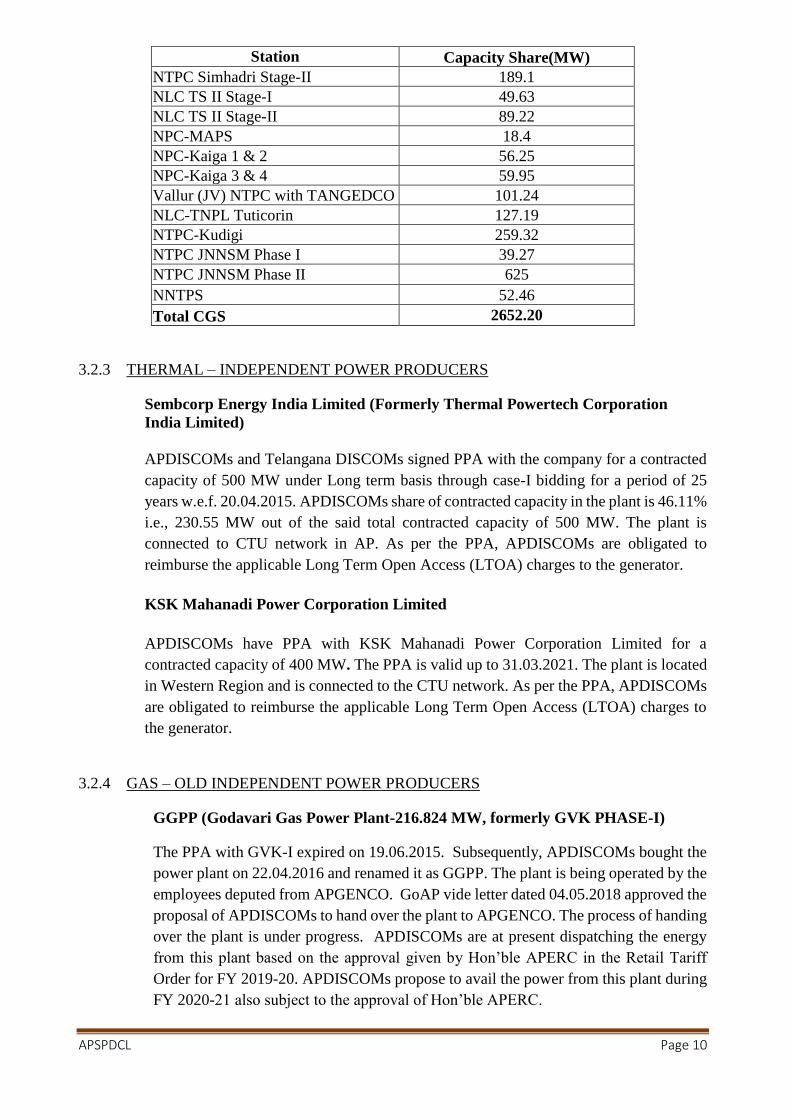
3.2.2 CENTRAL GENERATING STATIONS
APDISCOMS have been purchasing power from Central Generating Stations
controlled/owned by GoI based on the long term PPAs. The list of the Stations along with the
APDISCOMs’ share of power from these Stations (as per the Regional Energy Account
issued by SRPC for the month of Sep’19) are indicated in the following table. Further,
APDISCOMs have been purchasing bundled power from thermal Stations of NTPC which
was allocated by MOP/GOI against the solar power procurement by APDISCOMs under
JNNSM Phase I &II. NNTP (New Neyveli Thermal Plant) of NLC is expected to be
commissioned by Dec’19. The Capacities being availed by APDISCOMs in CGS are
tabulated below.
Station Capacity Share(MW)
NTPC-(SR) Ramagundam I & II 280.56
NTPC-(SR) Ramagundam- III 70.67
NTPC-Talcher-II 172.84
NTPC Simhadri Stage-I 461.1
APSPDCL Page 10
Station Capacity Share(MW)
NTPC Simhadri Stage-II 189.1
NLC TS II Stage-I 49.63
NLC TS II Stage-II 89.22
NPC-MAPS 18.4
NPC-Kaiga 1 & 2 56.25
NPC-Kaiga 3 & 4 59.95
Vallur (JV) NTPC with TANGEDCO 101.24
NLC-TNPL Tuticorin 127.19
NTPC-Kudigi 259.32
NTPC JNNSM Phase I 39.27
NTPC JNNSM Phase II 625
NNTPS 52.46
Total CGS 2652.20
3.2.3 THERMAL – INDEPENDENT POWER PRODUCERS
Sembcorp Energy India Limited (Formerly Thermal Powertech Corporation
India Limited)
APDISCOMs and Telangana DISCOMs signed PPA with the company for a contracted
capacity of 500 MW under Long term basis through case-I bidding for a period of 25
years w.e.f. 20.04.2015. APDISCOMs share of contracted capacity in the plant is 46.11%
i.e., 230.55 MW out of the said total contracted capacity of 500 MW. The plant is
connected to CTU network in AP. As per the PPA, APDISCOMs are obligated to
reimburse the applicable Long Term Open Access (LTOA) charges to the generator.
KSK Mahanadi Power Corporation Limited
APDISCOMs have PPA with KSK Mahanadi Power Corporation Limited for a
contracted capacity of 400 MW. The PPA is valid up to 31.03.2021. The plant is located
in Western Region and is connected to the CTU network. As per the PPA, APDISCOMs
are obligated to reimburse the applicable Long Term Open Access (LTOA) charges to
the generator.
3.2.4 GAS – OLD INDEPENDENT POWER PRODUCERS
GGPP (Godavari Gas Power Plant-216.824 MW, formerly GVK PHASE-I)
The PPA with GVK-I expired on 19.06.2015. Subsequently, APDISCOMs bought the
power plant on 22.04.2016 and renamed it as GGPP. The plant is being operated by the
employees deputed from APGENCO. GoAP vide letter dated 04.05.2018 approved the
proposal of APDISCOMs to hand over the plant to APGENCO. The process of handing
over the plant is under progress. APDISCOMs are at present dispatching the energy
from this plant based on the approval given by Hon’ble APERC in the Retail Tariff
Order for FY 2019-20. APDISCOMs propose to avail the power from this plant during
FY 2020-21 also subject to the approval of Hon’ble APERC.

APSPDCL Page 11
SPGL (Spectrum Power Generation Limited-205.187MW)
Upon the expiry of PPA with the plant on 18.04.2016, APDISCOMs proposed to renew
the PPA for a further period of 15 years and accordingly sent the proposal to GoAP for
consent. If the consent is received from GoAP, APDISCOMs will file the draft PPA
before Hon’ble APERC for approval. APDISCOMs are at present purchasing the power
from this plant at the rates approved in the Retail Tariff Order for FY 2019-20. Pending
permission from GoAP, APDISCOMs propose to purchase the power from this plant
during FY 2020-21 also subject to the approval of Hon’ble APERC.
The capacities being availed by APDISCOMs in the above plants are as tabulated below.
Station Capacity (MW)
GGPP 216.824
SPGL 205.187
Total 422.011
3.2.5 GAS – NEW INDEPENDENT POWER PRODUCERS
APDISCOMs of erstwhile united AP State entered into long term PPAs with GVK
Extension (220 MW), GVPGL(GMR Vemagiri Power Generation Limited-370 MW),
Gouthami CCPP(464 MW) and Konaseema Gas Power Limited(444.08 MW). These new
IPPs were commissioned during the years 2006 (GVPGL), 2009 (GVK Extension,
Gouthami CCPP) and 2010 (Konaseema Gas Power Limited). After bifurcation of AP State,
APDISCOMs of the present AP State were allocated 46.11% of share of capacity in these
plants. The Natural gas supplies from RIL KG D-6 fields to the aforesaid IPPs became zero
w.e.f. 01.03.2013. As a result, there is no generation from these plants as of now. Further,
there is no official communication from MoP&NG on the availability of natural gas to these
plants. The e-bid RLNG Scheme ended by 31.03.2017and MoP/GOI has not extended the
scheme. Therefore, APDISCOMs are not proposing to procure any power from these plants.
Further, APDISCOMs are not presently paying any fixed charges to these plants.
3.2.6 APGPCL (AP GAS POWER CORPORATION LIMITED)
APGPCL is a joint sector gas-based power project. APDISCOMs are availing power from
this project to the extent of APTRANSCO’s equity share in the project. The share of
APDISCOMS power in this project is as follows.
3.2.7 OTHER RENEWABLE ENERGY PLANTS
APDISCOMs are having PPAs with the following Other Renewable Energy plants (stable
energy producing plants) for the second half of FY 2019-20 and FY 2020-21as given below.
Renewable Energy based projects have been allocated to the APDISCOMs based on
location basis (see Go Ms No 116, Dt 1-10-2019).
Station Capacity Share (MW)
APGPCL Stage-I 9.33
APGPCL Stage-II 24.96
Total 34.29

APSPDCL Page 12
Type of NCE Projects Capacity Share (MW)
FY 2019-20 H2
Capacity Share
(MW) FY 2020-21
Biomass Power Projects including Co-gen 148.5 148.5
Bagasse Cogeneration Projects. 106.5 106.5
Mini Hydel Power Projects 38.64 38.64
Industrial Waste Based Power Projects 21.66 21.66
NCL Energy Ltd. 8.25 8.25
Total 323.55 323.55
3.2.8 VARIABLE RENEWABLE ENERGY PLANTS
APDISCOMs are having PPAs with the following class of Variable Renewable Energy/
Non-Conventional based Projects for the second half of FY 2019-20 and FY 2020-21as
given below. Renewable Energy based projects have been allocated to the APDISCOMs
based on location basis (see Go Ms No 116, Dt 1-10-2019). Further the Solar PPA in
respect of Ghani project has been assigned to APSPDCL instead of APEPDCL vide the
amendment PPA entered into between M/s NTPC and APSPDCL on 18-11-2019. The
Amendment is effective from 1st April 2018.
Type of VRE Projects Capacity Share (MW)
FY 2019-20 H2
Capacity Share
(MW) FY 2020-21
Wind Power Projects 3928.25 3928.25
Solar Parks 3800 3800
Solar Power Projects 665 665
NVVNL Bundled Power -SOLAR 39.2 39.2
Total 8432.45 8432.45
3.3 AVAILABILITY
3.3.1 DISPATCHABLE ENERGY AVAILABILITY
The energy availabilities have been estimated after considering the generators projections,
actual performance of the generating Stations during FY 2018-19 and FY 2019-20 H1, the
availabilities approved in the Retail Tariff Order for FY 2019-20, the availability of fuel,
breakdown of units, expiry of the existing PPAs during FY 2019-20 H2 and FY 2020-21,
expected commissioning of new stations and the need to maintain the spinning reserve. The
proposed availabilities in MU are indicated in the following tables.
Availability (In MU)
Source Station FY 2019-20 H2 FY 2020-21
AP GENCO Thermal
Dr NTTPS-I,II,III 3743.30 8035.71
Dr NTTPS-IV 1564.18 3241.20
RTPP-I 1401.95 2678.46
RTPP-II 1374.83 2678.46
RTPP-III 643.46 1339.67
RTPP-IV 1380.67 3952.51
DSSTPS-I 4453.00 10489.53
DSSTPS-II - 2466.60
Dr.NTTPS-V - 2232.54
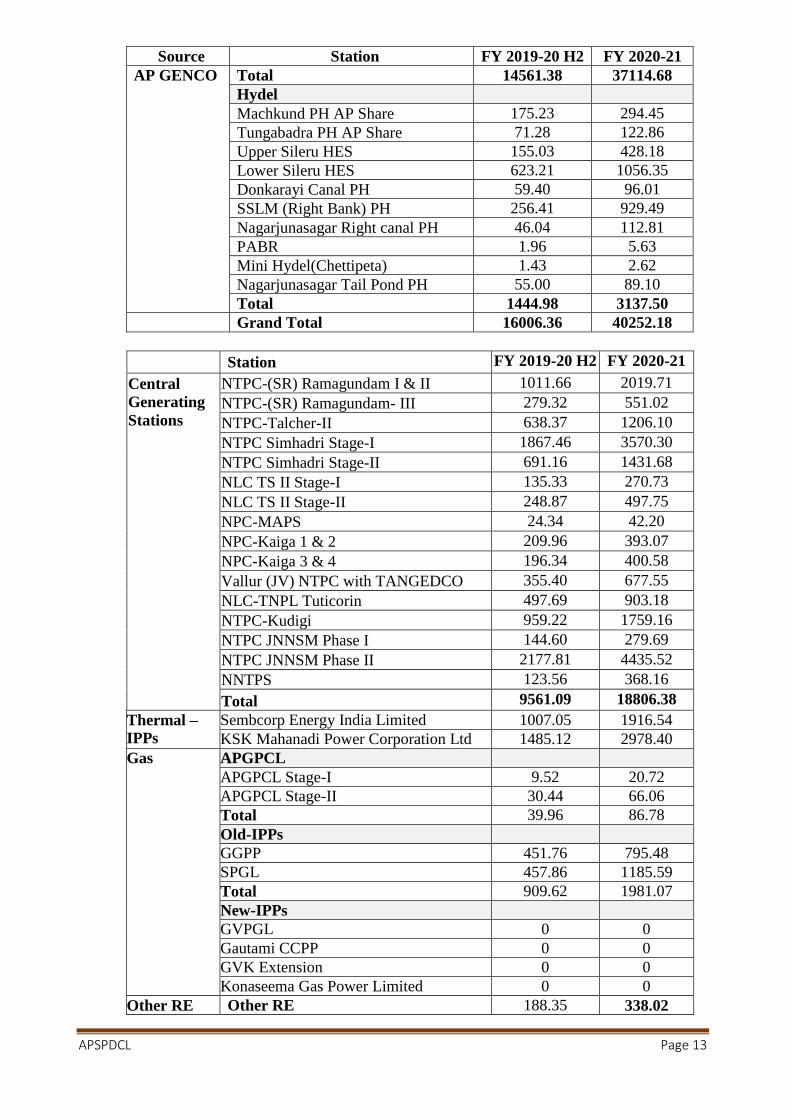
APSPDCL Page 13
Source Station FY 2019-20 H2 FY 2020-21
AP GENCO Total 14561.38 37114.68
Hydel
Machkund PH AP Share 175.23 294.45
Tungabadra PH AP Share 71.28 122.86
Upper Sileru HES 155.03 428.18
Lower Sileru HES 623.21 1056.35
Donkarayi Canal PH 59.40 96.01
SSLM (Right Bank) PH 256.41 929.49
Nagarjunasagar Right canal PH 46.04 112.81
PABR 1.96 5.63
Mini Hydel(Chettipeta) 1.43 2.62
Nagarjunasagar Tail Pond PH 55.00 89.10
Total 1444.98 3137.50
Grand Total 16006.36 40252.18
Station FY 2019-20 H2 FY 2020-21
Central
Generating
Stations
NTPC-(SR) Ramagundam I & II 1011.66 2019.71
NTPC-(SR) Ramagundam- III 279.32 551.02
NTPC-Talcher-II 638.37 1206.10
NTPC Simhadri Stage-I 1867.46 3570.30
NTPC Simhadri Stage-II 691.16 1431.68
NLC TS II Stage-I 135.33 270.73
NLC TS II Stage-II 248.87 497.75
NPC-MAPS 24.34 42.20
NPC-Kaiga 1 & 2 209.96 393.07
NPC-Kaiga 3 & 4 196.34 400.58
Vallur (JV) NTPC with TANGEDCO 355.40 677.55
NLC-TNPL Tuticorin 497.69 903.18
NTPC-Kudigi 959.22 1759.16
NTPC JNNSM Phase I 144.60 279.69
NTPC JNNSM Phase II 2177.81 4435.52
NNTPS 123.56 368.16
Total 9561.09 18806.38
Thermal –
IPPs
Sembcorp Energy India Limited 1007.05 1916.54
KSK Mahanadi Power Corporation Ltd 1485.12 2978.40
Gas APGPCL
APGPCL Stage-I 9.52 20.72
APGPCL Stage-II 30.44 66.06
Total 39.96 86.78
Old-IPPs
GGPP 451.76 795.48
SPGL 457.86 1185.59
Total 909.62 1981.07
New-IPPs
GVPGL 0 0
Gautami CCPP 0 0
GVK Extension 0 0
Konaseema Gas Power Limited 0 0
Other RE Other RE 188.35 338.02
APSPDCL Page 14
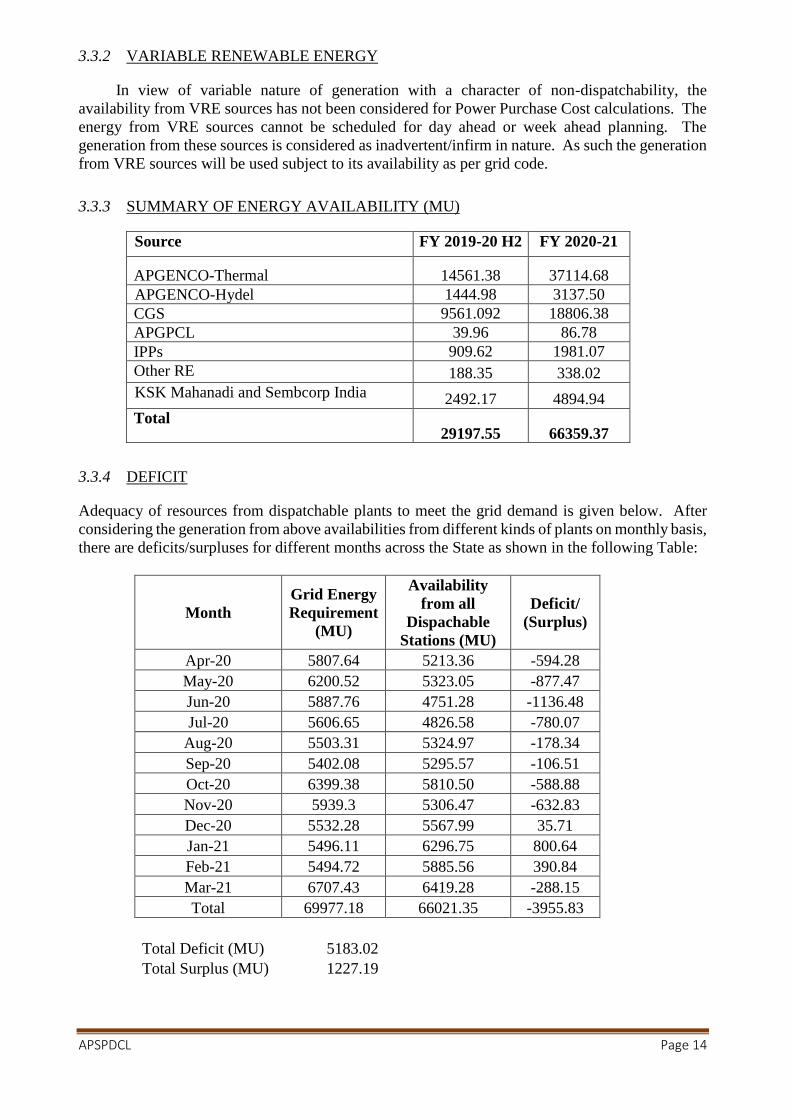
3.3.2 VARIABLE RENEWABLE ENERGY
In view of variable nature of generation with a character of non-dispatchability, the
availability from VRE sources has not been considered for Power Purchase Cost calculations. The
energy from VRE sources cannot be scheduled for day ahead or week ahead planning. The
generation from these sources is considered as inadvertent/infirm in nature. As such the generation
from VRE sources will be used subject to its availability as per grid code.
3.3.3 SUMMARY OF ENERGY AVAILABILITY (MU)
Source FY 2019-20 H2 FY 2020-21
APGENCO-Thermal 14561.38 37114.68
APGENCO-Hydel 1444.98 3137.50
CGS 9561.092 18806.38
APGPCL 39.96 86.78
IPPs 909.62 1981.07
Other RE 188.35 338.02
KSK Mahanadi and Sembcorp India 2492.17 4894.94
Total 29197.55 66359.37
3.3.4 DEFICIT
Adequacy of resources from dispatchable plants to meet the grid demand is given below. After
considering the generation from above availabilities from different kinds of plants on monthly basis,
there are deficits/surpluses for different months across the State as shown in the following Table:
Month
Grid Energy
Requirement
(MU)
Availability
from all
Dispachable
Stations (MU)
Deficit/
(Surplus)
Apr-20 5807.64 5213.36 -594.28
May-20 6200.52 5323.05 -877.47
Jun-20 5887.76 4751.28 -1136.48
Jul-20 5606.65 4826.58 -780.07
Aug-20 5503.31 5324.97 -178.34
Sep-20 5402.08 5295.57 -106.51
Oct-20 6399.38 5810.50 -588.88
Nov-20 5939.3 5306.47 -632.83
Dec-20 5532.28 5567.99 35.71
Jan-21 5496.11 6296.75 800.64
Feb-21 5494.72 5885.56 390.84
Mar-21 6707.43 6419.28 -288.15
Total 69977.18 66021.35 -3955.83
Total Deficit (MU) 5183.02
Total Surplus (MU) 1227.19

APSPDCL Page 15
DISCOM proposes to bridge the monthly deficit wherever it is incidental though procurement from
market such as from Energy exchanges or through DEEP-E Bidding portal or through any other
competitive means.
3.4 POWER PURCHASE COST
3.4.1 APGENCO STATIONS
FIXED COSTS IN RS.CRS
In respect of Dr NTTPS-I,II,III & IV and RTPP -I,II,III, the fixed costs for FY 2019-20
H2 and for the ensuing financial year FY 2020-21 were adopted as per the AP Genco
Tariff Order for the 4th Control period dated 29-04-2019 issued by the Hon’ble APERC.
For RTPP-IV, the fixed charges as indicated in the AP Genco filings in OP No. 35 of
2018 are adopted as the matter of determination of tariffs is under examination of the
Hon’ble APERC. For DSSTPS-I & DSSTPS-II(yet to be commissioned), the fixed rate
as furnished by APPDCL was considered. For Dr.NTTPS-V, which is yet to be
commissioned , the fixed rate as furnished by APGENCO was considered. The fixed
charges computed based on the above are indicated in the following table.
Station FY 2019-20H2 FY 2020-21
Thermal
Dr NTTPS-I, II, III 331.67 679.47
Dr NTTPS-IV 164.43 282.92
RTPP-I 127.46 259.43
RTPP-II 123.74 252.73
RTPP-III 126.55 186.96
RTPP-IV 396.59 1101.73
DSSTPS- Stage I 1012.24 2002.18
DSSTPS-Stage-II -- 471.12
Dr.NTTPS-V - 608.81
Interest on Pension Bonds 444.15 921.50
Total 2726.81 6766.85
Hydel
MACHKUND PH AP Share 16.71 35.01
TUNGBHADRA PH AP Share 11.45 24.00
Upper Sileru HES 37.28 76.55
Lower Sileru HES 71.46 146.72
Donkarayi Canal PH 3.88 7.97
SSLM (Right Bank) PH 108.25 219.76
Nagarjunasagar Right canal PH 12.40 25.19
PABR 6.44 13.07
Mini Hydel (Chettipeta) 0.83 1.70
Nagarjunasagar Tail Pond PH 26.07 51.44
Total 294.77 601.41
Grand Total 3021.58 7368.26
VARIABLE RATE IN Rs/KWH.
In respect of Dr NTTPS-I,II,III & IV and RTPP -I,II,III, the variable rates for FY 2019-
20 H2 were adopted as per the AP Genco Tariff Order for the 4th Control period dated

APSPDCL Page 16
29-04-2019 issued by the Hon’ble APERC. Variable rates for FY 2020-21were projected
with 10% hike on FY 2019-20 H2. For DSSTPS-I & DSSTPS-II (yet to be
commissioned), the variable rate as furnished by APPDCL was considered. For
Dr.NTTPS-V, the fixed rate as furnished by APGENCO was considered. The variable
rates are indicated in the following table.
Station FY 2019-20H2 FY 2020-21
Dr NTTPS-I, II, III 3.34 3.67
Dr NTTPS-IV 3.15 3.46
RTPP-I 3.86 4.25
RTPP-II 3.86 4.25
RTPP-III 3.86 4.25
RTPP-IV 3.86 3.86
DSSTPS- Stage-I 2.85 3.14
DSSTPS-Stage-II 2.85 3.14
Dr.NTTPS-V -- 3.15
3.4.2 CENTRAL GENERATING STATIONS
FIXED COSTS IN RS. CRS
The fixed costs for FY 2019-20 H2 and FY 2020-21 were projected as per the latest
CERC, Department of Atomic energy (DAE), Govt. of India orders. The fixed costs are
indicated in the following table.
Station FY 2019-20H2 FY 2020-21
NTPC-(SR) Ramagundam I & II 71.36 142.72
NTPC-(SR) Ramagundam- III 19.25 38.50
NTPC-Talcher-II 43.75 87.51
NTPC Simhadri Stage-I 154.73 309.46
NTPC Simhadri Stage-II 102.27 204.55
NLC TS II Stage-I 11.81 23.62
NLC TS II Stage-II 22.00 44.01
NPC-MAPS - -
NPC-Kaiga 1 & 2 - -
NPC-Kaiga 3 & 4 - -
Vallur (JV) NTPC with TANGEDCO 62.73 125.46
NLC-TNPL Tuticorin 69.33 138.66
NTPC-Kudigi 166.12 332.24
NTPC JNNSM Phase I - 28.80
NTPC JNNSM Phase II - 665.33
NNTPS 24.97 77.68
Total 748.32 2218.54
VARIABLE RATES IN Rs/KWH
The variable rates for FY 2019-20H2 were projected as per the September 2019 month actual
variable cost. For 2020-21, the variable rates were projected by enhancing the September 2019
month actual variable cost by 10%.The variable rates are indicated in the following table.

APSPDCL Page 17
Station FY 2019-20H2 FY 2020-21
NTPC-(SR) Ramagundam I & II 2.77 3.05
NTPC-(SR) Ramagundam- III 2.73 3.01
NTPC-Talcher-II 2.39 2.63
NTPC Simhadri Stage-I 3.38 3.72
NTPC Simhadri Stage-II 3.34 3.67
NLC TS II Stage-I 2.64 2.91
NLC TS II Stage-II 2.64 2.91
NPC-MAPS - -
NPC-Kaiga 1 & 2 - -
NPC-Kaiga 3 & 4 - -
Vallur (JV) NTPC with TANGEDCO 3.78 4.15
NLC-TNPL Tuticorin 3.16 3.48
NTPC-Kudigi 3.98 4.38
NTPC JNNSM Phase I 4.60 3.93
NTPC JNNSM Phase II 4.21 3.04
NNTPS 2.31 2.54
3.4.3 SEMBCORP ENERGY AND KSK MAHANADI
FIXED COSTS IN RS. CRS.
These are the bid based projects and the tariffs discovered in the bids were adopted by
APERC. Therefore, the fixed costs and variable costs for these Stations have been computed
based on the rates discovered in the bid. The fixed costs are indicated in the following table.
VARIABLE RATES RS/KWH
3.4.4 APGPCL
FIXEDCOSTS IN Rs. CRs.
The fixed costs projected for FY 2019-20 H2 and FY 2020-21 are based on the
information on projections as furnished by APGPCL. The fixed costs computed, based
on the above rates, are indicated in the following table.
Station FY 2019-20 H2 FY 2020-21
APGPCL Stage-I 2.15 1.72
APGPCL Stage-II 2.14 16.63
Total 4.29 18.35
Station FY 2019-20H2 FY 2020-21
Sembcorp Energy India Limited 143.84 277.04
KSK Mahanadi Power Corporation Limited 222.75 446.73
Station FY 2019-20H2 FY 2020-21
Sembcorp Energy India Limited 2.25 2.43
KSK Mahanadi Power Corporation Limited 2.77 2.96

APSPDCL Page 18
VARIABLE RATES IN RS/KWH
The variable cost projected for FY 2019-20 H2 and FY 2020-21 are based on the information
on projections as furnished by APGPCL. The variable costs computed, based on the above
rates, are indicated in the following table.
3.4.5 OLD GAS BASED IPPs
FIXED CHARGES IN RS. CRS.
In respect of GGPP, the fixed cost have been computed by considering the actual fixed cost up to
September 2019 for FY 2019-20 & for the ensuing year. In respect of SPGL the variable rates as
approved in the Retail Supply tariff order for FY 2019-20 have been adopted for H2 of current
Financial year and the ensuing Financial Year.
Station FY 2019-20H2 FY 2020-21
GGPP 18.52 32.61
SPGL 42.12 109.07
Total 60.64 141.68
VARIABLE RATES IN RS/KWH
In respect of GGPP, the variable rates have been computed by considering the GCVs, SHR,
Auxiliary Consumption and latest actual gas price which is effective from 1stOctober,2019
($3.23/MMBTU) for H2 of FY 2019-20. The same rate has been escalated with 5% to arrive at
variable cost rate for the ensuing year. In respect of SPGL the variable rates as approved in the Retail
Supply tariff order for FY 2019-20 have been adopted for H2 of current Financial year and the
ensuing Financial Year.
and are tabulated below.
Station FY 2019-20H2 FY 2020-21
GGPP 2.70 2.84
SPGL 2.39 2.39
It is requested for pass through of gas price in the variable cost may be permitted.
Station FY 2019-20H2 FY 2020-21
APGPCL Stage-I 2.86 2.85
APGPCL Stage-II 2.85 2.85

APSPDCL Page 19
3.4.6 NEWGAS BASED IPPs
Fixed and variable costs have not been projected for these plants as there is no generation from
these plants.
3.4.7 MARKET
The rates for energy procured from Market sources is taken as per the discovered prices while
taking up the actual procurement. For the purpose estimation of power purchase cost in this ARR
exercise a weighted average single part price of Rs 4.31/Unit has been considered in the category
of procurement.
3.4.8 PGCIL CHARGES
The POC rate approved by CERC for the latest quarter i.e. second quarter of FY 2019-20 is Rs.4.99
lakhs/MW which includes POC slab rate, Reliability support charges rate and HVDC charges rate.
Apart from the main POC bill, PGCIL raises supplementary bills also from time to time. Further,
transmission assets pertaining to CTU (Central Transmission Network) get added to the network
regularly which would increase the POC charges in future. To account for the above, the POC rate
of Rs.4.99 lakhs/MW has been enhanced by 5% to arrive at a value of Rs. 5.24 lakhs/MW. Based
on this value, the POC charges for FY 2019-20 H2 and FY 2020-21 have been computed in the
following manner.
POC charges for FY 2019-20 H2
= (4.99) X (number of months in the second half of FY 2019-20) X (interstate capacity in MW
APDISCOMs are expected to avail)/100
= (4.99) X (6) X (2796.65)/100 = Rs.837.3Crs.
Total POC charges for FY 2020-21
= (5.24) X (number of months in the FY 2020-21) X (interstate capacity in MW APDISCOMs
are expected to avail)/100
= (5.24) X (12) X (2821.65)/100 = Rs.1774.25 Crs.
The above charges include the POC charges reimbursable to KSK Mahanadi and Sembcorp Energy
plants.
ENERGY REQUIREMENT
The DISCOM wise Energy Requirement are tabulated below.
DISCOM FY 2019-20H2 FY 2020-21
APEPDCL 11925.7 26358.53
APSPDCL 21385.7 43618.65
Total 33311.3 69977.18

APSPDCL Page 20
The energy requirement of APDISCOMs has been arrived at by grossing up the sales with
appropriate transmission and distribution losses. The external losses (PGCIL losses) on the power
purchased from CGS (excluding NTPC Simhadri-I), KSK Mahanadi and Sembcorp Energy India
Limited have also been factored for arriving at the above energy requirement.
3.5 PP COST SUMMARY
Based on the availability, requirement and costs for each source, the summary of power purchase
cost for Andhra Pradesh for H2 FY 2019-20 is projected as follows:
FY 2019-20 H2
Source Energy
Availability
Energy
Dispatch
(MU)
Total Cost (Rs
Crs)
Per Unit Cost
(Rs/kWh)
APGENCO Thermal
and DSTPP-I &II 14,561.38 14,561.38 7,592.04 5.21
APGENCO Hydel 1,444.98 1,444.98 294.77 2.04
CGS 9,561.09 9,483.69 4,076.61 4.30
APGPCL 39.96 39.96 15.68 3.92
IPPs – Gas 909.62 909.36 291.98 3.21
KSK Mahanadhi 1,485.12 1,485.12 634.13 4.27
Sembcorp Energy 1,007.05 1007.05 374.19 3.72
Market Purchases 188.35 4,378.07 2118.99 4.84
Gross Purchases 29,197.55 33,309.61 15,398.39 4.62
Based on the availability, requirement and costs for each source, the summary of power purchase cost for
Andhra Pradesh for FY 2020-21 is projected as follows:
FY 2020-21
Source Energy
Availability
Energy
Dispatch
(MU)
Cost (Rs Crs) Per Unit Cost
(Rs/kWh)
APGENCO Thermal
and DSTPP-I &II 37,114.68 36,230.71 19,604.92 5.41
APGENCO Hydel 3,137.50 3,137.50 601.41 1.92
CGS 18,806.38 18,358.87 8,585.90 4.68
APGPCL 86.78 86.78 43.09 4.97

APSPDCL Page 21
FY 2020-21
Source Energy
Availability
Energy
Dispatch
(MU)
Cost (Rs Crs) Per Unit Cost
(Rs/kWh)
IPPs – Gas 1,981.07 1,981.07 650.96 3.29
Other Renewable
Energy Sources 338.03 338.03 174.71 5.17
KSK Mahanadhi 2,978.40 2,978.40 1,328.34 4.46
Sembcorp Energy 1,916.54 1,916.54 747.73 3.90
Market Purchases 4949.36 2133.17 4.31
Total Purchases 66,359.38 69,977.26 33,870.23 4.84
3.6 VARIABLE RENEWABLE ENERGY SUBSIDY
3.6.1 PROBABLE AVAILABILITY (MU)
The following is the probable energy availability (MU) from the VRE.
Type of VRE Projects FY 2019-20 H2 FY 2020-21
Wind Power Projects 2292.96 8033.66
Solar Parks 1788.72 3577.43
Solar Power Projects 783.92 1497.59
NVVNL Bundled Power -SOLAR 42.5 84.99
Total 4908.1 13193.67
3.6.2 VRE INTEGRATION COST
The VRE integration costs are calculated based on CEA Reports on optimal energy mix in power generation (page
20) and Optimal location of various types of balancing energy sources (page 13).
The adequacy cost is computed as a differential cost between Weighted Average RE Tariff and the weighted
average Thermal variable Cost.
The balancing cost is due to increase in specific coal consumption and increased oil consumption while
operating in ramped down condition; and reduced coal plant life etc. due to frequent ramp up/ramp down
or start/stop operations.

APSPDCL Page 22
Grid integration cost is due to the wasted evacuation and network infrastructure created for the < 25% PLF
VRE plants. 75% of evacuation infrastructure remains under utilized and the fixed cost is paid
unnecessarily by APTRANSCO and to PGCIL by way of PoC charges. The APTRANSCO charges are
not included in the network expenditure.
Minimum VRE integration cost. The following is the minimum VRE integration cost (Rs per unit) based on the
actual pooled variable cost of thermal generating stations .for the Current Financial Year and the ensuing FY.
Type of VRE
Projects
Weighted
Average
Tariff
FY 2019-20 H2 FY 2020-21
Adequac
y cost
Balancin
g Cost
Grid
integration
cost
Total Adequacy
cost
Balancin
g Cost
Grid
integration
cost
Total
Wind Power
Projects
4.61 1.41 0.53 0.41 2.35 1.07 0.53 0.41 2.01
Solar Parks 4.63 1.43 0.53 0.41 2.37 1.09 0.53 0.41 2.03
Solar Power
Projects
5.64 2.44 0.53 0.41 3.38 2.10 0.53 0.41 3.04
NVVNL
Bundled Power -
SOLAR
10.76
7.56 0.53 0.41 8.50 7.22 0.53 0.41 8.16
The actual pooled variable cost is considered as Rs 3.2/Unit for H2 of FY 2020 and Rs 3.54 /Unit for 20021.
The following is the minimum VRE integration cost (Rs Cr).
Type of
VRE
Projects
FY 2019-20 H2 – Rs Crs FY 2020-21 Rs Crs
Adequacy
cost
Balancing
Cost
Grid
integration
cost
Total Adequacy
cost
Balancing
Cost
Grid
integration
cost
Total
Wind Power
Projects 323.31 121.53 94.01 538.85 859.60 425.78 329.38 1614.77
Solar Parks 255.79 94.80 73.34 423.93 389.94 189.60 146.67 726.22
Solar Power
Projects 191.28 41.55 32.14 264.96 314.49 79.37 61.40 455.27
NVVNL
Bundled
Power -
SOLAR
32.13 2.25 1.74 36.13 61.36 4.50 3.48 69.35
Total 802.50 260.13 201.23 1263.86 1625.40 699.26 540.94 2865.60
Maximum VRE integration cost. The following is the maximum VRE integration cost (Rs per unit) based on the
pooled variable cost. notified by APERC vide Tariff Order 2019-20 which is Rs 2.65/Unit.

APSPDCL Page 23
Type of VRE
Projects
Weighted
Average
Tariff
FY 2019-20 H2 FY 2020-21
Adequacy
cost
Balancing
Cost
Grid integration
cost Total Adequacy cost
Balancing
Cost
Grid
integration
cost
Total
Wind Power Projects 4.61 1.96 0.53 0.41 2.90 1.96 0.53 0.41 2.90
Solar Parks 4.63 1.98 0.53 0.41 2.92 1.98 0.53 0.41 2.92
Solar Power Projects 5.64 2.99 0.53 0.41 3.93 2.99 0.53 0.41 3.93
NVVNL Bundled
Power -SOLAR 10.76 8.11 0.53 0.41 9.05 8.11 0.53 0.41 9.05
The following is the maximum VRE integration cost (Rs Cr).
Type of VRE
Projects
FY 2019-20 H2 – Rs Crs FY 2020-21 Rs Crs
Adequacy
cost
Balancing
Cost
Grid
integration
cost
Total Adequacy
cost
Balancing
Cost
Grid
integration
cost
Total
Wind Power Projects 449.42 121.53 94.01 664.96 1574.60 425.78 329.38 2329.76
Solar Parks 354.17 94.80 73.34 522.31 708.33 189.60 146.67 1044.61
Solar Power Projects 234.39 41.55 32.14 308.08 447.78 79.37 61.40 588.55
NVVNL Bundled
Power -SOLAR 34.47 2.25 1.74 38.46 68.93 4.50 3.48 76.92
Total 1072.45 260.13 201.23 1533.81 2799.63 699.26 540.94 4039.84
3.6.3 VRE SUBSIDY
The highest technical authority in the Country i.e. the Central Electricity Authority (CEA) has identified
the VRE integration cost by the RE rich states such as AP for accommodating the Renewable Energy duly
backing down the conventional generation. The consumption of this VRE in place of dispatchable energy
will entail the following subsidy.
FY 2019-20 H2 – Rs Crs FY 2020-21 - Rs Crs
Minimum Rs 1062.62 Cr Rs. 2324.66 Cr
Maximum Rs 1592.70 Cr Rs 3498.90 Cr.
The minimum scenario is calculated based on weighted average thermal variable cost of Rs 3.20/Unit for
H2 of FY 2019-20 & Rs 3.54/Unit for FY 2020-21.
The maximum scenario is calculated based on the weighted average thermal variable cost (Rs 2.65/unit) as
estimated by the Hon’ble APERC in its tariff order for FY 2019-20.
The state government has notified Wind/Solar Policies 2015. Under these policies bilateral agreements to
the extent of 6500 MW are entered into between State Government (or its nominee NREDCAP) and the
project developers.
The State Government directed the DISCOM to enter into high cost VRE Power Purchase Agreements
subsequently. This bilateral agreement between Government and Project developers is the basis for all the
PPAs entered into by DISCOM. These bilateral government agreements include a Must Run Incentive
(MRI) obligation by State Government to the Wind/Solar developers.
The MRI can be estimated as the price differential between VRE tariff determined/discovered u/s 62 or 63
of EA -2003 and the weighted average Thermal variable Cost. To this a balancing cost component that
would arise on account of frequent start ups, ramp ups and ramp down of thermal generating stations that
results in increase in variable costs, wear & tear which may affect the life of the plant, is to be added.
Ultimately the per unit MRI Subsidy = Tariff determined/Discovered - weighted average Thermal
variable Cost + Balancing cost

APSPDCL Page 24
The tariff payable by the DISCOMs to VRE developers = weighted average Thermal variable Cost -
balancing cost
Ex. If the Tariff determined /discovered is Rs 5/Unit, weighted average thermal variable cost is Rs
3.5/Unit and the balancing cost is Rs 0.5/Unit:
The Tariff payable by the DISCOM=3.5-0.5 = Rs 3/Unit
The MRI subsidy payable by the State Govt. = 5-3.5+0.5 = Rs 2.0/Unit.
This MRI is the subsidy payable by State Government to the developer. This MRI subsidy amount will be
paid directly by the State Government to the developers under the bilateral agreement between state
government and the developers. The same is therefore not supposed to be included in the power purchase
cost in ARR.
Out of the VRE tariff, Tariff payable by DISCOM is paid to developer by DISCOM under the PPA, and
the MRI subsidy is paid to developer by State Govt under the bilateral agreement.
4 Losses
4.1 DISCOM losses The DISCOM losses for FY 2019-20 is projected at the same level as actual losses of H1 of FY
2019-20 and for FY 2020-21, losses are projected to reduce 0.6% over FY 2019-20. The table given
below provides the voltage level losses for projecting APSPDCL energy requirement for FY 2019-20
(H2) and FY 2020-21.
The following table gives the details of losses projected by SPDCL for 2019-20 and 2020-21.
4.2 TRANSCO losses The Transco losses for H2 FY 2019-20 and for FY 2020-21 have been taken as per approved losses.
4.3 Losses external to APTRANSCO system The losses external to the APTRANSCO system are considered to be 3.17 % for H2 FY 19-20 and also
for FY 2020-21. This is applicable for procurement of power from Central Generating Stations and other
medium and short term purchases. However, external losses have not been considered for bilateral / inter-
state purchases due to considering average landed power purchase cost at APTransco periphery.

APSPDCL Page 25
5 Expenditure Projections for APSPDCL
5.1 APTransco Charges
The Transmission cost has been computed based on the Transmission Tariff Order for the fourth
control period (FY 2019-20 to FY 2023-24) and is tabulated below.
Form - 1.1 – Transmission Cost
5.2 PGCIL and ULDC Charges
The POC rate approved by CERC for the latest quarter i.e. second quarter of FY 2019-20 is Rs.4.99
lakhs/MW which includes POC slab rate, Reliability support charges rate and HVDC charges rate. Apart
from the main POC bill, PGCIL raises supplementary bills also from time to time. Further, transmission
assets pertaining to CTU(Central Transmission Network) get added to the network regularly which would
increase the POC charges in future. To account for the above, the POC rate of Rs.4.99 lakhs/MW has been
enhanced by 5% to arrive at a value of Rs. 5.24 lakhs/MW. Based on this value, the POC charges for FY
2019-20 H2 and FY 2020-21 have been computed in the following manner.
POC charges for FY 2019-20 H2
= (4.99) X (number of months in the second half of FY 2019-20) X (interstate capacity in MW
APDISCOMs are expected to avail)/100
= (4.99) X (6) X (2796.65)/100 = Rs.837.3Crs.
Total POC charges for FY 2020-21
=(5.24) X (number of months in the FY 2020-21) X (interstate capacity in MW APDISCOMs are
expected to avail)/100
= (5.24) X (12) X (2821.65)/100 = Rs.1774.25 Crs.
The above charges include the POC charges reimbursable to KSK Mahanadi and Sembcorp Energy plants.
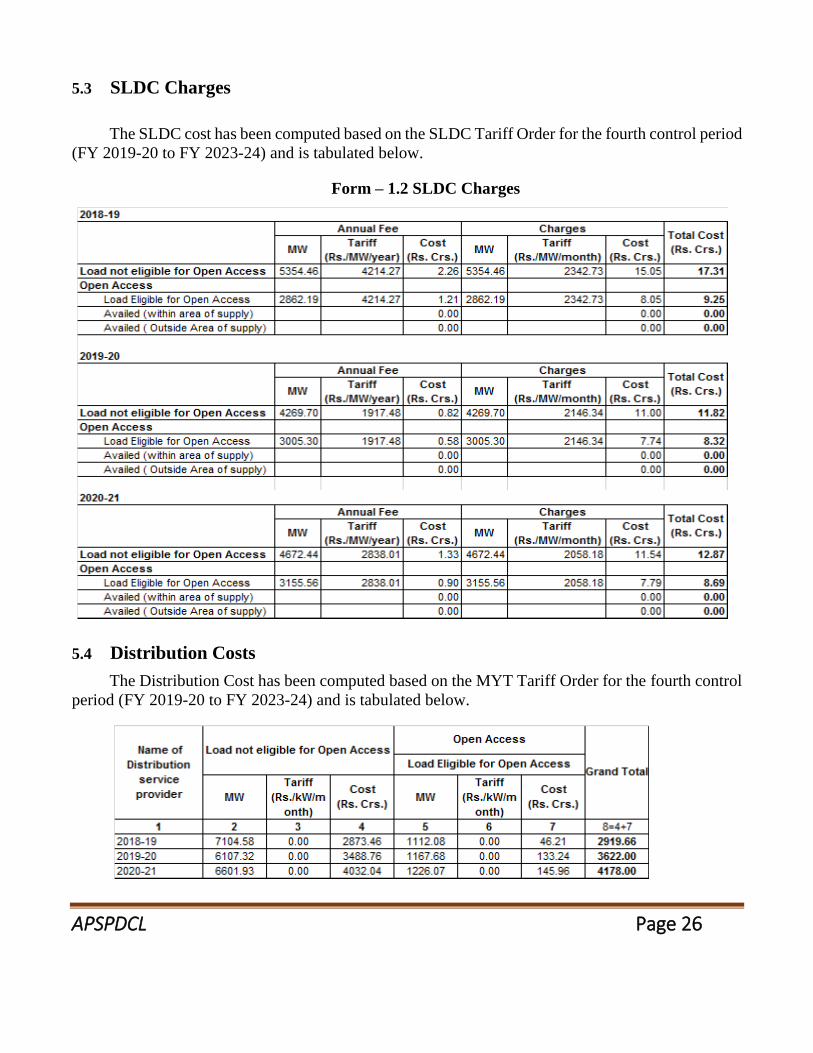
APSPDCL Page 26
5.3 SLDC Charges
The SLDC cost has been computed based on the SLDC Tariff Order for the fourth control period
(FY 2019-20 to FY 2023-24) and is tabulated below.
Form – 1.2 SLDC Charges
5.4 Distribution Costs
The Distribution Cost has been computed based on the MYT Tariff Order for the fourth control
period (FY 2019-20 to FY 2023-24) and is tabulated below.

APSPDCL Page 27
5.5 Interest on Consumer Security Deposits
Interest on Security Deposit is calculated based on the past trend. The interest is calculated @
6.20% per annum for 2019-20 & FY 2020-21 on the average of opening and closing balances.
Form 1.5: The computation on Interest on Consumer Security Deposit is given below
As per APERC Regulation 6 of 2004 stipulates "Security Deposit amount shall be two months charges in case of
monthly billing and 3 months charges for bi-monthly billing".
.....
"The interest accruing to the credit of the consumer shall be adjusted annually against the amounts outstanding
from the consumer to the Licensee as on 1st May of every year and the amounts becoming due from the consumer
to the Licensee immediately thereafter."
5.6 Supply Margin
Proposal to Fix Supply Margin @ 2 paise /Unit
As per the present practice the Hon’ble APERC has been allowing Retail Supply Margin (RSM) on the
basis of 2% additional Return on the equity portion of approved Regulated Rate Base (RRB). In this
methodology there is no direct linkage to the sales/turnover which is a directly identifiable parameter in
Power Supply business of the DISCOM to earn the Regulated Return, instead it is linked to the network
business. The DISCOMs are proposing to deviate from this practice and propose the Retail Supply margin
(RSM) in similar lines of Trading margin available to the trading licensees whose activity is analogues to
the supply activity of the DISCOMs. Accordingly, the DISCOMs propose a 2 paise per sale unit as the
RSM with effect from the ensuing financial year. The present trading margin allowed by the Hon’ble
CERC for all Inter State trading licensees is 7 paise max. per unit. The Hon’ble Commission is humbly
requested to kindly approve the proposal of Licensee and encourage to carryout the supply activity in a
more effective manner.
Form – 1.6 - Supply Margin Rs. in Crores
Particulars 2018-19 2019-20 2020-21
Supply Margin Amount
13.05 28.31 77.59
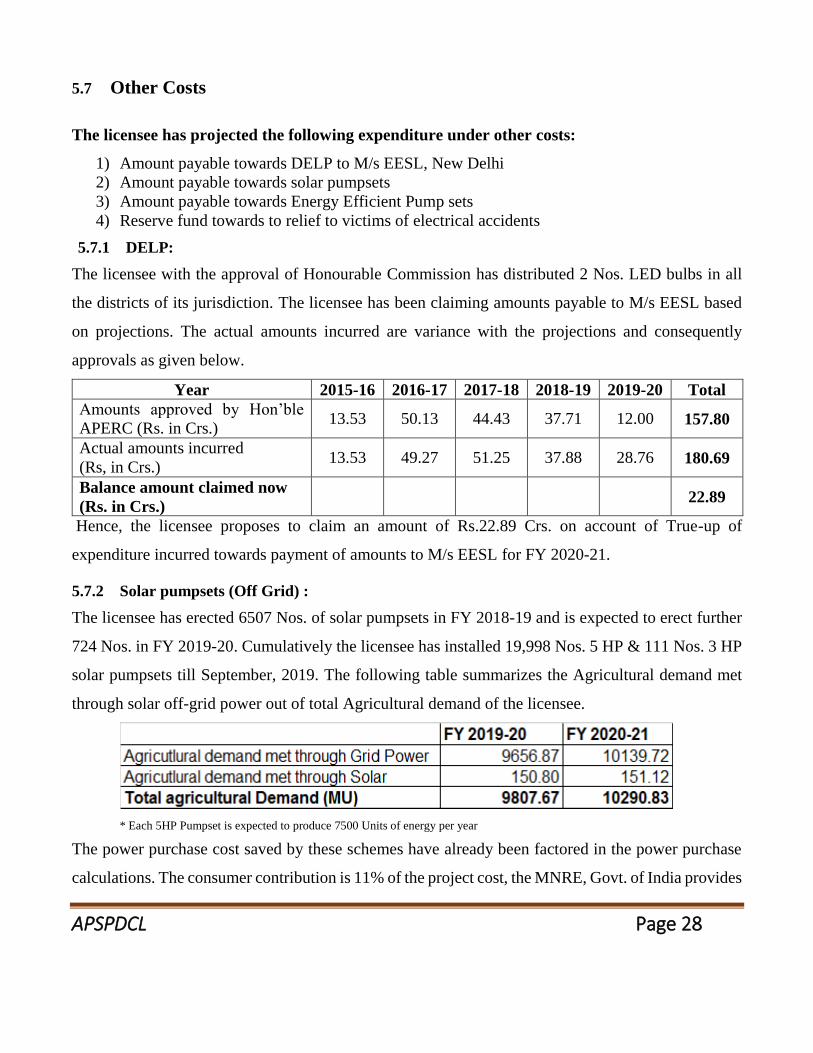
APSPDCL Page 28
5.7 Other Costs
The licensee has projected the following expenditure under other costs:
1) Amount payable towards DELP to M/s EESL, New Delhi
2) Amount payable towards solar pumpsets
3) Amount payable towards Energy Efficient Pump sets
4) Reserve fund towards to relief to victims of electrical accidents
5.7.1 DELP:
The licensee with the approval of Honourable Commission has distributed 2 Nos. LED bulbs in all
the districts of its jurisdiction. The licensee has been claiming amounts payable to M/s EESL based
on projections. The actual amounts incurred are variance with the projections and consequently
approvals as given below.
Year 2015-16 2016-17 2017-18 2018-19 2019-20 Total
Amounts approved by Hon’ble
APERC (Rs. in Crs.) 13.53 50.13 44.43 37.71 12.00 157.80
Actual amounts incurred
(Rs, in Crs.) 13.53 49.27 51.25 37.88 28.76 180.69
Balance amount claimed now
(Rs. in Crs.) 22.89
Hence, the licensee proposes to claim an amount of Rs.22.89 Crs. on account of True-up of
expenditure incurred towards payment of amounts to M/s EESL for FY 2020-21.
5.7.2 Solar pumpsets (Off Grid) :
The licensee has erected 6507 Nos. of solar pumpsets in FY 2018-19 and is expected to erect further
724 Nos. in FY 2019-20. Cumulatively the licensee has installed 19,998 Nos. 5 HP & 111 Nos. 3 HP
solar pumpsets till September, 2019. The following table summarizes the Agricultural demand met
through solar off-grid power out of total Agricultural demand of the licensee.
* Each 5HP Pumpset is expected to produce 7500 Units of energy per year
The power purchase cost saved by these schemes have already been factored in the power purchase
calculations. The consumer contribution is 11% of the project cost, the MNRE, Govt. of India provides

APSPDCL Page 29
33% of the project cost as subsidy and balance 56% is to be borne by the licensee. The following table
shows the cost-breakup of solar-pumpsets and Discom’s contribution for which it is liable to repay
the loan instalments.
The actual expenditure incurred and projected / approved expenditure are at variance for the previous
years as given below.
Year 2015-16 2016-17 2017-18 2018-19 2019-20 Total
Actual work executed (1) 49.09 62.02 108.08 125.23 13.47 357.89
Debt (2) 31.33 30.67 48.04 85.35 0.00 195.39
Own funds (3) 17.76 31.35 60.04 39.88 13.47 162.50
Principle (4) 0.00 2.58 5.17 5.17 5.17 18.09
Interest (5) 0.87 6.77 11.04 17.17 17.94 53.79
Total amount incurred (6=3+4+5) 18.63 40.70 76.25 62.22 36.58 234.38
Approved (7) 0.00 11.38 36.90 34.80 63.93 147.01
Balance amount claimed now
(Rs. in Crs.) (8=6-7) 18.63 29.32 39.35 27.42 -27.35 87.37
There is a true-up of Rs.87.37 Crs. on account of variation in approved Vs actual costs for previous
years. Further, the DISCOM is projected to incur an amount of Rs.23.11 Crs. in FY 2020-21 towards
repayment of loans taken for Solar pumpsets.
5.7.3 Energy Efficient pump sets : The licensee proposed to replace 65,000 Nos. of old pumpsets with
BEE 5 Star rated 5 HP energy efficient submersible pump sets with smart control panels. The details
of the project costs are given below.
The above project was approved by Honourable APERC vide order in OP.No.20 of 2017, dated
17-06-2017. Till now the licensee has replaced 51877 Nos. 5HP energy efficient submersible

APSPDCL Page 30
pumpsets till September, 2019. The expenditure proposed to be incurred by the licensee towards
repayment of interest on loan for FY 2020-21 is Rs.28.761 Crs.
5.7.4 Reserve fund towards relief to victims of electrical accidents
During FY 2019-20, upto Sep’19 the DISCOM has sanctioned compensation to the victims of
electrical accidents an amount of Rs.4.46 Crs. Hence it is proposed to incur an amount of Rs.18 Crs.
towards reserve fund for relief to victims of electrical accidents for FY 2020-21.
5.7.5 Grants to APSEEDCO for promotion of Energy Conservation
In the Tariff Order for FY 2019-20, the Honourable APERC has directed to include the grants for
APSEEDCO at not lower than the approved level for FY 2019-20 for the next four years in the ARR &
Tariff filings for Retail Sale of Electricity. Hence the licensee has proposed an amount of Rs.2 Crs. towards
grants to APSEEDCO for promotion of Energy Conservation & Efficiency for FY 2020-21.
The other costs during FY 2020-21 is submitted below. Rs. Crs.
5.8 Summary of ARR
Aggregate Revenue Requirement (ARR) for Retail Supply Business (Form-1) (Rs. in Crores)

APSPDCL Page 31
6 Revenue Projections
6.1 Sales Forecast
The factors affecting the actual consumption are numerous and often beyond the control of the
licensee due to factors such as Government Policy, economic climate, weather conditions and force
majeure events like natural disasters. Therefore, an accurate point-estimate of the consumption (sales
by licensee) is not possible. Under such a situation, the attempt is to look into various factors and
estimate the interrelationships to arrive at a reasonably accurate forecast within a range and use a
single point-estimate within the range for the limited purpose of estimating future costs / revenues.
6.1.1 Trend Method
This method is a non-causal model of demand forecasting which assumes that the underlying factors,
which drive the demand for electricity, are expected to follow the same trend as in the past and hence
the forecast for electricity is also based on the assumption that the past trend in consumption of
electricity will continue in the future. The strength of this method, when used with balanced judgment,
lies in its ability to reflect recent changes and therefore is probably best suited for a short-term
projection as used for the ARR/ Tariff filing. However, the trend-based approach has to be adjusted
for judgment on the characteristics of the specific consumer groups/ categories. For example, while
this method may provide a better estimate of consumption by the domestic and commercial categories
of consumers, it may not be very suitable for the industrial category because of the high dependence
of demand on the end-use and also on the macroeconomic variables.
In any case, the forecasts arrived at by using the trend method need to be modified for impact of any
other considerations like increasing commercialization/ development in certain districts/ regions to
incorporate the impact of econometric variables and the load reliefs issued in the past. The Licensee
has projected the category –wise sales based on the modified trend approach. Sales Forecast for the
ensuing year has been developed primarily based on analysis of historic data for the period FY 2014-
15 to H1 of FY 2019-20. The following inputs have been taken to arrive at sales consumption for H2
of FY 2019-20 and FY 2020-21.

APSPDCL Page 32
Actual sales (6 districts + Anantapur & Kurnool) captured from FY2014-15 to FY 2018-19
CAGR computed for historical sales for FY 2014-15 to FY 2018-19
Actual sales (6 districts + Anantapur & Kurnool) captured for FY 2019-20 (upto Sep’19)
CAGR computed for actual sales from FY 2014-15 to FY 2019-20
Growth rate used on FY 2019-20 projected sales to forecast sales for FY 2020-21
Additional loads for Lift irrigation schemes, CRDA and Industrial clusters etc., added for
projecting FY 2019-20 (H2) & FY 2020-21 sales
Load reliefs (minimal in extent) captured for FY 2018-19 and FY 2019-20 (H1)
No Load reliefs are expected in FY 2019-20 (H2) & FY 2020-21
The sales for FY 2019-20 are projected by taking actuals upto Sep’19 and projecting the growth
rate based on the trend observed during the period from April’19 to Sep’19 and appropriate CAGR
by considering the additional loads.
The sales for FY 2020-21 are projected based on trend observed and appropriate CAGR duly
considering the additional loads.
6.1.2 LT Sales forecast
Sales Forecast for FY 2020-21 has been projected primarily based on analysis of historic data for the
period FY 2014-15 to FY 2018-19. The Licensee submits the following forecasts of energy sales (in
million units) as part of the current application to the Honourable Commission. For the FY 2014-15,
the actual sales pertaining to Anantapur & Kurnool districts are considered from 2nd June, 2014.
6.1.2.1 LT Cat-I: Domestic
The consumption of power by the domestic category is 8672.82 MU in the year 2018-19
consisting of 4696.19 MU in the first half and 3976.63 MU in the second half of the year. The sales
projected for FY 2019-20 is 9733.91 MU (H1 : 5391.87, H2 : 4342.04) and for FY 2020-21 is
10445.84 MU.

APSPDCL Page 33
6.1.2.2 LT Cat-II: Commercial & Others
The consumption of power by the Commercial & Others category is 1907.34 MU in
the year 2018-19 consisting of 1004.50 MU in the first half and 902.84 MU in the second half of the
year. The sales projected for FY 2019-20 is 2067.07 MU (H1 : 1099.24, H2 : 967.83) and for FY
2020-21 is 2223.30 MU.
6.1.2.3 LT Cat-III: Industrial
The consumption of power by the category is 1061.67 MU in FY 2018-19 consisting of 523.60
MU in the first half and 538.07 MU in the second half of the year. The sales projected for FY 2019-
20 is 1060.73 MU (H1 : 521.62, H2 : 539.11) and for FY 2020-21 is 1073.35 MU.
6.1.2.4 LT-IV - Institutional
The consumption of power by this category is 855.45 MU in FY 2018-19 consisting of 414.41
MU in the first half and 441.05 MU in the second half of the year. The sales projected for FY 2019-
20 is 908.29 MU (H1 : 439.16, H2 : 469.13) and for FY 2020-21 is 956.63 MU.

APSPDCL Page 34
6.1.2.5 LT-V - Agriculture & Related
a) The Licensed area of APSPDCL covers eight Districts after bifurcation of AP state. Farmers
in these eight Districts largely depend on lifting of ground water for their irrigation needs. The
Energy Demand has been growing consistently over the past years. Usually, two crops are
grown in a year and in some areas where plenty of water is available, particularly in Krishna
and Guntur districts & part of other districts, third crop is also grown. Among all the crops,
Paddy is the most preferred crop being grown in all the eight Districts resulting in high Energy
Demand on Irrigation.
b) Large no. of the pump sets under usage are of not as per standard specifications and such pump
sets draw more Energy. Also the farmers are replacing the old pump sets with higher capacity
pump sets whenever the depth of water table increases.
c) There are 14,57,550 Nos. agricultural services in the licensee’s area as on 31-03-2019. During
FY 2019-20, the licensee has released 17097 Nos. agricultural connections upto September,
2019 against the present target of 50,000 Nos. By this projected addition of new connections,
the total no.of agricultural connections in the licensee area will be 15,07,550 Nos. at end of
FY 2019-20. The circle wise break up of no.of agricultural connections existing, added and
projections for FY 2019-20 & FY 2020-21 are furnished in the table below:
d) The majority of the agricultural connections are with bore wells. Hence, the average capacity
of the pump-sets are increasing at every year. The connected load details of agricultural
connections are furnished in the below table:

APSPDCL Page 35
e) Initiatives of the licensee to control agricultural sales in line with Tariff Order :
The licensee has took all possible measures to control agricultural sales within the limits of
Tariff Order. The following initiatives are taken in this regard.
Strict implementation of 9 Hrs. supply a day.
Anti-pilferage measures.
APSPDCL has taken Demand side management measures with publicity through handouts,
electronic media etc., to the farmers to install energy efficient pump sets, required rating
of capacitors, HDPE pipe lines at suction and delivery and frictionless foot-valves to save
energy and to avail subsidized tariff.
Wide publicity is being given among the consumers on installation of capacitors
With the initiatives of MNRE, Govt. of India, erection of solar pump sets project has been
under taken at a large scale. REC is acting as financial agency, MNRE is giving 33% as
subsidy, the consumer is contributing 11% and balance 56% is to be borne by the licensee.
So far, 19,998 Nos. 5 HP & 111 Nos. 3 HP solar pumpsets were commissioned at the end
of September, 2019.
Agreement entered with M/s EESL, New Delhi for 65,000 Nos. replacement of existing
old inefficient pump sets with ISI pump sets and 51877 Nos. 5HP old pumpsets were
replaced with energy efficient pump sets till September, 2019.
HVDS: The APSPDCL has taken to convert existing LT network in to HVDS for all
agricultural connections. Majority of services in the districts of Vijayawada, Guntur,
Prakasam, Nellore, Tirupati and Kadapa are already provided supply with HVDS. Works
are in progress in all the districts of the licensee to provide HVDS to all agricultural
connections.
f) Factors for increased agricultural sales :
The following factors are expected for the increased agricultural sales in the licensee area.
Releasing of agricultural services in large number due to increasing demand for new
services.
Due to increase in rainfall during the current year, ground water level increased for the
FY 2019-20, Hence the agricultural consumption will be increased in H2 of FY 2019-20
& FY 2020-21.

APSPDCL Page 36
g) Sales estimates with ISI methodology :
The agricultural sales estimations are being done with ISI methodology for all the circles
h) Sales estimation : Actuals for FY 2018-19, FY 2019-20 (H1) and projections for
FY 2019-20 (H2) and FY 2020-21.
(i) Based on the methods as explained above, the actual sales are considered for FY 2018-
19 and FY 2019-20 (H1).
(ii) For FY 2019-20 (H2) and FY 2020-21, sales projections are made based on the
historical sales, considering new services released / to be released and anticipated
seasonal changes.
(iii) The agricultural demand met through Off-Grid Solar pumpsets (Around 151 MUs) is
not considered in the sales projections as the same are not connected to Grid.
(iv) The actual sales estimated and projections made as discussed in the above paras are
furnished in the below tables:
The above sales are inclusive of paying category services.

APSPDCL Page 37
The following issues were considered while projecting agricultural consumption for FY 2019-
20 and for the next year FY 2020-21:
The consumption of power by the category is 9832.49 MU in 2018-19 consisting of 4549.73 MU in
the first half and 5282.76 MU in the second half of the year.
While the consumption during 2018-19 H2 is higher than that of H1, the same trend is expected to
continue in second half of 2019-20. The Agricultural consumption during H2 of 2019-20 is expected
to be higher than H1 (4127.11 MU) and is estimated at 5459.50 MU and total for FY 2019-20 is
9586.61 MU.
Growth in agriculture restricted sales are linked to the growth rate in agriculture connections as
mentioned above. The licensee is projecting 5.76% growth in sales for FY 2020-21 over the total
sales for FY 2019-20. The licensee is confident that the growth-rate projected would take care of
the increase in specific consumption, consumption increase because of new services to be released
in FY 2020-21.
The licensee has assumed 9 hours of supply to agricultural consumers, in its projections, considering
the present power supply situation in the state.
6.1.3 Temporary Supply
The consumption of power by the category is 1.32 MU in FY 2018-19 consisting of 0.66 MU
in the first half and 0.66 MU in the second half of the year. The sales projected for FY 2019-20 is 0.66
MU (H1 : 0, H2 : 0.66) and for FY 2020-21 is 0.73 MU.

APSPDCL Page 38
6.1.4 HT sales forecast
Details of the trends envisaged for key categories are discussed in the following sections.
6.1.4.1 HT Cat-I – Domestic
The consumption of power by the HT Domestic category is 26.43 MU in FY 2018-19
consisting of 14.13 MU in the first half and 12.29 MU in the second half of the year. The sales
projected for FY 2019-20 is 23.44 MU (H1 : 10.28, H2 : 13.15) and for FY 2020-21 is 23.67 MU.
6.1.4.2 HT Cat-II: Commercial & Others
The consumption of power by the HT Commercial & Others category was 869.10 MU in the
FY 2018-19 consisting of 449.81 MU in the first half and 419.29 MU in the second half of the year.
The sales projected for FY 2019-20 is 1176.24 MU (H1 : 572.32, H2 : 603.91) and for FY 2020-21 is
1206.34 MU.
6.1.4.3 HT III: Industrial
The consumption of power by the HT Industrial category was 7483.89MU in the FY 2018-19
consisting of 3651.56 MU in the first half and 3832.33 MU in the second half of the year. The sales
projected for FY 2019-20 is 7425.05 MU (H1 : 3523.71, H2 : 3901.34) and for FY 2020-21 is 7633.38
MU.

APSPDCL Page 39
6.1.4.4 HT Cat-IV ; Institutional
The consumption of power by the HT Institutional category was 961.79 MU in the FY 2018-19
consisting of 490.23 MU in the first half and 471.55 MU in the second half of the year. The sales
projected for FY 2019-20 is 968.03 MU (H1:483.23, H2:484.81) and for FY 2020-21 is 1016.66 MU
6.1.4.5 HT Cat-V: Agriculture & Related
The consumption of power by the HT Lift Irrigation & CPWS category is 1465.71 MU in FY
2018-19 consisting of 422.78 MU in the first half and 1042.93 MU in the second half of the year. The
sales projected for FY 2019-20 is 1832.95 MU (H1 : 513.95, H2 : 1319) and for FY 2020-21 is
1955.83 MU.
The Licensee has collected the likely commissioning dates of the upcoming lift irrigation schemes in
consultation with Chief Engineer / Lift irrigation / APTransco and projected the sales for H2 of
FY2019-20 (Oct’19 to Mar’20) & FY 2020-21. In APSPDCL, the following are major State
Government Lift Irrigation schemes are expected to be operational.
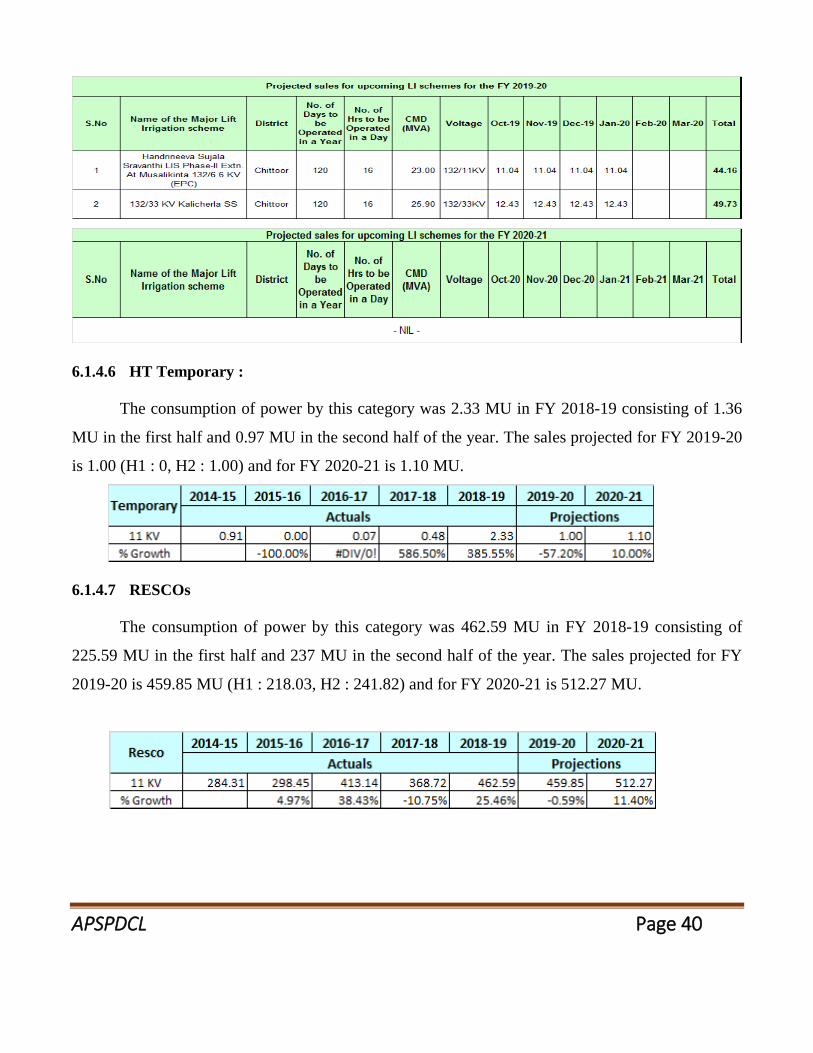
APSPDCL Page 40
6.1.4.6 HT Temporary :
The consumption of power by this category was 2.33 MU in FY 2018-19 consisting of 1.36
MU in the first half and 0.97 MU in the second half of the year. The sales projected for FY 2019-20
is 1.00 (H1 : 0, H2 : 1.00) and for FY 2020-21 is 1.10 MU.
6.1.4.7 RESCOs
The consumption of power by this category was 462.59 MU in FY 2018-19 consisting of
225.59 MU in the first half and 237 MU in the second half of the year. The sales projected for FY
2019-20 is 459.85 MU (H1 : 218.03, H2 : 241.82) and for FY 2020-21 is 512.27 MU.
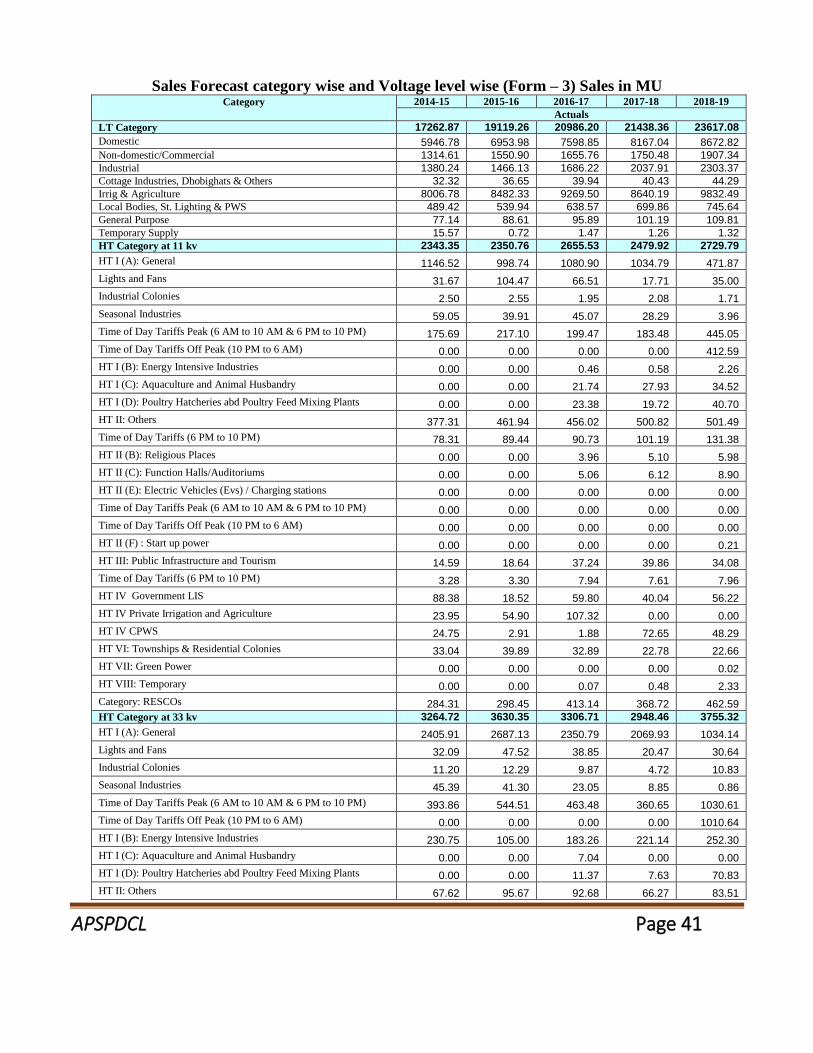
APSPDCL Page 41
Sales Forecast category wise and Voltage level wise (Form – 3) Sales in MU Category
2014-15 2015-16 2016-17 2017-18 2018-19
Actuals
LT Category 17262.87 19119.26 20986.20 21438.36 23617.08
Domestic 5946.78 6953.98 7598.85 8167.04 8672.82
Non-domestic/Commercial 1314.61 1550.90 1655.76 1750.48 1907.34
Industrial 1380.24 1466.13 1686.22 2037.91 2303.37
Cottage Industries, Dhobighats & Others 32.32 36.65 39.94 40.43 44.29
Irrig & Agriculture 8006.78 8482.33 9269.50 8640.19 9832.49
Local Bodies, St. Lighting & PWS 489.42 539.94 638.57 699.86 745.64
General Purpose 77.14 88.61 95.89 101.19 109.81
Temporary Supply 15.57 0.72 1.47 1.26 1.32
HT Category at 11 kv 2343.35 2350.76 2655.53 2479.92 2729.79
HT I (A): General 1146.52 998.74 1080.90 1034.79 471.87
Lights and Fans 31.67 104.47 66.51 17.71 35.00
Industrial Colonies 2.50 2.55 1.95 2.08 1.71
Seasonal Industries 59.05 39.91 45.07 28.29 3.96
Time of Day Tariffs Peak (6 AM to 10 AM & 6 PM to 10 PM) 175.69 217.10 199.47 183.48 445.05
Time of Day Tariffs Off Peak (10 PM to 6 AM) 0.00 0.00 0.00 0.00 412.59
HT I (B): Energy Intensive Industries 0.00 0.00 0.46 0.58 2.26
HT I (C): Aquaculture and Animal Husbandry 0.00 0.00 21.74 27.93 34.52
HT I (D): Poultry Hatcheries abd Poultry Feed Mixing Plants 0.00 0.00 23.38 19.72 40.70
HT II: Others 377.31 461.94 456.02 500.82 501.49
Time of Day Tariffs (6 PM to 10 PM) 78.31 89.44 90.73 101.19 131.38
HT II (B): Religious Places 0.00 0.00 3.96 5.10 5.98
HT II (C): Function Halls/Auditoriums 0.00 0.00 5.06 6.12 8.90
HT II (E): Electric Vehicles (Evs) / Charging stations 0.00 0.00 0.00 0.00 0.00
Time of Day Tariffs Peak (6 AM to 10 AM & 6 PM to 10 PM) 0.00 0.00 0.00 0.00 0.00
Time of Day Tariffs Off Peak (10 PM to 6 AM) 0.00 0.00 0.00 0.00 0.00
HT II (F) : Start up power 0.00 0.00 0.00 0.00 0.21
HT III: Public Infrastructure and Tourism 14.59 18.64 37.24 39.86 34.08
Time of Day Tariffs (6 PM to 10 PM) 3.28 3.30 7.94 7.61 7.96
HT IV Government LIS 88.38 18.52 59.80 40.04 56.22
HT IV Private Irrigation and Agriculture 23.95 54.90 107.32 0.00 0.00
HT IV CPWS 24.75 2.91 1.88 72.65 48.29
HT VI: Townships & Residential Colonies 33.04 39.89 32.89 22.78 22.66
HT VII: Green Power 0.00 0.00 0.00 0.00 0.02
HT VIII: Temporary 0.00 0.00 0.07 0.48 2.33
Category: RESCOs 284.31 298.45 413.14 368.72 462.59
HT Category at 33 kv 3264.72 3630.35 3306.71 2948.46 3755.32
HT I (A): General 2405.91 2687.13 2350.79 2069.93 1034.14
Lights and Fans 32.09 47.52 38.85 20.47 30.64
Industrial Colonies 11.20 12.29 9.87 4.72 10.83
Seasonal Industries 45.39 41.30 23.05 8.85 0.86
Time of Day Tariffs Peak (6 AM to 10 AM & 6 PM to 10 PM) 393.86 544.51 463.48 360.65 1030.61
Time of Day Tariffs Off Peak (10 PM to 6 AM) 0.00 0.00 0.00 0.00 1010.64
HT I (B): Energy Intensive Industries 230.75 105.00 183.26 221.14 252.30
HT I (C): Aquaculture and Animal Husbandry 0.00 0.00 7.04 0.00 0.00
HT I (D): Poultry Hatcheries abd Poultry Feed Mixing Plants 0.00 0.00 11.37 7.63 70.83
HT II: Others 67.62 95.67 92.68 66.27 83.51

APSPDCL Page 42
Category
2014-15 2015-16 2016-17 2017-18 2018-19
Actuals
Time of Day Tariffs (6 PM to 10 PM) 13.32 19.26 18.43 18.68 25.89
HT II (B): Religious Places 0.00 0.00 7.20 26.87 29.01
HT II (C): Function Halls/Auditoriums 0.00 0.00 0.00 7.73 0.11
HT II (E): Electric Vehicles (Evs) / Charging stations 0.00 0.00 0.00 0.00 0.00
Time of Day Tariffs Peak (6 AM to 10 AM & 6 PM to 10 PM) 0.00 0.00 0.00 0.00 0.00
Time of Day Tariffs Off Peak (10 PM to 6 AM) 0.00 0.00 0.00 0.00 0.00
HT II (F) : Start up power 0.00 0.00 0.00 0.00 17.37
HT III: Public Infrastructure and Tourism 0.00 0.00 3.17 6.97 6.77
Time of Day Tariffs (6 PM to 10 PM) 0.00 0.00 0.71 1.50 1.87
HT IV Government LIS 37.70 23.15 42.57 52.66 86.31
HT IV Private Irrigation and Agriculture 10.20 52.28 52.35 0.00 0.00
HT IV CPWS 15.25 0.00 0.00 71.34 59.86
HT VI: Townships & Residential Colonies 1.44 2.25 1.87 3.05 3.76
HT VII: Green Power 0.00 0.00 0.00 0.00 0.00
HT VIII: Temporary 0.00 0.00 0.00 0.00 0.00
Category: RESCOs 0.00 0.00 0.00 0.00 0.00
HT Category at 132 kv 3490.59 3612.00 3786.06 4468.28 4786.72
HT I (A): General 1914.08 2126.19 1828.51 2261.42 864.08
Lights and Fans 15.41 25.74 15.28 46.19 14.63
Industrial Colonies 12.38 14.52 11.00 11.81 12.95
Seasonal Industries 0.00 0.00 0.00 0.00 0.00
Time of Day Tariffs Peak (6 AM to 10 AM & 6 PM to 10 PM) 317.23 407.14 388.07 385.55 840.39
Time of Day Tariffs Off Peak (10 PM to 6 AM) 0.00 0.00 0.00 0.00 900.70
HT I (B): Energy Intensive Industries 138.77 131.41 117.76 139.56 108.68
HT I (C ): Aquaculture and Animal Husbandry 0.00 0.00 0.00 0.00 0.00
HT I (D): Poultry and Hatcheries and Poultry Feed Mixing Plants 0.00 0.00 0.00 0.00 0.00
HT II: Others 14.25 22.93 24.65 32.83 37.52
Time of Day Tariffs (6 PM to 10 PM) 2.50 3.82 4.25 6.22 8.41
HT II (B): Religious Places 0.00 0.00 0.00 0.00 0.00
HT II (C) : Function Halls / Auditoriums 0.00 0.00 0.00 2.43 0.00
HT II (E): Electric Vehicles (Evs) / Charging stations 0.00 0.00 0.00 0.00 0.00
Time of Day Tariffs Peak (6 AM to 10 AM & 6 PM to 10 PM) 0.00 0.00 0.00 0.00 0.00
Time of Day Tariffs Off Peak (10 PM to 6 AM) 0.00 0.00 0.00 0.00 0.00
HT II (F) : Start up power 0.00 0.00 0.00 0.00 3.62
HT III: Public Infrastructure and Tourism 0.00 0.00 0.00 0.00 0.00
Time of Day Tariffs (6 PM to 10 PM) 0.00 0.00 0.00 0.00 0.00
HT IV Government LIS 328.13 187.51 746.87 842.66 1177.12
HT IV Agriculture 0.00 0.00 0.00 0.00 0.00
HT IV CPWS 0.00 0.00 0.00 0.00 0.00
HT V: Railway Traction 747.84 692.74 649.67 739.61 818.64
HT VI: Townships & Residential Colonies 0.00 0.00 0.00 0.00 0.00
HT VII: Green Power 0.00 0.00 0.00 0.00 0.00
HT VIII: Temporary 0.00 0.00 0.00 0.00 0.00
Category: RESCOs 0.00 0.00 0.00 0.00 0.00
Total (LT + HT) 26361.53 28712.37 30734.50 31335.03 34888.91
YoY Growth (%) 8.92% 7.04% 1.95% 11.34%
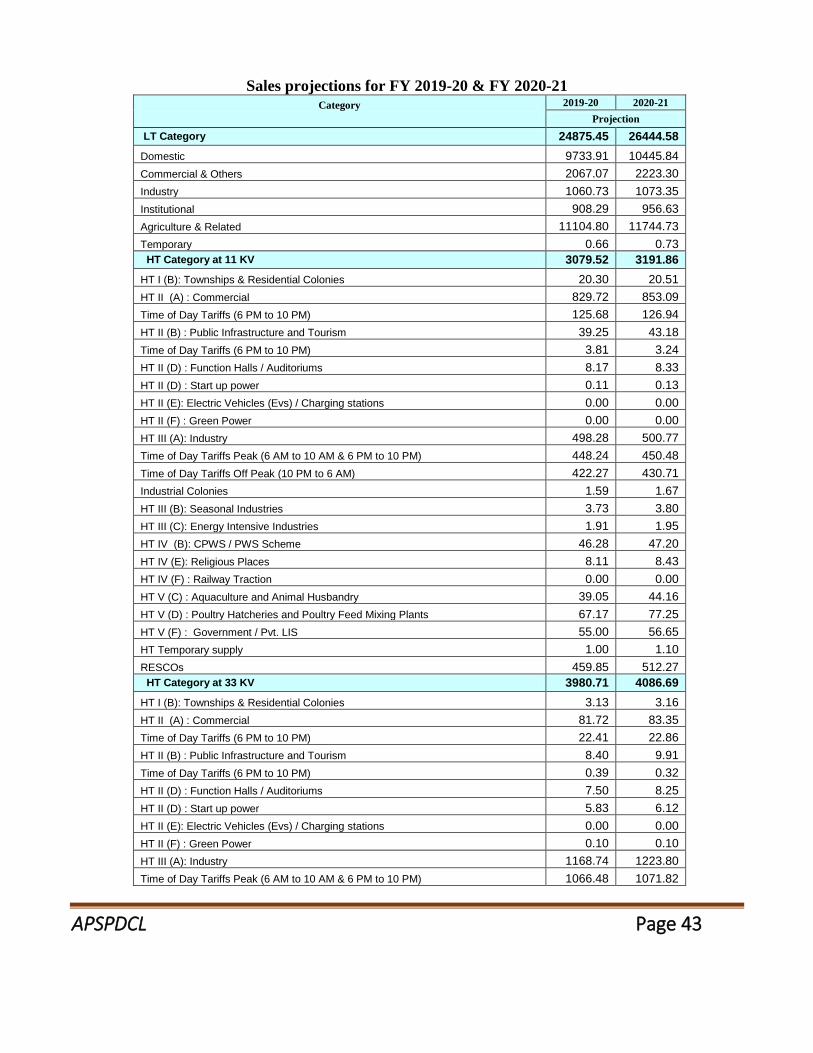
APSPDCL Page 43
Sales projections for FY 2019-20 & FY 2020-21 Category
2019-20 2020-21
Projection
LT Category 24875.45 26444.58
Domestic 9733.91 10445.84
Commercial & Others 2067.07 2223.30
Industry 1060.73 1073.35
Institutional 908.29 956.63
Agriculture & Related 11104.80 11744.73
Temporary 0.66 0.73
HT Category at 11 KV 3079.52 3191.86
HT I (B): Townships & Residential Colonies 20.30 20.51
HT II (A) : Commercial 829.72 853.09
Time of Day Tariffs (6 PM to 10 PM) 125.68 126.94
HT II (B) : Public Infrastructure and Tourism 39.25 43.18
Time of Day Tariffs (6 PM to 10 PM) 3.81 3.24
HT II (D) : Function Halls / Auditoriums 8.17 8.33
HT II (D) : Start up power 0.11 0.13
HT II (E): Electric Vehicles (Evs) / Charging stations 0.00 0.00
HT II (F) : Green Power 0.00 0.00
HT III (A): Industry 498.28 500.77
Time of Day Tariffs Peak (6 AM to 10 AM & 6 PM to 10 PM) 448.24 450.48
Time of Day Tariffs Off Peak (10 PM to 6 AM) 422.27 430.71
Industrial Colonies 1.59 1.67
HT III (B): Seasonal Industries 3.73 3.80
HT III (C): Energy Intensive Industries 1.91 1.95
HT IV (B): CPWS / PWS Scheme 46.28 47.20
HT IV (E): Religious Places 8.11 8.43
HT IV (F) : Railway Traction 0.00 0.00
HT V (C) : Aquaculture and Animal Husbandry 39.05 44.16
HT V (D) : Poultry Hatcheries and Poultry Feed Mixing Plants 67.17 77.25
HT V (F) : Government / Pvt. LIS 55.00 56.65
HT Temporary supply 1.00 1.10
RESCOs 459.85 512.27
HT Category at 33 KV 3980.71 4086.69
HT I (B): Townships & Residential Colonies 3.13 3.16
HT II (A) : Commercial 81.72 83.35
Time of Day Tariffs (6 PM to 10 PM) 22.41 22.86
HT II (B) : Public Infrastructure and Tourism 8.40 9.91
Time of Day Tariffs (6 PM to 10 PM) 0.39 0.32
HT II (D) : Function Halls / Auditoriums 7.50 8.25
HT II (D) : Start up power 5.83 6.12
HT II (E): Electric Vehicles (Evs) / Charging stations 0.00 0.00
HT II (F) : Green Power 0.10 0.10
HT III (A): Industry 1168.74 1223.80
Time of Day Tariffs Peak (6 AM to 10 AM & 6 PM to 10 PM) 1066.48 1071.82

APSPDCL Page 44
Category
2019-20 2020-21
Projection
Time of Day Tariffs Off Peak (10 PM to 6 AM) 1072.26 1093.70
Industrial Colonies 10.14 10.34
HT III (B): Seasonal Industries 0.73 0.67
HT III (C): Energy Intensive Industries 212.31 195.32
HT IV (B): CPWS / PWS Scheme 58.89 60.06
HT IV (E): Religious Places 32.18 33.47
HT IV (F) : Railway Traction 0.00 0.00
HT V (C) : Aquaculture and Animal Husbandry 0.00 0.00
HT V (D) : Poultry Hatcheries and Poultry Feed Mixing Plants 122.89 153.61
HT V (F) : Government / Pvt. LIS 106.63 109.83
HT Temporary supply 0.00 0.00
RESCOs 0.00 0.00
HT Category at 132 KV 4826.32 5070.70
HT I (B): Townships & Residential Colonies 0.00 0.00
HT II (A) : Commercial 32.79 30.82
Time of Day Tariffs (6 PM to 10 PM) 7.25 6.82
HT II (B) : Public Infrastructure and Tourism 0.00 0.00
Time of Day Tariffs (6 PM to 10 PM) 0.00 0.00
HT II (D) : Function Halls / Auditoriums 2.06 2.06
HT II (D) : Start up power 1.05 0.84
HT II (E): Electric Vehicles (Evs) / Charging stations 0.00 0.00
HT II (F) : Green Power 0.00 0.00
HT III (A): Industry 769.45 886.81
Time of Day Tariffs Peak (6 AM to 10 AM & 6 PM to 10 PM) 803.81 807.83
Time of Day Tariffs Off Peak (10 PM to 6 AM) 845.99 862.91
Industrial Colonies 13.15 13.42
HT III (B): Seasonal Industries 0.00 0.00
HT III (C): Energy Intensive Industries 85.96 77.36
HT IV (B): CPWS / PWS Scheme 0.00 0.00
HT IV (E): Religious Places 0.00 0.00
HT IV (F) : Railway Traction 822.59 867.50
HT V (C) : Aquaculture and Animal Husbandry 0.00 0.00
HT V (D) : Poultry Hatcheries and Poultry Feed Mixing Plants 0.00 0.00
HT V (F) : Government / Pvt. LIS 1442.21 1514.32
HT Temporary supply 0.00 0.00
RESCOs 0.00 0.00
Grand Total (LT+HT) 36762.01 38793.83
% Growth rate 5.37% 5.53%

APSPDCL Page 45
6.2 Revenue from Current Tariffs
The computation of revenue at current tariff for FY 2019-20 and FY 2020-21 for each customer
category is carried out as follows:
Revenue from Tariffs =
Energy Estimate * Approved Energy Charges … ……………………..……….. (a)
+ Contracted Demand / Load Estimate * Approved Demand / Fixed Charges ………..... (b)
+ Incremental Revenue on account of Monthly Minimum Charges (‘MMC’) … (c)
+ Customer Charges (d)
+ Other Charges ----- (e)
Energy charges:
For customer categories having telescopic energy tariffs, the energy estimates have been apportioned
into the slabs and then have been multiplied with the corresponding slab tariff. The apportionment
has been based on the historical break up of telescopic consumption into the various slabs as captured
in the billing information database. The energy charges are calculated as per the billing parameters
i.e., kWh and kVAh for the category and the existing tariff rates of that category.
Demand/Fixed Charges: The estimate of demand has been made in “HP/kW” or in “MVA” as the
case maybe. Billing demand has been assumed to grow in proportion to the growth of sales in FY
2019-20 & FY 2020-21. Additional demand due to additional load has been added to arrive at final
demand for the year FY 2019-20 & FY 2020-21.
Monthly Minimum charges (MMC): The ‘incremental’ revenue due to MMC for each category is
the difference between cost of units recorded and monthly minimum charges notified in the tariff
order in respect of LT categories.
Customer Charges: Customer charges are as approved in tariff Order for each of the category of
consumers. As per the revised regulatory formats income from customer charges is considered as part
of revenue from tariffs.
Other Charges: These are the charges other than the above charges.

APSPDCL Page 46
Based on the above approach, the gross revenue (excl. NTI) for FY 2019-20 is expected to be
Rs.16333.43 Cr, while that for FY 2020-21 is expected to be Rs. 17269.61 Cr. The NTI for FY 2019-20
is Rs. 943.45 Crs., while for FY 2020-21 NTI is Rs.990.62 crores. The table below provides the category-
wise revenue for FY 2019-20 and FY 2020-21:
Category-wise revenue (Excl. NTI) (Form-5) (Rs. Crores) Category 2019-20 2020-21
LT Category 7892.47 8497.03
Domestic 3820.43 4168.31
Commercial & Others 2109.30 2266.33
Industry 790.72 799.47
Institutional 558.32 587.17
Agriculture & Related 613.01 675.75
Temporary 0.70 0.00
HT Category at 11 kv 2570.82 2620.76
HT I (B): Townships & Residential Colonies 13.63 13.76
HT II (A) : Commercial 950.46 971.11
Time of Day Tariffs (6 PM to 10 PM) 108.71 109.80
HT II (B) : Public Infrastructure and Tourism 38.72 42.66
Time of Day Tariffs (6 PM to 10 PM) 3.16 2.69
HT II (D) : Function Halls / Auditoriums / Start-up power 9.79 10.13
HT II (E): Electric Vehicles (Evs) / Charging stations 0.00 0.00
HT II (F) : Green Power 0.00 0.00
HT III (A): Industry 739.51 743.23
Time of Day Tariffs Peak (6 AM to 10 AM & 6 PM to 10 PM) 327.21 328.85
Time of Day Tariffs Off Peak (10 PM to 6 AM) 223.80 228.28
Industrial Colonies 1.00 1.06
HT III (B): Seasonal Industries 2.90 2.96
HT III (C): Energy Intensive Industries 1.11 1.13
HT IV (B): CPWS / PWS Scheme 22.62 23.07
HT IV (E): Religious Places 4.25 4.42
HT IV (F) : Railway Traction 0.00 0.00
HT V (C) : Aquaculture and Animal Husbandry 15.99 18.09
HT V (D) : Poultry Hatcheries and Poultry Feed Mixing Plants 57.01 65.52
HT V (F) : Government / Pvt. LIS 32.53 33.50
HT Temporary supply 0.01 0.01
RESCOs 18.40 20.49
HT Category at 33 kv 2885.90 2984.66
HT I (B): Townships & Residential Colonies 2.22 2.24
HT II (A) : Commercial 86.09 87.71
Time of Day Tariffs (6 PM to 10 PM) 17.82 18.17
HT II (B) : Public Infrastructure and Tourism 8.03 9.65
Time of Day Tariffs (6 PM to 10 PM) 0.30 0.24
HT II (D) : Function Halls / Auditoriums / Start-up power 8.82 17.23
HT II (E): Electric Vehicles (Evs) / Charging stations 0.00 0.00

APSPDCL Page 47
Category 2019-20 2020-21
HT II (F) : Green Power 0.11 0.11
HT III (A): Industry 1197.22 1253.56
Time of Day Tariffs Peak (6 AM to 10 AM & 6 PM to 10 PM) 730.54 734.19
Time of Day Tariffs Off Peak (10 PM to 6 AM) 520.05 530.45
Industrial Colonies 6.39 6.52
HT III (B): Seasonal Industries 0.51 0.47
HT III (C): Energy Intensive Industries 113.61 104.52
HT IV (B): CPWS / PWS Scheme 28.63 29.20
HT IV (E): Religious Places 16.34 16.99
HT IV (F) : Railway Traction 0.00 0.00
HT V (C) : Aquaculture and Animal Husbandry 0.00 0.00
HT V (D) : Poultry Hatcheries and Poultry Feed Mixing Plants 87.17 109.49
HT V (F) : Government / Pvt. LIS 62.06 63.92
HT Temporary supply 0.00 0.00
RESCOs 0.00 0.00
HT Category at 132 kv 2984.23 3167.15
HT I (B): Townships & Residential Colonies 0.00 0.00
HT II (A) : Commercial 29.38 28.06
Time of Day Tariffs (6 PM to 10 PM) 5.58 5.25
HT II (B) : Public Infrastructure and Tourism 0.00 0.00
Time of Day Tariffs (6 PM to 10 PM) 0.00 0.00
HT II (D) : Function Halls / Auditoriums / Start-up power 2.42 3.42
HT II (E): Electric Vehicles (Evs) / Charging stations 0.00 0.00
HT II (F) : Green Power 0.00 0.00
HT III (A): Industry 723.68 833.28
Time of Day Tariffs Peak (6 AM to 10 AM & 6 PM to 10 PM) 514.44 517.01
Time of Day Tariffs Off Peak (10 PM to 6 AM) 372.24 379.68
Industrial Colonies 8.29 8.45
HT III (B): Seasonal Industries 0.00 0.00
HT III (C): Energy Intensive Industries 42.55 38.30
HT IV (B): CPWS / PWS Scheme 0.00 0.00
HT IV (E): Religious Places 0.00 0.00
HT IV (F) : Railway Traction 449.06 475.28
HT V (C) : Aquaculture and Animal Husbandry 0.00 0.00
HT V (D) : Poultry Hatcheries and Poultry Feed Mixing Plants 0.00 0.00
HT V (F) : Government / Pvt. LIS 836.59 878.42
HT Temporary supply 0.00 0.00
RESCOs 0.00 0.00
Total (LT + HT) 16333.43 17269.61

APSPDCL Page 48
6.2.1 Detailed category wise Revenue computation
The detailed category wise computation of revenue is as follows.
6.2.2 Low Tension Categories
6.2.2.1 LT I: Domestic Category
The revenue at current tariff is projected. Estimated revenue for FY 2019-20 & FY 2020-21 are
submitted below:
Based on the above the total revenue estimate for the category is Rs. 3820.43 Crores for FY 2019-20
and Rs.4168.31 Crores for FY 2020-21.
6.2.2.2 LT II: Commercial & Others Category
Based on the above the total revenue estimate for the category is Rs.2109.30 Crores for FY
2019-20 and Rs.2266.33 Crores for FY 2020-21.
6.2.2.3 LT III: Industrial Category
Based on the above the total revenue estimate for the category is Rs.790.72 Crores for FY
2019-20 and Rs.799.47 Crores for FY 2020-21.

APSPDCL Page 49
6.2.2.4 LT IV: Institutional Category
The total revenue estimate for the category is Rs 558.32 Crores for FY 2019-20 and Rs.587.17
Crores for FY 2020-21.
6.2.2.5 LT V: Agriculture & Related Category
Based on the above computations the gross revenue from agricultural category is Rs.613.01
Crores for FY 2019-20 and Rs.675.75 Crores for FY 2020-21.
6.2.2.6 Temporary supply Category
The total revenue estimate for the category is Rs.0.70 Crores for FY 2019-20 and Rs.0.00 Crores
for FY 2020-21.

APSPDCL Page 50
6.2.3 High Tension Categories
6.2.3.1 HT Cat-I: Domestic
Based on the above the total revenue estimate for the category is Rs.15.85 Crores for FY 2019-20 and
Rs.15.99 Crores for FY 2020-21.
6.2.3.2 HT Cat-II: Commercial & Others
Based on the above consumption the total revenue estimate for the category is Rs.1269.40
Crores for FY 2019-20 and Rs.1306.24 Crores for FY 2020-21.

APSPDCL Page 51
6.2.3.3 HT Cat-III: Industry
Based on the above consumption the total revenue estimate for the category is Rs.5525.05
Crores for FY 2019-20 and Rs.5711.94 Crores for FY 2020-21.
6.2.3.4 HT Cat- IV: Institutional
The total revenue estimate for the category is Rs.520.91 Crores for FY 2019-20 and Rs.548.96
Crores for FY 2020-21.

APSPDCL Page 52
6.2.3.5 HT Cat-V: Agriculture & Related
The total revenue estimate for the category is Rs 1091.35 Crores for FY 2019-20 and
Rs.1168.95 Crores for FY 2020-21.
6.2.3.6 Temporary : The expected revenue for H2 FY 2018-19 & FY 2019-20 are insignificant.
6.2.3.7 RESCOs
The total revenue estimate for the category is Rs 18.40 Crores for FY 2019-20 and Rs.20.49
Crores for FY 2020-21.

APSPDCL Page 53
7 Average Revenue Realized vs Average CoS break up for APSPDCL in
FY 2020-21
Average Revenue Realized vs Average CoS break up for APSPDCL in FY 2020-21
Average Revenue Realisation (ARR) for FY 2020-21 through proposed tariffs is Rs.4.94/kWh
Average Cost of Supply (CoS) for APSPDCL - Rs. 7.36/kWh
Average CoS break-up (per unit of Sales) for APSPDCL is as follows:-
The estimated revenue gap for the licensee for FY 2020-21 is as follows:

APSPDCL Page 54
8 Performance Parameters
The details as required by the APERC as per the fresh directive (1) in the Retail supply Tariff order
2008-09 are given below:
8.1.1 Compensation awarded by the CGRF to the consumers for deficiency of service as per the
Regulations of the Commission
Compensation paid by the licensee to consumers for deficiency of service as per the Regulations of the Commission
S.No C.G.No &
Date Circle
Date of Order
Compensation awarded
Brief Cause
Compensation awarded for the year 2018-2019
1 213/2017-18 Kurnool 28-08-2018 Rs.4,000 /- Compensation for 40 days @ Rs.100/- per day to Rs.4000/-
Compensation awarded for the year 2019-2020 (Upto Sep’19)
- NIL -
8.1.2 Details of Electrical Accidents and ex-gratia sanctioned during FY 2018-19 and FY 2019-20
(upto Sep’19):
2018-19 (Non-Departmental) 2019-20 (upto Sep'19)
(Non-Departmental)
S.
No Circle
Human Animal Human Animal
Fatal Non-fatal Fatal Non-fatal Fatal Non-fatal Fatal Non-fatal
1 Vijayawada 37 9 88 0 33 2 37 0 2 Guntur 41 3 66 0 21 0 21 0
3 Ongole 40 1 88 0 11 0 89 0
4 Nellore 15 8 71 0 4 0 27 0
5 Tirupati 14 3 3 0 8 1 1 0
6 Kadapa 44 9 38 0 22 1 15 0
7 Anantapur 77 9 40 0 51 9 13 0 8 Kurnool 86 24 33 0 49 7 33 0
Total 354 66 427 0 199 20 236 0

APSPDCL Page 55
Ex-gratia Paid
Circle
FY 2018-19 FY 2019-20 (upto Sep, 2019)
Animal
(Nos.) Amount (Rs.)
Human
(Nos.) Amount (Rs.)
Animal
(Nos.)
Amount
(Rs.)
Human
(Nos.)
Amount
(Rs.)
Vijayawada 88 3252000 24 10577206 29 1417000 8 2995333
Guntur 66 2031000 24 9728750 15 650000 10 4272886
Ongole 88 2962000 19 8000000 89 4036500 11 5500000
Nellore 71 1625000 15 6424767 27 1229000 2 100000
Tirupati 3 80000 14 5915244 0 0 8 3428000 Kadapa 38 1164000 26 11710522 8 390000 11 4600000
Anantapur 40 622000 35 14668110 1 40000 24 10018282
Kurnool 33 1263038 26 11037641 15 520000 11 5440827
SPDCL 427 12999038 183 78062240 184 8282500 85 36355328
8.1.3 Replacement of burnt transformers, installation of additional transformers.
S.
No Circle
2018-19 2019-20 (upto Sep'19)
Total No.
of DTRs
Failed
Replacement
of failed
transformers
Installation
of additional
transformers
Total No. of
DTRs
Failed
Replacement
of failed
transformers
Installation
of additional
transformers
1 Vijayawada 2607 2607 6964 1329 1329 3849 2 Guntur 3901 3901 4270 2626 2626 2347 3 Ongole 4962 4962 6019 2739 2739 2127 4 Nellore 6347 6347 6553 2781 2781 3227
5 Tirupati 12451 12451 4608 4819 4819 2003 6 Kadapa 7763 7763 4795 4221 4221 1580
7 Anantapur 6017 6017 17086 3256 3256 9573 8 Kurnool 5101 5101 9561 2792 2792 10045
Total 49149 49149 59856 24563 24563 34751
8.1.4 Number of burnt-out, non-functioning or faulty meters (Circle-wise).

APSPDCL Page 56

APSPDCL Page 57
8.1.5 Performance with regard to attending fuse-off calls.
Performance with regard to attending fuse -off calls
S.No Circle
2018-19
Received With in the
stipulated time
1 Vijayawada 22738 17936
2 Guntur 16030 13103
3 Ongole 4186 3401
4 Nellore 8752 7207
5 Tirupati 11776 9708
6 Kadapa 4787 3977
7 Anantapur 5777 4853
8 Kurnool 5422 4449
APSPDCL 79468 64634
8.1.6 Breakdowns and interruptions in power supply to consumers (Circle-wise) and time taken
for restoration.
Number and Duration of supply interruptions on 33KV and 11KV networks URBAN
For FY 2018-19
S.No Circle No of interruptions Duration in hours No of Breakdowns Duration in Hours
33KV 11KV 33KV 11KV 33KV 11KV 33KV 11KV
1 Vijayawada 725 9605 207:12 480:23 215 699 640:25 1415:03
2 Guntur 963 8778 212:38 439:30 140 269 800:18 743:00
3 Ongole 882 11486 185:36 574:28 93 135 469:21 427:53
4 Nellore 742 10260 179:23 513:00 110 127 571:45 607:43
5 Tirupati 634 8750 158:55 437:48 47 191 219:33 494:54
6 Kadapa 1004 8607 232:57 430:35 71 572 460:21 2270:38
7 Anantapur 767 6698 210:42 335:28 82 489 579:27 2470:46
8 Kurnool 911 6926 194:12 346:28 72 155 304:45 770:47
SPDCL 6629 71108 1581:39 3557:40 830 2637 4045:58 9200:47
For FY 2019-2020 (upto Sep,2019)
1 Vijayawada 135 2264 116:35 156:05 54 345 604:40 703:41
2 Guntur 166 5320 123:02 232:15 46 252 915:57 720:21
3 Ongole 157 3422 114:24 194:17 35 138 454:03 503:17
4 Nellore 108 1688 49:52 135:21 23 89 282:14 213:38
5 Tirupati 103 3495 84:21 272:13 11 121 129:15 140:44
6 Kadapa 180 6462 137:27 289:12 23 244 789:30 1154:05
7 Anantapur 124 8799 109:55 351:04 28 213 540:16 1596:54
8 Kurnool 184 6313 180:45 278:15 29 64 390:51 406:43
SPDCL 1157 37763 916:25 1908:43 249 1466 4106:49 5439:24

APSPDCL Page 58
Number and Duration of supply interruptions on 33KV and 11KV networks RURAL
For FY 2018-19
S.No Circle No of interruptions Duration in hours No of Breakdowns Duration in Hours
33KV 11KV 33KV 11KV 33KV 11KV 33KV 11KV
1 Vijayawada 1347 11520 384:49 720:12 399 1298 1189:22 2627:58
2 Guntur 1789 13104 394:55 819:15 260 499 1486:17 1379:51
3 Ongole 1639 23904 344:41 1494:21 173 252 871:39 794:38
4 Nellore 1379 24120 333:09 1506:08 203 237 1061:49 1128:38
5 Tirupati 1178 42552 295:07 2568:14 86 354 407:44 919:06
6 Kadapa 1864 27252 432:39 1701:14 133 1063 854:56 4216:55
7 Anantapur 1425 25524 391:18 1593:21 153 907 1076:08 4588:34
8 Kurnool 1692 20664 360:40 1290:19 135 287 565:58 1431:28
SPDCL 12312 188640 2937:21 11783:04 1542 4897 7513:57 17087:10
For FY 2019-2020 (upto Sep,2019)
1 Vijayawada 710 6336 127:44 383:09 190 642 1122:58 1306:50
2 Guntur 876 9529 134:49 1172:02 166 469 1701:03 1337:47
3 Ongole 827 7155 125:21 519:13 125 257 843:14 934:40
4 Nellore 566 8956 113:39 326:20 83 164 524:08 396:44
5 Tirupati 541 7979 92:26 188:47 40 224 240:03 261:21
6 Kadapa 948 11839 150:37 214:57 82 453 1466:13 2143:17
7 Anantapur 653 17005 120:26 838:30 99 396 1003:21 2965:41
8 Kurnool 968 17839 198:02 1177:41 105 118 725:53 755:20
SPDCL 6090 86638 1063:08 4820:43 889 2723 7626:56 10101:46
8.1.7 Frequency at various levels of interface over the period.
Month Average Max. Min.
Hz. Hz. Date Hz. Date
Apr.18 49.97 50.25 17.04.18 49.62 29.04.18
May.18 49.95 50.25 10.05.18 49.57 01.05.18
Jun.18 49.98 50.25 01.06.18 49.60 08.06.18
July.18 49.98 50.25 10.07.18 49.62 15.07.18
Aug.18 49.98 50.25 01.08.18 49.62 19.08.19
Sep.18 49.97 50.25 15.09.18 49.57 02.09.18
Oct.18 49.97 50.25 15.10.18 49.69 02.10.18
Nov.18 49.97 50.25 29.11.18 49.70 06.11.18
Dec.18 49.99 50.25 21.12.18 49.67 26.12.18
Jan.19 50.01 50.28 03.01.19 49.58 20.01.19
Feb.19 50.00 50.27 21.02.19 49.68 10.02.19
Mar.19 49.99 50.30 09.03.19 49.64 15.03.19
Average 2018-19 49.98
Apr.19 50.00 50.29 02.04.19 49.65 15.04.19
May.19 50.00 50.33 09.05.19 49.65 24.05.19
Jun.19 50.00 50.31 05.06.19 49.63 28.06.19
Jul.19 49.98 50.22 10.07.19 49.80 25.07.19
Aug.19 50.00 50.32 15.08.19 49.55 02.08.19
Sep.19 50.01 50.27 05.09.19 49.62 09.09.19
Average 2019-20 50.00

APSPDCL Page 59
8.1.8 Pending applications and connections released to different categories of consumers
Category wise pending applications as on November’ 2019
8.1.9 Arrears of consumers over Rs.50, 000 pending for over six months and details of bad debts
written off
Defaulters list of individual consumers (circle wise) whose arrears are more than Rs.50,000/- as
on 30-09-2019 is displayed in APSPDCL website (www.apspdcl.in)
8.1.10 Court cases involving the Licensee
Details of Cases pertains to Thermal / Coal based pending before Various Courts as on 14.06.2019

APSPDCL Page 60
Details of cases pertains to Gas Division in various legal forums.

APSPDCL Page 61
Details of Cases pending pertains to NCE in Gas Division before Various Courts as on 14.06.2019

APSPDCL Page 62
Details of Wind Cases pending before Various Courts as on 14.06.2019

APSPDCL Page 63

APSPDCL Page 64

APSPDCL Page 65

APSPDCL Page 66

APSPDCL Page 67

APSPDCL Page 68
8.1.11 Number of cases filed in respect of pilferage of power in various categories giving
comparative picture with respect to FY 2018-19 & 2019-20 (upto Sep’19)

APSPDCL Page 69
9 Cost of Service for FY 2020-21
The Licensee has been filing Cost of Service (CoS) in embedded cost methodology. As per the
directions, the study of various CoS methods was done and report submitted of Hon’ble commission. In
Tariff Order FY 2019-20, the Hon’ble commission having examined the report on various methods of
CoS, finally decided to adopt the same methodology as in FY2018-19 for arriving at the Cost of Service
for FY2019-20 also, considering the under lying complex exercise involved in data collection etc., in
arriving CoS though the Embedded cost methodology is robust. Thus, considering the inferences
drawn by Commission, the Licensee is adopting Hon’ble Commission’s approach in arriving CoS for FY
2020-21.
The Licensee estimated gross energy sales (MU) at different voltage levels as shown the
Table below:
The Licensee has, thereafter, grossed up the energy sales (MU) at the specific voltage
levels with T & D losses (%) as estimated in this filings for FY 2020-21 for arriving at the power
purchase requirement (MU). The summary of the voltage wise losses considered are shown in
the Table below:

APSPDCL Page 70
Applying the above losses, the power purchase requirement / energy input (MU) for the
respective voltage levels is arrived at as shown in the Table below:
The ARR estimated for the year has been apportioned in proportion to the energy input
at different voltage levels. The ARR cost allocated at different voltage levels is as shown in the
Table below:
Based on the energy sales and the apportioned ARR at the respective voltage levels,
the Licensee has calculated Cost of Service per unit for different voltage levels for FY 2020-21
as shown in the Table below:
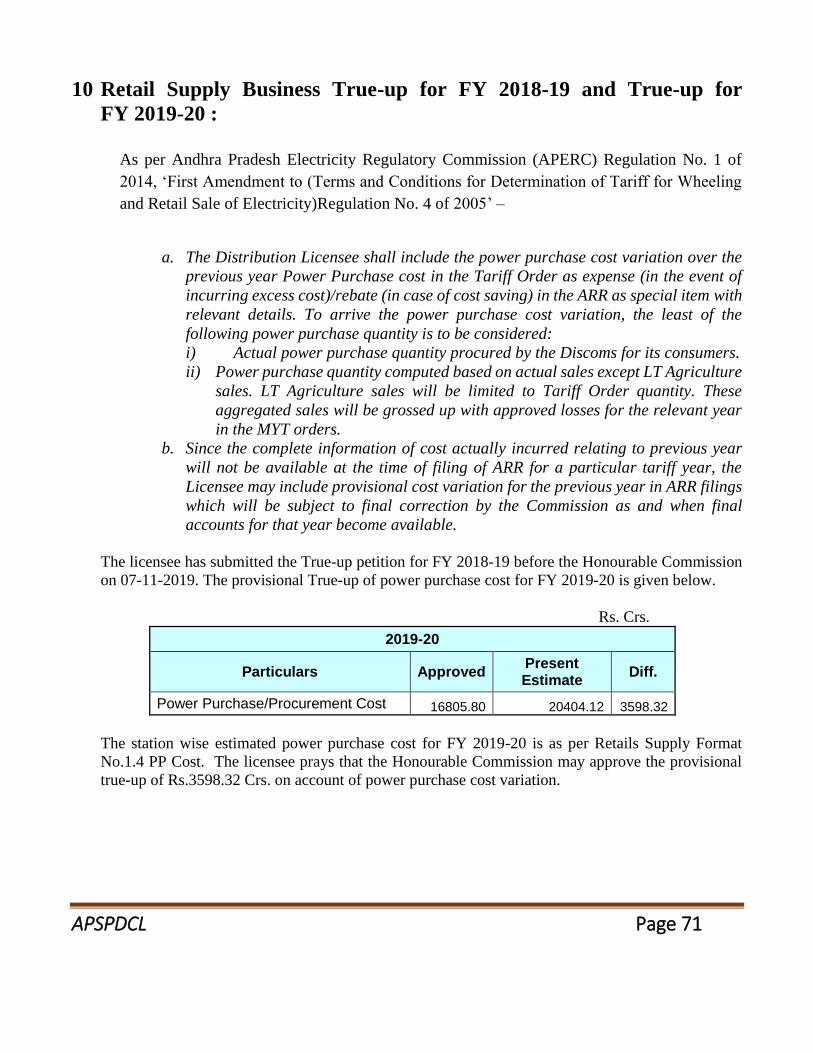
APSPDCL Page 71
10 Retail Supply Business True-up for FY 2018-19 and True-up for
FY 2019-20 :
As per Andhra Pradesh Electricity Regulatory Commission (APERC) Regulation No. 1 of
2014, ‘First Amendment to (Terms and Conditions for Determination of Tariff for Wheeling
and Retail Sale of Electricity)Regulation No. 4 of 2005’ –
a. The Distribution Licensee shall include the power purchase cost variation over the
previous year Power Purchase cost in the Tariff Order as expense (in the event of
incurring excess cost)/rebate (in case of cost saving) in the ARR as special item with
relevant details. To arrive the power purchase cost variation, the least of the
following power purchase quantity is to be considered:
i) Actual power purchase quantity procured by the Discoms for its consumers.
ii) Power purchase quantity computed based on actual sales except LT Agriculture
sales. LT Agriculture sales will be limited to Tariff Order quantity. These
aggregated sales will be grossed up with approved losses for the relevant year
in the MYT orders.
b. Since the complete information of cost actually incurred relating to previous year
will not be available at the time of filing of ARR for a particular tariff year, the
Licensee may include provisional cost variation for the previous year in ARR filings
which will be subject to final correction by the Commission as and when final
accounts for that year become available.
The licensee has submitted the True-up petition for FY 2018-19 before the Honourable Commission
on 07-11-2019. The provisional True-up of power purchase cost for FY 2019-20 is given below.
Rs. Crs.
2019-20
Particulars Approved Present Estimate
Diff.
Power Purchase/Procurement Cost 16805.80 20404.12 3598.32
The station wise estimated power purchase cost for FY 2019-20 is as per Retails Supply Format
No.1.4 PP Cost. The licensee prays that the Honourable Commission may approve the provisional
true-up of Rs.3598.32 Crs. on account of power purchase cost variation.

APSPDCL Page 72
11 Tariff Proposals for FY 2020-21
Licensees proposes to continue with same 5 Main categories in LT as well as 5 Main categories in HT
as approved by Hon’ble Commission during FY 2019-20.
The following changes have been proposed:
LT-I Domestic : The licensee proposed to dispense with the categorization of consumers based on
consumption during the previous financial year and levy energy charges based on consumption of
current month.
Sub-Category Slab Energy Charges (Rs./Kwh)
A: <= 75 Units per month 0-50 1.45
51-75 2.60
B: > 75-225 Units Per month
0-50 2.60
51-100 2.60
101-200 3.60
201-225 6.90
C: >225 Units Per month
0-50 2.65
51-100 3.35
101-200 5.40
201-300 7.10
301-400 7.95
401-500 8.50
>500 9.95
HT-I- Gated communities, Bungalows & Villas: The licensee proposes to include gated
communities, villas & Bungalows in this category with energy charges of Rs 7.00 per unit
Commercial & Non-Domestic:
LT –II C-General: The existing subcategories ie II-C–Advertising Hoardings and II-D- Function
Halls/Auditoriums, Startup power and II-E, E.V.Charging Stations are clubbed into single Group IIC-
General, duly adopting tariffs of Advertising Hoardings of energy charges of Rs. 12.25 per unit with
Fixed Charges of Rs.100 per KW. Additionally, the railway stations and Bus stands which are
previously in LT -IIA Commercial are also oriented into LT-IIC-General now.
HT –II Commercial
HT-II A-General: The licensee proposes to club existing HT Cat II-B-Public Infrastructure and
Tourism and HT-II-E-EV Charging Stations with HT-II-A-Commercial renaming as HT-II-A-General
Category 11KV 33KV 132KV and above
Existing Tariff
HT-II(A) Commercial 7.65 6.95 6.70
TOD peak (6PM to 10PM) 8.65 7.95 7.70
HT-II(B) Public Infrastructure & Tourism 7.30 6.65 6.35

APSPDCL Page 73
Category 11KV 33KV 132KV and above
TOD peak (6PM to 10PM) 8.30 7.65 7.35
HT-II(E) EV Charging Stations 5.00 5.00 5.00
Proposed Tariff
HT-II A-General: 7.65 7.50 7.35
TOD peak (6PM to 10PM) 8.65 8.50 8.35
HT-II B-Occasional: The licensee proposes to merge the existing HT Cat II-D-Function
Halls/Auditoriums, Startup power & HT-II-F- Green power into single group as HT-II-B-Occasional.
Category 11KV 33KV 132KV and above
Existing Tariff
HT-II-D Function Halls/Auditoriums, Startup power 11.75 11.75 11.75
HT-II-F-Green Power 11.30 11.30 11.30
Proposed Tariff
H-II B-Occasional: 12.25 12.25 12.25
III Industry:
HT-III-A : Industry (General) : The licensee proposes to withdraw the load factor incentive scheme
for FY 2020-21
HT-III-C-Energy Intensive Industries: The licensee proposes to incorporate a condition to Energy
Intensive industries as follows:
“If the monthly consumption of Energy Intensive Industries falls below 85% Load utilization factor
during any billing month, the consumer shall be billed in HT-III-A-Industry General Category in the
billing month”.
IV-Institutional:
LT – Institutional-A-Utilities: The Licensee proposes that the existing subcategories of Panchayats,
Municipalities & Municipal Corporations of IV-A- Street lighting & IV-B-CPWS/PWS schemes and
LT-IV-C-NTR Sujala Pathakam are clubbed into one subcategory and renaming as LT-IV –
Institutional-A-Utilities and the regrouping as Panchayats and Urban Local bodies as follows:
Category
Fixed Charges per month
(Rs./HP or KW)
Energy Charges
(Rs per Unit)
Existing Tariff
LT-IV- A- Street lighting
(i) Panchayats 75 5.95
(ii) Municipalities 75 6.50
(iii) Municipal Corporations 75 7.05
IV- B- CPWS/PWS Schemes
(i) Panchayats 75 4.85
(ii) Municipalities 75 5.95
(iii) Municipal Corporations 75 6.50
IV- C- NTR Sujala Pathakam 10 4.00
Proposed Tariff

APSPDCL Page 74
LT-IV-A-Utilities
Panchayats 75 7.00
Urban Local bodies 75 7.00
LT – Institutional-B-General: The Licensee proposes renaming of the existing subcategories of IV-
D-General purpose as LT-IV –Institutional-B-General with tariffs as given below:
Category Fixed Charges per month
(Rs./HP or KW)
Energy Charges
(Rs per Unit)
Existing Tariff
LT-IV- D- General purpose 30 7.25
Proposed Tariff
LT-IV-B-General 75 7.00
IV-HT-Institutional:
HT IV-A-Utilities: The Licensee proposes the existing subcategory HT-IV-B-CPWS/PWS Schemes
to be renamed as HT IV-A-Utilities and proposes an increase energy charges 11KV – Rs.7.95, 33KV
- Rs.7.25 & 132KV - Rs.7.00 per unit with fixed charges Rs.475 / KVA / Month.
HT IV-B-General : The Licensee proposes to introduce new category with Govt. offices, Govt.
educational institutions / Hostels, Govt. Hospitals & Charitable institutions with tariff as given below:
Category Fixed Charges per month
(Rs./HP or KW)
Energy Charges
(Rs per Unit)
Existing Tariff (II (A) Commercial)
11 KV 475 7.65
33 KV 475 6.95
132 KV 475 6.70
Proposed Tariff (IV-B General)
11 KV 475 7.95
33 KV 475 7.25
132 KV 475 7.00
HT IV-D-Railway traction: The Licensee proposes to increase in energy charges from Rs. 3.75 to
6.50 per unit.
V-Agriculture and related:
LT-V-Agriculture and related: LT-V-A-Corporate Farmers: The licensee proposes a flat rate Tariff
of Rs. 200/HP/Month in place of energy charges of Rs. 2.50 per unit. LT-V-D-Hatcheries, Feed
Mixing Plants and Floriculture: The licensee proposes an increase in Energy Charges from Rs. 3.85 to
4.50 per unit
HT-V-Agriculture and related:
HT-V-B-Hatcheries, Feed Mixing Plants and Floriculture: The licensee proposes an increase in
Energy Charges from Rs. 4.85 to 5.25 per unit
HT-V-C-Lift Irrigations: The licensee proposes an increase in Energy Charges from Rs. 5.80 to 7.15
per unit
RECSOs: The activity of RESCOs is similar to that of the Licensee in implementing similar tariffs as
approved by the Hon’ble commission wherein RESCOs draw power from Licensee as determined by

APSPDCL Page 75
the Commission. In order to encourage a competitive spirit on par with DISCOM, the Licensee
proposes to increase Resco Tariff Rs 3.50 per unit each for both RESCOs.
Revenue Impact: The overall revenue gain due to above Tariff Proposals is Rs.843.07 Crores (including
Non-Tariff Income) as shown in the Table below:
The estimated revenue gap with proposed tariffs for the licensee for FY 2020-21 is as follows:

APSPDCL Page 76
Tariff Schedule for FY 2020-21
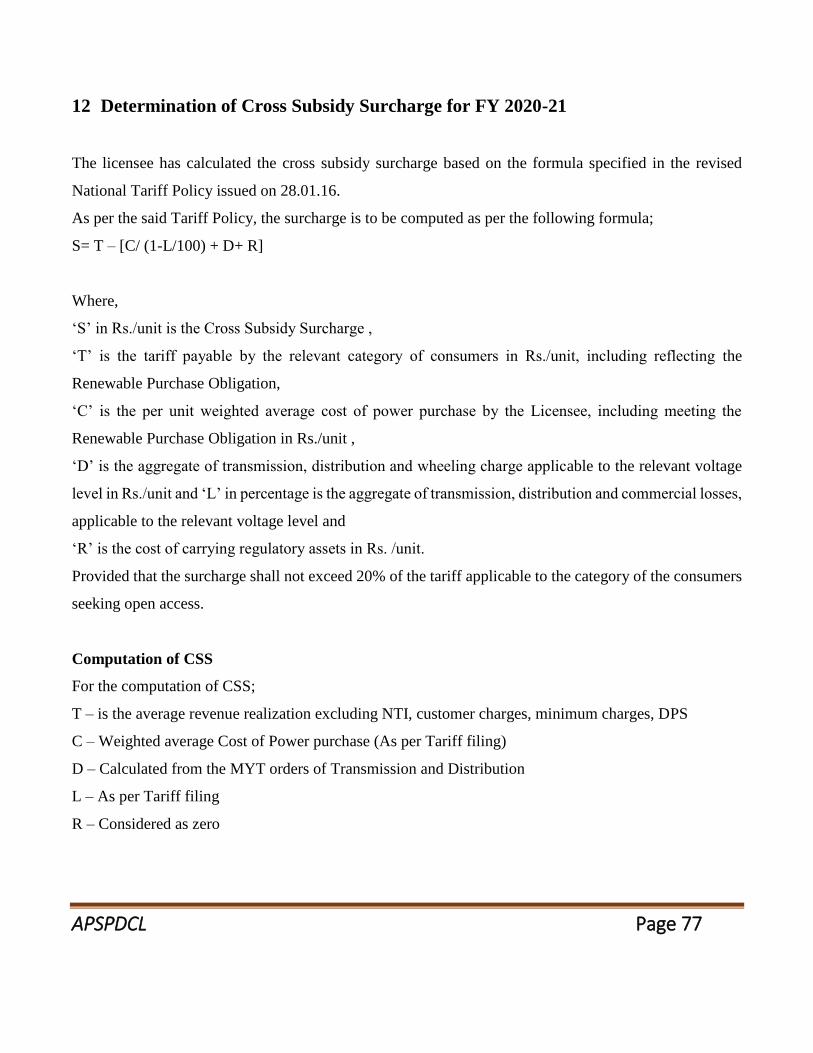
APSPDCL Page 77
12 Determination of Cross Subsidy Surcharge for FY 2020-21
The licensee has calculated the cross subsidy surcharge based on the formula specified in the revised
National Tariff Policy issued on 28.01.16.
As per the said Tariff Policy, the surcharge is to be computed as per the following formula;
S= T – [C/ (1-L/100) + D+ R]
Where,
‘S’ in Rs./unit is the Cross Subsidy Surcharge ,
‘T’ is the tariff payable by the relevant category of consumers in Rs./unit, including reflecting the
Renewable Purchase Obligation,
‘C’ is the per unit weighted average cost of power purchase by the Licensee, including meeting the
Renewable Purchase Obligation in Rs./unit ,
‘D’ is the aggregate of transmission, distribution and wheeling charge applicable to the relevant voltage
level in Rs./unit and ‘L’ in percentage is the aggregate of transmission, distribution and commercial losses,
applicable to the relevant voltage level and
‘R’ is the cost of carrying regulatory assets in Rs. /unit.
Provided that the surcharge shall not exceed 20% of the tariff applicable to the category of the consumers
seeking open access.
Computation of CSS
For the computation of CSS;
T – is the average revenue realization excluding NTI, customer charges, minimum charges, DPS
C – Weighted average Cost of Power purchase (As per Tariff filing)
D – Calculated from the MYT orders of Transmission and Distribution
L – As per Tariff filing
R – Considered as zero
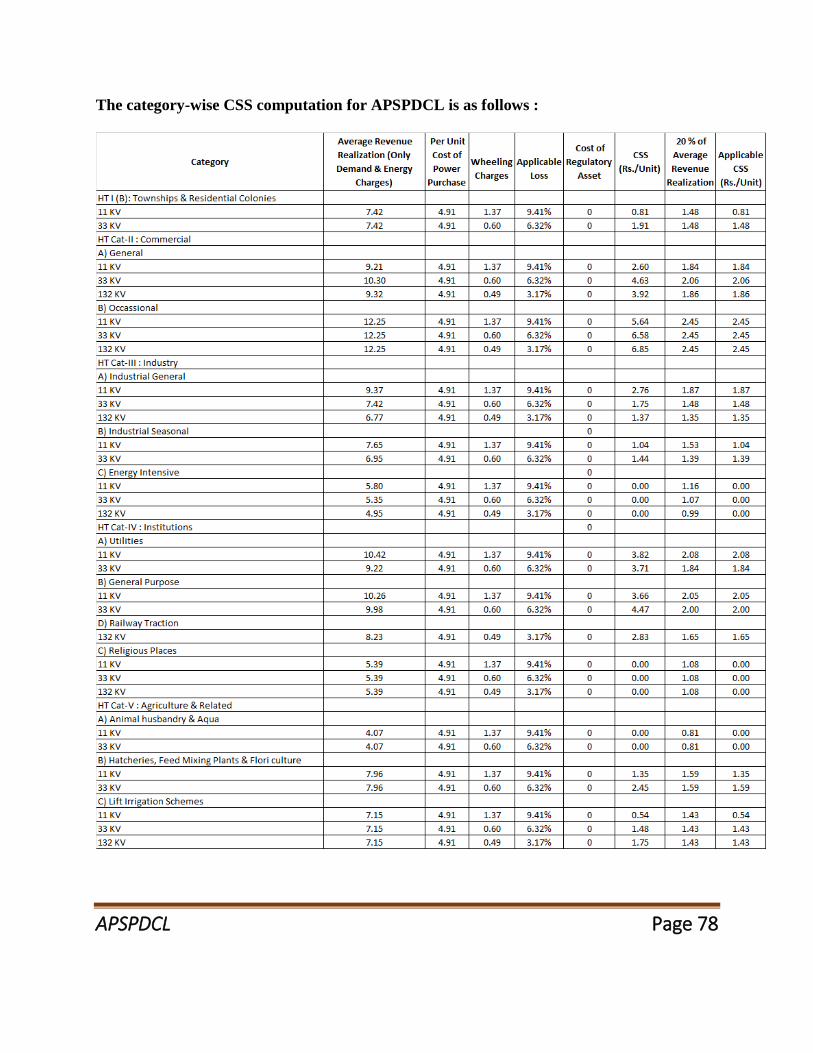
APSPDCL Page 78
The category-wise CSS computation for APSPDCL is as follows :

APSPDCL Page 79
13 Additional Surcharge
The Licensee filed for Additional Surcharge of Rs. 0.95 per unit in petition for ARR of FY 2018-19.
The Hon’ble Commission disallowed it with following comments:
“the Licensees have not been able to demonstrate the above conclusively, as the parameters for grant
of additional surcharge prescribed by section 42(4) read with clause 8.5.4 of the National Tariff
Policy, 2016 are not satisfactorily established to exist to sustain such a claim. Therefore, the
Commission is not rendering any decision on the eligibility or otherwise of the licensees to collect
such additional surcharge from a consumer or any class of consumers for FY2018-19 in the present
consideration. However, the licensees are at liberty to move an appropriate application for the
purpose in accordance with law sufficiently supported by the relevant data and material which may
be considered on merits.”
Hence, the Licensee requests the Hon’ble Commission to determine the methodology for
determination of the Additional Surcharge. Based on the methodology, the Licensee shall file the
Additional Surcharge in supplementary filings.

APSPDCL Page 80
14 Prayer
Based on the information available, the Applicant has made sincere efforts to comply with the
Regulation of the Honourable Commission and discharge its obligations to the best of its abilities.
However, should any further material information become available in the near future, the
Applicant shall file such additional information and consequently amend/ revise the application.
In the aforesaid facts and circumstances, the Applicant requests that this Honourable Commission
may be pleased to:
a. Take the accompanying ARR, Tariff Proposal, provisional true-up for FY 2019-20 and
Cross Subsidy Surcharge Application of APSPDCL on record and treat it as complete;
b. Grant suitable opportunity to APSPDCL within a reasonable time frame to file additional
material information that may be subsequently available;
c. Consider and approve APSPDCL’s ARR and Tariff application including all requested
regulatory treatments in the filing;
d. Pass such order as the Honourable Commission may deem fit and proper in the facts and
circumstances of the case.

Company Name APSPDCL
Filing Date (dd/mm/yy) 02-12-19
Multi Year Tariff Period FY 2020-24
Year FY2020-21
Commission' s Regulations Reg-4/2005
Business type Retail Supply of Electricity
1 Aggregate Revenue Requirement for Retail Supply Business Form 1
2 Transmission Cost Form 1.1
3 SLDC Charges Form 1.2
4 Distribution Cost Form 1.3
5 Power Purchase and Procurement Cost (For Regulated Business) Form 1.4
6 NCE Generation (Base Year) Form 1.4 (i)
7 NCE Generation (Year 1) Form 1.4(ii)
8 NCE Generation (Year 2) Form 1.4(iii)
9 NCE Generation (Year 3) Form 1.4(iv)
10 NCE Generation (Year 4) Form 1.4(v)
11 NCE Generation (Year 5) Form 1.4(vi)
12 Power Purchase and Procurement Cost (For Non-regulated Business) Form 1.4a
13 Sales to Licensees Form 1.4b
14 Discom-Discom Purchases Form 1.4c
15 Interest on Consumer Security Deposits Form 1.5
16 Supply Margin Form 1.6
17 Other Costs Form 1.7
18 New consumer categories Form A
19 Cost of Service Form 2
20 Sales Forecast Form 3
21 Power Purchase Requirement Form 4
22 Energy Losses (Distribution System) Form 4a
23 Transmission Losses Form 4b
24 Energy Availability Form 4.1
25 Energy Dispatch Form 4.2
26 Revenue from Current Tariffs Form 5
27 Incentives at current Tariffs Form 5a
28 Consumers switching to competition Form 5b
29 Consumers served under Open Access as per Section 42 and Section 49 of E Act Form 5c
30 Non-tariff Income at current charges Form 6
31 Total Revenue at Current tariff and Charges Form 7
32 Revenue Deficit/Surplus at current tariff and charges Form 8
33 Revenue Deficit/Surplus and Proposed Adjustments Form 9
34 Revenue from Proposed Tariffs Form 10
35 Incentives at Proposed Tariffs Form 10a
36 Non-tariff Income at proposed charges Form 11
37 Total Revenue at Proposed Tariff and Charges Form 12
38 Cost and Revenue Form 13
S. No. Title Form No.
Notes:
1) 2018-19 Base Year for the 4th control period FY20-24 is FY2018-19
2019-20 Year 1 is the First Year of the control Period, FY2019-20
2020-21 Year 2 is the Second Year of the control Period, FY2020-21
2021-22 Year 3 is the Third Year of the control Period, FY2021-22
2022-23 Year 4 is the Fourth Year of the control Period, FY2022-23
2023-24 Year 5 is the Five Year of the control Period, FY2023 -24
2) Filings 2020-21, Licensees shall provide
Full projections for FY2020-21
Estimates for FY2019-20 based on actuals for first half of the year
3)
4)
5) New Categories
The Licensees shall add the proposed categories in Form A, the new categories would be then updated automatically in other forms
The new categories are segregated voltage-wise in Form A
6)
7) Phasing of Open Access as per Regulation 2 of 2005 of APERC
Eligibility Criteria for Open Access
Phase Eligibility criteria Commencement date
1 Consumers availing of power from NCE developers
irrespective of the quantum of contracted capacity
September, 2005
2 Contracted capcity being greater than 5 MW September, 2005
3 Contracted capacity being greater than 2 MW September, 2006
4 Contracted capacity being greater than 1 MW April, 2008
8) Terminology for Open Access Status
1 Load not eligible for Open Access
2 Load Eligible for Open Access
3 Availed (within area of supply)
4 Availed ( Outside Area of supply)
Load within the area of supply of the licensees and satisfying the eligibility criteria to avail open
access as per Commission's Regulation during the period under consideration whether availing
power through Open Access or not.
Load outside the area of supply of the Licensee but availing power through Open Access from the
Licensee under consideration.
Load within the area of supply of the Licensee and availing power through Open Access whether
from the same Licensee or any other supplier.
Regulated Business: The retail supply of electricity to (i) consumers within the area of supply of the licensee and not eligible to
avail Open Access as per Commission’s Regulations (ii) consumers within the area of supply of the licensee and eligible to
avail Open Access but not exercising their option of availing open access.
Non-regulated Business: The retail supply of electricity to consumers availing supply under open access from the licensee
either forming the part of area of supply of the licensee or outside the area of supply of the licensee.
Direct Non-Tariff Income: Non-Tariff income which is directly identifiable with a consumer category.
Apportioned Non-Tariff Income: Non-Tariff income which is not directly identifiable with a consumer category. It shall be
appropriately apportioned across various consumer categories.
Modification/addition of Slabs/sub categories for LT consumers should be carried out in Form 7 for Current Tariff and Form 12
for Proposed Tariff.See notes in the relevant form for details
Load within the area of supply of the licensees not satisfying the eligibility criteria to avail open
access as per Commission's Regulation during the time period under consideration.

Form 1
Amount (in Rs. crores)
2019-20 2020-21 2021-22 2022-23 2023-24
1 Transmission Cost Form 1.1 1,041.31 1,304.58 0.00 0.00 0.00
2 SLDC Cost Form 1.2 20.13 21.56 0.00 0.00 0.00
3 Distribution Cost Form 1.3 3,622.00 4,178.00 0.00 0.00 0.00
4 PGCIL Expenses 969.44 1,166.31
5 ULDC Charges 2.85 2.94
6 Network and SLDC Cost (1+2+3+4+5) 5,655.73 6,673.39 0.00 0.00 0.00
7 Power Purchase / Procurement Cost Form 1.4 20,404.12 21,430.91 0.00 0.00 0.00
8 Interest on Consumer Security Deposits Form 1.5 167.20 184.56 0.00 0.00 0.00
9 Supply Margin in Retail Supply Business Form 1.6 28.31 77.59 0.00 0.00 0.00
10 Other Costs, if any Form 1.7 130.87 182.07 0.00 0.00 0.00
11 Supply Cost (7+8+9+10) 20,730.50 21,875.12 0.00 0.00 0.00
12 Aggregate Revenue Requirement (6+11) 26,386.23 28,548.51 0.00 0.00 0.00
Note:
1 The Revenue Requirement Items are cost borne for supply of power to consumers within the area of supply of the Licensees and not availing supply under Open Access.
2 Transmission Cost refers to the transmission cost borne by the licensee to serve the consumers within the area of the supply and not availing supply under Open Access
3 SLDC cost refers to the SLDC Charges paid to serve the consumers within the area of the supply and not availing supply under Open Access
4 Distribution Cost refers to the distribution cost borne by the licensee to serve the consumers within the area of the supply and not availing supply under Open Access
5 PGCIL and ULDC Expenses to be submitted in this form.
Aggregate Revenue Requirement for Retail Supply Business
Revenue Requirement Item (Rs. Crs.) Details link
For Control Period

Form 1.1
2018-19
MWTariff
(Rs./kW/month)
Cost
(Rs. Crs.)MW
Tariff
(Rs./kW/month)
Cost
(Rs. Crs.)MW
Tariff
(Rs./kW/month)
Cost
(Rs. Crs.)MW
Tariff
(Rs./kW/month)
Cost
(Rs. Crs.)
APTRANSCO 5354.46 94.44 606.81 2862.19 94.44 324.37
Truedown 0.00 0.00 -155.95 0.00 0.00 0.00
Total 5354.46 450.86 2862.19 324.37 0.00 0.00 0.00 0.00
MWTariff
(Rs./kW/month)
Cost
(Rs. Crs.)MW
Tariff
(Rs./kW/month)
Cost
(Rs. Crs.)MW
Tariff
(Rs./kW/month)
Cost
(Rs. Crs.)MW
Tariff
(Rs./kW/month)
Cost
(Rs. Crs.)
APTRANSCO
Total 0.00 0.00 0.00 0.00 0.00 0.00 0.00 0.00
Total Long term + Short term
Contracts
((A) + (B)) 5354.46 450.86 2862.19 324.37 0.00 0.00 0.00 0.00
2019-20 Year 1
MWTariff
(Rs./kW/month)
Cost
(Rs. Crs.)MW
Tariff
(Rs./kW/month)
Cost
(Rs. Crs.)MW
Tariff
(Rs./kW/month)
Cost
(Rs. Crs.)MW
Tariff
(Rs./kW/month)
Cost
(Rs. Crs.)
APTRANSCO 4269.70 119.28 611.15 3005.30 119.28 430.17
Total 4269.70 611.15 3005.30 430.17 0.00 0.00 0.00 0.00
MWTariff
(Rs./kW/month)
Cost
(Rs. Crs.)MW
Tariff
(Rs./kW/month)
Cost
(Rs. Crs.)MW
Tariff
(Rs./kW/month)
Cost
(Rs. Crs.)MW
Tariff
(Rs./kW/month)
Cost
(Rs. Crs.)
APTRANSCO
Total 0.00 0.00 0.00 0.00 0.00 0.00 0.00 0.00
Total Long term + Short term
Contracts
((A) + (B)) 4269.70 611.15 3005.30 430.17 0.00 0.00 0.00 0.00
Load Eligible for Open Access
Load Eligible for Open Access Name of Transmission service
provider
Open Access
Load not eligible for Open Access
(B) Short Term and Temporary Contracts
Load Eligible for Open AccessLoad not eligible for Open Access
(A) Long Term and Firm Contracts
Name of Transmission service
provider
Open Access
(B) Short Term and Temporary Contracts
Name of Transmission service
provider
Availed (within area of supply) Availed ( Outside Area of supply)
Availed (within area of supply) Availed ( Outside Area of supply)Load not eligible for Open Access
Open Access
Transmission Cost
Name of Transmission service
provider
(A) Long Term and Firm Contracts
Load not eligible for Open Access
Open Access
Load Eligible for Open Access Availed (within area of supply)
Availed ( Outside Area of supply)
Availed ( Outside Area of supply)
Availed (within area of supply)

Form 1.1 Transmission Cost
2020-21 Year 2
MWTariff
(Rs./kW/month)
Cost
(Rs. Crs.)MW
Tariff
(Rs./kW/month)
Cost
(Rs. Crs.)MW
Tariff
(Rs./kW/month)
Cost
(Rs. Crs.)MW
Tariff
(Rs./kW/month)
Cost
(Rs. Crs.)
APTRANSCO 4672.44 138.88 778.69 3155.56 138.88 525.89
Total 4672.44 778.69 3155.56 525.89 0.00 0.00 0.00 0.00
MWTariff
(Rs./kW/month)
Cost
(Rs. Crs.)MW
Tariff
(Rs./kW/month)
Cost
(Rs. Crs.)MW
Tariff
(Rs./kW/month)
Cost
(Rs. Crs.)MW
Tariff
(Rs./kW/month)
Cost
(Rs. Crs.)
APTRANSCO
Total 0.00 0.00 0.00 0.00 0.00 0.00 0.00 0.00
Total Long term + Short term
Contracts
((A) + (B)) 4672.44 778.69 3155.56 525.89 0.00 0.00 0.00 0.00
(A) Long Term and Firm Contracts
Name of Transmission service
provider Load Eligible for Open Access Availed (within area of supply)
Open Access
Load not eligible for Open Access
(B) Short Term and Temporary Contracts
Name of Transmission service
provider Load not eligible for Open Access
Availed ( Outside Area of supply)
Availed (within area of supply)
Open Access
Availed ( Outside Area of supply)Load Eligible for Open Access

Form 1.2 SLDC Charges
2018-19
MWTariff
(Rs./MW/year)
Cost
(Rs. Crs.)MW
Tariff
(Rs./MW/ month)
Cost
(Rs. Crs.)
Load not eligible for Open Access 5354.46 4214.27 2.26 5354.46 2342.73 15.05 17.31
Open Access
Load Eligible for Open Access 2862.19 4214.27 1.21 2862.19 2342.73 8.05 9.25
Availed (within area of supply) 0.00 0.00 0.00
Availed ( Outside Area of supply) 0.00 0.00 0.00
2019-20
MWTariff
(Rs./MW/year)
Cost
(Rs. Crs.)MW
Tariff
(Rs./MW/ month)
Cost
(Rs. Crs.)
Load not eligible for Open Access 4269.70 1917.48 0.82 4269.70 2146.34 11.00 11.82
Open Access
Load Eligible for Open Access 3005.30 1917.48 0.58 3005.30 2146.34 7.74 8.32
Availed (within area of supply) 0.00 0.00 0.00
Availed ( Outside Area of supply) 0.00 0.00 0.00
2020-21
MWTariff
(Rs./MW/year)
Cost
(Rs. Crs.)MW
Tariff
(Rs./MW/ month)
Cost
(Rs. Crs.)
Load not eligible for Open Access 4672.44 2838.01 1.33 4672.44 2058.18 11.54 12.87
Open Access
Load Eligible for Open Access 3155.56 2838.01 0.90 3155.56 2058.18 7.79 8.69
Availed (within area of supply) 0.00 0.00 0.00
Availed ( Outside Area of supply) 0.00 0.00 0.00
Charges
Total Cost
(Rs. Crs.)
Total Cost
(Rs. Crs.)
Annual Fee
Annual Fee Charges
Annual Fee Charges
Total Cost
(Rs. Crs.)

Form 1.3
2018-19
MW
Tariff
(Rs./kW/m
onth)
Cost
(Rs. Crs.)MW
Tariff
(Rs./kW/mont
h)
Cost
(Rs. Crs.)MW
Tariff
(Rs./kW/mo
nth)
Cost
(Rs. Crs.)MW
Tariff
(Rs./kW/m
onth)
Cost
(Rs. Crs.)
SPDCL ( 33 KV) 1024.68 15.17 19.63
SPDCL ( 11 KV) 87.40 240.68 26.57
SPDCL LT
Total ( Non Eligible OA
Cost) 7104.58 0.00 2873.46
Total 7104.58 2873.46 1112.08 46.21 0.00 0.00 0.00 0.00
MW
Tariff
(Rs./kW/m
onth)
Cost
(Rs. Crs.)MW
Tariff
(Rs./kW/mont
h)
Cost
(Rs. Crs.)MW
Tariff
(Rs./kW/mo
nth)
Cost
(Rs. Crs.)MW
Tariff
(Rs./kW/m
onth)
Cost
(Rs. Crs.)
Total 0.00 0.00 0.00 0.00 0.00 0.00 0.00 0.00
Total Long term + Short
term Contracts
((A) + (B)) 7104.58 2873.46 1112.08 46.21 0.00 0.00 0.00 0.00
(B) Short Term and Temporary Contracts
Name of Distribution
service provider
Load not eligible for Open Access
Distribution Cost
(A) Long Term and Firm Contracts
Name of Distribution
service provider
Load not eligible for Open Access
Open Access
Open Access
Availed ( Outside Area of supply)Load Eligible for Open Access Availed (within area of supply)
Load Eligible for Open Access Availed (within area of supply) Availed ( Outside Area of supply)

2019-20
MW
Tariff
(Rs./kW/m
onth)
Cost
(Rs. Crs.)MW
Tariff
(Rs./kW/mont
h)
Cost
(Rs. Crs.)MW
Tariff
(Rs./kW/mo
nth)
Cost
(Rs. Crs.)MW
Tariff
(Rs./kW/m
onth)
Cost
(Rs. Crs.)
SPDCL ( 33 KV) 1075.91 61.16 83.12
SPDCL ( 11 KV) 91.77 432.38 50.12
SPDCL LT
Total ( Non Eligible OA
Cost) 6107.32 3488.76
Total 6107.32 3488.76 1167.68 133.24 0.00 0.00 0.00 0.00
MW
Tariff
(Rs./kW/m
onth)
Cost
(Rs. Crs.)MW
Tariff
(Rs./kW/mont
h)
Cost
(Rs. Crs.)MW
Tariff
(Rs./kW/mo
nth)
Cost
(Rs. Crs.)MW
Tariff
(Rs./kW/m
onth)
Cost
(Rs. Crs.)
Total 0.00 0.00 0.00 0.00 0.00 0.00 0.00 0.00
Total Long term + Short
term Contracts
((A) + (B)) 6107.32 3488.76 1167.68 133.24 0.00 0.00 0.00 0.00
Availed (within area of supply) Availed ( Outside Area of supply)
(A) Long Term and Firm Contracts
Load not eligible for Open Access
(B) Short Term and Temporary Contracts
Name of Distribution
service provider
Availed (within area of supply)
Name of Distribution
service provider
Load not eligible for Open Access
Open Access
Load Eligible for Open Access
Availed ( Outside Area of supply)Load Eligible for Open Access
Open Access

2020-21
MW
Tariff
(Rs./kW/
month)
Cost
(Rs. Crs.)MW
Tariff (Rs./kW/
month)
Cost
(Rs. Crs.)MW
Tariff
(Rs./kW/
month)
Cost
(Rs. Crs.)MW
Tariff
(Rs./kW/m
onth)
Cost
(Rs. Crs.)
SPDCL ( 33 KV) 1129.71 64.11 91.48
SPDCL ( 11 KV) 96.36 447.58 54.48
SPDCL LT
Total ( Non Eligible OA
Cost) 6601.93 4032.04
Total 6601.93 4032.04 1226.07 145.96 0.00 0.00 0.00 0.00
MW
Tariff
(Rs./kW/m
onth)
Cost
(Rs. Crs.)MW
Tariff
(Rs./kW/mont
h)
Cost
(Rs. Crs.)MW
Tariff
(Rs./kW/mo
nth)
Cost
(Rs. Crs.)MW
Tariff
(Rs./kW/m
onth)
Cost
(Rs. Crs.)
Total 0.00 0.00 0.00 0.00 0.00 0.00 0.00 0.00
Total Long term + Short
term Contracts
((A) + (B)) 6601.93 4032.04 1226.07 145.96 0.00 0.00 0.00 0.00
Open Access
(B) Short Term and Temporary Contracts
Open Access
(A) Long Term and Firm Contracts
Load Eligible for Open Access Availed (within area of supply)
Load not eligible for Open Access
Load not eligible for Open Access Availed ( Outside Area of supply) Name of Distribution
service provider
Availed ( Outside Area of supply) Name of Distribution
service provider
Availed (within area of supply)Load Eligible for Open Access

Form 1.4 Power Purchase and Procurement Cost (For Regulated Business#)
2019-20
Generating Station D Link
Plant Type
Must Run = 1
Others = 2
Plant
Capacity
DISCOM's
share
DISCOM's
share
(MW) (%) (MW) Net Availability Dispatch Fixed Variable Incentive Inc. Tax Others Total Fixed Inctv Inc. Tax Others Variable Total
AP GENCO Thermal
Dr.NTTPS Unit I,II,III (AP) 4821.59 482.37 1452.22 0.00 0.00 0.00 1934.58
Dr.NTTPS IV (AP) 2089.68 221.47 579.69 0.00 0.00 0.00 801.17 1.06 0.00 0.00 0.00 2.77 3.83
RTPP Stage-I (AP) 1517.32 183.38 542.79 0.00 0.00 0.00 726.17 1.21 0.00 0.00 0.00 3.58 4.79
RTPP Stage-II (AP) 1710.17 177.44 602.06 0.00 0.00 0.00 779.50 1.04 0.00 0.00 0.00 3.52 4.56
RTPP Stage-III (AP) 717.72 172.37 255.82 0.00 0.00 0.00 428.18 2.40 0.00 0.00 0.00 3.56 5.97
RTPP Stage-IV (AP) 1692.65 347.04 596.83 0.00 0.00 0.00 943.87 2.05 0.00 0.00 0.00 3.53 5.58
Damodaram Sanjeevaiah Thermal
Power Unit-I & II 5508.77 928.68 1508.04 0.00 0.00 0.00 2436.72 1.69 0.00 0.00 0.00 2.74 4.42
Interest on Pension Bonds for FY 2018-19 0.00 575.22 0.00 0.00 0.00 0.00 575.22 0.00 0.00 0.00 0.00 0.00 0.00
AP GENCO TB Dam 75.80 15.19 0.00 0.00 0.00 0.00 15.19 2.00 0.00 0.00 0.00 0.00 2.00
TOTAL HYDRO 2024.84 375.34 0.00 0.00 0.00 0.00 375.34 1.85 0.00 0.00 0.00 0.00 1.85
TOTAL GENCO 20082.75 3463.31 5785.38 0.00 0.00 0.00 9248.70
0.00 0.00 0.00 0.00 0.00 0.00 0.00 0.00 0.00 0.00 0.00 0.00 0.00
Central Generating Stations 0.00 0.00 0.00 0.00 0.00 0.00 0.00 0.00 0.00 0.00 0.00 0.00 0.00
NTPC (SR)-Ramagundam Stage1&2 1300.84 94.00 355.08 1.25 0.00 0.14 450.48 0.72 0.01 0.00 0.00 2.73 3.46
NTPC (SR)-Ramagundam Stage 3 360.22 25.61 96.81 1.05 0.00 0.07 123.54 0.71 0.03 0.00 0.00 2.69 3.43
Total NTPC(SR) 1661.06 119.61 451.89 2.30 0.00 0.21 574.01 0.72 0.01 0.00 0.00 2.72 3.46
0.00 0.00 0.00 0.00 0.00 0.00 0.00 0.00 0.00 0.00 0.00 0.00 0.00
Talcher Stage 2 741.60 54.93 164.31 1.10 0.00 1.52 221.86 0.74 0.01 0.00 0.02 2.22 2.99
Total NTPC(ER) 741.60 54.93 164.31 1.10 0.00 1.52 221.86 0.74 0.01 0.00 0.02 2.22 2.99
0.00 0.00 0.00 0.00 0.00 0.00 0.00 0.00 0.00 0.00 0.00 0.00 0.00
Total NTPC 2402.66 174.54 616.20 3.40 0.00 1.74 795.87 0.73 0.01 0.00 0.01 2.56 3.31
NLC TS-II 0.00 0.00 0.00 0.00 0.00 0.00 0.00 0.00 0.00 0.00 0.00 0.00 0.00
0.00 0.00 0.00 0.00 0.00 0.00 0.00 0.00 0.00 0.00 0.00 0.00 0.00
CGS - New & Bundled Power Coal 0.00 0.00 0.00 0.00 0.00 0.00 0.00 0.00 0.00 0.00 0.00 0.00 0.00
NTECL Vallur Thermal Power Plant 353.17 87.72 134.58 0.15 0.00 2.00 224.45 2.48 0.00 0.00 0.06 3.81 6.36
NLC Tamilnadu Power Ltd St.1 (NTPL) 488.98 88.14 154.80 1.73 0.00 2.34 247.02
NTPC KUDGI Thermal (New Project) 886.97 202.54 346.88 1.70 0.00 0.05 551.17
NVVNL Bundled Power JNNSM Ph-1-COAL 154.95 0.00 71.29 0.00 0.00 0.00 71.29
NVVNL Bundled power NSM-II Ph-2 2389.18 0.00 1005.53 0.00 0.00 0.00 1005.53
New Neyveli Thermal power
station (NNTPS) 81.22 16.41 18.76 0.00 0.00 0.00 35.17 2.02 0.00 0.00 0.00 2.31 4.33
NTPC WR & NR Stations (Only for Sep'19) 209.64 61.91 75.87 0.00 0.00 0.00 137.79 2.95 0.00 0.00 0.00 3.62 6.57
TOTAL CGS 10922.58 1048.47 3715.29 15.87 0.00 14.48 4794.11 0.96 0.01 0.00 0.01 3.40 4.39
0.00 0.00 0.00 0.00 0.00 0.00 0.00
APGPCL 0.00 0.00 0.00 0.00 0.00 0.00 0.00
APGPCL I - Allocated capacity 15.22 2.11 4.78 0.00 0.00 0.00 6.89 1.39 0.00 0.00 0.00 3.14 4.53
APGPCL II - Allocated capacity 50.40 2.98 15.84 0.00 0.00 0.00 18.82 0.59 0.00 0.00 0.00 3.14 3.74
Total APGPCL 65.61 5.10 20.62 0.00 0.00 0.00 25.71 0.78 0.00 0.00 0.00 3.14 3.92
IPPs-Gas 0.00 0.00 0.00 0.00 0.00 0.00 0.00 0.00 0.00 0.00 0.00 0.00 0.00
Godavari Gas Power Plant 534.01 21.96 150.88 0.00 0.00 0.00 172.84 0.41 0.00 0.00 0.00 2.83 3.24
Spectrum Power 481.06 44.26 114.97 0.00 0.00 0.00 159.23 0.92 0.00 0.00 0.00 2.39 3.31
LANCO Kondapalli 187.23 17.97 43.63 0.00 0.00 0.00 61.60
TOTAL IPPS 1202.30 84.19 309.48 0.00 0.00 0.00 393.67 0.70 0.00 0.00 0.00 2.57 3.27
NCE 0.00 0.00 0.00 0.00 0.00 0.00 0.00
NCE - Bio Mass 35.36 0.00 22.42 0.00 0.00 0.00 22.42
NCE - Industrial Waste 5.92 0.00 3.69 0.00 0.00 0.00 3.69 0.00 0.00 0.00 0.00 6.23 6.23
NCE - Wind Power 3533.51 0.00 889.13 0.00 0.00 0.00 889.13 0.00 0.00 0.00 0.00 2.52 2.52
NCE - Mini Hydel 17.40 0.00 4.54 0.00 0.00 0.00 4.54 0.00 0.00 0.00 0.00 2.61 2.61
NCE - SOLAR Power (Without Bundled) 678.69 0.00 203.40 0.00 0.00 0.00 203.40
NVVNL Bumdled Power - SOALR 13.80 0.00 14.85 0.00 0.00 0.00 14.85
NTPC Ramagundam Solar Power 0.00 0.00 0.00 0.00 0.00 0.00 0.00 0.00 0.00 0.00 0.00 0.00 0.00
NTPC NPKunta Ultra Mega Solar PVP 119.82 0.00 69.69 0.00 0.00 0.00 69.69 0.00 0.00 0.00 0.00 5.82 5.82
NTPC NVVNL NSM Phase-II, Batch-II, Trench-I Bundled Power -SOLAR POWER (*) 774.67 0.00 348.27 0.00 0.00 0.00 348.27 0.00 0.00 0.00 0.00 4.50 4.50
TOTAL NCE 5179.18 0.00 1555.99 0.00 0.00 0.00 1555.99 0.00 0.00 0.00 0.00 3.00 3.00
0.00 0.00 0.00 0.00 0.00 0.00 0.00
IPPs-Others 0.00 0.00 0.00 0.00 0.00 0.00 0.00
Srivathsa (Exclusive EPDCL) 6.49 0.31 1.91 0.00 0.00 0.00 2.22 0.48 0.00 0.00 0.00 2.94 3.42
Thermal Powertech Corporation India 1248.86 190.99 279.01 2.47 0.00 0.00 472.47 1.53 0.02 0.00 0.00 2.23 3.78
Hinduja National Power Corp Ltd (HNPCL) 931.99 0.00 356.02 0.00 0.00 0.00 356.02 0.00 0.00 0.00 0.00 3.82 3.82
KSK Mahanadi Power Co., Ltd., 1377.69 216.48 381.70 0.00 0.00 0.00 598.18
TOTAL OTHERS 3565.03 407.77 1018.64 2.47 0.00 0.00 1428.89
0.00 0.00 0.00 0.00 0.00 0.00 0.00 0.00 0.00 0.00 0.00 0.00 0.00
Unit Cost
(Rs. / kWh)Availability and Dispatch (MU) Cost (Rs. Crs.)

Generating Station D Link
Plant Type
Must Run = 1
Others = 2
Plant
Capacity
DISCOM's
share
DISCOM's
share
(MW) (%) (MW) Net Availability Dispatch Fixed Variable Incentive Inc. Tax Others Total Fixed Inctv Inc. Tax Others Variable Total
Unit Cost
(Rs. / kWh)Availability and Dispatch (MU) Cost (Rs. Crs.)
MARKET 0.00 0.00 0.00 0.00 0.00 0.00 0.00 0.00 0.00 0.00 0.00 0.00 0.00
Short Term Purchases (Trading/IEX/PXIL) 820.45 0.00 373.16 0.00 0.00 0.00 373.16 0.00 0.00 0.00 0.00 4.55 4.55
Short Term Purchases (Swap Receipt) 271.84 0.00 62.92 0.00 0.00 0.00 62.92 0.00 0.00 0.00 0.00 2.31 2.31
Short Term Purchases (Swap Return) -2714.94 0.00 1296.83 0.00 0.00 0.00 1296.83 0.00 0.00 0.00 0.00 -4.78 -4.78
Market sources 3518.09 0.00 1701.43 0.00 0.00 0.00 1701.43 0.00 0.00 0.00 0.00 4.84 4.84
POSOCO Deviation Charges(UI Charges) 0.00 0.00 25.18 0.00 0.00 0.00 25.18 0.00 0.00 0.00 0.00 0.00 0.00
D<>D Transactions -1570.21 -502.47 -502.47 0.00 0.00 0.00 0.00 3.20 3.20
TOTAL MARKET 325.23 0.00 2957.05 0.00 0.00 0.00 2957.05
0.00 0.00 0.00 0.00 0.00 0.00
TOTAL (From All Sources) 41342.68 5008.84 15362.45 18.35 0.00 14.48 20404.12 1.21 0.00 0.00 0.00 3.72 4.94

Generating Station D Link
Plant Type
Must Run = 1
Others = 2
Plant
Capacity
DISCOM's
share
DISCOM's
share
(MW) (%) (MW) Net Availability Dispatch Fixed Variable Incentive Inc. Tax Others Total Fixed Inctv Inc. Tax Others Variable Total
Unit Cost
(Rs. / kWh)Availability and Dispatch (MU) Cost (Rs. Crs.)
2020-21
Generating Station D Link
Plant Type
Must Run = 1
Others = 2
Plant
Capacity
DISCOM's
share
DISCOM's
share
(MW) (%) (MW) Net Availability Dispatch Fixed Variable Incentive Income Tax Others Total Fixed Incentives Income Tax Others Variable Total
APGENCO-THERMAL
VTPS I 420 100% 420 1760.55 1760.55 148.87 646.12 0.00 0.00 0.00 794.99 0.85 0.00 0.00 0.00 3.67 4.52
VTPS II 420 100% 420 1760.67 1760.67 148.87 646.16 0.00 0.00 0.00 795.04 0.85 0.00 0.00 0.00 3.67 4.52
VTPS III 420 100% 420 1760.66 1760.66 148.87 646.16 0.00 0.00 0.00 795.03 0.85 0.00 0.00 0.00 3.67 4.52
VTPS IV 500 100% 500 2130.44 2130.44 185.96 737.13 0.00 0.00 0.00 923.10 0.87 0.00 0.00 0.00 3.46 4.33
VTPS V 800 100% 800 1467.45 1467.45 400.17 462.25 0.00 0.00 0.00 862.42 2.73 0.00 0.00 0.00 3.15 5.88
RTPP Stage-I 420 100% 420 1760.55 1604.62 170.52 681.96 0.00 0.00 0.00 852.49 1.06 0.00 0.00 0.00 4.25 5.31
RTPP Stage-II 420 100% 420 1760.55 1486.48 166.12 631.75 0.00 0.00 0.00 797.87 1.12 0.00 0.00 0.00 4.25 5.37
RTPP Stage-III 210 100% 210 880.56 729.53 122.89 310.05 0.00 0.00 0.00 432.94 1.68 0.00 0.00 0.00 4.25 5.93
RTPP Stage-IV 600 100% 600 2597.99 2597.99 724.17 1002.82 0.00 0.00 0.00 1726.99 2.79 0.00 0.00 0.00 3.86 6.65
Damodaram Sanjeevaiah Thermal power plant - I 1600 100% 1600 6894.77 6894.771316.03 2164.96 0.00 0.00 0.00
3480.99 1.91 0.00 0.00 0.00 3.14 5.05
Damodaram Sanjeevaiah Thermal power
plant - II800 100% 800 1621.30 1621.30
309.67 509.09 0.00 0.00 0.00818.76 1.91 0.00 0.00 0.00 3.14 5.05
Interest on pension bonds (Over and above
schedule)0.00 0.00 0.00 0.00 0.00
605.700.00 0.00 0.00 0.00 605.70 0.25 0.00 0.00 0.00 0.00 0.25
TOTAL THERMAL 6610.00 6610.00 24395.48 23814.45 4447.85 8438.46 0.00 0.00 0.00 12886.31 1.87 0.00 0.00 0.00 3.54 5.41
APGENCO-HYDEL
MACHKUND PH AP Share 84 100% 84 193.54 193.54 23.01 0.00 0.00 0.00 0.00 23.01 1.19 0.00 0.00 0.00 0.00 1.19
TUNGBHADRA PH AP Share 57.6 100% 57.6 80.75 80.75 15.78 0.00 0.00 0.00 0.00 15.78 1.95 0.00 0.00 0.00 0.00 1.95
Upper Sileru Power House (AP) 240 100% 240 281.45 281.45 50.32 0.00 0.00 0.00 0.00 50.32 1.79 0.00 0.00 0.00 0.00 1.79
Lower Sileru Power House (AP) 460 100% 460 694.34 694.34 96.44 0.00 0.00 0.00 0.00 96.44 1.39 0.00 0.00 0.00 0.00 1.39
DONKARAYI (AP) 25 100% 25 63.11 63.11 5.24 0.00 0.00 0.00 0.00 5.24 0.83 0.00 0.00 0.00 0.00 0.83
Srisailam Right Bank Power House (AP) 770 100% 770 610.95 610.95 144.45 0.00 0.00 0.00 0.00 144.45 2.36 0.00 0.00 0.00 0.00 2.36
Nagarjunasagar Right Bank Power House
(AP) 90.00 100% 90.00 74.15 74.15 16.56 0.00 0.00 0.00 0.00 16.56 2.23 0.00 0.00 0.00 0.00 2.23
Penna Ahobilam (AP) 20.00 100% 20.00 3.70 3.70 8.59 0.00 0.00 0.00 0.00 8.59 23.21 0.00 0.00 0.00 0.00 23.21
MINI HYDEL(Chettipeta)-AP 1.00 100% 1.00 1.72 1.72 1.12 0.00 0.00 0.00 0.00 1.12 6.48 0.00 0.00 0.00 0.00 6.48
Nagarjunasagar Tail Pond Dam Power
House 50 100% 50 58.57 58.57 33.81 0.00 0.00 0.00 0.00 33.81 5.77 0.00 0.00 0.00 0.00 5.77
TOTAL HYDRO 1797.60 1797.60 2062.28 2062.28 395.31 0.00 0.00 0.00 0.00 395.31 1.92 0.00 0.00 0.00 0.00 1.92
TOTAL APGENCO 7607.60 8407.60 26457.76 25876.72 4843.16 8438.46 0.00 0.00 0.00 13281.62 1.87 0.00 0.00 0.00 3.26 5.13
CGS
NTPC - Simhadri
NTPC Simhadri Stage I 1000 46.11% 461.1 2346.76 2346.76 203.41 872.99 10.99 0.00 39.34 1126.73 0.87 0.05 0.00 0.17 3.72 4.80
NTPC Simhadri Stage II 1000 18.91% 189.1 941.04 941.04 134.45 345.36 3.44 0.00 11.93 495.18 1.43 0.04 0.00 0.13 3.67 5.26
Total NTPC- Simhadri 3287.80 3287.80 337.86 1218.36 14.43 0.00 51.27 1621.91 1.03 0.04 0.00 0.16 3.71 4.93
NTPC (SR)
NTPC (SR)-Ramagundam Stage1&2 2100 13.36% 280.56 1327.56 1327.56 93.81 404.91 2.55 0.00 0.17 501.44 0.71 0.02 0.00 0.00 3.05 3.78
NTPC (SR)-Ramagundam Stage 3 500 14.13% 70.67 362.18 362.18 25.31 109.02 1.90 0.00 0.04 136.26 0.70 0.05 0.00 0.00 3.01 3.76
Total NTPC(SR) 1689.74 1689.74 119.12 513.92 4.45 0.00 0.21 637.70 0.70 0.03 0.00 0.00 3.04 3.77
NTPC (ER)
Talcher Stage 2 2000 8.64% 172.84 792.77 792.77 57.52 208.50 0.00 0.00 0.15 266.17 0.73 0.00 0.00 0.00 2.63 3.36
Total NTPC(ER) 792.77 792.77 57.52 208.50 0.00 0.00 0.15 266.17 0.73 0.00 0.00 0.00 2.63 3.36
Unit Cost
(Rs. / kWh)Availability and Dispatch (MU) Cost (Rs. Crs.)

Generating Station D Link
Plant Type
Must Run = 1
Others = 2
Plant
Capacity
DISCOM's
share
DISCOM's
share
(MW) (%) (MW) Net Availability Dispatch Fixed Variable Incentive Inc. Tax Others Total Fixed Inctv Inc. Tax Others Variable Total
Unit Cost
(Rs. / kWh)Availability and Dispatch (MU) Cost (Rs. Crs.)
Total NTPC 5770.31 5770.31 514.49 1940.78 18.88 0.00 51.63 2525.78 0.89 0.03 0.00 0.00 3.36 4.38
NLC TS-II
Stage-I 630 7.88% 49.63 177.95 177.95 15.52 51.78 0.00 0.00 0.13 67.44 0.87 0.00 0.00 0.00 2.91 3.79
Stage-II 840 10.62% 89.22 327.17 327.17 28.93 95.21 0.00 0.00 0.20 124.33 0.88 0.00 0.00 0.00 2.91 3.80
Total NLC 505.12 505.12 44.45 146.99 0.00 0.00 0.33 191.77 0.88 0.00 0.00 0.00 2.91 3.80
NPC
NPC-MAPS 440 4.18% 18.4 27.74 27.74 0.00 8.53 0.00 0.00 0.26 8.79 0.00 0.00 0.00 0.09 3.07 3.17
NPC-Kaiga unit I&ii 440 12.79% 56.25 258.37 258.37 0.00 103.60 0.00 0.00 0.26 103.87 0.00 0.00 0.00 0.01 4.01 4.02
NPC-Kaiga unit III&IV 440 13.63% 59.95 263.30 263.30 0.00 105.58 0.00 0.00 0.26 105.85 0.00 0.00 0.00 0.01 4.01 4.02
Total NPC 549.40 549.40 0.00 217.71 0.00 0.00 0.79 218.50 0.00 0.00 0.00 0.00 3.96 3.98
CGS - New
Bundled power under JVNSM 39.27 100% 39.27 183.84 183.84 18.93 72.25 0.00 0.00 0.00 91.18 1.03 0.00 0.00 0.00 3.93 4.96
Vallur Thermal Power Plant 1500 6.75% 101.24 445.35 405.46 82.47 168.27 0.00 0.00 4.00 254.73 2.03 0.00 0.00 0.10 4.15 6.28
Kudigi 2400 10.81% 259.32 1156.30 968.76 218.38 424.32 0.00 0.00 0.11 642.81 2.25 0.00 0.00 0.00 4.38 6.64
Tuticorin 1000 12.72% 127.19 593.66 593.66 91.14 206.59 0.35 0.00 4.93 303.01 1.54 0.01 0.00 0.08 3.48 5.10
JNNSM Phase-II 625 100% 625 2915.46 2848.75 437.32 865.89 0.00 0.00 0.00 1303.21 1.54 0.00 0.00 0.00 3.04 4.57
NNTPS 1000 5.25% 52.46 241.99 241.99 51.06 61.47 0.00 0.00 0.00 112.53 2.11 0.00 0.00 0.00 2.54 4.65
TOTAL CGS 15954.27 2652.20 12361.43 12067.28 1458.24 4104.26 19.23 0.00 61.78 5643.51 1.21 0.02 0.00 0.05 3.40 4.68
IPPS-COAL
KSK Mahanadi (MT) 400.00 100% 400.00 1957.70 1957.70 293.64 579.48 0.00 0.00 0.00 873.12 1.50 0.00 0.00 0.00 2.96 4.46
Thermal Power Tech 500.00 46.16% 231.00 1259.74 1259.74 182.10 306.12 3.27 0.00 0.00 491.48 1.45 0.03 0.00 0.00 2.43 3.90
TOTAL IPPS-COAL 3217.44 3217.44 475.73 885.60 3.27 0.00 0.00 1364.60 1.48 0.01 0.00 0.00 2.75 4.24
IPPS-GAS
GGPP 216.00 100% 216.00 522.87 522.87 21.44 148.49 0.00 0.00 0.00 169.93 0.41 0.00 0.00 0.00 2.84 3.25
Spectrum Power Generation Limited 205.19 100% 205.19 779.29 779.29 71.69 186.25 0.00 0.00 0.00 257.94 0.92 0.00 0.00 0.00 2.39 3.31
APGPCL-I 100 9.331% 9.33 13.62 13.62 1.13 3.88 0.00 0.00 0.00 5.02 0.83 0.00 0.00 0.00 2.85 3.68
APGPCL-II 172 14.51% 24.96 43.42 43.42 10.93 12.37 0.00 0.00 0.00 23.31 2.52 0.00 0.00 0.00 2.85 5.37
TOTAL IPPS-GAS 216.00 455.48 1359.20 1359.20 105.20 351.00 0.00 0.00 0.00 456.20 0.77 0.00 0.00 0.00 2.58 3.36
Other RE (ORE) 248.70 248.70 133.80 133.80
Market 3253.21 0.00 1402.13 0.00 0.00 0.00 1402.13 0.00 0.00 0.00 0.00 4.31 4.31
D<>D Transcations -2403.84 -850.96 -850.96 3.54
TOTAL (From All Sources) 43644.53 43618.72 6882.33 14464.30 22.49 0.00 61.78 21430.91 1.58 0.01 0.00 0.01 3.32 4.91

Form 1.4a
2019-20
Generating Station D Link
Plant Type
Must Run = 1
Others = 2
Plant
Capacity
DISCOM's
share
DISCOM's
share
(MW) (%) (MW) Net Availability Dispatch Fixed Variable Incentive Income Tax Others Total Fixed Incentives Income Tax Others Variable Total
APGENCO
Thermal
VTPS I 0.00 0.00 0.00 0.00 0.00 0.00 0.00
VTPS II 0.00 0.00 0.00 0.00 0.00 0.00 0.00
VTPS III 0.00 0.00 0.00 0.00 0.00 0.00 0.00
VTPS IV 0.00 0.00 0.00 0.00 0.00 0.00 0.00
RTPP I 0.00 0.00 0.00 0.00 0.00 0.00 0.00
RTPP Stage-II 0.00 0.00 0.00 0.00 0.00 0.00 0.00
RTPP Stage-III 0.00 0.00 0.00 0.00 0.00 0.00 0.00
KTPS A 0.00 0.00 0.00 0.00 0.00 0.00 0.00
KTPS B 0.00 0.00 0.00 0.00 0.00 0.00 0.00
KTPS C 0.00 0.00 0.00 0.00 0.00 0.00 0.00
KTPS D 0.00 0.00 0.00 0.00 0.00 0.00 0.00
KTPS Stage VI 0.00 0.00 0.00 0.00 0.00 0.00 0.00
RTS B 0.00 0.00 0.00 0.00 0.00 0.00 0.00
NTS 0.00 0.00 0.00 0.00 0.00 0.00 0.00
Kakatiya Thermal Power Plant Stage I 0.00 0.00 0.00 0.00 0.00 0.00 0.00
Kakatiya Thermal Power Plant Stage II 0.00 0.00 0.00 0.00 0.00 0.00 0.00
0.00 0.00 0.00 0.00 0.00 0.00 0.00
0.00 0.00 0.00 0.00 0.00 0.00 0.00
TOTAL THERMAL 0.00 0.00 0.00 0.00 0.00 0.00 0.00 0.00 0.00 0.00 0.00 0.00 0.00 0.00 0.00 0.00
MACHKUND PH AP Share 0.00 0.00 0.00 0.00 0.00 0.00 0.00
TUNGBHADRA PH AP Share 0.00 0.00 0.00 0.00 0.00 0.00 0.00
USL 0.00 0.00 0.00 0.00 0.00 0.00 0.00
LSR 0.00 0.00 0.00 0.00 0.00 0.00 0.00
DONKARAYI 0.00 0.00 0.00 0.00 0.00 0.00 0.00
SSLM 0.00 0.00 0.00 0.00 0.00 0.00 0.00
NSPH 0.00 0.00 0.00 0.00 0.00 0.00 0.00
NSRCPH 0.00 0.00 0.00 0.00 0.00 0.00 0.00
NSLCPH 0.00 0.00 0.00 0.00 0.00 0.00 0.00
POCHAMPAD PH 0.00 0.00 0.00 0.00 0.00 0.00 0.00
NIZAMSAGAR PH 0.00 0.00 0.00 0.00 0.00 0.00 0.00
PABM 0.00 0.00 0.00 0.00 0.00 0.00 0.00
MINI HYDRO&OTHERS 0.00 0.00 0.00 0.00 0.00 0.00 0.00
SINGUR 0.00 0.00 0.00 0.00 0.00 0.00 0.00
SSLM LCPH 0.00 0.00 0.00 0.00 0.00 0.00 0.00
Nagarjunasagar Tail Pond Dam Power House 0.00 0.00 0.00 0.00 0.00 0.00 0.00
Priyadarshini Jurala Hydro Electric Project- AP Share 0.00 0.00 0.00 0.00 0.00 0.00 0.00
Lower Jurala Hydro Electric Project 0.00 0.00 0.00 0.00 0.00 0.00 0.00
0.00 0.00 0.00 0.00 0.00 0.00 0.00
0.00 0.00 0.00 0.00 0.00 0.00 0.00
TOTAL HYDRO 0.00 0.00 0.00 0.00 0.00 0.00 0.00 0.00 0.00 0.00 0.00 0.00 0.00 0.00 0.00 0.00
TOTAL APGENCO 0.00 0.00 0.00 0.00 0.00 0.00 0.00 0.00 0.00 0.00 0.00 0.00 0.00 0.00 0.00 0.00
Central Generating Stations
NTPC
NTPC (SR)
NTPC (SR) 0.00 0.00 0.00 0.00 0.00 0.00 0.00
NTPC (SR) Stage III 0.00 0.00 0.00 0.00 0.00 0.00 0.00
Total NTPC(SR) 0.00 0.00 0.00 0.00 0.00 0.00 0.00 0.00 0.00 0.00 0.00 0.00 0.00 0.00 0.00 0.00
NTPC (ER)
Farakka 0.00 0.00 0.00 0.00 0.00 0.00 0.00
Availability and Dispatch (MU) Cost (Rs. Crs.)
Power Purchase and Procurement Cost (For Non-regulated Business#)
Unit Cost
(Rs. / kWh)

Generating Station D Link
Plant Type
Must Run = 1
Others = 2
Plant
Capacity
DISCOM's
share
DISCOM's
share
(MW) (%) (MW) Net Availability Dispatch Fixed Variable Incentive Income Tax Others Total Fixed Incentives Income Tax Others Variable Total
Availability and Dispatch (MU) Cost (Rs. Crs.)Unit Cost
(Rs. / kWh)
Kahalgaon 0.00 0.00 0.00 0.00 0.00 0.00 0.00
Talcher - Stage 1 0.00 0.00 0.00 0.00 0.00 0.00 0.00
Talcher Stage 2 0.00 0.00 0.00 0.00 0.00 0.00 0.00
Others 0.00 0.00 0.00 0.00 0.00 0.00 0.00
Total NTPC(ER) 0.00 0.00 0.00 0.00 0.00 0.00 0.00 0.00 0.00 0.00 0.00 0.00 0.00 0.00 0.00 0.00
Total NTPC 0.00 0.00 0.00 0.00 0.00 0.00 0.00 0.00 0.00 0.00 0.00 0.00 0.00 0.00 0.00 0.00
NLC TS-II
Stage-I 0.00 0.00 0.00 0.00 0.00 0.00 0.00
Stage-II 0.00 0.00 0.00 0.00 0.00 0.00 0.00
Total NLC 0.00 0.00 0.00 0.00 0.00 0.00 0.00 0.00 0.00 0.00 0.00 0.00 0.00 0.00 0.00 0.00
NPC
NPC-MAPS 0.00 0.00 0.00 0.00 0.00 0.00 0.00
NPC-Kaiga unit I 0.00 0.00 0.00 0.00 0.00 0.00 0.00
NPC-Kaiga unit II 0.00 0.00 0.00 0.00 0.00 0.00 0.00
Total NPC 0.00 0.00 0.00 0.00 0.00 0.00 0.00 0.00 0.00 0.00 0.00 0.00 0.00 0.00 0.00 0.00
NTPC - Simhadri
NTPC Simhadri Stage I 0.00 0.00 0.00 0.00 0.00 0.00 0.00
NTPC Simhadri Stage II 0.00 0.00 0.00 0.00 0.00 0.00 0.00
Total NTPC- Simhadri 0.00 0.00 0.00 0.00 0.00 0.00 0.00 0.00 0.00 0.00 0.00 0.00 0.00 0.00 0.00 0.00
CGS - New
0.00 0.00 0.00 0.00 0.00 0.00 0.00
0.00 0.00 0.00 0.00 0.00 0.00 0.00
0.00 0.00 0.00 0.00 0.00 0.00 0.00
0.00 0.00 0.00 0.00 0.00 0.00 0.00
0.00 0.00 0.00 0.00 0.00 0.00 0.00
TOTAL CGS 0.00 0.00 0.00 0.00 0.00 0.00 0.00 0.00 0.00 0.00 0.00 0.00 0.00 0.00 0.00 0.00
APGPCL
APGPCL I - Allocated capacity 0.00 0.00 0.00 0.00 0.00 0.00 0.00
APGPCL I - Unutilised capacity 0.00 0.00 0.00 0.00 0.00 0.00 0.00
APGPCL II - Allocated capacity 0.00 0.00 0.00 0.00 0.00 0.00 0.00
APGPCL II - Unutilised capacity 0.00 0.00 0.00 0.00 0.00 0.00 0.00
Total APGPCL 0.00 0.00 0.00 0.00 0.00 0.00 0.00 0.00 0.00 0.00 0.00 0.00 0.00 0.00 0.00 0.00
IPPS
GVK 0.00 0.00 0.00 0.00 0.00 0.00 0.00
Spectrum 0.00 0.00 0.00 0.00 0.00 0.00 0.00
Kondapalli (Naphtha) 0.00 0.00 0.00 0.00 0.00 0.00 0.00
Kondapalli (Gas) 0.00 0.00 0.00 0.00 0.00 0.00 0.00
BSES 0.00 0.00 0.00 0.00 0.00 0.00 0.00
GVK Extension 0.00 0.00 0.00 0.00 0.00 0.00 0.00
Vemagiri 0.00 0.00 0.00 0.00 0.00 0.00 0.00
Gautami 0.00 0.00 0.00 0.00 0.00 0.00 0.00
Konaseema 0.00 0.00 0.00 0.00 0.00 0.00 0.00
0.00 0.00 0.00 0.00 0.00 0.00 0.00
TOTAL IPPS 0.00 0.00 0.00 0.00 0.00 0.00 0.00 0.00 0.00 0.00 0.00 0.00 0.00 0.00 0.00 0.00
NCE
NCE - Bio-Mass 0.00 0.00 0.00 0.00 0.00 0.00 0.00
NCE - Bagasse 0.00 0.00 0.00 0.00 0.00 0.00 0.00
NCE - Municipal Waste to Energy 0.00 0.00 0.00 0.00 0.00 0.00 0.00

Generating Station D Link
Plant Type
Must Run = 1
Others = 2
Plant
Capacity
DISCOM's
share
DISCOM's
share
(MW) (%) (MW) Net Availability Dispatch Fixed Variable Incentive Income Tax Others Total Fixed Incentives Income Tax Others Variable Total
Availability and Dispatch (MU) Cost (Rs. Crs.)Unit Cost
(Rs. / kWh)
NCE - Industrial Waste based power project 0.00 0.00 0.00 0.00 0.00 0.00 0.00
NCE - Wind Power 0.00 0.00 0.00 0.00 0.00 0.00 0.00
NCE - Mini Hydel 0.00 0.00 0.00 0.00 0.00 0.00 0.00
NCE - NCL Energy Ltd 0.00 0.00 0.00 0.00 0.00 0.00 0.00
NCE-Others 0.00 0.00 0.00 0.00 0.00 0.00 0.00
TOTAL NCE 0.00 0.00 0.00 0.00 0.00 0.00 0.00 0.00 0.00 0.00 0.00 0.00 0.00 0.00 0.00 0.00
OTHERS
Srivathsa 0.00 0.00 0.00 0.00 0.00 0.00 0.00
LVS 0.00 0.00 0.00 0.00 0.00 0.00 0.00
Vishakapatnam Steel Plant 0.00 0.00 0.00 0.00 0.00 0.00 0.00
NB Ferro Alloys 0.00 0.00 0.00 0.00 0.00 0.00 0.00
0.00 0.00 0.00 0.00 0.00 0.00 0.00
0.00 0.00 0.00 0.00 0.00 0.00 0.00
0.00 0.00 0.00 0.00 0.00 0.00 0.00
TOTAL OTHERS 0.00 0.00 0.00 0.00 0.00 0.00 0.00 0.00 0.00 0.00 0.00 0.00 0.00 0.00 0.00 0.00
MARKET
PTC 0.00 0.00 0.00 0.00 0.00 0.00 0.00
RCL and Short-Term Sources(IG Wells,Kesoram) 0.00 0.00 0.00 0.00 0.00 0.00 0.00
CPDCL 0.00 0.00 0.00 0.00 0.00 0.00 0.00
EPDCL 0.00 0.00 0.00 0.00 0.00 0.00 0.00
NPDCL 0.00 0.00 0.00 0.00 0.00 0.00 0.00
SPDCL 0.00 0.00 0.00 0.00 0.00 0.00 0.00
UI 0.00 0.00 0.00 0.00 0.00 0.00 0.00
Other Short Term Sources 0.00 0.00 0.00 0.00 0.00 0.00 0.00
0.00 0.00 0.00 0.00 0.00 0.00 0.00
TOTAL MARKET 0.00 0.00 0.00 0.00 0.00 0.00 0.00 0.00 0.00 0.00 0.00 0.00 0.00 0.00 0.00 0.00
TOTAL (From All Sources) 0.00 0.00 0.00 0.00 0.00 0.00 0.00 0.00 0.00 0.00 0.00 0.00 0.00 0.00 0.00 0.00

Generating Station D Link
Plant Type
Must Run = 1
Others = 2
Plant
Capacity
DISCOM's
share
DISCOM's
share
(MW) (%) (MW) Net Availability Dispatch Fixed Variable Incentive Income Tax Others Total Fixed Incentives Income Tax Others Variable Total
Availability and Dispatch (MU) Cost (Rs. Crs.)Unit Cost
(Rs. / kWh)
2020-21
Generating Station D Link
Plant Type
Must Run = 1
Others = 2
Plant
Capacity
DISCOM's
share
DISCOM's
share
(MW) (%) (MW) Net Availability Dispatch Fixed Variable Incentive Income Tax Others Total Fixed Incentives Income Tax Others Variable Total
APGENCO
Thermal
VTPS I 0.00 0.00 0.00 0.00 0.00 0.00 0.00
VTPS II 0.00 0.00 0.00 0.00 0.00 0.00 0.00
VTPS III 0.00 0.00 0.00 0.00 0.00 0.00 0.00
VTPS IV 0.00 0.00 0.00 0.00 0.00 0.00 0.00
RTPP I 0.00 0.00 0.00 0.00 0.00 0.00 0.00
RTPP Stage-II 0.00 0.00 0.00 0.00 0.00 0.00 0.00
RTPP Stage-III 0.00 0.00 0.00 0.00 0.00 0.00 0.00
KTPS A 0.00 0.00 0.00 0.00 0.00 0.00 0.00
KTPS B 0.00 0.00 0.00 0.00 0.00 0.00 0.00
KTPS C 0.00 0.00 0.00 0.00 0.00 0.00 0.00
KTPS D 0.00 0.00 0.00 0.00 0.00 0.00 0.00
KTPS Stage VI 0.00 0.00 0.00 0.00 0.00 0.00 0.00
RTS B 0.00 0.00 0.00 0.00 0.00 0.00 0.00
NTS 0.00 0.00 0.00 0.00 0.00 0.00 0.00
Kakatiya Thermal Power Plant Stage I 0.00 0.00 0.00 0.00 0.00 0.00 0.00
Kakatiya Thermal Power Plant Stage II 0.00 0.00 0.00 0.00 0.00 0.00 0.00
0.00 0.00 0.00 0.00 0.00 0.00 0.00
0.00 0.00 0.00 0.00 0.00 0.00 0.00
TOTAL THERMAL 0.00 0.00 0.00 0.00 0.00 0.00 0.00 0.00 0.00 0.00 0.00 0.00 0.00 0.00 0.00 0.00
MACHKUND PH AP Share 0.00 0.00 0.00 0.00 0.00 0.00 0.00
TUNGBHADRA PH AP Share 0.00 0.00 0.00 0.00 0.00 0.00 0.00
USL 0.00 0.00 0.00 0.00 0.00 0.00 0.00
LSR 0.00 0.00 0.00 0.00 0.00 0.00 0.00
DONKARAYI 0.00 0.00 0.00 0.00 0.00 0.00 0.00
SSLM 0.00 0.00 0.00 0.00 0.00 0.00 0.00
NSPH 0.00 0.00 0.00 0.00 0.00 0.00 0.00
NSRCPH 0.00 0.00 0.00 0.00 0.00 0.00 0.00
NSLCPH 0.00 0.00 0.00 0.00 0.00 0.00 0.00
POCHAMPAD PH 0.00 0.00 0.00 0.00 0.00 0.00 0.00
NIZAMSAGAR PH 0.00 0.00 0.00 0.00 0.00 0.00 0.00
PABM 0.00 0.00 0.00 0.00 0.00 0.00 0.00
MINI HYDRO&OTHERS 0.00 0.00 0.00 0.00 0.00 0.00 0.00
SINGUR 0.00 0.00 0.00 0.00 0.00 0.00 0.00
SSLM LCPH 0.00 0.00 0.00 0.00 0.00 0.00 0.00
Nagarjunasagar Tail Pond Dam Power House 0.00 0.00 0.00 0.00 0.00 0.00 0.00
Priyadarshini Jurala Hydro Electric Project- AP Share 0.00 0.00 0.00 0.00 0.00 0.00 0.00
Lower Jurala Hydro Electric Project 0.00 0.00 0.00 0.00 0.00 0.00 0.00
0.00 0.00 0.00 0.00 0.00 0.00 0.00
0.00 0.00 0.00 0.00 0.00 0.00 0.00
TOTAL HYDRO 0.00 0.00 0.00 0.00 0.00 0.00 0.00 0.00 0.00 0.00 0.00 0.00 0.00 0.00 0.00 0.00
TOTAL APGENCO 0.00 0.00 0.00 0.00 0.00 0.00 0.00 0.00 0.00 0.00 0.00 0.00 0.00 0.00 0.00 0.00
Central Generating Stations
NTPC
NTPC (SR)
NTPC (SR) 0.00 0.00 0.00 0.00 0.00 0.00 0.00
NTPC (SR) Stage III 0.00 0.00 0.00 0.00 0.00 0.00 0.00
Total NTPC(SR) 0.00 0.00 0.00 0.00 0.00 0.00 0.00 0.00 0.00 0.00 0.00 0.00 0.00 0.00 0.00 0.00
NTPC (ER)
Farakka 0.00 0.00 0.00 0.00 0.00 0.00 0.00
Kahalgaon 0.00 0.00 0.00 0.00 0.00 0.00 0.00
Talcher - Stage 1 0.00 0.00 0.00 0.00 0.00 0.00 0.00
Unit Cost
(Rs. / kWh)Cost (Rs. Crs.)Availability and Dispatch (MU)

Generating Station D Link
Plant Type
Must Run = 1
Others = 2
Plant
Capacity
DISCOM's
share
DISCOM's
share
(MW) (%) (MW) Net Availability Dispatch Fixed Variable Incentive Income Tax Others Total Fixed Incentives Income Tax Others Variable Total
Availability and Dispatch (MU) Cost (Rs. Crs.)Unit Cost
(Rs. / kWh)
Talcher Stage 2 0.00 0.00 0.00 0.00 0.00 0.00 0.00
Others 0.00 0.00 0.00 0.00 0.00 0.00 0.00
Total NTPC(ER) 0.00 0.00 0.00 0.00 0.00 0.00 0.00 0.00 0.00 0.00 0.00 0.00 0.00 0.00 0.00 0.00
Total NTPC 0.00 0.00 0.00 0.00 0.00 0.00 0.00 0.00 0.00 0.00 0.00 0.00 0.00 0.00 0.00 0.00
NLC TS-II
Stage-I 0.00 0.00 0.00 0.00 0.00 0.00 0.00
Stage-II 0.00 0.00 0.00 0.00 0.00 0.00 0.00
Total NLC 0.00 0.00 0.00 0.00 0.00 0.00 0.00 0.00 0.00 0.00 0.00 0.00 0.00 0.00 0.00 0.00
NPC
NPC-MAPS 0.00 0.00 0.00 0.00 0.00 0.00 0.00
NPC-Kaiga unit I 0.00 0.00 0.00 0.00 0.00 0.00 0.00
NPC-Kaiga unit II 0.00 0.00 0.00 0.00 0.00 0.00 0.00
Total NPC 0.00 0.00 0.00 0.00 0.00 0.00 0.00 0.00 0.00 0.00 0.00 0.00 0.00 0.00 0.00 0.00
NTPC - Simhadri
NTPC Simhadri Stage I 0.00 0.00 0.00 0.00 0.00 0.00 0.00
NTPC Simhadri Stage II 0.00 0.00 0.00 0.00 0.00 0.00 0.00
Total NTPC- Simhadri 0.00 0.00 0.00 0.00 0.00 0.00 0.00 0.00 0.00 0.00 0.00 0.00 0.00 0.00 0.00 0.00
CGS - New
0.00 0.00 0.00 0.00 0.00 0.00 0.00
TOTAL CGS 0.00 0.00 0.00 0.00 0.00 0.00 0.00 0.00 0.00 0.00 0.00 0.00 0.00 0.00 0.00
APGPCL
APGPCL I - Allocated capacity 0.00 0.00 0.00 0.00 0.00 0.00 0.00
APGPCL I - Unutilised capacity 0.00 0.00 0.00 0.00 0.00 0.00 0.00
APGPCL II - Allocated capacity 0.00 0.00 0.00 0.00 0.00 0.00 0.00
APGPCL II - Unutilised capacity 0.00 0.00 0.00 0.00 0.00 0.00 0.00
Total APGPCL 0.00 0.00 0.00 0.00 0.00 0.00 0.00 0.00 0.00 0.00 0.00 0.00 0.00 0.00 0.00 0.00
IPPS
GVK 0.00 0.00 0.00 0.00 0.00 0.00 0.00
Spectrum 0.00 0.00 0.00 0.00 0.00 0.00 0.00
Kondapalli (Naphtha) 0.00 0.00 0.00 0.00 0.00 0.00 0.00
Kondapalli (Gas) 0.00 0.00 0.00 0.00 0.00 0.00 0.00
BSES 0.00 0.00 0.00 0.00 0.00 0.00 0.00
GVK Extension 0.00 0.00 0.00 0.00 0.00 0.00 0.00
Vemagiri 0.00 0.00 0.00 0.00 0.00 0.00 0.00
Gautami 0.00 0.00 0.00 0.00 0.00 0.00 0.00
Konaseema 0.00 0.00 0.00 0.00 0.00 0.00 0.00
0.00 0.00 0.00 0.00 0.00 0.00 0.00
TOTAL IPPS 0.00 0.00 0.00 0.00 0.00 0.00 0.00 0.00 0.00 0.00 0.00 0.00 0.00 0.00 0.00
NCE
NCE - Bio-Mass 0.00 0.00 0.00 0.00 0.00 0.00 0.00
NCE - Bagasse 0.00 0.00 0.00 0.00 0.00 0.00 0.00
NCE - Municipal Waste to Energy 0.00 0.00 0.00 0.00 0.00 0.00 0.00
NCE - Industrial Waste based power project 0.00 0.00 0.00 0.00 0.00 0.00 0.00
NCE - Wind Power 0.00 0.00 0.00 0.00 0.00 0.00 0.00
NCE - Mini Hydel 0.00 0.00 0.00 0.00 0.00 0.00 0.00
NCE - NCL Energy Ltd 0.00 0.00 0.00 0.00 0.00 0.00 0.00
NCE-Others 0.00 0.00 0.00 0.00 0.00 0.00 0.00
TOTAL NCE 0.00 0.00 0.00 0.00 0.00 0.00 0.00 0.00 0.00 0.00 0.00 0.00 0.00 0.00 0.00
OTHERS
Srivathsa 0.00 0.00 0.00 0.00 0.00 0.00 0.00
LVS 0.00 0.00 0.00 0.00 0.00 0.00 0.00
Vishakapatnam Steel Plant 0.00 0.00 0.00 0.00 0.00 0.00 0.00

Generating Station D Link
Plant Type
Must Run = 1
Others = 2
Plant
Capacity
DISCOM's
share
DISCOM's
share
(MW) (%) (MW) Net Availability Dispatch Fixed Variable Incentive Income Tax Others Total Fixed Incentives Income Tax Others Variable Total
Availability and Dispatch (MU) Cost (Rs. Crs.)Unit Cost
(Rs. / kWh)
NB Ferro Alloys 0.00 0.00 0.00 0.00 0.00 0.00 0.00
TOTAL OTHERS 0.00 0.00 0.00 0.00 0.00 0.00 0.00 0.00 0.00 0.00 0.00 0.00 0.00 0.00 0.00
MARKET
PTC 0.00 0.00 0.00 0.00 0.00 0.00 0.00
RCL and Short-Term Sources(IG Wells,Kesoram) 0.00 0.00 0.00 0.00 0.00 0.00 0.00
CPDCL 0.00 0.00 0.00 0.00 0.00 0.00 0.00
EPDCL 0.00 0.00 0.00 0.00 0.00 0.00 0.00
NPDCL 0.00 0.00 0.00 0.00 0.00 0.00 0.00
SPDCL 0.00 0.00 0.00 0.00 0.00 0.00 0.00
UI 0.00 0.00 0.00 0.00 0.00 0.00 0.00
Other Short Term Sources 0.00 0.00 0.00 0.00 0.00 0.00 0.00
TOTAL MARKET 0.00 0.00 0.00 0.00 0.00 0.00 0.00 0.00 0.00 0.00 0.00 0.00 0.00 0.00 0.00
TOTAL (From All Sources) 0.00 0.00 0.00 0.00 0.00 0.00 0.00 0.00 0.00 0.00 0.00 0.00 0.00 0.00 0.00
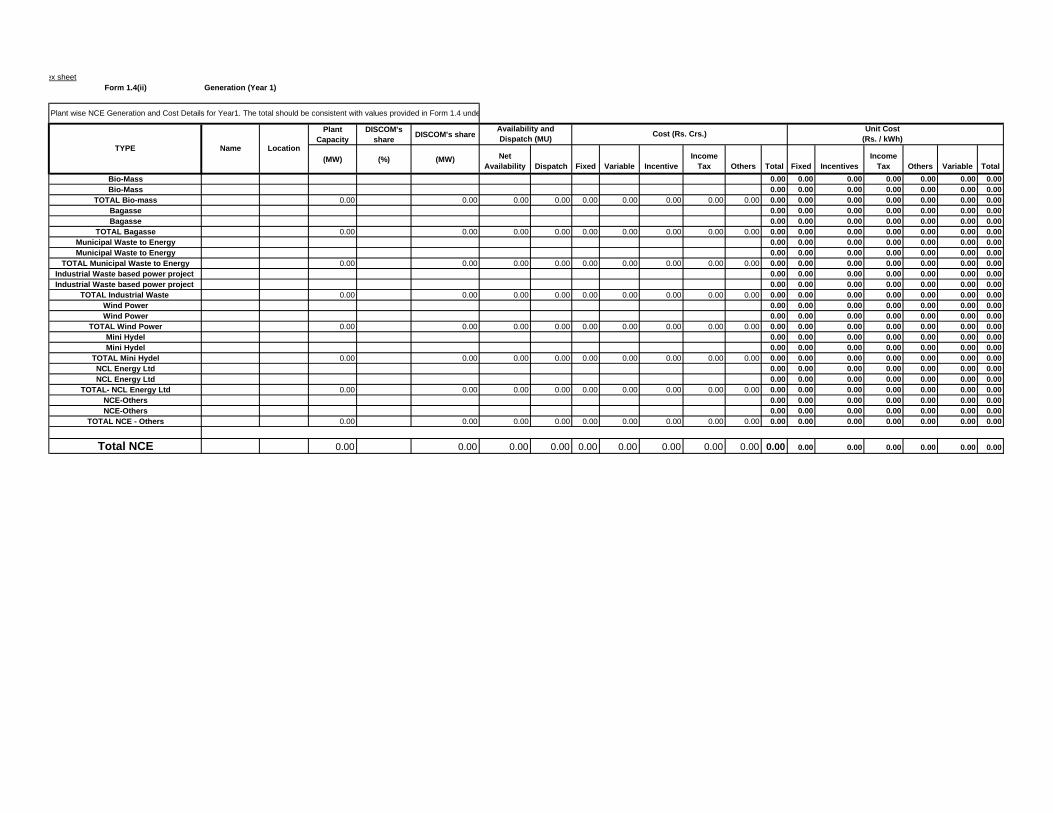
Index sheet
Form 1.4(ii) NCE Generation (Year 1)
Plant
Capacity
DISCOM's
shareDISCOM's share
(MW) (%) (MW) Net
Availability Dispatch Fixed Variable Incentive
Income
Tax Others Total Fixed Incentives
Income
Tax Others Variable Total
Bio-Mass 0.00 0.00 0.00 0.00 0.00 0.00 0.00
Bio-Mass 0.00 0.00 0.00 0.00 0.00 0.00 0.00
TOTAL Bio-mass 0.00 0.00 0.00 0.00 0.00 0.00 0.00 0.00 0.00 0.00 0.00 0.00 0.00 0.00 0.00 0.00
Bagasse 0.00 0.00 0.00 0.00 0.00 0.00 0.00
Bagasse 0.00 0.00 0.00 0.00 0.00 0.00 0.00
TOTAL Bagasse 0.00 0.00 0.00 0.00 0.00 0.00 0.00 0.00 0.00 0.00 0.00 0.00 0.00 0.00 0.00 0.00
Municipal Waste to Energy 0.00 0.00 0.00 0.00 0.00 0.00 0.00
Municipal Waste to Energy 0.00 0.00 0.00 0.00 0.00 0.00 0.00
TOTAL Municipal Waste to Energy 0.00 0.00 0.00 0.00 0.00 0.00 0.00 0.00 0.00 0.00 0.00 0.00 0.00 0.00 0.00 0.00
Industrial Waste based power project 0.00 0.00 0.00 0.00 0.00 0.00 0.00
Industrial Waste based power project 0.00 0.00 0.00 0.00 0.00 0.00 0.00
TOTAL Industrial Waste 0.00 0.00 0.00 0.00 0.00 0.00 0.00 0.00 0.00 0.00 0.00 0.00 0.00 0.00 0.00 0.00
Wind Power 0.00 0.00 0.00 0.00 0.00 0.00 0.00
Wind Power 0.00 0.00 0.00 0.00 0.00 0.00 0.00
TOTAL Wind Power 0.00 0.00 0.00 0.00 0.00 0.00 0.00 0.00 0.00 0.00 0.00 0.00 0.00 0.00 0.00 0.00
Mini Hydel 0.00 0.00 0.00 0.00 0.00 0.00 0.00
Mini Hydel 0.00 0.00 0.00 0.00 0.00 0.00 0.00
TOTAL Mini Hydel 0.00 0.00 0.00 0.00 0.00 0.00 0.00 0.00 0.00 0.00 0.00 0.00 0.00 0.00 0.00 0.00
NCL Energy Ltd 0.00 0.00 0.00 0.00 0.00 0.00 0.00
NCL Energy Ltd 0.00 0.00 0.00 0.00 0.00 0.00 0.00
TOTAL- NCL Energy Ltd 0.00 0.00 0.00 0.00 0.00 0.00 0.00 0.00 0.00 0.00 0.00 0.00 0.00 0.00 0.00 0.00
NCE-Others 0.00 0.00 0.00 0.00 0.00 0.00 0.00
NCE-Others 0.00 0.00 0.00 0.00 0.00 0.00 0.00
TOTAL NCE - Others 0.00 0.00 0.00 0.00 0.00 0.00 0.00 0.00 0.00 0.00 0.00 0.00 0.00 0.00 0.00 0.00
Total NCE 0.00 0.00 0.00 0.00 0.00 0.00 0.00 0.00 0.00 0.00 0.00 0.00 0.00 0.00 0.00 0.00
Plant wise NCE Generation and Cost Details for Year1. The total should be consistent with values provided in Form 1.4 under NCE.
Cost (Rs. Crs.)Unit Cost
(Rs. / kWh)
TYPE Name Location
Availability and
Dispatch (MU)

Form 1.4(ii) NCE Generation (Year 2)
Plant
Capacity
DISCOM's
shareDISCOM's share
(MW) (%) (MW)Net
Availability Dispatch Fixed Variable Incentive
Income
Tax Others Total Fixed Incentives
Income
Tax Others Variable Total
Bio-Mass 0.00 0.00 0.00 0.00 0.00 0.00 0.00
Bio-Mass 0.00 0.00 0.00 0.00 0.00 0.00 0.00
TOTAL Bio-mass 0.00 0.00 0.00 0.00 0.00 0.00 0.00 0.00 0.00 0.00 0.00 0.00 0.00 0.00 0.00 0.00
Bagasse 0.00 0.00 0.00 0.00 0.00 0.00 0.00
Bagasse 0.00 0.00 0.00 0.00 0.00 0.00 0.00
TOTAL Bagasse 0.00 0.00 0.00 0.00 0.00 0.00 0.00 0.00 0.00 0.00 0.00 0.00 0.00 0.00 0.00 0.00
Municipal Waste to Energy 0.00 0.00 0.00 0.00 0.00 0.00 0.00
Municipal Waste to Energy 0.00 0.00 0.00 0.00 0.00 0.00 0.00
TOTAL Municipal Waste to Energy 0.00 0.00 0.00 0.00 0.00 0.00 0.00 0.00 0.00 0.00 0.00 0.00 0.00 0.00 0.00 0.00
Industrial Waste based power project 0.00 0.00 0.00 0.00 0.00 0.00 0.00
Industrial Waste based power project 0.00 0.00 0.00 0.00 0.00 0.00 0.00
TOTAL Industrial Waste 0.00 0.00 0.00 0.00 0.00 0.00 0.00 0.00 0.00 0.00 0.00 0.00 0.00 0.00 0.00 0.00
Wind Power 0.00 0.00 0.00 0.00 0.00 0.00 0.00
Wind Power 0.00 0.00 0.00 0.00 0.00 0.00 0.00
TOTAL Wind Power 0.00 0.00 0.00 0.00 0.00 0.00 0.00 0.00 0.00 0.00 0.00 0.00 0.00 0.00 0.00 0.00
Mini Hydel 0.00 0.00 0.00 0.00 0.00 0.00 0.00
Mini Hydel 0.00 0.00 0.00 0.00 0.00 0.00 0.00
TOTAL Mini Hydel 0.00 0.00 0.00 0.00 0.00 0.00 0.00 0.00 0.00 0.00 0.00 0.00 0.00 0.00 0.00 0.00
NCL Energy Ltd 0.00 0.00 0.00 0.00 0.00 0.00 0.00
NCL Energy Ltd 0.00 0.00 0.00 0.00 0.00 0.00 0.00
TOTAL- NCL Energy Ltd 0.00 0.00 0.00 0.00 0.00 0.00 0.00 0.00 0.00 0.00 0.00 0.00 0.00 0.00 0.00 0.00
NCE-Others 0.00 0.00 0.00 0.00 0.00 0.00 0.00
NCE-Others 0.00 0.00 0.00 0.00 0.00 0.00 0.00
TOTAL NCE - Others 0.00 0.00 0.00 0.00 0.00 0.00 0.00 0.00 0.00 0.00 0.00 0.00 0.00 0.00 0.00 0.00
Total NCE 0.00 0.00 0.00 0.00 0.00 0.00 0.00 0.00 0.00 0.00 0.00 0.00 0.00 0.00 0.00 0.00
Plant wise NCE Generation and Cost Details for Year1. The total should be consistent with values provided in Form 1.4 under NCE.
Cost (Rs. Crs.)Unit Cost
(Rs. / kWh)
TYPE Name Location
Availability and
Dispatch (MU)

Form 1.4b Sales to Licensees
2018-19
S. No. Discom Name Details link Quantity (MU) Cost (Rs Crores)
Rate at which
power is sold
(Rs/kWh)
Amt received
through sales
(Rs crores)
1 State Discoms 0.00 0.00 0.00 0.00
A CPDCL
B EPDCL
C NPDCL
D SPDCL
2 Other State licensees/Consumers 0.00 0.00 0.00 0.00
A Bi-lateral Sales( PTC etc.)
B UI Sales
C Pool Transaction ( Sales)
Total 0.00 0.00 0.00
2019-20
S. No. Discom Name Details link Quantity (MU) Cost (Rs Crores)
Rate at which
power is sold
(Rs/kWh)
Amt received
through sales
(Rs crores)
1 State Discoms 0.00 0.00 0.00 0.00
A CPDCL
B EPDCL
C NPDCL
D SPDCL
2 Other State licensees/Consumers 0.00 0.00 0.00 0.00
A Bi-lateral Sales( PTC etc.)
B UI Sales
C Pool Transaction ( Sales)
Total 0.00 0.00 0.00
2020-21
S. No. Discom Name Details link Quantity (MU) Cost (Rs Crores)
Rate at which
power is sold
(Rs/kWh)
Amt received
through sales
(Rs crores)
1 State Discoms 0.00 0.00 0.00 0.00
A CPDCL
B EPDCL
C NPDCL
D SPDCL
2 Other State licensees/Consumers 0.00 0.00 0.00 0.00
A Bi-lateral Sales( PTC etc.)
B UI Sales
C Pool Transaction ( Sales)
Total 0.00 0.00 0.00

Form 1.4c Discom-Discom Purchases
Base year2018-19
S. No. Discom Name Details link Quantity (MU) Cost (Rs Crores) Rate (Rs/kWh)
1 EPDCL 0.00
2 SPDCL 0.00
3 0.00
4 0.00
5 0.00
6 0.00
Total 0.00 0.00 0.00
Year 1 2019-20
S. No. Discom Name Details link Quantity (MU) Cost (Rs Crores) Rate (Rs/kWh)
1 EPDCL 0.00
2 SPDCL 0.00
3 0.00
4 0.00
5 0.00
6 0.00
Total 0.00 0.00 0.00
Year 2 2020-21
S. No. Discom Name Details link Quantity (MU) Cost (Rs Crores) Rate (Rs/kWh)
1 EPDCL 0.00
2 SPDCL 0.00
3 0.00
4 0.00
5 0.00
6 0.00
Total 0.00 0.00 0.00

Form 1.5
Amount (In Rs crores)
2018-19 2019-20 2020-21 2021-22 2022-23 2023-24
A Opening Balance 2298.86 2558.84 2831.82
B Additions during the Year 1544.28 1621.49 1702.57
C Deductions during the Year 1284.30 1348.52 1415.94
D Closing Balance 2558.84 2831.82 3118.45 0.00 0.00 0.00
E Average Balance ((A+D)/2) 2428.85 2695.33 2975.13 0.00 0.00 0.00
F Interest @ % p.a. # 6.20 6.20 6.20
G Interest Cost (E*F) 150.67 167.20 184.56 0.00 0.00 0.00
Interest on Consumer Security Deposits
Revenue Requirement Item (Rs. Crs.) Details link
For Control Period

Form 1.6 Supply Margin
Amount (In Rs crores)
2018-19 2019-20 2020-21 2021-22 2022-23 2023-24
A Supply Margin Amount 13.05 28.31 77.59
Particulars Details link
For Control Period

Form 1.7
Amount (In Rs crores)
2019-20 2020-21 2021-22 2022-23 2023-24
1 Payment to M/s EESL towards DELP 28.76 22.89
2 Solar Pumpsets 36.58 110.42
3 Energy Efficient Pumpsets 45.53 28.76
4 Towards Electrical accidents compensation 18.00 18.00
5 Grants to APSEEDCO 2.00 2.00
6
7
8
9
10
11
12
Total 130.87 182.07 0.00 0.00 0.00
Other Costs
Details
linkS.No.
For Control PeriodParticulars

Form 2
Cost of Service:
Total Cost
Allocation
(Rs.Crs)
Sales (MU)CoS
(Rs/unit)
LT Category 19960.18 26444.58 7.55
HT Category at 11 KV 2305.98 3191.86 7.22
HT Category at 33 KV 2855.03 4086.69 6.99
HT Category at 132 KV 3427.33 5070.70 6.76
Average 28548.51 38793.83 7.36
Cost of Service: Embedded Cost Method
Consumer CategoriesDetail
Links
2020-21

Form 3 Sales Forecast
Base Year
2018-19
Sales / Forecast Sales (MU) D Link Apr May Jun Jul Aug Sep Oct Nov Dec Jan Feb Mar Total
LT Category 2055.47 2031.70 1892.31 1884.96 2004.58 1965.68 2081.94 1911.58 1758.29 1811.48 1838.78 2380.30 23617.08
Category I (A&B) - Domestic 725.43 844.46 875.17 723.41 765.77 761.95 777.42 753.06 662.80 577.24 569.55 636.56 8672.82
Category II (A,B & C) - Non-domestic/Commercial 158.34 178.19 179.78 159.44 163.20 165.56 160.09 161.78 149.77 148.12 134.28 148.80 1907.34
Category III (A & B) - Industrial 211.45 199.03 201.78 184.29 174.91 175.06 178.78 201.26 195.03 196.60 193.63 191.55 2303.37
Category IV (A,B &C) - Cottage Industries & Dhobighats 3.72 3.76 3.81 3.61 3.87 3.94 3.42 3.83 3.65 4.12 3.57 2.99 44.29
Category V (A, B & C) - Irrigation and Agriculture 886.30 736.95 563.15 748.75 828.43 786.14 892.22 716.81 672.20 810.12 863.14 1328.28 9832.49
Category VI (A & B) - Local Bodies, St. Lighting & PWS 60.02 60.42 60.22 56.97 58.61 62.92 60.11 65.64 64.84 66.18 66.89 62.82 745.64
Category VII (A & B) - General Purpose 10.15 8.77 8.13 8.42 9.74 10.04 9.74 9.06 9.88 9.02 7.58 9.29 109.81
Category VIII (A & B) -Temporary Supply 0.07 0.12 0.28 0.07 0.06 0.07 0.17 0.13 0.12 0.08 0.15 0.01 1.32
HT Category at 11 KV 234.97 220.95 215.01 222.00 217.72 214.30 237.40 224.48 227.14 221.97 217.22 276.63 2729.79
HT I (A): General 40.48 39.37 36.45 37.93 35.62 36.12 40.56 38.63 42.17 37.89 37.51 49.13 471.87
Lights and Fans 6.33 2.69 2.50 2.43 0.62 0.66 1.60 1.53 1.52 5.42 4.45 5.27 35.00
Industrial Colonies 0.11 0.08 0.07 0.13 0.13 0.13 0.15 0.23 0.17 0.13 0.15 0.23 1.71
Seasonal Industries 0.32 0.45 0.23 0.15 0.18 0.43 0.80 0.33 0.26 0.28 0.20 0.35 3.96
Time of Day Tariffs Peak (6 AM to 10 AM & 6 PM to 10 PM) 35.86 37.91 35.67 35.79 32.48 34.57 38.71 36.92 39.17 36.59 35.25 46.15 445.05
Time of Day Tariffs Off Peak (10 PM to 6 AM) 30.95 35.64 33.11 33.35 30.42 32.46 35.98 34.00 36.42 34.16 33.15 42.94 412.59
HT I (B): Energy Intensive Industries 0.18 0.21 0.20 0.21 0.19 0.19 0.20 0.20 0.20 0.15 0.14 0.19 2.26
HT I (C): Aquaculture and Animal Husbandry 3.35 3.59 2.87 2.50 2.58 2.90 3.36 4.41 2.26 1.85 1.76 3.08 34.52
HT I (D): Poultry Hatcheries abd Poultry Feed Mixing Plants 2.29 2.51 2.35 2.74 2.38 3.13 3.61 3.50 4.43 4.52 4.24 5.00 40.70
HT II: Others 44.52 45.32 45.13 43.17 42.84 42.11 41.42 39.95 36.79 34.35 37.34 48.55 501.49
Time of Day Tariffs Peak (6 AM to 10 AM & 6 PM to 10 PM) 11.10 11.27 11.15 10.86 11.24 10.85 11.18 10.66 10.33 9.75 10.47 12.51 131.38
HT II (B): Religious Places 0.51 0.60 0.56 0.52 0.51 0.48 0.51 0.46 0.45 0.38 0.44 0.57 5.98
HT II (C): Function Halls/Auditoriums 0.99 0.72 0.75 0.53 1.12 0.54 0.64 0.51 0.81 0.41 0.98 0.91 8.90
HT II (E): Electric Vehicles (Evs) / Charging stations 0.00 0.00 0.00 0.00 0.00 0.00 0.00 0.00 0.00 0.00 0.00 0.00 0.00
Time of Day Tariffs Peak (6 AM to 10 AM & 6 PM to 10 PM) 0.00 0.00 0.00 0.00 0.00 0.00 0.00 0.00 0.00 0.00 0.00 0.00 0.00
Time of Day Tariffs Off Peak (10 PM to 6 AM) 0.00 0.00 0.00 0.00 0.00 0.00 0.00 0.00 0.00 0.00 0.00 0.00 0.00
HT II (F) : Start up power 0.02 0.02 0.01 0.01 0.01 0.02 0.02 0.02 0.02 0.02 0.02 0.02 0.21
HT III: Public Infrastructure and Tourism 3.56 3.83 3.38 3.11 2.79 2.96 2.44 2.58 2.34 1.85 2.06 3.17 34.08
Time of Day Tariffs (6 PM to 10 PM) 0.79 0.85 0.76 0.70 0.66 0.72 0.57 0.63 0.59 0.46 0.49 0.73 7.96
HT IV Government LIS 2.30 0.71 0.95 1.70 3.26 5.53 9.60 10.72 7.99 6.84 3.84 2.77 56.22
HT IV Private Irrigation and Agriculture 0.00 0.00 0.00 0.00 0.00 0.00 0.00 0.00 0.00 0.00 0.00 0.00 0.00
HT IV CPWS 4.31 3.89 3.91 3.65 3.97 3.92 4.31 4.22 4.36 4.11 3.68 3.96 48.29
HT VI: Townships & Residential Colonies 2.02 2.29 2.10 1.96 1.87 1.90 1.87 1.67 1.59 1.61 1.69 2.11 22.66
HT VII: Green Power 0.00 0.00 0.00 0.00 0.00 0.00 0.00 0.00 0.00 0.00 0.00 0.02 0.02
HT VIII: Temporary 0.23 0.23 0.22 0.23 0.23 0.22 0.24 0.19 0.16 0.13 0.13 0.12 2.33
Category: RESCOs 44.78 28.77 32.61 40.34 44.63 34.46 39.63 33.12 35.10 41.06 39.23 48.85 462.59
HT Category at 33 KV 291.24 312.05 287.75 288.23 286.76 310.64 353.15 326.87 331.45 305.89 293.06 368.22 3755.32
HT I (A): General 98.11 88.15 78.12 77.24 78.05 81.61 91.87 85.87 89.73 83.21 81.46 100.72 1034.14
Lights and Fans 2.79 2.60 2.45 3.06 2.56 2.71 2.87 2.74 1.99 1.95 2.06 2.86 30.64
Industrial Colonies 0.98 1.05 0.91 0.95 0.82 1.23 1.01 0.86 0.73 0.62 0.71 0.97 10.83
Seasonal Industries 0.01 0.00 0.02 0.17 0.12 0.12 0.29 0.02 0.02 0.09 0.00 0.00 0.86
Time of Day Tariffs Peak (6 AM to 10 AM & 6 PM to 10 PM) 75.36 86.74 80.78 82.31 79.42 83.43 95.29 88.32 89.94 84.53 81.80 102.69 1030.61
Time of Day Tariffs Off Peak (10 PM to 6 AM) 71.29 86.10 78.85 81.30 77.77 82.49 93.49 87.46 89.12 83.02 79.67 100.07 1010.64
HT I (B): Energy Intensive Industries 21.41 21.86 19.85 18.84 18.61 21.26 24.60 22.77 21.92 19.83 17.97 23.39 252.30
HT I (C) : Aquaculture and Animal Husbandry 0.00 0.00 0.00 0.00 0.00 0.00 0.00 0.00 0.00 0.00 0.00 0.00 0.00
HT I (D) : Poultry Hatcheries and Poultry Feed Mixing Plants 0.92 4.63 5.74 5.90 5.91 6.76 7.67 6.84 5.99 6.08 6.21 8.17 70.83
HT II: Others 6.79 6.26 8.53 7.10 6.92 6.56 6.74 6.70 6.52 6.48 6.73 8.18 83.51

Sales / Forecast Sales (MU) D Link Apr May Jun Jul Aug Sep Oct Nov Dec Jan Feb Mar Total
Time of Day Tariffs (6 PM to 10 PM) 2.13 2.10 2.24 1.92 1.87 2.20 2.17 2.04 2.14 2.17 2.22 2.70 25.89
HT II (B): Religious Places 3.16 3.86 2.15 0.91 0.83 2.55 2.62 2.29 2.56 2.70 2.42 2.96 29.01
HT II (C) : Function Halls / Auditoriums 0.02 0.02 0.02 0.02 0.02 0.01 0.02 0.00 0.00 0.00 0.00 0.00 0.11
HT II (E): Electric Vehicles (Evs) / Charging stations 0.00 0.00 0.00 0.00 0.00 0.00 0.00 0.00 0.00 0.00 0.00 0.00 0.00
Time of Day Tariffs Peak (6 AM to 10 AM & 6 PM to 10 PM) 0.00 0.00 0.00 0.00 0.00 0.00 0.00 0.00 0.00 0.00 0.00 0.00 0.00
Time of Day Tariffs Off Peak (10 PM to 6 AM) 0.00 0.00 0.00 0.00 0.00 0.00 0.00 0.00 0.00 0.00 0.00 0.00 0.00
HT II (F) : Start up power 1.34 1.78 0.72 0.27 0.23 1.37 1.82 1.11 1.14 2.89 1.69 2.99 17.37
HT III: Public Infrastructure and Tourism 0.71 0.77 0.64 0.61 0.53 0.60 0.47 0.49 0.47 0.38 0.42 0.67 6.77
Time of Day Tariffs (6 PM to 10 PM) 0.20 0.22 0.18 0.18 0.15 0.17 0.13 0.14 0.13 0.10 0.11 0.17 1.87
HT IV Government LIS 1.11 0.51 0.68 2.26 8.35 12.17 17.39 14.25 12.40 6.48 4.44 6.28 86.31
HT IV Agriculture 0.00 0.00 0.00 0.00 0.00 0.00 0.00 0.00 0.00 0.00 0.00 0.00 0.00
HT IV CPWS 4.59 5.01 5.47 4.90 4.34 5.09 4.39 4.66 6.38 5.12 4.89 5.03 59.86
HT VI: Townships & Residential Colonies 0.32 0.39 0.37 0.31 0.29 0.31 0.32 0.29 0.27 0.25 0.27 0.36 3.76
HT VII: Green Power 0.00 0.00 0.00 0.00 0.00 0.00 0.00 0.00 0.00 0.00 0.00 0.00 0.00
HT VIII: Temporary 0.00 0.00 0.00 0.00 0.00 0.00 0.00 0.00 0.00 0.00 0.00 0.00 0.00
Category: RESCOs 0.00 0.00 0.00 0.00 0.00 0.00 0.00 0.00 0.00 0.00 0.00 0.00 0.00
0.00
0.00
HT Category at 132 KV 317.81 327.92 287.92 325.38 442.08 452.72 528.45 471.53 462.02 405.42 381.52 383.95 4786.72
HT I (A): General 94.04 75.56 61.03 69.81 73.15 76.68 76.82 68.20 69.14 68.91 68.50 62.25 864.08
Lights and Fans 1.35 1.39 0.91 1.29 1.13 1.42 1.31 1.14 1.12 1.03 1.25 1.29 14.63
Industrial Colonies 1.25 1.36 1.19 1.08 1.02 1.10 1.13 0.99 0.93 0.82 0.88 1.20 12.95
Seasonal Industries 0.00 0.00 0.00 0.00 0.00 0.00 0.00 0.00 0.00 0.00 0.00 0.00 0.00
Time of Day Tariffs Peak (6 AM to 10 AM & 6 PM to 10 PM) 63.37 73.00 68.70 72.63 66.96 71.63 77.24 71.13 73.34 74.14 65.57 62.68 840.39
Time of Day Tariffs Off Peak (10 PM to 6 AM) 68.10 82.28 73.58 77.91 71.49 76.01 83.69 74.99 78.34 78.48 69.95 65.87 900.70
HT I (B): Energy Intensive Industries 13.82 10.56 7.57 7.65 8.19 8.88 9.64 8.65 8.75 7.98 7.54 9.43 108.68
HT I (C ): Aquaculture and Animal Husbandry 0.00 0.00 0.00 0.00 0.00 0.00 0.00 0.00 0.00 0.00 0.00 0.00 0.00
HT I (D): Poultry and Hatcheries and Poultry Feed Mixing Plants 0.00 0.00 0.00 0.00 0.00 0.00 0.00 0.00 0.00 0.00 0.00 0.00 0.00
HT II: Others 3.69 5.14 2.96 2.75 2.69 2.91 2.79 2.66 2.87 3.14 2.78 3.13 37.52
Time of Day Tariffs (6 PM to 10 PM) 0.68 1.04 0.65 0.68 0.63 0.66 0.63 0.64 0.67 0.76 0.63 0.74 8.41
HT II (B): Religious Places 0.00 0.00 0.00 0.00 0.00 0.00 0.00 0.00 0.00 0.00 0.00 0.00 0.00
HT II (C) : Function Halls / Auditoriums 0.00 0.00 0.00 0.00 0.00 0.00 0.00 0.00 0.00 0.00 0.00 0.00 0.00
HT II (E): Electric Vehicles (Evs) / Charging stations 0.00 0.00 0.00 0.00 0.00 0.00 0.00 0.00 0.00 0.00 0.00 0.00 0.00
Time of Day Tariffs Peak (6 AM to 10 AM & 6 PM to 10 PM) 0.00 0.00 0.00 0.00 0.00 0.00 0.00 0.00 0.00 0.00 0.00 0.00 0.00
Time of Day Tariffs Off Peak (10 PM to 6 AM) 0.00 0.00 0.00 0.00 0.00 0.00 0.00 0.00 0.00 0.00 0.00 0.00 0.00
HT II (F) : Start up power 0.27 0.38 0.15 0.28 0.12 0.31 0.35 0.25 0.23 0.44 0.34 0.48 3.62
HT III: Public Infrastructure and Tourism 0.00 0.00 0.00 0.00 0.00 0.00 0.00 0.00 0.00 0.00 0.00 0.00 0.00
Time of Day Tariffs (6 PM to 10 PM) 0.00 0.00 0.00 0.00 0.00 0.00 0.00 0.00 0.00 0.00 0.00 0.00 0.00
HT IV Government LIS 5.41 5.27 2.15 19.37 144.19 143.80 200.67 175.67 158.65 107.30 103.17 111.48 1177.12
HT IV Agriculture 0.00 0.00 0.00 0.00 0.00 0.00 0.00 0.00 0.00 0.00 0.00 0.00 0.00
HT IV CPWS 0.00 0.00 0.00 0.00 0.00 0.00 0.00 0.00 0.00 0.00 0.00 0.00 0.00
HT V: Railway Traction 65.84 71.94 69.03 71.92 72.51 69.31 74.17 67.21 67.98 62.41 60.92 65.40 818.64
HT VI: Townships & Residential Colonies 0.00 0.00 0.00 0.00 0.00 0.00 0.00 0.00 0.00 0.00 0.00 0.00 0.00
HT VII: Green Power 0.00 0.00 0.00 0.00 0.00 0.00 0.00 0.00 0.00 0.00 0.00 0.00 0.00
HT VIII: Temporary 0.00 0.00 0.00 0.00 0.00 0.00 0.00 0.00 0.00 0.00 0.00 0.00 0.00
Category: RESCOs 0.00 0.00 0.00 0.00 0.00 0.00 0.00 0.00 0.00 0.00 0.00 0.00 0.00
0.00
0.00
Total 2899.50 2892.63 2682.99 2720.57 2951.14 2943.34 3200.95 2934.46 2778.90 2744.76 2730.58 3409.09 34888.91

Sales / Forecast Sales (MU) D Link Apr May Jun Jul Aug Sep Oct Nov Dec Jan Feb Mar Total
Year-1
2019-20
Sales / Forecast Sales (MU) D Link Apr May Jun Jul Aug Sep Oct Nov Dec Jan Feb Mar Total
LT Category 2142.57 2351.41 2169.34 2003.22 1904.60 1814.42 2230.00 2033.48 1866.45 1914.72 1939.58 2505.67 24875.45
Domestic 833.62 927.34 1064.54 913.89 819.34 833.14 858.86 825.12 723.22 628.59 616.96 689.29 9733.91
Commerical & Others 181.49 188.51 202.38 182.95 175.21 168.70 171.75 173.48 160.51 158.73 143.93 159.44 2067.07
Industry 100.55 84.48 91.34 82.94 84.70 77.63 86.51 94.53 86.16 88.36 91.27 92.28 1060.73
Institutional 80.45 76.16 73.41 67.97 71.69 69.49 74.36 79.43 79.49 79.97 79.15 76.73 908.29
Agriculture & Related 946.47 1074.92 737.68 755.48 753.66 665.45 1038.35 860.80 816.95 958.99 1008.13 1487.92 11104.80
Temporary 0.00 0.00 0.00 0.00 0.00 0.00 0.17 0.13 0.12 0.08 0.15 0.01 0.66
0.00
HT Category at 11 KV 249.26 249.32 239.60 234.18 244.03 230.46 270.01 258.64 264.84 261.45 258.05 319.69 3079.52
HT I (B): Townships & Residential Colonies 2.18 0.78 -0.78 2.30 2.07 2.16 2.05 1.84 1.75 1.77 1.86 2.32 20.30
HT II (A) : Commercial 60.21 64.90 62.55 58.92 75.44 74.19 69.72 69.88 68.52 67.93 72.52 84.93 829.72
Time of Day Tariffs (6 PM to 10 PM) 8.85 10.52 9.63 9.24 12.24 12.24 10.85 10.34 10.02 9.46 10.15 12.13 125.68
HT II (B) : Public Infrastructure and Tourism 3.08 3.90 3.93 3.52 4.51 4.41 2.69 2.84 2.57 2.04 2.27 3.49 39.25
Time of Day Tariffs (6 PM to 10 PM) 0.00 0.00 0.00 0.00 0.00 0.00 0.63 0.69 0.64 0.50 0.54 0.80 3.81
HT II (D) : Function Halls / Auditoriums / Start up Power 0.57 0.90 0.88 0.41 0.56 0.54 0.66 0.53 0.84 0.44 1.01 0.94 8.28
HT II (E): Electric Vehicles (Evs) / Charging stations 0.00 0.00 0.00 0.00 0.00 0.00 0.00 0.00 0.00 0.00 0.00 0.00 0.00
HT II (F) : Green Power 0.00 0.00 0.00 0.00 0.00 0.00 0.00 0.00 0.00 0.00 0.00 0.00 0.00
HT III (A): Industry 42.99 42.92 40.01 40.42 31.97 33.24 41.32 39.36 44.41 44.03 42.71 54.90 498.28
Time of Day Tariffs Peak (6 AM to 10 AM & 6 PM to 10 PM) 37.29 38.75 36.16 35.71 34.12 28.77 39.48 37.66 39.95 37.32 35.96 47.07 448.24
Time of Day Tariffs Off Peak (10 PM to 6 AM) 36.14 37.38 34.67 33.80 31.56 26.98 36.83 34.80 37.28 34.96 33.93 43.95 422.27
Industrial Colonies 0.12 0.12 0.08 0.10 0.09 0.08 0.14 0.22 0.16 0.12 0.14 0.22 1.59
HT III (B): Seasonal Industries 0.25 0.20 0.20 0.18 0.19 0.58 0.77 0.31 0.25 0.27 0.19 0.34 3.73
HT III (C): Energy Intensive Industries 0.14 0.18 0.16 0.14 0.15 0.15 0.18 0.18 0.18 0.14 0.13 0.18 1.91
HT IV (B): CPWS / PWS Scheme 3.81 3.64 3.41 3.56 4.14 3.77 4.19 4.10 4.24 3.99 3.58 3.85 46.28
HT IV (E): Religious Places 1.06 1.20 0.66 0.59 0.64 0.54 0.62 0.56 0.55 0.46 0.53 0.69 8.11
HT IV (F) : Railway Traction 0.00 0.00 0.00 0.00 0.00 0.00 0.00 0.00 0.00 0.00 0.00 0.00 0.00
HT V (C) : Aquaculture and Animal Husbandry 3.51 2.97 3.44 3.31 3.36 3.41 3.83 5.02 2.58 2.11 2.01 3.51 39.05
HT V (D) : Poultry Hatcheries and Poultry Feed Mixing Plants 4.50 3.55 4.96 5.13 5.51 5.29 5.45 5.29 6.69 6.84 6.40 7.56 67.17
HT V (F) : Government / Pvt. LIS 1.40 0.72 0.77 1.06 3.57 4.47 9.89 11.04 8.23 7.05 3.95 2.85 55.00
HT Temporary supply 0.00 0.00 0.00 0.00 0.00 0.00 0.25 0.19 0.16 0.13 0.13 0.12 1.00
RESCOs 43.15 36.68 38.87 35.79 33.90 29.65 40.46 33.78 35.81 41.89 40.03 49.85 459.85
0.00
HT Category at 33 KV 314.60 332.75 306.24 310.85 284.70 288.12 369.94 342.15 365.91 337.67 324.85 402.94 3980.71
HT I (B): Townships & Residential Colonies 0.40 0.14 -0.15 0.40 0.39 0.38 0.29 0.26 0.24 0.22 0.24 0.32 3.13
HT II (A) : Commercial 5.71 6.73 6.14 6.40 7.97 8.03 6.64 6.60 6.42 6.38 6.63 8.06 81.72
Time of Day Tariffs (6 PM to 10 PM) 1.41 1.69 1.54 1.45 2.18 1.92 1.98 1.85 1.95 1.97 2.02 2.46 22.41
HT II (B) : Public Infrastructure and Tourism 0.67 0.83 0.78 0.65 1.34 0.79 0.54 0.57 0.54 0.44 0.48 0.77 8.40
Time of Day Tariffs (6 PM to 10 PM) 0.00 0.00 0.00 0.00 0.00 0.00 0.07 0.07 0.06 0.05 0.05 0.08 0.39
HT II (D) : Function Halls / Auditoriums / Start up Power 1.81 1.63 0.76 0.49 0.60 2.18 0.94 0.56 0.57 1.45 0.85 1.50 13.33
HT II (E): Electric Vehicles (Evs) / Charging stations 0.00 0.00 0.00 0.00 0.00 0.00 0.00 0.00 0.00 0.00 0.00 0.00 0.00
HT II (F) : Green Power 0.01 0.01 0.01 0.01 0.01 0.01 0.01 0.01 0.01 0.01 0.01 0.01 0.10
HT III (A): Industry 95.71 97.64 88.27 89.74 80.18 77.85 96.92 90.65 113.69 106.97 105.30 125.82 1168.74
Time of Day Tariffs Peak (6 AM to 10 AM & 6 PM to 10 PM) 85.46 91.15 86.50 88.08 77.09 76.74 98.61 91.40 93.07 87.47 84.64 106.27 1066.48
Time of Day Tariffs Off Peak (10 PM to 6 AM) 84.55 89.99 86.97 89.25 78.45 77.72 99.19 92.80 94.55 88.08 84.53 106.17 1072.26
Industrial Colonies 0.91 0.97 1.06 0.84 0.79 0.87 0.97 0.83 0.70 0.59 0.68 0.93 10.14
HT III (B): Seasonal Industries 0.00 0.05 0.03 0.10 0.09 0.08 0.26 0.02 0.02 0.08 0.00 0.00 0.73
HT III (C): Energy Intensive Industries 19.51 19.71 16.49 16.11 11.98 11.07 22.14 20.50 19.73 17.84 16.18 21.05 212.31
HT IV (B): CPWS / PWS Scheme 5.41 4.80 4.68 4.94 4.91 4.00 4.34 4.61 6.31 5.07 4.84 4.98 58.89

Sales / Forecast Sales (MU) D Link Apr May Jun Jul Aug Sep Oct Nov Dec Jan Feb Mar Total
HT IV (E): Religious Places 3.18 3.60 2.61 1.75 1.67 2.13 2.91 2.54 2.84 2.99 2.68 3.28 32.18
HT IV (F) : Railway Traction 0.00 0.00 0.00 0.00 0.00 0.00 0.00 0.00 0.00 0.00 0.00 0.00 0.00
HT V (C) : Aquaculture and Animal Husbandry 0.00 0.00 0.00 0.00 0.00 0.00 0.00 0.00 0.00 0.00 0.00 0.00 0.00
HT V (D) : Poultry Hatcheries and Poultry Feed Mixing Plants 8.15 7.35 10.09 9.97 9.76 9.98 12.65 11.29 9.89 10.04 10.24 13.48 122.89
HT V (F) : Government / Pvt. LIS 1.72 6.45 0.47 0.66 7.29 14.38 21.49 17.60 15.32 8.01 5.49 7.76 106.63
HT Temporary supply 0.00 0.00 0.00 0.00 0.00 0.00 0.00 0.00 0.00 0.00 0.00 0.00 0.00
RESCOs 0.00 0.00 0.00 0.00 0.00 0.00 0.00 0.00 0.00 0.00 0.00 0.00 0.00
0.00
HT Category at 132 KV 321.94 305.50 287.06 288.14 387.62 447.15 569.63 510.30 498.03 433.76 386.52 390.67 4826.32
HT I (B): Townships & Residential Colonies 0.00 0.00 0.00 0.00 0.00 0.00 0.00 0.00 0.00 0.00 0.00 0.00 0.00
HT II (A) : Commercial 2.30 2.70 2.69 2.62 3.10 3.40 2.56 2.45 2.64 2.89 2.56 2.88 32.79
Time of Day Tariffs (6 PM to 10 PM) 0.51 0.59 0.54 0.53 0.65 0.72 0.58 0.58 0.61 0.69 0.58 0.67 7.25
HT II (B) : Public Infrastructure and Tourism 0.00 0.00 0.00 0.00 0.00 0.00 0.00 0.00 0.00 0.00 0.00 0.00 0.00
Time of Day Tariffs (6 PM to 10 PM) 0.00 0.00 0.00 0.00 0.00 0.00 0.00 0.00 0.00 0.00 0.00 0.00 0.00
HT II (D) : Function Halls / Auditoriums / Start up Power 0.34 0.37 0.26 0.24 0.32 0.53 0.17 0.13 0.12 0.22 0.17 0.24 3.11
HT II (E): Electric Vehicles (Evs) / Charging stations 0.00 0.00 0.00 0.00 0.00 0.00 0.00 0.00 0.00 0.00 0.00 0.00 0.00
HT II (F) : Green Power 0.00 0.00 0.00 0.00 0.00 0.00 0.00 0.00 0.00 0.00 0.00 0.00 0.00
HT III (A): Industry 66.03 72.59 65.16 65.82 59.53 53.06 71.87 63.79 64.64 64.34 64.17 58.45 769.45
Time of Day Tariffs Peak (6 AM to 10 AM & 6 PM to 10 PM) 68.77 74.56 67.24 66.67 60.17 55.02 74.93 69.00 71.14 71.91 63.60 60.80 803.81
Time of Day Tariffs Off Peak (10 PM to 6 AM) 72.88 78.10 70.62 70.87 63.35 56.91 80.34 71.99 75.20 75.34 67.15 63.24 845.99
Industrial Colonies 1.31 1.40 1.41 1.12 0.94 0.92 1.15 1.00 0.95 0.84 0.89 1.22 13.15
HT III (B): Seasonal Industries 0.00 0.00 0.00 0.00 0.00 0.00 0.00 0.00 0.00 0.00 0.00 0.00 0.00
HT III (C): Energy Intensive Industries 8.06 8.12 7.64 7.03 5.99 4.40 8.29 7.44 7.52 6.87 6.49 8.11 85.96
HT IV (B): CPWS / PWS Scheme 0.00 0.00 0.00 0.00 0.00 0.00 0.00 0.00 0.00 0.00 0.00 0.00 0.00
HT IV (E): Religious Places 0.00 0.00 0.00 0.00 0.00 0.00 0.00 0.00 0.00 0.00 0.00 0.00 0.00
HT IV (F) : Railway Traction 62.05 66.10 70.17 72.17 76.57 65.50 76.40 69.22 70.02 64.28 62.74 67.37 822.59
HT V (C) : Aquaculture and Animal Husbandry 0.00 0.00 0.00 0.00 0.00 0.00 0.00 0.00 0.00 0.00 0.00 0.00 0.00
HT V (D) : Poultry Hatcheries and Poultry Feed Mixing Plants 0.00 0.00 0.00 0.00 0.00 0.00 0.00 0.00 0.00 0.00 0.00 0.00 0.00
HT V (F) : Government / Pvt. LIS 39.69 0.97 1.34 1.09 117.00 206.68 253.33 224.70 205.19 146.38 118.17 127.69 1442.21
HT Temporary supply 0.00 0.00 0.00 0.00 0.00 0.00 0.00 0.00 0.00 0.00 0.00 0.00 0.00
RESCOs 0.00 0.00 0.00 0.00 0.00 0.00 0.00 0.00 0.00 0.00 0.00 0.00 0.00
0.00
Total 3028.37 3238.98 3002.23 2836.40 2820.95 2780.15 3439.58 3144.58 2995.23 2947.60 2909.00 3618.96 36762.01

Sales / Forecast Sales (MU) D Link Apr May Jun Jul Aug Sep Oct Nov Dec Jan Feb Mar Total
Year-2
2020-21
Sales / Forecast Sales (MU) D Link Apr May Jun Jul Aug Sep Oct Nov Dec Jan Feb Mar Total
LT Category 2276.27 2506.66 2329.59 2140.22 2025.80 1930.49 2368.57 2160.26 1980.81 2027.91 2051.02 2646.99 26444.58
Domestic 893.67 1002.10 1159.93 987.85 877.64 891.87 921.39 883.47 772.43 669.32 654.76 731.42 10445.84
Commerical & Others 195.32 202.98 217.74 196.85 188.46 181.51 184.59 186.52 172.49 170.66 154.64 171.53 2223.30
Industry 101.74 85.48 92.43 83.93 85.72 78.58 87.53 95.65 87.19 89.43 92.34 93.33 1073.35
Agriculture & Related 1000.79 1135.88 782.14 799.98 798.45 705.36 1096.52 910.83 864.86 1014.19 1065.83 1569.92 11744.73
Temporary 0.00 0.00 0.00 0.00 0.00 0.00 0.19 0.14 0.14 0.09 0.16 0.01 0.73
0.00
HT Category at 11 KV 258.90 258.16 248.81 242.98 252.96 238.78 279.81 267.77 274.05 271.15 267.42 331.07 3191.86
HT I (B): Townships & Residential Colonies 2.21 0.79 -0.78 2.33 2.09 2.19 2.07 1.86 1.77 1.79 1.87 2.34 20.51
HT II (A) : Commercial 62.07 66.81 64.43 60.77 77.45 76.19 71.67 71.84 70.46 69.86 74.50 87.03 853.09
Time of Day Tariffs (6 PM to 10 PM) 8.94 10.62 9.72 9.34 12.37 12.36 10.95 10.45 10.12 9.55 10.26 12.25 126.94
HT II (B) : Public Infrastructure and Tourism 3.39 4.29 4.32 3.87 4.97 4.85 2.95 3.13 2.83 2.24 2.50 3.84 43.18
Time of Day Tariffs (6 PM to 10 PM) 0.00 0.00 0.00 0.00 0.00 0.00 0.54 0.59 0.55 0.43 0.46 0.68 3.24
HT II (D) : Function Halls / Auditoriums / Start up Power 0.59 0.92 0.89 0.42 0.57 0.55 0.68 0.54 0.86 0.45 1.03 0.96 8.46
HT II (E): Electric Vehicles (Evs) / Charging stations 0.00 0.00 0.00 0.00 0.00 0.00 0.00 0.00 0.00 0.00 0.00 0.00 0.00
HT II (F) : Green Power 0.00 0.00 0.00 0.00 0.00 0.00 0.00 0.00 0.00 0.00 0.00 0.00 0.00
HT III (A): Industry 43.20 43.14 40.21 40.62 32.13 33.40 41.52 39.56 44.63 44.25 42.92 55.18 500.77
Time of Day Tariffs Peak (6 AM to 10 AM & 6 PM to 10 PM) 37.47 38.95 36.34 35.89 34.29 28.91 39.68 37.84 40.15 37.51 36.14 47.30 450.48
Time of Day Tariffs Off Peak (10 PM to 6 AM) 36.86 38.13 35.37 34.48 32.19 27.52 37.56 35.50 38.02 35.66 34.61 44.83 430.71
Industrial Colonies 0.13 0.13 0.09 0.10 0.09 0.08 0.15 0.23 0.17 0.13 0.15 0.23 1.67
HT III (B): Seasonal Industries 0.26 0.20 0.20 0.18 0.20 0.59 0.78 0.32 0.25 0.27 0.20 0.34 3.80
HT III (C): Energy Intensive Industries 0.15 0.18 0.16 0.15 0.16 0.16 0.19 0.18 0.18 0.14 0.13 0.18 1.95
HT IV (B): CPWS / PWS Scheme 3.88 3.71 3.48 3.63 4.23 3.85 4.28 4.18 4.32 4.07 3.65 3.92 47.20
HT IV (E): Religious Places 1.10 1.25 0.69 0.62 0.66 0.57 0.64 0.58 0.57 0.48 0.55 0.72 8.43
HT IV (F) : Railway Traction 0.00 0.00 0.00 0.00 0.00 0.00 0.00 0.00 0.00 0.00 0.00 0.00 0.00
HT V (C) : Aquaculture and Animal Husbandry 3.97 3.36 3.89 3.74 3.80 3.85 4.33 5.67 2.92 2.39 2.27 3.97 44.16
HT V (D) : Poultry Hatcheries and Poultry Feed Mixing Plants 5.18 4.08 5.71 5.89 6.34 6.08 6.27 6.09 7.69 7.86 7.36 8.69 77.25
HT V (F) : Government / Pvt. LIS 1.44 0.74 0.80 1.09 3.67 4.60 10.19 11.37 8.48 7.26 4.07 2.94 56.65
HT Temporary supply 0.00 0.00 0.00 0.00 0.00 0.00 0.28 0.21 0.18 0.15 0.15 0.14 1.10
RESCOs 48.07 40.86 43.30 39.87 37.77 33.03 45.07 37.64 39.89 46.66 44.59 55.53 512.27
0.00
HT Category at 33 KV 322.53 340.79 314.75 319.36 293.53 297.33 379.55 351.23 374.83 346.36 333.53 412.90 4086.69
HT I (B): Townships & Residential Colonies 0.40 0.14 -0.15 0.41 0.39 0.38 0.29 0.26 0.25 0.22 0.24 0.33 3.16
HT II (A) : Commercial 5.83 6.87 6.26 6.53 8.13 8.19 6.77 6.73 6.55 6.51 6.76 8.22 83.35
Time of Day Tariffs (6 PM to 10 PM) 1.43 1.73 1.57 1.48 2.22 1.96 2.02 1.89 1.99 2.01 2.06 2.51 22.86
HT II (B) : Public Infrastructure and Tourism 0.79 0.98 0.92 0.77 1.58 0.93 0.64 0.67 0.64 0.51 0.57 0.91 9.91
Time of Day Tariffs (6 PM to 10 PM) 0.00 0.00 0.00 0.00 0.00 0.00 0.05 0.06 0.05 0.04 0.04 0.07 0.32
HT II (D) : Function Halls / Auditoriums / Start up Power 1.99 1.80 0.83 0.54 0.66 2.40 0.99 0.59 0.60 1.52 0.89 1.57 14.37
HT II (E): Electric Vehicles (Evs) / Charging stations 0.00 0.00 0.00 0.00 0.00 0.00 0.00 0.00 0.00 0.00 0.00 0.00 0.00
HT II (F) : Green Power 0.01 0.01 0.01 0.01 0.01 0.01 0.01 0.01 0.01 0.01 0.01 0.01 0.10
HT III (A): Industry 100.29 102.23 92.81 94.29 84.68 82.34 101.51 95.21 118.36 111.61 109.93 130.55 1223.80
Time of Day Tariffs Peak (6 AM to 10 AM & 6 PM to 10 PM) 85.89 91.61 86.93 88.52 77.47 77.13 99.10 91.86 93.54 87.91 85.07 106.80 1071.82
Time of Day Tariffs Off Peak (10 PM to 6 AM) 86.24 91.79 88.71 91.04 80.02 79.28 101.18 94.65 96.44 89.84 86.22 108.29 1093.70
Industrial Colonies 0.93 0.99 1.08 0.85 0.81 0.89 0.98 0.84 0.72 0.61 0.69 0.95 10.34
HT III (B): Seasonal Industries 0.00 0.04 0.03 0.10 0.08 0.07 0.24 0.02 0.02 0.08 0.00 0.00 0.67
HT III (C): Energy Intensive Industries 17.95 18.13 15.17 14.82 11.02 10.19 20.37 18.86 18.15 16.42 14.88 19.37 195.32
HT IV (B): CPWS / PWS Scheme 5.51 4.89 4.77 5.04 5.00 4.08 4.43 4.71 6.44 5.17 4.93 5.08 60.06
HT IV (E): Religious Places 3.30 3.74 2.71 1.82 1.74 2.21 3.02 2.64 2.96 3.11 2.79 3.41 33.47
HT IV (F) : Railway Traction 0.00 0.00 0.00 0.00 0.00 0.00 0.00 0.00 0.00 0.00 0.00 0.00 0.00

Sales / Forecast Sales (MU) D Link Apr May Jun Jul Aug Sep Oct Nov Dec Jan Feb Mar Total
HT V (C) : Aquaculture and Animal Husbandry 0.00 0.00 0.00 0.00 0.00 0.00 0.00 0.00 0.00 0.00 0.00 0.00 0.00
HT V (D) : Poultry Hatcheries and Poultry Feed Mixing Plants 10.18 9.19 12.61 12.47 12.20 12.48 15.82 14.12 12.36 12.54 12.80 16.85 153.61
HT V (F) : Government / Pvt. LIS 1.77 6.65 0.49 0.68 7.51 14.81 22.13 18.13 15.78 8.25 5.65 7.99 109.83
HT Temporary supply 0.00 0.00 0.00 0.00 0.00 0.00 0.00 0.00 0.00 0.00 0.00 0.00 0.00
RESCOs 0.00 0.00 0.00 0.00 0.00 0.00 0.00 0.00 0.00 0.00 0.00 0.00 0.00
0.00
HT Category at 132 KV 337.96 319.93 301.56 302.81 408.18 471.52 597.24 535.95 522.81 455.31 406.44 411.00 5070.70
HT I (B): Townships & Residential Colonies 0.00 0.00 0.00 0.00 0.00 0.00 0.00 0.00 0.00 0.00 0.00 0.00 0.00
HT II (A) : Commercial 2.16 2.53 2.53 2.46 2.91 3.20 2.41 2.30 2.49 2.72 2.41 2.71 30.82
Time of Day Tariffs (6 PM to 10 PM) 0.48 0.56 0.51 0.50 0.61 0.67 0.54 0.55 0.57 0.65 0.54 0.63 6.82
HT II (B) : Public Infrastructure and Tourism 0.00 0.00 0.00 0.00 0.00 0.00 0.00 0.00 0.00 0.00 0.00 0.00 0.00
Time of Day Tariffs (6 PM to 10 PM) 0.00 0.00 0.00 0.00 0.00 0.00 0.00 0.00 0.00 0.00 0.00 0.00 0.00
HT II (D) : Function Halls / Auditoriums / Start up Power 0.34 0.37 0.26 0.24 0.32 0.53 0.14 0.10 0.09 0.18 0.13 0.19 2.90
HT II (E): Electric Vehicles (Evs) / Charging stations 0.00 0.00 0.00 0.00 0.00 0.00 0.00 0.00 0.00 0.00 0.00 0.00 0.00
HT II (F) : Green Power 0.00 0.00 0.00 0.00 0.00 0.00 0.00 0.00 0.00 0.00 0.00 0.00 0.00
HT III (A): Industry 75.82 82.42 74.94 75.60 69.29 62.79 81.69 73.57 74.42 74.12 73.95 68.20 886.81
Time of Day Tariffs Peak (6 AM to 10 AM & 6 PM to 10 PM) 69.11 74.93 67.58 67.00 60.47 55.30 75.30 69.35 71.49 72.27 63.92 61.11 807.83
Time of Day Tariffs Off Peak (10 PM to 6 AM) 74.34 79.66 72.03 72.29 64.62 58.04 81.95 73.43 76.71 76.85 68.49 64.50 862.91
Industrial Colonies 1.34 1.43 1.44 1.14 0.96 0.94 1.17 1.02 0.97 0.85 0.91 1.24 13.42
HT III (B): Seasonal Industries 0.00 0.00 0.00 0.00 0.00 0.00 0.00 0.00 0.00 0.00 0.00 0.00 0.00
HT III (C): Energy Intensive Industries 7.25 7.31 6.88 6.33 5.39 3.96 7.46 6.69 6.77 6.18 5.84 7.30 77.36
HT IV (B): CPWS / PWS Scheme 0.00 0.00 0.00 0.00 0.00 0.00 0.00 0.00 0.00 0.00 0.00 0.00 0.00
HT IV (E): Religious Places 0.00 0.00 0.00 0.00 0.00 0.00 0.00 0.00 0.00 0.00 0.00 0.00 0.00
HT IV (F) : Railway Traction 65.44 69.71 74.00 76.11 80.75 69.08 80.57 73.00 73.84 67.79 66.17 71.05 867.50
HT V (C) : Aquaculture and Animal Husbandry 0.00 0.00 0.00 0.00 0.00 0.00 0.00 0.00 0.00 0.00 0.00 0.00 0.00
HT V (D) : Poultry Hatcheries and Poultry Feed Mixing Plants 0.00 0.00 0.00 0.00 0.00 0.00 0.00 0.00 0.00 0.00 0.00 0.00 0.00
HT V (F) : Government / Pvt. LIS 41.67 1.01 1.40 1.14 122.85 217.01 266.00 235.93 215.45 153.70 124.08 134.07 1514.32
HT Temporary supply 0.00 0.00 0.00 0.00 0.00 0.00 0.00 0.00 0.00 0.00 0.00 0.00 0.00
RESCOs 0.00 0.00 0.00 0.00 0.00 0.00 0.00 0.00 0.00 0.00 0.00 0.00 0.00
0.00
Total 3195.65 3425.54 3194.71 3005.36 2980.47 2938.12 3625.16 3315.20 3152.50 3100.73 3058.41 3801.97 38793.83

Form 4
Total Sales, MU 36762.01 38793.83 0.00 0.00 0.00
Sales ( LT, 11kV, 33kV) (MU) Form 3 31935.69 33723.13 0.00 0.00 0.00
EHT Sales (MU) Form 3 4826.32 5070.70 0.00 0.00 0.00
Total Losses, MU 4623.41 4826.24 0.00 0.00 0.00
Distribution System Losses (MU) Form 4a 3270.10 3443.48 0.00 0.00 0.00
Transmission System Losses (MU) 1353.30 1382.76 0.00 0.00 0.00
Total Losses, (%) 11.17 11.06 0.00 0.00 0.00
Transmission Losses (%) 3.27 3.17 0.00 0.00 0.00
Distribution System Losses(%) Form 4a 9.29 9.26 0.00 0.00 0.00
Input to Distribution System 35205.79 37166.61 0.00 0.00 0.00
Power Purchase Requirement (MU) 41385.41 43620.07 0.00 0.00 0.00
Availability Form 4.1 41405.80 43644.53 0.00 0.00 0.00
Dispatch Form 4.2 41342.66 43618.72
Surplus /(deficit) 20.39 24.46 0.00 0.00 0.00
Power Purchase Requirement
Particulars Detail Links 2019-20 2020-21 2021-22 2022-23 2023-24
Form ANew Consumer Categories
Notes:
1 Add any proposed category here, in the tables provided under corresponding voltage levels.
2 Select the category which is being modified/replaced in the EXISTING CATEGORY Field.
3 Provide the name of the proposed category in the PROPOSED CATEGORY Field
4 Modifications of Slabs/SubCategories should be done in the Form 7/ Form 12. See the notes in the corresponding Forms for detailed instructions
For LT Category For HT Category - 11kV
For HT Category - 33kV For HT Category - 132kV
Modification/Replacement of existing
CategoryExisting Category Proposed Category
Existing Category Proposed CategoryModification/Replacement of existing
CategoryRemarks
RemarksRemarksModification/Replacement of existing
CategoryProposed CategoryExisting Category
Proposed CategoryRemarksModification/Replacement of existing
CategoryExisting Category
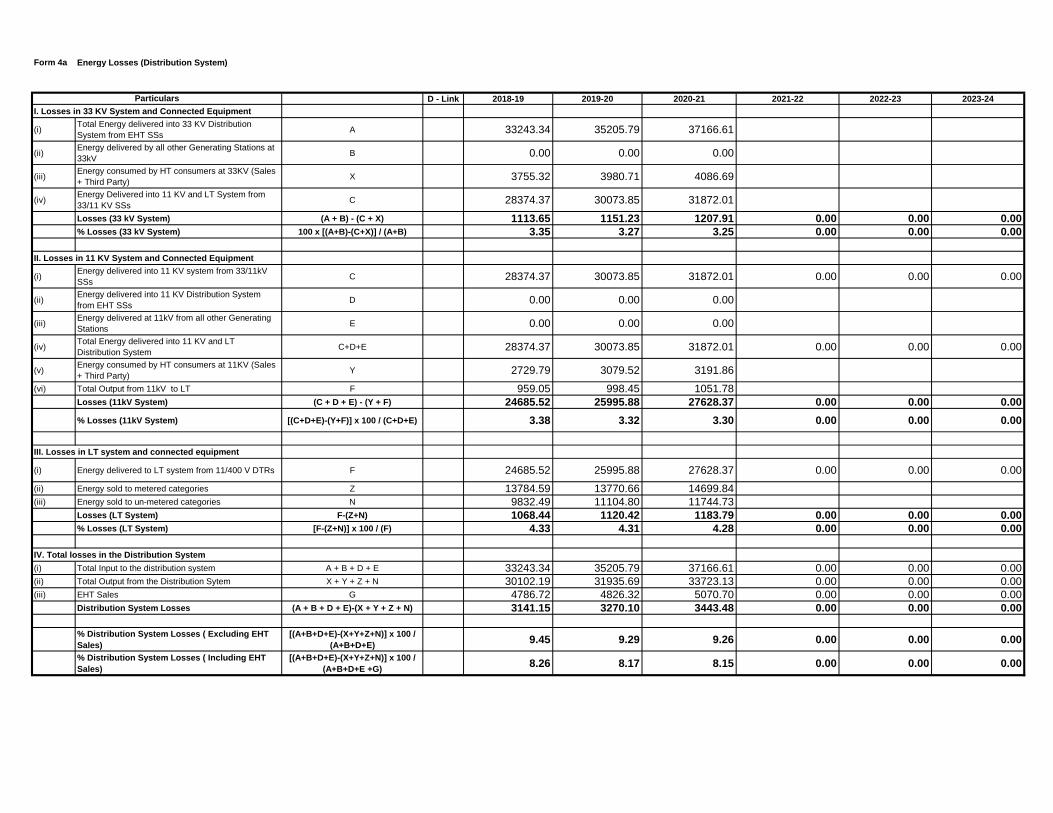
Form 4a Energy Losses (Distribution System)
D - Link 2018-19 2019-20 2020-21 2021-22 2022-23 2023-24
I. Losses in 33 KV System and Connected Equipment
(i)Total Energy delivered into 33 KV Distribution
System from EHT SSsA 33243.34 35205.79 37166.61
(ii)Energy delivered by all other Generating Stations at
33kV B 0.00 0.00 0.00
(iii)Energy consumed by HT consumers at 33KV (Sales
+ Third Party)X 3755.32 3980.71 4086.69
(iv)Energy Delivered into 11 KV and LT System from
33/11 KV SSs C 28374.37 30073.85 31872.01
Losses (33 kV System) (A + B) - (C + X) 1113.65 1151.23 1207.91 0.00 0.00 0.00% Losses (33 kV System) 100 x [(A+B)-(C+X)] / (A+B) 3.35 3.27 3.25 0.00 0.00 0.00
II. Losses in 11 KV System and Connected Equipment
(i)Energy delivered into 11 KV system from 33/11kV
SSsC 28374.37 30073.85 31872.01 0.00 0.00 0.00
(ii)Energy delivered into 11 KV Distribution System
from EHT SSsD 0.00 0.00 0.00
(iii)Energy delivered at 11kV from all other Generating
StationsE 0.00 0.00 0.00
(iv)Total Energy delivered into 11 KV and LT
Distribution SystemC+D+E 28374.37 30073.85 31872.01 0.00 0.00 0.00
(v)Energy consumed by HT consumers at 11KV (Sales
+ Third Party)Y 2729.79 3079.52 3191.86
(vi) Total Output from 11kV to LT F 959.05 998.45 1051.78
Losses (11kV System) (C + D + E) - (Y + F) 24685.52 25995.88 27628.37 0.00 0.00 0.00
% Losses (11kV System) [(C+D+E)-(Y+F)] x 100 / (C+D+E) 3.38 3.32 3.30 0.00 0.00 0.00
III. Losses in LT system and connected equipment
(i) Energy delivered to LT system from 11/400 V DTRs F 24685.52 25995.88 27628.37 0.00 0.00 0.00
(ii) Energy sold to metered categories Z 13784.59 13770.66 14699.84(iii) Energy sold to un-metered categories N 9832.49 11104.80 11744.73
Losses (LT System) F-(Z+N) 1068.44 1120.42 1183.79 0.00 0.00 0.00% Losses (LT System) [F-(Z+N)] x 100 / (F) 4.33 4.31 4.28 0.00 0.00 0.00
IV. Total losses in the Distribution System
(i) Total Input to the distribution system A + B + D + E 33243.34 35205.79 37166.61 0.00 0.00 0.00(ii) Total Output from the Distribution Sytem X + Y + Z + N 30102.19 31935.69 33723.13 0.00 0.00 0.00(iii) EHT Sales G 4786.72 4826.32 5070.70 0.00 0.00 0.00
Distribution System Losses (A + B + D + E)-(X + Y + Z + N) 3141.15 3270.10 3443.48 0.00 0.00 0.00
% Distribution System Losses ( Excluding EHT
Sales)
[(A+B+D+E)-(X+Y+Z+N)] x 100 /
(A+B+D+E)9.45 9.29 9.26 0.00 0.00 0.00
% Distribution System Losses ( Including EHT
Sales)
[(A+B+D+E)-(X+Y+Z+N)] x 100 /
(A+B+D+E +G)8.26 8.17 8.15 0.00 0.00 0.00
Particulars

Total Transmission Losses (Inclusive of PGCIL) (%)
Input to APTransco Network (MU)
APTransco Losses (%) 3.17 3.17
APTransco Losses (MU)
Input to PGCIL (For CGS) (MU)
PGCIL Losses (%) (For CGS) 3.17 3.17
PGCIL Losses (MU) (For CGS)
Particulars 2019-20 2020-21 2021-22
Relates to detailed calculation of the Transmission Losses percentage entered in Form 4. The working
of the losses (MU & percentages) to be entered under working notes Form 4b.
2022-23 2023-24
Form 4B - Transmission Losses

Form 4.1 (2019-20)
April May June July August September October November December January February March Total
APGENCO-THERMAL
VTPS I 3.34 160.77 164.05 153.45 140.92 139.63 109.46 149.54 144.75 113.65 149.54 139.97 149.54 1715.25 1715.25
VTPS II 3.34 160.77 164.05 153.45 140.92 139.63 109.46 113.36 108.26 149.54 144.75 139.97 149.54 1673.69 1673.69
VTPS III 3.34 160.77 164.05 153.45 140.92 139.63 109.46 149.54 108.26 149.54 120.82 130.40 149.54 1676.37 1676.37
VTPS IV 3.15 197.71 170.41 187.08 175.70 178.68 151.96 181.18 175.10 181.18 181.18 128.29 181.18 2089.68 2089.68
RTPP I 3.86 170.41 158.72 131.38 116.51 68.16 77.43 156.12 151.09 156.12 156.12 145.95 156.12 1644.11 1644.11
RTPP Stage-II 3.86 134.92 146.89 138.46 148.18 126.32 139.72 159.82 154.62 120.11 159.82 149.48 159.82 1738.17 1738.17
RTPP Stage-III 3.86 57.46 78.93 63.85 57.46 60.92 4.15 40.26 75.55 78.06 78.06 72.97 78.06 745.72 745.72
RTPP IV 3.86 119.96 188.30 106.83 170.39 94.85 132.79 183.88 0.00 183.88 183.88 172.01 183.88 1720.64 1720.64
DSSTPS-I-U I 2.85 470.20 507.58 471.95 426.34 493.79 407.08 329.22 351.05 441.31 621.85 561.67 621.85 5703.89 5703.89
TOTAL HYDRO 130.57 118.19 113.82 111.38 287.80 313.31 182.81 170.77 151.25 151.90 146.69 146.37 2024.84 0.00 2024.84
TOTAL APGENCO 1763.55 1861.17 1673.72 1628.70 1729.41 1554.83 1645.71 1439.46 1724.62 1947.92 1787.39 1975.88 20732.37 0.00 20732.37
CGS-THERMAL 0.00 0.00
NTPC - Simhadri 0.00 0.00
NTPC Simhadri Stage I 3.38 172.31 119.53 70.87 136.13 73.43 213.43 207.91 201.25 207.91 207.91 194.58 207.91 2013.19 2013.19
NTPC Simhadri Stage II 3.34 52.76 62.41 49.39 78.98 52.04 79.32 85.27 48.85 69.85 85.27 79.80 85.27 829.21 829.21
Total NTPC- Simhadri 225.08 181.95 120.26 215.11 125.48 292.75 293.18 250.09 277.77 293.18 274.38 293.18 2842.40 0.00 2842.40
NTPC (SR) 0.00 0.00
NTPC (SR)-Ramagundam Stage1&2 2.77 104.02 105.82 90.05 112.14 98.09 125.77 117.75 103.45 99.88 122.45 110.65 110.79 1300.84 1300.84
NTPC (SR)-Ramagundam Stage 3 2.73 29.36 26.97 25.97 31.98 26.95 35.39 31.10 30.10 31.10 31.10 29.10 31.10 360.22 360.22
Total NTPC(SR) 133.38 132.79 116.03 144.12 125.03 161.15 148.85 133.55 130.98 153.55 139.75 141.89 1661.06 0.00 1661.06
NTPC (ER) 0.00 0.00
Talcher Stage 2 2.39 71.35 66.91 56.21 57.63 31.73 38.18 71.08 68.79 71.08 71.08 66.49 71.08 741.60 741.60
Total NTPC(ER) 71.35 66.91 56.21 57.63 31.73 38.18 71.08 68.79 71.08 71.08 66.49 71.08 741.60 0.00 741.60
Total NTPC 429.80 381.64 292.50 416.87 282.24 492.08 513.11 452.43 479.83 517.81 480.62 506.15 5245.06 0.00 5245.06
Vallur Thermal Power Plant 3.78 16.20 20.80 21.35 24.64 14.46 22.12 32.57 39.85 41.13 41.13 38.21 40.72 353.17 353.17
Kudigi 3.98 17.54 32.19 8.00 59.34 100.69 89.59 105.85 103.55 107.00 107.00 100.10 107.00 937.85 937.85
Tuticorin 3.16 21.86 17.42 15.05 26.89 38.99 41.64 43.89 55.93 57.77 57.77 54.01 57.77 488.98 488.98
JNNSM Phase-II 4.21 167.64 127.26 170.63 166.31 168.07 157.80 247.03 223.70 234.37 249.88 231.98 244.52 2389.18 2389.18
NNTPS 2.31 0.00 0.00 0.00 0.00 0.00 0.00 0.66 9.94 10.28 20.55 19.23 20.55 81.22 81.22
TOTAL CGS 772.40 692.54 604.24 805.33 698.97 905.82 1104.38 1040.35 1090.47 1130.79 1063.83 1137.74 11046.87 0.00 11046.87
IPPS-COAL 0.00 0.00
KSK Mahanadi (MT) 2.77 6.63 93.17 50.16 58.19 171.57 21.81 166.27 160.91 166.27 166.27 150.18 166.27 1377.69 1377.69
Thermal Power Tech 2.25 95.48 90.55 98.78 110.20 92.66 99.25 112.75 109.11 112.75 112.75 101.84 112.75 1248.86 1248.86
TOTAL IPPS-COAL 102.12 183.72 148.94 168.39 264.23 121.06 279.02 270.02 279.02 279.02 252.02 279.02 2626.56 0.00 2626.56
IPPS-GAS 0.00 0.00
GGPP 2.70 27.38 25.03 26.67 49.15 57.43 51.57 50.86 49.22 47.40 50.86 47.58 50.86 534.01 534.01
Spectrum Power Generation Limited 2.39 28.25 23.02 31.11 33.30 15.23 49.20 50.98 49.34 50.98 50.98 47.69 50.98 481.06 481.06
APGPCL-I 2.86 1.15 1.09 1.14 1.91 2.26 1.39 1.18 1.04 1.16 1.16 0.82 0.90 15.22 15.22
APGPCL-II 2.85 3.65 3.47 3.63 6.95 8.04 4.66 3.83 3.30 3.70 3.70 2.62 2.86 50.40 50.40
TOTAL IPPS 60.43 52.61 62.55 91.31 82.96 106.82 106.85 102.89 103.24 106.70 98.72 105.60 1080.68 0.00 1080.68
NCE - Bio Mass 8.80 6.44 7.28 3.50 4.67 4.68 0.00 0.00 0.00 0.00 0.00 0.00 35.36 35.36
NCE - Bagasse 4.03 0.93 0.87 0.33 0.00 0.00 6.17 6.17
NCE - Industrial Waste 1.32 0.73 0.58 1.12 0.98 1.20 5.92 5.92
NCE - Wind Power 274.46 395.48 715.72 907.96 886.68 353.22 3533.51 3533.51
NCE - Mini Hydel 0.92 0.97 0.85 0.80 6.97 6.88 17.40 17.40
NCE - SOLAR Power (Without Bundled) 129.75 129.53 116.00 123.74 88.66 91.02 678.69 678.69
NVVNL Bumdled Power - SOALR 4.92 3.59 2.79 1.07 0.49 0.93 13.80 13.80
NTPC Ramagundam Solar Power 0.00 0.00 0.00 0.00 0.00 0.00 0.00 0.00
NTPC NPKunta Ultra Mega Solar PVP 22.92 22.54 20.86 19.10 17.08 17.33 119.82 119.82
NTPC NVVNL NSM Phase-II, Batch-II, Trench-I Bundled Power -SOLAR POWER (*) 157.66 131.69 160.10 125.78 90.14 109.29 774.67 774.67
Srivathsa (Exclusive EPDCL) 1.89 1.96 1.96 0.67 0.01 0.00 6.49 6.49
Hinduja National Power Corp Ltd(HNPCL) 95.48 90.55 98.78 110.20 92.66 99.25 586.93 586.93
Other Renewable Energy 18.52 20.27 25.49 29.04 25.50 21.75 140.57 140.57
TOTAL (From All Sources) 3400.6 3574.4 3615.2 3988.0 3963.9 3372.3 3154.5 2873.0 3222.8 3493.5 3227.5 3520.0 41405.8 0.0 41405.8
Variable Cost
(Rs. / kWh)
Gross Energy Availability (MU)Yearly Auxiliary
Consumption
(MU)
Net Energy
Availability
(MU)
Generating Station D LinkPLF
(%)

April May June July August September October November December January February March Total
Variable Cost
(Rs. / kWh)
Gross Energy Availability (MU)Yearly Auxiliary
Consumption
(MU)
Net Energy
Availability
(MU)
Generating Station D LinkPLF
(%)
2020-21
April May June July August September October November December January February March Total
APGENCO-THERMAL
VTPS I 53% 3.67 151.12 156.16 151.12 115.80 156.16 151.12 156.16 151.12 118.43 156.16 141.05 156.16 1760.55 1760.55
VTPS II 53% 3.67 151.12 156.16 151.12 118.55 156.16 151.12 115.80 151.12 156.16 156.16 141.05 156.16 1760.67 1760.67
VTPS III 53% 3.67 150.69 155.71 150.69 155.71 155.71 150.69 155.71 113.07 155.71 125.62 135.63 155.71 1760.66 1760.66
VTPS IV 53% 3.46 190.79 197.15 0.00 197.15 197.15 190.79 197.15 190.79 197.15 197.15 178.07 197.15 2130.44 2130.44
VTPS V 44% 3.15 0.00 0.00 0.00 0.00 0.00 0.00 177.94 183.88 177.94 312.59 312.59 302.51 1467.45 1467.45
RTPP I 53% 4.25 150.90 155.93 150.90 155.93 118.21 113.18 155.93 150.90 155.93 155.93 140.84 155.93 1760.55 1760.55
RTPP Stage-II 53% 4.25 158.24 163.51 158.24 77.97 122.12 158.24 163.51 158.24 125.79 163.51 147.69 163.51 1760.55 1760.55
RTPP Stage-III 53% 4.25 72.35 78.06 75.55 78.06 78.06 75.55 40.26 75.55 78.06 78.06 72.97 78.06 880.56 880.56
RTPP IV 53% 3.86 232.66 240.41 232.66 240.41 240.41 232.66 240.41 0.00 240.41 240.41 217.15 240.41 2597.99 2597.99
Damodaram Sanjeevaiah Thermal power plant - I 53% 3.14 580.55 610.88 594.71 614.54 614.54 580.55 607.22 451.34 469.52 614.54 541.85 614.54 6894.77 6894.77
Damodaram Sanjeevaiah Thermal power plant - II 49% 3.14 0.00 0.00 0.00 0.00 0.00 0.00 177.00 292.64 292.64 283.20 292.64 283.20 1621.30 1621.30
TOTAL THERMAL 1838.42 1913.97 1664.98 1754.11 1838.51 1803.88 2187.09 1918.64 2167.73 2483.31 2321.51 2503.33 24395.48 24395.48
APGENCO-HYDEL
MACHKUND PH AP Share 26% 0.00 16.14 16.99 14.24 16.30 17.14 15.43 16.16 15.19 15.58 16.98 16.24 17.16 193.54 193.54
TUNGBHADRA PH AP Share 16% 0.00 1.73 0.32 0.02 3.25 12.13 13.63 11.82 10.54 7.27 8.22 5.95 5.87 80.75 80.75
Upper Sileru Power House (AP) 13% 0.00 25.59 19.28 16.10 20.54 17.72 19.22 21.98 17.30 18.31 30.86 33.09 41.44 281.45 281.45
Lower Sileru Power House (AP) 17% 0.00 60.84 44.18 37.61 54.96 56.24 58.06 60.41 50.37 54.77 67.76 70.16 78.99 694.34 694.34
DONKARAYI (AP) 29% 0.00 4.72 4.06 2.64 4.37 4.24 5.55 6.52 5.27 5.54 6.28 6.62 7.28 63.11 63.11
Srisailam Right Bank Power House (AP) 9% 0.00 29.26 10.01 8.50 13.55 149.22 154.94 75.54 27.34 15.05 31.06 45.72 50.76 610.95 610.95
Nagarjunasagar Right Bank Power House (AP) 9% 0.00 1.19 0.00 0.00 0.05 6.07 14.46 15.92 14.88 9.94 6.99 2.73 1.91 74.15 74.15
Penna Ahobilam (AP) 2% 0.00 0.02 0.02 0.00 0.05 0.65 0.63 0.79 0.46 0.44 0.27 0.20 0.16 3.70 3.70
MINI HYDEL(Chettipeta)-AP 20% 0.00 0.08 0.00 0.04 0.25 0.20 0.21 0.05 0.03 0.18 0.25 0.18 0.24 1.72 1.72
Nagarjunasagar Tail Pond Dam Power House 13% 0.00 0.65 0.65 0.65 2.60 5.21 8.46 8.46 10.41 10.41 5.86 2.60 2.60 58.57 58.57
TOTAL HYDRO 140.23 95.51 79.81 115.91 268.82 290.60 217.65 151.78 137.50 174.53 183.51 206.43 2062.28 2062.28
TOTAL APGENCO 1978.65 2009.47 1744.80 1870.03 2107.33 2094.48 2404.74 2070.42 2305.23 2657.84 2505.02 2709.75 26457.76 26457.76
CGS-THERMAL
NTPC - Simhadri
NTPC Simhadri Stage I 93.78% 3.72 201.25 207.91 201.25 207.91 207.91 201.25 207.91 201.25 106.68 207.91 187.61 207.91 2346.76 2346.76
NTPC Simhadri Stage II 91.70% 3.67 82.53 85.27 82.53 75.45 42.38 72.34 85.27 82.53 85.27 85.27 76.94 85.27 941.04 941.04
Total NTPC- Simhadri 283.78 293.18 283.78 283.36 250.30 273.59 293.18 283.78 191.95 293.18 264.55 293.18 3287.80 3287.80
NTPC (SR)
NTPC (SR)-Ramagundam Stage1&2 88.40% 3.05 107.21 110.79 97.62 109.47 110.79 107.21 106.08 96.49 122.45 122.45 114.55 122.45 1327.56 1327.56
NTPC (SR)-Ramagundam Stage 3 94.95% 3.01 30.10 31.10 30.10 31.10 31.10 30.10 31.10 30.10 26.09 31.10 29.10 31.10 362.18 362.18
Total NTPC(SR) 137.31 141.89 127.72 140.57 141.89 137.31 137.19 126.59 148.53 153.55 143.64 153.55 1689.74 1689.74
NTPC (ER)
Talcher Stage 2 84.97% 2.63 71.03 69.62 55.26 67.99 67.99 48.93 58.20 70.28 72.62 72.62 65.60 72.62 792.77 792.77
Total NTPC(ER) 71.03 69.62 55.26 67.99 67.99 48.93 58.20 70.28 72.62 72.62 65.60 72.62 792.77 792.77
Total NTPC 492.12 504.69 466.76 491.92 460.18 459.82 488.57 480.65 413.11 519.36 473.79 519.36 5770.31 5770.31
NLC TS-II
Stage-I 69.20% 2.91 14.60 15.07 14.60 15.07 15.07 14.60 15.07 14.60 15.07 15.07 14.08 15.07 177.95 177.95
Stage-II 70.76% 2.91 26.81 27.72 26.81 27.72 27.72 26.81 27.72 26.81 27.72 27.72 25.90 27.72 327.17 327.17
Total NLC 41.41 42.78 41.41 42.78 42.78 41.41 42.78 41.41 42.78 42.78 39.99 42.78 505.12 505.12
NPC
NPC-MAPS 28.73% 3.07 2.61 2.72 2.61 2.72 2.72 2.61 2.72 2.61 2.72 0.00 0.96 2.72 27.74 27.74
NPC-Kaiga unit I&ii 89.11% 4.01 22.69 23.37 22.69 23.37 23.37 22.69 23.37 22.69 23.37 23.37 10.51 16.89 258.37 258.37
NPC-Kaiga unit III&IV 85.23% 4.01 24.18 24.90 24.18 24.90 24.90 24.18 24.90 24.18 24.90 12.45 11.19 18.45 263.30 263.30
Total NPC 49.49 50.98 49.49 50.98 50.98 49.49 50.98 49.49 50.98 35.81 22.66 38.06 549.40 549.40
CGS - New
Bundled power under JVNSM 86.88% 4.96 15.82 16.25 15.02 13.87 14.00 14.97 15.77 15.34 14.64 15.93 15.40 16.82 183.84 183.84
Vallur Thermal Power Plant 82.32% 4.15 39.03 40.35 33.80 26.60 34.01 38.41 37.51 38.62 39.90 39.90 37.34 39.90 445.35 445.35
Kudigi 82.60% 4.38 103.55 107.00 103.55 71.33 90.89 103.55 107.00 103.55 71.33 90.89 96.65 107.00 1156.30 1156.30
Tuticorin 86.00% 3.48 52.84 54.59 52.84 40.46 51.08 33.44 42.97 52.59 54.34 54.59 49.33 54.59 593.66 593.66
JNNSM Phase-II 90.66% 4.47 247.29 254.52 238.66 228.85 230.17 237.99 249.30 242.15 237.10 251.04 237.70 260.69 2915.46 2915.46
NNTPS 85.00% 2.54 19.89 20.55 19.89 20.55 20.55 19.89 20.55 19.89 20.55 20.55 18.56 20.55 241.99 241.99
TOTAL CGS 1061.43 1091.72 1021.42 987.36 994.65 998.97 1055.44 1043.68 944.74 1070.86 991.41 1099.75 12361.43 12361.43
IPPS-COAL
KSK Mahanadi (MT) 85% 2.96 160.91 166.27 160.91 166.27 166.27 160.91 166.27 160.91 166.27 166.27 150.18 166.27 1957.70 1957.70
Thermal Power Tech 94.6% 2.43 109.11 112.75 78.99 75.10 112.75 109.11 112.75 109.11 112.75 112.75 101.84 112.75 1259.74 1259.74
TOTAL IPPS-COAL 270.02 279.02 239.90 241.37 279.02 270.02 279.02 270.02 279.02 279.02 252.02 279.02 3217.44 3217.44
IPPS-GAS
GGPP 43.5% 2.84 49.17 50.81 49.17 50.81 50.81 49.17 0.00 24.59 50.81 50.81 45.89 50.81 522.87 522.87
Spectrum Power Generation Limited 43.4% 2.39 62.70 62.96 63.03 18.08 63.47 63.44 75.34 74.49 75.19 75.46 69.85 75.27 779.29 779.29
APGPCL-I 16.7% 2.85 1.14 1.16 1.12 1.16 1.12 1.12 1.12 1.16 1.16 1.16 1.05 1.14 13.62 13.62
APGPCL-II 19.9% 2.85 3.64 3.70 3.58 3.70 3.70 3.58 3.58 3.58 3.70 3.70 3.34 3.64 43.42 43.42
TOTAL IPPS 116.65 118.63 116.90 73.75 119.10 117.31 80.04 103.81 130.86 131.13 120.13 130.87 1359.20 1359.20
Other RE 5.38 17.79 16.22 16.50 14.50 22.48 20.64 18.52 20.27 25.49 29.04 25.50 21.75 248.70 248.70
TOTAL (From All Sources) 3444.53 3515.06 3139.52 3187.01 3522.58 3501.42 3837.76 3508.21 3685.33 4167.89 3894.08 4241.14 43644.53 43644.53
Variable Cost
(Rs. / kWh)
Gross Energy Availability (MU) Yearly Auxiliary
Consumption
(MU)
Net Energy
Availability
(MU)
Generating Station D LinkPLF
(%)

Form 4.2 (2019-20)
April May June July August September October November December January February March Total
AP GENCO Thermal
Dr.NTTPS Unit I,II,III (AP) 414.34 440.28 412.79 393.69 378.53 321.49 412.43 361.28 412.72 415.11 410.33 448.61 4821.59
Dr.NTTPS IV (AP) 197.71 170.41 187.08 175.70 178.68 151.96 181.18 175.10 181.18 181.18 128.29 181.18 2089.68
RTPP Stage-I (AP) 127.64 134.24 112.97 102.60 54.55 63.82 156.12 151.09 156.12 156.12 145.95 156.12 1517.32
RTPP Stage-II (AP) 124.35 138.18 138.46 139.46 126.32 139.72 159.82 154.62 120.11 159.82 149.48 159.82 1710.17
RTPP Stage-III (AP) 46.89 70.21 63.85 48.75 60.92 4.15 40.26 75.55 78.06 78.06 72.97 78.06 717.72
RTPP Stage-IV (AP) 109.39 179.58 106.83 161.68 94.85 132.79 183.88 0.00 183.88 183.88 172.01 183.88 1692.65
Damodaram Sanjeevaiah Thermal power plant-I & II424.32 484.42 423.44 407.93 453.03 388.67 329.22 351.05 441.31 621.85 561.67 621.85 5508.77
TOTAL AP GENCO THERMAL 1444.65 1617.33 1445.42 1429.81 1346.89 1202.61 1462.90 1268.68 1573.37 1796.02 1640.70 1829.52 18057.91
AP GENCO TB Dam 0.84 -0.10 -0.20 -0.10 11.48 17.03 7.81 7.81 7.81 7.81 7.81 7.81 75.80
TOTAL HYDRO 130.57 118.19 113.82 111.38 287.80 313.31 182.81 170.77 151.25 151.90 146.69 146.37 2024.84
TOTAL GENCO 1575.22 1735.52 1559.24 1541.18 1634.69 1515.92 1645.71 1439.46 1724.62 1947.92 1787.39 1975.88 20082.75
0.00
Central Generating Stations 0.00
NTPC 0.00
NTPC (SR) 0.00
NTPC (SR)-Ramagundam Stage1&2 104.02 105.82 90.05 112.14 98.09 125.77 117.75 103.45 99.88 122.45 110.65 110.79 1300.84
NTPC (SR)-Ramagundam Stage 3 29.36 26.97 25.97 31.98 26.95 35.39 31.10 30.10 31.10 31.10 29.10 31.10 360.22
Total NTPC(SR) 133.38 132.79 116.03 144.12 125.03 161.15 148.85 133.55 130.98 153.55 139.75 141.89 1661.06
0.00
NTPC (ER) 0.00
Talcher Stage 2 71.35 66.91 56.21 57.63 31.73 38.18 71.08 68.79 71.08 71.08 66.49 71.08 741.60
Total NTPC(ER) 71.35 66.91 56.21 57.63 31.73 38.18 71.08 68.79 71.08 71.08 66.49 71.08 741.60
Total NTPC 204.72 199.70 172.24 201.75 156.76 199.33 219.93 202.34 202.06 224.63 206.24 212.97 2402.66
NTPC Simhadri Stage II 52.76 62.41 49.39 78.98 52.04 79.32 85.27 48.85 69.85 85.27 79.80 85.27 829.21
Total NTPC- Simhadri 225.08 181.95 120.26 215.11 125.48 292.75 293.18 250.09 277.77 293.18 274.38 293.18 2842.40
0.00
CGS - New & Bundled Power Coal 0.00
NTECL Vallur Thermal Power Plant 16.20 20.80 21.35 24.64 14.46 22.12 32.57 39.85 41.13 41.13 38.21 40.72 353.17
NLC Tamilnadu Power Ltd St.1 (NTPL) 21.86 17.42 15.05 26.89 38.99 41.64 43.89 55.93 57.77 57.77 54.01 57.77 488.98
NTPC KUDGI Thermal (New Project) 17.54 32.19 8.00 59.34 100.69 89.59 105.85 103.55 107.00 56.13 100.10 107.00 886.97
NVVNL Bundled Power JNNSM Ph-1-
COAL 11.63 11.02 10.20 9.73 9.40 7.92 16.52 14.57 15.35 16.78 15.54 16.29 154.95
NVVNL Bundled power NSM-II Ph-2 167.64 127.26 170.63 166.31 168.07 157.80 247.03 223.70 234.37 249.88 231.98 244.52 2389.18
New Neyveli Thermal power station
(NNTPS) 0.00 0.00 0.00 0.00 0.00 0.00 0.66 9.94 10.28 20.55 19.23 20.55 81.22
NTPC additional 1000MW (Only for Sep'19) 0.00 0.00 0.00 0.00 0.00 209.64 0.00 0.00 0.00 0.00 0.00 0.00 209.64
TOTAL CGS 772.40 692.54 604.24 805.33 698.97 1115.46 1053.40 990.87 1039.49 1041.38 1021.74 1086.76 10922.58
0.00
APGPCL 0.00
APGPCL I - Allocated capacity 1.15 1.09 1.14 1.91 2.26 1.39 1.18 1.04 1.16 1.16 0.82 0.90 15.22
APGPCL II - Allocated capacity 3.65 3.47 3.63 6.95 8.04 4.66 3.83 3.30 3.70 3.70 2.62 2.86 50.40
Total APGPCL 4.80 4.56 4.77 8.86 10.30 6.05 5.01 4.33 4.86 4.86 3.44 3.76 65.61
0.00
IPPs-Gas 0.00
Godavari Gas Power Plant 27.38 25.03 26.67 49.15 57.43 51.57 50.86 49.22 47.40 50.86 47.58 50.86 534.01
Spectrum Power 28.25 23.02 31.11 33.30 15.23 49.20 50.98 49.34 50.98 50.98 47.69 50.98 481.06
LANCO Kondapalli 57.91 58.79 49.12 15.93 0.00 5.49 0.00 0.00 0.00 0.00 0.00 0.00 187.23
TOTAL IPPS 113.54 106.84 106.90 98.38 72.66 106.26 101.84 98.56 98.38 101.84 95.27 101.84 1202.30
0.00
NCE 0.00
NCE - Bio Mass 8.80 6.44 7.28 3.50 4.67 4.68 0.00 0.00 0.00 0.00 0.00 0.00 35.36
NCE - Industrial Waste 1.32 0.73 0.58 1.12 0.98 1.20 0.00 0.00 0.00 0.00 0.00 0.00 5.92
NCE - Wind Power 274.46 395.48 715.72 907.96 886.68 353.22 0.00 0.00 0.00 0.00 0.00 0.00 3533.51
NCE - Mini Hydel 0.92 0.97 0.85 0.80 6.97 6.88 0.00 0.00 0.00 0.00 0.00 0.00 17.40
NCE - SOLAR Power (Without Bundled) 129.75 129.53 116.00 123.74 88.66 91.02 0.00 0.00 0.00 0.00 0.00 0.00 678.69
NVVNL Bumdled Power - SOALR 4.92 3.59 2.79 1.07 0.49 0.93 0.00 0.00 0.00 0.00 0.00 0.00 13.80
NTPC Ramagundam Solar Power 0.00 0.00 0.00 0.00 0.00 0.00 0.00 0.00 0.00 0.00 0.00 0.00 0.00
NTPC NPKunta Ultra Mega Solar PVP 22.92 22.54 20.86 19.10 17.08 17.33 0.00 0.00 0.00 0.00 0.00 0.00 119.82
NTPC NVVNL NSM Phase-II, Batch-II, Trench-I
Bundled Power -SOLAR POWER (*) 157.66 131.69 160.10 125.78 90.14 109.29 0.00 0.00 0.00 0.00 0.00 0.00 774.67
TOTAL NCE 600.75 690.96 1024.18 1183.06 1095.67 584.56 0.00 0.00 0.00 0.00 0.00 0.00 5179.18
0.00
IPPs-Others 0.00
Srivathsa (Exclusive EPDCL) 1.89 1.96 1.96 0.67 0.01 0.00 0.00 0.00 0.00 0.00 0.00 0.00 6.49
Thermal Powertech Corporation India 95.48 90.55 98.78 110.20 92.66 99.25 112.75 109.11 112.75 112.75 101.84 112.75 1248.86
Hinduja National Power Corp Ltd(HNPCL) 187.04 182.90 188.14 217.61 43.02 113.26 0.00 0.00 0.00 0.00 0.00 0.00 931.99
Generating Station D Link
Variable
Cost (Rs. /
Energy Dispatch (MU)

April May June July August September October November December January February March TotalGenerating Station D Link
Variable
Cost (Rs. /
Energy Dispatch (MU)
KSK Mahanadi Power Co., Ltd., 6.63 93.17 50.16 58.19 171.57 21.81 166.27 160.91 166.27 166.27 150.18 166.27 1377.69
TOTAL OTHERS 291.05 368.58 339.04 386.68 307.27 234.32 279.02 270.02 279.02 279.02 252.02 279.02 3565.03
0.00
MARKET 0.00
Short Term Purchases (Trading/IEX/PXIL) 10.69 190.24 145.47 182.02 172.71 119.32 0.00 0.00 0.00 0.00 0.00 0.00 820.45
Short Term Purchases (Swap Receipt) 256.35 4.67 0.80 0.95 0.00 6.30 2.77 0.00 0.00 0.00 0.00 0.00 271.84
Short Term Purchases (Swap Return) -37.85 -39.02 -241.33 -866.00 -826.34 -702.74 -1.66 0.00 0.00 0.00 0.00 0.00 -2714.94
Market sources 4.03 77.23 67.37 83.15 158.90 249.71 782.00 814.74 280.21 33.88 248.10 718.78 3518.09
D<>D Transcations -174.70 -172.39 -219.15 -223.72 -153.06 -117.33 -13.13 -93.31 -75.12 -102.01 -138.63 -87.68 -1570.23
TOTAL MARKET 233.22 233.13 -27.69 -599.88 -494.73 -327.41 783.10 814.74 280.21 33.88 248.10 718.78 1895.44
0.00
TOTAL (From All Sources) 3416.26 3659.74 3391.53 3199.89 3171.76 3117.83 3854.95 3524.67 3351.45 3306.88 3269.34 4078.36 41342.66

April May June July August September October November December January February March TotalGenerating Station D Link
Variable
Cost (Rs. /
Energy Dispatch (MU)
2020-21
April May June July August September October November December January February March Total
Spectrum Power Generation Limited 0.00 62.70 62.96 63.03 18.08 63.47 63.44 75.34 74.49 75.19 75.46 69.85 75.27 779.29
Thermal Power Tech 0.00 109.11 112.75 78.99 75.10 112.75 109.11 112.75 109.11 112.75 112.75 101.84 112.75 1259.74
NNTPS 0.00 19.89 20.55 19.89 20.55 20.55 19.89 20.55 19.89 20.55 20.55 18.56 20.55 241.99
Talcher Stage 2 0.00 71.03 69.62 55.26 67.99 67.99 48.93 58.20 70.28 72.62 72.62 65.60 72.62 792.77
Godavari Gas Power Plant 0.00 49.17 50.81 49.17 50.81 50.81 49.17 0.00 24.59 50.81 50.81 45.89 50.81 522.87
APGPCL-I 0.00 1.14 1.16 1.12 1.16 1.12 1.12 1.12 1.16 1.16 1.16 1.05 1.14 13.62
APGPCL-II 0.00 3.64 3.70 3.58 3.70 3.70 3.58 3.58 3.58 3.70 3.70 3.34 3.64 43.42
NLC Stage-II 0.00 26.81 27.72 26.81 27.72 27.72 26.81 27.72 26.81 27.72 27.72 25.90 27.72 327.17
NLC Stage-I 0.00 14.60 15.07 14.60 15.07 15.07 14.60 15.07 14.60 15.07 15.07 14.08 15.07 177.95
KSK Mahanadi (MT) 0.00 160.91 166.27 160.91 166.27 166.27 160.91 166.27 160.91 166.27 166.27 150.18 166.27 1957.70
NTPC (SR)-Ramagundam Stage 3 0.00 30.10 31.10 30.10 31.10 31.10 30.10 31.10 30.10 26.09 31.10 29.10 31.10 362.18
NTPC (SR)-Ramagundam Stage1&2 0.00 107.21 110.79 97.62 109.47 110.79 107.21 106.08 96.49 122.45 122.45 114.55 122.45 1327.56
NPC-MAPS 0.00 2.61 2.72 2.61 2.72 2.72 2.61 2.72 2.61 2.72 0.00 0.96 2.72 27.74
Damodaram Sanjeevaiah Thermal power plant - I 0.00 580.55 610.88 594.71 614.54 614.54 580.55 607.22 451.34 469.52 614.54 541.85 614.54 6894.77
Damodaram Sanjeevaiah Thermal power plant - II 0.00 0.00 0.00 0.00 0.00 0.00 0.00 177.00 292.64 292.64 283.20 292.64 283.20 1621.30
VTPS-V 0.00 0.00 0.00 0.00 0.00 0.00 0.00 177.94 183.88 177.94 312.59 312.59 302.51 1467.45
VTPS IV 0.00 190.79 197.15 0.00 197.15 197.15 190.79 197.15 190.79 197.15 197.15 178.07 197.15 2130.44
NTPL- Tuticorin 0.00 52.84 54.59 52.84 40.46 51.08 33.44 42.97 52.59 54.34 54.59 49.33 54.59 593.66
NTPC Simhadri Stage II 0.00 82.53 85.27 82.53 75.45 42.38 72.34 85.27 82.53 85.27 85.27 76.94 85.27 941.04
VTPS I 0.00 151.12 156.16 151.12 115.80 156.16 151.12 156.16 151.12 118.43 156.16 141.05 156.16 1760.55
VTPS II 0.00 151.12 156.16 151.12 118.55 156.16 151.12 115.80 151.12 156.16 156.16 141.05 156.16 1760.67
VTPS III 0.00 150.69 155.71 150.69 155.71 155.71 150.69 155.71 113.07 155.71 125.62 135.63 155.71 1760.66
NTPC Simhadri Stage I 0.00 201.25 207.91 201.25 207.91 207.91 201.25 207.91 201.25 106.68 207.91 187.61 207.91 2346.76
RTPP IV 0.00 232.66 240.41 232.66 240.41 240.41 232.66 240.41 0.00 240.41 240.41 217.15 240.41 2597.99
NPC-Kaiga unit I&II 0.00 22.69 23.37 22.69 23.37 23.37 22.69 23.37 22.69 23.37 23.37 10.51 16.89 258.37
NPC-Kaiga unit III&IV 0.00 24.18 24.90 24.18 24.90 24.90 24.18 24.90 24.18 24.90 12.45 11.19 18.45 263.30
NTPC NSM Phase-II, Bundled Power (COAL) 0.00 247.29 254.52 238.66 228.85 230.17 237.99 249.30 242.15 193.98 227.45 237.70 260.69 2848.75
NTPC NVVNL Bundled Power (Only COAL) 0.00 15.82 16.25 15.02 13.87 14.00 14.97 15.77 15.34 14.64 15.93 15.40 16.82 183.84
Vallur Thermal Power Plant 0.00 39.03 40.35 33.80 26.60 34.01 38.41 37.51 38.62 39.90 0.00 37.34 39.90 405.46
RTPP I 0.00 150.90 155.93 150.90 155.93 118.21 113.18 155.93 150.90 155.93 0.00 140.84 155.93 1604.62
RTPP Stage-II 0.00 158.24 163.51 158.24 77.97 122.12 158.24 163.51 158.24 125.79 0.00 37.13 163.51 1486.48
RTPP Stage-III 0.00 72.35 78.06 75.55 78.06 78.06 75.55 40.26 75.55 78.06 0.00 0.00 78.06 729.53
Kudigi 0.00 103.55 107.00 103.55 71.33 90.89 103.55 107.00 103.55 71.33 0.00 0.00 107.00 968.76
MACHKUND PH AP Share 0.00 16.14 16.99 14.24 16.30 17.14 15.43 16.16 15.19 15.58 16.98 16.24 17.16 193.54
TUNGBHADRA PH AP Share 0.00 1.73 0.32 0.02 3.25 12.13 13.63 11.82 10.54 7.27 8.22 5.95 5.87 80.75
Upper Sileru Power House (AP) 0.00 25.59 19.28 16.10 20.54 17.72 19.22 21.98 17.30 18.31 30.86 33.09 41.44 281.45
Lower Sileru Power House (AP) 0.00 60.84 44.18 37.61 54.96 56.24 58.06 60.41 50.37 54.77 67.76 70.16 78.99 694.34
DONKARAYI (AP) 0.00 4.72 4.06 2.64 4.37 4.24 5.55 6.52 5.27 5.54 6.28 6.62 7.28 63.11
Srisailam Right Bank Power House (AP) 0.00 29.26 10.01 8.50 13.55 149.22 154.94 75.54 27.34 15.05 31.06 45.72 50.76 610.95
Nagarjunasagar Right Bank Power House (AP) 0.00 1.19 0.00 0.00 0.05 6.07 14.46 15.92 14.88 9.94 6.99 2.73 1.91 74.15
Penna Ahobilam (AP) 0.00 0.02 0.02 0.00 0.05 0.65 0.63 0.79 0.46 0.44 0.27 0.20 0.16 3.70
MINI HYDEL(Chettipeta)-AP 0.00 0.08 0.00 0.04 0.25 0.20 0.21 0.05 0.03 0.18 0.25 0.18 0.24 1.72
Nagarjunasagar Tail Pond Dam Power House 0.00 0.65 0.65 0.65 2.60 5.21 8.46 8.46 10.41 10.41 5.86 2.60 2.60 58.57
Other RE 5.38 17.79 16.22 16.50 14.50 22.48 20.64 18.52 20.27 25.49 29.04 25.50 21.75 248.70
Market 4.31 373.6 562.2 732.2 499.4 97.1 51.5 369.6 400.2 - - - 167.5 3,253.2
D<>D Transaction (214.2) (207.6) (263.3) (296.7) (269.4) (258.8) (145.1) (193.1) (115.2) (138.0) (177.4) (125.1) (2,403.8)
Total 3603.94 3869.63 3608.43 3389.73 3350.29 3294.11 4062.26 3715.27 3527.02 3478.01 3436.50 4283.54 43,618.72
Intermediate Stations
Peak Stations
Market Sources
Energy Dispatch (MU)
Generating Station D Link
Variable
Cost (Rs. /

Form 5 Revenue from Current Tariffs
Gross
RevenueIncentives
Net
RevenueSurcharge
Additional
surcharge
LT Category 7087.71 0.00 7087.71 0.00 0.00 0.00 7087.71
Category I (A&B) - Domestic Form-7 3229.08 0.00 3229.08 3229.08
Category II (A,B & C) - Non-domestic/Commercial Form-5a 1952.73 0.00 1952.73 1952.73
Category III (A & B) - Industrial 1301.28 0.00 1301.28 1301.28
Category IV (A,B &C) - Cottage Industries & Dhobighats 18.03 0.00 18.03 18.03
Category V (A, B & C) - Irrigation and Agriculture 55.82 0.00 55.82 55.82
Category VI (A & B) - Local Bodies, St. Lighting & PWS 443.70 0.00 443.70 443.70
Category VII (A & B) - General Purpose 85.64 0.00 85.64 85.64
Category VIII (A & B) -Temporary Supply 1.42 0.00 1.42 1.42HT Category at 11 KV 2190.16 0.00 2190.16 0.00 0.00 0.00 2190.16
HT I (A): General 731.68 0.00 731.68 731.68
Lights and Fans 22.16 0.00 22.16 22.16
Industrial Colonies 1.08 0.00 1.08 1.08
Seasonal Industries 3.03 0.00 3.03 3.03
Time of Day Tariffs Peak (6 AM to 10 AM & 6 PM to 10 PM) 328.45 0.00 328.45 328.45
Time of Day Tariffs Off Peak (10 PM to 6 AM) 219.91 0.00 219.91 219.91
HT I (B): Energy Intensive Industries 1.32 0.00 1.32 1.32
HT I (C): Aquaculture and Animal Husbandry 14.17 0.00 14.17 14.17
HT I (D): Poultry Hatcheries abd Poultry Feed Mixing Plants 34.68 0.00 34.68 34.68
HT II: Others 574.97 0.00 574.97 574.97
Time of Day Tariffs Peak (6 AM to 10 AM & 6 PM to 10 PM) 114.43 0.00 114.43 114.43
HT II (B): Religious Places 3.15 0.00 3.15 3.15
HT II (C): Function Halls/Auditoriums 10.68 0.00 10.68 10.68
HT II (E): Electric Vehicles (Evs) / Charging stations 0.00 0.00 0.00 0.00
Time of Day Tariffs Peak (6 AM to 10 AM & 6 PM to 10 PM) 0.00 0.00 0.00 0.00
Time of Day Tariffs Off Peak (10 PM to 6 AM) 0.00 0.00 0.00 0.00
HT II (F) : Start up power 0.25 0.00 0.25 0.25
HT III: Public Infrastructure and Tourism 33.60 0.00 33.60 33.60
Time of Day Tariffs (6 PM to 10 PM) 6.64 0.00 6.64 6.64
HT IV Government LIS 33.36 0.00 33.36 33.36
HT IV Private Irrigation and Agriculture 0.00 0.00 0.00 0.00
HT IV CPWS 23.80 0.00 23.80 23.80
HT VI: Townships & Residential Colonies 15.26 0.00 15.26 15.26
HT VII: Green Power 0.03 0.00 0.03 0.03
HT VIII: Temporary 2.22 0.00 2.22 2.22
Category: RESCOs 15.27 0.00 15.27 15.27HT Category at 33 KV 2727.28 0.00 2727.28 0.00 0.00 0.00 2727.28
HT I (A): General 1074.96 0.00 1074.96 1074.96
Lights and Fans 17.99 0.00 17.99 17.99
Industrial Colonies 6.84 0.00 6.84 6.84
Seasonal Industries 0.60 0.00 0.60 0.60
Time of Day Tariffs Peak (6 AM to 10 AM & 6 PM to 10 PM) 713.18 0.00 713.18 713.18
Time of Day Tariffs Off Peak (10 PM to 6 AM) 492.18 0.00 492.18 492.18
HT I (B): Energy Intensive Industries 135.52 0.00 135.52 135.52
HT I (C) : Aquaculture and Animal Husbandry 0.00 0.00 0.00 0.00
HT I (D) : Poultry Hatcheries and Poultry Feed Mixing Plants 50.54 0.00 50.54 50.54
HT II: Others 88.07 0.00 88.07 88.07
Revenue from Current Tariffs (Rs. Crs.)Retail Supply (Regulated Business)Detail
Links
Surcharges (Open Access)
2018-19
Total
Revenue
Grid
Support
Charges

Gross
RevenueIncentives
Net
RevenueSurcharge
Additional
surcharge
Revenue from Current Tariffs (Rs. Crs.)Retail Supply (Regulated Business)Detail
Links
Surcharges (Open Access)
2018-19
Total
Revenue
Grid
Support
Charges
Time of Day Tariffs (6 PM to 10 PM) 20.79 0.00 20.79 20.79
HT II (B): Religious Places 14.85 0.00 14.85 14.85
HT II (C) : Function Halls / Auditoriums 0.13 0.00 0.13 0.13
HT II (E): Electric Vehicles (Evs) / Charging stations 0.00 0.00 0.00 0.00
Time of Day Tariffs Peak (6 AM to 10 AM & 6 PM to 10 PM) 0.00 0.00 0.00 0.00
Time of Day Tariffs Off Peak (10 PM to 6 AM) 0.00 0.00 0.00 0.00
HT II (F) : Start up power 21.41 0.00 21.41 21.41
HT III: Public Infrastructure and Tourism 6.36 0.00 6.36 6.36
Time of Day Tariffs (6 PM to 10 PM) 1.45 0.00 1.45 1.45
HT IV Government LIS 50.41 0.00 50.41 50.41
HT IV Agriculture 0.00 0.00 0.00 0.00
HT IV CPWS 29.34 0.00 29.34 29.34
HT VI: Townships & Residential Colonies 2.66 0.00 2.66 2.66
HT VII: Green Power 0.00 0.00 0.00 0.00
HT VIII: Temporary 0.00 0.00 0.00 0.00
Category: RESCOs 0.00 0.00 0.00 0.00HT Category at 132 KV 2979.51 0.00 2979.51 0.00 0.00 0.00 2979.51
HT I (A): General 824.46 0.00 824.46 824.46
Lights and Fans 7.96 0.00 7.96 7.96
Industrial Colonies 8.18 0.00 8.18 8.18
Seasonal Industries 0.00 0.00 0.00 0.00
Time of Day Tariffs Peak (6 AM to 10 AM & 6 PM to 10 PM) 545.41 0.00 545.41 545.41
Time of Day Tariffs Off Peak (10 PM to 6 AM) 399.91 0.00 399.91 399.91
HT I (B): Energy Intensive Industries 53.80 0.00 53.80 53.80
HT I (C ): Aquaculture and Animal Husbandry 0.00 0.00 0.00 0.00
HT I (D): Poultry and Hatcheries and Poultry Feed Mixing Plants 0.00 0.00 0.00 0.00
HT II: Others 32.63 0.00 32.63 32.63
Time of Day Tariffs (6 PM to 10 PM) 6.53 0.00 6.53 6.53
HT II (B): Religious Places 0.00 0.00 0.00 0.00
HT II (C) : Function Halls / Auditoriums 0.00 0.00 0.00 0.00
HT II (E): Electric Vehicles (Evs) / Charging stations 0.00 0.00 0.00 0.00
Time of Day Tariffs Peak (6 AM to 10 AM & 6 PM to 10 PM) 0.00 0.00 0.00 0.00
Time of Day Tariffs Off Peak (10 PM to 6 AM) 0.00 0.00 0.00 0.00
HT II (F) : Start up power 4.32 0.00 4.32 4.32
HT III: Public Infrastructure and Tourism 0.00 0.00 0.00 0.00
Time of Day Tariffs (6 PM to 10 PM) 0.00 0.00 0.00 0.00
HT IV Government LIS 685.17 0.00 685.17 685.17
HT IV Agriculture 0.00 0.00 0.00 0.00
HT IV CPWS 0.00 0.00 0.00 0.00
HT V: Railway Traction 411.14 0.00 411.14 411.14
HT VI: Townships & Residential Colonies 0.00 0.00 0.00 0.00
HT VII: Green Power 0.00 0.00 0.00 0.00
HT VIII: Temporary 0.00 0.00 0.00 0.00
Category: RESCOs 0.00 0.00 0.00 0.00Total 14984.65 0.00 14984.65 0.00 0.00 0.00 14984.65

Form 5
Gross
RevenueIncentives
Net
RevenueSurcharge
Additional
surcharge
Gross
RevenueIncentives
Net
RevenueSurcharge
Additional
surcharge
LT Category 7892.47 0.00 7892.47 0.00 0.00 0.00 7892.47 8497.03 0.00 8497.03 0.00 0.00 0.00 8497.03
Domestic 3820.43 0.00 3820.43 3820.43 4168.31 0.00 4168.31 4168.31
Commerical & Others 2109.30 0.00 2109.30 2109.30 2266.33 0.00 2266.33 2266.33
Industry 790.72 0.00 790.72 790.72 799.47 0.00 799.47 799.47
Institutional 558.32 0.00 558.32 558.32 587.17 0.00 587.17 587.17
Agriculture & Related 613.01 0.00 613.01 613.01 675.75 0.00 675.75 675.75
Temporary 0.70 0.00 0.70 0.70 0.00 0.00 0.00 0.00
HT Category at 11 KV 2570.82 1.28 2569.54 0.00 0.00 0.00 2569.54 2620.76 1.29 2619.48 0.00 0.00 0.00 2619.48
HT I (B): Townships & Residential Colonies 13.63 0.00 13.63 13.63 13.76 0.00 13.76 13.76
HT II (A) : Commercial 950.46 0.00 950.46 950.46 971.11 0.00 971.11 971.11
Time of Day Tariffs (6 PM to 10 PM) 108.71 0.00 108.71 108.71 109.80 0.00 109.80 109.80
HT II (B) : Public Infrastructure and Tourism 38.72 0.00 38.72 38.72 42.66 0.00 42.66 42.66
Time of Day Tariffs (6 PM to 10 PM) 3.16 0.00 3.16 3.16 2.69 0.00 2.69 2.69
HT II (D) : Function Halls / Auditoriums 9.79 0.00 9.79 9.79 10.13 0.00 10.13 10.13
HT II (D) : Start up power 0.00 0.00 0.00 0.00 0.00 0.00 0.00 0.00
HT II (E): Electric Vehicles (Evs) / Charging stations 0.00 0.00 0.00 0.00 0.00 0.00 0.00 0.00
HT II (F) : Green Power 0.00 0.00 0.00 0.00 0.00 0.00 0.00 0.00
HT III (A): Industry 739.51 1.28 738.23 738.23 743.23 1.29 741.94 741.94
Time of Day Tariffs Peak (6 AM to 10 AM & 6 PM to 10 PM) 327.21 0.00 327.21 327.21 328.85 0.00 328.85 328.85
Time of Day Tariffs Off Peak (10 PM to 6 AM) 223.80 0.00 223.80 223.80 228.28 0.00 228.28 228.28
Industrial Colonies 1.00 0.00 1.00 1.00 1.06 0.00 1.06 1.06
HT III (B): Seasonal Industries 2.90 0.00 2.90 2.90 2.96 0.00 2.96 2.96
HT III (C): Energy Intensive Industries 1.11 0.00 1.11 1.11 1.13 0.00 1.13 1.13
HT IV (B): CPWS / PWS Scheme 22.62 0.00 22.62 22.62 23.07 0.00 23.07 23.07
HT IV (E): Religious Places 4.25 0.00 4.25 4.25 4.42 0.00 4.42 4.42
HT IV (F) : Railway Traction 0.00 0.00 0.00 0.00 0.00 0.00 0.00 0.00
HT V (C) : Aquaculture and Animal Husbandry 15.99 0.00 15.99 15.99 18.09 0.00 18.09 18.09
HT V (D) : Poultry Hatcheries and Poultry Feed Mixing Plants 57.01 0.00 57.01 57.01 65.52 0.00 65.52 65.52
HT V (F) : Government / Pvt. LIS 32.53 0.00 32.53 32.53 33.50 0.00 33.50 33.50
HT Temporary supply 0.01 0.00 0.01 0.01 0.01 0.00 0.01 0.01
RESCOs 18.40 0.00 18.40 18.40 20.49 0.00 20.49 20.49
HT Category at 33 KV 2885.90 7.00 2878.90 0.00 0.00 0.00 2878.90 2984.66 7.33 2977.33 0.00 0.00 0.00 2977.33
HT I (B): Townships & Residential Colonies 2.22 0.00 2.22 2.22 2.24 0.00 2.24 2.24
HT II (A) : Commercial 86.09 0.00 86.09 86.09 87.71 0.00 87.71 87.71
Time of Day Tariffs (6 PM to 10 PM) 17.82 0.00 17.82 17.82 18.17 0.00 18.17 18.17
HT II (B) : Public Infrastructure and Tourism 8.03 0.00 8.03 8.03 9.65 0.00 9.65 9.65
Time of Day Tariffs (6 PM to 10 PM) 0.30 0.00 0.30 0.30 0.24 0.00 0.24 0.24
HT II (D) : Function Halls / Auditoriums 8.82 0.00 8.82 8.82 17.23 0.00 17.23 17.23
HT II (D) : Start up power 0.00 0.00 0.00 0.00 0.00 0.00 0.00 0.00
HT II (E): Electric Vehicles (Evs) / Charging stations 0.00 0.00 0.00 0.00 0.00 0.00 0.00 0.00
HT II (F) : Green Power 0.11 0.00 0.11 0.11 0.11 0.00 0.11 0.11
HT III (A): Industry 1197.22 7.00 1190.22 1190.22 1253.56 7.33 1246.23 1246.23
2019-20
Retail Supply (Regulated Business)Total
Revenue
Surcharges (Open Access) Grid
Support
Charges
Grid
Support
Charges
2020-21
Surcharges (Open Access)Retail Supply (Regulated Business)Total
Revenue
Revenue from Current Tariffs (Rs. Crs.)

Gross
RevenueIncentives
Net
RevenueSurcharge
Additional
surcharge
Gross
RevenueIncentives
Net
RevenueSurcharge
Additional
surcharge
2019-20
Retail Supply (Regulated Business)Total
Revenue
Surcharges (Open Access) Grid
Support
Charges
Grid
Support
Charges
2020-21
Surcharges (Open Access)Retail Supply (Regulated Business)Total
Revenue
Revenue from Current Tariffs (Rs. Crs.)
Time of Day Tariffs Peak (6 AM to 10 AM & 6 PM to 10 PM) 730.54 0.00 730.54 730.54 734.19 0.00 734.19 734.19
Time of Day Tariffs Off Peak (10 PM to 6 AM) 520.05 0.00 520.05 520.05 530.45 0.00 530.45 530.45
Industrial Colonies 6.39 0.00 6.39 6.39 6.52 0.00 6.52 6.52
HT III (B): Seasonal Industries 0.51 0.00 0.51 0.51 0.47 0.00 0.47 0.47
HT III (C): Energy Intensive Industries 113.61 0.00 113.61 113.61 104.52 0.00 104.52 104.52
HT IV (B): CPWS / PWS Scheme 28.63 0.00 28.63 28.63 29.20 0.00 29.20 29.20
HT IV (E): Religious Places 16.34 0.00 16.34 16.34 16.99 0.00 16.99 16.99
HT IV (F) : Railway Traction 0.00 0.00 0.00 0.00 0.00 0.00 0.00 0.00
HT V (C) : Aquaculture and Animal Husbandry 0.00 0.00 0.00 0.00 0.00 0.00 0.00 0.00
HT V (D) : Poultry Hatcheries and Poultry Feed Mixing Plants 87.17 0.00 87.17 87.17 109.49 0.00 109.49 109.49
HT V (F) : Government / Pvt. LIS 62.06 0.00 62.06 62.06 63.92 0.00 63.92 63.92
HT Temporary supply 0.00 0.00 0.00 0.00 0.00 0.00 0.00 0.00
RESCOs 0.00 0.00 0.00 0.00 0.00 0.00 0.00 0.00
HT Category at 132 KV 2984.23 3.72 2980.51 0.00 0.00 0.00 2980.51 3167.15 4.29 3162.87 0.00 0.00 0.00 3162.87
HT I (B): Townships & Residential Colonies 0.00 0.00 0.00 0.00 0.00 0.00 0.00 0.00
HT II (A) : Commercial 29.38 0.00 29.38 29.38 28.06 0.00 28.06 28.06
Time of Day Tariffs (6 PM to 10 PM) 5.58 0.00 5.58 5.58 5.25 0.00 5.25 5.25
HT II (B) : Public Infrastructure and Tourism 0.00 0.00 0.00 0.00 0.00 0.00 0.00 0.00
Time of Day Tariffs (6 PM to 10 PM) 0.00 0.00 0.00 0.00 0.00 0.00 0.00 0.00
HT II (D) : Function Halls / Auditoriums 2.42 0.00 2.42 2.42 3.42 0.00 3.42 3.42
HT II (D) : Start up power 0.00 0.00 0.00 0.00 0.00 0.00 0.00 0.00
HT II (E): Electric Vehicles (Evs) / Charging stations 0.00 0.00 0.00 0.00 0.00 0.00 0.00 0.00
HT II (F) : Green Power 0.00 0.00 0.00 0.00 0.00 0.00 0.00 0.00
HT III (A): Industry 723.68 3.72 719.96 719.96 833.28 4.29 828.99 828.99
Time of Day Tariffs Peak (6 AM to 10 AM & 6 PM to 10 PM) 514.44 0.00 514.44 514.44 517.01 0.00 517.01 517.01
Time of Day Tariffs Off Peak (10 PM to 6 AM) 372.24 0.00 372.24 372.24 379.68 0.00 379.68 379.68
Industrial Colonies 8.29 0.00 8.29 8.29 8.45 0.00 8.45 8.45
HT III (B): Seasonal Industries 0.00 0.00 0.00 0.00 0.00 0.00 0.00 0.00
HT III (C): Energy Intensive Industries 42.55 0.00 42.55 42.55 38.30 0.00 38.30 38.30
HT IV (B): CPWS / PWS Scheme 0.00 0.00 0.00 0.00 0.00 0.00 0.00 0.00
HT IV (E): Religious Places 0.00 0.00 0.00 0.00 0.00 0.00 0.00 0.00
HT IV (F) : Railway Traction 449.06 0.00 449.06 449.06 475.28 0.00 475.28 475.28
HT V (C) : Aquaculture and Animal Husbandry 0.00 0.00 0.00 0.00 0.00 0.00 0.00 0.00
HT V (D) : Poultry Hatcheries and Poultry Feed Mixing Plants 0.00 0.00 0.00 0.00 0.00 0.00 0.00 0.00
HT V (F) : Government / Pvt. LIS 836.59 0.00 836.59 836.59 878.42 0.00 878.42 878.42
HT Temporary supply 0.00 0.00 0.00 0.00 0.00 0.00 0.00 0.00
RESCOs 0.00 0.00 0.00 0.00 0.00 0.00 0.00 0.00
Total 16333.43 12.00 16321.43 0.00 0.00 0.00 16321.43 17269.61 12.91 17256.70 0.00 0.00 0.00 17256.70

Form 5 a
Incentives at current Tariffs
2018-19 10003 10003
Data LinkNo. of
consumers
Incentive
Amount
LT Category Form-7 0 0.00
Category I (A&B) - Domestic
Category II (A,B & C) - Non-domestic/Commercial
Category III (A & B) - Industrial
Category IV (A,B &C) - Cottage Industries & Dhobighats
Category V (A, B & C) - Irrigation and Agriculture
Category VI (A & B) - Local Bodies, St. Lighting & PWS
Category VII (A & B) - General Purpose
Category VIII (A & B) -Temporary Supply
HT Category at 11 KV 0 0.00
HT I (A): General
Lights and Fans
Industrial Colonies
Seasonal Industries
Time of Day Tariffs Peak (6 AM to 10 AM & 6 PM to 10 PM)
Time of Day Tariffs Off Peak (10 PM to 6 AM)
HT I (B): Energy Intensive Industries
HT I (C): Aquaculture and Animal Husbandry
HT I (D): Poultry Hatcheries abd Poultry Feed Mixing Plants
HT II: Others
Time of Day Tariffs Peak (6 AM to 10 AM & 6 PM to 10 PM)
HT II (B): Religious Places
HT II (C): Function Halls/Auditoriums
HT II (E): Electric Vehicles (Evs) / Charging stations
Time of Day Tariffs Peak (6 AM to 10 AM & 6 PM to 10 PM)
Time of Day Tariffs Off Peak (10 PM to 6 AM)
HT II (F) : Start up power
HT III: Public Infrastructure and Tourism
Time of Day Tariffs (6 PM to 10 PM)
HT IV Government LIS
HT IV Private Irrigation and Agriculture
HT IV CPWS
HT VI: Townships & Residential Colonies
HT VII: Green Power
HT VIII: Temporary
Category: RESCOs
RemarksConsumer CategoryTotal

Data LinkNo. of
consumers
Incentive
Amount
RemarksConsumer CategoryTotal
HT Category at 33 KV 0 0.00
HT I (A): General
Lights and Fans
Industrial Colonies
Seasonal Industries
Time of Day Tariffs Peak (6 AM to 10 AM & 6 PM to 10 PM)
Time of Day Tariffs Off Peak (10 PM to 6 AM)
HT I (B): Energy Intensive Industries
HT I (C) : Aquaculture and Animal Husbandry
HT I (D) : Poultry Hatcheries and Poultry Feed Mixing Plants
HT II: Others
Time of Day Tariffs (6 PM to 10 PM)
HT II (B): Religious Places
HT II (C) : Function Halls / Auditoriums
HT II (E): Electric Vehicles (Evs) / Charging stations
Time of Day Tariffs Peak (6 AM to 10 AM & 6 PM to 10 PM)
Time of Day Tariffs Off Peak (10 PM to 6 AM)
HT II (F) : Start up power
HT III: Public Infrastructure and Tourism
Time of Day Tariffs (6 PM to 10 PM)
HT IV Government LIS
HT IV Agriculture
HT IV CPWS
HT VI: Townships & Residential Colonies
HT VII: Green Power
HT VIII: Temporary
Category: RESCOs
HT Category at 132 KV 0 0.00
HT I (A): General
Lights and Fans
Industrial Colonies
Seasonal Industries
Time of Day Tariffs Peak (6 AM to 10 AM & 6 PM to 10 PM)
Time of Day Tariffs Off Peak (10 PM to 6 AM)
HT I (B): Energy Intensive Industries
HT I (C ): Aquaculture and Animal Husbandry
HT I (D): Poultry and Hatcheries and Poultry Feed Mixing Plants
HT II: Others
Time of Day Tariffs (6 PM to 10 PM)
HT II (B): Religious Places
HT II (C) : Function Halls / Auditoriums
HT II (E): Electric Vehicles (Evs) / Charging stations
Time of Day Tariffs Peak (6 AM to 10 AM & 6 PM to 10 PM)
Time of Day Tariffs Off Peak (10 PM to 6 AM)
HT II (F) : Start up power
HT III: Public Infrastructure and Tourism
Time of Day Tariffs (6 PM to 10 PM)
HT IV Government LIS
HT IV Agriculture
HT IV CPWS
HT V: Railway Traction
HT VI: Townships & Residential Colonies
HT VII: Green Power
HT VIII: Temporary
Category: RESCOs
Total (LT & HT) 0.00 0.00

Data LinkNo. of
consumers
Incentive
Amount
RemarksConsumer CategoryTotal
2019-20
Data LinkNo. of
consumers
Incentive
Amount
LT Category Form-7 0 0.00
Domestic
Commerical & Others
Industry
Institutional
Agriculture & Related
Temporary
HT Category at 11 KV 1168 1.28
HT I (B): Townships & Residential Colonies
HT II (D) : Function Halls / Auditoriums
HT II (D) : Start up power
HT II (E): Electric Vehicles (Evs) / Charging stations
HT II (F) : Green Power
HT III (A): Industry 1168 1.28
Time of Day Tariffs Peak (6 AM to 10 AM & 6 PM to 10 PM)
Time of Day Tariffs Off Peak (10 PM to 6 AM)
Industrial Colonies
HT III (B): Seasonal Industries
HT III (C): Energy Intensive Industries
HT IV (B): CPWS / PWS Scheme
HT IV (E): Religious Places
HT IV (F) : Railway Traction
HT V (C) : Aquaculture and Animal Husbandry
HT V (D) : Poultry Hatcheries and Poultry Feed Mixing Plants
HT V (F) : Government / Pvt. LIS
HT Temporary supply
RESCOs
Remarks
Total
Consumer Category

Data LinkNo. of
consumers
Incentive
Amount
RemarksConsumer CategoryTotal
HT Category at 33 KV 644 7.00
HT I (B): Townships & Residential Colonies
HT II (A) : Commercial
Time of Day Tariffs (6 PM to 10 PM)
HT II (B) : Public Infrastructure and Tourism
Time of Day Tariffs (6 PM to 10 PM)
HT II (D) : Function Halls / Auditoriums
HT II (D) : Start up power
HT II (E): Electric Vehicles (Evs) / Charging stations
HT II (F) : Green Power
HT III (A): Industry 644 7.00
Time of Day Tariffs Peak (6 AM to 10 AM & 6 PM to 10 PM)
Time of Day Tariffs Off Peak (10 PM to 6 AM)
Industrial Colonies
HT III (B): Seasonal Industries
HT III (C): Energy Intensive Industries
HT IV (B): CPWS / PWS Scheme
HT IV (E): Religious Places
HT IV (F) : Railway Traction
HT V (C) : Aquaculture and Animal Husbandry
HT V (D) : Poultry Hatcheries and Poultry Feed Mixing Plants
HT V (F) : Government / Pvt. LIS
HT Temporary supply
RESCOs
HT Category at 132 KV 62 3.72
HT I (B): Townships & Residential Colonies
HT II (A) : Commercial
Time of Day Tariffs (6 PM to 10 PM)
HT II (B) : Public Infrastructure and Tourism
Time of Day Tariffs (6 PM to 10 PM)
HT II (D) : Function Halls / Auditoriums
HT II (D) : Start up power
HT II (E): Electric Vehicles (Evs) / Charging stations
HT II (F) : Green Power
HT III (A): Industry 62 3.72
Time of Day Tariffs Peak (6 AM to 10 AM & 6 PM to 10 PM)
Time of Day Tariffs Off Peak (10 PM to 6 AM)
Industrial Colonies
HT III (B): Seasonal Industries
HT III (C): Energy Intensive Industries
HT IV (B): CPWS / PWS Scheme
HT IV (E): Religious Places
HT IV (F) : Railway Traction
HT V (C) : Aquaculture and Animal Husbandry
HT V (D) : Poultry Hatcheries and Poultry Feed Mixing Plants
HT V (F) : Government / Pvt. LIS
HT Temporary supply
RESCOs
Total (LT & HT) 1874.00 12.00

Data LinkNo. of
consumers
Incentive
Amount
RemarksConsumer CategoryTotal
2020-21
Data LinkNo. of
consumers
Incentive
Amount
LT Category Form-7 0 0.00
Domestic
Commerical & Others
Industry
Institutional
Agriculture & Related
Temporary
HT Category at 11 KV 1174 1.29
HT I (B): Townships & Residential Colonies
HT II (A) : Commercial
Time of Day Tariffs (6 PM to 10 PM)
HT II (B) : Public Infrastructure and Tourism
Time of Day Tariffs (6 PM to 10 PM)
HT II (D) : Function Halls / Auditoriums
HT II (D) : Start up power
HT II (E): Electric Vehicles (Evs) / Charging stations
HT II (F) : Green Power
HT III (A): Industry 1174 1.29
Time of Day Tariffs Peak (6 AM to 10 AM & 6 PM to 10 PM)
Time of Day Tariffs Off Peak (10 PM to 6 AM)
Industrial Colonies
HT III (B): Seasonal Industries
HT III (C): Energy Intensive Industries
HT IV (B): CPWS / PWS Scheme
HT IV (E): Religious Places
HT IV (F) : Railway Traction
HT V (C) : Aquaculture and Animal Husbandry
HT V (D) : Poultry Hatcheries and Poultry Feed Mixing Plants
HT V (F) : Government / Pvt. LIS
HT Temporary supply
RESCOs
Consumer Category RemarksTotal

Data LinkNo. of
consumers
Incentive
Amount
RemarksConsumer CategoryTotal
HT Category at 33 KV 674 7.33
HT I (B): Townships & Residential Colonies
HT II (A) : Commercial
Time of Day Tariffs (6 PM to 10 PM)
HT II (B) : Public Infrastructure and Tourism
Time of Day Tariffs (6 PM to 10 PM)
HT II (D) : Function Halls / Auditoriums
HT II (D) : Start up power
HT II (E): Electric Vehicles (Evs) / Charging stations
HT II (F) : Green Power
HT III (A): Industry 674 7.33
Time of Day Tariffs Peak (6 AM to 10 AM & 6 PM to 10 PM)
Time of Day Tariffs Off Peak (10 PM to 6 AM)
Industrial Colonies
HT III (B): Seasonal Industries
HT III (C): Energy Intensive Industries
HT IV (B): CPWS / PWS Scheme
HT IV (E): Religious Places
HT IV (F) : Railway Traction
HT V (C) : Aquaculture and Animal Husbandry
HT V (D) : Poultry Hatcheries and Poultry Feed Mixing Plants
HT V (F) : Government / Pvt. LIS
HT Temporary supply
RESCOs
HT Category at 132 KV 71 4.29
HT I (B): Townships & Residential Colonies
HT II (A) : Commercial
Time of Day Tariffs (6 PM to 10 PM)
HT II (B) : Public Infrastructure and Tourism
Time of Day Tariffs (6 PM to 10 PM)
HT II (D) : Function Halls / Auditoriums
HT II (D) : Start up power
HT II (E): Electric Vehicles (Evs) / Charging stations
HT II (F) : Green Power
HT III (A): Industry 71 4.29
Time of Day Tariffs Peak (6 AM to 10 AM & 6 PM to 10 PM)
Time of Day Tariffs Off Peak (10 PM to 6 AM)
Industrial Colonies
HT III (B): Seasonal Industries
HT III (C): Energy Intensive Industries
HT IV (B): CPWS / PWS Scheme
HT IV (E): Religious Places
HT IV (F) : Railway Traction
HT V (C) : Aquaculture and Animal Husbandry
HT V (D) : Poultry Hatcheries and Poultry Feed Mixing Plants
HT V (F) : Government / Pvt. LIS
HT Temporary supply
RESCOs
Total (LT & HT) 1919.00 12.91
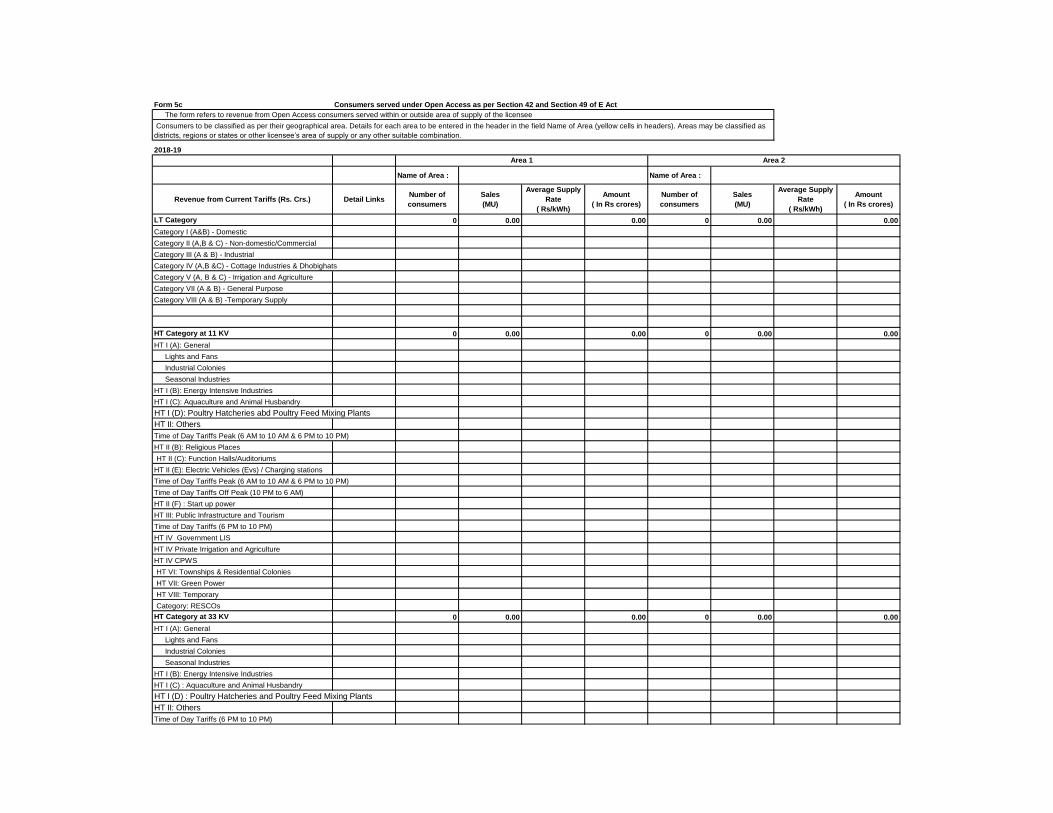
Form 5c Consumers served under Open Access as per Section 42 and Section 49 of E Act
The form refers to revenue from Open Access consumers served within or outside area of supply of the licensee
2018-19
Name of Area : Name of Area :
Revenue from Current Tariffs (Rs. Crs.) Detail LinksNumber of
consumers
Sales
(MU)
Average Supply
Rate
( Rs/kWh)
Amount
( In Rs crores)
Number of
consumers
Sales
(MU)
Average Supply
Rate
( Rs/kWh)
Amount
( In Rs crores)
LT Category 0 0.00 0.00 0 0.00 0.00
Category I (A&B) - Domestic
Category II (A,B & C) - Non-domestic/Commercial
Category III (A & B) - Industrial
Category IV (A,B &C) - Cottage Industries & Dhobighats
Category V (A, B & C) - Irrigation and Agriculture
Category VII (A & B) - General Purpose
Category VIII (A & B) -Temporary Supply
HT Category at 11 KV 0 0.00 0.00 0 0.00 0.00
HT I (A): General
Lights and Fans
Industrial Colonies
Seasonal Industries
HT I (B): Energy Intensive Industries
HT I (C): Aquaculture and Animal Husbandry
HT I (D): Poultry Hatcheries abd Poultry Feed Mixing Plants
HT II: Others
Time of Day Tariffs Peak (6 AM to 10 AM & 6 PM to 10 PM)
HT II (B): Religious Places
HT II (C): Function Halls/Auditoriums
HT II (E): Electric Vehicles (Evs) / Charging stations
Time of Day Tariffs Peak (6 AM to 10 AM & 6 PM to 10 PM)
Time of Day Tariffs Off Peak (10 PM to 6 AM)
HT II (F) : Start up power
HT III: Public Infrastructure and Tourism
Time of Day Tariffs (6 PM to 10 PM)
HT IV Government LIS
HT IV Private Irrigation and Agriculture
HT IV CPWS
HT VI: Townships & Residential Colonies
HT VII: Green Power
HT VIII: Temporary
Category: RESCOs
HT Category at 33 KV 0 0.00 0.00 0 0.00 0.00
HT I (A): General
Lights and Fans
Industrial Colonies
Seasonal Industries
HT I (B): Energy Intensive Industries
HT I (C) : Aquaculture and Animal Husbandry
HT I (D) : Poultry Hatcheries and Poultry Feed Mixing Plants
HT II: Others
Time of Day Tariffs (6 PM to 10 PM)
Consumers to be classified as per their geographical area. Details for each area to be entered in the header in the field Name of Area (yellow cells in headers). Areas may be classified as
districts, regions or states or other licensee’s area of supply or any other suitable combination.
Area 1 Area 2

Name of Area : Name of Area :
Revenue from Current Tariffs (Rs. Crs.) Detail LinksNumber of
consumers
Sales
(MU)
Average Supply
Rate
( Rs/kWh)
Amount
( In Rs crores)
Number of
consumers
Sales
(MU)
Average Supply
Rate
( Rs/kWh)
Amount
( In Rs crores)
Area 1 Area 2
HT II (B): Religious Places
HT II (C) : Function Halls / Auditoriums
HT II (E): Electric Vehicles (Evs) / Charging stations
Time of Day Tariffs Peak (6 AM to 10 AM & 6 PM to 10 PM)
Time of Day Tariffs Off Peak (10 PM to 6 AM)
HT II (F) : Start up power
HT III: Public Infrastructure and Tourism
Time of Day Tariffs (6 PM to 10 PM)
HT IV Government LIS
HT IV Agriculture
HT IV CPWS
HT VI: Townships & Residential Colonies
HT VII: Green Power
HT VIII: Temporary
Category: RESCOs
HT Category at 132 KV 0 0.00 0.00 0 0.00 0.00
HT I (A): General
Lights and Fans
Industrial Colonies
Seasonal Industries
HT I (B): Energy Intensive Industries
HT I (C ): Aquaculture and Animal Husbandry
HT I (D): Poultry and Hatcheries and Poultry Feed Mixing Plants
HT II: Others
Time of Day Tariffs (6 PM to 10 PM)
HT II (B): Religious Places
HT II (C) : Function Halls / Auditoriums
HT II (E): Electric Vehicles (Evs) / Charging stations
Time of Day Tariffs Peak (6 AM to 10 AM & 6 PM to 10 PM)
Time of Day Tariffs Off Peak (10 PM to 6 AM)
HT II (F) : Start up power
HT III: Public Infrastructure and Tourism
Time of Day Tariffs (6 PM to 10 PM)
HT IV Government LIS
HT IV Agriculture
HT IV CPWS
HT V: Railway Traction
HT VI: Townships & Residential Colonies
HT VII: Green Power
HT VIII: Temporary
Category: RESCOs
Total 0 0.00 0.00 0 0.00 0.00

Name of Area : Name of Area :
Revenue from Current Tariffs (Rs. Crs.) Detail LinksNumber of
consumers
Sales
(MU)
Average Supply
Rate
( Rs/kWh)
Amount
( In Rs crores)
Number of
consumers
Sales
(MU)
Average Supply
Rate
( Rs/kWh)
Amount
( In Rs crores)
Area 1 Area 2
2019-20
Name of Area : Name of Area :
Revenue from Current Tariffs (Rs. Crs.) Detail LinksNumber of
consumers
Sales
(MU)
Average Supply
Rate
( Rs/kWh)
Amount
( In Rs crores)
Number of
consumers
Sales
(MU)
Average Supply
Rate
( Rs/kWh)
Amount
( In Rs crores)
LT Category 0 0.00 0.00 0 0.00 0.00
Domestic
Commerical & Others
Industry
Institutional
Agriculture & Related
Temporary
HT Category at 11 KV 0 0.00 0.00 0 0.00 0.00
HT I (B): Townships & Residential Colonies
HT II (A) : Commercial
Time of Day Tariffs (6 PM to 10 PM)
HT II (B) : Public Infrastructure and Tourism
Time of Day Tariffs (6 PM to 10 PM)
HT II (D) : Function Halls / Auditoriums
HT II (D) : Start up power
HT II (E): Electric Vehicles (Evs) / Charging stations
HT II (F) : Green Power
HT III (A): Industry
Time of Day Tariffs Peak (6 AM to 10 AM & 6 PM to 10 PM)
Time of Day Tariffs Off Peak (10 PM to 6 AM)
Industrial Colonies
HT III (B): Seasonal Industries
HT III (C): Energy Intensive Industries
HT IV (B): CPWS / PWS Scheme
HT IV (E): Religious Places
HT IV (F) : Railway Traction
HT V (C) : Aquaculture and Animal Husbandry
HT V (D) : Poultry Hatcheries and Poultry Feed Mixing Plants
HT V (F) : Government / Pvt. LIS
HT Temporary supply
RESCOs
HT Category at 33 KV 0 0.00 0.00 0 0.00 0.00
HT I (B): Townships & Residential Colonies
HT II (A) : Commercial
Time of Day Tariffs (6 PM to 10 PM)
HT II (B) : Public Infrastructure and Tourism
Time of Day Tariffs (6 PM to 10 PM)
HT II (D) : Function Halls / Auditoriums
HT II (D) : Start up power
HT II (E): Electric Vehicles (Evs) / Charging stations
HT II (F) : Green Power
HT III (A): Industry
Time of Day Tariffs Peak (6 AM to 10 AM & 6 PM to 10 PM)
Time of Day Tariffs Off Peak (10 PM to 6 AM)
Industrial Colonies
HT III (B): Seasonal Industries
Area 1 Area 2

Name of Area : Name of Area :
Revenue from Current Tariffs (Rs. Crs.) Detail LinksNumber of
consumers
Sales
(MU)
Average Supply
Rate
( Rs/kWh)
Amount
( In Rs crores)
Number of
consumers
Sales
(MU)
Average Supply
Rate
( Rs/kWh)
Amount
( In Rs crores)
Area 1 Area 2
HT III (C): Energy Intensive Industries
HT IV (B): CPWS / PWS Scheme
HT IV (E): Religious Places
HT IV (F) : Railway Traction
HT V (C) : Aquaculture and Animal Husbandry
HT V (D) : Poultry Hatcheries and Poultry Feed Mixing Plants
HT V (F) : Government / Pvt. LIS
HT Temporary supply
RESCOs
HT Category at 132 KV 0 0.00 0.00 0 0.00 0.00
HT I (B): Townships & Residential Colonies
HT II (A) : Commercial
Time of Day Tariffs (6 PM to 10 PM)
HT II (B) : Public Infrastructure and Tourism
Time of Day Tariffs (6 PM to 10 PM)
HT II (D) : Function Halls / Auditoriums
HT II (D) : Start up power
HT II (E): Electric Vehicles (Evs) / Charging stations
HT II (F) : Green Power
HT III (A): Industry
Time of Day Tariffs Peak (6 AM to 10 AM & 6 PM to 10 PM)
Time of Day Tariffs Off Peak (10 PM to 6 AM)
Industrial Colonies
HT III (B): Seasonal Industries
HT III (C): Energy Intensive Industries
HT IV (B): CPWS / PWS Scheme
HT IV (E): Religious Places
HT IV (F) : Railway Traction
HT V (C) : Aquaculture and Animal Husbandry
HT V (D) : Poultry Hatcheries and Poultry Feed Mixing Plants
HT V (F) : Government / Pvt. LIS
HT Temporary supply
RESCOs
Total 0 0.00 0.00 0 0.00 0.00

Name of Area : Name of Area :
Revenue from Current Tariffs (Rs. Crs.) Detail LinksNumber of
consumers
Sales
(MU)
Average Supply
Rate
( Rs/kWh)
Amount
( In Rs crores)
Number of
consumers
Sales
(MU)
Average Supply
Rate
( Rs/kWh)
Amount
( In Rs crores)
Area 1 Area 2
2020-21
Name of Area : Name of Area :
Revenue from Current Tariffs (Rs. Crs.) Detail LinksNumber of
consumers
Sales
(MU)
Average Supply
Rate
( Rs/kWh)
Amount
( In Rs crores)
Number of
consumers
Sales
(MU)
Average Supply
Rate
( Rs/kWh)
Amount
( In Rs crores)
LT Category 0 0.00 0.00 0 0.00 0.00
Domestic
Commerical & Others
Industry
Institutional
Agriculture & Related
Temporary
HT Category at 11 KV 0 0.00 0.00 0 0.00 0.00
HT I (B): Townships & Residential Colonies
HT II (A) : Commercial
Time of Day Tariffs (6 PM to 10 PM)
HT II (B) : Public Infrastructure and Tourism
Time of Day Tariffs (6 PM to 10 PM)
HT II (D) : Function Halls / Auditoriums
HT II (D) : Start up power
HT II (E): Electric Vehicles (Evs) / Charging stations
HT II (F) : Green Power
HT III (A): Industry
Time of Day Tariffs Peak (6 AM to 10 AM & 6 PM to 10 PM)
Time of Day Tariffs Off Peak (10 PM to 6 AM)
Industrial Colonies
HT III (B): Seasonal Industries
HT III (C): Energy Intensive Industries
HT IV (B): CPWS / PWS Scheme
HT IV (E): Religious Places
HT IV (F) : Railway Traction
HT V (C) : Aquaculture and Animal Husbandry
HT V (D) : Poultry Hatcheries and Poultry Feed Mixing Plants
HT V (F) : Government / Pvt. LIS
HT Temporary supply
RESCOs
HT Category at 33 KV 0 0.00 0.00 0 0.00 0.00
HT I (B): Townships & Residential Colonies
HT II (A) : Commercial
Time of Day Tariffs (6 PM to 10 PM)
HT II (B) : Public Infrastructure and Tourism
Time of Day Tariffs (6 PM to 10 PM)
HT II (D) : Function Halls / Auditoriums
HT II (D) : Start up power
HT II (E): Electric Vehicles (Evs) / Charging stations
HT II (F) : Green Power
HT III (A): Industry
Time of Day Tariffs Peak (6 AM to 10 AM & 6 PM to 10 PM)
Time of Day Tariffs Off Peak (10 PM to 6 AM)
Industrial Colonies
HT III (B): Seasonal Industries
HT III (C): Energy Intensive Industries
HT IV (B): CPWS / PWS Scheme
HT IV (E): Religious Places
Area 1 Area 2

Name of Area : Name of Area :
Revenue from Current Tariffs (Rs. Crs.) Detail LinksNumber of
consumers
Sales
(MU)
Average Supply
Rate
( Rs/kWh)
Amount
( In Rs crores)
Number of
consumers
Sales
(MU)
Average Supply
Rate
( Rs/kWh)
Amount
( In Rs crores)
Area 1 Area 2
HT IV (F) : Railway Traction
HT V (C) : Aquaculture and Animal Husbandry
HT V (D) : Poultry Hatcheries and Poultry Feed Mixing Plants
HT V (F) : Government / Pvt. LIS
HT Temporary supply
RESCOs
HT Category at 132 KV 0 0.00 0.00 0 0.00 0.00
HT I (B): Townships & Residential Colonies
HT II (A) : Commercial
Time of Day Tariffs (6 PM to 10 PM)
HT II (B) : Public Infrastructure and Tourism
Time of Day Tariffs (6 PM to 10 PM)
HT II (D) : Function Halls / Auditoriums
HT II (D) : Start up power
HT II (E): Electric Vehicles (Evs) / Charging stations
HT II (F) : Green Power
HT III (A): Industry
Time of Day Tariffs Peak (6 AM to 10 AM & 6 PM to 10 PM)
Time of Day Tariffs Off Peak (10 PM to 6 AM)
Industrial Colonies
HT III (B): Seasonal Industries
HT III (C): Energy Intensive Industries
HT IV (B): CPWS / PWS Scheme
HT IV (E): Religious Places
HT IV (F) : Railway Traction
HT V (C) : Aquaculture and Animal Husbandry
HT V (D) : Poultry Hatcheries and Poultry Feed Mixing Plants
HT V (F) : Government / Pvt. LIS
HT Temporary supply
RESCOs
Total 0 0.00 0.00 0 0.00 0.00

Form 6
Items of Non - Tariff Income
(Rs. Crs.)Detail Links 2018-19 2019-20 2020-21 2021-22 2022-23 2023-24
Rebate on Power Purchase 96.60 101.43 106.51
Cap S/c 82.86 87.01 91.36
Gain/loss (Billing) -0.11 -0.11 -0.12
HT EPSS 0.00 0.00 0.00
IED 6.12 6.43 6.75
Int on Bank Deposits 0.67 0.70 0.74
LPF 2.94 3.09 3.24
LVSe 8.67 9.10 9.56
Malpractice 6.40 6.72 7.06
Prior Period HT -27.99 -29.39 -30.86
Prior Period LT -8.70 -9.14 -9.60
Reactive Income 1.14 1.20 1.26
Receipt of Direct Ta 2.57 2.70 2.84
Recoveries for TP 0.00 0.00 0.00
Theft 16.59 17.42 18.29
Reconnection fee 56.29 59.10 62.06
Delayed payment surcharge 654.46 687.18 721.54
Total Non tariff income 898.52 943.45 990.62 0.00 0.00 0.00
Non-tariff Income at Current Charges
This form refers to income other than the income derived from tariffs and does not include cross subsidy surcharge, additional surcharge, etc.

Form 7 Total Revenue at Current Tariff and Charges
2018-19
Energy
Charges
(Rs/kWh) or
(Rs/kVAh)
Demand
charges
(Rs/kVA/Yr)
Demand
charges
(Rs/HP/Yr)
Energy
Sales
(MU)
Energy
sales
(MVAh)
Connected
Load/
Contract
Demand
(MVA)
Connected
Load/ Contract
Demand
(HP)
Energy
Charges
(Rs
Crores)
Demand
/Fixed
charges
(Rs Crores)
Minimum
Charges
(Rs
Crores)
Customer
Charges
(Rs crores)
Others
(Rs Crores)
Gross Tariff
Revenue
(Rs Crores)
LT Total - (Existing Categories) 10728800 23617.08 0.00 10541.36 11154292.58 6242.32 324.89 88.56 431.94 0.00 7087.71Category- Domestic (All) 8169327 8672.82 0.00 8209.97 0.00 2828.94 0.00 70.66 329.48 0.00 3229.08Group A: All consumers with annual consumption < = 900
Units4409111 2314.68 0.00 2817.32 0.00 426.06 0.00 58.16 138.74 0.00 622.95
0-50 3416939 1.45 1742.39 2116.30 252.65 0.00 58.16 102.51 413.3151-100 913423 2.60 440.38 620.64 114.50 0.00 32.88 147.38101-200 72709 3.60 97.28 73.07 35.02 0.00 3.05 38.07Above 200 6040 6.90 34.63 7.31 23.90 0.00 0.29 24.19Group B: All consumers with consumption ( < =2700 and >
900 units)3286587 4679.61 0.00 3923.04 0.00 1450.49 0.00 7.62 163.90 0.00 1622.01
0-50 381335 2.60 1818.60 431.11 472.84 0.00 7.62 16.02 496.47
51-100 1600710 2.60 1487.48 1664.88 386.75 0.00 76.83 463.58
101-200 1214684 3.60 1103.20 1678.74 397.15 0.00 65.59 462.75
201-300 78669 6.90 185.32 133.11 127.87 0.00 4.72 132.59
Above 300 11189 7.75 85.01 15.20 65.88 0.00 0.74 66.62Group C: All consumers with annual consumption >2700
units473629 1678.53 0.00 1469.61 0.00 952.39 0.00 4.88 26.85 0.00 984.12
0-50 15383 2.68 272.20 36.92 72.95 0.00 4.88 0.65 78.48
51-100 29723 3.35 260.31 74.46 87.21 0.00 1.43 88.63
101-200 218164 5.42 458.52 614.77 248.52 0.00 11.78 260.30
201-300 148680 7.11 298.35 463.63 212.13 0.00 8.92 221.05
301-400 37215 7.98 154.17 144.95 123.03 0.00 2.46 125.48
401-500 10992 8.52 80.19 52.79 68.32 0.00 0.73 69.05
Above 500 units 13472 9.06 154.79 82.09 140.24 0.00 0.89 141.13
Smart Meters (Optional for above 500 units/month 9.06 0.00 0.00 0.00
Time of Day Tariff (ToD) 10 AM to 12 Noon 8.06 0.00 0.00 0.00
Category II - Non-domestic/Commrl (A,B ,C, D, E & F) 828729 1907.34 0.00 2097.45 0.00 1733.29 167.72 16.57 35.15 0.00 1952.73
Category II - Non-domestic/Commrl (A & B) 826028 1883.55 0.00 2054.84 0.00 1705.18 167.46 16.57 34.99 0.00 1924.20Lt - II (A) Upto 50 units/month 487284 102.85 0.00 728.11 0.00 55.54 48.06 16.57 17.54 0.00 137.71
0-50 units 487284 5.40 660.00 102.85 728.11 55.54 48.06 16.57 17.54 137.71Lt - II (B) >50 Units/month 338744 1780.70 0.00 1326.73 0.00 1649.64 119.41 0.00 17.44 0.00 1786.49
0-50 units 0 6.90 900.00 226.26 0.00 156.12 0.00 0.00 156.12
51- 100 units 141268 7.69 900.00 177.73 238.16 136.67 21.43 6.78 164.89
101- 300 units 123656 9.06 900.00 321.07 325.44 290.89 29.29 6.68 326.86
301- 500 units 26932 9.61 900.00 167.87 132.98 161.33 11.97 1.45 174.75
Above 500 units 46888 10.19 900.00 887.76 630.16 904.63 56.71 2.53 963.88 LT II (C): Advertisement Hoardings 749 12.28 900.00 2.19 2.87 2.69 0.26 0.04 3.00 LT II (D) : Function Halls / Auditoriums 1952 11.77 21.60 39.75 25.42 0.00 0.12 25.54 LT II (E): Electric Vehicles (Evs) / Charging stations 6.95 0.00 0.00 0.00 0.00 Time of Day Tariffs Peak (6 AM to 10 AM & 6 PM to 10 PM) 8.00 0.00 0.00 0.00 Time of Day Tariffs Off Peak (10 PM to 6 AM) 5.95 0.00 0.00 0.00 LT II (F) : Start up power 11.77 0.00 0.00 0.00 0.00Category III - Industrial 78352 2303.37 0.00 0.00 2264537.00 1180.47 114.89 0.00 5.92 0.00 1301.28
Industries (General) 44788 6.71 900.00 1017.64 1321409.00 682.84 88.68 3.39 774.91
Seasonal Industries (off season) 0 7.45 900.00 0.01 0.00 0.01 0.00 0.00 0.01
Aquaculture and Animal Husbandry 32298 3.86 360.00 1271.07 920263.00 490.63 24.70 2.44 517.78
Sugarcane crushing 37 3.86 360.00 1.78 808.00 0.69 0.02 0.00 0.71
Mushroom and Rabbit farms 7 5.91 900.00 0.06 80.00 0.04 0.01 0.00 0.04
Floriculture in Green House 6 5.91 900.00 0.04 42.00 0.02 0.00 0.00 0.02
Poultry Hactcheries & Poultry Feed mixing plants, Aqua
Hatcheries and Aqua Feed mixing plants1216 4.89 900.00 12.76 21935.00 6.24 1.47 0.09 7.81
Full year revenue excluding external subsidyRelevant sales related data
Consumer Categories No of consumers
Components of tariff
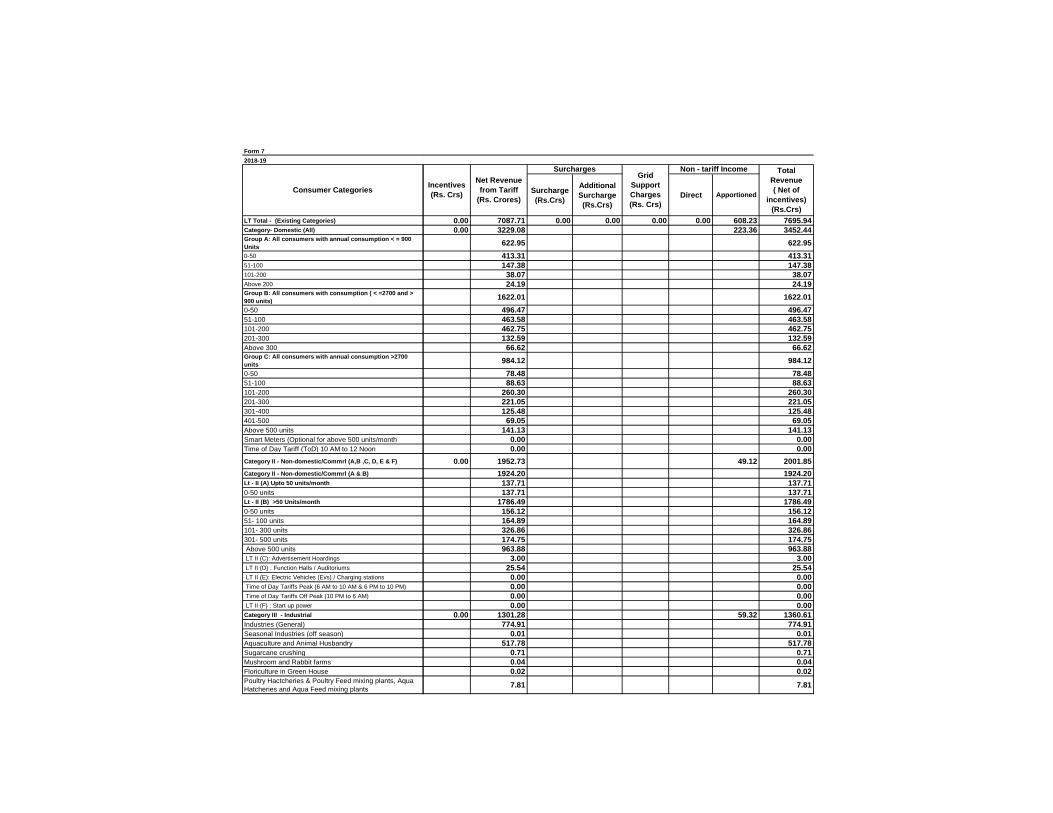
Form 7
2018-19
LT Total - (Existing Categories)
Category- Domestic (All)
Group A: All consumers with annual consumption < = 900
Units
0-50
51-100
101-200
Above 200
Group B: All consumers with consumption ( < =2700 and >
900 units)
0-50
51-100
101-200
201-300
Above 300
Group C: All consumers with annual consumption >2700
units
0-50
51-100
101-200
201-300
301-400
401-500
Above 500 units
Smart Meters (Optional for above 500 units/month
Time of Day Tariff (ToD) 10 AM to 12 Noon
Category II - Non-domestic/Commrl (A,B ,C, D, E & F)
Category II - Non-domestic/Commrl (A & B)
Lt - II (A) Upto 50 units/month
0-50 units
Lt - II (B) >50 Units/month
0-50 units
51- 100 units
101- 300 units
301- 500 units
Above 500 units
LT II (C): Advertisement Hoardings
LT II (D) : Function Halls / Auditoriums
LT II (E): Electric Vehicles (Evs) / Charging stations
Time of Day Tariffs Peak (6 AM to 10 AM & 6 PM to 10 PM)
Time of Day Tariffs Off Peak (10 PM to 6 AM)
LT II (F) : Start up power
Category III - Industrial
Industries (General)
Seasonal Industries (off season)
Aquaculture and Animal Husbandry
Sugarcane crushing
Mushroom and Rabbit farms
Floriculture in Green House
Poultry Hactcheries & Poultry Feed mixing plants, Aqua
Hatcheries and Aqua Feed mixing plants
Consumer Categories Surcharge
(Rs.Crs)
Additional
Surcharge
(Rs.Crs)
Direct Apportioned
0.00 7087.71 0.00 0.00 0.00 0.00 608.23 7695.94
0.00 3229.08 223.36 3452.44
622.95 622.95
413.31 413.31
147.38 147.38
38.07 38.07
24.19 24.19
1622.01 1622.01
496.47 496.47
463.58 463.58
462.75 462.75
132.59 132.59
66.62 66.62
984.12 984.12
78.48 78.48
88.63 88.63
260.30 260.30
221.05 221.05
125.48 125.48
69.05 69.05
141.13 141.13
0.00 0.00
0.00 0.00
0.00 1952.73 49.12 2001.85
1924.20 1924.20
137.71 137.71
137.71 137.71
1786.49 1786.49
156.12 156.12
164.89 164.89
326.86 326.86
174.75 174.75
963.88 963.88
3.00 3.00
25.54 25.54
0.00 0.00
0.00 0.00
0.00 0.00
0.00 0.00
0.00 1301.28 59.32 1360.61
774.91 774.91
0.01 0.01
517.78 517.78
0.71 0.71
0.04 0.04
0.02 0.02
7.81 7.81
Net Revenue
from Tariff
(Rs. Crores)
Non - tariff Income Total
Revenue
( Net of
incentives)
(Rs.Crs)
Grid
Support
Charges
(Rs. Crs)
Incentives
(Rs. Crs)
Surcharges
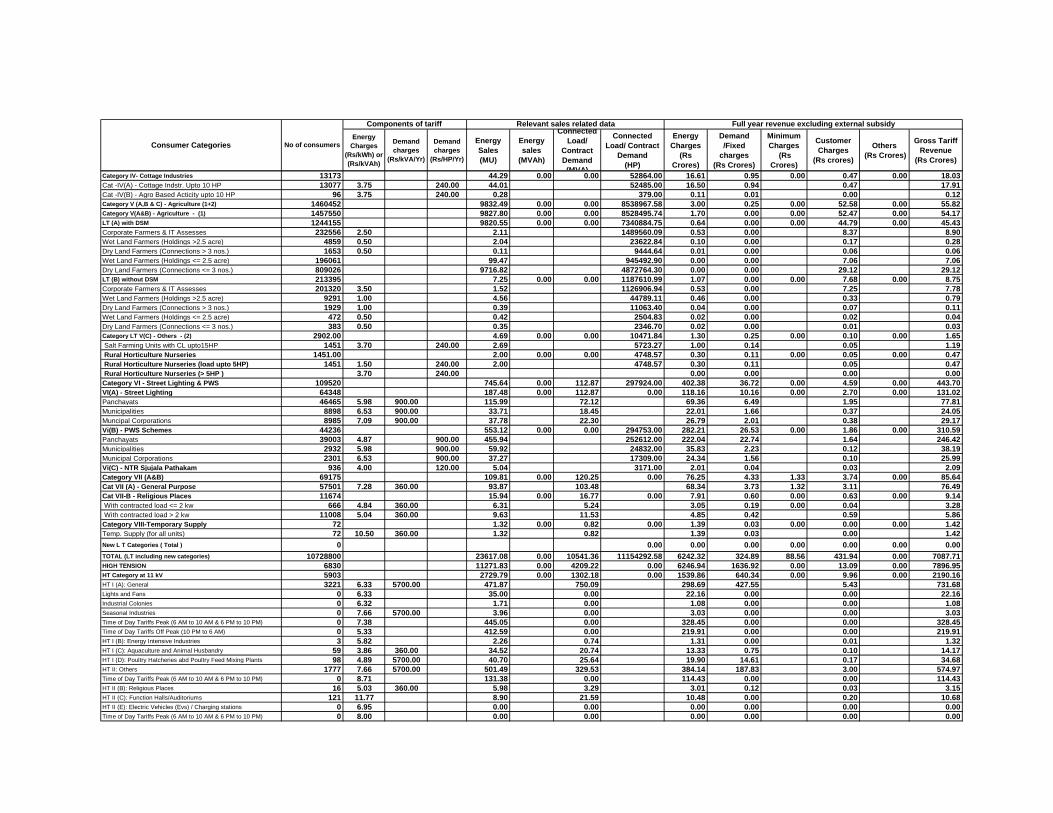
Energy
Charges
(Rs/kWh) or
(Rs/kVAh)
Demand
charges
(Rs/kVA/Yr)
Demand
charges
(Rs/HP/Yr)
Energy
Sales
(MU)
Energy
sales
(MVAh)
Connected
Load/
Contract
Demand
(MVA)
Connected
Load/ Contract
Demand
(HP)
Energy
Charges
(Rs
Crores)
Demand
/Fixed
charges
(Rs Crores)
Minimum
Charges
(Rs
Crores)
Customer
Charges
(Rs crores)
Others
(Rs Crores)
Gross Tariff
Revenue
(Rs Crores)
Full year revenue excluding external subsidyRelevant sales related data
Consumer Categories No of consumers
Components of tariff
Category IV- Cottage Industries 13173 44.29 0.00 0.00 52864.00 16.61 0.95 0.00 0.47 0.00 18.03
Cat -IV(A) - Cottage Indstr. Upto 10 HP 13077 3.75 240.00 44.01 52485.00 16.50 0.94 0.47 17.91
Cat -IV(B) - Agro Based Acticity upto 10 HP 96 3.75 240.00 0.28 379.00 0.11 0.01 0.00 0.12Category V (A,B & C) - Agriculture (1+2) 1460452 9832.49 0.00 0.00 8538967.58 3.00 0.25 0.00 52.58 0.00 55.82Category V(A&B) - Agriculture - (1) 1457550 9827.80 0.00 0.00 8528495.74 1.70 0.00 0.00 52.47 0.00 54.17LT (A) with DSM 1244155 9820.55 0.00 0.00 7340884.75 0.64 0.00 0.00 44.79 0.00 45.43
Corporate Farmers & IT Assesses 232556 2.50 2.11 1489560.09 0.53 0.00 8.37 8.90
Wet Land Farmers (Holdings >2.5 acre) 4859 0.50 2.04 23622.84 0.10 0.00 0.17 0.28
Dry Land Farmers (Connections > 3 nos.) 1653 0.50 0.11 9444.64 0.01 0.00 0.06 0.06
Wet Land Farmers (Holdings <= 2.5 acre) 196061 99.47 945492.90 0.00 0.00 7.06 7.06
Dry Land Farmers (Connections <= 3 nos.) 809026 9716.82 4872764.30 0.00 0.00 29.12 29.12LT (B) without DSM 213395 7.25 0.00 0.00 1187610.99 1.07 0.00 0.00 7.68 0.00 8.75
Corporate Farmers & IT Assesses 201320 3.50 1.52 1126906.94 0.53 0.00 7.25 7.78
Wet Land Farmers (Holdings >2.5 acre) 9291 1.00 4.56 44789.11 0.46 0.00 0.33 0.79
Dry Land Farmers (Connections > 3 nos.) 1929 1.00 0.39 11063.40 0.04 0.00 0.07 0.11
Wet Land Farmers (Holdings <= 2.5 acre) 472 0.50 0.42 2504.83 0.02 0.00 0.02 0.04
Dry Land Farmers (Connections <= 3 nos.) 383 0.50 0.35 2346.70 0.02 0.00 0.01 0.03Category LT V(C) - Others - (2) 2902.00 4.69 0.00 0.00 10471.84 1.30 0.25 0.00 0.10 0.00 1.65
Salt Farming Units with CL upto15HP 1451 3.70 240.00 2.69 5723.27 1.00 0.14 0.05 1.19
Rural Horticulture Nurseries 1451.00 2.00 0.00 0.00 4748.57 0.30 0.11 0.00 0.05 0.00 0.47
Rural Horticulture Nurseries (load upto 5HP) 1451 1.50 240.00 2.00 4748.57 0.30 0.11 0.05 0.47
Rural Horticulture Nurseries (> 5HP ) 3.70 240.00 0.00 0.00 0.00 0.00
Category VI - Street Lighting & PWS 109520 745.64 0.00 112.87 297924.00 402.38 36.72 0.00 4.59 0.00 443.70
VI(A) - Street Lighting 64348 187.48 0.00 112.87 0.00 118.16 10.16 0.00 2.70 0.00 131.02
Panchayats 46465 5.98 900.00 115.99 72.12 69.36 6.49 1.95 77.81
Municipalities 8898 6.53 900.00 33.71 18.45 22.01 1.66 0.37 24.05
Muncipal Corporations 8985 7.09 900.00 37.78 22.30 26.79 2.01 0.38 29.17
Vi(B) - PWS Schemes 44236 553.12 0.00 0.00 294753.00 282.21 26.53 0.00 1.86 0.00 310.59
Panchayats 39003 4.87 900.00 455.94 252612.00 222.04 22.74 1.64 246.42
Municipalities 2932 5.98 900.00 59.92 24832.00 35.83 2.23 0.12 38.19
Municipal Corporations 2301 6.53 900.00 37.27 17309.00 24.34 1.56 0.10 25.99
Vi(C) - NTR Sjujala Pathakam 936 4.00 120.00 5.04 3171.00 2.01 0.04 0.03 2.09
Category VII (A&B) 69175 109.81 0.00 120.25 0.00 76.25 4.33 1.33 3.74 0.00 85.64
Cat VII (A) - General Purpose 57501 7.28 360.00 93.87 103.48 68.34 3.73 1.32 3.11 76.49
Cat VII-B - Religious Places 11674 15.94 0.00 16.77 0.00 7.91 0.60 0.00 0.63 0.00 9.14
With contracted load <= 2 kw 666 4.84 360.00 6.31 5.24 3.05 0.19 0.00 0.04 3.28
With contracted load > 2 kw 11008 5.04 360.00 9.63 11.53 4.85 0.42 0.59 5.86
Category VIII-Temporary Supply 72 1.32 0.00 0.82 0.00 1.39 0.03 0.00 0.00 0.00 1.42
Temp. Supply (for all units) 72 10.50 360.00 1.32 0.82 1.39 0.03 0.00 1.42
New L T Categories ( Total ) 0 0.00 0.00 0.00 0.00 0.00 0.00 0.00
TOTAL (LT including new categories) 10728800 23617.08 0.00 10541.36 11154292.58 6242.32 324.89 88.56 431.94 0.00 7087.71HIGH TENSION 6830 11271.83 0.00 4209.22 0.00 6246.94 1636.92 0.00 13.09 0.00 7896.95HT Category at 11 kV 5903 2729.79 0.00 1302.18 0.00 1539.86 640.34 0.00 9.96 0.00 2190.16HT I (A): General 3221 6.33 5700.00 471.87 750.09 298.69 427.55 5.43 731.68Lights and Fans 0 6.33 35.00 0.00 22.16 0.00 0.00 22.16Industrial Colonies 0 6.32 1.71 0.00 1.08 0.00 0.00 1.08Seasonal Industries 0 7.66 5700.00 3.96 0.00 3.03 0.00 0.00 3.03Time of Day Tariffs Peak (6 AM to 10 AM & 6 PM to 10 PM) 0 7.38 445.05 0.00 328.45 0.00 0.00 328.45Time of Day Tariffs Off Peak (10 PM to 6 AM) 0 5.33 412.59 0.00 219.91 0.00 0.00 219.91HT I (B): Energy Intensive Industries 3 5.82 2.26 0.74 1.31 0.00 0.01 1.32HT I (C): Aquaculture and Animal Husbandry 59 3.86 360.00 34.52 20.74 13.33 0.75 0.10 14.17HT I (D): Poultry Hatcheries abd Poultry Feed Mixing Plants 98 4.89 5700.00 40.70 25.64 19.90 14.61 0.17 34.68HT II: Others 1777 7.66 5700.00 501.49 329.53 384.14 187.83 3.00 574.97Time of Day Tariffs Peak (6 AM to 10 AM & 6 PM to 10 PM) 0 8.71 131.38 0.00 114.43 0.00 0.00 114.43HT II (B): Religious Places 16 5.03 360.00 5.98 3.29 3.01 0.12 0.03 3.15HT II (C): Function Halls/Auditoriums 121 11.77 8.90 21.59 10.48 0.00 0.20 10.68HT II (E): Electric Vehicles (Evs) / Charging stations 0 6.95 0.00 0.00 0.00 0.00 0.00 0.00Time of Day Tariffs Peak (6 AM to 10 AM & 6 PM to 10 PM) 0 8.00 0.00 0.00 0.00 0.00 0.00 0.00
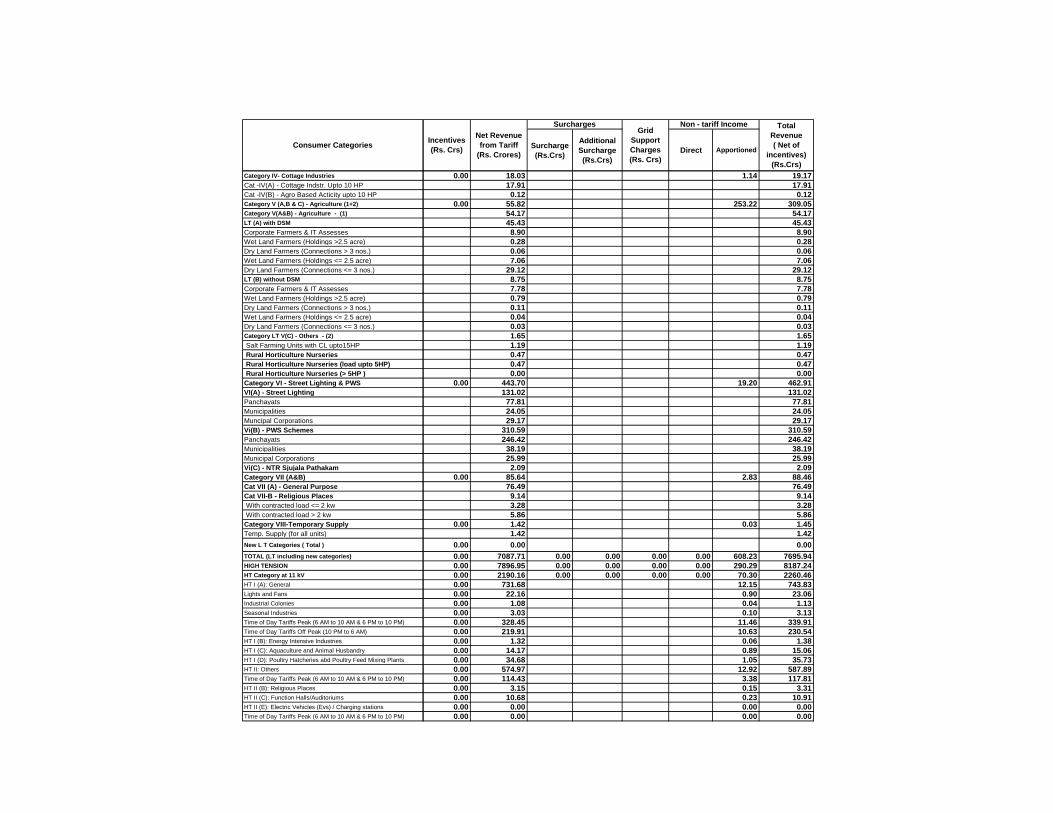
Consumer Categories
Category IV- Cottage Industries
Cat -IV(A) - Cottage Indstr. Upto 10 HP
Cat -IV(B) - Agro Based Acticity upto 10 HP
Category V (A,B & C) - Agriculture (1+2)
Category V(A&B) - Agriculture - (1)
LT (A) with DSM
Corporate Farmers & IT Assesses
Wet Land Farmers (Holdings >2.5 acre)
Dry Land Farmers (Connections > 3 nos.)
Wet Land Farmers (Holdings <= 2.5 acre)
Dry Land Farmers (Connections <= 3 nos.)
LT (B) without DSM
Corporate Farmers & IT Assesses
Wet Land Farmers (Holdings >2.5 acre)
Dry Land Farmers (Connections > 3 nos.)
Wet Land Farmers (Holdings <= 2.5 acre)
Dry Land Farmers (Connections <= 3 nos.)
Category LT V(C) - Others - (2)
Salt Farming Units with CL upto15HP
Rural Horticulture Nurseries
Rural Horticulture Nurseries (load upto 5HP)
Rural Horticulture Nurseries (> 5HP )
Category VI - Street Lighting & PWS
VI(A) - Street Lighting
Panchayats
Municipalities
Muncipal Corporations
Vi(B) - PWS Schemes
Panchayats
Municipalities
Municipal Corporations
Vi(C) - NTR Sjujala Pathakam
Category VII (A&B)
Cat VII (A) - General Purpose
Cat VII-B - Religious Places
With contracted load <= 2 kw
With contracted load > 2 kw
Category VIII-Temporary Supply
Temp. Supply (for all units)
New L T Categories ( Total )
TOTAL (LT including new categories)
HIGH TENSION
HT Category at 11 kV
HT I (A): General
Lights and Fans
Industrial Colonies
Seasonal Industries
Time of Day Tariffs Peak (6 AM to 10 AM & 6 PM to 10 PM)
Time of Day Tariffs Off Peak (10 PM to 6 AM)
HT I (B): Energy Intensive Industries
HT I (C): Aquaculture and Animal Husbandry
HT I (D): Poultry Hatcheries abd Poultry Feed Mixing Plants
HT II: Others
Time of Day Tariffs Peak (6 AM to 10 AM & 6 PM to 10 PM)
HT II (B): Religious Places
HT II (C): Function Halls/Auditoriums
HT II (E): Electric Vehicles (Evs) / Charging stations
Time of Day Tariffs Peak (6 AM to 10 AM & 6 PM to 10 PM)
Surcharge
(Rs.Crs)
Additional
Surcharge
(Rs.Crs)
Direct Apportioned
Net Revenue
from Tariff
(Rs. Crores)
Non - tariff Income Total
Revenue
( Net of
incentives)
(Rs.Crs)
Grid
Support
Charges
(Rs. Crs)
Incentives
(Rs. Crs)
Surcharges
0.00 18.03 1.14 19.17
17.91 17.91
0.12 0.12
0.00 55.82 253.22 309.05
54.17 54.17
45.43 45.43
8.90 8.90
0.28 0.28
0.06 0.06
7.06 7.06
29.12 29.12
8.75 8.75
7.78 7.78
0.79 0.79
0.11 0.11
0.04 0.04
0.03 0.03
1.65 1.65
1.19 1.19
0.47 0.47
0.47 0.47
0.00 0.00
0.00 443.70 19.20 462.91
131.02 131.02
77.81 77.81
24.05 24.05
29.17 29.17
310.59 310.59
246.42 246.42
38.19 38.19
25.99 25.99
2.09 2.09
0.00 85.64 2.83 88.46
76.49 76.49
9.14 9.14
3.28 3.28
5.86 5.86
0.00 1.42 0.03 1.45
1.42 1.42
0.00 0.00 0.00
0.00 7087.71 0.00 0.00 0.00 0.00 608.23 7695.94
0.00 7896.95 0.00 0.00 0.00 0.00 290.29 8187.24
0.00 2190.16 0.00 0.00 0.00 0.00 70.30 2260.46
0.00 731.68 12.15 743.83
0.00 22.16 0.90 23.06
0.00 1.08 0.04 1.13
0.00 3.03 0.10 3.13
0.00 328.45 11.46 339.91
0.00 219.91 10.63 230.54
0.00 1.32 0.06 1.38
0.00 14.17 0.89 15.06
0.00 34.68 1.05 35.73
0.00 574.97 12.92 587.89
0.00 114.43 3.38 117.81
0.00 3.15 0.15 3.31
0.00 10.68 0.23 10.91
0.00 0.00 0.00 0.00
0.00 0.00 0.00 0.00

Energy
Charges
(Rs/kWh) or
(Rs/kVAh)
Demand
charges
(Rs/kVA/Yr)
Demand
charges
(Rs/HP/Yr)
Energy
Sales
(MU)
Energy
sales
(MVAh)
Connected
Load/
Contract
Demand
(MVA)
Connected
Load/ Contract
Demand
(HP)
Energy
Charges
(Rs
Crores)
Demand
/Fixed
charges
(Rs Crores)
Minimum
Charges
(Rs
Crores)
Customer
Charges
(Rs crores)
Others
(Rs Crores)
Gross Tariff
Revenue
(Rs Crores)
Full year revenue excluding external subsidyRelevant sales related data
Consumer Categories No of consumers
Components of tariff
Time of Day Tariffs Off Peak (10 PM to 6 AM) 0 5.95 0.00 0.00 0.00 0.00 0.00 0.00HT II (F) : Start up power 6 11.77 0.21 0.44 0.24 0.00 0.01 0.25HT III: Public Infrastructure and Tourism 65 7.30 5700.00 34.08 15.11 24.88 8.61 0.11 33.60Time of Day Tariffs (6 PM to 10 PM) 0 8.35 7.96 0.00 6.64 0.00 0.00 6.64HT IV Government LIS 380 5.82 56.22 104.23 32.72 0.00 0.64 33.36HT IV Private Irrigation and Agriculture 0 5.82 0.00 0.00 0.00 0.00 0.00 0.00HT IV CPWS 109 4.89 48.29 21.07 23.62 0.00 0.18 23.80HT VI: Townships & Residential Colonies 46 6.32 900.00 22.66 9.58 14.32 0.86 0.08 15.26 HT VII: Green Power 0 11.32 0.02 0.00 0.03 0.00 0.00 0.03 HT VIII: Temporary 1 9.50 2.33 0.14 2.21 0.00 0.00 2.22 Category: RESCOs 1 0.33 462.59 0.00 15.27 0.00 0.00 15.27HT Category at 33 kV 805 3755.32 0.00 1151.69 0.00 2210.06 514.50 0.00 2.72 0.00 2727.28HT I (A): General 349 5.87 5700.00 1034.14 818.85 607.04 466.74 1.18 1074.96Lights and Fans 0 5.87 30.64 0.00 17.99 0.00 0.00 17.99Industrial Colonies 0 6.32 10.83 0.00 6.84 0.00 0.00 6.84Seasonal Industries 0 6.98 5700.00 0.86 0.00 0.60 0.00 0.00 0.60Time of Day Tariffs Peak (6 AM to 10 AM & 6 PM to 10 PM) 0 6.92 1030.61 0.00 713.18 0.00 0.00 713.18Time of Day Tariffs Off Peak (10 PM to 6 AM) 0 4.87 1010.64 0.00 492.18 0.00 0.00 492.18HT I (B): Energy Intensive Industries 11 5.37 252.30 50.15 135.49 0.00 0.04 135.52HT I (C) : Aquaculture and Animal Husbandry 0 3.86 360.00 0.00 0.00 0.00 0.00 0.00 0.00HT I (D) : Poultry Hatcheries and Poultry Feed Mixing Plants 15 4.89 5700.00 70.83 27.81 34.64 15.85 0.05 50.54HT II: Others 62 6.98 5700.00 83.51 51.88 58.29 29.57 0.21 88.07Time of Day Tariffs (6 PM to 10 PM) 0 8.03 25.89 0.00 20.79 0.00 0.00 20.79HT II (B): Religious Places 1 5.03 360.00 29.01 7.00 14.59 0.25 0.00 14.85HT II (C) : Function Halls / Auditoriums 0 11.77 0.11 0.00 0.13 0.00 0.00 0.13HT II (E): Electric Vehicles (Evs) / Charging stations 0 6.95 0.00 0.00 0.00 0.00 0.00 0.00Time of Day Tariffs Peak (6 AM to 10 AM & 6 PM to 10 PM) 0 8.00 0.00 0.00 0.00 0.00 0.00 0.00Time of Day Tariffs Off Peak (10 PM to 6 AM) 0 5.95 0.00 0.00 0.00 0.00 0.00 0.00HT II (F) : Start up power 285 11.77 17.37 39.27 20.45 0.00 0.96 21.41HT III: Public Infrastructure and Tourism 3 6.69 5700.00 6.77 3.20 4.53 1.82 0.01 6.36Time of Day Tariffs (6 PM to 10 PM) 0 7.74 1.87 0.00 1.45 0.00 0.00 1.45HT IV Government LIS 52 5.82 86.31 129.89 50.23 0.00 0.18 50.41HT IV Agriculture 0 5.82 0.00 0.00 0.00 0.00 0.00 0.00HT IV CPWS 20 4.89 59.86 20.74 29.27 0.00 0.07 29.34HT VI: Townships & Residential Colonies 7 6.32 900.00 3.76 2.90 2.38 0.26 0.02 2.66HT VII: Green Power 0 11.32 0.00 0.00 0.00 0.00 0.00 0.00HT VIII: Temporary 0 8.81 0.00 0.00 0.00 0.00 0.00 0.00Category: RESCOs 0 0.33 0.00 0.00 0.00 0.00 0.00HT Category at 132 kV 122 4786.72 0.00 1755.36 0.00 2497.02 482.07 0.00 0.41 0.00 2979.51HT I (A): General 46 5.44 5700.00 864.08 621.48 470.06 354.24 0.16 824.46Lights and Fans 0 5.44 14.63 0.00 7.96 0.00 0.00 7.96Industrial Colonies 0 6.32 12.95 0.00 8.18 0.00 0.00 8.18Seasonal Industries 0 6.72 5700.00 0.00 0.00 0.00 0.00 0.00 0.00Time of Day Tariffs Peak (6 AM to 10 AM & 6 PM to 10 PM) 0 6.49 840.39 0.00 545.41 0.00 0.00 545.41Time of Day Tariffs Off Peak (10 PM to 6 AM) 0 4.44 900.70 0.00 399.91 0.00 0.00 399.91HT I (B): Energy Intensive Industries 1 4.95 108.68 18.00 53.79 0.00 0.00 53.80HT I (C ): Aquaculture and Animal Husbandry 0 3.86 360.00 0.00 0.00 0.00 0.00 0.00 0.00HT I (D): Poultry Hatcheries and Poultry Feed Mixing Plants 0 4.89 5700.00 0.00 0.00 0.00 0.00 0.00 0.00HT II: Others 1 6.72 5700.00 37.52 13.00 25.21 7.41 0.00 32.63Time of Day Tariffs (6 PM to 10 PM) 0 7.77 8.41 0.00 6.53 0.00 0.00 6.53HT II (B): Religious Places 0 5.03 360.00 0.00 0.00 0.00 0.00 0.00 0.00HT II (C) : Function Halls / Auditoriums 0 11.77 0.00 0.00 0.00 0.00 0.00 0.00HT II (E): Electric Vehicles (Evs) / Charging stations 0 6.95 0.00 0.00 0.00 0.00 0.00 0.00Time of Day Tariffs Peak (6 AM to 10 AM & 6 PM to 10 PM) 0 8.00 0.00 0.00 0.00 0.00 0.00 0.00Time of Day Tariffs Off Peak (10 PM to 6 AM) 0 5.95 0.00 0.00 0.00 0.00 0.00 0.00HT II (F) : Start up power 18 11.77 3.62 2.84 4.26 0.00 0.06 4.32HT III: Public Infrastructure and Tourism 0 6.38 5700.00 0.00 0.00 0.00 0.00 0.00 0.00Time of Day Tariffs (6 PM to 10 PM) 0 7.43 0.00 0.00 0.00 0.00 0.00 0.00HT IV Government LIS 26 5.82 1177.12 765.53 685.09 0.00 0.09 685.17HT IV Agriculture 0 5.82 0.00 0.00 0.00 0.00 0.00 0.00HT IV CPWS 0 4.89 0.00 0.00 0.00 0.00 0.00 0.00HT V: Railway Traction 30 3.55 3600.00 818.64 334.50 290.62 120.42 0.10 411.14HT VI: Townships & Residential Colonies 0 6.32 900.00 0.00 0.00 0.00 0.00 0.00 0.00HT VII: Green Power 0 11.32 0.00 0.00 0.00 0.00 0.00 0.00HT VIII: Temporary 0 8.16 0.00 0.00 0.00 0.00 0.00 0.00
Category: RESCOs 0 0.33 0.00 0.00 0.00 0.00 0.00
TOTAL( LT + HT) 10735630 34888.91 0.00 14750.58 11154292.58 12489.26 1961.80 88.56 445.03 0.00 14984.65
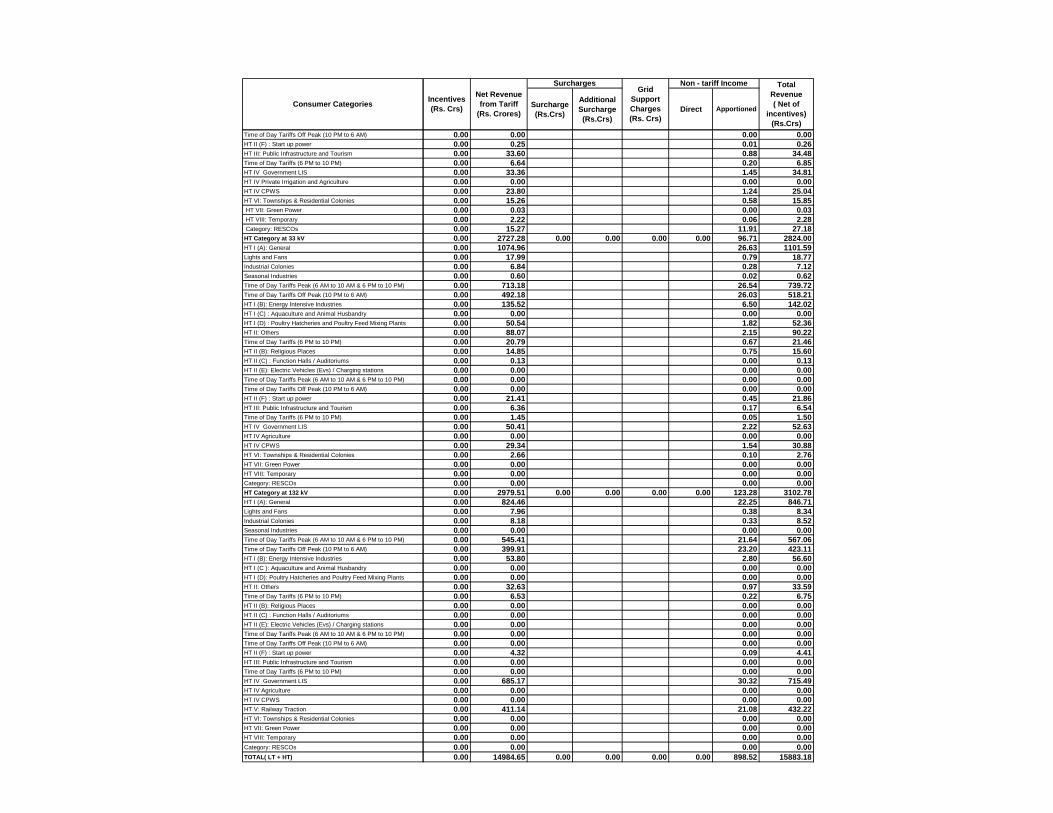
Consumer Categories
Time of Day Tariffs Off Peak (10 PM to 6 AM)
HT II (F) : Start up power
HT III: Public Infrastructure and Tourism
Time of Day Tariffs (6 PM to 10 PM)
HT IV Government LIS
HT IV Private Irrigation and Agriculture
HT IV CPWS
HT VI: Townships & Residential Colonies
HT VII: Green Power
HT VIII: Temporary
Category: RESCOs
HT Category at 33 kV
HT I (A): General
Lights and Fans
Industrial Colonies
Seasonal Industries
Time of Day Tariffs Peak (6 AM to 10 AM & 6 PM to 10 PM)
Time of Day Tariffs Off Peak (10 PM to 6 AM)
HT I (B): Energy Intensive Industries
HT I (C) : Aquaculture and Animal Husbandry
HT I (D) : Poultry Hatcheries and Poultry Feed Mixing Plants
HT II: Others
Time of Day Tariffs (6 PM to 10 PM)
HT II (B): Religious Places
HT II (C) : Function Halls / Auditoriums
HT II (E): Electric Vehicles (Evs) / Charging stations
Time of Day Tariffs Peak (6 AM to 10 AM & 6 PM to 10 PM)
Time of Day Tariffs Off Peak (10 PM to 6 AM)
HT II (F) : Start up power
HT III: Public Infrastructure and Tourism
Time of Day Tariffs (6 PM to 10 PM)
HT IV Government LIS
HT IV Agriculture
HT IV CPWS
HT VI: Townships & Residential Colonies
HT VII: Green Power
HT VIII: Temporary
Category: RESCOs
HT Category at 132 kV
HT I (A): General
Lights and Fans
Industrial Colonies
Seasonal Industries
Time of Day Tariffs Peak (6 AM to 10 AM & 6 PM to 10 PM)
Time of Day Tariffs Off Peak (10 PM to 6 AM)
HT I (B): Energy Intensive Industries
HT I (C ): Aquaculture and Animal Husbandry
HT I (D): Poultry Hatcheries and Poultry Feed Mixing Plants
HT II: Others
Time of Day Tariffs (6 PM to 10 PM)
HT II (B): Religious Places
HT II (C) : Function Halls / Auditoriums
HT II (E): Electric Vehicles (Evs) / Charging stations
Time of Day Tariffs Peak (6 AM to 10 AM & 6 PM to 10 PM)
Time of Day Tariffs Off Peak (10 PM to 6 AM)
HT II (F) : Start up power
HT III: Public Infrastructure and Tourism
Time of Day Tariffs (6 PM to 10 PM)
HT IV Government LIS
HT IV Agriculture
HT IV CPWS
HT V: Railway Traction
HT VI: Townships & Residential Colonies
HT VII: Green Power
HT VIII: Temporary
Category: RESCOs
TOTAL( LT + HT)
Surcharge
(Rs.Crs)
Additional
Surcharge
(Rs.Crs)
Direct Apportioned
Net Revenue
from Tariff
(Rs. Crores)
Non - tariff Income Total
Revenue
( Net of
incentives)
(Rs.Crs)
Grid
Support
Charges
(Rs. Crs)
Incentives
(Rs. Crs)
Surcharges
0.00 0.00 0.00 0.00
0.00 0.25 0.01 0.26
0.00 33.60 0.88 34.48
0.00 6.64 0.20 6.85
0.00 33.36 1.45 34.81
0.00 0.00 0.00 0.00
0.00 23.80 1.24 25.04
0.00 15.26 0.58 15.85
0.00 0.03 0.00 0.03
0.00 2.22 0.06 2.28
0.00 15.27 11.91 27.18
0.00 2727.28 0.00 0.00 0.00 0.00 96.71 2824.00
0.00 1074.96 26.63 1101.59
0.00 17.99 0.79 18.77
0.00 6.84 0.28 7.12
0.00 0.60 0.02 0.62
0.00 713.18 26.54 739.72
0.00 492.18 26.03 518.21
0.00 135.52 6.50 142.02
0.00 0.00 0.00 0.00
0.00 50.54 1.82 52.36
0.00 88.07 2.15 90.22
0.00 20.79 0.67 21.46
0.00 14.85 0.75 15.60
0.00 0.13 0.00 0.13
0.00 0.00 0.00 0.00
0.00 0.00 0.00 0.00
0.00 0.00 0.00 0.00
0.00 21.41 0.45 21.86
0.00 6.36 0.17 6.54
0.00 1.45 0.05 1.50
0.00 50.41 2.22 52.63
0.00 0.00 0.00 0.00
0.00 29.34 1.54 30.88
0.00 2.66 0.10 2.76
0.00 0.00 0.00 0.00
0.00 0.00 0.00 0.00
0.00 0.00 0.00 0.00
0.00 2979.51 0.00 0.00 0.00 0.00 123.28 3102.78
0.00 824.46 22.25 846.71
0.00 7.96 0.38 8.34
0.00 8.18 0.33 8.52
0.00 0.00 0.00 0.00
0.00 545.41 21.64 567.06
0.00 399.91 23.20 423.11
0.00 53.80 2.80 56.60
0.00 0.00 0.00 0.00
0.00 0.00 0.00 0.00
0.00 32.63 0.97 33.59
0.00 6.53 0.22 6.75
0.00 0.00 0.00 0.00
0.00 0.00 0.00 0.00
0.00 0.00 0.00 0.00
0.00 0.00 0.00 0.00
0.00 0.00 0.00 0.00
0.00 4.32 0.09 4.41
0.00 0.00 0.00 0.00
0.00 0.00 0.00 0.00
0.00 685.17 30.32 715.49
0.00 0.00 0.00 0.00
0.00 0.00 0.00 0.00
0.00 411.14 21.08 432.22
0.00 0.00 0.00 0.00
0.00 0.00 0.00 0.00
0.00 0.00 0.00 0.00
0.00 0.00 0.00 0.00
0.00 14984.65 0.00 0.00 0.00 0.00 898.52 15883.18
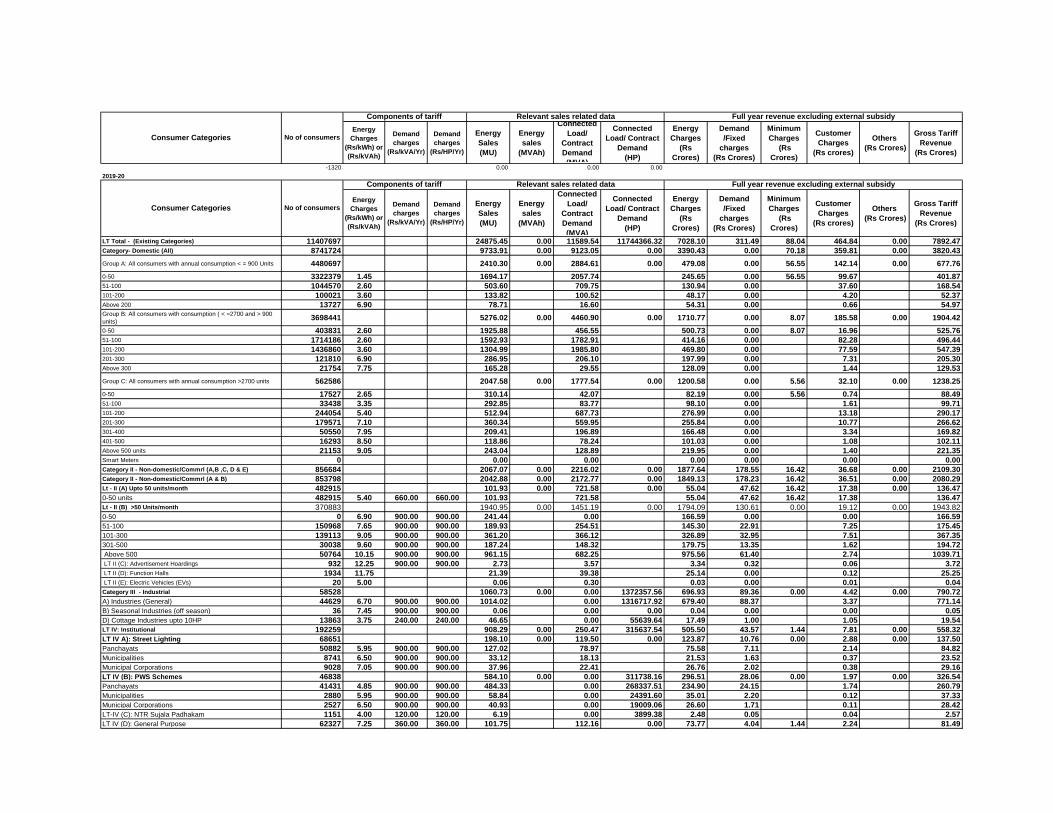
Energy
Charges
(Rs/kWh) or
(Rs/kVAh)
Demand
charges
(Rs/kVA/Yr)
Demand
charges
(Rs/HP/Yr)
Energy
Sales
(MU)
Energy
sales
(MVAh)
Connected
Load/
Contract
Demand
(MVA)
Connected
Load/ Contract
Demand
(HP)
Energy
Charges
(Rs
Crores)
Demand
/Fixed
charges
(Rs Crores)
Minimum
Charges
(Rs
Crores)
Customer
Charges
(Rs crores)
Others
(Rs Crores)
Gross Tariff
Revenue
(Rs Crores)
Full year revenue excluding external subsidyRelevant sales related data
Consumer Categories No of consumers
Components of tariff
-1320 0.00 0.00 0.00
2019-20
Energy
Charges
(Rs/kWh) or
(Rs/kVAh)
Demand
charges
(Rs/kVA/Yr)
Demand
charges
(Rs/HP/Yr)
Energy
Sales
(MU)
Energy
sales
(MVAh)
Connected
Load/
Contract
Demand
(MVA)
Connected
Load/ Contract
Demand
(HP)
Energy
Charges
(Rs
Crores)
Demand
/Fixed
charges
(Rs Crores)
Minimum
Charges
(Rs
Crores)
Customer
Charges
(Rs crores)
Others
(Rs Crores)
Gross Tariff
Revenue
(Rs Crores)
LT Total - (Existing Categories) 11407697 24875.45 0.00 11589.54 11744366.32 7028.10 311.49 88.04 464.84 0.00 7892.47Category- Domestic (All) 8741724 9733.91 0.00 9123.05 0.00 3390.43 0.00 70.18 359.81 0.00 3820.43
Group A: All consumers with annual consumption < = 900 Units 4480697 2410.30 0.00 2884.61 0.00 479.08 0.00 56.55 142.14 0.00 677.76
0-50 3322379 1.45 1694.17 2057.74 245.65 0.00 56.55 99.67 401.8751-100 1044570 2.60 503.60 709.75 130.94 0.00 37.60 168.54101-200 100021 3.60 133.82 100.52 48.17 0.00 4.20 52.37Above 200 13727 6.90 78.71 16.60 54.31 0.00 0.66 54.97Group B: All consumers with consumption ( < =2700 and > 900
units)3698441 5276.02 0.00 4460.90 0.00 1710.77 0.00 8.07 185.58 0.00 1904.42
0-50 403831 2.60 1925.88 456.55 500.73 0.00 8.07 16.96 525.7651-100 1714186 2.60 1592.93 1782.91 414.16 0.00 82.28 496.44101-200 1436860 3.60 1304.99 1985.80 469.80 0.00 77.59 547.39201-300 121810 6.90 286.95 206.10 197.99 0.00 7.31 205.30Above 300 21754 7.75 165.28 29.55 128.09 0.00 1.44 129.53
Group C: All consumers with annual consumption >2700 units 562586 2047.58 0.00 1777.54 0.00 1200.58 0.00 5.56 32.10 0.00 1238.25
0-50 17527 2.65 310.14 42.07 82.19 0.00 5.56 0.74 88.4951-100 33438 3.35 292.85 83.77 98.10 0.00 1.61 99.71101-200 244054 5.40 512.94 687.73 276.99 0.00 13.18 290.17201-300 179571 7.10 360.34 559.95 255.84 0.00 10.77 266.62301-400 50550 7.95 209.41 196.89 166.48 0.00 3.34 169.82401-500 16293 8.50 118.86 78.24 101.03 0.00 1.08 102.11Above 500 units 21153 9.05 243.04 128.89 219.95 0.00 1.40 221.35Smart Meters 0 0.00 0.00 0.00 0.00 0.00 0.00Category II - Non-domestic/Commrl (A,B ,C, D & E) 856684 2067.07 0.00 2216.02 0.00 1877.64 178.55 16.42 36.68 0.00 2109.30Category II - Non-domestic/Commrl (A & B) 853798 2042.88 0.00 2172.77 0.00 1849.13 178.23 16.42 36.51 0.00 2080.29Lt - II (A) Upto 50 units/month 482915 101.93 0.00 721.58 0.00 55.04 47.62 16.42 17.38 0.00 136.47
0-50 units 482915 5.40 660.00 660.00 101.93 721.58 55.04 47.62 16.42 17.38 136.47Lt - II (B) >50 Units/month 370883 1940.95 0.00 1451.19 0.00 1794.09 130.61 0.00 19.12 0.00 1943.82
0-50 0 6.90 900.00 900.00 241.44 0.00 166.59 0.00 0.00 166.59
51-100 150968 7.65 900.00 900.00 189.93 254.51 145.30 22.91 7.25 175.45
101-300 139113 9.05 900.00 900.00 361.20 366.12 326.89 32.95 7.51 367.35
301-500 30038 9.60 900.00 900.00 187.24 148.32 179.75 13.35 1.62 194.72
Above 500 50764 10.15 900.00 900.00 961.15 682.25 975.56 61.40 2.74 1039.71 LT II (C): Advertisement Hoardings 932 12.25 900.00 900.00 2.73 3.57 3.34 0.32 0.06 3.72 LT II (D): Function Halls 1934 11.75 21.39 39.38 25.14 0.00 0.12 25.25 LT II (E): Electric Vehicles (EVs) 20 5.00 0.06 0.30 0.03 0.00 0.01 0.04Category III - Industrial 58528 1060.73 0.00 0.00 1372357.56 696.93 89.36 0.00 4.42 0.00 790.72
A) Industries (General) 44629 6.70 900.00 900.00 1014.02 0.00 1316717.92 679.40 88.37 3.37 771.14
B) Seasonal Industries (off season) 36 7.45 900.00 900.00 0.06 0.00 0.00 0.04 0.00 0.00 0.05
D) Cottage Industries upto 10HP 13863 3.75 240.00 240.00 46.65 0.00 55639.64 17.49 1.00 1.05 19.54LT IV: Institutional 192259 908.29 0.00 250.47 315637.54 505.50 43.57 1.44 7.81 0.00 558.32
LT IV A): Street Lighting 68651 198.10 0.00 119.50 0.00 123.87 10.76 0.00 2.88 0.00 137.50
Panchayats 50882 5.95 900.00 900.00 127.02 78.97 75.58 7.11 2.14 84.82
Municipalities 8741 6.50 900.00 900.00 33.12 18.13 21.53 1.63 0.37 23.52
Municipal Corporations 9028 7.05 900.00 900.00 37.96 22.41 26.76 2.02 0.38 29.16
LT IV (B): PWS Schemes 46838 584.10 0.00 0.00 311738.16 296.51 28.06 0.00 1.97 0.00 326.54
Panchayats 41431 4.85 900.00 900.00 484.33 0.00 268337.51 234.90 24.15 1.74 260.79
Municipalities 2880 5.95 900.00 900.00 58.84 0.00 24391.60 35.01 2.20 0.12 37.33
Municipal Corporations 2527 6.50 900.00 900.00 40.93 0.00 19009.06 26.60 1.71 0.11 28.42
LT-IV (C): NTR Sujala Padhakam 1151 4.00 120.00 120.00 6.19 0.00 3899.38 2.48 0.05 0.04 2.57
LT IV (D): General Purpose 62327 7.25 360.00 360.00 101.75 112.16 0.00 73.77 4.04 1.44 2.24 81.49
Consumer Categories No of consumers
Components of tariff Relevant sales related data Full year revenue excluding external subsidy

Consumer Categories
2019-20
LT Total - (Existing Categories)
Category- Domestic (All)
Group A: All consumers with annual consumption < = 900 Units
0-50
51-100
101-200
Above 200
Group B: All consumers with consumption ( < =2700 and > 900
units)
0-50
51-100
101-200
201-300
Above 300
Group C: All consumers with annual consumption >2700 units
0-50
51-100
101-200
201-300
301-400
401-500
Above 500 units
Smart Meters
Category II - Non-domestic/Commrl (A,B ,C, D & E)
Category II - Non-domestic/Commrl (A & B)
Lt - II (A) Upto 50 units/month
0-50 units
Lt - II (B) >50 Units/month
0-50
51-100
101-300
301-500
Above 500
LT II (C): Advertisement Hoardings
LT II (D): Function Halls
LT II (E): Electric Vehicles (EVs)
Category III - Industrial
A) Industries (General)
B) Seasonal Industries (off season)
D) Cottage Industries upto 10HP
LT IV: Institutional
LT IV A): Street Lighting
Panchayats
Municipalities
Municipal Corporations
LT IV (B): PWS Schemes
Panchayats
Municipalities
Municipal Corporations
LT-IV (C): NTR Sujala Padhakam
LT IV (D): General Purpose
Consumer Categories
Surcharge
(Rs.Crs)
Additional
Surcharge
(Rs.Crs)
Direct Apportioned
Net Revenue
from Tariff
(Rs. Crores)
Non - tariff Income Total
Revenue
( Net of
incentives)
(Rs.Crs)
Grid
Support
Charges
(Rs. Crs)
Incentives
(Rs. Crs)
Surcharges
Surcharge
(Rs.Crs)
Additional
Surcharge
(Rs.Crs)
Direct Apportioned
0.00 7892.47 0.00 0.00 0.00 0.00 638.40 8530.87
0.00 3820.43 249.81 4070.24
677.76 677.76
401.87 401.87
168.54 168.54
52.37 52.37
54.97 54.97
1904.42 1904.42
525.76 525.76
496.44 496.44
547.39 547.39
205.30 205.30
129.53 129.53
1238.25 1238.25
88.49 88.49
99.71 99.71
290.17 290.17
266.62 266.62
169.82 169.82
102.11 102.11
221.35 221.35
0.00 0.00
0.00 2109.30 53.05 2162.35
2080.29 2080.29
136.47 136.47
136.47 136.47
1943.82 1943.82
166.59 166.59
175.45 175.45
367.35 367.35
194.72 194.72
1039.71 1039.71
3.72 3.72
25.25 25.25
0.04 0.04
0.00 790.72 27.22 817.94
771.14 771.14
0.05 0.05
19.54 19.54
0.00 558.32 23.31 581.63
137.50 137.50
84.82 84.82
23.52 23.52
29.16 29.16
326.54 326.54
260.79 260.79
37.33 37.33
28.42 28.42
2.57 2.57
81.49 81.49
SurchargesGrid
Support
Charges
(Rs. Crs)
Non - tariff Income
Incentives
(Rs. Crs)
Total
Revenue
( Net of
incentives)
(Rs.Crs)
Net Revenue
from Tariff
(Rs. Crores)

Energy
Charges
(Rs/kWh) or
(Rs/kVAh)
Demand
charges
(Rs/kVA/Yr)
Demand
charges
(Rs/HP/Yr)
Energy
Sales
(MU)
Energy
sales
(MVAh)
Connected
Load/
Contract
Demand
(MVA)
Connected
Load/ Contract
Demand
(HP)
Energy
Charges
(Rs
Crores)
Demand
/Fixed
charges
(Rs Crores)
Minimum
Charges
(Rs
Crores)
Customer
Charges
(Rs crores)
Others
(Rs Crores)
Gross Tariff
Revenue
(Rs Crores)
Full year revenue excluding external subsidyRelevant sales related data
Consumer Categories No of consumers
Components of tariff
LT IV (E): Religious Places 13292 18.15 0.00 18.80 0.00 8.87 0.68 0.00 0.67 0.00 10.22
(i) Religious Places (CL > 2kW) 841 5.00 360.00 360.00 7.97 6.61 3.98 0.24 0.00 0.05 4.27
(ii) Religious Places (CL <= 2kW) 11634 4.80 360.00 360.00 10.18 12.19 4.89 0.44 0.00 0.63 5.95
LT V: Agriculture 1558490 11104.80 0.00 0.00 10056371.22 556.91 0.00 0.00 56.11 0.00 613.01LT V (B) 0.00 0.00Corporate Farmers with DSM 8561 2.50 2.08 45293.70 0.52 0.00 0.31 0.83Corporate Farmers without DSM 7200 3.50 1.47 37765.51 0.51 0.00 0.26 0.77Non-Corporate Farmers 1501391 0.00 9653.33 8921857.09 0.00 0.00 54.05 54.05
Salt farming units with CL upto 15HP 1510 2.50 2.74 5955.98 0.68 0.00 0.05 0.74
Rural Horticulture Nurseries 2884 0.00 1.95 4942.22 0.00 0.00 0.10 0.10
Sugarcane crushing 39 0.00 1.18 851.68 0.00 0.00 0.00 0.00
V (C) : Aquaculture and Animal Husbandry 36015 3.85 360.00 1417.34 1026171.03 545.68 0.00 1.30 546.97
V (D) Poultry Hactcheries & Poultry Feed mixing
plants 13 3.85 900.00 24.11 148.57 9.28 0.00 0.00 9.28
Floriculture in Green House 702 3.85 900.00 0.02 12663.13 0.01 0.00 0.03 0.03
E) Agro Based Activities 175 3.75 240.00 0.59 722.30 0.22 0.00 0.01 0.23
Category VIII-Temporary Supply 12 10.50 360.00 0.66 0.00 0.00 0.00 0.70 0.00 0.00 0.00 0.00 0.70
Temp. Supply (for all units) 0 0.00 0.00 0.00 0.00 0.00 0.00 0.00New L T Categories ( Total ) 0.00 0.00 0.00 0.00 0.00 0.00 0.00 0.00 0.00 0.00
TOTAL (LT including new categories) 11407697 24875.45 0.00 11589.54 11744366.32 7028.10 311.49 88.04 464.84 0.00 7892.47HIGH TENSION 7878 11886.55 0.00 4617.62 0.00 6632.17 1794.52 0.00 14.26 0.00 8440.95HT Category at 11 kV 7097 3079.52 0.00 1522.23 0.00 1791.96 766.89 0.00 11.97 0.00 2570.82HT I (B): Townships & Residential Colonies 41 6.30 900.00 20.30 8.54 12.79 0.77 0.07 13.63HT II (A) : Commercial 2940 7.65 5700.00 829.72 545.20 634.74 310.77 4.96 950.46Time of Day Tariffs (6 PM to 10 PM) 0 8.65 125.68 0.00 108.71 0.00 0.00 108.71HT II (B) : Public Infrastructure and Tourism 75 7.30 5700.00 39.25 17.43 28.66 9.94 0.13 38.72Time of Day Tariffs (6 PM to 10 PM) 0 8.30 3.81 0.00 3.16 0.00 0.00 3.16HT II (D) : Function Halls / Auditoriums / Start-up power 111 11.75 8.17 19.80 9.60 0.00 0.19 9.79HT II (E): Electric Vehicles (Evs) / Charging stations 0 5.00 0.00 0.00 0.00 0.00 0.00 0.00HT II (F) : Green Power 0 11.30 0.00 0.00 0.00 0.00 0.00 0.00HT III (A): Industry 3166 6.30 5700.00 498.28 737.28 313.92 420.25 5.34 739.51Time of Day Tariffs Peak (6 AM to 10 AM & 6 PM to 10 PM) 0 7.30 448.24 0.00 327.21 0.00 0.00 327.21Time of Day Tariffs Off Peak (10 PM to 6 AM) 0 5.30 422.27 0.00 223.80 0.00 0.00 223.80Industrial Colonies 0 6.30 1.59 0.00 1.00 0.00 0.00 1.00HT III (B): Seasonal Industries 27 7.65 5700.00 3.73 0.00 2.85 0.00 0.05 2.90HT III (C): Energy Intensive Industries 3 5.80 1.91 0.74 1.11 0.00 0.01 1.11

Consumer Categories
LT IV (E): Religious Places
(i) Religious Places (CL > 2kW)
(ii) Religious Places (CL <= 2kW)
LT V: Agriculture
LT V (B)
Corporate Farmers with DSM
Corporate Farmers without DSM
Non-Corporate Farmers
Salt farming units with CL upto 15HP
Rural Horticulture Nurseries
Sugarcane crushing
V (C) : Aquaculture and Animal Husbandry
V (D) Poultry Hactcheries & Poultry Feed mixing
plants
Floriculture in Green House
E) Agro Based Activities
Category VIII-Temporary Supply
Temp. Supply (for all units)
New L T Categories ( Total )
TOTAL (LT including new categories)
HIGH TENSION
HT Category at 11 kV
HT I (B): Townships & Residential Colonies
HT II (A) : Commercial
Time of Day Tariffs (6 PM to 10 PM)
HT II (B) : Public Infrastructure and Tourism
Time of Day Tariffs (6 PM to 10 PM)
HT II (D) : Function Halls / Auditoriums / Start-up power
HT II (E): Electric Vehicles (Evs) / Charging stations
HT II (F) : Green Power
HT III (A): Industry
Time of Day Tariffs Peak (6 AM to 10 AM & 6 PM to 10 PM)
Time of Day Tariffs Off Peak (10 PM to 6 AM)
Industrial Colonies
HT III (B): Seasonal Industries
HT III (C): Energy Intensive Industries
Surcharge
(Rs.Crs)
Additional
Surcharge
(Rs.Crs)
Direct Apportioned
Net Revenue
from Tariff
(Rs. Crores)
Non - tariff Income Total
Revenue
( Net of
incentives)
(Rs.Crs)
Grid
Support
Charges
(Rs. Crs)
Incentives
(Rs. Crs)
Surcharges
10.22 10.22
4.27 4.27
5.95 5.95
0.00 613.01 284.99 898.00
0.00
0.83 0.83
0.77 0.77
54.05 54.05
0.74 0.74
0.10 0.10
0.00 0.00
546.97 546.97
9.28 9.28
0.03 0.03
0.23 0.23
0.00 0.70 0.02 0.71
0.00 0.00
0.00 0.00 0.00
0.00
0.00 7892.47 0.00 0.00 0.00 0.00 638.40 8530.87
12.00 8428.95 0.00 0.00 0.00 0.00 305.05 8734.01
1.28 2569.54 0.00 0.00 0.00 0.00 79.03 2648.57
0.00 13.63 0.52 14.15
0.00 950.46 21.29 971.760.00 108.71 3.23 111.940.00 38.72 1.01 39.730.00 3.16 0.10 3.260.00 9.79 0.21 10.000.00 0.00 0.00 0.00
0.00 0.00 0.00 0.00
1.28 738.23 12.79 751.02
0.00 327.21 11.50 338.72
0.00 223.80 10.84 234.64
0.00 1.00 0.04 1.05
0.00 2.90 0.10 2.99
0.00 1.11 0.05 1.16

Energy
Charges
(Rs/kWh) or
(Rs/kVAh)
Demand
charges
(Rs/kVA/Yr)
Demand
charges
(Rs/HP/Yr)
Energy
Sales
(MU)
Energy
sales
(MVAh)
Connected
Load/
Contract
Demand
(MVA)
Connected
Load/ Contract
Demand
(HP)
Energy
Charges
(Rs
Crores)
Demand
/Fixed
charges
(Rs Crores)
Minimum
Charges
(Rs
Crores)
Customer
Charges
(Rs crores)
Others
(Rs Crores)
Gross Tariff
Revenue
(Rs Crores)
Full year revenue excluding external subsidyRelevant sales related data
Consumer Categories No of consumers
Components of tariff
HT IV (B): CPWS / PWS Scheme 104 4.85 46.28 20.11 22.44 0.00 0.18 22.62HT IV (E): Religious Places 22 5.00 360.00 8.11 4.52 4.05 0.16 0.04 4.25HT IV (F) : Railway Traction 0 3.75 4200.00 0.00 0.00 0.00 0.00 0.00 0.00HT V (C) : Aquaculture and Animal Husbandry 67 3.85 360.00 39.05 23.56 15.03 0.85 0.11 15.99
HT V (D) : Poultry Hatcheries and Poultry Feed Mixing Plants 162 4.85 5700.00 67.17 42.38 32.58 24.16 0.27 57.01
HT V (F) : Government / Pvt. LIS 372 5.80 55.00 102.03 31.90 0.00 0.63 32.53HT Temporary supply 3 1.00 0.42 0.00 0.00 0.01 0.01RESCOs 1 0.40 459.85 0.00 18.39 0.00 0.00 18.40HT Category at 33 kV 672 3980.71 0.00 1246.49 0.00 2312.26 571.69 0.00 1.94 0.00 2885.90HT I (B): Townships & Residential Colonies 6 6.30 900.00 3.13 2.48 1.97 0.22 0.02 2.22HT II (A) : Commercial 61 6.95 5700.00 81.72 51.05 56.79 29.10 0.21 86.09Time of Day Tariffs (6 PM to 10 PM) 0 7.95 22.41 0.00 17.82 0.00 0.00 17.82HT II (B) : Public Infrastructure and Tourism 4 6.65 5700.00 8.40 4.27 5.59 2.43 0.01 8.03Time of Day Tariffs (6 PM to 10 PM) 0 7.65 0.39 0.00 0.30 0.00 0.00 0.30HT II (D) : Function Halls / Auditoriums / Start-up power 0 11.75 7.50 0.00 8.82 0.00 0.00 8.82HT II (E): Electric Vehicles (Evs) / Charging stations 0 5.00 0.00 0.00 0.00 0.00 0.00 0.00HT II (F) : Green Power 1 11.30 0.10 0.00 0.11 0.00 0.00 0.11HT III (A): Industry 383 5.85 5700.00 1168.74 898.62 683.71 512.21 1.29 1197.22Time of Day Tariffs Peak (6 AM to 10 AM & 6 PM to 10 PM) 0 6.85 1066.48 0.00 730.54 0.00 0.00 730.54Time of Day Tariffs Off Peak (10 PM to 6 AM) 0 4.85 1072.26 0.00 520.05 0.00 0.00 520.05Industrial Colonies 0 6.30 10.14 0.00 6.39 0.00 0.00 6.39HT III (B): Seasonal Industries 1 6.95 5700.00 0.73 0.00 0.51 0.00 0.00 0.51HT III (C): Energy Intensive Industries 9 5.35 212.31 41.03 113.58 0.00 0.03 113.61HT IV (B): CPWS / PWS Scheme 20 4.85 58.89 20.74 28.56 0.00 0.07 28.63HT IV (E): Religious Places 1 5.00 360.00 32.18 7.00 16.09 0.25 0.00 16.34HT IV (F) : Railway Traction 0 3.75 4200.00 0.00 0.00 0.00 0.00 0.00 0.00HT V (C) : Aquaculture and Animal Husbandry 0 3.85 360.00 0.00 0.00 0.00 0.00 0.00 0.00
HT V (D) : Poultry Hatcheries and Poultry Feed Mixing Plants 26 4.85 5700.00 122.89 48.21 59.60 27.48 0.09 87.17
HT V (F) : Government / Pvt. LIS 64 5.80 106.63 159.87 61.85 0.00 0.22 62.06HT Temporary supply 0 0.00 0.00 0.00 0.00 0.00 0.00RESCOs 0 0.40 0.00 0.00 0.00 0.00 0.00 0.00HT Category at 132 kV 109 4826.32 0.00 1848.90 0.00 2527.95 455.94 0.00 0.35 0.00 2984.23HT I (B): Townships & Residential Colonies 0 6.30 900.00 0.00 0.00 0.00 0.00 0.00 0.00HT II (A) : Commercial 1 6.70 5700.00 32.79 13.00 21.97 7.41 0.00 29.38Time of Day Tariffs (6 PM to 10 PM) 0 7.70 7.25 0.00 5.58 0.00 0.00 5.58HT II (B) : Public Infrastructure and Tourism 0 6.35 5700.00 0.00 0.00 0.00 0.00 0.00 0.00Time of Day Tariffs (6 PM to 10 PM) 0 7.35 0.00 0.00 0.00 0.00 0.00 0.00HT II (D) : Function Halls / Auditoriums / Start-up power 0 11.75 2.06 0.00 2.42 0.00 0.00 2.42HT II (E): Electric Vehicles (Evs) / Charging stations 0 5.00 0.00 0.00 0.00 0.00 0.00 0.00HT II (F) : Green Power 0 11.30 0.00 0.00 0.00 0.00 0.00 0.00HT III (A): Industry 40 5.40 5700.00 769.45 540.42 415.50 308.04 0.14 723.68Time of Day Tariffs Peak (6 AM to 10 AM & 6 PM to 10 PM) 0 6.40 803.81 0.00 514.44 0.00 0.00 514.44Time of Day Tariffs Off Peak (10 PM to 6 AM) 0 4.40 845.99 0.00 372.24 0.00 0.00 372.24Industrial Colonies 0 6.30 13.15 0.00 8.29 0.00 0.00 8.29HT III (B): Seasonal Industries 0 6.70 5700.00 0.00 0.00 0.00 0.00 0.00 0.00HT III (C): Energy Intensive Industries 1 4.95 85.96 18.00 42.55 0.00 0.00 42.55HT IV (B): CPWS / PWS Scheme 0 4.85 0.00 0.00 0.00 0.00 0.00 0.00HT IV (E): Religious Places 0 5.00 360.00 0.00 0.00 0.00 0.00 0.00 0.00HT IV (F) : Railway Traction 30 3.75 4200.00 822.59 334.50 308.47 140.49 0.10 449.06HT V (C) : Aquaculture and Animal Husbandry 0 3.85 360.00 0.00 0.00 0.00 0.00 0.00 0.00
HT V (D) : Poultry Hatcheries and Poultry Feed Mixing Plants 0 4.85 5700.00 0.00 0.00 0.00 0.00 0.00 0.00
HT V (F) : Government / Pvt. LIS 32 5.80 1442.21 942.20 836.48 0.00 0.11 836.59HT Temporary supply 0 0.00 0.00 0.00 0.00 0.00 0.00RESCOs 0 0.40 0.00 0.00 0.00 0.00 0.00 0.00TOTAL( LT + HT) 11415575 36762.01 0.00 16207.16 11744366.32 13660.27 2106.01 88.04 479.10 0.00 16333.43
- -

Consumer Categories
HT IV (B): CPWS / PWS Scheme
HT IV (E): Religious Places
HT IV (F) : Railway Traction
HT V (C) : Aquaculture and Animal Husbandry
HT V (D) : Poultry Hatcheries and Poultry Feed Mixing Plants
HT V (F) : Government / Pvt. LIS
HT Temporary supply
RESCOs
HT Category at 33 kV
HT I (B): Townships & Residential Colonies
HT II (A) : Commercial
Time of Day Tariffs (6 PM to 10 PM)
HT II (B) : Public Infrastructure and Tourism
Time of Day Tariffs (6 PM to 10 PM)
HT II (D) : Function Halls / Auditoriums / Start-up power
HT II (E): Electric Vehicles (Evs) / Charging stations
HT II (F) : Green Power
HT III (A): Industry
Time of Day Tariffs Peak (6 AM to 10 AM & 6 PM to 10 PM)
Time of Day Tariffs Off Peak (10 PM to 6 AM)
Industrial Colonies
HT III (B): Seasonal Industries
HT III (C): Energy Intensive Industries
HT IV (B): CPWS / PWS Scheme
HT IV (E): Religious Places
HT IV (F) : Railway Traction
HT V (C) : Aquaculture and Animal Husbandry
HT V (D) : Poultry Hatcheries and Poultry Feed Mixing Plants
HT V (F) : Government / Pvt. LIS
HT Temporary supply
RESCOs
HT Category at 132 kV
HT I (B): Townships & Residential Colonies
HT II (A) : Commercial
Time of Day Tariffs (6 PM to 10 PM)
HT II (B) : Public Infrastructure and Tourism
Time of Day Tariffs (6 PM to 10 PM)
HT II (D) : Function Halls / Auditoriums / Start-up power
HT II (E): Electric Vehicles (Evs) / Charging stations
HT II (F) : Green Power
HT III (A): Industry
Time of Day Tariffs Peak (6 AM to 10 AM & 6 PM to 10 PM)
Time of Day Tariffs Off Peak (10 PM to 6 AM)
Industrial Colonies
HT III (B): Seasonal Industries
HT III (C): Energy Intensive Industries
HT IV (B): CPWS / PWS Scheme
HT IV (E): Religious Places
HT IV (F) : Railway Traction
HT V (C) : Aquaculture and Animal Husbandry
HT V (D) : Poultry Hatcheries and Poultry Feed Mixing Plants
HT V (F) : Government / Pvt. LIS
HT Temporary supply
RESCOs
TOTAL( LT + HT)
Surcharge
(Rs.Crs)
Additional
Surcharge
(Rs.Crs)
Direct Apportioned
Net Revenue
from Tariff
(Rs. Crores)
Non - tariff Income Total
Revenue
( Net of
incentives)
(Rs.Crs)
Grid
Support
Charges
(Rs. Crs)
Incentives
(Rs. Crs)
Surcharges
0.00 22.62 1.19 23.81
0.00 4.25 0.21 4.46
0.00 0.00 0.00 0.00
0.00 15.99 1.00 17.00
0.00 57.01 1.72 58.74
0.00 32.53 1.41 33.94
0.00 0.01 0.03 0.03
0.00 18.40 11.80 30.20
7.00 2878.90 0.00 0.00 0.00 0.00 102.16 2980.91
0.00 2.22 0.08 2.30
0.00 86.09 2.10 88.19
0.00 17.82 0.58 18.39
0.00 8.03 0.22 8.25
0.00 0.30 0.01 0.31
0.00 8.82 0.19 9.01
0.00 0.00 0.00 0.00
0.00 0.11 0.00 0.11
7.00 1190.22 29.99 1220.21
0.00 730.54 27.37 757.91
0.00 520.05 27.52 547.56
0.00 6.39 0.26 6.65
0.00 0.51 0.02 0.53
0.00 113.61 5.45 119.06
0.00 28.63 1.51 30.14
0.00 16.34 0.83 17.17
0.00 0.00 0.00 0.00
0.00 0.00 0.00 0.00
0.00 87.17 3.15 90.32
0.00 62.06 2.74 64.80
0.00 0.00 0.00 0.00
0.00 0.00 0.00 0.00
3.72 2980.51 0.00 0.00 0.00 0.00 123.86 3104.35
0.00 0.00 0.00 0.00
0.00 29.38 0.84 30.22
0.00 5.58 0.19 5.77
0.00 0.00 0.00 0.00
0.00 0.00 0.00 0.00
0.00 2.42 0.05 2.47
0.00 0.00 0.00 0.00
0.00 0.00 0.00 0.00
3.72 719.96 19.75 739.70
0.00 514.44 20.63 535.07
0.00 372.24 21.71 393.95
0.00 8.29 0.34 8.62
0.00 0.00 0.00 0.00
0.00 42.55 2.21 44.76
0.00 0.00 0.00 0.00
0.00 0.00 0.00 0.00
0.00 449.06 21.11 470.17
0.00 0.00 0.00 0.00
0.00 0.00 0.00 0.00
0.00 836.59 37.01 873.60
0.00 0.00 0.00 0.00
0.00 0.00 0.00 0.00
12.00 16321.43 0.00 0.00 0.00 0.00 943.45 17264.88

Energy
Charges
(Rs/kWh) or
(Rs/kVAh)
Demand
charges
(Rs/kVA/Yr)
Demand
charges
(Rs/HP/Yr)
Energy
Sales
(MU)
Energy
sales
(MVAh)
Connected
Load/
Contract
Demand
(MVA)
Connected
Load/ Contract
Demand
(HP)
Energy
Charges
(Rs
Crores)
Demand
/Fixed
charges
(Rs Crores)
Minimum
Charges
(Rs
Crores)
Customer
Charges
(Rs crores)
Others
(Rs Crores)
Gross Tariff
Revenue
(Rs Crores)
Full year revenue excluding external subsidyRelevant sales related data
Consumer Categories No of consumers
Components of tariff
2020-21
Energy
Charges
(Rs/kWh) or
(Rs/kVAh)
Demand
charges
(Rs/kVA/Yr)
Demand
charges
(Rs/HP/Yr)
Energy
Sales
(MU)
Energy
sales
(MVAh)
Connected
Load/
Contract
Demand
(MVA)
Connected
Load/ Contract
Demand
(HP)
Energy
Charges
(Rs
Crores)
Demand
/Fixed
charges
(Rs Crores)
Minimum
Charges
(Rs
Crores)
Customer
Charges
(Rs crores)
Others
(Rs Crores)
Gross Tariff
Revenue
(Rs Crores)
LT Total - (Existing Categories) 12018611 26444.58 0.00 12383.40 12236976.07 7586.80 326.97 90.77 492.49 0.00 8497.03Category- Domestic (All) 9229775 10445.84 0.00 9754.22 0.00 3713.59 0.00 72.41 382.30 0.00 4168.31
Group A: All consumers with annual consumption
< = 900 Units 4662977 2515.80 0.00 3008.45 0.00 507.33 0.00 57.68 148.38 0.00 713.38
0-50 3388827 1.45 1728.06 2098.89 250.57 0.00 57.68 101.66 409.91
51-100 1149027 2.60 553.96 780.72 144.03 0.00 41.36 185.40
101-200 110023 3.60 147.20 110.58 52.99 0.00 4.62 57.61
Above 200 15100 6.90 86.58 18.26 59.74 0.00 0.72 60.47
Group B: All consumers with consumption ( <
=2700 and > 900 units) 3948306 5649.74 0.00 4783.12 0.00 1863.40 0.00 8.47 198.58 0.00 2070.44
0-50 423749 2.60 2020.87 479.06 525.43 0.00 8.47 17.80 551.69
51-100 1793140 2.60 1666.30 1865.02 433.24 0.00 86.07 519.31
101-200 1554898 3.60 1412.19 2148.93 508.39 0.00 83.96 592.35
201-300 150849 6.90 355.36 255.23 245.20 0.00 9.05 254.25
Above 300 25670 7.75 195.03 34.87 151.15 0.00 1.69 152.84
Group C: All consumers with annual consumption
>2700 units 618492 2280.30 0.00 1962.65 0.00 1342.87 0.00 6.27 35.35 0.00 1384.49
0-50 19744 2.65 349.38 47.39 92.58 0.00 6.27 0.83 99.68
51-100 36857 3.35 322.79 92.34 108.14 0.00 1.77 109.91
101-200 262657 5.40 552.04 740.15 298.10 0.00 14.18 312.28
201-300 197055 7.10 395.43 614.47 280.75 0.00 11.82 292.58
301-400 58686 7.95 243.12 228.57 193.28 0.00 3.87 197.15
401-500 19590 8.50 142.91 94.08 121.47 0.00 1.29 122.76
Above 500 units 23903 9.05 274.63 145.65 248.54 0.00 1.58 250.12
Smart Meters 0 0.00 0.00 0.00 0.00 0.00 0.00
Category II - Non-domestic/Commrl (A,B ,C, D & E) 905484 2223.30 0.00 2359.10 0.00 2019.65 190.79 16.83 39.06 0.00 2266.33
Category II - Non-domestic/Commrl (A & B) 902347 2197.59 0.00 2313.02 0.00 1989.38 190.42 16.83 38.86 0.00 2235.49Lt - II (A) Upto 50 units/month 494903 104.46 0.00 739.49 0.00 56.41 48.81 16.83 17.82 0.00 139.86
0-50 units 494903 5.40 660.00 104.46 739.49 56.41 48.81 16.83 17.82 139.86Lt - II (B) >50 Units/month 407444 2093.14 0.00 1573.53 0.00 1932.97 141.62 0.00 21.04 0.00 2095.63
0-50 0 6.90 900.00 257.81 0.00 177.89 0.00 0.00 177.89
51-100 159525 7.65 900.00 200.70 268.93 153.53 24.20 7.66 185.40
101-300 160768 9.05 900.00 417.43 423.11 377.77 38.08 8.68 424.53
301-500 34085 9.60 900.00 212.46 168.30 203.97 15.15 1.84 220.95
Above 500 53066 10.15 900.00 1004.74 713.19 1019.81 64.19 2.87 1086.86 LT II (C): Advertisement Hoardings 1062 12.25 900.00 3.11 4.06 3.81 0.37 0.06 4.24 LT II (D): Function Halls 2031 11.75 22.46 41.35 26.40 0.00 0.12 26.52 LT II (E): Electric Vehicles (EVs) 44 5.00 0.13 0.66 0.07 0.00 0.01 0.08Category III - Industrial 59712 1073.35 0.00 0.00 1388462.12 704.66 90.30 0.00 4.51 0.00 799.47
A) Industries (General) 45075 6.70 900.00 900.00 1024.16 0.00 1329876.54 686.19 89.25 3.41 778.85
B) Seasonal Industries (off season) 40 7.45 900.00 900.00 0.06 0.00 0.00 0.05 0.00 0.00 0.05
D) Cottage Industries upto 10HP 14597 3.75 240.00 240.00 49.12 0.00 58585.57 18.42 1.05 1.10 20.57
Relevant sales related data Full year revenue excluding external subsidy
Consumer Categories No of consumers
Components of tariff
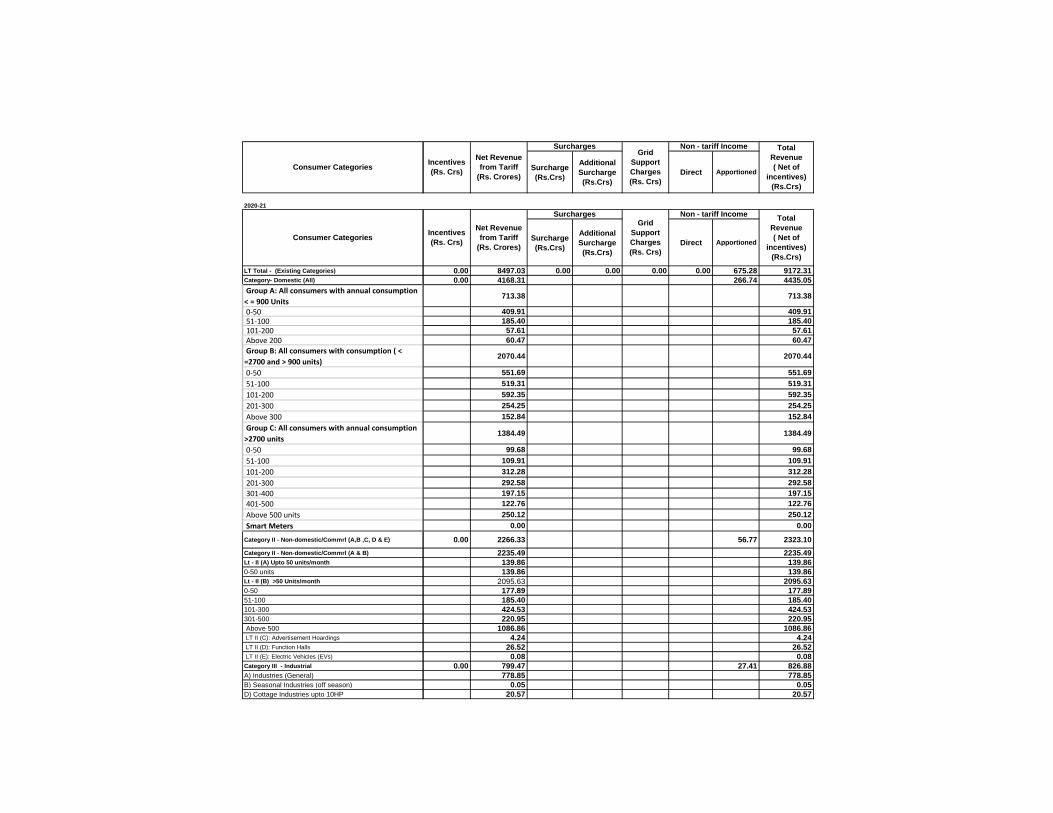
Consumer Categories
2020-21
LT Total - (Existing Categories)
Category- Domestic (All)
Group A: All consumers with annual consumption
< = 900 Units 0-50 51-100 101-200 Above 200
Group B: All consumers with consumption ( <
=2700 and > 900 units)
0-50
51-100
101-200
201-300
Above 300
Group C: All consumers with annual consumption
>2700 units
0-50
51-100
101-200
201-300
301-400 401-500
Above 500 units
Smart Meters
Category II - Non-domestic/Commrl (A,B ,C, D & E)
Category II - Non-domestic/Commrl (A & B)
Lt - II (A) Upto 50 units/month
0-50 units
Lt - II (B) >50 Units/month
0-50
51-100
101-300
301-500
Above 500
LT II (C): Advertisement Hoardings
LT II (D): Function Halls
LT II (E): Electric Vehicles (EVs)
Category III - Industrial
A) Industries (General)
B) Seasonal Industries (off season)
D) Cottage Industries upto 10HP
Consumer Categories
Surcharge
(Rs.Crs)
Additional
Surcharge
(Rs.Crs)
Direct Apportioned
Net Revenue
from Tariff
(Rs. Crores)
Non - tariff Income Total
Revenue
( Net of
incentives)
(Rs.Crs)
Grid
Support
Charges
(Rs. Crs)
Incentives
(Rs. Crs)
Surcharges
Surcharge
(Rs.Crs)
Additional
Surcharge
(Rs.Crs)
Direct Apportioned
0.00 8497.03 0.00 0.00 0.00 0.00 675.28 9172.31
0.00 4168.31 266.74 4435.05
713.38 713.38
409.91 409.91
185.40 185.40
57.61 57.61
60.47 60.47
2070.44 2070.44
551.69 551.69
519.31 519.31
592.35 592.35
254.25 254.25
152.84 152.84
1384.49 1384.49
99.68 99.68
109.91 109.91
312.28 312.28
292.58 292.58
197.15 197.15
122.76 122.76
250.12 250.12
0.00 0.00
0.00 2266.33 56.77 2323.10
2235.49 2235.49
139.86 139.86
139.86 139.86
2095.63 2095.63
177.89 177.89
185.40 185.40
424.53 424.53
220.95 220.95
1086.86 1086.86
4.24 4.24
26.52 26.52
0.08 0.08
0.00 799.47 27.41 826.88
778.85 778.85
0.05 0.05
20.57 20.57
Grid
Support
Charges
(Rs. Crs)
Incentives
(Rs. Crs)
Net Revenue
from Tariff
(Rs. Crores)
Surcharges Non - tariff Income Total
Revenue
( Net of
incentives)
(Rs.Crs)

Energy
Charges
(Rs/kWh) or
(Rs/kVAh)
Demand
charges
(Rs/kVA/Yr)
Demand
charges
(Rs/HP/Yr)
Energy
Sales
(MU)
Energy
sales
(MVAh)
Connected
Load/
Contract
Demand
(MVA)
Connected
Load/ Contract
Demand
(HP)
Energy
Charges
(Rs
Crores)
Demand
/Fixed
charges
(Rs Crores)
Minimum
Charges
(Rs
Crores)
Customer
Charges
(Rs crores)
Others
(Rs Crores)
Gross Tariff
Revenue
(Rs Crores)
Full year revenue excluding external subsidyRelevant sales related data
Consumer Categories No of consumers
Components of tariff
LT IV: Institutional 201651 956.63 0.00 263.60 333801.08 531.54 45.88 1.53 8.22 0.00 587.17
LT IV A): Street Lighting 71408 204.86 0.00 123.74 0.00 127.87 11.14 0.00 3.00 0.00 142.01
Panchayats 53749 5.95 900.00 900.00 134.18 83.42 79.83 7.51 2.26 89.60
Municipalities 8587 6.50 900.00 900.00 32.53 17.81 21.15 1.60 0.36 23.11
Municipal Corporations 9072 7.05 900.00 900.00 38.15 22.51 26.89 2.03 0.38 29.30
LT IV (B): PWS Schemes 49552 616.67 0.00 0.00 329512.10 312.65 29.66 0.00 2.08 0.00 344.38
Panchayats 44010 4.85 900.00 900.00 514.48 285041.00 249.52 25.65 1.85 277.03
Municipalities 2938 5.95 900.00 900.00 60.02 24882.82 35.71 2.24 0.12 38.08
Municipal Corporations 2604 6.50 900.00 900.00 42.17 19588.28 27.41 1.76 0.11 29.28
LT-IV (C): NTR Sujala Padhakam 1266 4.00 120.00 120.00 6.81 4288.98 2.73 0.05 0.05 2.82
LT IV (D): General Purpose 66334 7.25 360.00 360.00 108.29 119.38 0.00 78.51 4.30 1.53 2.39 86.73
LT IV (E): Religious Places 13091 19.99 0.00 20.48 0.00 9.78 0.74 0.00 0.71 0.00 11.23
(i) Religious Places (CL > 2kW) 992 5.00 360.00 360.00 9.40 7.80 4.70 0.28 0.00 0.05 5.04
(ii) Religious Places (CL <= 2kW) 12099 4.80 360.00 360.00 10.59 12.68 5.08 0.46 0.00 0.65 6.19
LT V: Agriculture 1621976 11744.73 0.00 6.48 10514712.87 617.36 0.00 0.00 58.39 0.00 675.75Corporate Farmers with DSM 8897 2.50 2.18 6.48 47071.38 0.55 0.00 0.32 0.87Corporate Farmers without DSM 7483 3.50 1.54 39249.91 0.54 0.00 0.27 0.81Non-Corporate Farmers 1560374 0.00 10135.99 9272357.32 0.00 0.00 56.17 56.17
Salt farming units with CL upto 15HP 1569 2.50 2.87 6188.70 0.72 0.00 0.06 0.77
Rural Horticulture Nurseries 2997 0.00 2.05 5135.86 0.00 0.00 0.11 0.11
Sugarcane crushing 41 0.00 1.23 895.35 0.00 0.00 0.00 0.00
V (C) : Aquaculture and Animal Husbandry 39617 3.85 360.00 360.00 1559.07 1128802.38 600.24 0.00 1.43 601.67
V (D) Poultry Hactcheries & Poultry Feed mixing
plants 21 3.85 900.00 900.00 39.08 240.00 15.05 0.00 0.00 15.05
Floriculture in Green House 772 3.85 900.00 900.00 0.02 13925.84 0.01 0.00 0.03 0.04
E) Agro Based Activities 205 3.75 240.00 240.00 0.69 846.13 0.26 0.00 0.01 0.27
Category VIII-Temporary Supply 13 10.50 360.00 360.00 0.73 0.00 0.00 0.00 0.00 0.00 0.00 0.00 0.00 0.00
Temp. Supply (for all units) 0 0.00 0.00 0.00 0.00 0.00 0.00 0.00
0.00 0.00 0.00TOTAL (LT including new categories) 12018611 26444.58 0.00 12383.40 12236976.07 7586.80 326.97 90.77 492.49 0.00 8497.03

Consumer Categories
LT IV: Institutional
LT IV A): Street Lighting
Panchayats
Municipalities
Municipal Corporations
LT IV (B): PWS Schemes
Panchayats
Municipalities
Municipal Corporations
LT-IV (C): NTR Sujala Padhakam
LT IV (D): General Purpose
LT IV (E): Religious Places
(i) Religious Places (CL > 2kW)
(ii) Religious Places (CL <= 2kW)
LT V: Agriculture
Corporate Farmers with DSM
Corporate Farmers without DSM
Non-Corporate Farmers
Salt farming units with CL upto 15HP
Rural Horticulture Nurseries
Sugarcane crushing
V (C) : Aquaculture and Animal Husbandry
V (D) Poultry Hactcheries & Poultry Feed mixing
plants
Floriculture in Green House
E) Agro Based Activities
Category VIII-Temporary Supply
Temp. Supply (for all units)
TOTAL (LT including new categories)
Surcharge
(Rs.Crs)
Additional
Surcharge
(Rs.Crs)
Direct Apportioned
Net Revenue
from Tariff
(Rs. Crores)
Non - tariff Income Total
Revenue
( Net of
incentives)
(Rs.Crs)
Grid
Support
Charges
(Rs. Crs)
Incentives
(Rs. Crs)
Surcharges
0.00 587.17 24.43 611.60
142.01 142.01
89.60 89.60
23.11 23.11
29.30 29.30
344.38 344.38
277.03 277.03
38.08 38.08
29.28 29.28
2.82 2.82
86.73 86.73
11.23 11.23
5.04 5.04
6.19 6.19
0.00 675.75 299.91 975.66
0.87 0.87
0.81 0.81
56.17 56.17
0.77 0.77
0.11 0.11
0.00 0.00
601.67 601.67
15.05 15.05
0.04 0.04
0.27 0.27
0.00 0.00 0.02 0.02
0.00 0.00
0.00 0.00
0.00 8497.03 0.00 0.00 0.00 0.00 675.28 9172.31

Energy
Charges
(Rs/kWh) or
(Rs/kVAh)
Demand
charges
(Rs/kVA/Yr)
Demand
charges
(Rs/HP/Yr)
Energy
Sales
(MU)
Energy
sales
(MVAh)
Connected
Load/
Contract
Demand
(MVA)
Connected
Load/ Contract
Demand
(HP)
Energy
Charges
(Rs
Crores)
Demand
/Fixed
charges
(Rs Crores)
Minimum
Charges
(Rs
Crores)
Customer
Charges
(Rs crores)
Others
(Rs Crores)
Gross Tariff
Revenue
(Rs Crores)
Full year revenue excluding external subsidyRelevant sales related data
Consumer Categories No of consumers
Components of tariff
HIGH TENSION 8077 12349.25 0.00 4861.58 0.00 6865.39 1892.17 0.00 15.02 0.00 8772.58
HT Category at 11 kV 7254 3191.86 0.00 1545.85 0.00 1832.11 776.41 0.00 12.24 0.00 2620.76HT I (B): Townships & Residential Colonies 41 6.30 900.00 20.51 8.54 12.92 0.77 0.07 13.76HT II (A) : Commercial 3023 7.65 5700.00 853.09 549.83 652.61 313.40 5.10 971.11Time of Day Tariffs (6 PM to 10 PM) 0 8.65 126.94 0.00 109.80 0.00 0.00 109.80HT II (B) : Public Infrastructure and Tourism 83 7.30 5700.00 43.18 19.29 31.52 11.00 0.14 42.66Time of Day Tariffs (6 PM to 10 PM) 0 8.30 3.24 0.00 2.69 0.00 0.00 2.69HT II (D) : Function Halls / Auditoriums / Start-up power 116 11.75 8.46 20.38 9.94 0.00 0.20 10.13HT II (E): Electric Vehicles (Evs) / Charging stations 0 5.00 0.00 0.00 0.00 0.00 0.00 0.00HT II (F) : Green Power 0 11.30 0.00 0.00 0.00 0.00 0.00 0.00HT III (A): Industry 3182 6.30 5700.00 500.77 741.00 315.49 422.37 5.37 743.23Time of Day Tariffs Peak (6 AM to 10 AM & 6 PM to 10 PM) 0 7.30 450.48 0.00 328.85 0.00 0.00 328.85Time of Day Tariffs Off Peak (10 PM to 6 AM) 0 5.30 430.71 0.00 228.28 0.00 0.00 228.28Industrial Colonies 0 6.30 1.67 0.00 1.06 0.00 0.00 1.06HT III (B): Seasonal Industries 28 7.65 5700.00 3.80 0.00 2.91 0.00 0.05 2.96HT III (C): Energy Intensive Industries 3 5.80 1.95 0.74 1.13 0.00 0.01 1.13HT IV (B): CPWS / PWS Scheme 106 4.85 47.20 20.49 22.89 0.00 0.18 23.07HT IV (E): Religious Places 23 5.00 360.00 8.43 4.73 4.21 0.17 0.04 4.42HT IV (F) : Railway Traction 0 3.75 4200.00 0.00 0.00 0.00 0.00 0.00 0.00HT V (C) : Aquaculture and Animal Husbandry 76 3.85 360.00 44.16 26.72 17.00 0.96 0.13 18.09
HT V (D) : Poultry Hatcheries and Poultry Feed Mixing Plants 186 4.85 5700.00 77.25 48.66 37.47 27.74 0.31 65.52
HT V (F) : Government / Pvt. LIS 383 5.80 56.65 105.05 32.86 0.00 0.65 33.50HT Temporary supply 3 1.10 0.42 0.00 0.00 0.01 0.01RESCOs 1 0.40 512.27 0.00 20.49 0.00 0.00 20.49 0.00 0.00HT Category at 33 kV 705 4086.69 0.00 1304.73 0.00 2378.03 604.25 0.00 2.38 0.00 2984.66HT I (B): Townships & Residential Colonies 6 6.30 900.00 3.16 2.48 1.99 0.22 0.02 2.24HT II (A) : Commercial 62 6.95 5700.00 83.35 51.88 57.93 29.57 0.21 87.71Time of Day Tariffs (6 PM to 10 PM) 0 7.95 22.86 0.00 18.17 0.00 0.00 18.17HT II (B) : Public Infrastructure and Tourism 5 6.65 5700.00 9.91 5.33 6.59 3.04 0.02 9.65Time of Day Tariffs (6 PM to 10 PM) 0 7.65 0.32 0.00 0.24 0.00 0.00 0.24HT II (D) : Function Halls / Auditoriums / Start-up power 101 11.75 14.37 13.92 16.89 0.00 0.34 17.23HT II (E): Electric Vehicles (Evs) / Charging stations 0 5.00 0.00 0.00 0.00 0.00 0.00 0.00HT II (F) : Green Power 1 11.30 0.10 0.00 0.11 0.00 0.00 0.11HT III (A): Industry 401 5.85 5700.00 1223.80 940.85 715.92 536.28 1.35 1253.56Time of Day Tariffs Peak (6 AM to 10 AM & 6 PM to 10 PM) 0 6.85 1071.82 0.00 734.19 0.00 0.00 734.19Time of Day Tariffs Off Peak (10 PM to 6 AM) 0 4.85 1093.70 0.00 530.45 0.00 0.00 530.45Industrial Colonies 0 6.30 10.34 0.00 6.52 0.00 0.00 6.52HT III (B): Seasonal Industries 1 6.95 5700.00 0.67 0.00 0.46 0.00 0.00 0.47HT III (C): Energy Intensive Industries 8 5.35 195.32 36.47 104.50 0.00 0.03 104.52HT IV (B): CPWS / PWS Scheme 20 4.85 60.06 20.74 29.13 0.00 0.07 29.20HT IV (E): Religious Places 1 5.00 360.00 33.47 7.00 16.73 0.25 0.00 16.99HT IV (F) : Railway Traction 0 3.75 4200.00 0.00 0.00 0.00 0.00 0.00 0.00HT V (C) : Aquaculture and Animal Husbandry 0 3.85 360.00 0.00 0.00 0.00 0.00 0.00 0.00
HT V (D) : Poultry Hatcheries and Poultry Feed Mixing Plants 33 4.85 5700.00 153.61 61.19 74.50 34.88 0.11 109.49
HT V (F) : Government / Pvt. LIS 66 5.80 109.83 164.86 63.70 0.00 0.22 63.92HT Temporary supply 0 0.00 0.00 0.00 0.00 0.00 0.00RESCOs 0 0.40 0.00 0.00 0.00 0.00 0.00 0.00

Consumer Categories
HIGH TENSION
HT Category at 11 kV
HT I (B): Townships & Residential Colonies
HT II (A) : Commercial
Time of Day Tariffs (6 PM to 10 PM)
HT II (B) : Public Infrastructure and Tourism
Time of Day Tariffs (6 PM to 10 PM)
HT II (D) : Function Halls / Auditoriums / Start-up power
HT II (E): Electric Vehicles (Evs) / Charging stations
HT II (F) : Green Power
HT III (A): Industry
Time of Day Tariffs Peak (6 AM to 10 AM & 6 PM to 10 PM)
Time of Day Tariffs Off Peak (10 PM to 6 AM)
Industrial Colonies
HT III (B): Seasonal Industries
HT III (C): Energy Intensive Industries
HT IV (B): CPWS / PWS Scheme
HT IV (E): Religious Places
HT IV (F) : Railway Traction
HT V (C) : Aquaculture and Animal Husbandry
HT V (D) : Poultry Hatcheries and Poultry Feed Mixing Plants
HT V (F) : Government / Pvt. LIS
HT Temporary supply
RESCOs
HT Category at 33 kV
HT I (B): Townships & Residential Colonies
HT II (A) : Commercial
Time of Day Tariffs (6 PM to 10 PM)
HT II (B) : Public Infrastructure and Tourism
Time of Day Tariffs (6 PM to 10 PM)
HT II (D) : Function Halls / Auditoriums / Start-up power
HT II (E): Electric Vehicles (Evs) / Charging stations
HT II (F) : Green Power
HT III (A): Industry
Time of Day Tariffs Peak (6 AM to 10 AM & 6 PM to 10 PM)
Time of Day Tariffs Off Peak (10 PM to 6 AM)
Industrial Colonies
HT III (B): Seasonal Industries
HT III (C): Energy Intensive Industries
HT IV (B): CPWS / PWS Scheme
HT IV (E): Religious Places
HT IV (F) : Railway Traction
HT V (C) : Aquaculture and Animal Husbandry
HT V (D) : Poultry Hatcheries and Poultry Feed Mixing Plants
HT V (F) : Government / Pvt. LIS
HT Temporary supply
RESCOs
Surcharge
(Rs.Crs)
Additional
Surcharge
(Rs.Crs)
Direct Apportioned
Net Revenue
from Tariff
(Rs. Crores)
Non - tariff Income Total
Revenue
( Net of
incentives)
(Rs.Crs)
Grid
Support
Charges
(Rs. Crs)
Incentives
(Rs. Crs)
Surcharges
12.91 8759.67 0.00 0.00 0.00 0.00 315.35 9075.02
1.29 2619.48 0.00 0.00 0.00 0.00 81.51 2700.98
0.00 13.76 0.52 14.28
0.00 971.11 21.78 992.90
0.00 109.80 3.24 113.04
0.00 42.66 1.10 43.76
0.00 2.69 0.08 2.77
0.00 10.13 0.22 10.35
0.00 0.00 0.00 0.00
0.00 0.00 0.00 0.00
1.29 741.94 12.79 754.73
0.00 328.85 11.50 340.35
0.00 228.28 11.00 239.28
0.00 1.06 0.04 1.10
0.00 2.96 0.10 3.05
0.00 1.13 0.05 1.18
0.00 23.07 1.21 24.28
0.00 4.42 0.22 4.64
0.00 0.00 0.00 0.00
0.00 18.09 1.13 19.22
0.00 65.52 1.97 67.49
0.00 33.50 1.45 34.95
0.00 0.01 0.03 0.03
0.00 20.49 13.08 33.57
0.00
7.33 2977.33 0.00 0.00 0.00 0.00 104.36 3081.68
0.00 2.24 0.08 2.32
0.00 87.71 2.13 89.84
0.00 18.17 0.58 18.76
0.00 9.65 0.25 9.90
0.00 0.24 0.01 0.25
0.00 17.23 0.37 17.59
0.00 0.00 0.00 0.00
0.00 0.11 0.00 0.11
7.33 1246.23 31.25 1277.48
0.00 734.19 27.37 761.56
0.00 530.45 27.93 558.37
0.00 6.52 0.26 6.78
0.00 0.47 0.02 0.49
0.00 104.52 4.99 109.51
0.00 29.20 1.53 30.73
0.00 16.99 0.85 17.84
0.00 0.00 0.00 0.00
0.00 0.00 0.00 0.00
0.00 109.49 3.92 113.41
0.00 63.92 2.80 66.73
0.00 0.00 0.00 0.00
0.00 0.00 0.00 0.00

Energy
Charges
(Rs/kWh) or
(Rs/kVAh)
Demand
charges
(Rs/kVA/Yr)
Demand
charges
(Rs/HP/Yr)
Energy
Sales
(MU)
Energy
sales
(MVAh)
Connected
Load/
Contract
Demand
(MVA)
Connected
Load/ Contract
Demand
(HP)
Energy
Charges
(Rs
Crores)
Demand
/Fixed
charges
(Rs Crores)
Minimum
Charges
(Rs
Crores)
Customer
Charges
(Rs crores)
Others
(Rs Crores)
Gross Tariff
Revenue
(Rs Crores)
Full year revenue excluding external subsidyRelevant sales related data
Consumer Categories No of consumers
Components of tariff
HT Category at 132 kV 118 5070.70 0.00 2010.99 0.00 2655.25 511.51 0.00 0.40 0.00 3167.15HT I (B): Townships & Residential Colonies 0 6.30 900.00 0.00 0.00 0.00 0.00 0.00 0.00HT II (A) : Commercial 1 6.70 5700.00 30.82 13.00 20.65 7.41 0.00 28.06Time of Day Tariffs (6 PM to 10 PM) 0 7.70 6.82 0.00 5.25 0.00 0.00 5.25HT II (B) : Public Infrastructure and Tourism 0 6.35 5700.00 0.00 0.00 0.00 0.00 0.00 0.00Time of Day Tariffs (6 PM to 10 PM) 0 7.35 0.00 0.00 0.00 0.00 0.00 0.00HT II (D) : Function Halls / Auditoriums / Start-up power 4 11.75 2.90 0.63 3.40 0.00 0.01 3.42HT II (E): Electric Vehicles (Evs) / Charging stations 0 5.00 0.00 0.00 0.00 0.00 0.00 0.00HT II (F) : Green Power 0 11.30 0.00 0.00 0.00 0.00 0.00 0.00HT III (A): Industry 46 5.40 5700.00 886.81 621.48 478.88 354.24 0.16 833.28Time of Day Tariffs Peak (6 AM to 10 AM & 6 PM to 10 PM) 0 6.40 807.83 0.00 517.01 0.00 0.00 517.01Time of Day Tariffs Off Peak (10 PM to 6 AM) 0 4.40 862.91 0.00 379.68 0.00 0.00 379.68Industrial Colonies 0 6.30 13.42 0.00 8.45 0.00 0.00 8.45HT III (B): Seasonal Industries 0 6.70 5700.00 0.00 0.00 0.00 0.00 0.00 0.00HT III (C): Energy Intensive Industries 1 4.95 77.36 18.00 38.30 0.00 0.00 38.30HT IV (B): CPWS / PWS Scheme 0 4.85 0.00 0.00 0.00 0.00 0.00 0.00HT IV (E): Religious Places 0 5.00 360.00 0.00 0.00 0.00 0.00 0.00 0.00HT IV (F) : Railway Traction 32 3.75 4200.00 867.50 356.80 325.31 149.86 0.11 475.28HT V (C) : Aquaculture and Animal Husbandry 0 3.85 360.00 0.00 0.00 0.00 0.00 0.00 0.00
HT V (D) : Poultry Hatcheries and Poultry Feed Mixing Plants 0 4.85 5700.00 0.00 0.00 0.00 0.00 0.00 0.00
HT V (F) : Government / Pvt. LIS 34 5.80 1514.32 1001.08 878.31 0.00 0.11 878.42HT Temporary supply 0 0.00 0.00 0.00 0.00 0.00 0.00RESCOs 0 0.40 0.00 0.00 0.00 0.00 0.00 0.00
0.00 0.00
0.00 0.00TOTAL( LT + HT) 12026688 38793.83 0.00 17244.98 12236976.07 14452.19 2219.14 90.77 507.51 0.00 17269.61

Consumer Categories
HT Category at 132 kV
HT I (B): Townships & Residential Colonies
HT II (A) : Commercial
Time of Day Tariffs (6 PM to 10 PM)
HT II (B) : Public Infrastructure and Tourism
Time of Day Tariffs (6 PM to 10 PM)
HT II (D) : Function Halls / Auditoriums / Start-up power
HT II (E): Electric Vehicles (Evs) / Charging stations
HT II (F) : Green Power
HT III (A): Industry
Time of Day Tariffs Peak (6 AM to 10 AM & 6 PM to 10 PM)
Time of Day Tariffs Off Peak (10 PM to 6 AM)
Industrial Colonies
HT III (B): Seasonal Industries
HT III (C): Energy Intensive Industries
HT IV (B): CPWS / PWS Scheme
HT IV (E): Religious Places
HT IV (F) : Railway Traction
HT V (C) : Aquaculture and Animal Husbandry
HT V (D) : Poultry Hatcheries and Poultry Feed Mixing Plants
HT V (F) : Government / Pvt. LIS
HT Temporary supply
RESCOs
TOTAL( LT + HT)
Surcharge
(Rs.Crs)
Additional
Surcharge
(Rs.Crs)
Direct Apportioned
Net Revenue
from Tariff
(Rs. Crores)
Non - tariff Income Total
Revenue
( Net of
incentives)
(Rs.Crs)
Grid
Support
Charges
(Rs. Crs)
Incentives
(Rs. Crs)
Surcharges
4.29 3162.87 0.00 0.00 0.00 0.00 129.48 3292.35
0.00 0.00 0.00 0.00
0.00 28.06 0.79 28.85
0.00 5.25 0.17 5.42
0.00 0.00 0.00 0.00
0.00 0.00 0.00 0.00
0.00 3.42 0.07 3.49
0.00 0.00 0.00 0.00
0.00 0.00 0.00 0.00
4.29 828.99 22.65 851.64
0.00 517.01 20.63 537.64
0.00 379.68 22.04 401.72
0.00 8.45 0.34 8.80
0.00 0.00 0.00 0.00
0.00 38.30 1.98 40.27
0.00 0.00 0.00 0.00
0.00 0.00 0.00 0.00
0.00 475.28 22.15 497.43
0.00 0.00 0.00 0.00
0.00 0.00 0.00 0.00
0.00 878.42 38.67 917.09
0.00 0.00 0.00 0.00
0.00 0.00 0.00 0.00
0.00
0.00
12.91 17256.70 0.00 0.00 0.00 0.00 990.62 18247.33

Form 8
Items of Revenue Deficit/Surplus (Rs. Crs.) Detail Links 2019-20 2020-21 2021-22 2022-23 2023-24
Aggregate Revenue Requirement (Rs. Crs.) Form 1 26386.23 28548.51
Total Revenue 17264.88 18247.33 0.00 0.00 0.00
Revenue from Current Tariffs (Net of incentives) (Rs. Crs.) Form 5 16321.43 17256.70
Non - Tariff Income (Rs. Crs.) Form 6' 943.45 990.62
Revenue from Trading (Rs. Crs.) Form 1.4 b 0.00 0.00
Revenue Deficit (-) / Surplus(+) at Current Tariffs
(Rs. Crs.)-9121.36 -10301.18 0.00 0.00 0.00
Revenue Deficit / Surplus at Current Tariffs and Charges

Form 9 Revenue Deficit / Surplus and Proposed Adjustments
Items of Revenue Deficit/ Surplus (Rs. Crs.)Detail
Links2019-20 2020-21 2021-22 2022-23 2023-24
A Aggregate Revenue Requirement Form 1 26386.23 28548.51 0.00 0.00 0.00
B Revenue from Current Tariffs (Net of incentives) (Rs. Crs.) Form 5 16321.43 17256.70 0.00 0.00 0.00
C Non - Tariff Income (Rs. Crs.) Form 6' 943.45 990.62 0.00 0.00 0.00
D Revenue from Trading Form 1.4 b 0.00 0.00 0.00 0.00 0.00
E Revenue Deficit(-) / Surplus(+) at Current Tariff -9121.36 -10301.18 0.00 0.00 0.00
F Revenue changed through proposed tariff 843.07
G External subsidy available / contracted 5,777.68
H Any other means of adjustments
i Revenue from Cross Subsidy Surcharge 82.50 92.18
j Revenue from Additional Surcharge
K Revenue from REC
Net Deficit / Surplus -3261.18 -9365.94 0.00 0.00 0.00

Form 10 Revenue from Proposed Tariffs
Gross
RevenueIncentives Net Revenue Surcharge
Additional
surcharge
LT Category 7935.01 0.00 13802.50 0.00 0.00 0.00 13802.50
Domestic Form-10a 4155.07 0.00 4421.81 4421.81
Commerical & Others Form-12 2035.29 0.00 177.89 177.89
Industry 827.03 0.00 489.03 489.03
Institutional 893.69 0.00 5.02 5.02
Agriculture & Related 5.02 0.00 56.28 56.28
Temporary 18.90 0.00 8652.47 8652.47
HT I (B): Gated community, Bungalow & Villa 17.56 0.00 17.56 17.56
HT Cat-II : Commercial 1115.74 0.00 1115.74 1115.74
A) General 1083.56 0.00 1083.56 1083.56
11 KV 818.48 0.00 818.48 818.48
Time of Day Tariff(ToD)- Peak (6PM to 10PM) 109.80 0.00 109.80 109.80
33 KV 119.93 0.00 119.93 119.93
Time of Day Tariff(ToD)- Peak (6PM to 10PM) 0.27 0.00 0.27 0.27
132 KV 35.08 0.00 35.08 35.08
Time of Day Tariff(ToD)- Peak (6PM to 10PM) 0.00 0.00 0.00 0.00
B) Occassional 32.19 0.00 32.19 32.19
11 KV 10.56 0.00 10.56 10.56
33 KV 18.07 0.00 18.07 18.07
132 KV 3.56 0.00 3.56 3.56
HT Cat-III : Industry 5712.81 0.00 5712.81 5712.81
A) Industrial General 5565.42 0.00 5565.42 5565.42
11 KV 744.28 0.00 744.28 744.28
Time of Day Tariff(ToD)- Peak (6AM to 10AM & 6PM to 10PM) 328.85 0.00 328.85 328.85
Time of Day Tariff(ToD)- Off Peak (10PM to 6AM) 228.28 0.00 228.28 228.28
33 KV 1259.61 0.00 1259.61 1259.61
Time of Day Tariff(ToD)- Peak (6AM to 10AM & 6PM to 10PM) 734.19 0.00 734.19 734.19
Time of Day Tariff(ToD)- Off Peak (10PM to 6AM) 530.45 0.00 530.45 530.45
132 KV 854.26 0.00 854.26 854.26
Time of Day Tariff(ToD)- Peak (6AM to 10AM & 6PM to 10PM) 517.01 0.00 517.01 517.01
132 KV 0.00 0.00 0.00 0.00 0.00 0.00 4021.48
C) Energy Intencive 143.96 0.00 143.96 143.96
11 KV 1.13 0.00 1.13 1.13
33 KV 104.52 0.00 104.52 104.52
132 KV 38.30 0.00 38.30 38.30
HT Cat-IV : Institutions 1015.70 0.00 1015.70 1015.70
A) Utilities 105.00 0.00 105.00 105.00
11 KV 49.57 0.00 49.57 49.57
33 KV 55.44 0.00 55.44 55.44
132 KV 0.00 0.00 0.00 0.00
B) General Purpose 190.97 0.00 190.97 190.97
11 KV 170.26 0.00 170.26 170.26
33 KV 20.72 0.00 20.72 20.72
132 KV 0.00 0.00 0.00 0.00
C) Railway Traction 713.84 0.00 713.84 713.84
D) Religious Places 5.88 0.00 5.88 5.88
HT Cat-V : Agriculture & Related 1406.18 0.00 1406.18 1406.18
A) Animal husbandry & Aqua 18.22 0.00 18.22 18.22
B) Hatcheries, Feed Mixing Plants & Flori culture 184.56 0.00 184.56 184.56
B) Lift Irrigation Schemes 1203.40 0.00 1203.40 1203.40
RESCOs 179.30 0.00 179.30 179.30
Temporary supply 0.01 0.00 0.01 0.01
0.00 0.00 0.00 0.00
TOTAL( LT + HT) 18099.77 0.00 18099.77 18099.77
Retail Supply (Regulated Business)Grid Support
Charges
Surcharges (Open Access)Revenue from Proposed Tariffs (Rs. Crs.) Detail Links
2020-21
Total
Revenue

Form 10 a
Incentives at current Tariffs
2020-21
No. of
consumers
Incentive
Amount
LT Category Form-7 0 0.00
Domestic
Commerical & Others
Industry
Institutional
Agriculture & Related
Temporary
HT I (B): Gated community, Bungalow & Villa 0 0.00
HT Cat-II : Commercial
A) General
11 KV
Time of Day Tariff(ToD)- Peak (6PM to 10PM)
33 KV
Time of Day Tariff(ToD)- Peak (6PM to 10PM)
132 KV
Time of Day Tariff(ToD)- Peak (6PM to 10PM)
B) Occassional
11 KV
33 KV
132 KV
HT Cat-III : Industry
A) Industrial General
11 KV
Time of Day Tariff(ToD)- Peak (6AM to 10AM & 6PM to 10PM)
Time of Day Tariff(ToD)- Off Peak (10PM to 6AM)
33 KV
Time of Day Tariff(ToD)- Peak (6AM to 10AM & 6PM to 10PM)
Time of Day Tariff(ToD)- Off Peak (10PM to 6AM)
132 KV
Time of Day Tariff(ToD)- Peak (6AM to 10AM & 6PM to 10PM)
Time of Day Tariff(ToD)- Off Peak (10PM to 6AM)
C) Energy Intencive 0 0.00
11 KV
33 KV
132 KV
HT Cat-IV : Institutions
A) Utilities
11 KV
33 KV
132 KV
B) General Purpose
11 KV
33 KV
132 KV
C) Railway Traction
D) Religious Places
HT Cat-V : Agriculture & Related
A) Animal husbandry & Aqua
B) Hatcheries, Feed Mixing Plants & Flori culture
B) Lift Irrigation Schemes
RESCOs
Temporary supply
TOTAL( LT + HT)
RemarksTotal
Consumer Category Data Link

Form 11
Items of Non - Tariff Income
(Rs. Crs.)Detail Links 2018-19 2019-20 2020-21 2021-22 2022-23 2023-24
Rebate on Power Purchase 96.60 101.43 106.51 0.00 0.00 0.00
Cap S/c 82.86 87.01 91.36 0.00 0.00 0.00
Gain/loss (Billing) -0.11 -0.11 -0.12 0.00 0.00 0.00
HT EPSS 0.00 0.00 0.00 0.00 0.00 0.00
IED 6.12 6.43 6.75 0.00 0.00 0.00
Int on Bank Deposits 0.67 0.70 0.74 0.00 0.00 0.00
LPF 2.94 3.09 3.24 0.00 0.00 0.00
LVSe 8.67 9.10 9.56 0.00 0.00 0.00
Malpractice 6.40 6.72 7.06 0.00 0.00 0.00
Prior Period HT -27.99 -29.39 -30.86 0.00 0.00 0.00
Prior Period LT -8.70 -9.14 -9.60 0.00 0.00 0.00
Reactive Income 1.14 1.20 1.26 0.00 0.00 0.00
Receipt of Direct Ta 2.57 2.70 2.84 0.00 0.00 0.00
Recoveries for TP 0.00 0.00 0.00 0.00 0.00 0.00
Theft 16.59 17.42 18.29 0.00 0.00 0.00
Reconnection fee 56.29 59.10 62.06 0.00 0.00 0.00
Delayed payment surcharge 654.46 687.18 721.54 0.00 0.00 0.00
Total Non tariff income 898.52 943.45 990.62 0.00 0.00 0.00
Non-tariff Income at Proposed Charges
This form refers to the income other than the income derived from tariffs and does not include cross subsidy surcharge, additional surcharge,
etc.
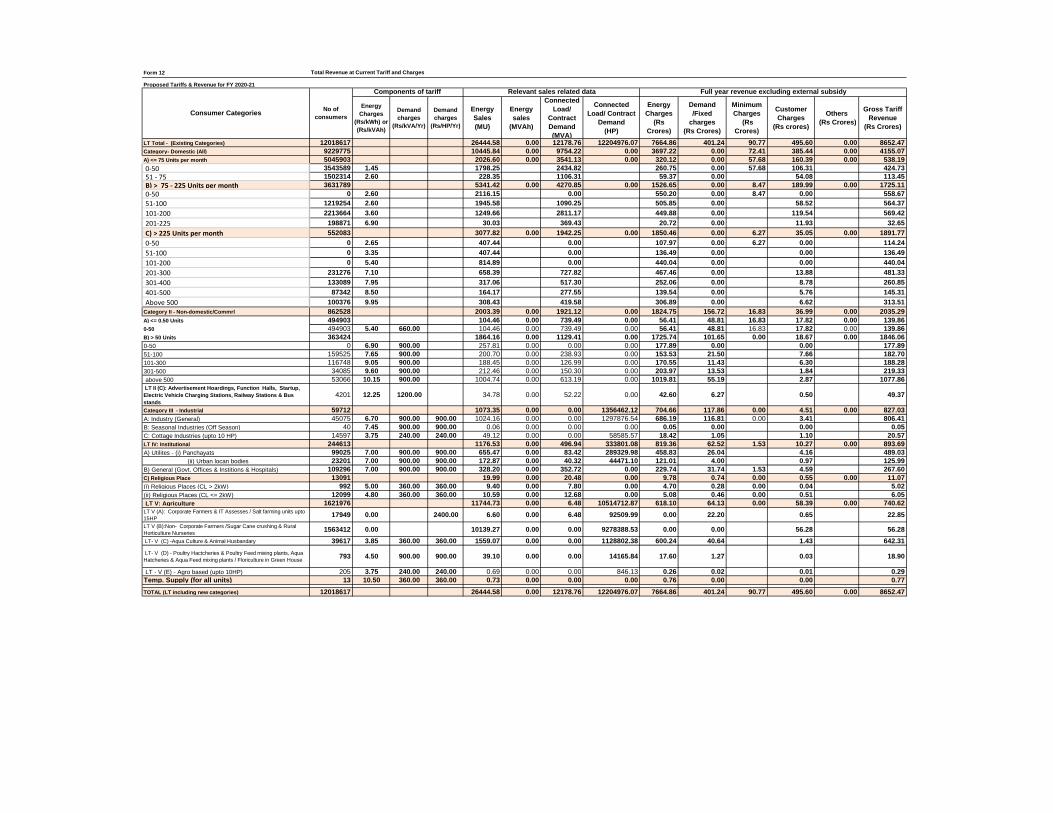
Form 12 Total Revenue at Current Tariff and Charges
Proposed Tariffs & Revenue for FY 2020-21
Energy
Charges
(Rs/kWh) or
(Rs/kVAh)
Demand
charges
(Rs/kVA/Yr)
Demand
charges
(Rs/HP/Yr)
Energy
Sales
(MU)
Energy
sales
(MVAh)
Connected
Load/
Contract
Demand
(MVA)
Connected
Load/ Contract
Demand
(HP)
Energy
Charges
(Rs
Crores)
Demand
/Fixed
charges
(Rs Crores)
Minimum
Charges
(Rs
Crores)
Customer
Charges
(Rs crores)
Others
(Rs Crores)
Gross Tariff
Revenue
(Rs Crores)
LT Total - (Existing Categories) 12018617 26444.58 0.00 12178.76 12204976.07 7664.86 401.24 90.77 495.60 0.00 8652.47
Category- Domestic (All) 9229775 10445.84 0.00 9754.22 0.00 3697.22 0.00 72.41 385.44 0.00 4155.07
A) <= 75 Units per month 5045903 2026.60 0.00 3541.13 0.00 320.12 0.00 57.68 160.39 0.00 538.19
0-50 3543589 1.45 1798.25 2434.82 260.75 0.00 57.68 106.31 424.73
51 - 75 1502314 2.60 228.35 1106.31 59.37 0.00 54.08 113.45
B) > 75 - 225 Units per month 3631789 5341.42 0.00 4270.85 0.00 1526.65 0.00 8.47 189.99 0.00 1725.11
0-50 0 2.60 2116.15 0.00 550.20 0.00 8.47 0.00 558.67
51-100 1219254 2.60 1945.58 1090.25 505.85 0.00 58.52 564.37
101-200 2213664 3.60 1249.66 2811.17 449.88 0.00 119.54 569.42
201-225 198871 6.90 30.03 369.43 20.72 0.00 11.93 32.65
C) > 225 Units per month 552083 3077.82 0.00 1942.25 0.00 1850.46 0.00 6.27 35.05 0.00 1891.77
0-50 0 2.65 407.44 0.00 107.97 0.00 6.27 0.00 114.24
51-100 0 3.35 407.44 0.00 136.49 0.00 0.00 136.49
101-200 0 5.40 814.89 0.00 440.04 0.00 0.00 440.04
201-300 231276 7.10 658.39 727.82 467.46 0.00 13.88 481.33
301-400 133089 7.95 317.06 517.30 252.06 0.00 8.78 260.85
401-500 87342 8.50 164.17 277.55 139.54 0.00 5.76 145.31
Above 500 100376 9.95 308.43 419.58 306.89 0.00 6.62 313.51
Category II - Non-domestic/Commrl 862528 2003.39 0.00 1921.12 0.00 1824.75 156.72 16.83 36.99 0.00 2035.29
A) <= 0.50 Units 494903 104.46 0.00 739.49 0.00 56.41 48.81 16.83 17.82 0.00 139.86
0-50 494903 5.40 660.00 104.46 0.00 739.49 0.00 56.41 48.81 16.83 17.82 0.00 139.86
B) > 50 Units 363424 1864.16 0.00 1129.41 0.00 1725.74 101.65 0.00 18.67 0.00 1846.06
0-50 0 6.90 900.00 257.81 0.00 0.00 0.00 177.89 0.00 0.00 177.89
51-100 159525 7.65 900.00 200.70 0.00 238.93 0.00 153.53 21.50 7.66 182.70
101-300 116748 9.05 900.00 188.45 0.00 126.99 0.00 170.55 11.43 6.30 188.28
301-500 34085 9.60 900.00 212.46 0.00 150.30 0.00 203.97 13.53 1.84 219.33
above 500 53066 10.15 900.00 1004.74 0.00 613.19 0.00 1019.81 55.19 2.87 1077.86
LT II (C): Advertisement Hoardings, Function Halls, Startup,
Electric Vehicle Charging Stations, Railway Stations & Bus
stands
4201 12.25 1200.00 34.78 0.00 52.22 0.00 42.60 6.27 0.50 49.37
Category III - Industrial 59712 1073.35 0.00 0.00 1356462.12 704.66 117.86 0.00 4.51 0.00 827.03
A: Industry (General) 45075 6.70 900.00 900.00 1024.16 0.00 0.00 1297876.54 686.19 116.81 0.00 3.41 806.41
B: Seasonal Industries (Off Season) 40 7.45 900.00 900.00 0.06 0.00 0.00 0.00 0.05 0.00 0.00 0.05
C: Cottage Industries (upto 10 HP) 14597 3.75 240.00 240.00 49.12 0.00 0.00 58585.57 18.42 1.05 1.10 20.57
LT IV: Institutional 244613 1176.53 0.00 496.94 333801.08 819.36 62.52 1.53 10.27 0.00 893.69
A) Utilites - (i) Panchayats 99025 7.00 900.00 900.00 655.47 0.00 83.42 289329.98 458.83 26.04 4.16 489.03
(ii) Urban locan bodies 23201 7.00 900.00 900.00 172.87 0.00 40.32 44471.10 121.01 4.00 0.97 125.99
B) General (Govt. Offices & Institions & Hospitals) 109296 7.00 900.00 900.00 328.20 0.00 352.72 0.00 229.74 31.74 1.53 4.59 267.60
C) Religious Place 13091 19.99 0.00 20.48 0.00 9.78 0.74 0.00 0.55 0.00 11.07
(i) Religious Places (CL > 2kW) 992 5.00 360.00 360.00 9.40 0.00 7.80 0.00 4.70 0.28 0.00 0.04 5.02
(ii) Religious Places (CL <= 2kW) 12099 4.80 360.00 360.00 10.59 0.00 12.68 0.00 5.08 0.46 0.00 0.51 6.05
LT V: Agriculture 1621976 11744.73 0.00 6.48 10514712.87 618.10 64.13 0.00 58.39 0.00 740.62LT V (A): Corporate Farmers & IT Assesses / Salt farming units upto
15HP17949 0.00 2400.00 6.60 0.00 6.48 92509.99 0.00 22.20 0.65 22.85
LT V (B):Non- Corporate Farmers /Sugar Cane crushing & Rural
Horticulture Nurseries1563412 0.00 10139.27 0.00 0.00 9278388.53 0.00 0.00 56.28 56.28
LT- V (C) -Aqua Culture & Animal Husbandary 39617 3.85 360.00 360.00 1559.07 0.00 0.00 1128802.38 600.24 40.64 1.43 642.31
LT- V (D) - Poultry Hactcheries & Poultry Feed mixing plants, Aqua
Hatcheries & Aqua Feed mixing plants / Floriculture in Green House793 4.50 900.00 900.00 39.10 0.00 0.00 14165.84 17.60 1.27 0.03 18.90
LT - V (E) - Agro based (upto 10HP) 205 3.75 240.00 240.00 0.69 0.00 0.00 846.13 0.26 0.02 0.01 0.29
Temp. Supply (for all units) 13 10.50 360.00 360.00 0.73 0.00 0.00 0.00 0.76 0.00 0.00 0.77
TOTAL (LT including new categories) 12018617 26444.58 0.00 12178.76 12204976.07 7664.86 401.24 90.77 495.60 0.00 8652.47
Consumer CategoriesNo of
consumers
Components of tariff Relevant sales related data Full year revenue excluding external subsidy

Energy
Charges
(Rs/kWh) or
(Rs/kVAh)
Demand
charges
(Rs/kVA/Yr)
Demand
charges
(Rs/HP/Yr)
Energy
Sales
(MU)
Energy
sales
(MVAh)
Connected
Load/
Contract
Demand
(MVA)
Connected
Load/ Contract
Demand
(HP)
Energy
Charges
(Rs
Crores)
Demand
/Fixed
charges
(Rs Crores)
Minimum
Charges
(Rs
Crores)
Customer
Charges
(Rs crores)
Others
(Rs Crores)
Gross Tariff
Revenue
(Rs Crores)
Consumer CategoriesNo of
consumers
Components of tariff Relevant sales related data Full year revenue excluding external subsidy
HIGH TENSION 8071 12349.26 0.00 4823.80 0.00 7551.62 1878.96 0.00 16.72 0.00 9447.30
HT I (B): Gated community, Bungalow & Villa 47 7.00 900.00 23.67 0.00 11.02 0.00 16.57 0.99 0.00 17.56
HT Cat-II : Commercial 3100 1051.80 0.00 532.93 0.00 826.35 283.86 0.00 5.52 0.00 1115.74
A) General 2878 1025.98 0.00 498.01 0.00 794.72 283.86 0.00 4.97 0.00 1083.56
11 KV 2810 7.65 5700.00 744.96 0.00 427.79 0.00 569.90 243.84 4.74 818.48
Time of Day Tariff(ToD)- Peak (6PM to 10PM) 0 8.65 126.94 109.80 0.00 0.00 109.80
33 KV 67 7.50 5700.00 116.12 0.00 57.22 0.00 87.09 32.61 0.23 119.93
Time of Day Tariff(ToD)- Peak (6PM to 10PM) 0 8.50 0.32 0.27 0.00 0.00 0.27
132 KV 1 7.35 5700.00 37.64 0.00 13.00 0.00 27.66 7.41 0.00 35.08
Time of Day Tariff(ToD)- Peak (6PM to 10PM) 0 8.35 0.00 0.00 0.00 0.00 0.00
B) Occassional 222 25.82 0.00 34.93 0.00 31.63 0.00 0.00 0.55 0.00 32.19
11 KV 116 12.25 8.46 0.00 20.38 0.00 10.36 0.00 0.20 10.56
33 KV 102 12.25 14.47 0.00 13.92 0.00 17.72 0.00 0.34 18.07
132 KV 4 12.25 2.90 0.00 0.63 0.00 3.55 0.00 0.01 3.56
HT Cat-III : Industry 3670 7633.38 0.00 2358.54 0.00 4392.94 1312.90 0.00 6.96 0.00 5712.81
A) Industrial General 3629 7354.28 0.00 2303.33 0.00 4245.65 1312.90 0.00 6.88 0.00 5565.42
11 KV 3182 6.30 5700.00 502.45 0.00 741.00 0.00 316.54 422.37 5.37 744.28
Time of Day Tariff(ToD)- Peak (6AM to 10AM & 6PM to 10PM) 7.30 450.48 328.85 0.00 0.00 328.85
Time of Day Tariff(ToD)- Off Peak (10PM to 6AM) 5.30 430.71 228.28 0.00 0.00 228.28
33 KV 401 5.85 5700.00 1234.14 0.00 940.85 0.00 721.97 536.28 1.35 1259.61
Time of Day Tariff(ToD)- Peak (6AM to 10AM & 6PM to 10PM) 6.85 1071.82 734.19 0.00 0.00 734.19
Time of Day Tariff(ToD)- Off Peak (10PM to 6AM) 4.85 1093.70 530.45 0.00 0.00 530.45
132 KV 46 5.40 5700.00 925.66 0.00 621.48 0.00 499.86 354.24 0.16 854.26
Time of Day Tariff(ToD)- Peak (6AM to 10AM & 6PM to 10PM) 6.40 807.83 517.01 0.00 0.00 517.01
Time of Day Tariff(ToD)- Off Peak (10PM to 6AM) 4.40 837.48 368.49 0.00 0.00 368.49
Industrial Colonies 0 7.00 25.43 0.00 0.00 0.00 17.80 0.00 0.00 17.80
B) Industrial Seasonal 29 4.47 0.00 0.00 0.00 3.37 0.00 0.00 0.05 0.00 3.42
11 KV 28 7.65 5700.00 3.80 0.00 0.00 0.00 2.91 0.00 0.05 2.96
33 KV 1 6.95 5700.00 0.67 0.00 0.00 0.00 0.46 0.00 0.00 0.47
132 KV 0 6.70 5700.00 0.00 0.00 0.00 0.00 0.00 0.00 0.00 0.00
C) Energy Intensive 12 274.63 0.00 55.21 0.00 143.92 0.00 0.00 0.04 0.00 143.96
11 KV 3 5.80 1.95 0.00 0.74 0.00 1.13 0.00 0.01 1.13
33 KV 8 5.35 195.32 0.00 36.47 0.00 104.50 0.00 0.03 104.52
132 KV 1 4.95 77.36 0.00 18.00 0.00 38.30 0.00 0.00 38.30
HT Cat-IV : Institutions 472 1171.21 0.00 513.32 0.00 796.49 217.62 0.00 1.59 0.00 1015.70
A) Utilities (CPWS / PWS) 126 107.27 0.00 41.24 0.00 81.07 23.51 0.00 0.43 0.00 105.00
11 KV 106 7.95 5700.00 5700.00 47.20 0.00 20.49 0.00 37.53 11.68 0.36 49.57
33 KV 20 7.25 5700.00 5700.00 60.06 0.00 20.74 0.00 43.55 11.82 0.07 55.44
132 KV 0 7.00 5700.00 5700.00 0.00 0.00 0.00 0.00 0.00 0.00 0.00 0.00
B) General Purpose 296 185.64 0.00 76.91 0.00 146.14 43.84 0.00 1.00 0.00 190.97
11 KV 273 7.95 5700.00 5700.00 164.97 67.00 131.15 38.19 0.92 170.26
33 KV 23 7.25 5700.00 5700.00 20.67 9.91 14.99 5.65 0.08 20.72
132 KV 7.00 5700.00 5700.00 0.00 0.00 0.00 0.00
D) Railway Traction 32 6.50 4200.00 867.50 0.00 356.80 0.00 563.88 149.86 0.11 713.84
C) Religious Places 18 5.00 360.00 10.80 0.00 38.37 0.00 5.40 0.42 0.06 5.88
HT Cat-V : Agriculture & Related 778 1955.83 0.00 1407.57 0.00 1339.98 63.58 0.00 2.63 0.00 1406.18
A) Animal husbandry & Aqua 76 3.85 360.00 44.16 0.00 26.72 0.00 17.00 0.96 0.26 18.22
B) Hatcheries, Feed Mixing Plants & Flori culture 219 5.25 5700.00 230.86 0.00 109.85 0.00 121.20 62.62 0.74 184.56
B) Lift Irrigation Schemes 483 7.15 1680.80 0.00 1271.00 0.00 1201.77 0.00 1.63 1203.40
RESCOs 1 3.50 512.27 0.00 0.00 0.00 179.29 0.00 0.00 179.30
Temporary supply 3 1.10 0.00 0.42 0.00 0.00 0.00 0.01 0.01
TOTAL( LT + HT) 12026688 38793.83 0.00 17002.56 12204976.07 15216.48 2280.19 90.77 512.32 0.00 18099.77
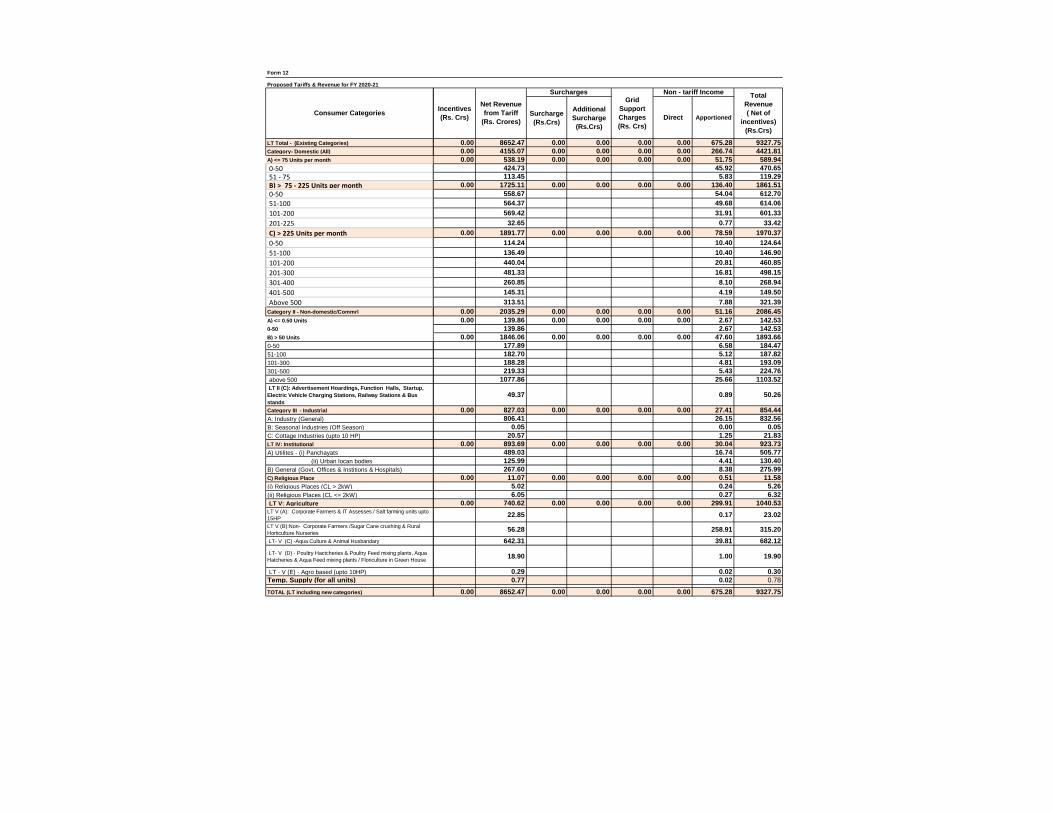
Form 12
Proposed Tariffs & Revenue for FY 2020-21
LT Total - (Existing Categories)
Category- Domestic (All)
A) <= 75 Units per month
0-50 51 - 75 B) > 75 - 225 Units per month 0-50
51-100
101-200
201-225
C) > 225 Units per month
0-50
51-100
101-200
201-300
301-400
401-500
Above 500 Category II - Non-domestic/Commrl
A) <= 0.50 Units
0-50
B) > 50 Units
0-50
51-100
101-300
301-500
above 500
LT II (C): Advertisement Hoardings, Function Halls, Startup,
Electric Vehicle Charging Stations, Railway Stations & Bus
stands
Category III - Industrial
A: Industry (General)
B: Seasonal Industries (Off Season)
C: Cottage Industries (upto 10 HP)
LT IV: Institutional
A) Utilites - (i) Panchayats
(ii) Urban locan bodies
B) General (Govt. Offices & Institions & Hospitals)
C) Religious Place
(i) Religious Places (CL > 2kW)
(ii) Religious Places (CL <= 2kW)
LT V: Agriculture
LT V (A): Corporate Farmers & IT Assesses / Salt farming units upto
15HP
LT V (B):Non- Corporate Farmers /Sugar Cane crushing & Rural
Horticulture Nurseries
LT- V (C) -Aqua Culture & Animal Husbandary
LT- V (D) - Poultry Hactcheries & Poultry Feed mixing plants, Aqua
Hatcheries & Aqua Feed mixing plants / Floriculture in Green House
LT - V (E) - Agro based (upto 10HP)
Temp. Supply (for all units)
TOTAL (LT including new categories)
Consumer Categories Surcharge
(Rs.Crs)
Additional
Surcharge
(Rs.Crs)
Direct Apportioned
0.00 8652.47 0.00 0.00 0.00 0.00 675.28 9327.75
0.00 4155.07 0.00 0.00 0.00 0.00 266.74 4421.81
0.00 538.19 0.00 0.00 0.00 0.00 51.75 589.94
424.73 45.92 470.65
113.45 5.83 119.29
0.00 1725.11 0.00 0.00 0.00 0.00 136.40 1861.51
558.67 54.04 612.70
564.37 49.68 614.06
569.42 31.91 601.33
32.65 0.77 33.42
0.00 1891.77 0.00 0.00 0.00 0.00 78.59 1970.37
114.24 10.40 124.64
136.49 10.40 146.90
440.04 20.81 460.85
481.33 16.81 498.15
260.85 8.10 268.94
145.31 4.19 149.50
313.51 7.88 321.39
0.00 2035.29 0.00 0.00 0.00 0.00 51.16 2086.45
0.00 139.86 0.00 0.00 0.00 0.00 2.67 142.53
139.86 2.67 142.53
0.00 1846.06 0.00 0.00 0.00 0.00 47.60 1893.66
177.89 6.58 184.47
182.70 5.12 187.82
188.28 4.81 193.09
219.33 5.43 224.76
1077.86 25.66 1103.52
49.37 0.89 50.26
0.00 827.03 0.00 0.00 0.00 0.00 27.41 854.44
806.41 26.15 832.56
0.05 0.00 0.05
20.57 1.25 21.83
0.00 893.69 0.00 0.00 0.00 0.00 30.04 923.73
489.03 16.74 505.77
125.99 4.41 130.40
267.60 8.38 275.99
0.00 11.07 0.00 0.00 0.00 0.00 0.51 11.58
5.02 0.24 5.26
6.05 0.27 6.32
0.00 740.62 0.00 0.00 0.00 0.00 299.91 1040.53
22.85 0.17 23.02
56.28 258.91 315.20
642.31 39.81 682.12
18.90 1.00 19.90
0.29 0.02 0.30
0.77 0.02 0.78
0.00 8652.47 0.00 0.00 0.00 0.00 675.28 9327.75
Non - tariff Income Total
Revenue
( Net of
incentives)
(Rs.Crs)
Incentives
(Rs. Crs)
Net Revenue
from Tariff
(Rs. Crores)
SurchargesGrid
Support
Charges
(Rs. Crs)

Consumer Categories
HIGH TENSION
HT I (B): Gated community, Bungalow & Villa
HT Cat-II : Commercial
A) General
11 KV
Time of Day Tariff(ToD)- Peak (6PM to 10PM)
33 KV
Time of Day Tariff(ToD)- Peak (6PM to 10PM)
132 KV
Time of Day Tariff(ToD)- Peak (6PM to 10PM)
B) Occassional
11 KV
33 KV
132 KV
HT Cat-III : Industry
A) Industrial General
11 KV
Time of Day Tariff(ToD)- Peak (6AM to 10AM & 6PM to 10PM)
Time of Day Tariff(ToD)- Off Peak (10PM to 6AM)
33 KV
Time of Day Tariff(ToD)- Peak (6AM to 10AM & 6PM to 10PM)
Time of Day Tariff(ToD)- Off Peak (10PM to 6AM)
132 KV
Time of Day Tariff(ToD)- Peak (6AM to 10AM & 6PM to 10PM)
Time of Day Tariff(ToD)- Off Peak (10PM to 6AM)
Industrial Colonies
B) Industrial Seasonal
11 KV
33 KV
132 KV
C) Energy Intensive
11 KV
33 KV
132 KV
HT Cat-IV : Institutions
A) Utilities (CPWS / PWS)
11 KV
33 KV
132 KV
B) General Purpose
11 KV
33 KV
132 KV
D) Railway Traction
C) Religious Places
HT Cat-V : Agriculture & Related
A) Animal husbandry & Aqua
B) Hatcheries, Feed Mixing Plants & Flori culture
B) Lift Irrigation Schemes
RESCOs
Temporary supply
TOTAL( LT + HT)
Surcharge
(Rs.Crs)
Additional
Surcharge
(Rs.Crs)
Direct Apportioned
Non - tariff Income Total
Revenue
( Net of
incentives)
(Rs.Crs)
Incentives
(Rs. Crs)
Net Revenue
from Tariff
(Rs. Crores)
SurchargesGrid
Support
Charges
(Rs. Crs)
0.00 9447.30 0.00 0.00 0.00 0.00 315.35 9762.64
17.56 0.60 18.17
0.00 1115.74 0.00 0.00 0.00 0.00 26.86 1142.60
0.00 1083.56 0.00 0.00 0.00 0.00 26.20 1109.76
818.48 19.02 837.50
109.80 3.24 113.04
119.93 2.97 122.90
0.27 0.01 0.28
35.08 0.96 36.04
0.00 0.00 0.00
0.00 32.19 0.00 0.00 0.00 0.00 0.66 32.85
10.56 0.22 10.77
18.07 0.37 18.44
3.56 0.07 3.64
0.00 5712.81 0.00 0.00 0.00 0.00 194.92 5907.73
0.00 5565.42 0.00 0.00 0.00 0.00 187.80 5753.22
744.28 12.83 757.11
328.85 11.50 340.35
228.28 11.00 239.28
1259.61 31.51 1291.13
734.19 27.37 761.56
530.45 27.93 558.37
854.26 23.64 877.89
517.01 20.63 537.64
368.49 21.39 389.88
17.80 0.65 18.45
0.00 3.42 0.00 0.00 0.00 0.00 0.11 3.54
2.96 0.10 3.05
0.47 0.02 0.49
0.00 0.00 0.00
0.00 143.96 0.00 0.00 0.00 0.00 7.01 150.97
1.13 0.05 1.18
104.52 4.99 109.51
38.30 1.98 40.27
0.00 1015.70 0.00 0.00 0.00 0.00 29.91 1045.61
0.00 105.00 0.00 0.00 0.00 0.00 2.74 107.74
49.57 1.21 50.77
55.44 1.53 56.97
0.00 0.00 0.00
0.00 190.97 0.00 0.00 0.00 0.00 4.74 195.71
170.26 4.21 174.47
20.72 0.53 21.24
0.00 0.00 0.00
713.84 22.15 735.99
5.88 0.28 6.16
0.00 1406.18 0.00 0.00 0.00 0.00 49.94 1456.13
18.22 1.13 19.35
184.56 5.90 190.45
1203.40 42.92 1246.32
179.30 13.08 192.38
0.01 0.03 0.03
0.00 18099.77 0.00 0.00 0.00 0.00 990.62 19090.39

Form 13 CoSt and Revenue
2020-21 Amount in Rs crores
Consumer CategoryDetail
LinksCost of Service
Revenue from
Tariff & Charges
(Class Deficit) / Class
Surplus
(=Revenue from Tariff &
Charges - CoS)
External
SubsidyCross Subsidy Remarks
LT Category 19960.18 8497.03 -11463.15 0.00 -11463.15
HT Category at 11 KV 2305.98 2619.48 313.50 0.00 313.50
HT Category at 33 KV 2855.03 2977.33 122.30 0.00 122.30
HT Category at 132 KV 3427.33 3162.87 -264.46 0.00 -264.46
Total 28548.51 17256.70 -11291.81 0.00 -11291.81