south korea country analysis
TRANSCRIPT

SOUTH KOREA
EDIM
Jogendra Singh YadavFinance (2012-14)
12114

South KoreaBackground: An independent kingdom for much of its long history, Korea
was occupied by Japan beginning in 1905 following the Russo-Japanese War. In 1910, Tokyo formally annexed the entire Peninsula. Korea regained its
independence following Japan's surrender to the United States in 1945. After World War II, a democratic-based government (Republic of Korea, ROK) was set up in the southern half of the Korean Peninsula while a communist-style
government was installed in the north (Democratic People's Republic of Korea, DPRK). During the Korean War (1950-53), US troops and UN forces fought alongside ROK soldiers to defend South Korea from a DPRK invasion
supported by China and the Soviet Union. A 1953 armistice split the peninsula along a demilitarized zone at about the 38th parallel. PARK Chung-hee took
over leadership of the country in a 1961 coup. During his regime, from 1961 to 1979, South Korea achieved rapid economic growth, with per capita income rising to roughly 17 times the level of North Korea. South Korea held its first
free presidential election under a revised democratic constitution in 1987, with former ROK Army general ROH Tae-woo winning a close race. In 1993, KIM Young-sam (1993-98) became South Korea's first civilian president. South
Korea today is a fully functioning modern democracy. LEE Myung-bak (2008-2013) pursued a policy of global engagement , highlighted by Seoul's hosting
of the G-20 summit in November 2010 and the Nuclear Security Summit in March 2012. South Korea also secured a non-permanent seat (2013-14) on
the UN Security Council and will host the 2018 Winter Olympic Games. President PARK Geun-hye took office in February 2013 and is South Korea's first female leader. Serious tensions with North Korea have punctuated inter-Korean relations in recent years, including the North's sinking of the South Korean warship Cheonan in March 2010 and its artillery attack on South
Korean soldiers and citizens in November 2010.

South Korea, officially the Republic of Korea. "The Great Republic of Korea is a country in East Asia, constituting the southern part of the Korean Peninsula. It shares land borders with North Korea to the north, and oversea borders with China to the west and Japan to the east. The capital and largest city is Seoul, with a population of 10 million. The Korean War began in 1950 when forces from the North invaded the South. The war lasted three years and involved the U.S., China, the Soviet Union, and several other nations. The border between the two nations remains the most heavily fortified in the world.
In the decades that followed, the South Korean economy grew significantly and the country was transformed into a G-20 major economy. South Korea is a presidential republic consisting of 17 administrative divisions and is a developed country with the second highest standard of living in Asia, having an HDI of 0.909. It is Asia's fourth largest economy and the world's 15th (nominal) or 12th (purchasing power parity) largest economy. The economy is export-driven, with production focusing on electronics, automobiles, ships, machinery, petrochemicals and robotics. South Korea is a member of the United Nations, WTO, and OECD, and a founding member of APEC and the East Asia Summit.

Geography Profile: Location Eastern Asia, southern half of the
Korean Peninsula bordering the Sea of Japan and the Yellow Sea
Geographic coordinates 37 00 N, 127 30 E
Map references Asia
Area total: 99,720 sq km land: 96,920 sq km water: 2,800 sq km
Area - comparative slightly larger than Indiana
Land boundaries total: 238 km border countries: North Korea 238 km
Coastline 2,413 km
Maritime claims territorial sea: 12 nm; between 3 nm and 12 nm in the Korea Strait contiguous zone: 24 nm exclusive economic zone: 200 nm continental shelf: not specified
Climate temperate, with rainfall heavier in summer than winter
Terrain mostly hills and mountains; wide coastal plains in west and south
Elevation extremes lowest point: Sea of Japan 0 m highest point: Halla-san 1,950 m
Natural resources coal, tungsten, graphite, molybdenum, lead, hydropower potential
Land use arable land: 14.93%

permanent crops: 2.06% other: 83% (2011)
Irrigated land 8,804 sq km (2003)
Total renewable water resources 69.7 cu km (2011)
Freshwater withdrawal (domestic/industrial/agricultural)
total: 25.47 cu km/yr (26%/12%/62%) per capita: 548.7 cu m/yr (2003)
Natural hazards occasional typhoons bring high winds and floods; low-level seismic activity common in southwest volcanism: Halla (elev. 1,950 m) is considered historically active although it has not erupted in many centuries
Environment - current issues air pollution in large cities; acid rain; water pollution from the discharge of sewage and industrial effluents; drift net fishing
Environment - international agreements
party to: Antarctic-Environmental Protocol, Antarctic-Marine Living Resources, Antarctic Treaty, Biodiversity, Climate Change, Climate Change-Kyoto Protocol, Desertification, Endangered Species, Environmental Modification, Hazardous Wastes, Law of the Sea, Marine Dumping, Ozone Layer Protection, Ship Pollution, Tropical Timber 83, Tropical Timber 94, Wetlands, Whaling signed, but not ratified: none of the selected agreements
South Korea Map references

South Korea AreaArea: total: 99,720 sq km land: 96,920 sq km water: 2,800 sq km
Definition: This entry includes three subfields. Total area is the sum of all land and water areas delimited by international boundaries and/or coastlines. Land area is the aggregate of all surfaces delimited by international boundaries and/or coastlines, excluding inland water bodies (lakes, reservoirs, rivers). Water area is the sum of the surfaces of all inland

water bodies, such as lakes, reservoirs, or rivers, as delimited by international boundaries and/or coastlines.
South Korea Land boundaries
Land boundaries: total: 238 km border countries: North Korea 238 km
Definition: This entry contains the total length of all land boundaries and the individual lengths for each of the contiguous border countries. When available, official lengths published by national statistical agencies are used. Because surveying methods may differ, country border lengths reported by contiguous countries may differ.
South Korea CoastlineCoastline: 2,413 km
Definition: This entry gives the total length of the boundary between the land area (including islands) and the sea.
South Korea Climate

Climate: temperate, with rainfall heavier in summer than winter
Definition: This entry includes a brief description of typical weather regimes throughout the year.
South Korea Terrain Terrain: mostly hills and mountains; wide coastal plains in west and south
Definition: This entry contains a brief description of the topography.
Natural resourcesNatural resources: coal, tungsten, graphite, molybdenum, lead, hydropower potential
Definition: This entry lists a country's mineral, petroleum, hydropower, and other resources of commercial importance.
Land useLand use: arable land: 14.93% permanent crops: 2.06% other: 83% (2011)
Definition: This entry contains the percentage shares of total land area for three different types of land use: arable land - land cultivated for crops like wheat, maize, and rice that are replanted after each harvest; permanent crops - land cultivated for crops like citrus, coffee, and rubber that are not replanted after each harvest; includes land under flowering shrubs, fruit trees, nut trees, and vines, but excludes land under trees grown for wood or timber; other - any land not arable or under permanent crops; includes permanent meadows and pastures, forests and woodlands, built-on areas, roads, barren land, etc
Natural hazards

Natural hazards: occasional typhoons bring high winds and floods; low-level seismic activity common in southwest volcanism: Halla (elev. 1,950 m) is considered historically active although it has not erupted in many centuries
Definition: This entry lists potential natural disasters.
Environment - international agreementsEnvironment - international agreements: party to: Antarctic-Environmental Protocol, Antarctic-Marine Living Resources, Antarctic Treaty, Biodiversity, Climate Change, Climate Change-Kyoto Protocol, Desertification, Endangered Species, Environmental Modification, Hazardous Wastes, Law of the Sea, Marine Dumping, Ozone Layer Protection, Ship Pollution, Tropical Timber 83, Tropical Timber 94, Wetlands, Whaling signed, but not ratified: none of the selected agreements
Definition: This entry separates country participation in international environmental agreements into two levels - party to and signed, but not ratified. Agreements are listed in alphabetical order by the abbreviated form of the full name.
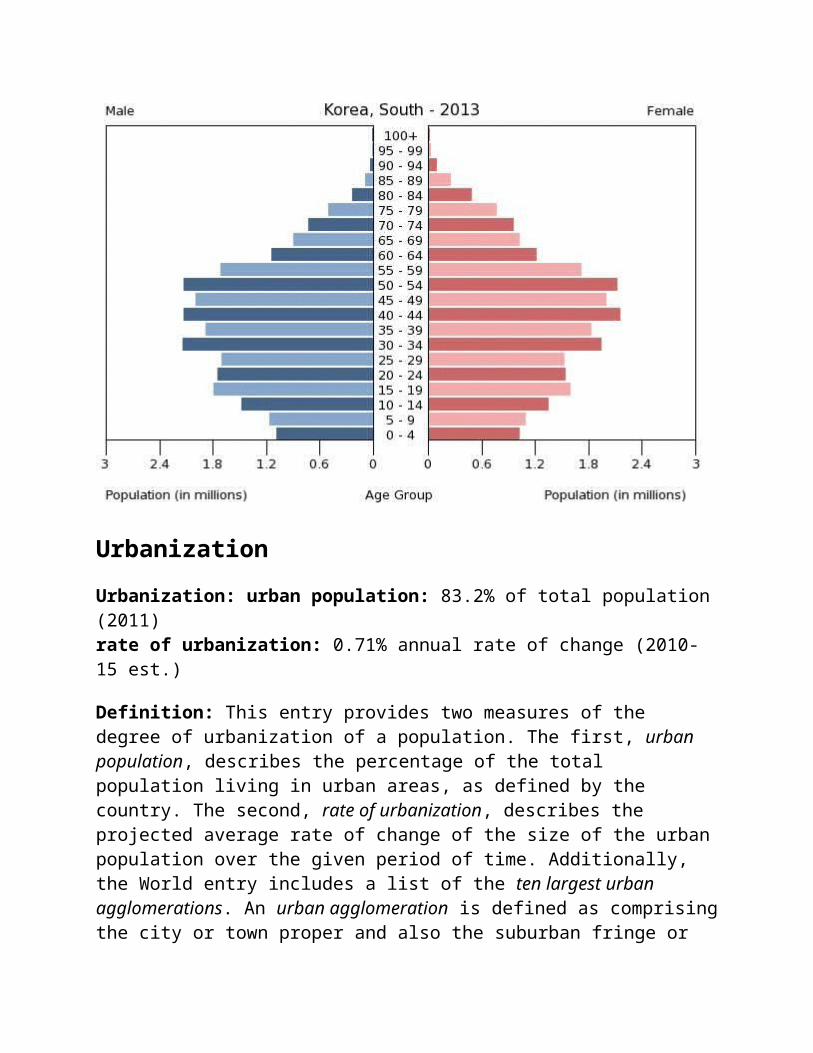
Demographics Profile 2013Population48,955,203 (July 2013 est.)Age structure0-14 years: 14.6% (male 3,717,701/female 3,424,490) 15-24 years: 13.6% (male 3,525,050/female 3,117,198) 25-54 years: 47.8% (male 11,925,181/female 11,491,841) 55-64 years: 11.7% (male 2,842,996/female 2,907,730) 65 years and over: 12.3% (male 2,469,093/female 3,533,923) (2013 est.)Dependency ratiostotal dependency ratio: 37.1 % youth dependency ratio: 20.4 % elderly dependency ratio: 16.7 % potential support ratio: 6 (2013)Median agetotal: 39.7 years male: 38.2 years female: 41 years (2013 est.)Population growth rate0.18% (2013 est.)Birth rate8.33 births/1,000 population (2013 est.)Death rate6.5 deaths/1,000 population (2013 est.)Net migration rate0 migrant(s)/1,000 population (2013 est.)Urbanizationurban population: 83.2% of total population (2011)

rate of urbanization: 0.71% annual rate of change (2010-15 est.)Major cities - populationSEOUL (capital) 9.778 million; Busan (Pusan) 3.439 million; Incheon (Inch'on) 2.572 million; Daegu (Taegu) 2.458 million; Daejon (Taejon) 1.497 million (2009)Sex ratioat birth: 1.07 male(s)/female 0-14 years: 1.09 male(s)/female 15-24 years: 1.13 male(s)/female 25-54 years: 1.04 male(s)/female 55-64 years: 0.98 male(s)/female 65 years and over: 0.69 male(s)/female total population: 1 male(s)/female (2013 est.)Mother's mean age at first birth29.6 (2008 est.)Infant mortality ratetotal: 4.01 deaths/1,000 live births male: 4.21 deaths/1,000 live births female: 3.79 deaths/1,000 live births (2013 est.)Life expectancy at birthtotal population: 79.55 years male: 76.4 years female: 82.91 years (2013 est.)Total fertility rate1.24 children born/woman (2013 est.)Contraceptive prevalence rate80% note: percent of women aged 15-44 (2009)HIV/AIDS - adult prevalence rateless than 0.1% (2009 est.)HIV/AIDS - people living with HIV/AIDS9,500 (2009 est.)HIV/AIDS - deathsfewer than 500 (2009 est.)Drinking water sourceimproved: urban: 100% of population rural: 88% of population total: 98% of population unimproved: urban: 0% of population rural: 12% of population total: 2% of population (2010 est.)Sanitation facility accessimproved: urban: 100% of population rural: 100% of population total: 100% of population (2010 est.)Nationalitynoun: Korean(s) adjective: KoreanEthnic groupshomogeneous (except for about 20,000 Chinese)ReligionsChristian 31.6% (Protestant 24%, Roman Catholic 7.6%), Buddhist 24.2%, other or unknown 0.9%, none 43.3% (2010 survey)LanguagesKorean, English (widely taught in junior high and high school)Literacydefinition: age 15 and over can read and write

total population: 97.9% male: 99.2% female: 96.6% (2002)School life expectancy (primary to tertiary education)total: 17 years male: 18 years female: 16 years (2010)Education expenditures5.1% of GDP (2009)Maternal mortality rate16 deaths/100,000 live births (2010)Health expenditures7.2% of GDP (2011)Physicians density2.02 physicians/1,000 population (2010)Hospital bed density10.3 beds/1,000 population (2009)Obesity - adult prevalence rate7.7% (2008)
Population
Age structureAge structure: 0-14 years: 14.6% (male 3,717,701/female 3,424,490) 15-24 years: 13.6% (male 3,525,050/female 3,117,198) 25-54 years: 47.8% (male 11,925,181/female 11,491,841) 55-64 years: 11.7% (male 2,842,996/female 2,907,730) 65 years and over: 12.3% (male 2,469,093/female 3,533,923) (2013 est.)
Definition: This entry provides the distribution of the population according to age. Information is included by sex and age group (0-14 years, 15-64 years, 65 years and over). The age structure of a population affects a nation's key socioeconomic issues. Countries with young populations (high percentage

under age 15) need to invest more in schools, while countries with older populations (high percentage ages 65 and over) need to invest more in the health sector. The age structure can also be used to help predict potential political issues. For example, the rapid growth of a young adult population unable to find employment can lead to unrest.
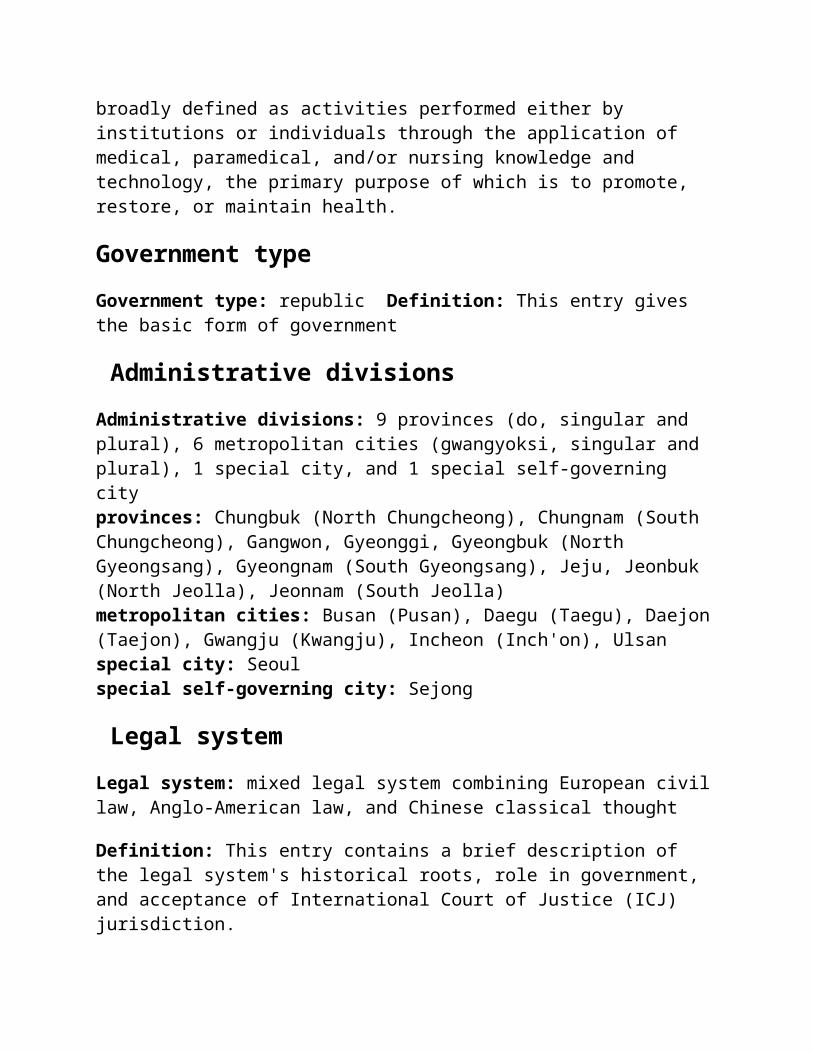
UrbanizationUrbanization: urban population: 83.2% of total population (2011) rate of urbanization: 0.71% annual rate of change (2010-15 est.)
Definition: This entry provides two measures of the degree of urbanization of a population. The first, urban population, describes the percentage of the total population living in urban areas, as defined by the country. The second, rate of urbanization, describes the projected average rate of change of the size of the urban population over the given period of time. Additionally, the World entry includes a list of the ten largest urban agglomerations. An urban agglomeration is defined as comprising the city or town proper and also the suburban fringe or thickly settled territory lying outside of, but adjacent to, the boundaries of the city.

Major cities - populationMajor cities - population: SEOUL (capital) 9.778 million; Busan (Pusan) 3.439 million; Incheon (Inch'on) 2.572 million; Daegu (Taegu) 2.458 million; Daejon (Taejon) 1.497 million (2009)
Definition: This entry provides the population of the capital and up to four major cities defined as urban agglomerations with populations of at least 750,000 people. An urban agglomeration is defined as comprising the city or town proper and also the suburban fringe or thickly settled territory lying outside of, but adjacent to, the boundaries of the city. For smaller countries, lacking urban centers of 750,000 or more, only the population of the capital is presented.
ReligionsReligions: Christian 31.6% (Protestant 24%, Roman Catholic 7.6%), Buddhist 24.2%, other or unknown 0.9%, none 43.3% (2010 survey)
Definition: This entry is an ordered listing of religions by adherents starting with the largest group and sometimes includes the percent of total population.
Health expendituresHealth expenditures: 7.2% of GDP (2011)
Definition: This entry provides the total expenditure on health as a percentage of GDP. Health expenditures are broadly defined as activities performed either by institutions or individuals through the application of medical, paramedical, and/or nursing knowledge and technology, the primary purpose of which is to promote, restore, or maintain health.
Government typeGovernment type: republic Definition: This entry gives the basic form of government
Administrative divisionsAdministrative divisions: 9 provinces (do, singular and plural), 6 metropolitan cities (gwangyoksi, singular and plural), 1 special city, and 1
special self-governing city provinces: Chungbuk (North Chungcheong), Chungnam (South Chungcheong), Gangwon, Gyeonggi, Gyeongbuk (North Gyeongsang), Gyeongnam (South Gyeongsang), Jeju, Jeonbuk (North Jeolla), Jeonnam (South Jeolla) metropolitan cities: Busan (Pusan), Daegu (Taegu), Daejon (Taejon), Gwangju (Kwangju), Incheon (Inch'on), Ulsan special city: Seoul special self-governing city: Sejong
Legal systemLegal system: mixed legal system combining European civil law, Anglo-American law, and Chinese classical thought
Definition: This entry contains a brief description of the legal system's historical roots, role in government, and acceptance of International Court of Justice (ICJ) jurisdiction.
Political parties and leadersPolitical parties and leaders: Democratic Party or DP (formerly the Democratic United Party or DUP) [KIM Han-gil] Liberty Forward Party or LFP (now part of the NFP) New Frontier Party (NFP) or Saenuri (formerly Grand National Party) [HWANG Woo-yea] Progressive Justice Party or PJP [ROH Hoe-chan and CHO Joon-ho] United Progressive Party or UPP [LEE Jung-hee]
Definition: This entry includes a listing of significant political organizations and their leaders.
International organization participationInternational organization participation: ADB, AfDB (nonregional member), APEC, ARF, ASEAN (dialogue partner), Australia Group, BIS, CD, CICA, CP, EAS, EBRD, FAO, FATF, G-20, IADB, IAEA, IBRD, ICAO, ICC (national committees), ICRM, IDA, IEA, IFAD, IFC, IFRCS, IHO, ILO, IMF, IMO, IMSO, Interpol, IOC, IOM, IPU, ISO, ITSO, ITU, ITUC (NGOs), LAIA (observer), MIGA, MINURSO, NEA, NSG, OAS (observer), OECD, OPCW, OSCE (partner), Paris Club (associate), PCA, PIF (partner), SAARC (observer),

SICA (observer), UN, UN Security Council (temporary), UNAMID, UNCTAD, UNESCO, UNHCR, UNIDO, UNIFIL, UNISFA, UNMIL, UNMISS, UNMOGIP, UNOCI, UNWTO, UPU, WCO, WHO, WIPO, WMO, WTO, ZC
Definition: This entry lists in alphabetical order by abbreviation those international organizations in which the subject country is a member or participates in some other way.
EconomyEconomy - overview: South Korea over the past four decades has demonstrated incredible growth and global integration to become a high-tech industrialized economy. In the 1960s, GDP per capita was comparable with levels in the poorer countries of Africa and Asia. In 2004, South Korea joined the trillion dollar club of world economies, and is currently the world's 12th largest economy. Initially, a system of close government and business ties, including directed credit and import restrictions, made this success possible. The government promoted the import of raw materials and technology at the expense of consumer goods, and encouraged savings and investment over consumption. The Asian financial crisis of 1997-98 exposed longstanding weaknesses in South Korea's development model including high debt/equity ratios and massive short-term foreign borrowing. GDP plunged by 6.9% in 1998, and then recovered by 9% in 1999-2000. Korea adopted numerous economic reforms following the crisis, including greater openness to foreign investment and imports. Growth moderated to about 4% annually between 2003 and 2007. Korea''s export focused economy was hit hard by the 2008 global economic downturn, but quickly rebounded in subsequent years, reaching 6.3% growth in 2010. The US-South Korea Free Trade Agreement was ratified by both governments in 2011 and went into effect in March 2012. Throughout 2012 the economy experienced sluggish growth because of market slowdowns in the United States, China, and the Eurozone. The incoming administration in 2013, following the December 2012 presidential election, is likely to face the challenges of balancing heavy reliance on exports with developing domestic-oriented sectors, such as services. The South Korean economy''s long term challenges include a rapidly aging population, inflexible labor market, and heavy reliance on exports - which comprise half of GDP.
Definition: This entry briefly describes the type of economy, including the degree of market orientation, the level of economic development, the most important natural resources, and the unique areas of specialization. It also
characterizes major economic events and policy changes in the most recent 12 months and may include a statement about one or two key future macroeconomic trends.
GDP (purchasing power parity)GDP (purchasing power parity): $1.64 trillion (2012 est.) $1.608 trillion (2011 est.) $1.552 trillion (2010 est.) note: data are in 2012 US dollars
Definition: This entry gives the gross domestic product (GDP) or value of all final goods and services produced within a nation in a given year. A nation's GDP at purchasing power parity (PPP) exchange rates is the sum value of all goods and services produced in the country valued at prices prevailing in the United States. This is the measure most economists prefer when looking at per-capita welfare and when comparing living conditions or use of resources across countries. The measure is difficult to compute, as a US dollar value has to be assigned to all goods and services in the country regardless of whether these goods and services have a direct equivalent in the United States (for example, the value of an ox-cart or non-US military equipment); as a result, PPP estimates for some countries are based on a small and sometimes different set of goods and services. In addition, many countries do not formally participate in the World Bank's PPP project that calculates these measures, so the resulting GDP estimates for these countries may lack precision. For many developing countries, PPP-based GDP measures are multiples of the official exchange rate (OER) measure. The difference between the OER- and PPP-denominated GDP values for most of the weathly industrialized countries are generally much smaller.

GDP (official exchange rate)GDP (official exchange rate): $1.156 trillion (2012 est.)
Definition: This entry gives the gross domestic product (GDP) or value of all final goods and services produced within a nation in a given year. A nation's GDP at offical exchange rates (OER) is the home-currency-denominated annual GDP figure divided by the bilateral average US exchange rate with that country in that year. The measure is simple to compute and gives a precise measure of the value of output. Many economists prefer this measure when gauging the economic power an economy maintains its neighbors, judging that an exchange rate captures the purchasing power a nation enjoys in the international marketplace. Official exchange rates, however, can be artifically fixed and/or subject to manipulation - resulting in claims of the country having an under- or over-valued currency - and are not necessarily the equivalent of a market-determined exchange rate. Moreover, even if the official exchange rate is market-determined, market exchange rates are frequently established by a relatively small set of goods and services (the ones the country trades) and may not capture the value of the larger set of goods the country produces. Furthermore, OER-converted GDP is not well suited to comparing domestic GDP over time, since appreciation/depreciation from one year to the next will make the OER GDP value rise/fall regardless of whether home-currency-denominated GDP changed
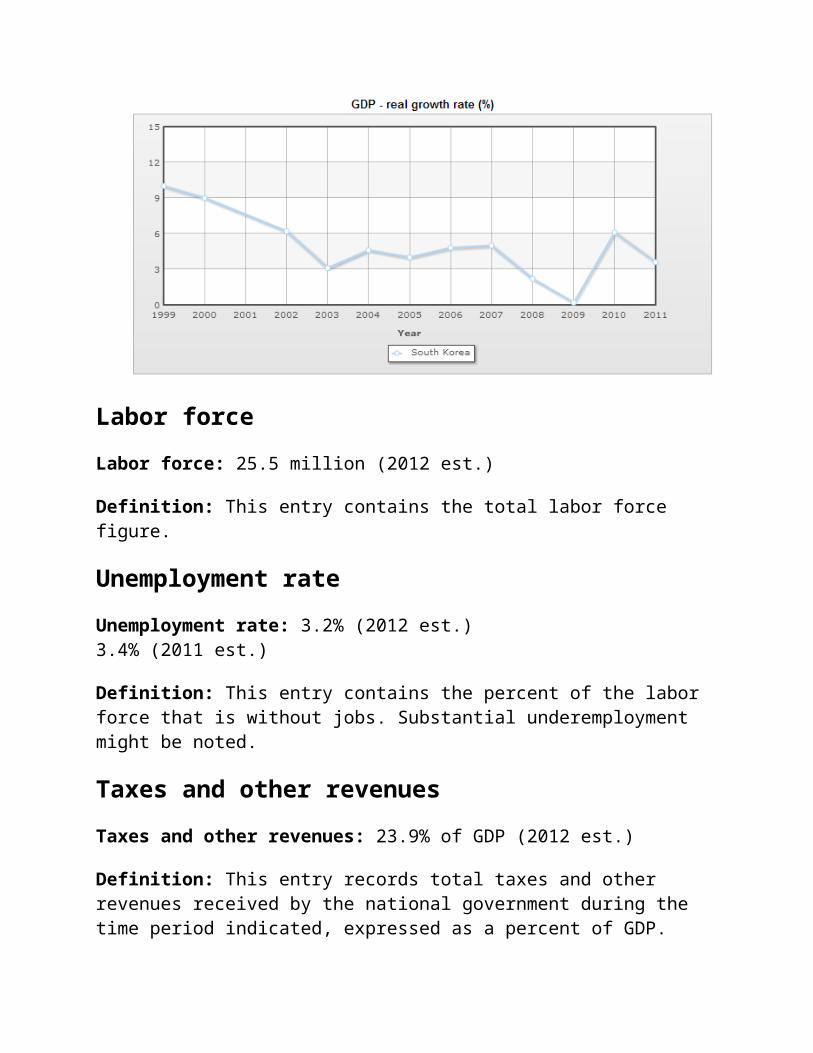
GDP - real growth rate
GDP - real growth rate: 2% (2012 est.) 3.6% (2011 est.) 6.3% (2010 est.)
Definition: This entry gives GDP growth on an annual basis adjusted for inflation and expressed as a percent.
Labor forceLabor force: 25.5 million (2012 est.)
Definition: This entry contains the total labor force figure.
Unemployment rateUnemployment rate: 3.2% (2012 est.) 3.4% (2011 est.)
Definition: This entry contains the percent of the labor force that is without jobs. Substantial underemployment might be noted.
Taxes and other revenuesTaxes and other revenues: 23.9% of GDP (2012 est.)

Definition: This entry records total taxes and other revenues received by the national government during the time period indicated, expressed as a percent of GDP. Taxes include personal and corporate income taxes, value added taxes, excise taxes, and tariffs. Other revenues include social contributions - such as payments for social security and hospital insurance - grants, and net revenues from public enterprises. Normalizing the data, by dividing total revenues by GDP, enables easy comparisons across countries, and provides an average rate at which all income (GDP) is paid to the national level government for the supply of public goods and services.
Budget surplus (+) or deficit (-)Budget surplus (+) or deficit (-): 1.4% of GDP (2012 est.)
Definition: This entry records the difference between national government revenues and expenditures, expressed as a percent of GDP. A positive (+) number indicates that revenues exceeded expenditures (a budget surplus), while a negative (-) number indicates the reverse (a budge deficit). Normalizing the data, by dividing the budget balance by GDP, enables easy comparisons across countries and indicates whether a national government saves or borrows money. Countries with high budget deficits (relative to their GDPs) generally have more difficulty raising funds to finance expenditures, than those with lower deficits.
Public debtPublic debt: 36.7% of GDP (2012 est.) 36.2% of GDP (2011 est.)
Definition: This entry records the cumulative total of all government borrowings less repayments that are denominated in a country's home currency. Public debt should not be confused with external debt, which reflects the foreign currency liabilities of both the private and public sector and must be financed out of foreign exchange earnings.
Inflation rate (consumer prices)Inflation rate (consumer prices): 2.2% (2012 est.) 4% (2011 est.)

Definition: This entry furnishes the annual percent change in consumer prices compared with the previous year's consumer prices
Agriculture - productsAgriculture - products: rice, root crops, barley, vegetables, fruit; cattle, pigs, chickens, milk, eggs; fish
Definition: This entry is an ordered listing of major crops and products starting with the most important.
IndustriesIndustries: electronics, telecommunications, automobile production, chemicals, shipbuilding, steel
Definition: This entry provides a rank ordering of industries starting with the largest by value of annual output.
ExportsExports: $552.6 billion (2012 est.) $551.8 billion (2011 est.)
Definition: This entry provides the total US dollar amount of merchandise exports on an f.o.b. (free on board) basis. These figures are calculated on an exchange rate basis, i.e., not in purchasing power parity (PPP) terms
Exports - commoditiesExports - commodities: semiconductors, wireless telecommunications equipment, motor vehicles, computers, steel, ships, petrochemicals
Definition: This entry provides a rank ordering of exported products starting with the most important; it sometimes includes the percent of total dollar value.
Exports - partnersExports - partners: China 24.4%, US 10.1%, Japan 7.1% (2011 est.)
Definition: This entry provides a rank ordering of trading partners starting with the most important; it sometimes includes the percent of total dollar value.
ImportsImports: $514.2 billion (2012 est.) $520.1 billion (2011 est.)
Definition: This entry provides the total US dollar amount of merchandise imports on a c.i.f. (cost, insurance, and freight) or f.o.b. (free on board) basis. These figures are calculated on an exchange rate basis, i.e., not in purchasing power parity (PPP) terms.
Imports - commoditiesImports - commodities: machinery, electronics and electronic equipment, oil, steel, transport equipment, organic chemicals, plastics
Definition: This entry provides a rank ordering of imported products starting with the most important; it sometimes includes the percent of total dollar value.
Imports - partnersImports - partners: China 16.5%, Japan 13%, US 8.5%, Saudi Arabia 7.1%, Australia 5% (2011 est.)
Definition: This entry provides a rank ordering of trading partners starting with the most important; it sometimes includes the percent of total dollar value.
Reserves of foreign exchange and goldReserves of foreign exchange and gold: $327 billion (31 December 2012 est.) $306.4 billion (31 December 2011 est.)
Definition: This entry gives the dollar value for the stock of all financial assets that are available to the central monetary authority for use in meeting a country's balance of payments needs as of the end-date of the period

specified. This category includes not only foreign currency and gold, but also a country's holdings of Special Drawing Rights in the International Monetary Fund, and its reserve position in the Fund.
External debtExternal debt: $413.4 billion (31 December 2012 est.) $398.7 billion (31 December 2011 est.)
Definition: This entry gives the total public and private debt owed to nonresidents repayable in foreign currency, goods, or services. These figures are calculated on an exchange rate basis, i.e., not in purchasing power parity (PPP) terms.
Current Account BalanceCurrent Account Balance: $3.14 billion (2012 est.) $26.51 billion (2011 est.)
Definition: This entry records a country's net trade in goods and services, plus net earnings from rents, interest, profits, and dividends, and net transfer payments (such as pension funds and worker remittances) to and from the rest of the world during the period specified. These figures are calculated on an exchange rate basis, i.e., not in purchasing power parity (PPP) terms.
Exchange ratesExchange rates: South Korean won (KRW) per US dollar - 1,126.47 (2012 est.) 1,108.29 (2011 est.) 1,156.1 (2010 est.) 1,276.93 (2009) 1,101.7 (2008)
Definition: This entry provides the official value of a country's monetary unit at a given date or over a given period of time, as expressed in units of local currency per US dollar and as determined by international market forces or official fiat.
Energy

Electricity - installed generating capacityElectricity - installed generating capacity: 80.59 million kW (2009 est.)
Definition: This entry is the total capacity of currently installed generators, expressed in kilowatts (kW), to produce electricity. A 10-kilowatt (kW) generator will produce 10 kilowatt hours (kWh) of electricity, if it runs continuously for one hour
Oil - productionOil - production: 19,990 bbl/day (2011 est.)
Definition: This entry is the total oil produced in barrels per day (bbl/day). The discrepancy between the amount of oil produced and/or imported and the amount consumed and/or exported is due to the omission of stock changes, refinery gains, and other complicating factors.
Oil - importsOil - imports: 2.59 million bbl/day (2012 est.)
Definition: This entry is the total oil imported in barrels per day (bbl/day), including both crude oil and oil products.
Refined petroleum products - productionRefined petroleum products - production: 2.83 million bbl/day (2012 est.)
Definition: This entry is the country's total output of refined petroleum products, in barrels per day (bbl/day). The discrepancy between the amount of refined petroleum products produced and/or imported and the amount consumed and/or exported is due to the omission of stock changes, refinery gains, and other complicating factors.
Refined petroleum products - consumptionRefined petroleum products - consumption: 2.26 million bbl/day (2012 est.)
Definition: This entry is the country's total consumption of refined petroleum products, in barrels per day (bbl/day). The discrepancy between the amount of refined petroleum products produced and/or imported and the amount consumed and/or exported is due to the omission of stock changes, refinery gains, and other complicating factors.
Refined petroleum products - exportsRefined petroleum products - exports: 907,100 bbl/day (2009 est.)
Definition: This entry is the country's total exports of refined petroleum products, in barrels per day (bbl/day).
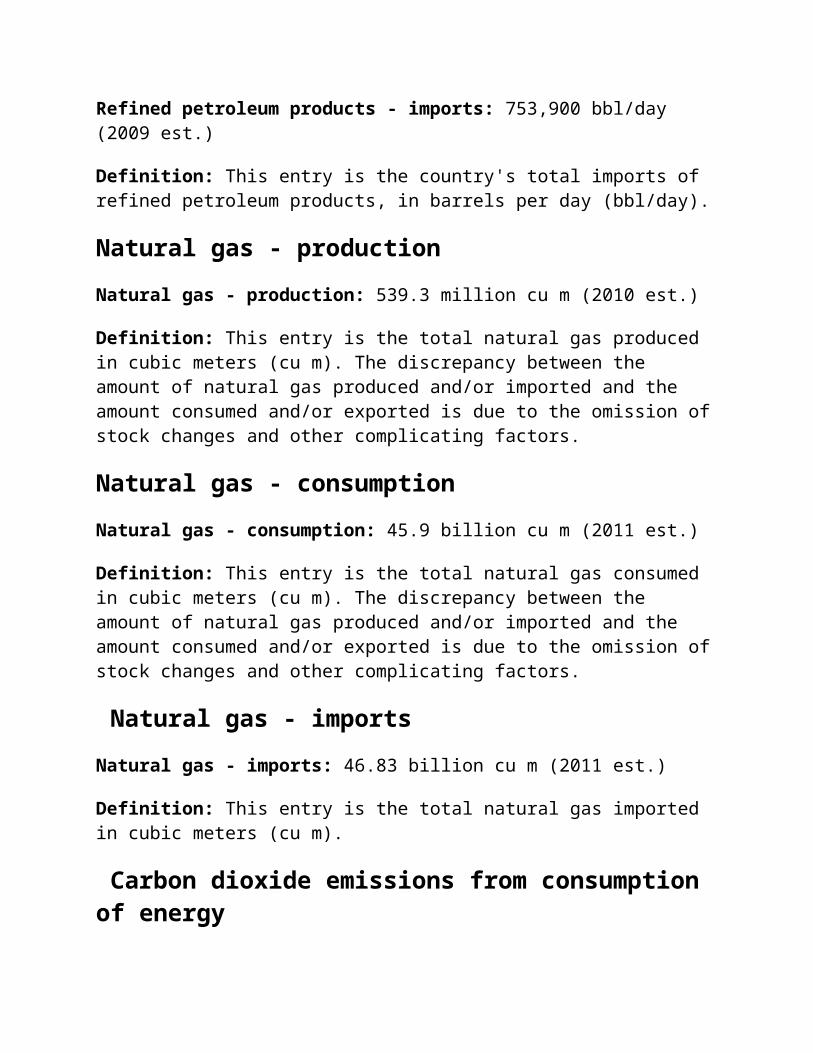
Refined petroleum products - importsRefined petroleum products - imports: 753,900 bbl/day (2009 est.)
Definition: This entry is the country's total imports of refined petroleum products, in barrels per day (bbl/day).
Natural gas - productionNatural gas - production: 539.3 million cu m (2010 est.)
Definition: This entry is the total natural gas produced in cubic meters (cu m). The discrepancy between the amount of natural gas produced and/or imported and the amount consumed and/or exported is due to the omission of stock changes and other complicating factors.
Natural gas - consumptionNatural gas - consumption: 45.9 billion cu m (2011 est.)
Definition: This entry is the total natural gas consumed in cubic meters (cu m). The discrepancy between the amount of natural gas produced and/or imported and the amount consumed and/or exported is due to the omission of stock changes and other complicating factors.
Natural gas - importsNatural gas - imports: 46.83 billion cu m (2011 est.)
Definition: This entry is the total natural gas imported in cubic meters (cu m).
Carbon dioxide emissions from consumption of energyCarbon dioxide emissions from consumption of energy: 579 million Mt (2010 est.)
Definition: This entry is the total amount of carbon dioxide, measured in metric tons, released by burning fossil fuels in the process of producing and consuming energy.
Telecommunications
Telephones - main lines in useTelephones - main lines in use: 30.1 million (2012)
Definition: This entry gives the total number of main telephone lines in use.
Telephone systemTelephone system: general assessment: excellent domestic and international services featuring rapid incorporation of new technologies domestic: fixed-line and mobile-cellular services widely available with a combined telephone subscribership of roughly 170 per 100 persons; rapid assimilation of a full range of telecommunications technologies leading to a boom in e-commerce international: country code - 82; numerous submarine cables provide links throughout Asia, Australia, the Middle East, Europe, and US; satellite earth stations - 66 (2011)
Definition: This entry includes a brief general assessment of the system with details on the domestic and international components
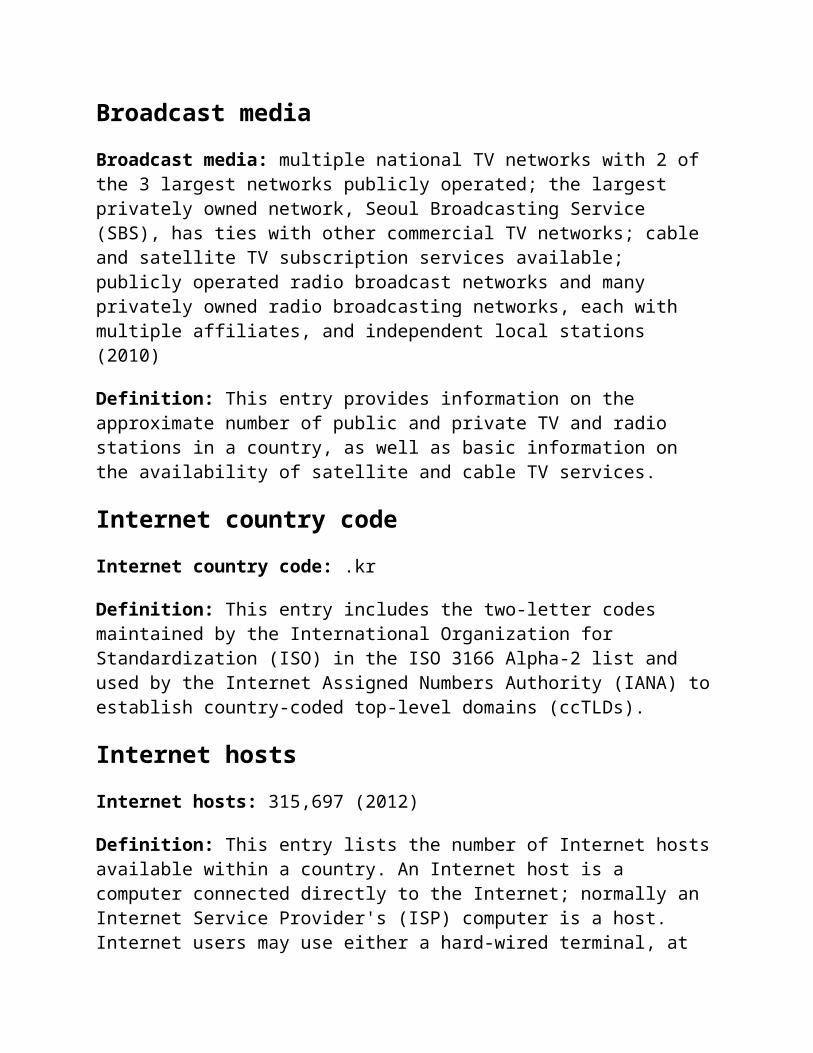
Broadcast mediaBroadcast media: multiple national TV networks with 2 of the 3 largest networks publicly operated; the largest privately owned network, Seoul Broadcasting Service (SBS), has ties with other commercial TV networks;

cable and satellite TV subscription services available; publicly operated radio broadcast networks and many privately owned radio broadcasting networks, each with multiple affiliates, and independent local stations (2010)
Definition: This entry provides information on the approximate number of public and private TV and radio stations in a country, as well as basic information on the availability of satellite and cable TV services.
Internet country codeInternet country code: .kr
Definition: This entry includes the two-letter codes maintained by the International Organization for Standardization (ISO) in the ISO 3166 Alpha-2 list and used by the Internet Assigned Numbers Authority (IANA) to establish country-coded top-level domains (ccTLDs).
Internet hostsInternet hosts: 315,697 (2012)
Definition: This entry lists the number of Internet hosts available within a country. An Internet host is a computer connected directly to the Internet; normally an Internet Service Provider's (ISP) computer is a host. Internet users may use either a hard-wired terminal, at an institution with a mainframe computer connected directly to the Internet, or may connect remotely by way of a modem via telephone line, cable, or satellite to the Internet Service Provider's host computer. The number of hosts is one indicator of the extent of Internet connectivity.
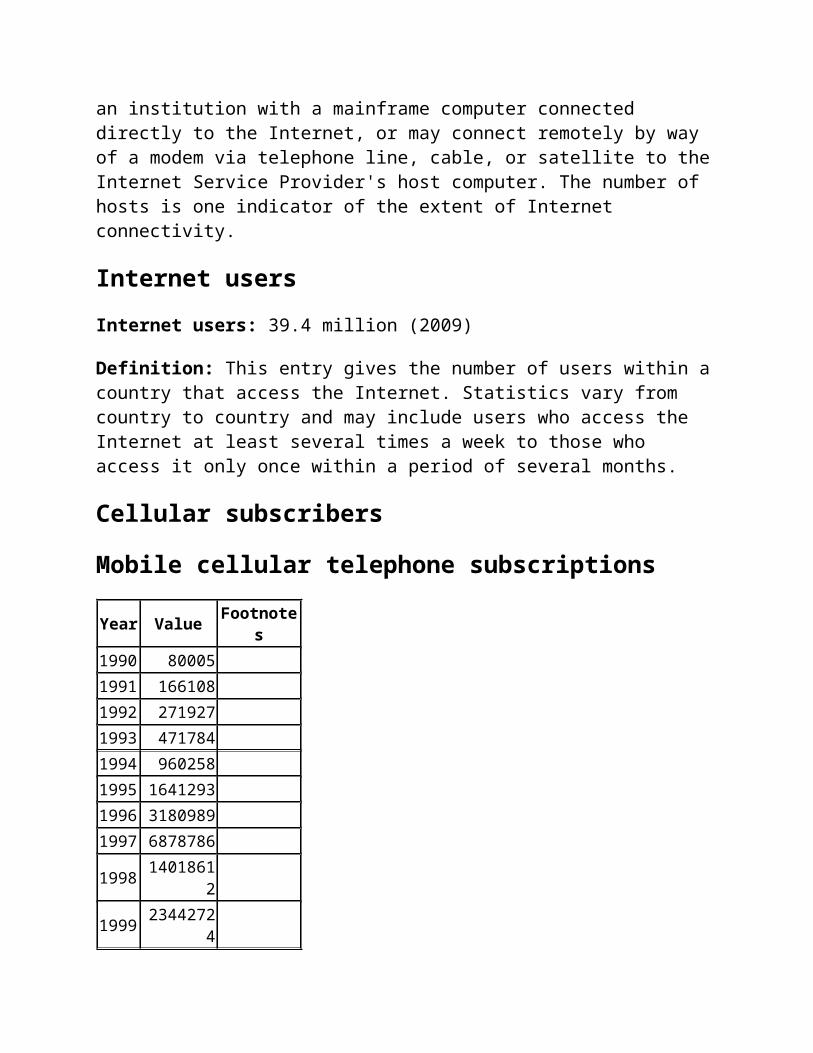
Internet usersInternet users: 39.4 million (2009)
Definition: This entry gives the number of users within a country that access the Internet. Statistics vary from country to country and may include users who access the Internet at least several times a week to those who access it only once within a period of several months.
Cellular subscribers

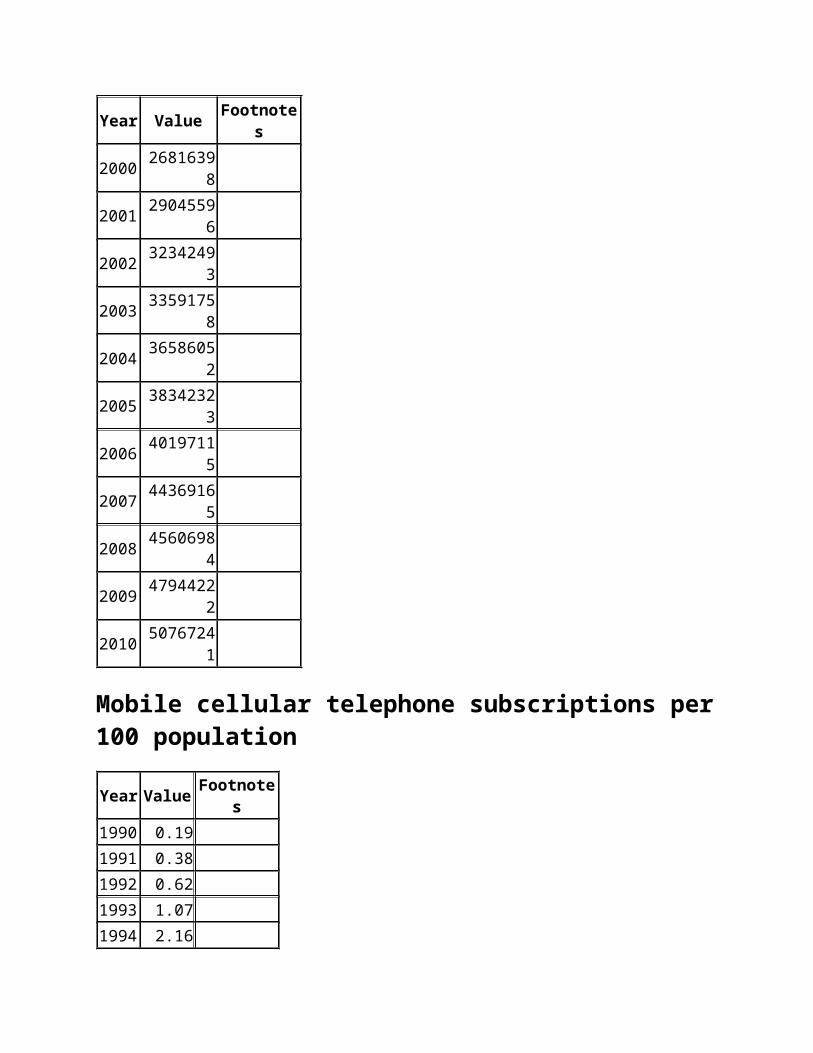
Mobile cellular telephone subscriptionsYear Value Footnotes1990 80005 1991 166108 1992 271927 1993 471784 1994 960258 1995 1641293 1996 3180989 1997 6878786 1998 14018612 1999 23442724 2000 26816398 2001 29045596 2002 32342493 2003 33591758 2004 36586052 2005 38342323 2006 40197115 2007 44369165 2008 45606984 2009 47944222 2010 50767241
Mobile cellular telephone subscriptions per 100 populationYear Value Footnotes1990 0.19 1991 0.38 1992 0.62 1993 1.07 1994 2.16 1995 3.67 1996 7.08 1997 15.21 1998 30.81

Year Value Footnotes1999 51.24 2000 58.31 2001 62.85 2002 69.67 2003 72.05 2004 78.12 2005 81.5 2006 85.04 2007 93.41 2008 95.54 2009 99.96 2010 105.36
Internet users
Internet usersYear Value Footnotes1990 9999.42162980301 1991 20005.3416707862 1992 43031.511036813 1993 110119.561919184 1994 138137.135118412 1995 366089.632737372 1996 730088.559299833 1997 1628562.46556623 1998 3085402.00267907 1999 10774894.380878 2000 20556467.928 12001 26155173.564 12002 27573994.998 12003 30539268.235 12004 34045918.173 12005 34577432.61 12006 36916099.473 12007 37429495.68 12008 38659726.9149 1

Year Value Footnotes2009 39138561.168 12010 40329659.808
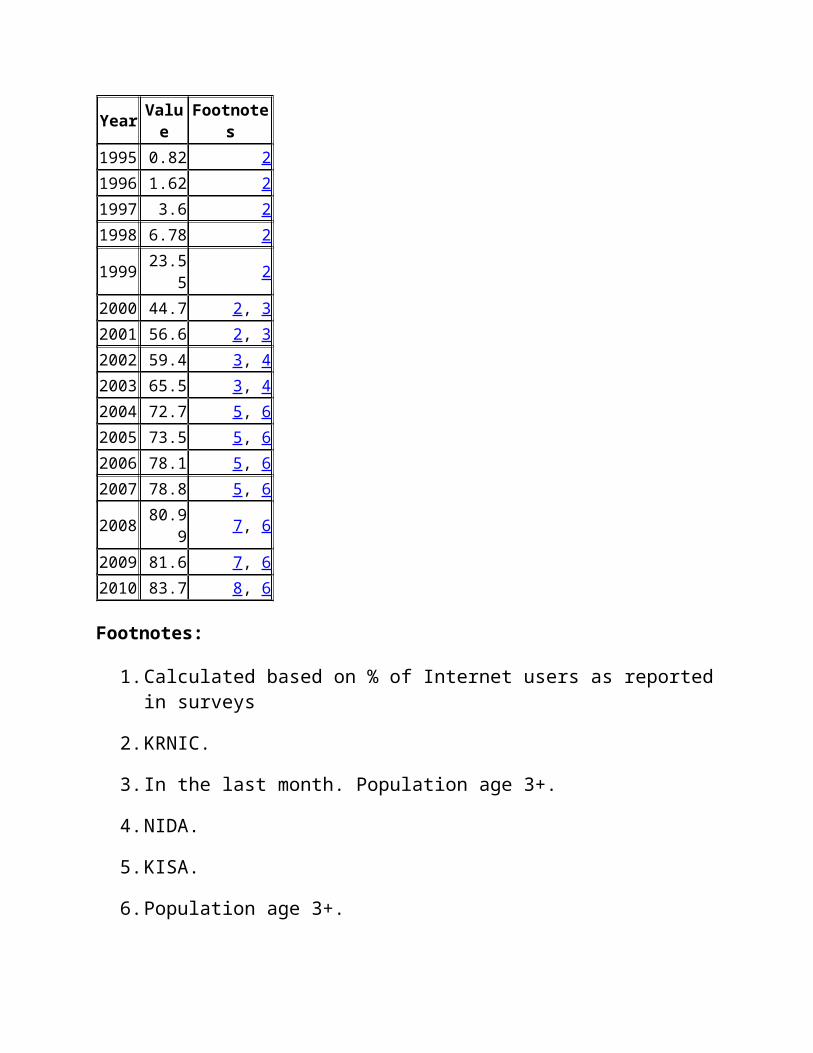
Internet users per 100 inhabitantsYear Value Footnotes1990 0.02 21991 0.05 21992 0.1 21993 0.25 21994 0.31 21995 0.82 21996 1.62 21997 3.6 21998 6.78 21999 23.55 22000 44.7 2, 32001 56.6 2, 32002 59.4 3, 42003 65.5 3, 42004 72.7 5, 62005 73.5 5, 62006 78.1 5, 62007 78.8 5, 62008 80.99 7, 62009 81.6 7, 62010 83.7 8, 6
Footnotes:
1. Calculated based on % of Internet users as reported in surveys
2. KRNIC.
3. In the last month. Population age 3+.
4. NIDA.
5. KISA.

6. Population age 3+.
7. KCC and KISA.
8. Korea Communications Commission
Personal computers
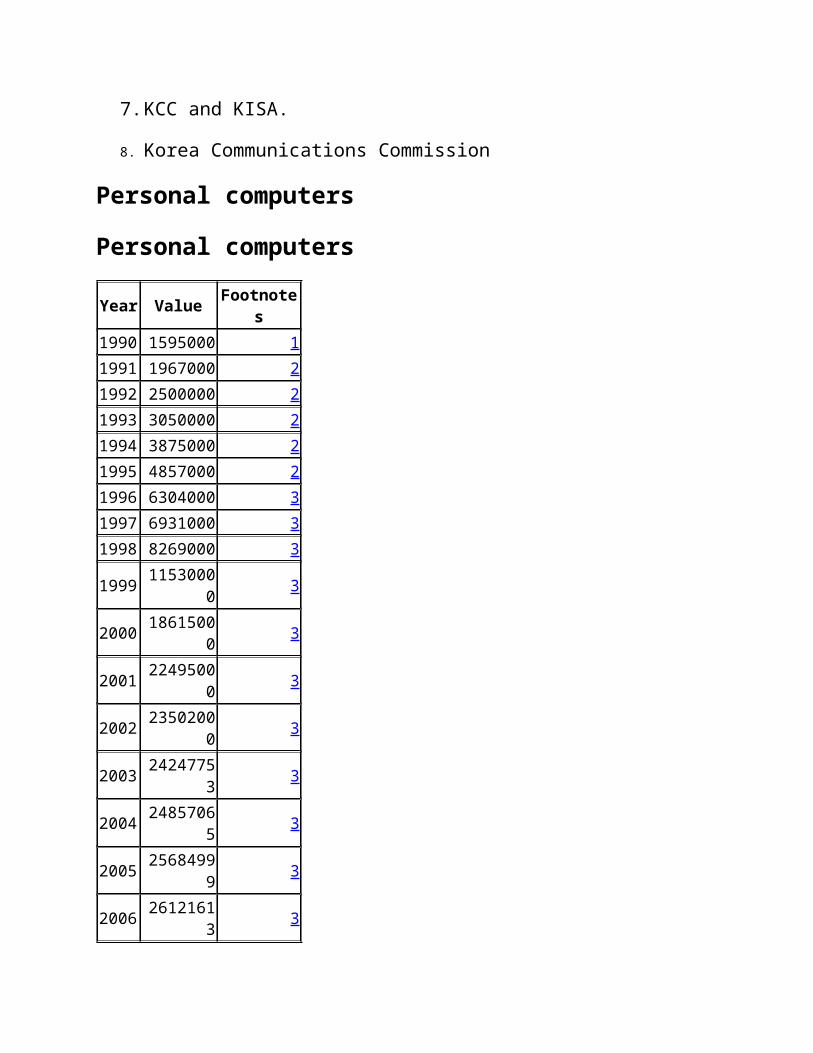
Personal computersYear Value Footnotes1990 1595000 11991 1967000 21992 2500000 21993 3050000 21994 3875000 21995 4857000 21996 6304000 31997 6931000 31998 8269000 31999 11530000 32000 18615000 32001 22495000 32002 23502000 32003 24247753 32004 24857065 32005 25684999 32006 26121613 32007 27886536 3
Personal computers per 100 inhabitantsYear Value Footnotes1990 3.71 11991 4.54 21992 5.72 21993 6.93 21994 8.74 21995 10.88 2
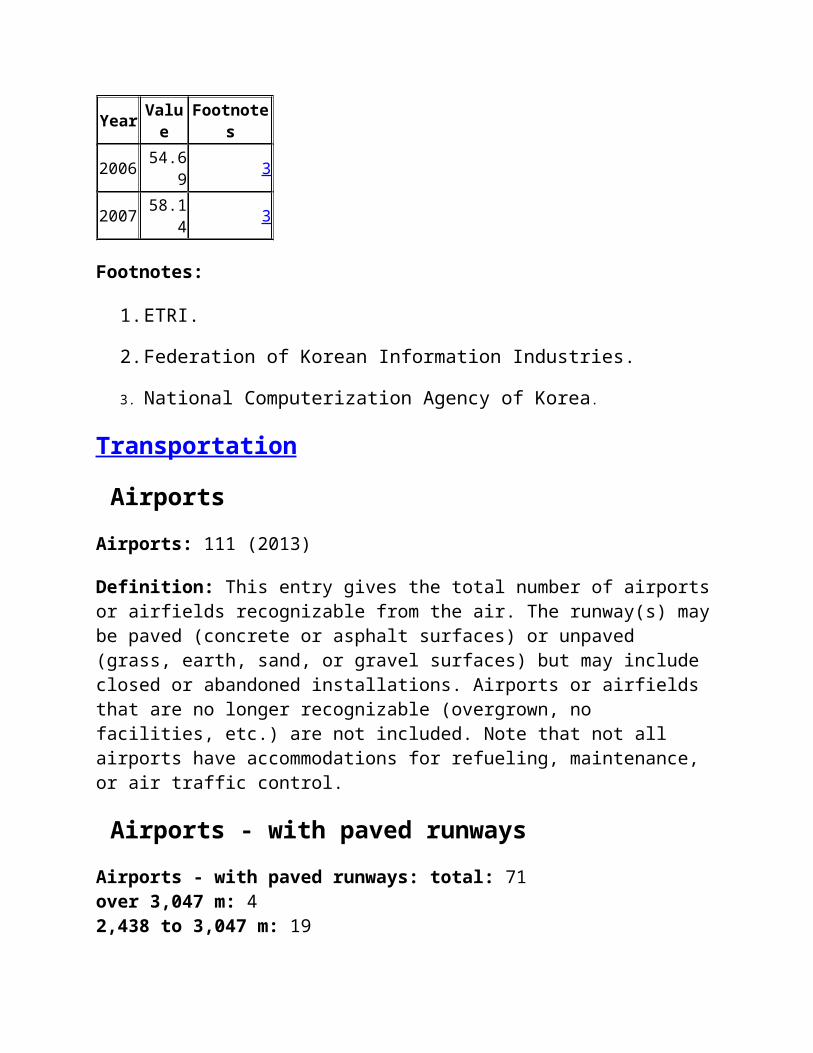
Year Value Footnotes1996 14.01 31997 15.27 31998 18.07 31999 25.01 32000 40.09 32001 48.16 32002 50.06 32003 51.41 32004 52.48 32005 54 32006 54.69 32007 58.14 3
Footnotes:
1. ETRI.
2. Federation of Korean Information Industries.
3. National Computerization Agency of Korea.
Transportation
AirportsAirports: 111 (2013)
Definition: This entry gives the total number of airports or airfields recognizable from the air. The runway(s) may be paved (concrete or asphalt surfaces) or unpaved (grass, earth, sand, or gravel surfaces) but may include closed or abandoned installations. Airports or airfields that are no longer recognizable (overgrown, no facilities, etc.) are not included. Note that not all airports have accommodations for refueling, maintenance, or air traffic control.
Airports - with paved runwaysAirports - with paved runways: total: 71 over 3,047 m: 4 2,438 to 3,047 m: 19
1,524 to 2,437 m: 12 914 to 1,523 m: 13 under 914 m: 23 (2013)
Definition: This entry gives the total number of airports with paved runways (concrete or asphalt surfaces) by length. For airports with more than one runway, only the longest runway is included according to the following five groups - (1) over 3,047 m, (2) 2,438 to 3,047 m, (3) 1,524 to 2,437 m, (4) 914 to 1,523 m, and (5) under 914 m. Only airports with usable runways are included in this listing. Not all airports have facilities for refueling, maintenance, or air traffic control.
HeliportsHeliports: 466 (2013)
Definition: This entry gives the total number of heliports with hard-surface runways, helipads, or landing areas that support routine sustained helicopter operations exclusively and have support facilities including one or more of the following facilities: lighting, fuel, passenger handling, or maintenance. It includes former airports used exclusively for helicopter operations but excludes heliports limited to day operations and natural clearings that could support helicopter landings and takeoffs.
PipelinesPipelines: gas 2,216 km; oil 16 km; refined products 889 km (2013)
Definition: This entry gives the lengths and types of pipelines for transporting products like natural gas, crude oil, or petroleum products.
RailwaysRailways: total: 3,381 km standard gauge: 3,381 km 1.435-m gauge (1,843 km electrified) (2008)
Definition: This entry states the total route length of the railway network and of its component parts by gauge: broad, standard, narrow, and dual.
Roadways

Roadways: total: 104,983 km paved: 83,199 km (includes 3,779 km of expressways) unpaved: 21,784 km (2009)
Definition: This entry gives the total length of the road network and includes the length of the paved and unpaved portions.
WaterwaysWaterways: 1,600 km (most navigable only by small craft) (2011)
Definition: This entry gives the total length of navigable rivers, canals, and other inland bodies of water.
Merchant marineMerchant marine: total: 786 by type: bulk carrier 191, cargo 235, carrier 8, chemical tanker 130, container 72, liquefied gas 44, passenger 5, passenger/cargo 15, petroleum tanker 55, refrigerated cargo 15, roll on/roll off 10, vehicle carrier 6 foreign-owned: 31 (China 6, France 2, Japan 14, Taiwan 1, US 8) registered in other countries: 457 (Bahamas 1, Cambodia 10, Ghana 1, Honduras 6, Hong Kong 3, Indonesia 2, Kiribati 1, Liberia 2, Malta 2, Marshall Islands 41, North Korea 1, Panama 373, Philippines 1, Russia 1, Singapore 3, Tuvalu 1, unknown 8) (2010)
Definition: Merchant marine may be defined as all ships engaged in the carriage of goods; or all commercial vessels (as opposed to all nonmilitary ships), which excludes tugs, fishing vessels, offshore oil rigs, etc. This entry contains information in four fields - total, ships by type, foreign-owned, and registered in other countries. Total includes the number of ships (1,000 GRT or over), total DWT for those ships, and total GRT for those ships. DWT or dead weight tonnage is the total weight of cargo, plus bunkers, stores, etc., that a ship can carry when immersed to the appropriate load line. GRT or gross register tonnage is a figure obtained by measuring the entire sheltered volume of a ship available for cargo and passengers and converting it to tons on the basis of 100 cubic feet per ton; there is no stable relationship between GRT and DWT. Ships by type includes a listing of barge carriers, bulk cargo ships, cargo ships, chemical tankers, combination bulk carriers, combination ore/oil carriers, container ships, liquefied gas tankers, livestock carriers,
multifunctional large-load carriers, petroleum tankers, passenger ships, passenger/cargo ships, railcar carriers, refrigerated cargo ships, roll-on/roll-off cargo ships, short-sea passenger ships, specialized tankers, and vehicle carriers. Foreign-owned are ships that fly the flag of one country but belong to owners in another. Registered in other countries are ships that belong to owners in one country but fly the flag of another.
Ports and terminalsPorts and terminals: major ports: Incheon, Pohang, Busan, Ulsan, Yeosu container ports: Busan (16,163,842), Kwangyang (2,061,958), Incheon (1,924,644)
Definition: This entry lists major ports and terminals primarily on the basis of the amount of cargo tonnage shipped through the facilities on an annual basis. In some instances, the number of containers handled or ship visits were also considered
Environment
Carbon dioxide emissions (CO2), kg CO2 per $1 GDP (PPP) (CDIAC)Year Value Footnotes1990 0.4997 1991 0.5029 1992 0.5071 1993 0.5286 1994 0.5228 1995 0.5217 1996 0.5273 1997 0.5317 1998 0.4908 1999 0.4867 2000 0.4912 2001 0.4809 2002 0.4746
Year Value Footnotes2003 0.4619 2004 0.4571 2005 0.4221 2006 0.4082 2007 0.4109 2008 0.4105
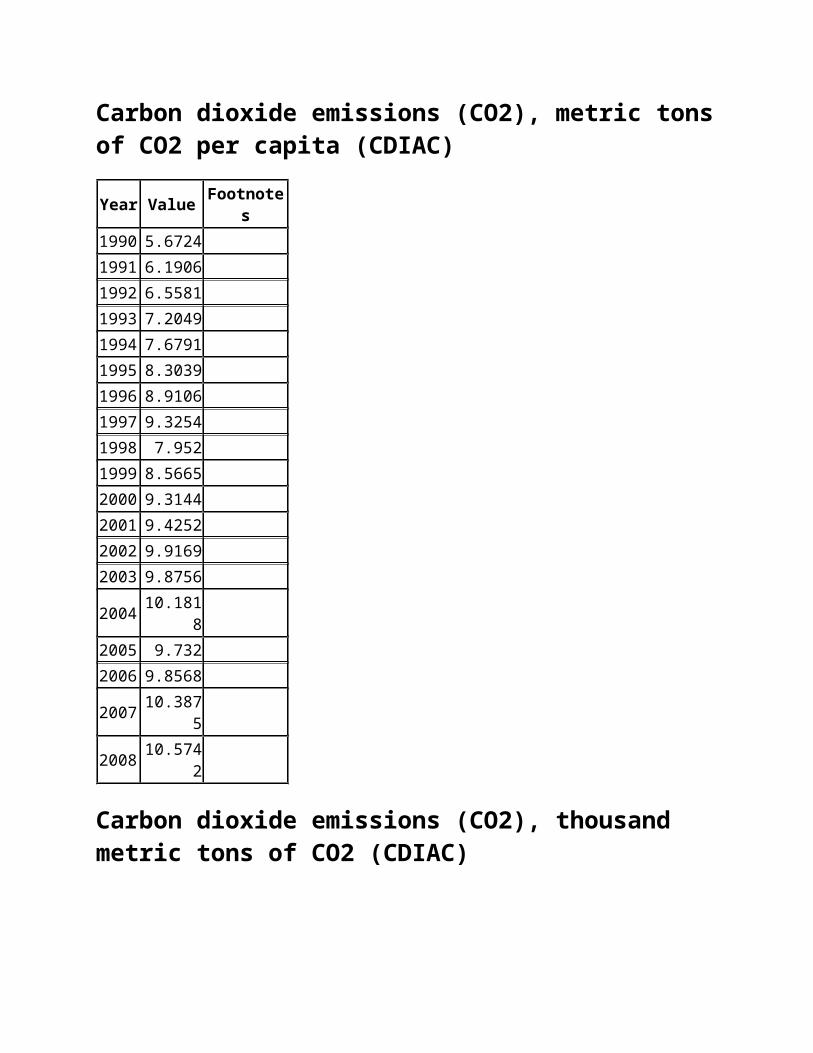
Carbon dioxide emissions (CO2), metric tons of CO2 per capita (CDIAC)Year Value Footnotes1990 5.6724 1991 6.1906 1992 6.5581 1993 7.2049 1994 7.6791 1995 8.3039 1996 8.9106 1997 9.3254 1998 7.952 1999 8.5665 2000 9.3144 2001 9.4252 2002 9.9169 2003 9.8756 2004 10.1818 2005 9.732 2006 9.8568 2007 10.3875 2008 10.5742
Carbon dioxide emissions (CO2), thousand metric tons of CO2 (CDIAC)Year Value Footnotes1990 243815
Year Value Footnotes1991 268432 1992 286569 1993 317085 1994 340353 1995 370781 1996 401030 1997 423175 1998 363840 1999 395006 2000 432460 2001 440216 2002 465584 2003 465771 2004 482277 2005 462918 2006 470821 2007 498206 2008 509170
Conclusion:- Potential of economy.
Attractive factors.
Emergence as quality and market leader
South Korea over the past four decades has demonstrated incredible growth and global integration to become a high-tech industrialized economy. In the 1960s, GDP per capita was comparable with levels in the poorer countries of Africa and Asia. In 2004, South Korea joined the trillion dollar club of world economies, and is currently the world's 12th largest economy. Initially, a system of close government and business ties, including directed credit and import restrictions, made this success possible. The government promoted the import of raw materials

and technology at the expense of consumer goods, and encouraged savings and investment over consumption
. The Asian financial crisis of 1997-98 exposed longstanding weaknesses in South
Korea's development model including high debt/equity ratios and massive short-
term foreign borrowing. GDP plunged by 6.9% in 1998, and then recovered by 9%
in 1999-2000. Korea adopted numerous economic reforms following the crisis,
including greater openness to foreign investment and imports. Growth moderated
to about 4% annually between 2003 and 2007. Korea's export focused economy
was hit hard by the 2008 global economic downturn, but quickly rebounded in
subsequent years, reaching 6.3% growth in 2010. The US-South Korea Free Trade
Agreement was ratified by both governments in 2011 and went into effect in
March 2012. Throughout 2012 the economy experienced sluggish growth because
of market slowdowns in the United States, China, and the Eurozone. The incoming
administration in 2013, following the December 2012 presidential election, is
likely to face the challenges of balancing heavy reliance on exports with
developing domestic-oriented sectors, such as services. The South Korean
economy's long term challenges include a rapidly aging population, inflexible labor
market, and heavy reliance on exports - which comprise half of GDP.
Why do business in South Korea:- South Korea has to be classed as one of the world’s great economic success stories. Along with Taiwan, South Korea is the only country which has recorded five consecutive decades of economic growth in excess of 5%. This is an amazing achievement which is the result of careful governmental macro-engineering, sound business practice and sheer hard work from the population at large.
Advantages of Investing in Korea:=
The Republic of Korea is located between China and Japan. Its geopolitical position

has enabled Korea to act as a bridge for cultural exchanges and trade between its
neighbors. In this regard, Korea is an optimal location for doing business with China
(the largest market in the world), and Japan (the world’s 2
nd
biggest economy).
North Asia is home to 25% of the world’s population and generates 22% of its GDP
(forecasted to increase to 30% by 2020).
Korea has rapidly emerged as one of the world’s leading ICT (Information &
Communication Technology) powerhouses. Korea’s excellent telecommunications
infrastructure makes Internet use and maintenance easily affordable. Its outstanding
edge and competitiveness enabled Seoul to rank top in the UN Global e-Government
Survey. Korea’s e-Government program was exported to Moscow, Russia in 2004, and
Hanoi, Vietnam in 2005.
Korea is the world’s 8
th
largest investor in research and development (IMD 2003).
Annual R&D investment has increased steadily since 1997, well above the rate of GDP
growth. Although R&D investment temporarily shrunk in 1999 because of the economic
slowdown caused by the Asian financial crisis, it has been on the rebound since 1999.
The R&D investment in 2005 stood at US$ 24.1 billion, or 2.99% of GDP, which is
close to the highest level in the world. Korea’s responsiveness to the latest products
and services make the country an ideal test bend. In fact, a number of global
companies take advantage of this responsiveness to utilize Korea’s leading
infrastructure and dynamic market.
Government Policy on Foreign Investment in Korea:-
Unless otherwise stipulated by law, a foreigner may carry out foreign investment
activities in Korea without restrictions. However, restrictions are placed when the
investment is deemed as harmful to national security, public order, the health and
welfare of Korean nationals, and environment preservation, or goes against established
social morals, customs, and/or the laws of the Republic of Korea. Through the Foreign
Investment Promotion Act, foreign investments are provided with a higher level of
investment protection than indirect investments such as investments through securities
and bonds. Overseas remittances of gains from the stocks acquired by foreign
investors and stock transactions, principal and fees paid according to a loan contract
under the Foreign Investment Promotion Act, and compensation under a technology
import contract are allowed in accordance to what has been permitted and notified
under the foreign investment technology import contract at the time of the remittance.
The Ministry of Strategy and Finance may temporarily suspend or restrict foreign
exchange transactions, when it is unavoidably required due to force majeure (war,
calamities, etc.), substantial and drastic changes to internal and external economic
conditions, or other matters in proportion to such. However, a foreign investment under
the Foreign Investment Promotion Act shall be an exception to the application of this
clause in the Foreign Exchange Trade Act. Unless otherwise stipulated by law, the
business operations of foreign investors and foreign-invested companies shall be
treated equally as citizens and corporations of the Republic of Korea.
Business Forms Available to Foreign Investment :-
Foreign advancement into Korea for business purposes can largely be divided into 4
types; a foreigner's (corporation) establishment of a local corporation, a foreigner's
(corporation) establishment of a private business, or a foreign corporation's
establishment of a local branch or a local office

The Foreign Investment Promotion Act and Korea's domestic commercial law apply to
investments that a foreigner (corporation) makes by establishing a “local corporation” in
Korea. To benefit from the protections and benefits of the Foreign Investment
Promotion Act, the foreigner shall invest a minimum of 50 million Won. The Foreign
Investment Promotion Act will also apply to foreign individuals investing 50 million won
and more who operate a business as a form of “private business.” Such an investment
will also be recognized as a foreign investment.
A foreign-invested business that generates profits is categorized as “branch.” As it is a
foreign corporation, such a branch is not considered FDI. An “office” differs from a branch
in that it does not conduct for-profit sales, but instead undertakes a non-sales function such
as market research, R&D, etc. And unlike branches, offices do not need to register
themselves domestically, but are given a unique business code number at the district tax
office which is equivalent to business registration
Local TaxesLocal taxes consist of provincial, city and county taxes. Provincial taxes include
acquisition tax, registration tax, race tax, horse race tax, license tax, community facility
tax and local education tax. City or county taxes include inhabitant tax, property tax,
mileage tax, automobile tax, agricultural income tax, butchery tax, urban planning tax,
and business place tax. At the same time, local education tax is added to taxes such as
registration tax and property tax.
Employment for Foreigners in KoreaThe scope of activities and employment opportunities for foreigners is relatively limited.
Therefore, foreigners are limited to the scope of activities and period of stay as stated
in their visa. When looking for employment opportunities in Korea, foreigners must
obtain the proper visa status and are limited to working at the workplace specified in
their visa application. When looking to change a place of employment, foreigners have
to notify the Seoul Immigration Office and obtain permission to do so in advance.
Korean Labor Law Korean Labor law issues are often the ones which any foreign investor conducting
business in Korean market has most difficulty in understanding. We set forth below
certain basic concepts of Korean labor law requirements.
The basic law in Korea regulating labor standards is the Labor Standards Act (LSA),
which is applicable to an employer with at least 5 employees. LSA was substantially
amended September of 2003 to be more in line with international standards, and the
key changes resulting from the amendment include the reduction of work hours per
week from 44 hours to 40 hours and abolishment of monthly-leave system, among
other things

My business in South Korea:-Auto Repair CompanyExecutive Summary
J&J is the desire of jogendra and jashwinder we together have experience as auto mechanics. Both have a dream of starting up their own company and offering better service to their clients than competitors
Objectives The objectives over the next three years for J&J Auto Repair are the following:
Sales revenues increase steadily through year three. Institute a program of superior customer service through rigorous
evaluation of service experience. Hire three more mechanics.
Keys to SuccessIn the auto repair industry a company builds its client base one customer at a time and mostly through word of mouth marketing. With this in mind, the keys to success for J & J Auto Repair are:
High-quality work. Constant contact with clients so as to keep them informed about the
state of their automobile and the repair job progress. Knowledgeable mechanics that are friendly, customer oriented, and
will take the time to explain to customer the intricate nature of our business and our work.
MissionThe mission of J & J Auto Repair is to provide high quality, convenient and comprehensive auto repair at low cost. The most important aspect of our
business is trust. It is the goal of our firm to have 100% customer satisfaction in regards to quality, friendliness, time to completion and to discover new ways to exceed the expectations of our clients
Company SummaryThe company will be a partnership with Jogendra and Jashwinder each owning 50% of the company. The company will be a limited liability company registered in the South Korea. The firm will have facilities on main auto market of Seoul. The facilities will contain a two-bay garage, office space and storage space for tools, parts, etc. The company is seeking a loan in order to finance the start of operations for the company. Each of the owners will be putting up some of their own capital as equity.
Start-up Summary
The data obtained for the start-up comes from research done in the Seattle area with other small mechanic shops who have started their own business. Inflation has been taken into account between the estimates of these fellow business owners (and when they started) and the current prices for expensed items. Much of the equipment to go into the facilities such as tools, air compressors, etc., are currently owned by the two partners
ServicesJ & J Auto offers a wide range of services as outlined in the detailed sections below. It is ultimately the goal of the company to offer a one-stop facility for all auto servicing needs, including brakes, transmission, wheel alignment, etc. In this way the company can offer greater perceived value for the customer than many other shops which specialize in certain areas.
The industry is highly competitive with suppliers having a great deal of power in setting and negotiating the prices of their products and services to repair shops. In addition, because the customers see the service as undifferentiated and a “commodity” with little value separation between competitors, buyer power is also very high. Finally, the barriers to entry are moderately low, and the large number of competitors in this field, including substitutes (such as do-it-yourself work) mean that the pricing for such

services are very competitive. The only way to have an advantage in this industry is a low cost leadership principal applied aggressively or to create higher switching costs through the building of strong business to customer ties.
J & J Auto will hire trained and certified mechanics who are able to prove they have superior customer awareness and interaction. It is the company’s professional people who will fulfill the firm’s contracts and goals. The largest part of the company’s expenses will be in labor costs.
Service DescriptionJ & J Auto provides a wide range of auto repair services. These include:
Scheduled maintenance. Wheel alignments, tires and rims. Brake repair. Comprehensive engine repair. Transmission.
Each job or project will be on a reservation basis, although we will accept a small percentage of drive in repair work.
Competitive ComparisonThe auto repair industry is highly competitive. Each company within this field has high capital costs, low margins, and a high intensity of competition.
Suppliers have a great deal of power in setting and negotiating the prices of their products and services to repair shops. This is due to the fact that the suppliers who absorb the greatest amounts of cash from repair shops are large auto part companies. These companies are more consolidated that the repair industry, have deeper pockets, an almost limitless number of substitute customers, and finally they are the single most important supplier to J & J industry. Therefore, these companies can set whatever price they wish to. Furthermore, labor is a supplier in this industry as well, and salaries for such individuals are well known and not very flexible.
In addition, because the customers see the service as undifferentiated and a “commodity” with little value separation between competitors (if they offer a suitable level of quality) buyer power is also very high. Additionally, the costs of our services are not cheap, and buyers are willing to search for the

most favorable combination of price and acceptable service. The barriers to entry and exit are moderately low in this industry. Switching costs are virtually non-existent and the costs to entry and exist the market are low. The large number of competitors in this field including substitutes mean that the pricing for such services are very competitive. The only way to have an advantage in this industry is a low cost leadership principal applied aggressively to all aspects of the business or to build up customer relations to a point where the switching costs are raised.
TechnologyThe technological revolution in computers has enhanced our abilities to diagnose and repair our client’s vehicles. J &J will remain on the cutting edge by instituting the use of computer diagnostic equipment in its shop. The company will continue to seek new ways to provide a better service through technology.
Future ServicesThe company does not have any plans to create further services at this time.
Market Analysis SummarySince J & J will be able to service any vehicle on the road, including motorcycles and campers, it does not make any sense to segment our market. Our potential customer includes every household in Seattle that owns one or more vehicles. The industry does not have any seasonality that affects it.
References
1. ^ "A New Way of Seeing Country Social Responsibility"(PDF). Faculty of Philosophy and Social-Political Sciences(Alexandru Ioan Cuza University): 6. Retrieved September 21, 2013.

2. ^ "2013 Estimate: Population of the Republic of Korea" (inKorean). Korean Statistical Information Service. July 1, 2013. Retrieved September 16, 2013.
3. ^ "Country Comparison :: Distribution of family income - Gini index". The World Factbook. Langley: Central Intelligence Agency. Retrieved November 11, 2013.
4. ^ "2013 Human Development Index and its components – Statistics" (PDF). United Nations Development Programme. 2013. p. 6. Retrieved September 16, 2013.
5. ^ a b This article incorporates public domain materialfrom websites or documents of the CIA World Factbook.
6. ^ "Korea's Geography". Asianinfo.org. February 1, 2010. Retrieved July 13, 2010.
7. ^ "Ancient civilizations" (Press release). Canada: Royal Ontario Museum. December 12, 2005. Retrieved April 25, 2010.
8. ^ Prehistoric Korea, Office of the Prime Minister.9. ^ a b "195 (III) The problem of the independence of Korea", December 12,
1948, Resolutions Adopted by the General Assembly During its Third Session, p. 25.
10.^ a b "Koreas agree to military hotline". CNN.com. June 4, 2004. Retrieved February 18, 2010.
11.^ "South Korea: Economic and social developments".Encyclopædia Britannica. Retrieved February 18, 2010.
12.^ Report for Selected Countries and Subjects, International Monetary Fund.13. Indexmondy.com14.www.pkf.com/media .15.www.heritage.org/index . 16. CIA Wor ld Factbook