south african etf quarterly review
DESCRIPTION
For the fourth quarter ending December 2013TRANSCRIPT
ETF Landscape4th Quarter - 2013For South African financial advisors & investors
Call us on 0861 432 383
Mail us at [email protected]
Visit us at www.itransact.co.za
Automated Outsourcing Services (Pty) Ltd, trading as Itransact, is an authorised financial services provider

Why ItransactWe make the market simple Exchange Traded Products (ETPs) are becoming a popular choice of investment products because of their simplicity and low costs. The South African market is overcrowded with a myriad of investment products, many of them complex and expensive, making investing a daunting experience for the average investor who simply wants the best return at the lowest possible cost. We make investing simple We make investing simple, easy and cost effective for everybody. Itransact is South Africa’s leading Exchange Traded Product Investment Platform that brings selected ETFs, ETNs, ETF Portfolios, ETF Retirement Products and Structured Index Products with capital protection together with all their investment benefits in one convenient place where together with your financial adviser, you can access and profit from Exchange Traded Products.
Keep it simple
This paper is part of a regular series prepared by Itransact and Warren Dick, an independent market analyst and is not intended to be relied upon as a forecast, research or investment advice, and is not a recommendation, offer or solicitation to buy or sell any securities or to adopt any investment strategy. Exchange Traded Products are subject to risks similar to those of shares. Investment returns will fluctuate and are subject to market volatility, so that an investor’s shares, when redeemed or sold, may be worth more or less than their original value. Past performance is not necessarily a guide to the future. The information furnished in this publication, which may include opinions, estimates, indicative rates, terms, price quotations and projections, reflects the existing judgment of the author and current market conditions, which judgment and conditions are subject to change without notice, modification or amendment. This publication does not necessarily reflect the opinion of Itransact, its officers, employees or appointed agents. The information herein has been obtained from various public sources, the accuracy and/or completeness of which Itransact does not guarantee. Itransact recommends that independent tax, accounting, legal and financial advice be sought should any party seek to place any reliance on the information contained herein. Itransact does not provide investment advice. This paper may contain ‘forward-looking’ information that is not purely historical in nature. Such information may include, among other things, projections and forecasts. There is no guarantee that any forecasts made will come to pass. Reliance upon information in this paper is at the sole discretion of the reader. Any unauthorised use or disclosure of this publication is prohibited. This publication may not be reproduced without the consent of Itransact. This material has not been approved for distribution outside South Africa. All rights reserved. ©2013 Itransact& Making the market simple, Keep it simple & the ETF Securities Investment Plan are registered trademarks of Automated Outsourcing Services (Pty) Ltd. For more information: www.itransact.co.za Analyst CertificationThe research analyst who prepared this report certifies that the view expressed herein accurately reflect the research analyst’s personal views about the subject security and issuer and that no part of his compensation was, is or will be directly or indirectly related to specific recommendations or views contained in this report.

SOUTH AFRICAN 4th QUARTER 2013 ETP REVIEW
PART ONE: PERFORMANCE 2
Performance Breakdown 5
PART TWO: FEES AND FLOWS 10
Total Expense Ratios (TER’s) 10
Net Flows 11
Assets Under Management 12
PART THREE: ANALYSIS 13
ETFs vs. Actively Managed Funds 13
Broad Market ETFs vs. General Equity Funds over 3 years 13
TERs As A Percentage Of Returns 14
PART FOUR: DEVELOPMENTS OVERSEAS 15
PART FIVE: EXTRAS 16
Head-to-Head: 16
ETFS 101 – Getting To Grips With The Basics 18
Disclaimer 19
Analyst Certification 20
We make investing simple.
Part One: Performance
Source: Morningstar
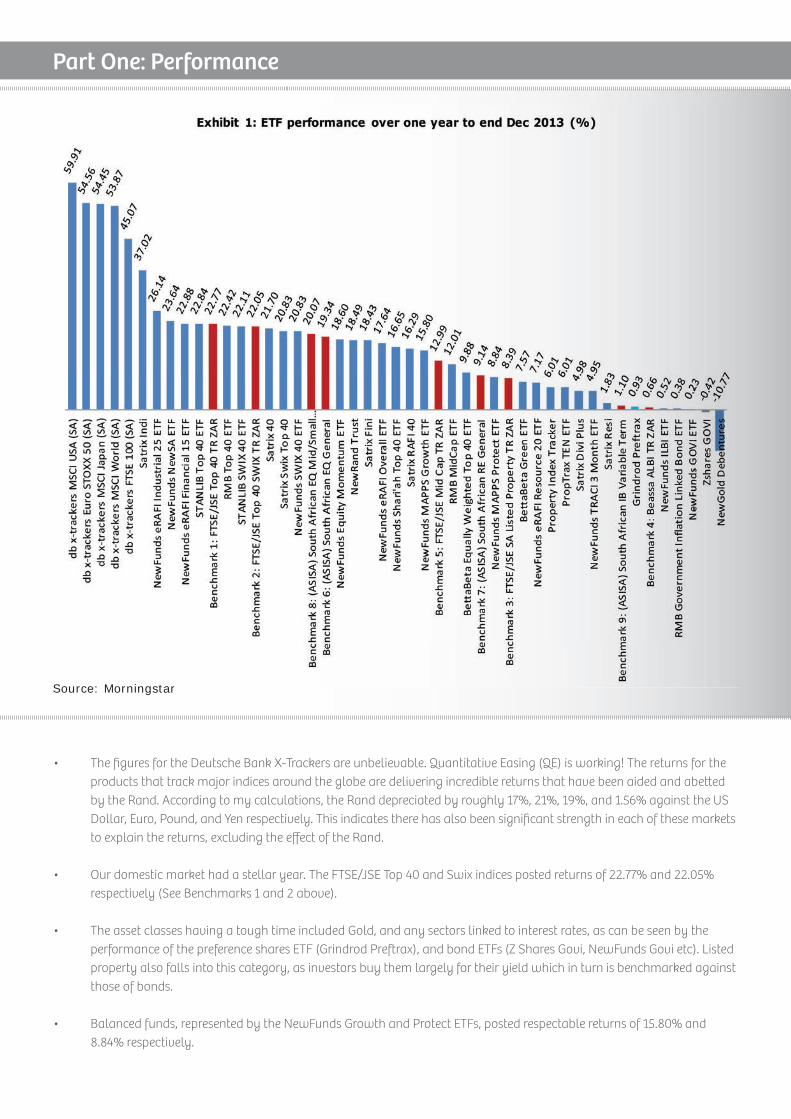
• ThefiguresfortheDeutscheBankX-Trackersareunbelievable.QuantitativeEasing(QE)isworking!Thereturnsforthe products that track major indices around the globe are delivering incredible returns that have been aided and abe�ed by the Rand. According to my calculations, the Rand depreciated by roughly 17%, 21%, 19%, and 1.56% against the US Dollar, Euro, Pound, and Yen respectively. This indicates there has also been significant strength in each of these markets to explain the returns, excluding the effect of the Rand.
• Ourdomesticmarkethadastellaryear.TheFTSE/JSETop40andSwixindicespostedreturnsof22.77%and22.05% respectively(SeeBenchmarks1and2above).
• TheassetclasseshavingatoughtimeincludedGold,andanysectorslinkedtointerestrates,ascanbeseenbythe performanceofthepreferencesharesETF(GrindrodPreftrax),andbondETFs(ZSharesGovi,NewFundsGovietc).Listed property also falls into this category, as investors buy them largely for their yield which in turn is benchmarked against those of bonds.
• Balancedfunds,representedbytheNewFundsGrowthandProtectETFs,postedrespectablereturnsof15.80%and 8.84% respectively.

Source: Morningstar
• ThestrongperformanceoftheDBX-Trackershascreptintothethreeyearperiod,ascanbeseenfromtheannualised performance of ETFs displayed above.
• WithverylittlefanfaretheSatrixFinancial(Fini)hasdeliveredreturnscloseto20%p.a.forthelastthreeyears.

Source: Profile Media
• WeincludetheperformanceofETNsforthefirsttimeinthisquarters’ETPreview.
• Ascanbeseenfromthegraph,someofthecommoditiesandcurrenciesdidwellovertheyear,largelysupportedbythe depreciation of the Rand.
• SilverandGoldhadanextremelytoughtime.
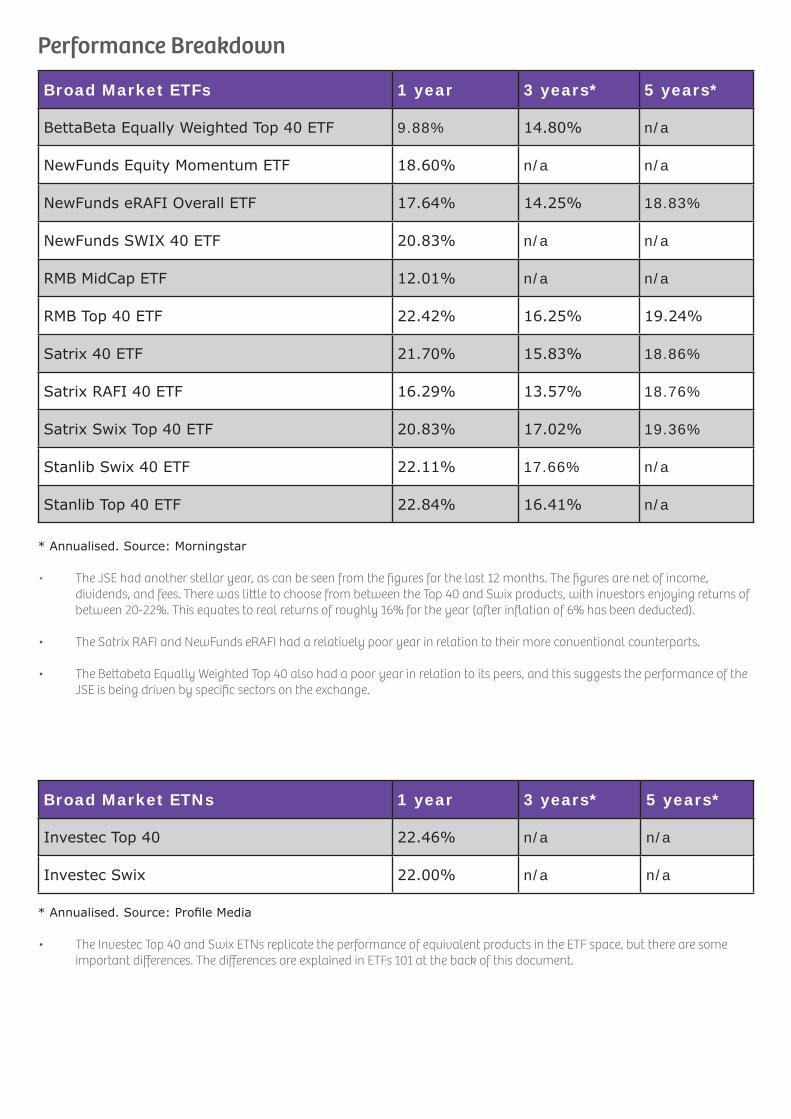
Broad Market ETFs 1 year 3 years* 5 years*
BettaBeta Equally Weighted Top 40 ETF 9.88% 14.80% n/a
NewFunds Equity Momentum ETF 18.60% n/a n/a
NewFunds eRAFI Overall ETF 17.64% 14.25% 18.83%
NewFunds SWIX 40 ETF 20.83% n/a n/a
RMB MidCap ETF 12.01% n/a n/a
RMB Top 40 ETF 22.42% 16.25% 19.24%
Satrix 40 ETF 21.70% 15.83% 18.86%
Satrix RAFI 40 ETF 16.29% 13.57% 18.76%
Satrix Swix Top 40 ETF 20.83% 17.02% 19.36%
Stanlib Swix 40 ETF 22.11% 17.66% n/a
Stanlib Top 40 ETF 22.84% 16.41% n/a
Performance Breakdown
* Annualised. Source: Morningstar
• TheJSEhadanotherstellaryear,ascanbeseenfromthefiguresforthelast12months.Thefiguresarenetofincome, dividends, and fees. There was li�le to choose from between the Top 40 and Swix products, with investors enjoying returns of between 20-22%. This equates to real returns of roughly 16% for the year (after inflation of 6% has been deducted).
• TheSatrixRAFIandNewFundseRAFIhadarelativelypooryearinrelationtotheirmoreconventionalcounterparts.
• TheBettabetaEquallyWeightedTop40alsohadapooryearinrelationtoitspeers,andthissuggeststheperformanceofthe JSEisbeingdrivenbyspecificsectorsontheexchange.
Broad Market ETNs 1 year 3 years* 5 years*
Investec Top 40 22.46% n/a n/a
Investec Swix 22.00% n/a n/a
* Annualised. Source: Profile Media
• TheInvestecTop40andSwixETNsreplicatetheperformanceofequivalentproductsintheETFspace,buttherearesome important differences. The differences are explained in ETFs 101 at the back of this document.
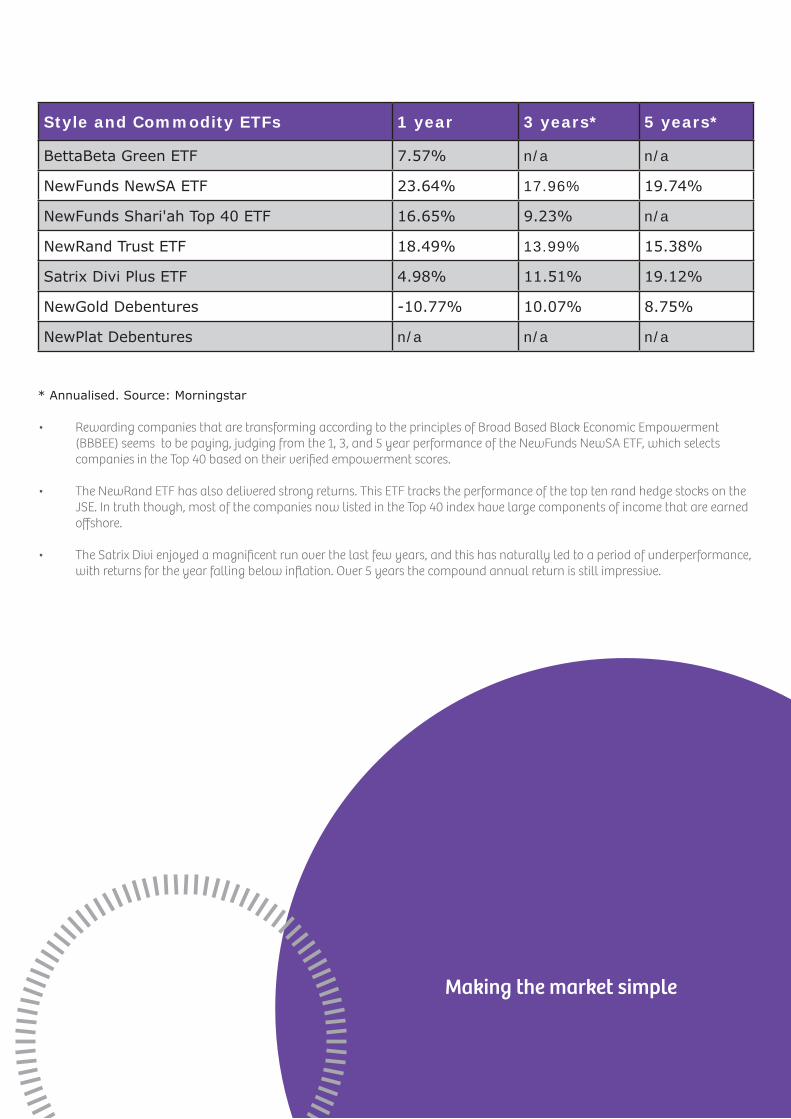
Style and Commodity ETFs 1 year 3 years* 5 years*
BettaBeta Green ETF 7.57% n/a n/a
NewFunds NewSA ETF 23.64% 17.96% 19.74%
NewFunds Shari'ah Top 40 ETF 16.65% 9.23% n/a
NewRand Trust ETF 18.49% 13.99% 15.38%
Satrix Divi Plus ETF 4.98% 11.51% 19.12%
NewGold Debentures -10.77% 10.07% 8.75%
NewPlat Debentures n/a n/a n/a
* Annualised. Source: Morningstar
• RewardingcompaniesthataretransformingaccordingtotheprinciplesofBroadBasedBlackEconomicEmpowerment (BBBEE)seemstobepaying,judgingfromthe1,3,and5yearperformanceoftheNewFundsNewSAETF,whichselects companies in the Top 40 based on their verified empowerment scores.
• TheNewRandETFhasalsodeliveredstrongreturns.ThisETFtrackstheperformanceofthetoptenrandhedgestocksonthe JSE.Intruththough,mostofthecompaniesnowlistedintheTop40indexhavelargecomponentsofincomethatareearned offshore.
• TheSatrixDivienjoyedamagnificentrunoverthelastfewyears,andthishasnaturallyledtoaperiodofunderperformance, with returns for the year falling below inflation. Over 5 years the compound annual return is still impressive.
Making the market simple
Commodity ETNs 1 year 3 years* 5 years*
NewWave Platinum 9.71% n/a n/a
NewWave Silver -21.84% n/a n/a
NewWave Commodity Index n/a n/a n/a
Investec Gold -34.59% n/a n/a
RMB Oil 33.14% 13.57% n/a
RMB Coal 0.37% n/a n/a
SB Africa Commodity Basket 10.64% n/a n/a
SB Gold Linker -11.97% 9.27% n/a
SB Silver Linker -21.76% -1.23% n/a
SB Palladum Linker 24.00% 10.83% n/a
SB Platinum Linker 8.18% 5.74% n/a
SB Copper 13.06% n/a n/a
SB Corn -13.14% n/a n/a
SB Oil 39.13% n/a n/a
SB Wheat -9.02% n/a n/a
* Annualised. Source: Profile Media
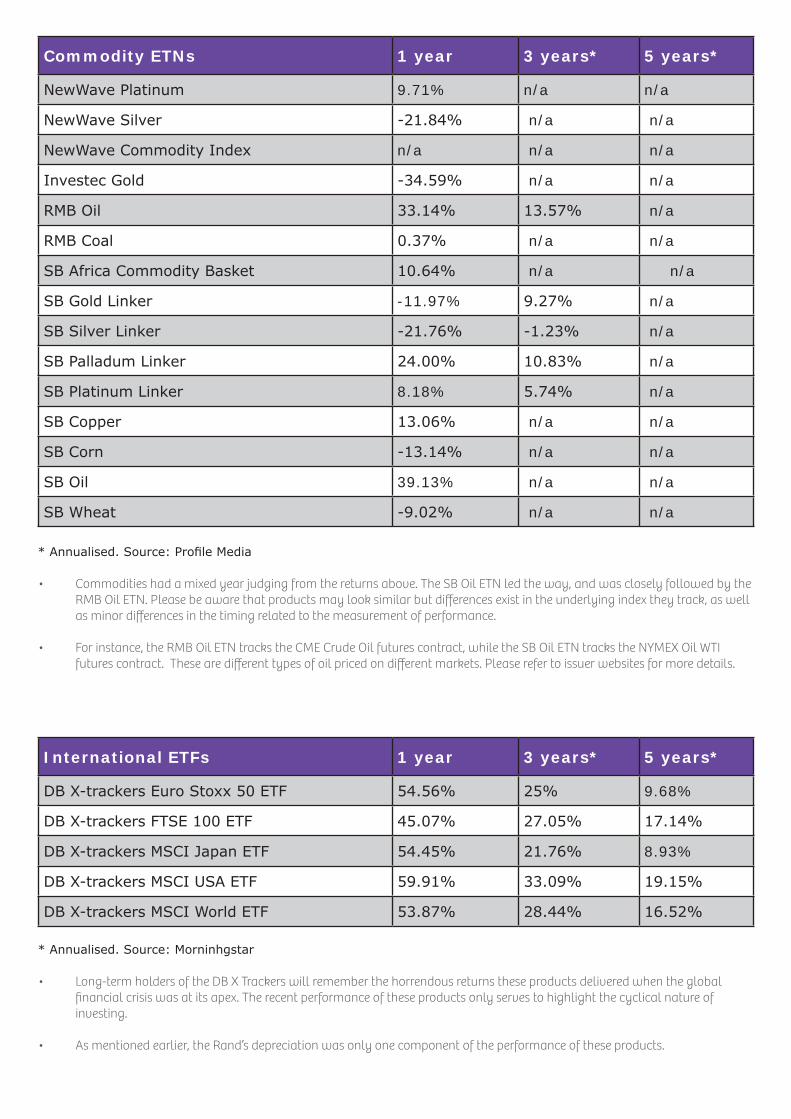
• Commoditieshadamixedyearjudgingfromthereturnsabove.TheSBOilETNledtheway,andwascloselyfollowedbythe RMBOilETN.Pleasebeawarethatproductsmaylooksimilarbutdifferencesexistintheunderlyingindextheytrack,aswell as minor differences in the timing related to the measurement of performance.
• Forinstance,theRMBOilETNtrackstheCMECrudeOilfuturescontract,whiletheSBOilETNtrackstheNYMEXOilWTI futures contract. These are different types of oil priced on different markets. Please refer to issuer websites for more details.
International ETFs 1 year 3 years* 5 years*
DB X-trackers Euro Stoxx 50 ETF 54.56% 25% 9.68%
DB X-trackers FTSE 100 ETF 45.07% 27.05% 17.14%
DB X-trackers MSCI Japan ETF 54.45% 21.76% 8.93%
DB X-trackers MSCI USA ETF 59.91% 33.09% 19.15%
DB X-trackers MSCI World ETF 53.87% 28.44% 16.52%
* Annualised. Source: Morninhgstar
• Long-termholdersoftheDBXTrackerswillrememberthehorrendousreturnstheseproductsdeliveredwhentheglobal financial crisis was at its apex. The recent performance of these products only serves to highlight the cyclical nature of investing.
• Asmentionedearlier,theRand’sdepreciationwasonlyonecomponentoftheperformanceoftheseproducts.
International ETNs 1 year 3 years* 5 years*
DB MSCI China 26.70% n/a n/a
DB MSCI Emerging Markets 19.59% n/a n/a
DB Africa Top 50 22.82% n/a n/a
SB Africa Equity 18.89% n/a n/a
* Annualised. Source: Profile Media
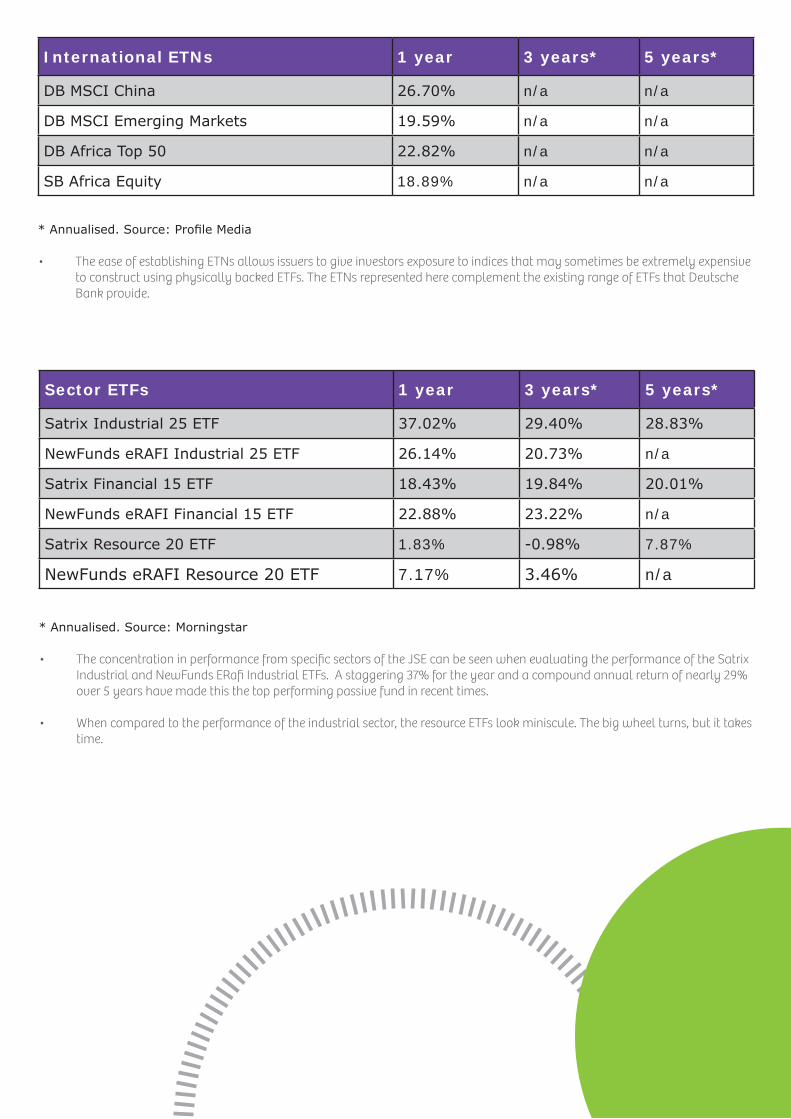
• TheeaseofestablishingETNsallowsissuerstogiveinvestorsexposuretoindicesthatmaysometimesbeextremelyexpensive to construct using physically backed ETFs. The ETNs represented here complement the existing range of ETFs that Deutsche Bankprovide.
Sector ETFs 1 year 3 years* 5 years*
Satrix Industrial 25 ETF 37.02% 29.40% 28.83%
NewFunds eRAFI Industrial 25 ETF 26.14% 20.73% n/a
Satrix Financial 15 ETF 18.43% 19.84% 20.01%
NewFunds eRAFI Financial 15 ETF 22.88% 23.22% n/a
Satrix Resource 20 ETF 1.83% -0.98% 7.87%
NewFunds eRAFI Resource 20 ETF 7.17% 3.46% n/a
* Annualised. Source: Morningstar
• TheconcentrationinperformancefromspecificsectorsoftheJSEcanbeseenwhenevaluatingtheperformanceoftheSatrix Industrial and NewFunds ERafi Industrial ETFs. A staggering 37% for the year and a compound annual return of nearly 29% over 5 years have made this the top performing passive fund in recent times.
• Whencomparedtotheperformanceoftheindustrialsector,theresourceETFslookminiscule.Thebigwheelturns,butittakes time.

Fixed Income and Cash ETFs 1 year 3 years* 5 years*
NewFunds GOVI ETF 0.23% n/a n/a
Z Shares GOVI ETF -0.42% 7.56% 7.03%
NewFunds ILBI ETF 0.52% n/a n/a
RMB Inflation-X ETF 0.38% 10.25% n/a
Grindrod Preftrax ETF 0.93% n/a n/a
NewFunds TRACI 3 Month ETF 4.95% n/a n/a
* Annualised. Source: Morninhgstar
• TheZSharesGoviETFwasclosedbyInvestecinJanuary2014duetothefundnotattainingitsassettargets.
• TheGrindrodPrefTraxhasalsostruggledtokeepitsheadabovewateroveroneyear.Theinverserelationshipbetweenyields and capital values means there is not much room to expect things to get be�er in the short-term. Interest rates for most countriesaroundtheworldonlyhaveoneplacetogo–andthat’sup!
• TheNewfundsTRACIrepresentsshort-termmoneymarketinterestrates,anditishighlyunlikelytheyshouldeverpostaloss over a one year period or longer period.
Currency ETNs 1 year 3 years* 5 years*
NewWave Euro 29.23% n/a n/a
NewWave Pound 26.80% n/a n/a
NewWave US Dollar 23.53% n/a n/a
SB Africa Equity 18.89% n/a n/a
* Annualised. Source: Profile Media
• ThedegreeoftheRand’sweaknesscanbeseeninthetableabove,wheretheNewWaveEuroETNappreciatedbycloseto 30% against the Rand.

Listed Property ETFs 1 year 3 years* 5 years*
Property Index Tracker ETF 6.01% 14.99% 17.08%
PropTrax Ten ETF 6.01% n/a n/a
Stanlib SA Property ETF n/a n/a n/a
SB Africa Equity 18.89% n/a n/a
* Annualised. Source: Morningstar
• Whileoverthreeandfiveyearsreturnsstilllookveryrespectable,thepainisbeingfeltnow.Aspropertyrentalsstartgrowing in excess of inflation valuations in the listed property sector should decouple from being benchmarked against bond yields, to a degree, but this may take a while.
• Ifyouarebuyingtoaccumulateyieldsoveralongperiodoftime,theseinstrumentswillalwaysformpartofaportfolio.In which case it’s best just to ignore the short-term swings in capital values.
• TheProptraxTenisamoreconcentratedversionoftheStanlibSAPropertyandPropertyIndexTrackerETFs.
Portfolio ETFs 1 year 3 years* 5 years*
NewFunds MAPPS Growth ETF 15.88% n/a n/a
NewFunds MAPPS Protect ETF 8.84% n/a n/a
Itransact Growth ETF RA Portfolio# 8% N/A N/A
Itransact Balanced ETF RA Portfolio# 3.5% N/A N/A
Itransact Cautious ETF RA Portfolio# 2.8% N/A N/A
Itransact Growth Discretionary# 12.8% N/A N/A
Itransact Balanced Discretionary# 8.2% N/A N/A
Itransact Cautious Discretionary# 8% N/A N/A
* Annualised. Source: Morningstar# Back-tested by Sterling Waterford Securities
• ThedifferenceinassetallocationbetweentheNewFundsMAPPSGrowthandMAPPSProtectcanbeseenforthe12months toendDecember.Bothproductsareregulation28compliantandcanbeusedinretirementsavingsvehicles,butthedegree oftheirequityexposurevaries.TheMAPPSGrowthhasa75%equityexposure,whereastheMAPPSProtectonlyhasa40% exposure to equities.
• TheItransactGrowth,BalancedandCautiousRAETFshavebeenlaunchedandprovidearangeofrisk-adjustedportfoliosto be used as retirement savings vehicles for investors at different stages of their lives.
Part Two: Fees And Flows
* Annualised. Source: Morningstar
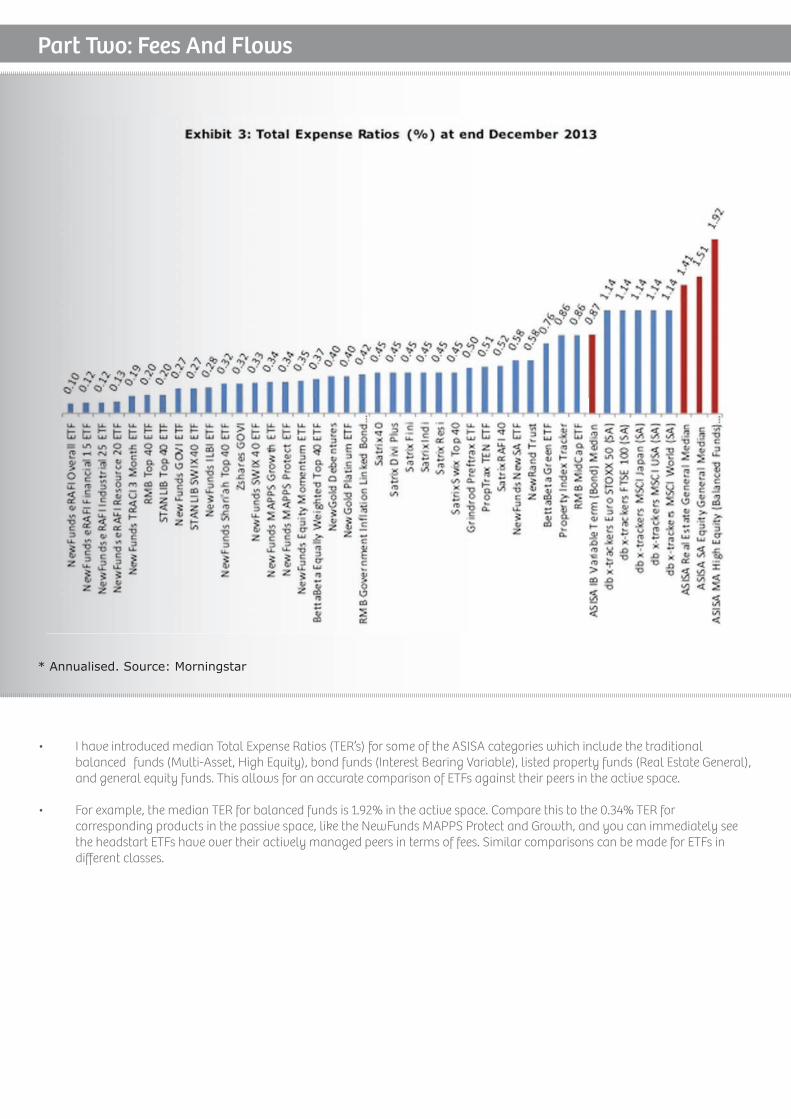
• IhaveintroducedmedianTotalExpenseRatios(TER’s)forsomeoftheASISAcategorieswhichincludethetraditional balanced funds(Multi-Asset,HighEquity),bondfunds(InterestBearingVariable),listedpropertyfunds(RealEstateGeneral), and general equity funds. This allows for an accurate comparison of ETFs against their peers in the active space.
• Forexample,themedianTERforbalancedfundsis1.92%intheactivespace.Comparethistothe0.34%TERfor correspondingproductsinthepassivespace,liketheNewFundsMAPPSProtectandGrowth,andyoucanimmediatelysee the headstart ETFs have over their actively managed peers in terms of fees. Similar comparisons can be made for ETFs in different classes.
* Annualised. Source: Morningstar
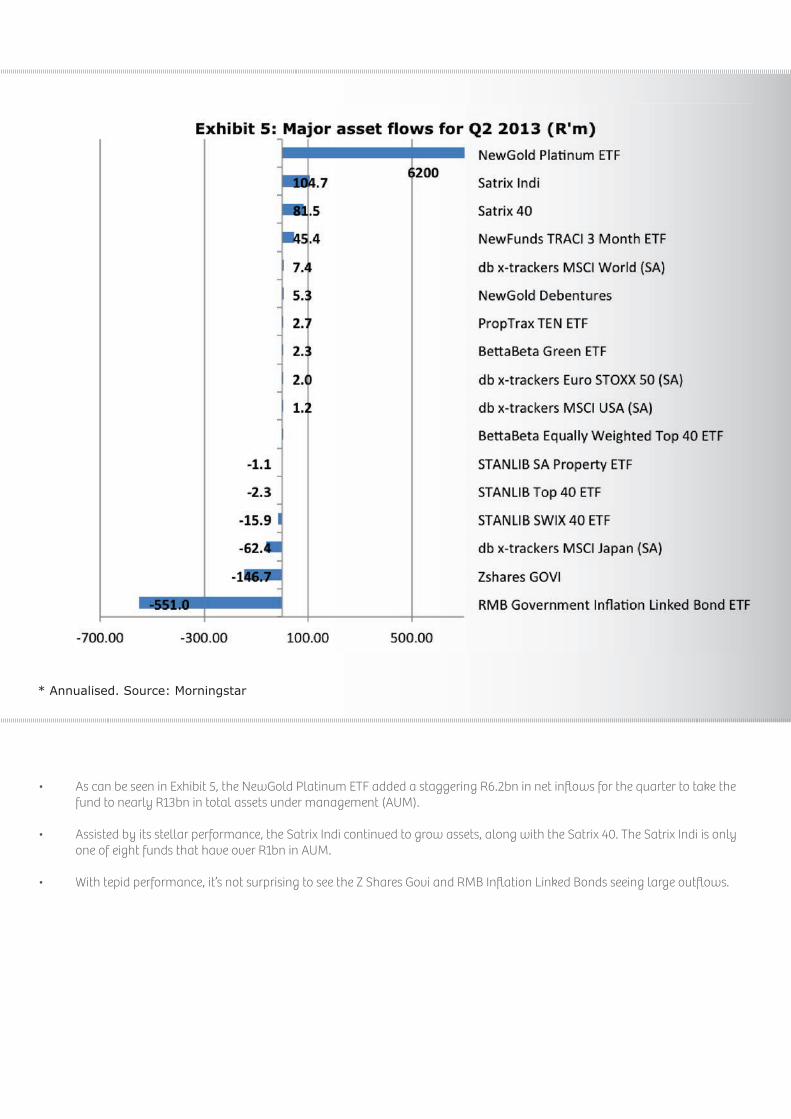
• AscanbeseeninExhibit5,theNewGoldPlatinumETFaddedastaggeringR6.2bninnetinflowsforthequartertotakethe fund to nearly R13bn in total assets under management (AUM).
• Assistedbyitsstellarperformance,theSatrixIndicontinuedtogrowassets,alongwiththeSatrix40.TheSatrixIndiisonly one of eight funds that have over R1bn in AUM.
• Withtepidperformance,it’snotsurprisingtoseetheZSharesGoviandRMBInflationLinkedBondsseeinglargeoutflows.

Instrument AUM (R'm)
BettaBeta Equally Weighted Top 40 ETF 139.6
BettaBeta Green ETF 131.0
db x-trackers Euro STOXX 50 (SA) 1 260.3
db x-trackers FTSE 100 (SA) 592.6
db x-trackers MSCI Japan (SA) 362.3
db x-trackers MSCI USA (SA) 1 329.0
db x-trackers MSCI World (SA) 1 665.6
Grindrod Preftrax 216.9
NewFunds Equity Momentum ETF 24.2
NewFunds eRAFI Financial 15 ETF 10.7
NewFunds eRAFI Industrial 25 ETF 10.6
NewFunds eRAFI Overall ETF 133.1
NewFunds eRAFI Resource 20 ETF 8.7
NewFunds GOVI ETF 43.3
NewFunds ILBI ETF 54.0
NewFunds MAPPS Growth ETF 22.5
NewFunds MAPPS Protect ETF 31.1
NewFunds NewSA ETF 59.2
NewFunds Shari'ah Top 40 ETF 23.1
NewFunds SWIX 40 ETF 12.7
NewFunds TRACI 3 Month ETF 68.4
Instrument AUM (R'm)
NewGold Debentures 16 848.0
NewGold Platinum ETF 12 979.0
NewRand Trust 105.1
Property Index Tracker 119.4
PropTrax TEN ETF 135.4
RMB Government Inflation Linked Bond ETF 491.4
RMB MidCap ETF 108.9
RMB Top 40 ETF 763.4
Satrix 40 8 855.0
Satrix Divi Plus 1 943.0
Satrix Fini 837.7
Satrix Indi 1 459.0
Satrix RAFI 40 938.6
Satrix Resi 483.9
Satrix Swix Top 40 312.5
STANLIB SA Property ETF 69.5
STANLIB SWIX 40 ETF 2 669.6
STANLIB Top 40 ETF 510.8
Z Shares Govi 94
Total (R'm) 55 923.0
Source: Morningstar, issuer websites.
Assets Under Management
• TheNewGoldandNewGoldPlatnowaccountforastaggering50%ofassetsintheETFspace.ThreeoftheDBXTracker funds – Euro, USA and World have become giant funds with each over R1bn in AUM.
• TheSatrix40isbyfarthelargestequityfundwithclosetoR9bninAUM.

ETFs vs. Actively Managed Funds Percentage of active funds beating the indices
Part Three: Analysis
Index 1 year 3 years 5 years
Benchmark 1: FTSE/JSE Top 40 TR ZAR 34% 31% 24%
Benchmark 2: FTSE/JSE Top 40 SWIX TR ZAR 39% 22% 18%
Benchmark 3: FTSE/JSE Mid Cap TR ZAR 86% 40% 7%
Benchmark 4: FTSE/JSE Dividend Plus TR ZAR 97% 72% 18%
Benchmark 5: FTSE/JSE RAFI 40 TR ZAR 66% 51% 24%
Source: Morningstar, general equity classification
• Thetableabovedisplayshowmanyfundsinthegeneralequityfundclassificationbeatfivedifferentequityindicesonwhich ETF products have been based. The figures represent wide variance that is hard to make sense of.
• TheDividendPlusindexforexample,isbeatenby97%offundsoveroneyear.Overfiveyearsthisnumberdropstojust18%. The Top 40 index by comparison has changed over recent surveys, and now has a declining trend of active funds that outperform it.
Rank Product/Fund 3 Year Return (annualised) TER
Percentage of Active
funds beaten
1 Mazi Capital MET Equity A1 23.22 1.09
2 STANLIB Equity R 21.51 1.23
3 Foord Equity R 21.41 1.70
4 Harvard House MET Equity 21.14 1.47
5 Sasfin MET Equity A 21.11 1.45
6 Momentum Best Blend Specialist Eq A 20.68 1.75
7 PSG Equity A 20.10 1.72
8 Coronation Top 20 A 19.55 1.81
9 Imara MET Equity 19.27 1.67
10 Coronation Equity R 19.23 1.16
21 STANLIB SWIX 40 ETF 17.66 0.27 78%
22 STANLIB MM All Stars Eq FoF A 17.62 1.94
23 Efficient Equity 17.06 1.59
24 Mergence Equity Prescient A1 17.05 0.68
25 Satrix Swix Top 40 17.02 0.45 75%
30 PSG Konsult Creator FoF D 16.57 1.75
31 STANLIB Top 40 ETF 16.41 0.20 70%
32 Gryphon All Share Tracker 16.38 0.64
33 Old Mutual Albaraka Equity 16.34 1.72
34 RMB Top 40 ETF 16.25 0.20 66%
35 Allan Gray Equity A 16.20 2.51
40 Satrix 40 15.83 0.45 67%
Broad Market ETFs vs. General Equity Funds over 3 years
Source: Morningstar, general equity classification
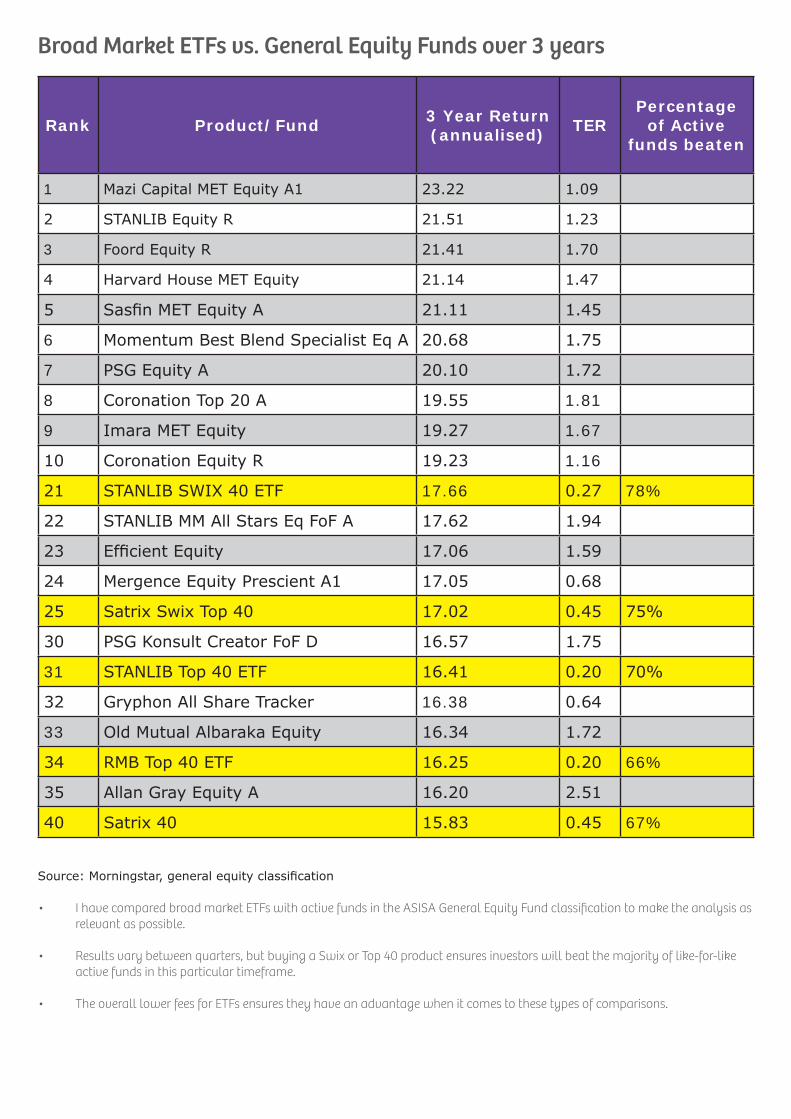
• IhavecomparedbroadmarketETFswithactivefundsintheASISAGeneralEquityFundclassificationtomaketheanalysisas relevant as possible.
• Resultsvarybetweenquarters,butbuyingaSwixorTop40productensuresinvestorswillbeatthemajorityoflike-for-like active funds in this particular timeframe.
• TheoveralllowerfeesforETFsensurestheyhaveanadvantagewhenitcomestothesetypesofcomparisons.
TERs As A Percentage Of ReturnsGeneral Equity Average TER 1.58%
1 year average return before fees 21.23%
TER as a % of return 7.44%
Broad Market ETFs Average TER 0.41%
1 year average return before fees 19.06%
TER as a % of return 2.15%
* See Performance Breakdown. Source: Morningstar, general equity classification
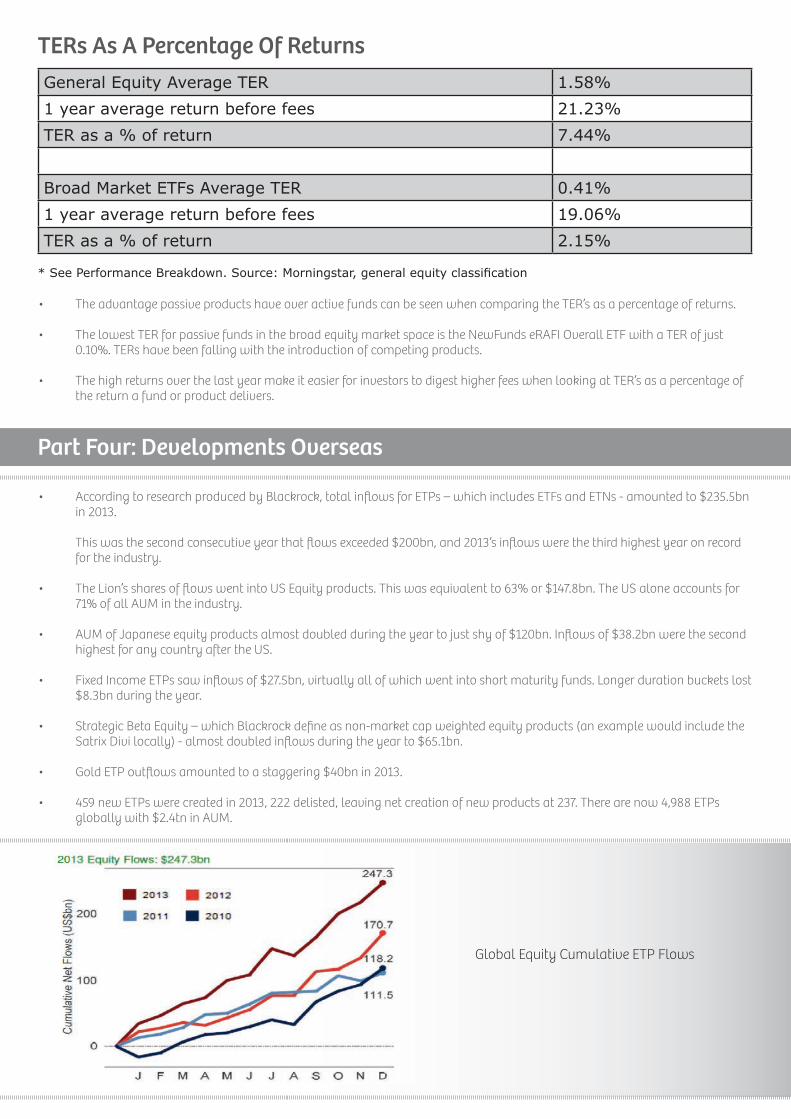
• TheadvantagepassiveproductshaveoveractivefundscanbeseenwhencomparingtheTER’sasapercentageofreturns.
• ThelowestTERforpassivefundsinthebroadequitymarketspaceistheNewFundseRAFIOverallETFwithaTERofjust 0.10%. TERs have been falling with the introduction of competing products.
• ThehighreturnsoverthelastyearmakeiteasierforinvestorstodigesthigherfeeswhenlookingatTER’sasapercentageof the return a fund or product delivers.
Part Four: Developments Overseas
• AccordingtoresearchproducedbyBlackrock,totalinflowsforETPs–whichincludesETFsandETNs-amountedto$235.5bn in 2013.
Thiswasthesecondconsecutiveyearthatflowsexceeded$200bn,and2013’sinflowswerethethirdhighestyearonrecord for the industry.
• TheLion’ssharesofflowswentintoUSEquityproducts.Thiswasequivalentto63%or$147.8bn.TheUSaloneaccountsfor 71% of all AUM in the industry.
• AUMofJapaneseequityproductsalmostdoubledduringtheyeartojustshyof$120bn.Inflowsof$38.2bnwerethesecond highest for any country after the US.
• FixedIncomeETPssawinflowsof$27.5bn,virtuallyallofwhichwentintoshortmaturityfunds.Longerdurationbucketslost $8.3bnduringtheyear.
• StrategicBetaEquity–whichBlackrockdefineasnon-marketcapweightedequityproducts(anexamplewouldincludethe SatrixDivilocally)-almostdoubledinflowsduringtheyearto$65.1bn.
• GoldETPoutflowsamountedtoastaggering$40bnin2013.
• 459newETPswerecreatedin2013,222delisted,leavingnetcreationofnewproductsat237.Therearenow4,988ETPs globallywith$2.4tninAUM.
GlobalEquityCumulativeETPFlows
Part Five: Extras
Head-to-Head:
What is the difference between a passive unit trust and an ETF?
One confusing aspect of investing in passive strategies is that investors may often be confronted with the same investment strategy in two different vehicles. A classic example of this is the case where an investor can a. buy a strategy in the form of an Exchange TradedFund(ETF);orb.Buyitasaunittrustfund.Thisnaturallybegsthequestion:whyduplicatethesamestrategy?Theansweristhat two vehicles have subtle differences which investors need to understand. I’ll a�empt to illustrate this using an example.
I’ve randomly selected the Satrix RAFI and the Old Mutual RAFI 40 Index Tracker as an example of an identical strategy that exists in two different forms. RAFI stands for Research Affiliates Fundamental Indexation, which is a strategy of creating an index that selects shares from a defined universe using tools other than that of the conventional “market cap” technique. Most people are familiar with ourlocalTop40indexthatformsthebasisfortheSatrix40ETF.Theindexranksthe40largestcompaniesontheJSEbasedontheirmarket cap.
The RAFI strategy instead will weight shares from the Top 40 index (referred to as the ‘universe’) not according to their market cap, but rather to other fundamental factors like their dividend yield, cash flows, sales etc. The idea is that by weighting them according to these factors they will identify companies that are cheap relative to others, and this will lead to be�er investment returns going forward.
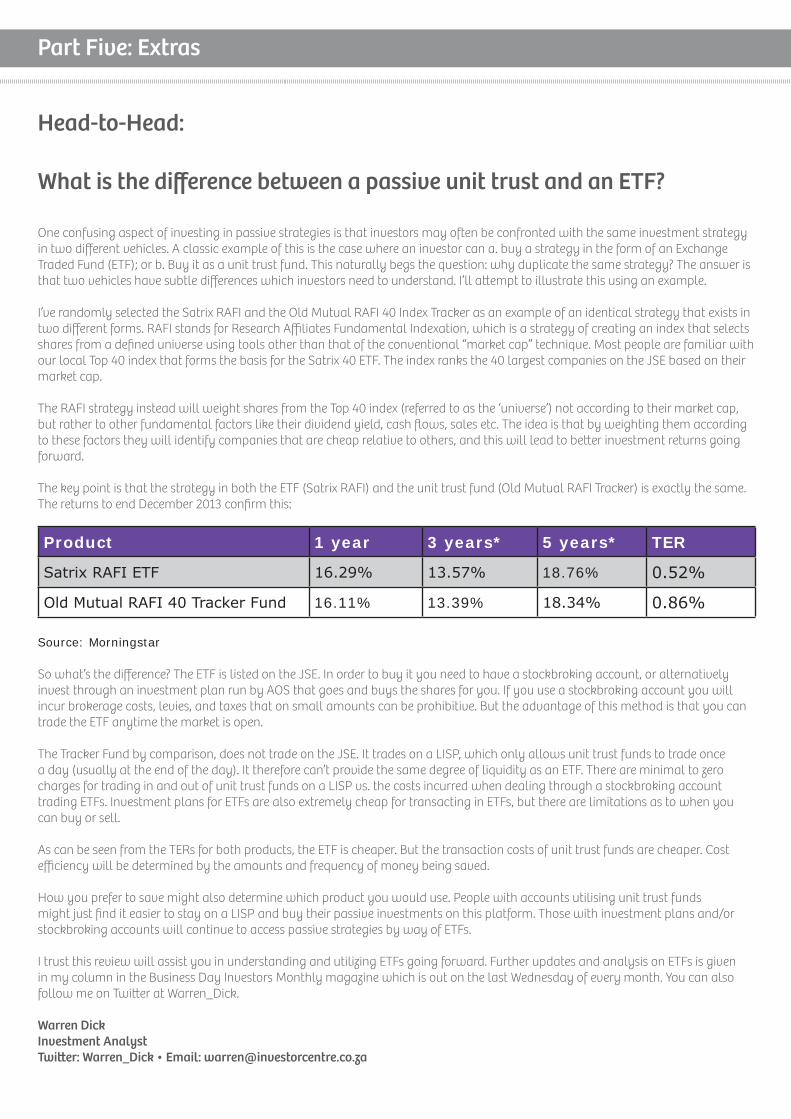
The key point is that the strategy in both the ETF (Satrix RAFI) and the unit trust fund (Old Mutual RAFI Tracker) is exactly the same. ThereturnstoendDecember2013confirmthis:
Source: Morningstar
Sowhat’sthedifference?TheETFislistedontheJSE.Inordertobuyityouneedtohaveastockbrokingaccount,oralternativelyinvest through an investment plan run by AOS that goes and buys the shares for you. If you use a stockbroking account you will incurbrokeragecosts,levies,andtaxesthatonsmallamountscanbeprohibitive.Buttheadvantageofthismethodisthatyoucantrade the ETF anytime the market is open.
TheTrackerFundbycomparison,doesnottradeontheJSE.IttradesonaLISP,whichonlyallowsunittrustfundstotradeoncea day (usually at the end of the day). It therefore can’t provide the same degree of liquidity as an ETF. There are minimal to zero charges for trading in and out of unit trust funds on a LISP vs. the costs incurred when dealing through a stockbroking account trading ETFs. Investment plans for ETFs are also extremely cheap for transacting in ETFs, but there are limitations as to when you can buy or sell.
AscanbeseenfromtheTERsforbothproducts,theETFischeaper.Butthetransactioncostsofunittrustfundsarecheaper.Costefficiency will be determined by the amounts and frequency of money being saved.
How you prefer to save might also determine which product you would use. People with accounts utilising unit trust funds might just find it easier to stay on a LISP and buy their passive investments on this platform. Those with investment plans and/or stockbroking accounts will continue to access passive strategies by way of ETFs.
I trust this review will assist you in understanding and utilizing ETFs going forward. Further updates and analysis on ETFs is given inmycolumnintheBusinessDayInvestorsMonthlymagazinewhichisoutonthelastWednesdayofeverymonth.Youcanalsofollow me on Twi�er at Warren_Dick.
Warren DickInvestment AnalystTwitter: Warren_Dick • Email: [email protected]
Product 1 year 3 years* 5 years* TER
Satrix RAFI ETF 16.29% 13.57% 18.76% 0.52%
Old Mutual RAFI 40 Tracker Fund 16.11% 13.39% 18.34% 0.86%

ETFS 101 –
Getting To Grips With The Basics
ETF or Exchange Traded Fund:IsafinancialinstrumentthatislistedonandtradesthroughtheJSE(JohannesburgStockExchange–ifyou’rereallybattlingwiththeGreek!)justlikeasharedoes,butinsteadoftrackingtheperformanceofasingleshare,itcantrackawhole range of things – anything from an index (a group of shares) to the price of a commodity (or commodities), an exchange rate, and even instruments listed on other exchanges – like bonds.
This makes the business of getting exposure to an industry or sector very easy, because instead of having to buy 40 different shares to get exposure to the Top 40 index for instance, you now buy just one instrument - the Satrix 40. And all the usual benefits that accrue to the owners of the underlying shares also accrue to the owners of the ETF, namely dividends, interest etc.
ETN or Exchange Traded Note: is a promise to pay an investor a return based on the performance of a particular index. A bank usually issues an ETN, which is listed on an exchange and trades like any other share. The investor has to take the credit risk of the entity issuing the ETN into account, as well as consider how the price of the index is calculated. ETNs do not hold the underlying shares, commodities, or currencies the ETN may promise to pay.
Forexample,theStandardBankGoldLinkerpromisestopayaninvestortheequivalentofthevalueoftheNYMEXgoldfuturecontract.UnliketheNewGoldETF(whichstoresgoldinavaultforyou)StandardBankwillnotholdgoldforyou–theETNwillonlybeworthwhatevertheNYMEXgoldfuturecontractisworth.
ETPorExchangeTradedProduct:AcollectivetermthatreferstoETFsandETNs.
“Market Cap”:shortformarketcapitalization.Thismeasuresacompanyorinstrumentstotalvalueandiscalculatedbymultiplyingthe number of shares in issue by the ruling price (or last traded price). For example, the market cap of the Satrix 40 is calculated as follows:
265,491,441XR23.24=R6,278,885,587orR6.2bn.TheMarketCapvariesassoonasthepricechanges.
Tracking error: When attempting to replicate an index, like ETFs or ETNs attempt to do, the amount by which the performance of the ETF differs from that of the index, when expressed as a percentage, is the tracking error.
Hedging: Protecting your portfolio by taking opposing bets, for want of a better word. If you hold a large portion of your wealth in Rands, and want to protect this value against any decline in the Rand/Dollar exchange rate, you would hedge yourself by buying US Dollars.
Uncorrelated returns: If one share/instrument performs well during a particular period and another one declines, we then refer to bothofthemasbeinguncorrelated.AnexcellentexampleisGold,whichtypicallydoeswellbyproducingpositiveorflatreturnswhile share prices collapse, usually in times of uncertainty.
Volatility: is the rate at which prices change or fluctuate. When prices or markets are volatile it usually indicates there is a lot of uncertainty regarding economic developments. Consequently there exists a vacuum and no clear trends (be they upward or downward) are evident. Analysts use volatility indexes to assess the willingness or unwillingness of investors to buy shares and other financial instruments.
Top 40 Index:The40largestcompanieslistedontheJSEbyvalueormarketcap.Thecompaniesmakeupthisindexbasedontheirproportionalsizeorweighting,soinotherwordsifyou’reJannieduPlessis,orBHPBilliton,youmakeupthebiggestproportionoftheteam. The Top 40 Index then measures the collective performance of the share prices’ of these companies.
Total expense ratio (TER): Is what you pay the issuer to administrate the ETF on your behalf. This cost is expressed as a percentage of the value of your portfolio per annum. This is usually calculated daily and debited once a quarter. Much of the benefit of using ETFs is that they are generally on a like-for-like basis much cheaper than using unit trusts.
Analyst Certification
The research analyst who prepared this report certifies that the view expressed herein accurately reflect the research analyst’s personal views about the subject security and issuer and that no part of his compensation was, is or will be directly or indirectly related to specific recommendations or views contained in this report.