south african etf quarterly review (1)
TRANSCRIPT

1
ETF Landscape1st Quarter - 2014For South African financial advisors & investors
Call us on 0861 432 383
Mail us at [email protected]
Visit us at www.itransact.co.za
Automated Outsourcing Services (Pty) Ltd, trading as Itransact, is an authorised financial services provider

Why ItransactWe make the market simple Exchange Traded Products (ETPs) are becoming a popular choice of investment products because of their simplicity and low costs. The South African market is overcrowded with a myriad of investment products, many of them complex and expensive, making investing a daunting experience for the average investor who simply wants the best return at the lowest possible cost. We make investing simple We make investing simple, easy and cost effective for everybody. Itransact is South Africa’s leading Exchange Traded Product Investment Platform that brings selected ETFs, ETNs, ETF Portfolios, ETF Retirement Products and Structured Index Products with capital protection together with all their investment benefits in one convenient place where together with your financial adviser, you can access and profit from Exchange Traded Products.
Keep it simple
This paper is part of a regular series prepared by Itransact and Warren Dick, an independent market analyst and is not intended to be relied upon as a forecast, research or investment advice, and is not a recommendation, offer or solicitation to buy or sell any securities or to adopt any investment strategy. Exchange Traded Products are subject to risks similar to those of shares. Investment returns will fluctuate and are subject to market volatility, so that an investor’s shares, when redeemed or sold, may be worth more or less than their original value. Past performance is not necessarily a guide to the future. The information furnished in this publication, which may include opinions, estimates, indicative rates, terms, price quotations and projections, reflects the existing judgment of the author and current market conditions, which judgment and conditions are subject to change without notice, modification or amendment. This publication does not necessarily reflect the opinion of Itransact, its officers, employees or appointed agents. The information herein has been obtained from various public sources, the accuracy and/or completeness of which Itransact does not guarantee. Itransact recommends that independent tax, accounting, legal and financial advice be sought should any party seek to place any reliance on the information contained herein. Itransact does not provide investment advice. This paper may contain ‘forward-looking’ information that is not purely historical in nature. Such information may include, among other things, projections and forecasts. There is no guarantee that any forecasts made will come to pass. Reliance upon information in this paper is at the sole discretion of the reader. Any unauthorised use or disclosure of this publication is prohibited. This publication may not be reproduced without the consent of Itransact. This material has not been approved for distribution outside South Africa. All rights reserved. ©2013 Itransact& Making the market simple, Keep it simple & the ETF Securities Investment Plan are registered trademarks of Automated Outsourcing Services (Pty) Ltd. For more information: www.itransact.co.za Analyst CertificationThe research analyst who prepared this report certifies that the view expressed herein accurately reflect the research analyst’s personal views about the subject security and issuer and that no part of his compensation was, is or will be directly or indirectly related to specific recommendations or views contained in this report.
1

2
SOUTH AFRICAN 4th QUARTER 2013 ETP REVIEW
PART ONE: PERFORMANCE 2
Performance Breakdown 5
PART TWO: FEES AND FLOWS 9
Total Expense Ratios (TER’s) 9
Net Flows 10
Assets Under Management 11
PART THREE: ANALYSIS 13
ETFs vs. Actively Managed Funds 13
Broad Market ETFs vs. General Equity Funds over 3 years 13
TERs As A Percentage Of Returns 14
PART FOUR: DEVELOPMENTS OVERSEAS 15
PART FIVE: EXTRAS 16
Head-to-Head: 16
ETFS 101 – Getting To Grips With The Basics 17
Disclaimer 18
Analyst Certification 18
We make investing simple.

3
Part One: Performance
Source: Morningstar, Profile Media
• Poor returns persisted for any instruments with a large income component. This included listed property (Proptrax), preference shares (Preftrax) and bond ETFs (Newfunds ILBI and Govi).
• Newgold just managed a positive performance, but nothing like returns it has delivered over the last few years.
• The market as a whole enjoyed another fantastic year as the as the Top 40 index and the Top 40 Swix delivered returns of 25.67% and 27.72% respectively. Naturally the products that replicate these indices followed suit.
• Another interesting observation was the degree to which the Mid-cap index (11.95%) trailed the performance of the Top 40 index (25.67%). 13% odd percent is a large difference over one year.
• The top performer still belongs to a product from the Deutsche Bank range of offshore ETFs – this time the DB Euro. For the period under review, I’m sure a 50% gain will do just fine! The Satrix Industrial ETF continues its strong run, but a 30% return for the year is nothing to be ashamed about.

4
Source: Morningstar, Profile Media
• The usual suspects dominate the top end of the performance graph, with the Satrix Industrial and Deutsche Bank offshore ETFs posting the largest annualised gains. This time round it was the DB USA ETF (31.54% p.a.) that just surpassed the Satrix Industrial ETF (29.49% p.a.).
• The Top 40 index, which is a good proxy for the market as a whole, posted annualised returns of 17.48%, yet over three years the Midcap index performed slightly better (17.75% p.a.).
• No negative returns were posted over the period, but the tough time the resources sector is having was reflected in the performance of the Satrix Resi.

Source: Profile Media
• Silver and Gold seem to be in everyone’s bad books at the moment, with negative performances for the NewWave Silver (-19.69%), Standard Bank Silver (-17.21%) and Standard Bank Gold (-6.61%) ETNs over one year.
• The performance of platinum has surprised many people. Up to 40% of the world’s supply capacity has been shut-down due to the strikes in Rustenburg. The SB Platinum Linker (3.48%) and NewWave Platinum (3.49%) ETNs barely posted positive returns.
• The equity ETNs led performance over one year, with the Investec Top 40 (26.90%) and Investec Swix (28.89%) the top performers.
5

6
Broad Market ETFs 1 year 3 years* 5 years*BettaBeta Equally Weighted Top 40 ETF 16.05% 15.96% n/a
NewFunds Equity Momentum ETF 24.89% n/a n/a
NewFunds eRAFI Overall ETF 18.12% 14.86% 24.07%
NewFunds SWIX 40 ETF 21.40% n/a n/a
RMB MidCap ETF 11.53% n/a n/a
RMB Top 40 ETF 26.26% 17.29% 21.05%
Satrix 40 ETF 25.33% 16.79% 20.74%
Satrix RAFI 40 ETF 21.61% 14.97% 21.31%
Satrix Swix Top 40 ETF 27.52% 18.43% 21.51%
Stanlib Swix 40 ETF 26.41% 18.50% n/a
Stanlib Top 40 ETF 24.69% 16.94% n/a
Performance Breakdown
* Annualised. Source: Morningstar
• Interesting to see the Swix indices - as represented by the Satrix Swix and Stanlib Swix – leading the way over one and three years.
• Also a very credible performance by the NewFunds Equity Momentum ETF, which posted a return of 24.89% over one year. This result may indicate just what kind of a market we find ourselves in.
• Over five years the NewFunds eRAFI overall delivered a phenomenal 24% p.a. return, and certainly makes a strong case for using the value approach which is captured in its stock selection.
Broad Market ETNs 1 year 3 years* 5 years*Investec Top 40 26.90% n/a n/a
Investec Swix 28.89% n/a n/a
* Annualised. Source: Profile Media
• Returns from the ETNs are slightly higher than those from the ETFs, probably on account of the lower fees ETNs incur.
Style and Commodity ETFs 1 year 3 years* 5 years*
BettaBeta Green ETF 11.21% n/a n/a
NewFunds NewSA ETF 22.92% 18.63% 24.68%
NewFunds Shari'ah Top 40 ETF 23.61% 9.98% n/a
NewRand Trust ETF 18.49% 13.99% 15.38%
Satrix Divi Plus ETF 6.38% 13.26% 19.79%
NewGold Debentures 0.98% 13.32% 8.38%
NewPlat Debentures n/a n/a n/a
* Annualised. Source: Morningstar
• Fantastic performance from the NewFunds NewSA ETF over all periods.
• The Satrix Divi’s performance has lagged over the short-term (one year) but has still posted respectable returns over three and five years.
• Investors were handsomely rewarded over one year by the performance of the NewFunds Shari’ah ETF.

Making the market simple
Commodity ETNs 1 year 3 years* 5 years*
NewWave Platinum 3.49% n/a n/a
NewWave Silver -19.69% n/a n/a
Investec Gold 0.09% n/a n/a
RMB Oil 20.28% 9.38% n/a
RMB Coal -5.84% n/a n/a
SB Africa Commodity Basket 8.51% n/a n/a
SB Gold Linker -6.61% 11.53% n/a
SB Silver Linker -17.21% -6.94% n/a
SB Palladium Linker 15.33% 15.50% n/a
SB Platinum Linker 3.48% 7.09% n/a
SB Copper 2.87% n/a n/a
SB Corn 2.65% n/a n/a
SB Oil 23.94% n/a n/a
SB Wheat 9.93% n/a n/a
* Annualised. Source: Profile Media
• A mixed bag of results for commodities, with silver being the most disappointing.
• Interesting to note the contrasting fortunes for palladium over one and three years vs. those for platinum. Palladium comfortably beat the performance of platinum despite coming from the same group elements.
International ETFs 1 year 3 years* 5 years*
DB X-trackers Euro Stoxx 50 ETF 49.81% 20.09% 14.49%
DB X-trackers FTSE 100 ETF 34.38% 24.92% 19.93%
DB X-trackers MSCI Japan ETF 21.38% 20.67% 11.15%
DB X-trackers MSCI USA ETF 39.72% 31.54% 22.12%
DB X-trackers MSCI World ETF 37.32% 27.17% 19.71%
* Annualised. Source: Morninhgstar
• The Deutsche Bank X-Trackers have profited enormously from a depreciating rand and the resurgence of international equity markets post the financial crisis.
7

8
International ETNs 1 year 3 years* 5 years*
DB MSCI China 18.07% n/a n/a
DB MSCI Emerging Markets 13.53% n/a n/a
DB Africa Top 50 24.19% n/a n/a
SB Africa Equity 15.28% n/a n/a
* Annualised. Source: Profile Media
• Still fairly new products, but the returns have certainly not disappointed, with the Deutsche Bank Africa ETN posting a stellar 24% for the year.
Sector ETFs 1 year 3 years* 5 years*
Satrix Industrial 25 ETF 30.82% 29.49% 31.24%
NewFunds eRAFI Industrial 25 ETF 19.49% 21.34% n/a
Satrix Financial 15 ETF 22.00% 22.28% 24.05%
NewFunds eRAFI Financial 15 ETF 15.98% 23.95% n/a
Satrix Resource 20 ETF 18.78% 1.35% 9.24%
NewFunds eRAFI Resource 20 ETF 20.24% 4.73% n/a
* Annualised. Source: Morningstar
• These are impressive numbers. The performance of the Satrix Industrial over all periods is nothing short of phenomenal.
• Interesting to see the market capitalization ETFs represented by Satrix dominating in the industrial and financial sectors, but falling behind to the RAFI strategy in resources.
Fixed Income and Cash ETFs 1 year 3 years* 5 years*
NewFunds GOVI ETF -0.57% n/a n/a
NewFunds ILBI ETF -0.59% n/a n/a
RMB Inflation-X ETF 0.24% 10.47% n/a
Grindrod Preftrax ETF -1.53% n/a n/a
NewFunds TRACI 3 Month ETF 5.34% n/a n/a
* Annualised. Source: Morninhgstar
• You can see what a tough time fixed income instruments have when interest rates start to rise, as can be seen by the negative performances of the NewFunds Govi (government bond index) and ILBI (inflation-linked bond index).
• Cash – via the NewFunds TRACI – paid investors an interest rate of 5.34% for the year.
• Longer term, the RMB Inflation-X (which is identical to the NewFunds ILBI) has comfortably beaten inflation over three years with a return of 10.47%.

Currency ETNs 1 year 3 years* 5 years*
NewWave Euro 23.64% n/a n/a
NewWave Pound 26.66% n/a n/a
NewWave US Dollar 15.02% n/a n/a
* Annualised. Source: Profile Media
• The rand’s lackluster performance over the period can be seen from the performance of these instruments, with the British pound faring the best.
Listed Property ETFs 1 year 3 years* 5 years*
Property Index Tracker ETF -2.34% 16.37% 17.79%
PropTrax Ten ETF -0.29% n/a n/a
Stanlib SA Property ETF 0.09% n/a n/a
* Annualised. Source: Morningstar
• Listed property often acts as a substitute to yield investors that own government bonds, and when interest rates rise, it means the value of listed property falls. This explains the poor performance over one year, which is comparable to the performance of fixed income ETFs.
• Longer-term their performance has still been stellar.
Portfolio ETFs 1 year 3 years* 5 years*
NewFunds MAPPS Growth ETF 15.65% n/a n/a
NewFunds MAPPS Protect ETF 8.13% n/a n/a
Itransact Growth ETF RA Portfolio# 9.2% N/A N/A
Itransact Balanced ETF RA Portfolio# 5.9% N/A N/A
Itransact Cautious ETF RA Portfolio# 3.4% N/A N/A
Itransact Growth Discretionary# 11.17% N/A N/A
Itransact Balanced Discretionary# 4.5% N/A N/A
Itransact Cautious Discretionary# 7% N/A N/A
* Annualised. Source: Morningstar & Sunstrike Capital# Back-tested by Sunstrike Capital.
• The instruments with the larger equity components led the way, as can be seen from the performance of the NewFunds MAPPS Growth and Itransact Growth ETFs.
• Products with a larger fixed-income component – like the MAPPS Protect and Itransact Balanced and Cautious products – have had their performance tempered by the poor short-term returns in this asset class.
9

10
Part Two: Fees And Flows
Source: Morningstar, issuer websites
• The median Total Expense Ratios (TER’s) for some of the ASISA categories which include the traditional balanced funds (Multi-Asset, High Equity), bond funds (Interest Bearing Variable), listed property funds (Real Estate General), and general equity allows for an interesting comparison of ETFs against their peers in the active space.
• For example, the median TER for balanced funds is 1.95% in the active space. Compare this to the 0.33% TER for corresponding products in the passive space, like the NewFunds MAPPS Protect and Growth, and you can immediately see the headstart ETFs have over their actively managed peers in terms of fees. Similar comparisons can be made for ETFs in different classes.

11
Source: Morningstar
• As can be seen, continued strong flows for the NewPlatinum ETF, whereas the Satrix 40 and NewGold saw some outflows during the quarter.

12
ETF AUM by Instrument AUM (R'm)
BettaBeta Equally Weighted Top 40 148.6
BettaBeta Green ETF 139.5
db x-trackers Euro STOXX 50 (SA) 1 410.0
db x-trackers FTSE 100 (SA) 700.1
db x-trackers MSCI Japan (SA) 324.0
db x-trackers MSCI USA (SA) 1 470.0
db x-trackers MSCI World (SA) 1 800.0
Grindrod Preftrax 224.3
Property Index Tracker 109.7
PropTrax TEN ETF 129.0
NewFunds Equity Momentum ETF 24.4
NewFunds eRAFI Financial 15 ETF 13.7
NewFunds eRAFI Industrial 25 ETF 13.7
NewFunds eRAFI Overall ETF 142.8
NewFunds eRAFI Resource 20 ETF 9.8
NewFunds GOVI ETF 63.8
NewFunds ILBI ETF 56.1
NewFunds MAPPS Growth ETF 23.5
NewFunds MAPPS Protect ETF 32.3
NewFunds NewSA ETF 62.0
ETF AUM by Instrument AUM (R'm)
NewFunds SWIX 40 ETF 13.4
NewFunds TRACI 3 Month ETF 87.6
NewGold Debentures 17 973.0
NewGold Platinum ETF 15 457.0
RMB Government Inflation Linked 465.3
RMB MidCap ETF 111.7
RMB Top 40 ETF 794.4
Satrix 40 8 307.0
Satrix Divi Plus 1 866.0
Satrix Fini 714.4
Satrix Indi 1 467.0
Satrix RAFI 40 987.8
Satrix Resi 366.8
Satrix Swix Top 40 327.9
STANLIB SA Property ETF 71.2
STANLIB SWIX 40 ETF 2 813.0
STANLIB Top 40 ETF 537.2
Total (R’m) 59 284.8
Source: Morningstar, issuer websites.
Assets Under Management
• The commodity ETFs (NewGold and NewPlat) still remain the largest by a wide margin, accounting for well over half of all assets in the ETF market.
ETN AUM by Instrument AUM (R'm)
NewWave Euro 148.6
NewWave Pound 139.5
NewWave US Dollar 14.0
NewWave Platinum 139.2
NewWave Silver 17.0
DB MSCI China 776.5
DB MSCI Emerging Markets 859.3
DB Africa Top 50 1 977.0
Investec Top 40 703.5
Investec Swix 683.3
Investec Gold 555.0
RMB Oil 186.2
RMB Coal 57.2
ETN AUM by Instrument AUM (R'm)
SB Africa Equity 241.6
SB Africa Commodity Basket 138.2
SB Gold Linker 155.3
SB Silver Linker 76.0
SB Palladum Linker 118.0
SB Platinum Linker 263.4
SB Copper 124
SB Corn 61.6
SB Oil 214.8
SB Wheat 56.9
Total (R’m) 7 426.2
Source: Morningstar, issuer websites.
• It’s good to see some real money starting to come into ETNs, with the largest of them, the Deutsche Bank Africa Top 50, now with almost R2bn.
• The rest of the Deutsche Bank products are not doing too badly either with the Emerging Markets and China ETNs now accounting for over R1.5bn.
• Investec has also had much success with its ETNs that replicate the performance of the Top 40 and Swix indices.
• The NewWave currency ETNs have not yet got to full scale.
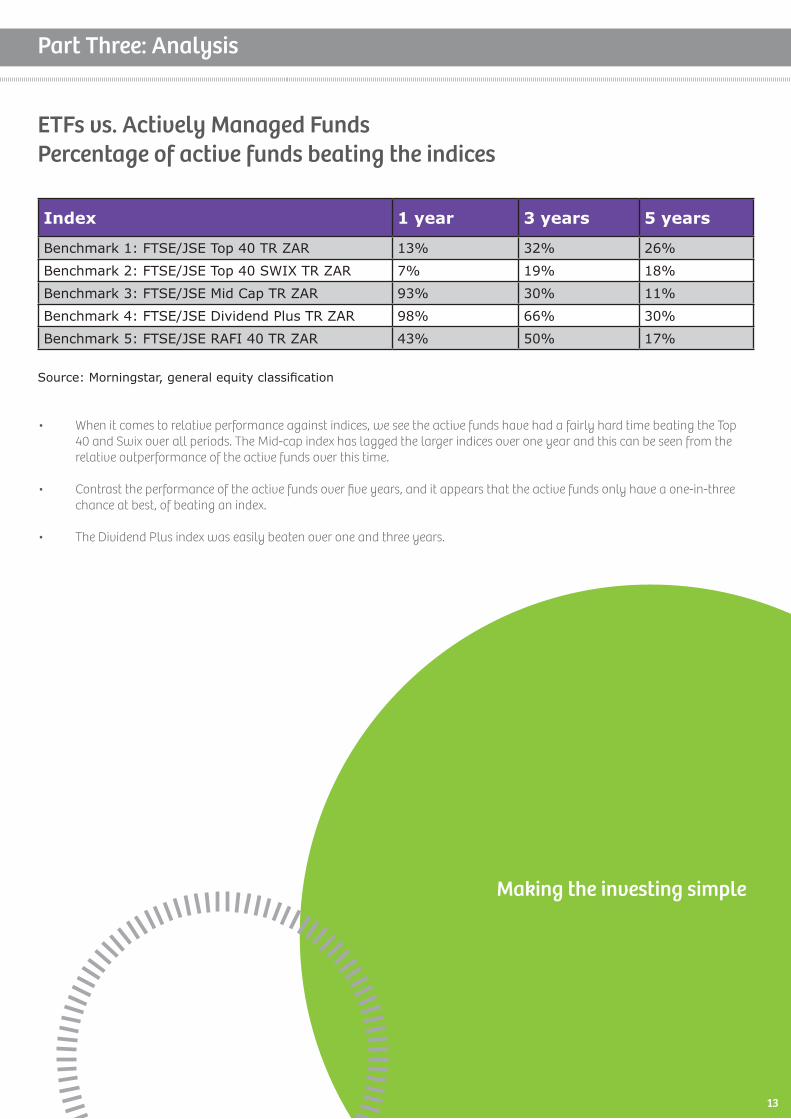
ETFs vs. Actively Managed Funds Percentage of active funds beating the indices
Part Three: Analysis
Index 1 year 3 years 5 years
Benchmark 1: FTSE/JSE Top 40 TR ZAR 13% 32% 26%
Benchmark 2: FTSE/JSE Top 40 SWIX TR ZAR 7% 19% 18%
Benchmark 3: FTSE/JSE Mid Cap TR ZAR 93% 30% 11%
Benchmark 4: FTSE/JSE Dividend Plus TR ZAR 98% 66% 30%
Benchmark 5: FTSE/JSE RAFI 40 TR ZAR 43% 50% 17%
Source: Morningstar, general equity classification
• When it comes to relative performance against indices, we see the active funds have had a fairly hard time beating the Top 40 and Swix over all periods. The Mid-cap index has lagged the larger indices over one year and this can be seen from the relative outperformance of the active funds over this time.
• Contrast the performance of the active funds over five years, and it appears that the active funds only have a one-in-three chance at best, of beating an index.
• The Dividend Plus index was easily beaten over one and three years.
Making the investing simple
13

14
Rank Group/Investment TER 3 Year Return (annualised)
Percentage of Active
funds beaten
1 Mazi Capital MET Equity A1 0.98 23.40
2 Foord Equity R 1.70 23.15
3 Harvard House MET Equity 1.47 22.97
4 PSG Equity A 1.73 21.95
5 Sasfin MET Equity A 1.47 21.57
6 Momentum Best Blend Specialist 1.74 21.55
7 Coronation Equity R 1.14 20.94
8 Coronation Top 20 A 1.89 20.73
9 STANLIB Equity R 1.25 20.72
10 Imara MET Equity 1.71 20.26
25 NewFunds NewSA ETF 0.57 18.63 74%
26 STANLIB MM All Stars Eq FoF A 2.00 18.56
27 STANLIB SWIX 40 ETF 0.25 18.5 73%
28 Satrix Swix Top 40 0.45 18.43 73%
29 Old Mutual Investors R 1.14 18.26
36 Old Mutual Albaraka Equity 1.72 17.36
37 RMB Top 40 ETF 0.19 17.29 65%
38 Capstone MET Equity 1.63 17.29
39 MI-PLAN IP Beta Equity B2 0.58 17.27
40 Aylett Equity Prescient A3 1.77 17.22
44 STANLIB Top 40 ETF 0.23 16.94 59%
45 FG IP Mercury Equity FoF A1 1.36 16.85
46 Satrix 40 0.45 16.79 57%
47 STANLIB Growth R 1.14 16.59
54 Momentum Equity R 1.13 15.98
55 BettaBeta Equally Weighted Top 40 ETF 0.29 15.96 48%
Broad Market ETFs vs. General Equity Funds over 3 years
Source: Morningstar, general equity classification
• As can be seen from the above table, the NewFunds NewSA still is the best performing broad market ETF (relative to active funds) over three years.
• The Stanlib and Satrix Swix still managed to beat 73% of active funds.
• There were 94 active funds in this classification alone (general equity).

15
TERs As A Percentage Of ReturnsGeneral Equity Average TER 1.65%
1 year average return before fees 22.46%
TER as a % of return 7.35%
Broad Market ETFs Average TER 0.30%
1 year average return before fees 24.75%
TER as a % of return 1.21%
* See Performance Breakdown. Source: Morningstar, general equity classification
• Both active funds and broad market ETFs had an excellent year from a returns perspective, but the relative cost of an ETF is still much smaller than actively managed funds.
Part Four: Developments Overseas
• According to research produced by Blackrock, total inflows for ETPs – which includes ETFs and ETNs – has amounted to $33.3bn year-to-date in 2014. This was below the $69.8bn in net inflows seen in Q1 2013.
• Fixed income ETPs saw net inflows of $19.9bn for the quarter vs. $11.6bn the year before. All other ETP classes saw inflows apart from emerging market equities which saw outflows of $15.2bn vs. inflows of $4.2bn for 1st quarter 2013.
• As at the end of March, there are now 5,102 listed ETPs around the world, comprising assets of $2.4tn. Of this, the US accounts for $1.7tn and Europe for $431bn in assets.
• As can be seen from the diagram below, Equity ETPs rebounded in February and March after some withdrawals in January.
• Fixed income ETPs have largely been gathering assets in investment grade corporate bonds and government bond funds. The amount of money going into short maturity funds ($7.8bn) was actually outpaced by money going into longer-term buckets ($12.1bn) for the first time in months.
• iShares ($937bn), State Street ($402.3bn) and Vanguard ($359bn) are the world’s biggest issuers of ETPs.
Global Equity ETP Flows by Category
Source: Blackrock

16
Part Five: Extras
Head-to-Head:
Head-to-Head: Grindrod S&P Dividend Aristocrats vs. Satrix Divi
Our head-to-head this month looks at two ETFs focused on selecting stocks that aim to select companies paying good dividends: the
Grindrod S&P Dividend Aristocrats (“Dividend Aristocrat”) and the Satrix Divi (“Divi”).
Many of you have heard of the Satrix Divi, but the Dividend Aristocrats may be unfamiliar. That’s because it is. Grindrod have
teamed up with Standard and Poors to design a set of ETFs exclusively for the South African market. While we don’t have a track
record for the Dividend Aristocrats with which to compare against the Divi, I thought it would still be useful to highlight some key
differences.
Let’s start with the Divi. For starters, the ETF aims to track the FTSE/JSE Dividend Plus index, which in turn selects 30 stocks with the
highest one year forecasted dividend yield, as compiled by the McGregor BFA survey. The universe comprises all stocks in the Top 40
and Mid-cap index, and the forecasts are made by both sell-side and buy-side analysts. The index is reviewed twice a year in March
and September.
The Dividend Aristocrats by comparison, selects shares (there are 22 constituents at the moment) from a universe consisting of the
S&P South Africa Composite index. This includes any share on the JSE, that a. Has a float adjusted market capitalization of $100m
or more, and b. Has an annual dollar value traded of $50m or more.
From this index, the ETF will select shares that have increased or maintained dividends over five consecutive years. So in this way it
has a quality filter. Shares that have had price declines, will naturally have a high dividend yield. The Dividend Aristocrats excludes
these ‘inferior’ companies by only selecting companies that on a per share basis have maintained or increased their dividends over
the last five years.
So the one is forward looking, the other backwards. It will be interesting to see which one delivers the best results in future.
Warren DickInvestment AnalystTwitter: Warren_Dick • Email: [email protected]

ETFS 101 –
Getting To Grips With The Basics
ETF or Exchange Traded Fund: Is a financial instrument that is listed on and trades through the JSE (Johannesburg Stock Exchange – if you’re really battling with the Greek!) just like a share does, but instead of tracking the performance of a single share, it can track a whole range of things – anything from an index (a group of shares) to the price of a commodity (or commodities), an exchange rate, and even instruments listed on other exchanges – like bonds.
This makes the business of getting exposure to an industry or sector very easy, because instead of having to buy 40 different shares to get exposure to the Top 40 index for instance, you now buy just one instrument - the Satrix 40. And all the usual benefits that accrue to the owners of the underlying shares also accrue to the owners of the ETF, namely dividends, interest etc.
ETN or Exchange Traded Note: is a promise to pay an investor a return based on the performance of a particular index. A bank usually issues an ETN, which is listed on an exchange and trades like any other share. The investor has to take the credit risk of the entity issuing the ETN into account, as well as consider how the price of the index is calculated. ETNs do not hold the underlying shares, commodities, or currencies the ETN may promise to pay.
For example, the Standard Bank Gold Linker promises to pay an investor the equivalent of the value of the NYMEX gold future contract. Unlike the NewGold ETF (which stores gold in a vault for you) Standard Bank will not hold gold for you – the ETN will only be worth whatever the NYMEX gold future contract is worth.
ETP or Exchange Traded Product: A collective term that refers to ETFs and ETNs.
Market Cap: short for market capitalization. This measures a company or instruments total value and is calculated by multiplying the number of shares in issue by the ruling price (or last traded price). For example, the market cap of the Satrix 40 is calculated as follows:
265,491,441 X R23.24 = R6,278,885,587 or R6.2bn. The Market Cap varies as soon as the price changes.
Tracking error: When attempting to replicate an index, like ETFs or ETNs attempt to do, the amount by which the performance of the ETF differs from that of the index, when expressed as a percentage, is the tracking error.
Hedging: Protecting your portfolio by taking opposing bets, for want of a better word. If you hold a large portion of your wealth in Rands, and want to protect this value against any decline in the Rand/Dollar exchange rate, you would hedge yourself by buying US Dollars.
Uncorrelated returns: If one share/instrument performs well during a particular period and another one declines, we then refer to both of them as being uncorrelated. An excellent example is Gold, which typically does well by producing positive or flat returns while share prices collapse, usually in times of uncertainty.
Volatility: is the rate at which prices change or fluctuate. When prices or markets are volatile it usually indicates there is a lot of uncertainty regarding economic developments. Consequently there exists a vacuum and no clear trends (be they upward or downward) are evident. Analysts use volatility indexes to assess the willingness or unwillingness of investors to buy shares and other financial instruments.
Top 40 Index: The 40 largest companies listed on the JSE by value or market cap. The companies make up this index based on their proportional size or weighting, so in other words if you’re Jannie du Plessis, or BHP Billiton, you make up the biggest proportion of the team. The Top 40 Index then measures the collective performance of the share prices’ of these companies.
Total expense ratio (TER): Is what you pay the issuer to administrate the ETF on your behalf. This cost is expressed as a percentage of the value of your portfolio per annum. This is usually calculated daily and debited once a quarter. Much of the benefit of using ETFs is that they are generally on a like-for-like basis much cheaper than using unit trusts.
Disclaimer
This publication has been issued by Investorcentre CC. The information contained herein has been obtained from sources which and persons whom we believe to be reliable but is not guaranteed for accuracy, completeness or otherwise. Opinions and estimates constitute our judgement as of the date of this material and are subject to change without notice. Past performance is not indicative of future results. This report is provided for informational purposes only. No information contained herein, no opinion expressed and no recommendation made constitutes a representation by us or a solicitation for the purchase of any of the securities mentioned herein and we have no responsibility whatsoever arising here from or in consequence hereof. Securities, financial instruments or strategies mentioned herein may not be suitable for all investors and investors must make their own investment decisions using their own independent advisers as they believe necessary and based upon their specific financial situations and investment objectives.
Analyst Certification
The research analyst who prepared this report certifies that the view expressed herein accurately reflect the research analyst’s personal views about the subject security and issuer and that no part of his compensation was, is or will be directly or indirectly related to specific recommendations or views contained in this report.
17