sources, trends and regional impacts of fine particulate ... · soren et al., 2009; eyring et al.,...
TRANSCRIPT

Atmos. Chem. Phys., 13, 3721–3732, 2013www.atmos-chem-phys.net/13/3721/2013/doi:10.5194/acp-13-3721-2013© Author(s) 2013. CC Attribution 3.0 License.
EGU Journal Logos (RGB)
Advances in Geosciences
Open A
ccess
Natural Hazards and Earth System
Sciences
Open A
ccess
Annales Geophysicae
Open A
ccessNonlinear Processes
in Geophysics
Open A
ccess
Atmospheric Chemistry
and PhysicsO
pen Access
Atmospheric Chemistry
and Physics
Open A
ccess
Discussions
Atmospheric Measurement
Techniques
Open A
ccess
Atmospheric Measurement
Techniques
Open A
ccess
Discussions
Biogeosciences
Open A
ccess
Open A
ccess
BiogeosciencesDiscussions
Climate of the Past
Open A
ccess
Open A
ccess
Climate of the Past
Discussions
Earth System Dynamics
Open A
ccess
Open A
ccess
Earth System Dynamics
Discussions
GeoscientificInstrumentation
Methods andData Systems
Open A
ccess
GeoscientificInstrumentation
Methods andData Systems
Open A
ccess
Discussions
GeoscientificModel Development
Open A
ccess
Open A
ccess
GeoscientificModel Development
Discussions
Hydrology and Earth System
Sciences
Open A
ccess
Hydrology and Earth System
Sciences
Open A
ccess
Discussions
Ocean Science
Open A
ccess
Open A
ccess
Ocean ScienceDiscussions
Solid Earth
Open A
ccess
Open A
ccess
Solid EarthDiscussions
The Cryosphere
Open A
ccess
Open A
ccess
The CryosphereDiscussions
Natural Hazards and Earth System
Sciences
Open A
ccess
Discussions
Sources, trends and regional impacts of fine particulate matter insouthern Mississippi valley: significance of emissions from sources inthe Gulf of Mexico coast
M.-C. Chalbot, B. McElroy, and I. G. Kavouras
University of Arkansas for Medical Sciences, Little Rock, Arkansas, USA
Correspondence to:I. G. Kavouras ([email protected])
Received: 19 October 2012 – Published in Atmos. Chem. Phys. Discuss.: 9 January 2013Revised: 7 March 2013 – Accepted: 9 March 2013 – Published: 8 April 2013
Abstract. The sources of fine particles over a 10 yr periodat Little Rock, Arkansas, an urban area in the southern Mis-sissippi Valley, were identified by positive matrix factoriza-tion. The annual trends of PM2.5 and its sources, and theirassociations with the pathways of air mass backward tra-jectories were examined. Seven sources were apportioned,namely, primary traffic particles, secondary nitrate and sul-phate, biomass burning, diesel particles, aged/contaminatedsea salt and mineral/road dust, accounting for more than90 % of measured PM2.5 (particles with aerodynamic diam-eter less than 2.5 µm) mass. The declining trend of PM2.5mass (0.4 µg m−3 per year) was related to lower levels ofSO2−
4 (0.2 µg m−3 per year) due to SO2 reductions from pointand mobile sources. The slower decline for NO−
3 particles(0.1 µg m−3 per year) was attributed to the increasing NH3emissions in the Midwest. The annual variation of biomassburning particles was associated with fires in the southeastand northwest US. Of the four regions within 500 km fromthe receptor site, the Gulf Coast and the southeast US ac-counted cumulatively for more than 65 % of PM2.5 mass, ni-trate, sulphate and biomass burning aerosol. Overall, morethan 50 % of PM2.5 and its components originated fromsources outside the state. Sources within the Gulf Coast andwestern Gulf of Mexico include 65 % of the busiest ports inthe US, intense marine traffic within 400 km of the coastburning rich in S diesel, and a large number of offshoreoil and natural gas platforms and many refineries. This ap-proach allowed for the quantitative assessment of the impactsof transport from regions representing diverse mixtures ofsources and weather conditions for different types of parti-cles. The findings of this effort demonstrated the influences
of emission controls on SO2 and NOx on PM2.5 mass, the po-tential effect of events (i.e. fires) sensitive to climate changephenomena on air pollution and the potential of offshore ac-tivities and shipping emissions to influence air quality in ur-ban areas located more than 1000 km away from the sources.
1 Introduction
Atmospheric aerosol modifies Earth’s energy balance byscattering sunlight back to space, absorbing solar and in-frared radiation and changing the microphysical and ther-modynamic properties of clouds (Ostrom and Koone, 2000;Lohmann and Feichter, 2001; Quinn and Bates, 2005). Over-all, atmospheric aerosols have a negative radiative forc-ing from −0.2± 0.2 W m−2 to −0.8± 0.2 W m−2, both di-rectly and indirectly, through the cloud albedo effect (IPCC,2007). Exposures to particulate matter are also associatedwith acute and chronic health problems and lead to increasedmortality rates from respiratory, cardiac and circulatory dis-eases, increased emergency care visits and hospital admis-sions for bronchitis and asthma (Brunekreef and Holgate,2002; Peng et al., 2005; Brunekreef and Forsberg, 2005).In the US, PM2.5 (particles with aerodynamic diameter lessthan 2.5 µm) mass concentrations decreased by 27 % be-tween 2001 and 2010 (US EPA, 2012a). These trends wereattributed to the significant reductions of gaseous sulfur andnitrogen oxides from coal-fired power plants and mobilesources. These gaseous pollutants are precursors of particu-late sulfate and nitrate aerosol, the dominant species of PM2.5aerosol in the Midwest and eastern US. The slower decline on
Published by Copernicus Publications on behalf of the European Geosciences Union.
3722 M.-C. Chalbot et al.: Significance of emissions from sources in the Gulf of Mexico coast
particle mass levels for “cool” months (October to April) ascompared to “warm” months was explained by the elevatedemissions from residential wood burning and the formationof temperature inversion layers that trigger the accumulationof particles near the ground.
Shipping emissions are recognized as an important sourceof particulate matter and its precursors around the world(Wang et al., 2003; Deniz et al., 2008; Minguillon et al.,2008). The diesel engines in ships operate on fuel that canhave extremely high sulfur content and porphyrin-contentrich in V and Ni (termed as bunker oil). They are sub-jected to modest emission controls in the US and around theworld, with the exceptions of passenger ships in the BalticSea, North Sea and English Channel. It is predicted that inthe absence of emission controls, SO2 emissions to the to-tal emissions in the US would increase from 21 % today to81 %, NOx emissions would increase to 28 % of total mobileNOx emissions in the US, and PM2.5 emissions would almosttriple to 170 000 tons yr−1 by 2030 (Corbett et al., 2003; Dal-soren et al., 2009; Eyring et al., 2010). Diesel particles fromships and secondary aerosol from the oxidation of NO2 andSO2 are shown to be related to 50–500 cancer cases, 750asthma attacks and 29 premature deaths per million peoplewithin 15 miles of the port and influence the air quality inreceptor sites far away from the coast (Corbett et al., 2007;Linder et al., 2008).
The Little Rock/North Little Rock Metropolitan StatisticalArea (MSA) is a region on the western edge of the south-ern Mississippi Valley with a population of approximately700,000. 24 h PM2.5 levels varied from 1 to 54 µg m−3
over the past 10 years, with annual PM2.5 from 11.4 to12.6 µg m−3 in 2010. According to the 2008 EnvironmentalProtection Agency National Emission Inventory, the high-est contributing source to air pollution was prescribed fires(1.076 tons yr−1), followed by road dust (617 tons yr−1); in-dustrial and mobile sources emitted 100 and 300 tons yr−1,respectively (US EPA, 2012b). Winds were typically fromthe northwest and south/southeast of the Gulf of Mexico, en-abling the transport of particles and its precursors from sev-eral regions with diverse characteristics. The objectives were:(i) to apportion the contributions of sources to fine partic-ulate matter in central Arkansas using positive matrix fac-torization; (ii) to assess the annual trends of PM2.5 and itssources; and (iii) to identify and quantify the impacts of re-gions to fine particle mass and its sources using the trajectoryresidence time regression analysis. The latter was previouslyapplied to assess the influences of source regions to sulfateconcentrations in continental background sites (Gerbhart etal., 2001; 2006; Xu et al., 2006) and black carbon in Arc-tic (Huang et al., 2010). Here, we applied this approach onphysico-chemically active mixtures of fine particles from dif-ferent types of sources (local and regional) in an urban area.
2 Methods
2.1 Sampling site and measurements
The concentrations of PM2.5 mass and chemical species mea-sured at the NCore site in North Little Rock (EPA AIRSID: 051190007; Lat.: N 34.756072; Long.: W 92.281139)for the 2002–2010 period were retrieved from US Environ-mental Protection Agency’s Air Quality System (AQS). TheNCore network (previously known as PM2.5 Chemical Spe-ciaton Network) is comprised of 63 urban sites and 18 ru-ral sites across the US. In each site, 1 h and 24 h PM2.5mass, 24-h PM10−2.5 mass, PM2.5 chemical speciation, NOx,NOy, O3, SO2, CO were measured. Filter sampling was doneonce every three days, using a four channel speciation sam-pler (Demokritou et al., 2001). Elements (from Na to U)were measured by X-ray fluorescence spectroscopy, water-soluble ions (sulfate, nitrate, chloride, ammonium, sodium,potassium, calcium and magnesium) by ion chromatography,atomic absorption and colorimetry. Elemental, four fractionsof organic carbon (evolved from ambient to 140◦C for OC1(volatile), from 140◦C to 280◦C for OC2 (semivolatile),from 280◦C to 480◦C for OC3 (nonvolatile) and from480◦C to 580◦C for OC4 (non volatile)) and carbonate car-bon were measured by the thermal optical reflectance (TOR)method using EPA’s laboratory standard operating protocols(http://www.epa.gov/ttn/amtic/specsop.html).
In Little Rock, the NCore site is located in a park adja-cent to the intersection of Pike Avenue and River Road inNorth Little Rock, AR by the Arkansas River. The annualaverage daily traffic (AADT) on these two roads is very lim-ited (no estimates are provided by Arkansas State Highwayand Transportation Department). The streets with the highestAADT are W. Riverfront Dr and W. Broadway St with 5000and 12 000 vehicles/day, respectively (ASHTD, 2011). Thesite is classified as commercial/neighborhood by EPA.
2.2 Positive matrix factorization
In PMF (positive matrix factorization), the concentrations ofm-aerosol species forn-sampling days are described by thesum of the product of the source contribution (G(nxp)) andthe source profile matrix (F (pxm)) wherep is the number ofsources and the residual component (E(nxm)) (Paatero andTapper, 1994; Paatero, 1997) (Eq. 1) through a solution thatminimizes the objective function (Q in Eq. 2) based on mea-surements uncertainties:
X(nxm) = G(nxp) × F(pxm) + E(nxm) (1)
Q =
∑n
i
∑m
k=1
[xik −
∑mk=1(gik × fkj )
σij
,
](2)
wherexij andσij are the concentration and associated un-certainty ofj -species ini-sample,gik is the contribution ofthek-factor to particle mass ini-sample, andfkj is the mass
Atmos. Chem. Phys., 13, 3721–3732, 2013 www.atmos-chem-phys.net/13/3721/2013/
M.-C. Chalbot et al.: Significance of emissions from sources in the Gulf of Mexico coast 3723
25
1
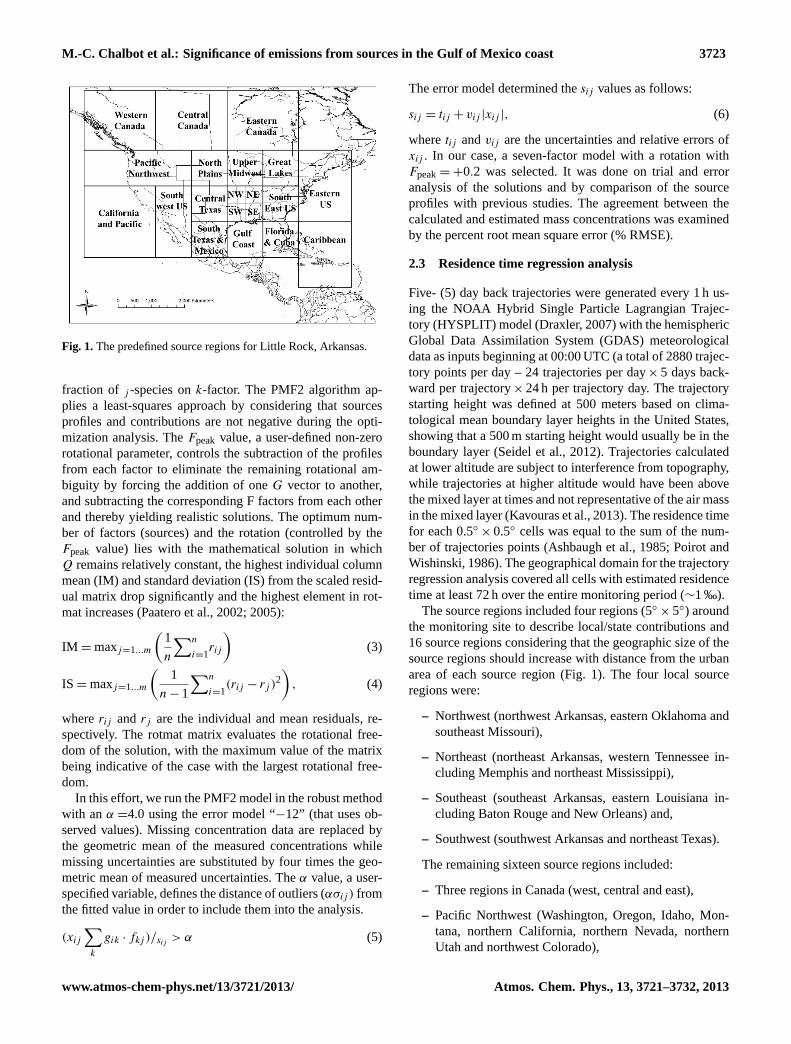
Figure 1. The predefined source regions for Little Rock, Arkansas. 2
Fig. 1.The predefined source regions for Little Rock, Arkansas.
fraction of j -species onk-factor. The PMF2 algorithm ap-plies a least-squares approach by considering that sourcesprofiles and contributions are not negative during the opti-mization analysis. TheFpeak value, a user-defined non-zerorotational parameter, controls the subtraction of the profilesfrom each factor to eliminate the remaining rotational am-biguity by forcing the addition of oneG vector to another,and subtracting the corresponding F factors from each otherand thereby yielding realistic solutions. The optimum num-ber of factors (sources) and the rotation (controlled by theFpeak value) lies with the mathematical solution in whichQ remains relatively constant, the highest individual columnmean (IM) and standard deviation (IS) from the scaled resid-ual matrix drop significantly and the highest element in rot-mat increases (Paatero et al., 2002; 2005):
IM = maxj=1...m
(1
n
∑n
i=1rij
)(3)
IS = maxj=1...m
(1
n − 1
∑n
i=1(rij − rj )
2)
, (4)
whererij andrj are the individual and mean residuals, re-spectively. The rotmat matrix evaluates the rotational free-dom of the solution, with the maximum value of the matrixbeing indicative of the case with the largest rotational free-dom.
In this effort, we run the PMF2 model in the robust methodwith anα =4.0 using the error model “−12” (that uses ob-served values). Missing concentration data are replaced bythe geometric mean of the measured concentrations whilemissing uncertainties are substituted by four times the geo-metric mean of measured uncertainties. Theα value, a user-specified variable, defines the distance of outliers (ασij ) fromthe fitted value in order to include them into the analysis.
(xij
∑k
gik · fkj )/sij > α (5)
The error model determined thesij values as follows:
sij = tij + vij |xij |, (6)
wheretij andvij are the uncertainties and relative errors ofxij . In our case, a seven-factor model with a rotation withFpeak= +0.2 was selected. It was done on trial and erroranalysis of the solutions and by comparison of the sourceprofiles with previous studies. The agreement between thecalculated and estimated mass concentrations was examinedby the percent root mean square error (% RMSE).
2.3 Residence time regression analysis
Five- (5) day back trajectories were generated every 1 h us-ing the NOAA Hybrid Single Particle Lagrangian Trajec-tory (HYSPLIT) model (Draxler, 2007) with the hemisphericGlobal Data Assimilation System (GDAS) meteorologicaldata as inputs beginning at 00:00 UTC (a total of 2880 trajec-tory points per day – 24 trajectories per day× 5 days back-ward per trajectory× 24 h per trajectory day. The trajectorystarting height was defined at 500 meters based on clima-tological mean boundary layer heights in the United States,showing that a 500 m starting height would usually be in theboundary layer (Seidel et al., 2012). Trajectories calculatedat lower altitude are subject to interference from topography,while trajectories at higher altitude would have been abovethe mixed layer at times and not representative of the air massin the mixed layer (Kavouras et al., 2013). The residence timefor each 0.5◦ × 0.5◦ cells was equal to the sum of the num-ber of trajectories points (Ashbaugh et al., 1985; Poirot andWishinski, 1986). The geographical domain for the trajectoryregression analysis covered all cells with estimated residencetime at least 72 h over the entire monitoring period (∼1 ‰).
The source regions included four regions (5◦× 5◦) around
the monitoring site to describe local/state contributions and16 source regions considering that the geographic size of thesource regions should increase with distance from the urbanarea of each source region (Fig. 1). The four local sourceregions were:
– Northwest (northwest Arkansas, eastern Oklahoma andsoutheast Missouri),
– Northeast (northeast Arkansas, western Tennessee in-cluding Memphis and northeast Mississippi),
– Southeast (southeast Arkansas, eastern Louisiana in-cluding Baton Rouge and New Orleans) and,
– Southwest (southwest Arkansas and northeast Texas).
The remaining sixteen source regions included:
– Three regions in Canada (west, central and east),
– Pacific Northwest (Washington, Oregon, Idaho, Mon-tana, northern California, northern Nevada, northernUtah and northwest Colorado),
www.atmos-chem-phys.net/13/3721/2013/ Atmos. Chem. Phys., 13, 3721–3732, 2013
3724 M.-C. Chalbot et al.: Significance of emissions from sources in the Gulf of Mexico coast
– California and Pacific (Southern California and south-ern Nevada),
– Southwest US (Arizona, southern Utah, western NewMexico and northwest Mexico),
– North Plains (North Dakota, South Dakota, Nebraskaand northeast Colorado),
– Central Texas (eastern New Mexico and central Texasincluding all the urban areas except Houston, Oklahomaand Kansas),
– Southern Texas and northeast Mexico,
– Upper Midwest (Minnesota, Wisconsin, Illinois andnorthern Missouri),
– Gulf Coast (eastern Texas including Houston, southernLouisiana), Great Lakes (Indiana, Ohio and Michigan),
– Southeast US (Kentucky, Tenneessee, Alabama, Geor-gia, South Carolina, western Virginia and western NorthCarolina),
– Florida and Cuba, Eastern US (New England, Pennsyl-vania, eastern Virginia and eastern North Carolina) and,
– Caribbean Sea (Puerto Rico and Bahamas).
Because of the definition of the local regions, the impact ofsources within the Little Rock/North Little Rock metropoli-tan area cannot be separated from the sources within thestate. The definition of a region encompassing Little Rock(e.g. 100× 100 km centered at the site) would only add a sig-nificant amount of ambiguity to the model because every sin-gle trajectory ends at the site, thus the residence time wouldbe the same.
The time that an air mass spent over these source regionswas computed by summing the residence times of cells thatfell within each region. The relationship between particlemass concentrations (yi , in µg m−3) and the time that airspends over each region (tj , in hours) was determined usingthe Tracer Mass Balance (TrMB) model (Eq. 7) (Pitchfordand Pitchford, 1985; Green et al., 2003; Xu et al., 2006):
yi = α +
∑20
j=1Cj = α +
∑20
j=1tjβj = α +
∑20
j=1((Q · T · E)j · tj ),(7)
whereCj (in µg m−3) is the contribution ofj -source regionon i-sample,βj (in (µg(m−3 h)) are the regression coeffi-cients of the regions describing the combined outcome ofemissions from the area (Qj ); aging and pollutants removeddue to gravitational settling, turbulent mix-out, and wet de-position during transport to the receptor site (Tj ); and theentrainment of particles from thej -sources to describe thedissociation between the trajectory and the transport (Ej ).The units of theQ,T andE factors were in µg(m−3 h) within
the region. The intercept,α, accounts for contributions fromsource regions outside the study domain. We estimated thesource contributions by running the TrMB model with andwithout the intercept. In our study, we included all cells inwhich the air masses spent at least 72 hours over the studyperiod; thus contributions from sources outside the regionsdescribed above may be negligible. Xu et al. (2006) showedthat the computed contributions using the TrMB approachwith and without the intercept are statistically insignificantand they represent the upper and lower estimates of the con-tributions, respectively.
3 Results and discussion
3.1 Types of fine aerosol
Table 1 shows the values of concentration diagnostic ratiosand the types of PM2.5 aerosol in Little Rock for the 2002–2010 period. Sulfur (S) was present as sulfate (SO2−
4 ) withsulfate-to-sulfur ratio of 3.59 ±0.35. The NH+
4 /SO2−
4 mo-lar ratio (2.06± 0.04) suggested that sulfate aerosols were inammonium sulfate ((NH4)2SO4) form (Malm et al., 2002).The OC/EC ratios (6.12± 2.11) indicated a mixture of pri-mary and secondary organic aerosol from various sources.OC/EC values lower than 1.1 were indicative of primary traf-fic emissions, while OC/EC values higher than 2.0 have beenobserved for coal and biomass combustion as well as sec-ondary organic aerosol (Cachier et al., 1989; Chow et al.,1996; Watson et al., 2001; Turpin and Lim, 2001). Solublepotassium (K+) accounted for 72 % of total K suggestingthe significant impact of biomass burning emissions. Saltsin soil also contributed about 20 % of K+. Ratios of Al/Si(0.48± 0.03) K/Fe (1.06± 0.06) and Al/Ca (1.76± 0.07)were comparable to those determined for samples collectedat the Interagency Monitoring of Protected Visibility En-vironments (IMPROVE) sites in the Midwest and easternUnited States (Hand et al., 2012).
The IMPROVE mass reconstruction scheme was appliedto reconstruct aerosol mass into four major species, namelysecondary inorganic, organic, light-absorbing carbon, andsoil (Eqs. 8–11) (Sisler 2000):
Reconstructed PM= [EC] + [OM] + [Secondary Inorganic] + [Soil] (8)
where[OM] = 1.6 · [OC] (9)
[Secondary Inorganic] = 1.29· [NO−
3 ] + 0.944· [NH+
4 ] + 1.02· [SO2−
4 ] (10)
[Soil] = 2.2 · [Al ] + 2.49· [Si] + 1.63· [Ca] + 2.42· [Fe] + 1.94· [Ti] (11)
where [EC], [OC], [NO−
3 ], [NH+
4 ], [SO2−
4 ], [Al], [Si], [Ca],[Fe] and [Ti] are the elemental carbon, organic carbon, ni-trate, ammonium, sulfate, aluminum, silica, calcium, iron
Atmos. Chem. Phys., 13, 3721–3732, 2013 www.atmos-chem-phys.net/13/3721/2013/
M.-C. Chalbot et al.: Significance of emissions from sources in the Gulf of Mexico coast 3725
and titanium concentrations (in µg m−3), respectively. Ni-trate may also be associated with coarse particles from neu-tralization of gas phase nitric acid with sea salt or calciumcarbonate. This was typically observed in the western US(Malm et al., 2007). Organic carbon to organic mass (OC-to-OM) conversion factors varied from 1.7± 0.2 in IMPROVEbackground sites to 2.1± 0.2 for rural PM2.5 aerosol to re-flect the presence of oxygenated functional organic com-pounds formed during transport (Turpin and Lim, 2001;Malm and Hand, 2007). We assumed an OC-to-OM conver-sion factor of 1.6 which is typically used for urban PM2.5atmospheric aerosol (Turpin and Lim, 2001). Soil mass con-centration [SOIL] was estimated as the sum of the elementspresent in the soil as oxides. Carbonaceous aerosol (OMand EC) accounted for 56 % of PM2.5 mass with OM be-ing the abundant component. Sulfate represented 29 % ofPM2.5 mass, while nitrate and mineral dust contributed ap-proximately 8 % and 7 %, respectively.
3.2 Sources of fine aerosol
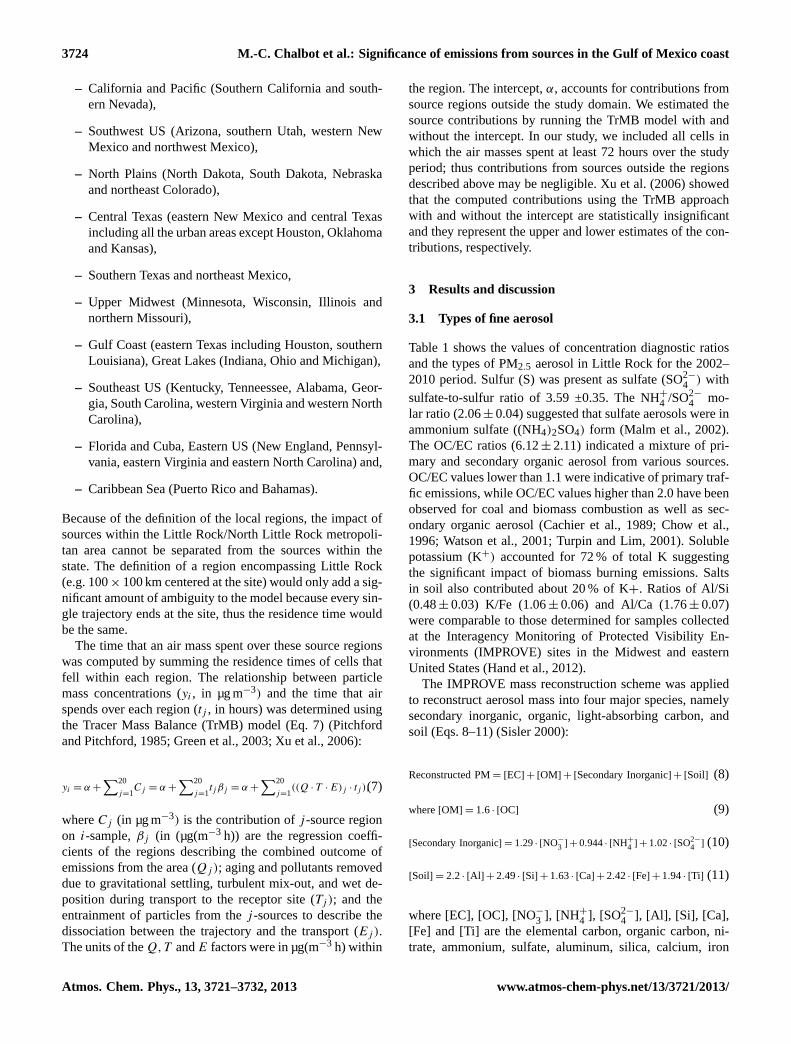
The good agreement between measured PM2.5 and predicted(using the seven-factor PMF model) PM2.5 mass concentra-tions (slope of 0.84± 0.02, an intercept of 0.8± 0.3 µg m−3
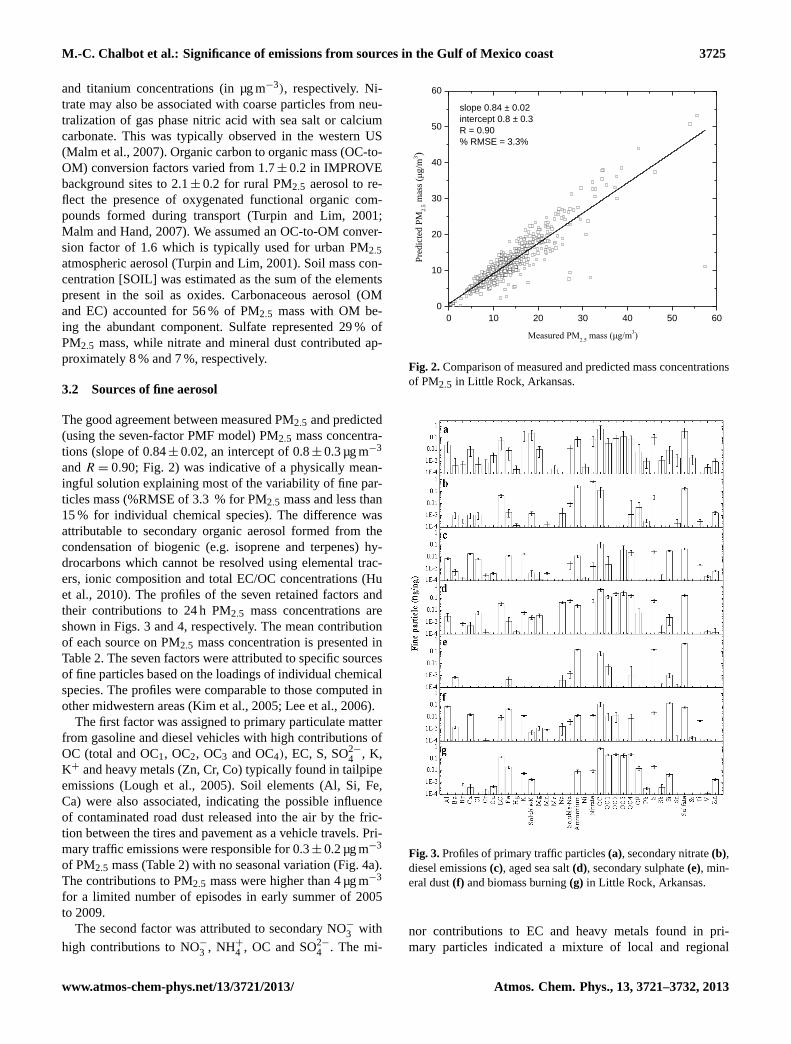
andR = 0.90; Fig. 2) was indicative of a physically mean-ingful solution explaining most of the variability of fine par-ticles mass (%RMSE of 3.3 % for PM2.5 mass and less than15 % for individual chemical species). The difference wasattributable to secondary organic aerosol formed from thecondensation of biogenic (e.g. isoprene and terpenes) hy-drocarbons which cannot be resolved using elemental trac-ers, ionic composition and total EC/OC concentrations (Huet al., 2010). The profiles of the seven retained factors andtheir contributions to 24 h PM2.5 mass concentrations areshown in Figs. 3 and 4, respectively. The mean contributionof each source on PM2.5 mass concentration is presented inTable 2. The seven factors were attributed to specific sourcesof fine particles based on the loadings of individual chemicalspecies. The profiles were comparable to those computed inother midwestern areas (Kim et al., 2005; Lee et al., 2006).
The first factor was assigned to primary particulate matterfrom gasoline and diesel vehicles with high contributions ofOC (total and OC1, OC2, OC3 and OC4), EC, S, SO2−
4 , K,K+ and heavy metals (Zn, Cr, Co) typically found in tailpipeemissions (Lough et al., 2005). Soil elements (Al, Si, Fe,Ca) were also associated, indicating the possible influenceof contaminated road dust released into the air by the fric-tion between the tires and pavement as a vehicle travels. Pri-mary traffic emissions were responsible for 0.3± 0.2 µg m−3
of PM2.5 mass (Table 2) with no seasonal variation (Fig. 4a).The contributions to PM2.5 mass were higher than 4 µg m−3
for a limited number of episodes in early summer of 2005to 2009.
The second factor was attributed to secondary NO−
3 withhigh contributions to NO−3 , NH+
4 , OC and SO2−
4 . The mi-
26
1
Figure 2. Comparison of measured and predicted mass concentrations of PM2.5 in Little 2
Rock, Arkansas. 3
4
0 10 20 30 40 50 60
0
10
20
30
40
50
60
Pre
dic
ted
PM
2.5 m
ass
(μg
/m3)
Measured PM2.5
mass (μg/m3)
slope 0.84 ± 0.02
intercept 0.8 ± 0.3
R = 0.90
% RMSE = 3.3%
Fig. 2.Comparison of measured and predicted mass concentrationsof PM2.5 in Little Rock, Arkansas.
27
1
Figure 3. Profiles of primary traffic particles (a), secondary nitrate (b), diesel emissions (c), 2
aged sea salt (d), secondary sulphate (e), mineral dust (f) and biomass burning (g) in Little 3
Rock, Arkansas. 4
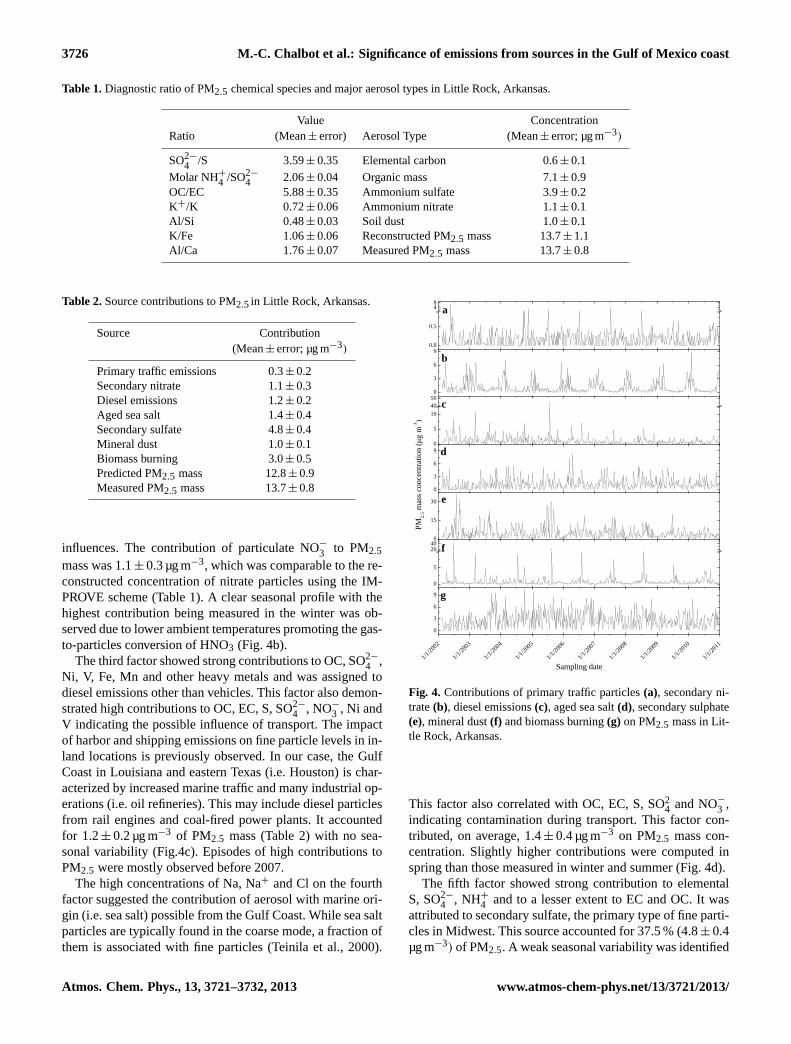
Fig. 3.Profiles of primary traffic particles(a), secondary nitrate(b),diesel emissions(c), aged sea salt(d), secondary sulphate(e), min-eral dust(f) and biomass burning(g) in Little Rock, Arkansas.
nor contributions to EC and heavy metals found in pri-mary particles indicated a mixture of local and regional
www.atmos-chem-phys.net/13/3721/2013/ Atmos. Chem. Phys., 13, 3721–3732, 2013
3726 M.-C. Chalbot et al.: Significance of emissions from sources in the Gulf of Mexico coast
Table 1.Diagnostic ratio of PM2.5 chemical species and major aerosol types in Little Rock, Arkansas.
Value ConcentrationRatio (Mean± error) Aerosol Type (Mean± error; µg m−3)
SO2−
4 /S 3.59± 0.35 Elemental carbon 0.6± 0.1
Molar NH+
4 /SO2−
4 2.06± 0.04 Organic mass 7.1± 0.9OC/EC 5.88± 0.35 Ammonium sulfate 3.9± 0.2K+/K 0.72± 0.06 Ammonium nitrate 1.1± 0.1Al/Si 0.48± 0.03 Soil dust 1.0± 0.1K/Fe 1.06± 0.06 Reconstructed PM2.5 mass 13.7± 1.1Al/Ca 1.76± 0.07 Measured PM2.5 mass 13.7± 0.8
Table 2.Source contributions to PM2.5 in Little Rock, Arkansas.
Source Contribution(Mean± error; µg m−3)
Primary traffic emissions 0.3± 0.2Secondary nitrate 1.1± 0.3Diesel emissions 1.2± 0.2Aged sea salt 1.4± 0.4Secondary sulfate 4.8± 0.4Mineral dust 1.0± 0.1Biomass burning 3.0± 0.5Predicted PM2.5 mass 12.8± 0.9Measured PM2.5 mass 13.7± 0.8
influences. The contribution of particulate NO−
3 to PM2.5
mass was 1.1± 0.3 µg m−3, which was comparable to the re-constructed concentration of nitrate particles using the IM-PROVE scheme (Table 1). A clear seasonal profile with thehighest contribution being measured in the winter was ob-served due to lower ambient temperatures promoting the gas-to-particles conversion of HNO3 (Fig. 4b).
The third factor showed strong contributions to OC, SO2−
4 ,Ni, V, Fe, Mn and other heavy metals and was assigned todiesel emissions other than vehicles. This factor also demon-strated high contributions to OC, EC, S, SO2−
4 , NO−
3 , Ni andV indicating the possible influence of transport. The impactof harbor and shipping emissions on fine particle levels in in-land locations is previously observed. In our case, the GulfCoast in Louisiana and eastern Texas (i.e. Houston) is char-acterized by increased marine traffic and many industrial op-erations (i.e. oil refineries). This may include diesel particlesfrom rail engines and coal-fired power plants. It accountedfor 1.2± 0.2 µg m−3 of PM2.5 mass (Table 2) with no sea-sonal variability (Fig.4c). Episodes of high contributions toPM2.5 were mostly observed before 2007.
The high concentrations of Na, Na+ and Cl on the fourthfactor suggested the contribution of aerosol with marine ori-gin (i.e. sea salt) possible from the Gulf Coast. While sea saltparticles are typically found in the coarse mode, a fraction ofthem is associated with fine particles (Teinila et al., 2000).
28
1
Figure 4. Contributions of primary traffic particles (a), secondary nitrate (b), diesel emissions 2
(c), aged sea salt (d), secondary sulphate (e), mineral dust (f) and biomass burning (g) on 3
PM2.5 mass in Little Rock, Arkansas. 4
0.0
0.5
48
0
3
6
9
0
5
10
40
50
0
3
6
9
0
15
30
0
5
2040
1/1/
2002
1/1/
2003
1/1/
2004
1/1/
2005
1/1/
2006
1/1/
2007
1/1/
2008
1/1/
2009
1/1/
2010
1/1/
2011
0
3
6
9
b
a
g
f
e
d
c
PM
2.5 m
ass
con
cen
trat
ion
(μ
g m
-3)
Sampling date
Fig. 4. Contributions of primary traffic particles(a), secondary ni-trate(b), diesel emissions(c), aged sea salt(d), secondary sulphate(e), mineral dust(f) and biomass burning(g) on PM2.5 mass in Lit-tle Rock, Arkansas.
This factor also correlated with OC, EC, S, SO24 and NO−
3 ,indicating contamination during transport. This factor con-tributed, on average, 1.4± 0.4 µg m−3 on PM2.5 mass con-centration. Slightly higher contributions were computed inspring than those measured in winter and summer (Fig. 4d).
The fifth factor showed strong contribution to elementalS, SO2−
4 , NH+
4 and to a lesser extent to EC and OC. It wasattributed to secondary sulfate, the primary type of fine parti-cles in Midwest. This source accounted for 37.5 % (4.8± 0.4µg m−3) of PM2.5. A weak seasonal variability was identified
Atmos. Chem. Phys., 13, 3721–3732, 2013 www.atmos-chem-phys.net/13/3721/2013/
M.-C. Chalbot et al.: Significance of emissions from sources in the Gulf of Mexico coast 3727
Table 3.Absolute and relative (to 2002) annual trends for PM2.5 and source contributions in Little Rock, Arkansas.
Component/Source Trend % Trendp-value(µg m−3 per yr) per year
PM2.5 mass –0.4 –2.9 % 0.000Primary traffic emissions −0.01 −3.4 % 0.254Secondary nitrate −0.09 −7.0 % 0.000Diesel emissions −0.11 −7.1 % 0.001Aged sea salt 0.03 3.9 % 0.123Secondary sulfate −0.20 −3.4 % 0.001Mineral dust −0.01 −0.8 % 0.610Biomass burning −0.02 −1.2 % 0.529
29
1
Figure 5. Annual variation of PM2.5 from biomass burning in Little Rock, Arkansas and burnt 2
area by wildfires in the USA for the 2002-2010 period. 3
4
2002 2003 2004 2005 2006 2007 2008 2009 2010
0.5
1.0
1.5
2.0
2.5
3.0
3.5
4.0
4.5
5.0
Burnt area
Biomass burning
Fitting of biomass burning
50% Prediction bands
Date
Bio
mass b
urn
ing c
ontr
ibution (
μg/m
3)
3000
4000
5000
6000
7000
8000
9000
10000
Burn
ed a
rea b
y f
ires (
10
3 a
cre
s)
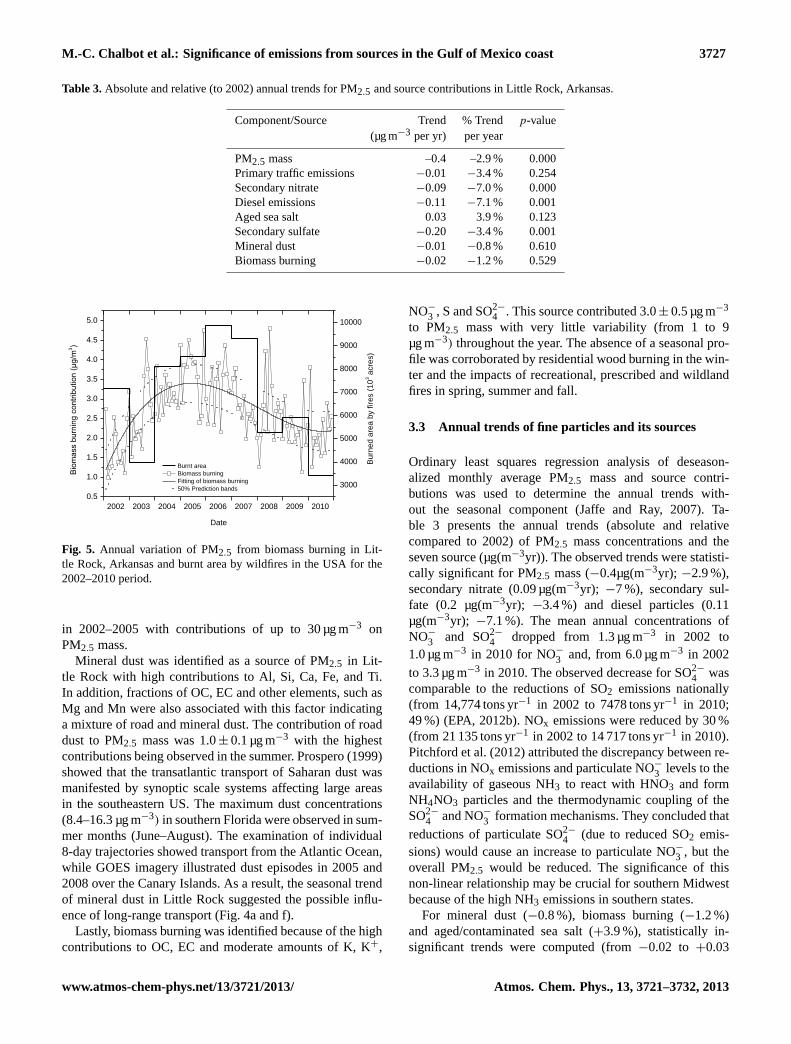
Fig. 5. Annual variation of PM2.5 from biomass burning in Lit-tle Rock, Arkansas and burnt area by wildfires in the USA for the2002–2010 period.
in 2002–2005 with contributions of up to 30 µg m−3 onPM2.5 mass.
Mineral dust was identified as a source of PM2.5 in Lit-tle Rock with high contributions to Al, Si, Ca, Fe, and Ti.In addition, fractions of OC, EC and other elements, such asMg and Mn were also associated with this factor indicatinga mixture of road and mineral dust. The contribution of roaddust to PM2.5 mass was 1.0± 0.1 µg m−3 with the highestcontributions being observed in the summer. Prospero (1999)showed that the transatlantic transport of Saharan dust wasmanifested by synoptic scale systems affecting large areasin the southeastern US. The maximum dust concentrations(8.4–16.3 µg m−3) in southern Florida were observed in sum-mer months (June–August). The examination of individual8-day trajectories showed transport from the Atlantic Ocean,while GOES imagery illustrated dust episodes in 2005 and2008 over the Canary Islands. As a result, the seasonal trendof mineral dust in Little Rock suggested the possible influ-ence of long-range transport (Fig. 4a and f).
Lastly, biomass burning was identified because of the highcontributions to OC, EC and moderate amounts of K, K+,
NO−
3 , S and SO2−
4 . This source contributed 3.0± 0.5 µg m−3
to PM2.5 mass with very little variability (from 1 to 9µg m−3) throughout the year. The absence of a seasonal pro-file was corroborated by residential wood burning in the win-ter and the impacts of recreational, prescribed and wildlandfires in spring, summer and fall.
3.3 Annual trends of fine particles and its sources
Ordinary least squares regression analysis of deseason-alized monthly average PM2.5 mass and source contri-butions was used to determine the annual trends with-out the seasonal component (Jaffe and Ray, 2007). Ta-ble 3 presents the annual trends (absolute and relativecompared to 2002) of PM2.5 mass concentrations and theseven source (µg(m−3yr)). The observed trends were statisti-cally significant for PM2.5 mass (−0.4µg(m−3yr); −2.9 %),secondary nitrate (0.09 µg(m−3yr); −7 %), secondary sul-fate (0.2 µg(m−3yr); −3.4 %) and diesel particles (0.11µg(m−3yr); −7.1 %). The mean annual concentrations ofNO−
3 and SO2−
4 dropped from 1.3 µg m−3 in 2002 to1.0 µg m−3 in 2010 for NO−
3 and, from 6.0 µg m−3 in 2002to 3.3 µg m−3 in 2010. The observed decrease for SO2−
4 wascomparable to the reductions of SO2 emissions nationally(from 14,774 tons yr−1 in 2002 to 7478 tons yr−1 in 2010;49 %) (EPA, 2012b). NOx emissions were reduced by 30 %(from 21 135 tons yr−1 in 2002 to 14 717 tons yr−1 in 2010).Pitchford et al. (2012) attributed the discrepancy between re-ductions in NOx emissions and particulate NO−
3 levels to theavailability of gaseous NH3 to react with HNO3 and formNH4NO3 particles and the thermodynamic coupling of theSO2−
4 and NO−
3 formation mechanisms. They concluded thatreductions of particulate SO2−
4 (due to reduced SO2 emis-sions) would cause an increase to particulate NO−
3 , but theoverall PM2.5 would be reduced. The significance of thisnon-linear relationship may be crucial for southern Midwestbecause of the high NH3 emissions in southern states.
For mineral dust (−0.8 %), biomass burning (−1.2 %)and aged/contaminated sea salt (+3.9 %), statistically in-significant trends were computed (from−0.02 to +0.03
www.atmos-chem-phys.net/13/3721/2013/ Atmos. Chem. Phys., 13, 3721–3732, 2013

3728 M.-C. Chalbot et al.: Significance of emissions from sources in the Gulf of Mexico coast
Fig. 6. Percentage of time the air mass parcel is in a horizontal grid cell (0.5◦× 0.5◦) using backward trajectories at 500 m in winter(a),
spring(b), summer(c) and fall(d).
µg(m−3yr)), because these sources may be influenced byweather patterns and climatology. Figure 5 illustrates themonthly contributions of biomass burning to PM2.5 (and fit-ting) and the area burnt (in acres) by wildland fires in theUS (data obtained from the National Interagency Fire Center)during the 2002–2010 period. While episodic high contribu-tions from biomass burning were also computed for yearswith reduced burned areas by wildfires (2003 and 2009 inFig. 5), on average, the trend of biomass contributions wascomparable to that of the burned areas by fires in the US.During the 2004–2007 period, wildfires burned more than 8million acres per year in the US as compared to less than5 million acres in 2003 and 2008. This increase was par-tially attributed to sequencing of El Nino events (wet) andLa Nina events (dry) by promoting the growth of fuels andthe subsequently dry them out over a period of years (Crim-mins and Comrie, 2004; Littell et al., 2009). During the studyperiod, four El Nino and two La Nina events were identi-fied. Weak El Nino events were observed in 2004 and 2006
and moderate El Nino events were identified in 2002 and2009. In these climate events, the equatorial Pacific Oceanis warmer than usual, altering the weather conditions aroundthe world. These conditions favored larger and destructivewildfires around the country. On the contrary, the colderEquatorial Pacific in La Nina events facilitates colder thannormal conditions in northwest US and warmer than normalin southeast US, reducing the fire risks years (Crimmins andComrie, 2004; Littell et al., 2009).
3.4 Regional contributions
Figure 6 shows the spatial variation of residence times inwinter, spring, summer and fall. These maps show clearseasonal differences between air masses near the ground.More specifically, winter trajectories originated often fromnorth/northwest over the upper Midwest, North Plains, andtraveled through the Mississippi Valley prior to their ar-rival in central Arkansas. In spring and fall, trajectories
Atmos. Chem. Phys., 13, 3721–3732, 2013 www.atmos-chem-phys.net/13/3721/2013/

M.-C. Chalbot et al.: Significance of emissions from sources in the Gulf of Mexico coast 3729
31
1
Figure 7. Contributions of predefined source regions on PM2.5 mass (a), primary traffic 2
particles (b), secondary nitrate (c), diesel particles (d), aged sea salt particles (e), secondary 3
sulphate (f), mineral dust particles (g) and biomass burning particles (h) in Little Rock, 4
Arkansas. 5
0.0
2.0
-0.1
0.0
0.1
0.0
0.2
0.0
0.5
PM
2.5 m
ass
contr
ibuti
on (
μg/m
3)
0.0
0.5
0.0
0.6
1.2
0.0
0.4
West C
anada
Centr
al C
anada
East C
anada
Nort
hW
est P
acific
Nort
h P
lain
s
Upper
Mid
west
Gre
at Lakes
Easte
rn U
S
Calif
orn
ia a
nd P
acific
South
west U
S
Centr
al T
exas
Nort
hw
est 500 k
m
Nort
heast 500 k
m
South
west 500 k
m
South
east 500 k
m
South
east U
S
South
ern
Texas, M
exic
o
Gulf C
oast
Flo
rida a
nd C
uba
Cari
bbean
0.0
0.5
1.0h
Region
b
a
g
f
e
d
c
Fig. 7. Contributions of predefined source regions on PM2.5 mass(a), primary traffic particles(b), secondary nitrate(c), diesel parti-cles(d), aged sea salt particles(e), secondary sulphate(f), mineraldust particles(g) and biomass burning particles(h) in Little Rock,Arkansas.
demonstrated more local influences by spending most of theirtime in surrounding states. On the other hand, air masses inthe summer extended from northeast to south/southeast cov-ering a larger geographical area from the central midwest tothe Gulf of Mexico and Cuba and were not as influenced bytopographic restrictions. Thus, these distinctions indicatedthat air masses in winter may have substantially differentcompositional characteristics as compared to air masses forthe other seasons, and particularly in the summer.
Figure 7 shows the mean (±error) of the contributions ofeach region on PM2.5 mass and source contributions for themodels with (lower line), and without (upper line) intercept.The differences of the contributions calculated for the twomodels were negligible (and statistically insignificant within1 standard error) for NO−3 , diesel particles, SO2−
4 , mineraldust and biomass burning. Some differences were observedfor primary traffic particle and aged/contaminated sea salt;however, in these cases, the overall estimated contributionsfor specific sectors were negligible (0.2± 0.4 µg m−3). Thesesimilarities suggested that PM2.5 mass and its componentsoriginated from sources within the selected geographical do-
32
1
Figure 8. Cumulative Terra and Aqua MODIS fire and thermal anomalies generated from 2
MODIS data for the monitoring period. The size of the grid cells is 0.5o per side. 3
Fig. 8.Cumulative Terra and Aqua MODIS fire and thermal anoma-lies generated from MODIS data for the monitoring period. The sizeof the grid cells is 0.5◦ per side.
main. The four regions around the site (NW, NE, SW andSE in Fig. 1), the Gulf Coast and southeast US contributed42 % (5.6± 0.9 µg m−3), 16 % (2.1± 0.3 µg m−3) and 10 %(1.4± 0.2 µg m−3) of PM2.5 mass, with sources within thesouthwest sector being responsible for 2.1± 0.3 µg m−3 ofPM2.5. These sectors include the urban areas of Dallas inTexas, Oklahoma City in Oklahoma, Memphis in Tennesseeand Baton Rouge in Louisiana and, point sources emitted cu-mulatively 731,262 tons of PM2.5 in 2008 (48 % of nationalannual PM2.5 emissions from point sources) (EPA, 2012b).Moderate contributions from the upper Midwest (0.8± 0.2µg m−3) and central Texas (0.4± 0.2 µg m−3) were alsocomputed. The same areas were responsible for 60 % of pri-mary traffic particles followed by Pacific Northwest (16 %each).
A slightly modified spatial pattern was observed for sec-ondary nitrate particles with 35 % of that being from thesouthern sectors (SW and SE), 19 % from Pacific Northwestand 11 % from the upper Midwest. Minor contributions (3–6 %) were also computed for central Texas and the NW sec-tor. For the two sectors south of Little Rock, the increasednitrate contribution was due to the interaction of NH3-richconditions in southern Arkansas and Louisiana with air massloaded in NOx/gaseous HNO3 from metropolitan areas inTexas to form NH4NO3 (Pitchford et al., 2012). Furthermore,emissions of other agents such as soil mineral (Ca, K) andsea salt (Na, Mg) off the Gulf Coast and semi-arid areas innortheastern Texas may also neutralize HNO3and form sta-ble salts in the aerosol phase. The significant contributions ofthe Pacific Northwest and North Plains domains on NO−
3 lev-els in central Arkansas were also attributed to neutralizationof HNO3 as the air masses travel over areas (North Plains,Nebraska, Kansas, Missouri, Minnesota, Iowa) with the high-est NH3 emissions in the US and the induced formation of
www.atmos-chem-phys.net/13/3721/2013/ Atmos. Chem. Phys., 13, 3721–3732, 2013

3730 M.-C. Chalbot et al.: Significance of emissions from sources in the Gulf of Mexico coast
nitrate particles due to typically lower ambient temperaturesmeasured in northern US, as compared to those measured inthe southern Mississippi valley.
About 80 % of secondary sulfates (3.7± 0.3 µg m−3)
(SO2−
4 ) and 62 % (0.7± 0.2 µg m−3) of diesel particles(other than diesel vehicles) were allocated to the four sec-tors around the receptor site, the Gulf Coast and the south-east US. These areas include a large number of SO2 pointsources including coal-fired power plants, oil refineries, off-shore oil and natural gas platforms and ports. In 2008, thesesources accounted for 55 % of annual SO2 emissions in theUS (33 % southeast US, 8 % NW, 5 % southeast, 4 % NWand 4 % SW). Two electrical power plants are located withinArkansas, emitting approximately 68,000 tons of SO2/year(less than 1 % of all SO2 in the six regions) (one less than100 km southwest of Little Rock) (EPA, 2012b). The GulfCoast also appeared to be the primary regional contributorfor sea salt (25 %; 0.3± 0.2 µg m−3) and mineral dust (55 %,0.4± 0.1 µg m−3). The area of the Gulf Coast includes thir-teen of the twenty busiest ports in the US, with Houston andNew Orleans being among the top five (US Army of Engi-neers, 2010). Marine traffic within 400 km from the landin the western Gulf Coast ranks among the top five busiestareas in the world (more than 1/3 of vessel calls in the USmostly (∼60 %) from tanker and container ships) (Ward andGallagher, 2010). These ships used oil with high sulfur con-tent from 5 to 4500 ppm. The Gulf Coast region also includesapproximately 3000 oil and natural gas platforms producingmore than half of crude oil and natural gas production in theUS. These platforms emit minor quantities of SO2 (less than0.1 % of national SO2 emissions) but up to 1.5 % and 5.3 %of national NOx and VOCs emissions.
Approximately 45 % (1.3± 0.2 µg m−3) of biomass burn-ing originated from the eastern (NE and SE) and SW sec-tors followed by Gulf Coast (9 %, 0.3± 0.1 µg m−3) andsoutheast US (8 %, 0.2 ±0.1 µg m−3). In these regions, mostof the emissions are from residential wood-burning, recre-ational, agricultural and prescribed burns. Large fires are in-frequently observed mostly in years with prolonged droughtconditions. The combined contribution of the Pacific North-west, North Plains and upper Midwest accounted for 20 % ofbiomass burning emissions (0.6± 0.2 µg m−3), mostly fromlarge wildfires in Colorado Rockies forests and agriculturalfires. Figure 8 shows the cumulative data of thermal anoma-lies caused by fire incidents as they were detected by Terraand Aqua MODIS satellites during the 2002–2010 period.The size of the aggregating cells is 0.25 degrees per side.These results indicated many temperature anomalies east andsouth of the receptor site and in southern Alabama and Geor-gia with weak/moderate thermal signatures which are typ-ical of small-scale prescribed, agricultural and recreationalburns. In addition, a smaller number of temperature anoma-lies associated with higher temperatures were observed inKansas, Idaho, Oregon and Washington, indicating larger,long-lasting and more intense fire events.
The spatial distribution of regional contributions to PM2.5and its sources was comparable to those modeled for theCaney Creek IMPROVE site located in southwest Arkansas.It is found that sulfate from east Texas, southeast US, andupper Midwest; nitrate from central Midwest, and east Texasas well as organic aerosol from Houston and Arkansas wereresponsible for the observed reduction of visibility (ENVI-RON, 2007).
4 Conclusions
The sources of fine particles in central Arkansas for the2002–2010 period were secondary sulfate (36 %), biomassburning (20 %), aged sea salt (10 %), diesel emissions (9 %),secondary nitrate (8 %), mineral dust (6 %), and primary par-ticulate emissions from vehicles (2 %). The remaining unex-plained fine particle mass was attributed to secondary organicaerosol. Strong seasonal variabilities were observed for ni-trate (high in the winter) and mineral dust (high in early sum-mer) and a weak seasonal profile (high in the summer) forsulfate for the 2002–2005 period. These trends were consis-tent with those observed in other urban environments and thedependence on meteorology and precursors emissions. Theabsence of seasonality of biomass burning emissions weredue to contributions from residential wood burning in winterand wildland fires for the other seasons.
Fine particle mass concentrations and the contributions ofsecondary sulfate declined by 0.4 µg m−3 and 0.2 µg m−3 peryear, which is consistent with the reductions on SO2 emis-sion from point and mobile sources. A slower declining trendwas also observed for secondary nitrate despite the signif-icant reductions of NOx emissions. This was explained bythe abundance of NH3 in the Midwest that favors the for-mation of stable forms of ammonium nitrate particles. Theannual variability of biomass burning contributions to fineparticle mass correlated very well with the burnt area by firesin the US. The impact of transport of fine particles in cen-tral Arkansas was assessed by regression against the resi-dence time of air mass in pre-defined regions. The four re-gions around the receptor site accounted for large fractionsof fine particle mass, primary traffic emission, secondary sul-fate and biomass burning. The contributions of sources in thesoutheast US and western Gulf Coast were also significant,accounting for 30 % of secondary sulfate and contaminatedsea salt particles.
In this study, we demonstrated that residence time regres-sion analysis may be successfully used to identify the im-pacts of emissions from specific regions on particle massand source contributions in urban receptor sites. Through thisanalysis, the effect of wildfires on PM2.5 was identified andthe role of meteorology and NH3 emissions was observed.In addition, the impact of shipping activities in the westernGulf of Mexico and coastal cities on fine particles was as-sessed; a region of potential interest as emissions from point
Atmos. Chem. Phys., 13, 3721–3732, 2013 www.atmos-chem-phys.net/13/3721/2013/

M.-C. Chalbot et al.: Significance of emissions from sources in the Gulf of Mexico coast 3731
(i.e. power plants) and mobile sources are decreasing whilemarine traffic and associated emissions of gaseous precursorsand particles will grow substantially.
Acknowledgements.This study was partially funded by the UAMSCenter for Diversity Affairs Arkansas Commitment Scholars.
Edited by: N. Mihalopoulos
References
ASHTD (Arkansas State Highway and Transportation Department):Annual Average Daily Traffic Estimates, 2011.
Ashbaugh, L. L., Malm, W. C., and Sadeh, W.Z.: A residence timeprobability analysis of sulfur concentrations at Grand CanyonNational Park, Atmos. Environ., 19, 1263–1270, 1985.
Brunekreef, B. and Forsberg, B.: Epidemiological evidence of ef-fects of coarse airborne particles on health, Eur. Respir. J., 26,309–318, 2005.
Brunekreef, B. and Holgate, S. T.: Air pollution and health, Lancet,360, 1233–1242, 2002.
Cachier, H., Bremond, M. P., and Buat-Menard, P.: Carbonaceousaerosols from different tropical biomass burning sources, Nature,340, 371–373, 1989.
Chow, J. C., Watson, J. G., Lu, Z., Lowenthal, D. H., Frazier, C.A., Solomon, P. A., and Thuillier, R. H.: Descriptive analysis ofPM2.5 and PM10 at regionally representative locations during 25SJVAQS/AUSPEX, Atmos. Environ., 30, 2079–2112, 1996.
Corbett, J. J. and Koehler, H. W.: Updated emissions fromocean shipping, J. Geophys. Res.-Atmos., 108, 4650,doi:10.1029/2003JD003751, 2003.
Corbett, J. J., Winebrake, J. J., Green, E. H., Kasibhatla, P., Eyring,V., and Lauer, A.: Mortality from ship emissions: A global as-sessment, Environ. Sci. Technol., 41, 8512–8518, 2007.
Crimmins, M. and Comrie, A.: Wildfire-climate interactions acrosssoutheast Arizona, Int. J. Wildland Fire, 13, 455–466, 2004.
Dalsøren, S. B., Eide, M. S., Endresen, Ø., Mjelde, A., Gravir, G.,and Isaksen, I. S. A.: Update on emissions and environmental im-pacts from the international fleet of ships: the contribution frommajor ship types and ports, Atmos. Chem. Phys., 9, 2171–2194,doi:10.5194/acp-9-2171-2009, 2009.
Demokritou, P., Kavouras, I. G., Harrison, D., and Koutrakis, P.: De-velopment and evaluation of an impactor for a PM2.5 speciationsampler, J. Air Waste Manag. Assoc., 51, 514–523, 2001.
Deniz, C. and Durmisoglu, Y.: Estimating shipping emissions in theregion of the Sea of Marmara, Turkey, Sci. Tot. Environ., 390,255–26, 2008.
Draxler, R. R.: Demonstration of a global modeling methodologyto determine the relative importance of local and long-distancesources, Atmos. Environ., 41, 776–789, 2007.
ENVIRON (Environ International Corporation and University ofCalifornia at Riverside): Technical Support Document for CEN-RAP Emissions and Air Quality Modeling to Support RegionalHaze State Implementation Plans, available at:http://www.dnr.mo.gov/ENV/apcp/docs/appendixf-1.pdf, 2007.
Eyring, V., Isaksen, I. S. A., Berntsen, T., Collins, W. J., Corbett,J. J., Endressen, O., Grainger, R. G., Moldanova, J., Schlager,
H., and Stevenson, D. S.: Transport impacts on atmosphere andclimate: Shipping, Atmos. Environ., 44, 4735–4771, 2010.
Gebhart, K. A., Kreidenweis, S., and Malm, W. C.: Back-trajectoryanalyses of fine particulate matter measured at Big Bend NationalPark in the historical database and the 1996 scoping study, Sci.Total Environ., 276, 185–204, 2001.
Gebhart, K. A., Schichtel, B. A., Barna, M. G., and Malm, W. C.:Quantitative back-trajectory apportionment of sources of partic-ulate sulfate at Big Bend National Park, TX, Atmos. Environ.,40, 2436–2448, 2006.
Gray, H. A., Cass, G. R., Huntzicker, J. J., Heyerdahl, E. K., andRau, J. A.: Characteristics of atmospheric organic and elemen-tal carbon particle concentrations in Los Angeles, Environ. Sci.Technol., 20, 580–582, 1986.
Green, M., Kuhns, H., Pitchford, M., Dietz, R., Ashbaugh, L., andWatson, T.: Application of the tracer-aerosol gradient interpretivetechnique to sulfur attribution for the Big Bend Regional Aerosoland Visibility Observational Study, Air Waste Manag. Assoc., 53,586–595, 2003.
Hand, J. L., Schichtel, B. A., Pitchford, M., Malm, W. C., and Frank,N. H.: Seasonal composition of remote and urban fine particu-late matter in the United States, J. Geophys. Res.-Atmos., 117,D05209,doi:10.1028/2011JD017122, 2012.
Hu, D., Bian, Q., Lau, A. K. H., and Yu, J. Z.: Source apportion-ing of primary and secondary organic carbon in summer PM2.5in Hong Kong using positive matrix factorization of secondaryand primary organic tracer data, J. Geophys. Res.-Atmos., 115,doi:10.1029/2009JD012498, 2010.
Huang, L., Gong, S. L., Sharma, S., Lavoue, D., and Jia, C. Q.:A trajectory analysis of atmospheric transport of black carbonaerosols to Canadian high Arctic in winter and spring (1990–2005), Atmos. Chem. Phys., 10, 5065–5073,doi:10.5194/acp-10-5065-2010, 2010.
IPCC (Intergovernmental Panel on Climate Change), ClimateChange 2001: The Scientific Basis, edited by: Houghton, J. T.,Ding, Y., Griggs, D. J., Noguer, M., van der Linden, P. J., Dai,X., Maskell, K., and Johnson, C. A., Cambridge University press,New York, USA, 2001.
Jaffe, D. and Ray, J.: Increase in surface ozone at rural sites in thewestern US, Atmos. Environ., 41, 5452–5463, 2007.
Kavouras, I. G., DuBois, D. W., Etyemezian, V., and Nikolich G.:Spatiotemporal variability of ground-level ozone and influenceof smoke in Treasure Valley, Idaho, Atmos. Res., 124, 44–52,2013.
Kim, E., Hopke, P. K., Kenski, D. M., and Korber, M.: Sourcesof fine particles in a rural Midwestern US area, Environ.Sci.Technol. 39, 4953–4960, 2005.
Lee J. H., Hopket P. K., and Turner, J. R.: Source identification ofairborne PM2.5 at the St.Louis-Midwest supersite, J. Geophys.Res.-Atmos., 111, D10S10,doi:10.1029/2005JD006329, 2006.
Linder, S. H., Marko, D., and Sexton, K.: Cumulative cancer riskfrom air pollution in Houston: Disparities in risk burden and so-cial disadvantage, Environ. Sci. Technol., 42, 4312–4322, 2008.
Littell, J. S., McKenzie, D., Peterson, D. L., and Westerling, A. L.:Climate and wildfire area burned in western U.S. ecoprovinces,1916–2003, Ecol. Appl., 19, 1003–1021, 2009.
Lohmann, U. and Feichter, J.: Can the Direct and Semi-DirectAerosol Effect Compete with the Indirect Effect on a GlobalScale, Geophys. Res. Lett., 28, 159–161, 2001.
www.atmos-chem-phys.net/13/3721/2013/ Atmos. Chem. Phys., 13, 3721–3732, 2013

3732 M.-C. Chalbot et al.: Significance of emissions from sources in the Gulf of Mexico coast
Lough, G. C., Schauer, J. J., Park, J. S., Shafer, M. M., Deminter,J. T., and Weinstein J. P.: Emissions of metals associated withmotor vehicle roadways, Environ. Sci. Technol., 39, 826–836,2005.
Malm, W. C. and Hand, J. L.: An examination of thephysical and optical properties of aerosols collected inthe IMPROVE program, Atmos. Environ., 41, 3407–3427,doi:10.1016/j.atmosenv.2006.12.012, 2007.
Malm, W. C., Schichtel, B. A., Ames, R. B., and Gebhart K. A.:A 10-year spatial and temporal trend of sulfate across the UnitedStates, J. Geophys. Res., 107, 4627,doi:10.1029/2002JD002107,2002.
Malm, W. C., Schichtel, B. A., Pitchford, M. L., Ashbaugh. L. L.,and Eldred, R. A.: Spatial and monthly trends in speciated fineparticle concentration in the United States, J. Geophys. Res., 109,D03306,doi:10.1029/2003JD003739, 2004.
Malm, W. C., Pitchford, M. L., McDade, C., and Ashbaugh, L.L.: Coarse particle speciation at selected locations in the ru-ral continental United States, Atmos. Environ., 41, 2225–2239,2007.
Minguillon, M. C., Arhami, M., Schauer, J. J., and Sioutas, C.: Sea-sonal and spatial variation of sources of fine and quasi-ultrafineparticulate matter in neighborhoods near the Los Angeles-LongBeach harbor, Atmos. Environ., 42, 7317–7328, 2008.
Ostrom, E. and Noone, K. J.: Vertical profiles of aerosol scat-tering and absorption measured in-situ during the North At-lantic Aerosol Characterization Experiment (ACE-2), Tellus,52B, 526–545, 2000.
Paatero, P.: Least-squares formulation of robust non-negative factoranalysis, Chem. Intell. Lab. Syst., 23–35, 1997.
Paatero, P. and Tapper, U.: Positive Matrix Factorization: a non-negative factor model with optimal utilization of error estimatesof data values, Environmetrics, 111–126, 1994.
Paatero, P., Hopke, P. K., Song, X-H, and Ramadan, Z.: Understand-ing and controlling rotation in factor analytic models, Chem. In-tell. Lab. Syst., 60, 253–264, 2002.
Paatero, P., Hopke, P. K., Begum, B. A., and Biswas, S. K.: A graph-ical diagnostic mehod for assessing the rotation in factor analysit-cal models of atmospheric pollution, Atmos. Environ., 39, 193–201, 2005.
Peng, R. D., Dominici, F., Pastor-Barriuso, R., Zeger, S. L., andSamet J. M.: Seasonal analyses of air pollution and mortality in100 US cities, Am. J. Epidem., 161, 585–594, 2005.
Pitchford, M. and Pitchford, A.: Analysis of regional visibility in theSouthwest using principal component and back trajectory tech-niques, Atmos. Environ., 19, 1301–1316, 1985.
Pitchford, M. L., Poirot, R. L., Schichtel, B. A., and Malm, W.C.: Characterization of the winter midwestern particualte nitratebulge, J. Air Waste Manag. Assoc., 59, 1061–1069, 2012.
Poirot, R. L. and Wishinski, P. R.: Visibility, sulfate and air masshistory associated with the summertime aerosol in northern Ver-mont, Atmos. Environ., 20, 1457–1469, 1986.
Prospero, J. M.: Long-term measurements of the transport ofAfrican mineral dust to the southeastern United States: Impli-cations for regional air quality, J. Geophys. Res.-Atmos., 104,15917–15925, 1999.
Quinn, P. K and Bates, T. S.: Regional aerosol properties: Compar-ison of boundary layer measurements from ACE 1, ACE 2, Ae-orosols99, INDOEX, ACE Asia, TARFOX and NEAQS, J. Geo-phys. Res., 110, D14202,doi:10.1029/2004JD004755, 2005.
Seidel, D. J., Zhang, Y., Beljaars, A., Golaz, J.-C., Jacobson, A. R.,and Medeiros B.: Climatology of the planetary boundary layerover the continental United States and Europe, J. Geophys. Res.,117, D17106,doi:10.1029/2012JD018143, 2012.
Sisler J. F.: Aerosol mass budget and spatial distribution, in Spatialand Seasonal Pattern and Temporal Variability of Haze and itsConstitutents in the United States, Report III, edited by: Malm,W., Fort Collins, Co, 2000.
Teinila, K., Kerminen V.-M., and Hillamo, R.: A study ofsize-segregated aerosol chemistry in the Antarctic at-mosphere, J. Geophys. Res.-Atmos., 105, 3893–3904,doi:10.1029/1999JD901033, 2000.
Turpin, B. J. and Lim H. J.: Species contributions to PM2.5 massconcentrations: Revisiting common assumptions for estimatingorganic mass, Aer. Sci.Technol., 35, 602–610, 2001.
US ACE (United States Army Corps of Engineers): U.S. WaterwayData – Principal Ports of the United States, Navigation Data Cen-ter Spreadsheets, available at:http://www.ndc.iwr.usace.army.mil//data/datappor.htm, last access: October 2012, 2010.
US DOE (United States Department of Energy): Natural Gas With-drawals and Production, available at:http://www.eia.gov/dnav/pet/petcrd crpdnadcmbbl a.htm, last access: October 2012,2010.
US DOE (United States Department of Energy): Crude Oil Pro-duction, Available from:http://www.eia.gov/dnav/pet/petcrdcrpdnadcmbbl a.htm, last access: October 2012, 2011.
US EPA (United States Environmental Protection Agency), Officeof Air Quality Planning and Standards: Our Nation’s Air, Statusand Trends through 2010, EPA-454/R-12-001, 2012a.
US EPA (United States Environmental Protection Agency), Officeof Air Quality Planning and Standards: 2008 National Emis-sions Inventory, Version 2, available at:http://www.epa.gov/ttn/chief/net/2008neiv2/2008neiv2 tsd draft.pdf, last access: Octo-ber 2012, 2012b.
Wang, T., Ding, A. J., Blake, D. R., Zahorowski, W., Poon, C.N., and Li, Y. S.: Chemical characterization of the bound-ary layer outflow of air pollution to Hong Kong duringFebruary-April 2001, J. Geophys. Res.-Atmos., 108, 8787,doi:10.1029/2002JD003272, 2003.
Ward, K. R. and Gallagher, B.: Utilizing vessel traffic and histori-cal bathymetric data to prioritize hydrographic surveys, in: U.S.Hydro. National Ocean Service, The Hydrographic Society ofAmerica, edited by: Steve Barnum, Apr 2011, 2011.
Watson, J. G., Chow, J. C., and Houck, J. E.: PM2.5 chemical sourceprofiles for vehicle exhaust, vegetative burning, geological mate-rial, and coal burning in Northwestern Colorado during 1995,Chemosphere, 43, 1141–1151, 2001.
Xu, J., DuBois, D., Pitchford, M., Green, M., and Etyemezian, V.:Attribution of sulfate aerosols in Federal Class I areas of thewestern United States based on trajectory regression analysis,Atmos. Environ., 40, 3433–3447, 2006.
Atmos. Chem. Phys., 13, 3721–3732, 2013 www.atmos-chem-phys.net/13/3721/2013/