sorption of uranine on forest soils
TRANSCRIPT
Hydrological Research Letters 2, 32‒35 (2008)Published online in J-STAGE (www.jstage.jst.go.jp/browse/HRL). DOI: 10.3178/HRL.2.32
Abstract:
Staining substances have been widely used to visual-ize flow paths in soils, and recently dye concentrationsin soil profiles are quantified using photographs. Fluo-rescent dye Uranine is one of the promising stainingagents. The sorption properties of Uranine are needed toestablish initial concentrations in applied solutions, de-termine Uranine mobility, and model solute transport.At least 65% of Uranine adsorption on subsoils fromOkaya, Japan occurred after 1 h of shaking. Sub-sequently, equilibrium sorption was assessed for six dif-ferent forest soil samples, including topsoil, subsoil, anda buried organic-rich layer. Adsorption in all soilsamples was significantly reduced by adjusting initialsolution pH to 13. Adsorption was greater in topsoil;however, it was not significantly correlated with soilorganic matter. The buried organic-rich soil experiencedintermediate adsorption compared to topsoil and subsoilsamples. Equilibrium adsorption data for both topsoiland subsoil samples best fit the Freundlich isotherm. Insubsoils, Uranine sorption was comparable to reportedvalues for Pyranine and commonly used Brilliant BlueFCF dye, while adsorption in topsoil samples from theseforests (up to 21.7% organic matter) was significantlyhigher than reported values for agricultural soils.
KEYWORDS Tracer; staining; adsorption isotherm;preferential flow; hydrological pathways
INTRODUCTION
The hydrological community is still in search ofideal vadose zone tracer (Flury and Wai 2003). In thepure sense, such a tracer does not exist except for thewater molecule itself (K�ass 1994), but tracers must beselected for investigations of hydrological pathways de-pending on soil type, scale, methodology, and other con-siderations. One of the most popular staining agents invadose hydrology is Brilliant Blue FCF dye. Numerousadsorption studies of Brilliant Blue FCF dye have beenconducted on different soils (e.g., Ketelsen and Meyer-Windel 1999, German-Heins and Flury 2000, Mon et al.2006). Recently, concentrations of dyes have been evalu-ated to elucidate subsurface flux (Aeby et al. 1997,Forrer et al. 2000), in addition to the more traditionalassessment of stained and unstained portions of soilprofiles. In the past decade fluorescent dyes were alsoproposed as staining tracers and methods for quantify-ing tracer concentrations (Aeby et al. 2001, Vander-borght et al. 2002, Duwig et al. 2008). While suchtechniques require more complicated equipment, theyprovide better possibilities to quantify vadose zone pref-erential flow, especially in dark (Duwig et al. 2008) andheterogeneous soils where Brilliant Blue is difficult to
detect or that would require very complex calibrations.Fluorescent dye Uranine is expected to be a useful
staining tracer. However, to estimate adequate initialconcentrations and mobility of the tracer, as well asmodel the transport of solutes and correct for tracerconcentrations in the soil profile, sorption properties ofUranine must be known. Such data are lacking, asUranine has typically been used for tracing ground-water flow paths in aqufiers (K�ass 1998). Thus, theobjective of this study was to evaluate adsorption prop-erties of Uranine on forest soils (including topsoil andsubsoil), the kinetics of sorption, and the influence ofvariable pH in initial applied staining solution via aseries of batch experiments.
MATERIALS AND METHODS
Soil samples
Six different soil samples were collected from threeforested hillslopes: (1) the headwall of a landslide nearOkaya city, Nagano Prefecture; (2) Fudoji catchment inShiga Prefecture; and (3) Konohara catchment, MiePrefecture, Japan. At each site two soil types represent-ing subsoil and topsoil or a buried organic-rich (black)soil were selected: Okaya subsoil (O) and Okaya blacklayer (OB); Fudoji subsoil (F) and Fudoji topsoil (FT);and Mie subsoil (M) and Mie topsoil (MT). The buriedblack layer at Okaya is rich in organic matter (18.6%)and possibly originated from past anthropogenic prac-tices in this region. The residual soil at the Okaya site isderived from volcanic materials, with erosional proc-esses possibly contributing to deposition in the uppersoil profile. The Fudoji soil is poorly developed fromweathered granite and the Mie soil is a typical brownforest soil (Cambisol). All sample sites were located insteep forest catchments that experienced activehydrogeomorphic processes, such as landslides, surfaceerosion, and subsurface piping or preferential flow.
Soils were air-dried and passed through a 2 mmsieve. Particle size distribution was determined by drysieving (for particles > 0.075 mm) and a centrifugalparticle analyzer (for particles < 0.075 mm). Soil pH wasdetermined in a 1:2 soil-to-solution ratio (by weight) inboth water and 0.01 M CaCl2 by a Horiba pH meter.Organic carbon content was estimated by dry ashingsoil sub-samples at 550°C. Selected physical andchemical properties of the six soils are presented inTable I.
Adsorption isotherms
Initially, the calibration curve for Uranine fluores-cence in pH = 10 solution was measured to relate fluo-rescence intensities measured by a spectrofluorometerwith concentrations of Uranine in solution. This curvewas linear for a wide range of concentrations (1 �g L‒1 to
― 32―
Received 22 March 2008Accepted 22 May 2008
Sorption of Uranine on Forest Soils
Kirill M. Gerke1, Roy C. Sidle2 and Yomei Tokuda3
1Graduate School of Science, Kyoto University, Kyoto, 611-0011, Japan2Disaster Prevention Research Institute, Geohazards Division, Kyoto University, Uji, 611-0011, Japan
3Institute for Chemical Research, Kyoto University, Uji, 611-0011, Japan
Correspondence to: Kirill M. Gerke, Slope Conservation SectionGraduate School of Science of Kyoto University, Gokasho, 611-0011, Kyoto, Uji, Japan. E-mail: [email protected]. ©2008,Japan Society of Hydrology and Water Resources.
SORPTION OF URANINE ON FOREST SOILS
2 mg L‒1 ). Assuming that concentrations of Uranineapplied in field experiments are much higher and detec-tion limits in soils are likely higher than 1 �g, concentra-tions < 1 �g L‒1 were set to zero. Batch kinetic andequilibrium studies were conducted by mixing differentsolution concentrations with soil. Samples were shakenin a reciprocal shaker at 20°C for up to 48 h. All of thesolutions contained 0.01 M CaCl2 background electro-lytic solution. At least 0.5 kg of each sieved soil wasplaced in a plastic bag and carefully mixed prior toadding solution to ensure homogeneous samples. Aseries of experiments with the same mixing ratioyielded negligible differences in sorption indicating thatthe sample preparation procedure was satisfactory.Preliminary experiments with mixed 1:1 and 1:2 solu-tion-soil weight ratios showed no differences in results.For kinetic studies, 30 samples were prepared bymixing 10 g of dry soil from Okaya with 20 mL ofsolution with the same Uranine concentration (0.01 gL‒1). Ten samples were prepared for each of the follow-ing initial pH values: 1, 6.65 and 13, adjusted by eitherHCl or NaOH. Each series of the same pH was shaken forwide range of times (1, 3, 5, 15, and 30 min, and 1, 5, 15.5,24, and 48 h). After shaking, samples were immediatelycentrifuged at 860×g for 20 s, which was sufficient toseparate liquid and solid phases as verified in prelimi-nary experiments where further centrifuging or higherrpm values did not change measured concentrationsexcept in the high pH solution. In the pH = 13 solution,the suspended colloids in some soils remained in suspen-sion even after longer centrifugation at high rpm. Oncethe solution pH was measured, it was diluted andbuffered to pH 10 with NaOH and then measured on aToshiba fluorescent spectrophotometer using the cali-bration curve. Dilutions (from 1:1 up to 1:2000) wereperformed because some concentrations in this studywere higher than the linear range of the calibrationcurve; also their pH had to be adjusted to 10. Dilutionwas also important to suppress the influence of colloidson fluorescence. Suspended colloids can affect fluores-cence in two different ways: (1) dense colloidal suspen-sions can lower the fluorescence by restricting thepassage of excitation light in the cuvette; and (2)moderate to low concentrations of colloids may amplifyfluorescence by scattering incident light or contributingtheir own fluorescence intensity. A 1:10 dilution wasfound to be sufficient in tests with known concentra-tions of Uranine containing fixed amounts of colloids indifferent ratios.
For equilibrium sorption, 120 samples were evalu-ated. Each soil type was mixed with 10 different concen-trations of Uranine (4, 2, 0.2, 0.1, 0.02, 0.01, 0.002, 0.001,0.0002 and 0.0001 g L‒1) in solutions of two differentinitial pH levels (6.65, 13) and shaken for 48 h. AcidicpH solutions were not investigated as it would beunpractical to add initial acidic solution to field soilsbecause it does not decrease the sorption rates and
increases the sorption kinetics. To obtain concentra-tions after shaking, samples were treated in the samemanner as in kinetic sorption experiments.
For high Uranine concentrations in solution (> 1 gL‒1), crystallization sometimes occurred on the walls ofthe flasks. If this occurred, the samples were first treatedas usual, but after carefully removing the soil from theflask, a known amount of hot distilled water was addedand solution concentration was measured after decry-stallization. These data were used to correct the concen-tration values obtained by the typical procedure.
Data analysis
Equilibrium sorption data were fit to both Langmuirand Freundlich isotherm models with non-linear leastsquares. The Langmuir isotherm is given by:
qe =QbCe
1 + bCe
(1)
where qe is the amount of Uranine adsorbed per unitweight of soil (g kg‒1), Q (g kg‒1) is the solid phase con-centration corresponding to complete coverage of avail-able sites or the limiting adsorption capacity, b (L g‒1) isa constant, Ce (g L‒1) is the residual liquid phase concen-tration at equilibrium. The Freundlich isotherm is givenby:
qe = KC1/ne (2)
where K (L kg‒1) and n (dimensionless) are characteristicconstants, that can be interpreted as a relative indicatorof adsorption capacity and energy or intensity of thereaction, respectively.
RESULTS AND DISCUSSION
Kinetic sorption
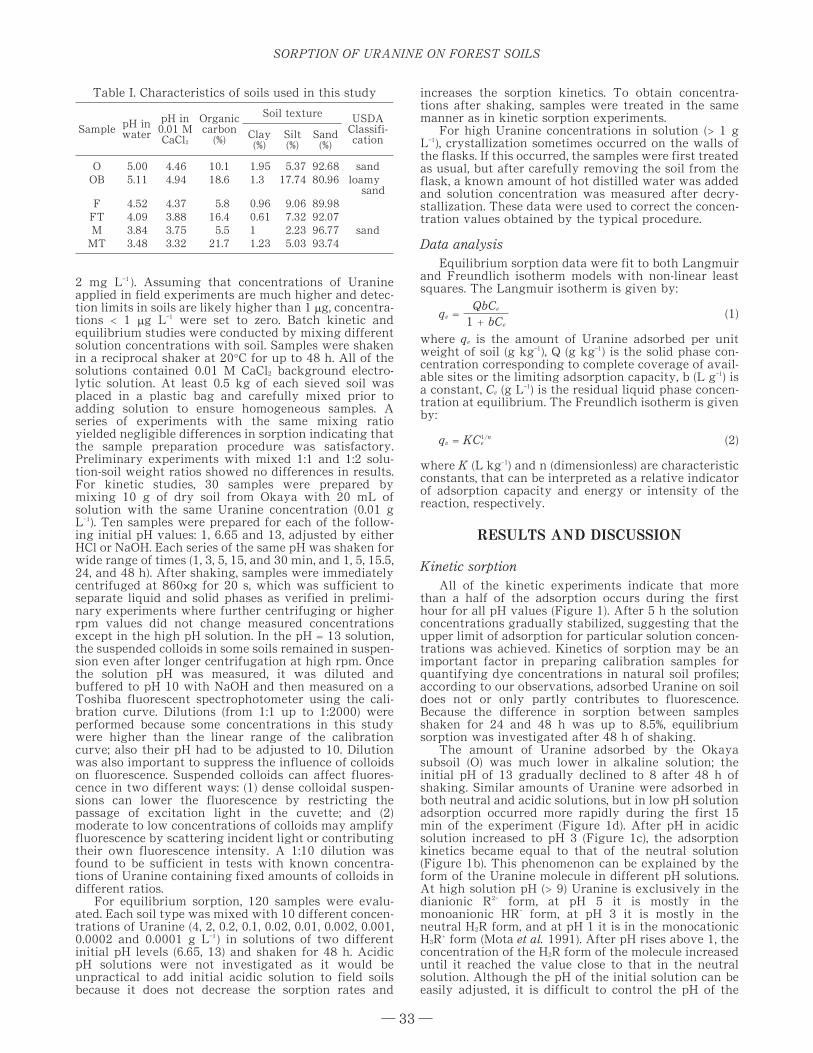
All of the kinetic experiments indicate that morethan a half of the adsorption occurs during the firsthour for all pH values (Figure 1). After 5 h the solutionconcentrations gradually stabilized, suggesting that theupper limit of adsorption for particular solution concen-trations was achieved. Kinetics of sorption may be animportant factor in preparing calibration samples forquantifying dye concentrations in natural soil profiles;according to our observations, adsorbed Uranine on soildoes not or only partly contributes to fluorescence.Because the difference in sorption between samplesshaken for 24 and 48 h was up to 8.5%, equilibriumsorption was investigated after 48 h of shaking.
The amount of Uranine adsorbed by the Okayasubsoil (O) was much lower in alkaline solution; theinitial pH of 13 gradually declined to 8 after 48 h ofshaking. Similar amounts of Uranine were adsorbed inboth neutral and acidic solutions, but in low pH solutionadsorption occurred more rapidly during the first 15min of the experiment (Figure 1d). After pH in acidicsolution increased to pH 3 (Figure 1c), the adsorptionkinetics became equal to that of the neutral solution(Figure 1b). This phenomenon can be explained by theform of the Uranine molecule in different pH solutions.At high solution pH (> 9) Uranine is exclusively in thedianionic R2‒ form, at pH 5 it is mostly in themonoanionic HR‒ form, at pH 3 it is mostly in theneutral H2R form, and at pH 1 it is in the monocationicH3R
+ form (Mota et al. 1991). After pH rises above 1, theconcentration of the H2R form of the molecule increaseduntil it reached the value close to that in the neutralsolution. Although the pH of the initial solution can beeasily adjusted, it is difficult to control the pH of the
― 33―
Table I. Characteristics of soils used in this study
SamplepH inwater
pH in0.01 MCaCl2
Organiccarbon
(%)
Soil textureUSDA
Classifi-cation
Clay(%)
Silt(%)
Sand(%)
O
OB
F
FT
M
MT
5.00
5.11
4.52
4.09
3.84
3.48
4.46
4.94
4.37
3.88
3.75
3.32
10.1
18.6
5.8
16.4
5.5
21.7
1.95
1.30
0.96
0.61
1.00
1.23
5.37
17.74
9.06
7.32
2.23
5.03
92.68
80.96
89.98
92.07
96.77
93.74
sand
loamysand
sand

K. M. GERKE ET AL.
resulting solution because of the strong bufferingcapacity of the soil. Thus, it is important to measure notonly the pH of the initial solution, but also the pH aftershaking, as it can change drastically during sorption ex-periments. For example, when an initial solution of pH10 was used, because of the strong buffering capacity ofthe Okaya soil (O), the final solution pH after shakingbecame almost the same as in the final solution withinitial pH 6.65.
Equilibrium sorption
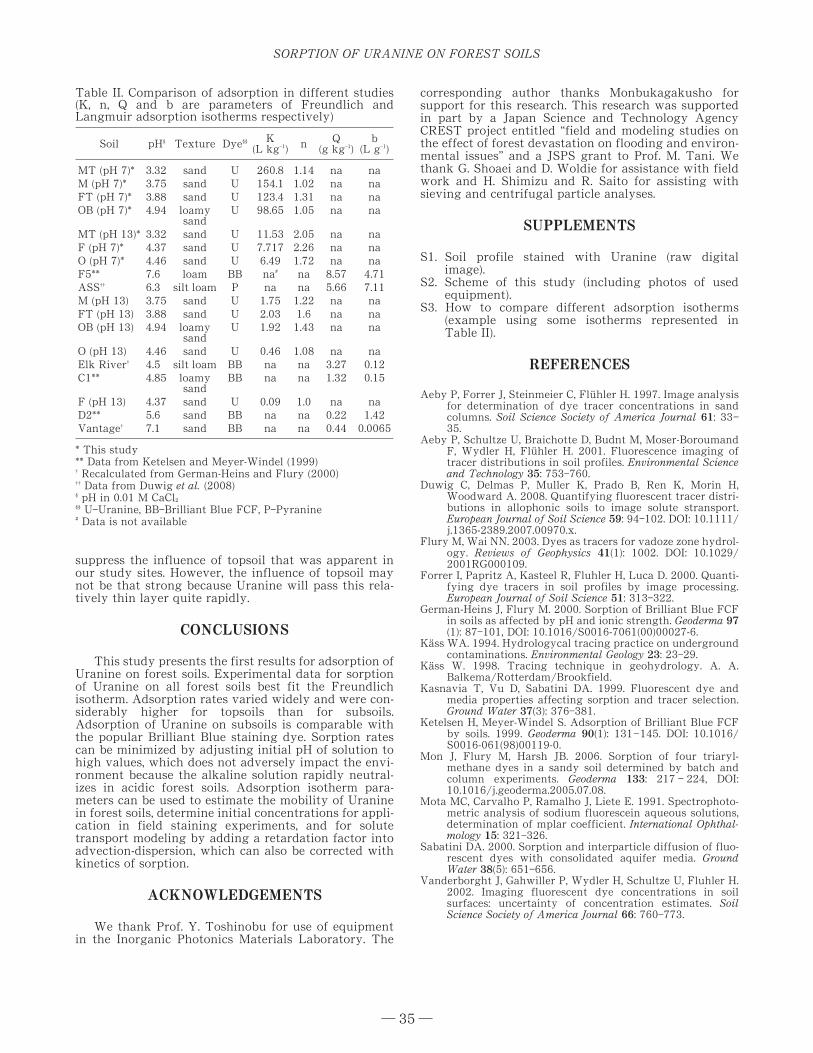
Adsorption curves of all samples fit both Freunlichand Langmuir isotherms well (R2 > 0.99 and R2 > 0.81, re-spectively); however, because experimental data showedtypical Freundlich behavior (Figure 2), Langmuir para-meters are not presented. The limiting adsorption ca-pacities (Q values) in the Langmuir isotherm aresomewhat questionable in terms of the adsorptionbehavior of our soils. Uranine adsorption in alkalinesolution (pH = 13) was definitely much lower than inneutral solution. The Mie topsoil (MT) exhibited thehighest sorption among all of the samples, while Miesubsoil (M) soil had the highest sorption among allsubsoils. Adsorption did not show any correlation witheither organic matter or clay content; however, claycontent was low and quite similar for all soils. Thisfinding agrees with other research which found thatUranine sorption appears to mostly depend on mineral-ogy (Sabatini 2000) and aquifer media charge (Kasnaviaet al. 1999). Since most soils are negatively charged, theinfluence of charge may not be so important in usingUranine for soil staining. However, different mineral-ogies, including different clay contents or aluminumand iron oxides, may be serious factors to consider; suchinteractions need more investigation. Depending on theform of the molecule, it will be more easily attracted tograins or surfaces with opposite charge. Given thenegative charge on soils, Uranine in high pH solution (in
R2‒ form) was adsorbed less than in neutral solutionwhere it existed in the HR‒ and H2R
+ forms.While sorption parameters for different staining
dyes that have been fit to different adsorption isothermmodels cannot be directly compared with our results,one can easily plot these graphs within the solute con-centration ranges of interest and compare adsorptionrates. In Table II, adsorption isotherm parameters fromour Uranine experiments are compared with sorptionparameters for other dyes and soils in order of decreas-ing sorption rate within the range of the residual con-centrations from 0 to 4 g L‒1 . The Fudoji subsoil (F)equilibrated with alkaline (pH = 13) initial solution ex-perienced the least sorption for all soils in our study,while Mie topsoil (MT) equilibrated in neutral solution(pH = 6.65) had the highest adsorption rate for all soilsreported in Table II. All of our soils buffered to pH 13 aswell as the Okaya and Fudoji subsoils in neutralsolution showed sorption rates comparable to BrilliantBlue FCF and Pyranine dyes, but the Okaya black layer,Mie subsoil, and Fudoji and Mie topsoils experiencedvery high sorption rates compared to other dye studies.These differences clearly show the importance of buffer-ing the applied field solution to high pH levels to
― 34―
Figure 1. Kinetics of sorption of Uranine on Okayasubsoil (O) and changes in pH in: a) pH 13, b) pH 6.65,and c) pH 1 initial solutions, and d) comparison of ad-sorption rates for all different initial pH values (thesmall inserted graph illustrates the sorption kineticswithin a compressed time frame of 1 hour).
Figure 2. Experimental adsorption data fitted toFreundlich isotherms for the six forest soils each withinitial solutions of pH 6.65 and 13: a) Okaya subsoil (O),b) Okaya black layer (OB), c) Fudoji subsoil (F), d) Fudojitopsoil (FT), e) Mie subsoil (M) and f) Mie topsoil (MT).
SORPTION OF URANINE ON FOREST SOILS
suppress the influence of topsoil that was apparent inour study sites. However, the influence of topsoil maynot be that strong because Uranine will pass this rela-tively thin layer quite rapidly.
CONCLUSIONS
This study presents the first results for adsorption ofUranine on forest soils. Experimental data for sorptionof Uranine on all forest soils best fit the Freundlichisotherm. Adsorption rates varied widely and were con-siderably higher for topsoils than for subsoils.Adsorption of Uranine on subsoils is comparable withthe popular Brilliant Blue staining dye. Sorption ratescan be minimized by adjusting initial pH of solution tohigh values, which does not adversely impact the envi-ronment because the alkaline solution rapidly neutral-izes in acidic forest soils. Adsorption isotherm para-meters can be used to estimate the mobility of Uraninein forest soils, determine initial concentrations for appli-cation in field staining experiments, and for solutetransport modeling by adding a retardation factor intoadvection-dispersion, which can also be corrected withkinetics of sorption.
ACKNOWLEDGEMENTS
We thank Prof. Y. Toshinobu for use of equipmentin the Inorganic Photonics Materials Laboratory. The
corresponding author thanks Monbukagakusho forsupport for this research. This research was supportedin part by a Japan Science and Technology AgencyCREST project entitled “field and modeling studies onthe effect of forest devastation on flooding and environ-mental issues” and a JSPS grant to Prof. M. Tani. Wethank G. Shoaei and D. Woldie for assistance with fieldwork and H. Shimizu and R. Saito for assisting withsieving and centrifugal particle analyses.
SUPPLEMENTS
S1. Soil profile stained with Uranine (raw digitalimage).
S2. Scheme of this study (including photos of usedequipment).
S3. How to compare different adsorption isotherms(example using some isotherms represented inTable II).
REFERENCES
Aeby P, Forrer J, Steinmeier C, Fl�uhler H. 1997. Image analysisfor determination of dye tracer concentrations in sandcolumns. Soil Science Society of America Journal 61: 33‒35.
Aeby P, Schultze U, Braichotte D, Budnt M, Moser-BoroumandF, Wydler H, Fl�uhler H. 2001. Fluorescence imaging oftracer distributions in soil profiles. Environmental Scienceand Technology 35: 753‒760.
Duwig C, Delmas P, Muller K, Prado B, Ren K, Morin H,Woodward A. 2008. Quantifying fluorescent tracer distri-butions in allophonic soils to image solute stransport.European Journal of Soil Science 59: 94‒102. DOI: 10.1111/j.1365-2389.2007.00970.x.
Flury M, Wai NN. 2003. Dyes as tracers for vadoze zone hydrol-ogy. Reviews of Geophysics 41(1): 1002. DOI: 10.1029/2001RG000109.
Forrer I, Papritz A, Kasteel R, Fluhler H, Luca D. 2000. Quanti-fying dye tracers in soil profiles by image processing.European Journal of Soil Science 51: 313‒322.
German-Heins J, Flury M. 2000. Sorption of Brilliant Blue FCFin soils as affected by pH and ionic strength. Geoderma 97(1): 87‒101, DOI: 10.1016/S0016-7061(00)00027-6.
K�ass WA. 1994. Hydrologycal tracing practice on undergroundcontaminations. Environmental Geology 23: 23‒29.
K�ass W. 1998. Tracing technique in geohydrology. A. A.Balkema/Rotterdam/Brookfield.
Kasnavia T, Vu D, Sabatini DA. 1999. Fluorescent dye andmedia properties affecting sorption and tracer selection.Ground Water 37(3): 376‒381.
Ketelsen H, Meyer-Windel S. Adsorption of Brilliant Blue FCFby soils. 1999. Geoderma 90(1): 131‒145. DOI: 10.1016/S0016-061(98)00119-0.
Mon J, Flury M, Harsh JB. 2006. Sorption of four triaryl-methane dyes in a sandy soil determined by batch andcolumn experiments. Geoderma 133: 217 ‒ 224, DOI:10.1016/j.geoderma.2005.07.08.
Mota MC, Carvalho P, Ramalho J, Liete E. 1991. Spectrophoto-metric analysis of sodium fluorescein aqueous solutions,determination of mplar coefficient. International Ophthal-mology 15: 321‒326.
Sabatini DA. 2000. Sorption and interparticle diffusion of fluo-rescent dyes with consolidated aquifer media. GroundWater 38(5): 651‒656.
Vanderborght J, Gahwiller P, Wydler H, Schultze U, Fluhler H.2002. Imaging fluorescent dye concentrations in soilsurfaces: uncertainty of concentration estimates. SoilScience Society of America Journal 66: 760‒773.
― 35―
Table II. Comparison of adsorption in different studies(K, n, Q and b are parameters of Freundlich andLangmuir adsorption isotherms respectively)
Soil pH§ Texture Dye§§ K(L kg‒1)
nQ
(g kg‒1)b
(L g‒1)
MT (pH 7)*
M (pH 7)*
FT (pH 7)*
OB (pH 7)*
MT (pH 13)*
F (pH 7)*
O (pH 7)*
F5**
ASS††
M (pH 13)
FT (pH 13)
OB (pH 13)
O (pH 13)
Elk River†
C1**
F (pH 13)
D2**
Vantage†
3.32
3.75
3.88
4.94
3.32
4.37
4.46
7.6
6.3
3.75
3.88
4.94
4.46
4.5
4.85
4.37
5.6
7.1
sand
sand
sand
loamysand
sand
sand
sand
loam
silt loam
sand
sand
loamysand
sand
silt loam
loamysand
sand
sand
sand
U
U
U
U
U
U
U
BB
P
U
U
U
U
BB
BB
U
BB
BB
260.8
154.1
123.4
98.65
11.53
7.717
6.49
na#
na
1.75
2.03
1.92
0.46
na
na
0.09
na
na
1.14
1.02
1.31
1.05
2.05
2.26
1.72
na
na
1.22
1.6
1.43
1.08
na
na
1.0
na
na
na
na
na
na
na
na
na
8.57
5.66
na
na
na
na
3.27
1.32
na
0.22
0.44
na
na
na
na
na
na
na
4.71
7.11
na
na
na
na
0.12
0.15
na
1.42
0.0065
* This study** Data from Ketelsen and Meyer-Windel (1999)† Recalculated from German-Heins and Flury (2000)†† Data from Duwig et al. (2008)§ pH in 0.01 M CaCl2
§§ U‒Uranine, BB‒Brilliant Blue FCF, P‒Pyranine# Data is not available