rare earth element sorption onto hydrous manganese oxide ... · rare earth element sorption onto...
TRANSCRIPT

Rare earth element sorption onto hydrous manganese
oxide: A modeling study
Olivier Pourret, Melanie Davranche
To cite this version:
Olivier Pourret, Melanie Davranche. Rare earth element sorption onto hydrous manganeseoxide: A modeling study. Journal of Colloid and Interface Science, Elsevier, 2013, pp.18-23.<10.1016/j.jcis.2012.11.054>. <hal-00801166>
HAL Id: hal-00801166
https://hal.archives-ouvertes.fr/hal-00801166
Submitted on 15 Mar 2013
HAL is a multi-disciplinary open accessarchive for the deposit and dissemination of sci-entific research documents, whether they are pub-lished or not. The documents may come fromteaching and research institutions in France orabroad, or from public or private research centers.
L’archive ouverte pluridisciplinaire HAL, estdestinee au depot et a la diffusion de documentsscientifiques de niveau recherche, publies ou non,emanant des etablissements d’enseignement et derecherche francais ou etrangers, des laboratoirespublics ou prives.

1 2 3 4 5 6 7 8 9 10 11 12 13 14 15 16 17 18 19 20 21 22 23 24 25 26 27 28 29 30 31 32 33 34 35 36 37 38 39 40 41 42 43 44 45 46 47 48 49 50 51 52 53 54 55 56 57 58 59 60 61 62 63 64 65
1
Rare earth element sorption onto hydrous manganese oxide
A modeling study
Olivier Pourret1*
and Mélanie Davranche2
1HydrISE, Institut Polytechnique LaSalle Beauvais, 60026 Beauvais cedex, France
2Géosciences Rennes, Université Rennes 1, CNRS, 35042 Rennes cedex, France
Keywords: rare earth element, manganese oxyhydroxides, surface complexation
modeling.
*Tel.: +33 344 068 979; Fax: +33 344 062 526; E-mail address:

1 2 3 4 5 6 7 8 9 10 11 12 13 14 15 16 17 18 19 20 21 22 23 24 25 26 27 28 29 30 31 32 33 34 35 36 37 38 39 40 41 42 43 44 45 46 47 48 49 50 51 52 53 54 55 56 57 58 59 60 61 62 63 64 65
2
Abstract
Manganese oxides are important scavengers of rare earth elements (REE) in
hydrosystems. However, it has been difficult to include Mn oxides in speciation
models due to the lack of a comprehensive set of sorption reactions consistent with a
given surface complexation model (SCM), as well as discrepancies between published
sorption data and predictions using the available models. Surface complexation
reactions for hydrous Mn oxide were described using a two surface site model and the
diffuse double layer SCM. The specific surface area, surface side density and pHzpc
were fixed to 746 m2/g, 2.1 mmol/g and 2.2, respectively. Two site types (≡XOH and
≡YOH) were also used with pKa2 values of 2.35 (≡XOH) and 6.06 (≡YOH). The
fraction of the high affinity sites was fixed at 0.36. Published REE sorption data were
subsequently used to determine the equilibrium surface complexation constants, while
considering the influence of pH, ionic strength and metal loading. Log K increases
from light REE to heavy REE and, more specifically, displays a convex tetrad effect.
At low metal loading, the ≡YOH site type strongly expresses its affinity towards REE
whereas at higher metal loading, the same is true for the ≡XOH site type. This study
thus provides evidence for heterogeneity in the distribution of the Mn oxide binding
sites among REE.
Keywords: lanthanide, manganese oxides, surface complexation modeling,
PHREEQC, PhreePlot
1. Introduction
The distributions of rare earth elements (REE) in natural waters have been
intensively investigated for more than forty years [1, 2]. The absolute and relative
concentrations of 14 stable REE have been determined in a variety of open ocean

1 2 3 4 5 6 7 8 9 10 11 12 13 14 15 16 17 18 19 20 21 22 23 24 25 26 27 28 29 30 31 32 33 34 35 36 37 38 39 40 41 42 43 44 45 46 47 48 49 50 51 52 53 54 55 56 57 58 59 60 61 62 63 64 65
3
environments [3], estuaries [4], rivers [5], lakes [6], groundwaters [7], and
hydrothermal fluids [8]. Although the complexation of hydrated trivalent REE with
various inorganic anions (carbonate, hydroxide, sulfate, fluoride and chloride) has
been intensively studied [9], REE partitioning and fractionation between solution and
relevant mineral surfaces is much less understood. To date, few studies have been
dedicated to REE sorption onto mineral surfaces [10-15] and the most frequently used
solids were Fe-oxyhydroxides [10, 11, 13-15]. REE sorption by amorphous ferric
hydroxide was measured over a pH range of 3.5 to 9.0 and over a large ionic strength
(IS) range. For a constant pH and individual REE, the magnitude of the estimated
distribution coefficients differs by a factor of around 400. Although Mn-
oxyhydroxides are as ubiquitous as Fe-oxyhydroxides and present high surface areas
and a strong affinity for many elements [16], fewer studies have focused on REE
adsorption by Mn-oxyhydroxides [10, 13, 17-19]. However, several studies have
demonstrated that Mn-oxyhydroxides partly controlled REE fractionation and
mobility in natural water. Thereby, they provided evidence that a negative Ce
anomaly in solution is developed through the oxidation/scavenging of Ce(III) onto the
MnO2 surface [10, 17, 19]. REE scavenging by ferromanganese nodules was also
identified as a major process in controlling REE fractionation in seawater [8, 20, 21].
The lack of data for REE binding by Mn-oxyhydroxides may be attributed to the high
variety of Mn-oxyhydroxide minerals and the heterogeneity of the published surface
properties which complicate modeling studies. However, in order to accurately
describe REE behavior, it is essential that REE binding to Mn-oxyhydroxides is
quantitatively modeled. Many surface complexation models have been established to
study and quantify cation sorption onto mineral surfaces. Each of them has their own
solid–solution interface description, model parameters and set of thermodynamic data

1 2 3 4 5 6 7 8 9 10 11 12 13 14 15 16 17 18 19 20 21 22 23 24 25 26 27 28 29 30 31 32 33 34 35 36 37 38 39 40 41 42 43 44 45 46 47 48 49 50 51 52 53 54 55 56 57 58 59 60 61 62 63 64 65
4
and many provide satisfactory fits to experimental data (e.g., [22]). Partially as a
result of this model flexibility, ion sorption data on Mn-oxyhydroxides have been fit
using a number of different surface complexation models (e.g. SCM). Thereby, a
triple-layer SCM was used to evaluate and predict the surface complexation constants
for hydrous manganese oxide (HMO) [23]. A variation on the constant capacitance
model [24] was included in SCAMP to determine the model parameters for sorption
on Mn oxyhydroxides [25]. Crystallographic data were used as the basis for a new
surface complexation model formulation [26]. More recently, Tonkin et al. [16]
provided consistent surface complexation constants for several cations for a generic
HMO and a diffuse double layer SCM for a system in which HMO is an important
scavenger.
In this study, a quantitative SCM model for REE sorption by HMO at low
substrate loadings (from 1.6 to 100 mg/L) was proposed using the generic HMO
surface parameters provided by Tonkin et al. [16]. The REE-HMO binding constant
was extrapolated using the linear free energy relationship (LFER) methodology and
by fitting experimental datasets with the PhreePlot program [27]. Published
experimental data cover an ionic strength range from 0 to 0.7 mol/L and a relatively
wide pH range from 4 to 9 [10]. This model was further used to discuss the nature and
importance of REE sorption by manganese oxyhydroxides in the open ocean.
2 Materials and methods
2.1 Surface complexation model description
The diffuse double layer SCM describes the sorption of solutes onto oxide
1 2 3 4 5 6 7 8 9 10 11 12 13 14 15 16 17 18 19 20 21 22 23 24 25 26 27 28 29 30 31 32 33 34 35 36 37 38 39 40 41 42 43 44 45 46 47 48 49 50 51 52 53 54 55 56 57 58 59 60 61 62 63 64 65
5
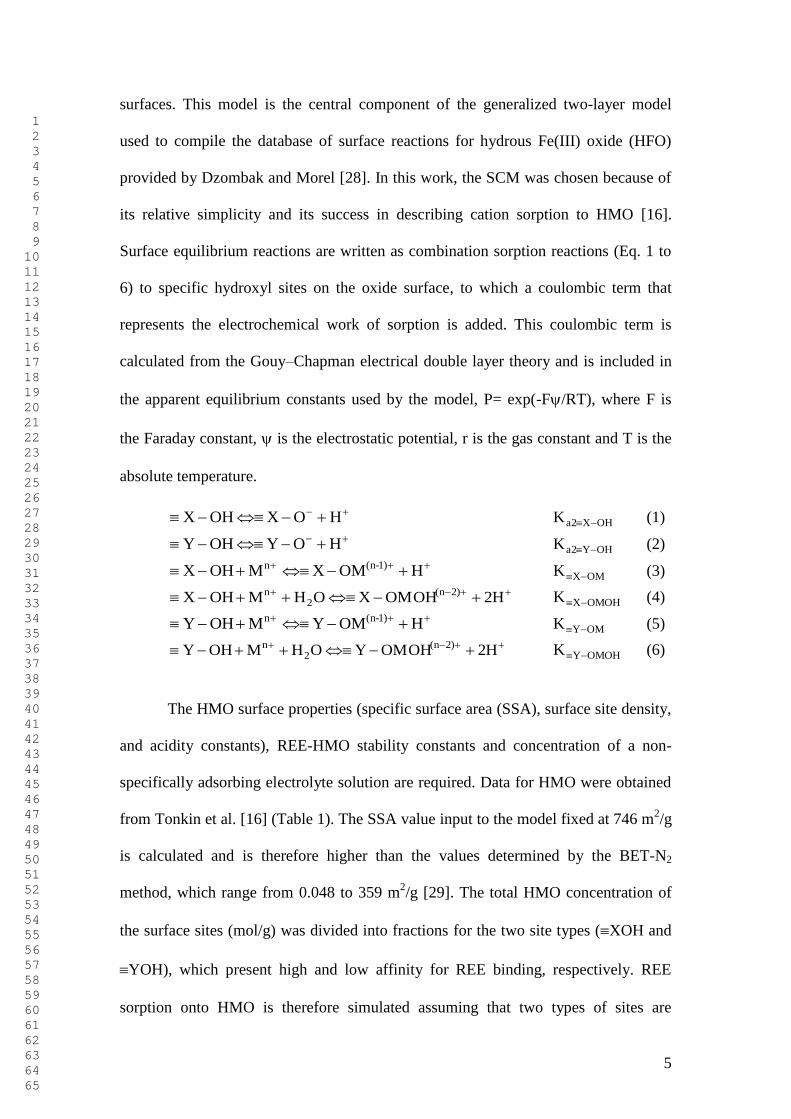
surfaces. This model is the central component of the generalized two-layer model
used to compile the database of surface reactions for hydrous Fe(III) oxide (HFO)
provided by Dzombak and Morel [28]. In this work, the SCM was chosen because of
its relative simplicity and its success in describing cation sorption to HMO [16].
Surface equilibrium reactions are written as combination sorption reactions (Eq. 1 to
6) to specific hydroxyl sites on the oxide surface, to which a coulombic term that
represents the electrochemical work of sorption is added. This coulombic term is
calculated from the Gouy–Chapman electrical double layer theory and is included in
the apparent equilibrium constants used by the model, P= exp(-F/RT), where F is
the Faraday constant, is the electrostatic potential, r is the gas constant and T is the
absolute temperature.
HOXOHX OHXa2K (1)
HOYOHY OHYa2K (2)
HOMXM OHX 1)-(nn OMXK (3)
2HOMOHXOHM OHX 2)(n2
n OMOHXK (4)
HOMYM OHY 1)-(nn OMYK (5)
2HOMOHYOHM OHY 2)(n2
n OMOHYK (6)
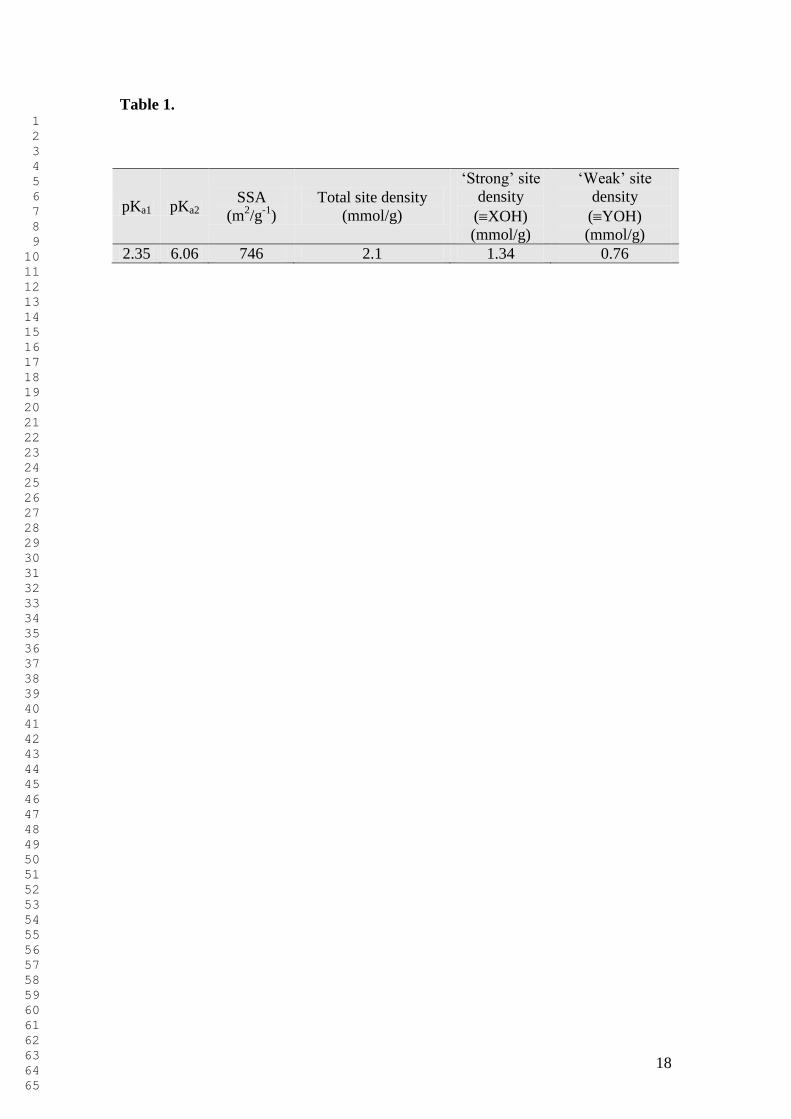
The HMO surface properties (specific surface area (SSA), surface site density,
and acidity constants), REE-HMO stability constants and concentration of a non-
specifically adsorbing electrolyte solution are required. Data for HMO were obtained
from Tonkin et al. [16] (Table 1). The SSA value input to the model fixed at 746 m2/g
is calculated and is therefore higher than the values determined by the BET-N2
method, which range from 0.048 to 359 m2/g [29]. The total HMO concentration of
the surface sites (mol/g) was divided into fractions for the two site types (XOH and
YOH), which present high and low affinity for REE binding, respectively. REE
sorption onto HMO is therefore simulated assuming that two types of sites are

1 2 3 4 5 6 7 8 9 10 11 12 13 14 15 16 17 18 19 20 21 22 23 24 25 26 27 28 29 30 31 32 33 34 35 36 37 38 39 40 41 42 43 44 45 46 47 48 49 50 51 52 53 54 55 56 57 58 59 60 61 62 63 64 65
6
available on the oxide surface (Table 1). Modeling calculations were performed with
PHREEQC and PhreePlot [27, 30]. Three keyword data blocks are required to define
the surface-complexation data for a simulation: (i) SURFACE_MASTER_SPECIES,
(ii) SURFACE_SPECIES, and (iii) SURFACE. The SURFACE_MASTER_SPECIES
data block defines a binding site, named “Hmo” (HMO; [16]), with two binding sites,
“Hmo_w” and “Hmo_s”, for the “weak” and “strong” binding sites. Inorganic
speciation was then performed; the Nagra/PSI database [31] was used and updated
including the same well-accepted stability constants at infinite dilution (25°C) for the
REE inorganic complexes (hydroxide, sulfate and carbonate; [32-34]. As Bau and
Koschinsky [35] proposed, Ce(III) is oxidized after its sorption onto oxyhydroxide
and therefore only REE(III) were considered in the proposed SCM.
2.2 REE-HMO sorption stability constants
2.2.1. Extrapolation of the linear free energy relationship
The linear free energy relationship (LFER) or the correlation between the first
hydrolysis constant for aqueous species and the corresponding surface complexation
constant was used to estimate the sorption stability constant as has been previously
done in numerous studies [16, 28, 36, 37]. The LFER can be used to extend results
from a limited dataset to other metals. The REE-HMO stability constants were
estimated by the same extrapolation method used by Tonkin et al. [16]. These authors
observed that a LFER exists for HMO between log K≡XOMe, log K≡XOMeOH, log K≡YOMe
and log K≡YOMeOH and the first hydrolysis (OH) constant for the metals (log KMeOH).

1 2 3 4 5 6 7 8 9 10 11 12 13 14 15 16 17 18 19 20 21 22 23 24 25 26 27 28 29 30 31 32 33 34 35 36 37 38 39 40 41 42 43 44 45 46 47 48 49 50 51 52 53 54 55 56 57 58 59 60 61 62 63 64 65
7
However, Tonkin et al. [16] caution against assuming a LFER for all metals
on HMO, notably with regards to the possible oxidation/scavenging mechanisms on
the HMO surface. The estimated stability constant of REE binding to HMO is
reported in Table 2. The first hydrolysis constant of REE, log KREE-OH, is taken from
the NIST database [38]. The REE-HMO stability constants extrapolated from the
LFER methodology are listed in Table 3 with the REE-OH stability constant used for
the calculation.
2.2.2. PhreePlot modeling
The pKa2, α values and published REE sorption data [10] were subsequently
used to determine the equilibrium surface complexation constants for the whole REE
series ([REE] = 125 g/L; [HMO=-MnO2] = 10 mg/L; room temperature; IS fixed
with NaNO3; no control of the CO2 species). They were modeled using the computer
program PhreePlot [27] and the Nagra/PSI database [31], which was modified to
include the well-accepted infinite dilution (at 25°C) of inorganic species [32, 33].
Intrinsic constants for the surface complexation model were optimized by Powell‟s
non-linear least squares method using PhreePlot's fitting options. The REE-HMO
stability constants are listed in Table 4. Only log K≡XOMe and log K≡YOMe were further
considered because log K≡XOMeOH and log K≡YOMeOH are low and thus negligible.
3. Results and discussion
The speciation calculations presented below were performed using a diffuse
double layer SCM in the PhreePlot program with the LFER extrapolated and
PhreePlot fitted REE-HMO stability constants. The database was modified to

1 2 3 4 5 6 7 8 9 10 11 12 13 14 15 16 17 18 19 20 21 22 23 24 25 26 27 28 29 30 31 32 33 34 35 36 37 38 39 40 41 42 43 44 45 46 47 48 49 50 51 52 53 54 55 56 57 58 59 60 61 62 63 64 65
8
integrate the extrapolated and fitted REE-HMO stability constant, as well as the
infinite dilution (25°C) stability constants for the REE inorganic (chloride and
carbonate) complexes [32, 33]. To test the validity of the extrapolated and fitted REE-
HMO stability constant and the diffused double layer SCM, the modeling calculations
were compared to the REE-HMO sorption experimental datasets [10, 13, 18, 19].
3.1. REE-HMO modeling with extrapolated stability constant
3.1.1. LFER extrapolated stability constant
The dataset for the extrapolated REE-HMO stability constants was
subsequently used to calculate the distribution of La under various experimental
conditions [10, 13, 18]. The comparison between the experimental and calculated data
provide evidence that the dataset for the extrapolated REE-HMO stability constants
cannot be used to reproduce the experimental distribution of REE onto HMO
regardless of the pH, IS (Figure 1; pH ranging from 4.0 to 9.5 and IS varying from
0.001 to 0.7 mol/L) and metal loading ([REE] varying from 5 µg/L to 0.2 mg/L and
[HMO=-MnO2] ranging from 3.2 mg/L to 100 mg/L). The calculated proportion of
bound REE is strongly underestimated. Therefore, the datasets for the extrapolated
constants were not used hereafter.
3.1.2. PhreePlot fitted stability constants
The fitted stability constants were subsequently used to calculate the
distribution of La, Eu and Lu under De Carlo et al.'s [10] experimental conditions.

1 2 3 4 5 6 7 8 9 10 11 12 13 14 15 16 17 18 19 20 21 22 23 24 25 26 27 28 29 30 31 32 33 34 35 36 37 38 39 40 41 42 43 44 45 46 47 48 49 50 51 52 53 54 55 56 57 58 59 60 61 62 63 64 65
9
Figure 2 compares the experimental and calculated datasets. The model reproduces
reasonably well the increasing light REE (LREE; illustrated by La) binding onto
HMO with pH and IS. However, for heavy REE (HREE; illustrated by Lu), although
the model predicts a decreasing binding strength, the experimental data show that
100% of REE are sorbed onto HMO. In Table 5, the rmse (root mean square errors)
are reported between the experimental and modeling data for the three REE and IS
conditions. The important rmse values for Eu and Lu at IS= 0.7 were expected with
regards to the irregularity observed in the experimental dataset [10]. Moreover, Figure
2 shows that the discrepancy between the experimental and calculated data also
increases with pH, IS and the REE atomic number. Lee and Byrne [39] demonstrated
that REE binding by carbonate in solution increases with the REE atomic numbers.
The most important difference observed for the heavy REE (HREE) therefore
indicates that the model predicts larger concentrations of HREE bound to carbonate
than in the experimental conditions.
3.2. PhreePlot modeling
3.2.1. pH dependence
Figure 2 also compares the experimental and calculated datasets. The model
reproduces reasonably well the increasing LREE binding onto HMO with pH and IS.
However, the model predicts a decreasing binding strength at an alkaline pH for
HREE. As already shown by De Carlo et al. [10], a large extent of the variability in
the sorption efficiency is observed at low pH with the IS. This is generally evidenced
by a shift in the adsorption edges towards an alkaline pH and reduced REE sorption
with increasing IS, especially at an acidic pH. The differences appear more
pronounced for LREE than HREE.

1 2 3 4 5 6 7 8 9 10 11 12 13 14 15 16 17 18 19 20 21 22 23 24 25 26 27 28 29 30 31 32 33 34 35 36 37 38 39 40 41 42 43 44 45 46 47 48 49 50 51 52 53 54 55 56 57 58 59 60 61 62 63 64 65
10
3.2.2. REE patterns
The REE distribution between suspended HMO (at an IS of 0.5 mol/L) over the pH
range from 4.79 to 6.80 [13] was further modeled using the previously described
SCM procedure. The calculated REE patterns onto HMO are shown in Figure 3a. The
patterns exhibit extremely large positive Ce anomalies and a convex tetrad effect
(well developed for the first two tetrads). These two features were already apparent in
the experimental datasets of De Carlo et al. [10] and Ohta and Kawabe [13]. The same
features occur for Davranche et al.'s [18] dataset: the REE patterns exhibit large
positive Ce anomalies (Fig. 3b), as well as convex tetrad curves. However, they are
less developed. This discrepancy might be explained by the rather different
experimental conditions used in Davranche et al. [18] as compared to those used in
De Carlo et al. [10] from which the constants are derived.
Among these results, an interesting feature is that the modeling approach reproduces
the strongly enhanced adsorption of Ce from acidic solution by HMO, relative to the
other REE. The adsorption edge in the HMO suspension is therefore below pH 4 for
Ce, whereas for strictly trivalent REE, it occurs near neutral pH. It should be noted
that at ambient conditions and in the absence of strong ligands, tetravalent Ce is only
stable in solid phase [40], or when it is derived from the oxidation/scavenging of
Ce(III) onto the metal oxyhydroxide surface [35]. Thus, the Ce-HMO constant
calculated in this study is a conditional constant which considers the global oxidation-
scavenging of the Ce(III, IV) mechanism onto the HMO surface.
3.2.3. Model validity and application

1 2 3 4 5 6 7 8 9 10 11 12 13 14 15 16 17 18 19 20 21 22 23 24 25 26 27 28 29 30 31 32 33 34 35 36 37 38 39 40 41 42 43 44 45 46 47 48 49 50 51 52 53 54 55 56 57 58 59 60 61 62 63 64 65
11
In order to check the validity of the model, calculations were performed with data
from the literature [13, 18]. Irrespective of the pH, IS (Figure 1; pH ranging from 4.0
to 9.5 and IS varying from 0.001 to 0.7 mol/L) and metal loadings ([REE] varying
from 5 µg/L to 0.2 mg/L and [HMO=-MnO2] ranging from 3.2 mg/L to 100 mg/L),
the modeling is in agreement with the experimental results. In further detail, data from
Ohta and Kawabe [13] for a high IS (i.e., 0.5 mol/L) are well reproduced, as was
observed in De Carlo et al.'s [10] experimental conditions. However, data from
Davranche et al. [18] for the lowest IS (i.e., 0.001 mol/L) are not well reproduced.
The main differences between these experimental conditions, apart from the IS, are
that different metal loadings are tested (i.e., 0.875 for Ohta and Kawabe [13]; 0.175
for De Carlo et al. [10]; 0.0007 for Davranche et al. [18, 19]).
Unlike the various experimental conditions, differences between the experimental
observations and modeling are probably due to the generic parameters chosen to
represent the Mn-oxyhydroxides. In fact, there are different Mn-oxyhydroxide
varieties and their properties are highly variable [29, 41]. As an example, pHzpc values
for HMO can vary from 2 to 9.6 [29]. Ohta and Kawabe [13] and De Carlo et al. [10]
consider vernadite with a pHzpc of 2.25 [42], whereas Davranche et al. [18] consider
pyrolusite with a pHzpc of 5.8.
Apart from these discrepancies, a faithful reproduction of the data from the literature
constitutes an even better test of model's ability. While the conditional nature (IS, pH
and metal loading) of the determined stability constants would render such an
exercise rather meaningless for a single element, the unique attributes of the REE
series can be used to examine whole log K patterns. The REE pattern shape (i.e., REE
fractionation) is governed by the chemical properties of the REE and does not depend

1 2 3 4 5 6 7 8 9 10 11 12 13 14 15 16 17 18 19 20 21 22 23 24 25 26 27 28 29 30 31 32 33 34 35 36 37 38 39 40 41 42 43 44 45 46 47 48 49 50 51 52 53 54 55 56 57 58 59 60 61 62 63 64 65
12
on the sorbent properties, which depend on its synthesis method which controls, for
example, its crystallinity and specific surface area. [43]
This type of SCM development can be used to improve the understanding of REE
fractionation in seawater. Indeed, the experimental conditions are closed to those of
marine system. Moreover, an interesting feature is that modeling approach can
reproduce the high adsorption of Ce relative to the other REE under acidic conditions.
This behavior is also observed in seawater when dissolved REE are scavenged by δ -
MnO2 [10]. The Ce anomaly is recognized as one of the fundamental features of
lanthanide geochemistry due to its redox sensitivity [44]. Cerium is a prime proxy for
ocean–atmosphere evolution over geological timescales [45]. The contribution of
oxidative scavenging toward the removal of Ce from solution is most pronounced at
acidic pH, where the strictly trivalent REE exhibit little propensity for sorption onto
δ-MnO2. It has been suggested that the behavior of REE and Ce in the marine
environment is more closely coupled to that of Mn than to that of Fe due to the
oxidative scavenging of Ce by Mn-oxyhydroxides [44].
4 Concluding remarks
Surface complexation modeling was used to test REE sorption onto HMO by
considering LFER to determine log K. However, this methodology does not allow
experimental data to be reproduced. Therefore, these experimental data were further
used to extrapolate equilibrium surface complexation constants by fitting them for a
large dataset [10]. The determined constants can reproduce pH dependence and REE
fractionation over a wide variety of conditions (i.e., pH ranging from 4.0 to 9.5, IS
varying from 0.001 to 0.7 mol/L, [REE] varying from 5 µg/L to 0.2 mg/L and
1 2 3 4 5 6 7 8 9 10 11 12 13 14 15 16 17 18 19 20 21 22 23 24 25 26 27 28 29 30 31 32 33 34 35 36 37 38 39 40 41 42 43 44 45 46 47 48 49 50 51 52 53 54 55 56 57 58 59 60 61 62 63 64 65
13
[HMO=-MnO2] ranging from 3.2 mg/L to 100 mg/L). SCM development of this type
can be used to improve the understanding of REE fractionation in seawater. However,
these results emphasize the relevance of conducting further experiments and modeling
for a better understanding of natural systems and have considerable implications for
the assessment of REE mobility.
Acknowledgments
Dr. Atsuyuki Ohta is acknowledged for sharing the raw data used in this study. This
research was funded by the French ANR, through the "Programme Jeunes
Chercheuses - Jeunes Chercheurs: SURFREE (Rare earth elements partitioning at
solid-water interface: Impact on REE geochemical behaviour and tracing properties)".
Dr. Sara Mullin is acknowledged for post-editing the English content.
1 2 3 4 5 6 7 8 9 10 11 12 13 14 15 16 17 18 19 20 21 22 23 24 25 26 27 28 29 30 31 32 33 34 35 36 37 38 39 40 41 42 43 44 45 46 47 48 49 50 51 52 53 54 55 56 57 58 59 60 61 62 63 64 65
14
Tables and Figures Captions
Table 1 SCM parameters for HMO [16].
Table 2 Stability constants used for the LFER established by Tonkin et al. [16].
Table 3 REE-HMO stability constants extrapolated from the LFER established by
Tonkin et al. [16].
Table 4 REE-HMO stability constants fitted with PhreePlot from De Carlo et al.'s
[10] experimental datasets.
Table 5 Rmse (root mean square error) calculated between the experimental datasets
[10]and the datasets calculated from the REE-HMO fitted stability constant.
Figure 1 Proportion of La sorbed to HMO as a function of pH. The dots correspond
to experimental data from the literature and the solid line representes modeled data
using extrapolated constants obtained from LFER (a) (b) (c) De Carlo et al. [10]; (d)
Ohta and Kawabe [13]; (e) Davranche et al. [18].
Figure 2 A comparison between the experimental and calculated proportion of La, Eu
and Lu bound to HMO using the fitted REE-HMO stability constants under the
experimental condition's provided by De Carlo et al. [10]. The dots correspond to the
displayed experimental data and the solid line corresponds to the calculated data.
Figure 3 Modeled vs. experiments REE patterns showing Ce/Ce* for the
experimental conditions described in (a) Fig. 2 in Ohta and Kawabe [13], and (b) Fig.
4 in Davranche et al. [19] and Fig. 6 in Davranche et al. [18].

1 2 3 4 5 6 7 8 9 10 11 12 13 14 15 16 17 18 19 20 21 22 23 24 25 26 27 28 29 30 31 32 33 34 35 36 37 38 39 40 41 42 43 44 45 46 47 48 49 50 51 52 53 54 55 56 57 58 59 60 61 62 63 64 65
15

1 2 3 4 5 6 7 8 9 10 11 12 13 14 15 16 17 18 19 20 21 22 23 24 25 26 27 28 29 30 31 32 33 34 35 36 37 38 39 40 41 42 43 44 45 46 47 48 49 50 51 52 53 54 55 56 57 58 59 60 61 62 63 64 65
16

1 2 3 4 5 6 7 8 9 10 11 12 13 14 15 16 17 18 19 20 21 22 23 24 25 26 27 28 29 30 31 32 33 34 35 36 37 38 39 40 41 42 43 44 45 46 47 48 49 50 51 52 53 54 55 56 57 58 59 60 61 62 63 64 65
17
1 2 3 4 5 6 7 8 9 10 11 12 13 14 15 16 17 18 19 20 21 22 23 24 25 26 27 28 29 30 31 32 33 34 35 36 37 38 39 40 41 42 43 44 45 46 47 48 49 50 51 52 53 54 55 56 57 58 59 60 61 62 63 64 65
18
Table 1.
pKa1 pKa2 SSA
(m2/g
-1)
Total site density
(mmol/g)
„Strong‟ site
density
(XOH)
(mmol/g)
„Weak‟ site
density
(YOH)
(mmol/g)
2.35 6.06 746 2.1 1.34 0.76

1 2 3 4 5 6 7 8 9 10 11 12 13 14 15 16 17 18 19 20 21 22 23 24 25 26 27 28 29 30 31 32 33 34 35 36 37 38 39 40 41 42 43 44 45 46 47 48 49 50 51 52 53 54 55 56 57 58 59 60 61 62 63 64 65
19
Table 2.
log KMeOH log K≡XOMe log K≡XOMeOH log K≡YOMe log K≡YOMeOH
Ba 0.53 0.45 - - -
Ca 1.15 -1.5 - - -
Cd 3.92 -2.4 -8 -3.5 -8.5
Co 4.35 1 -3.9 - -
Cu 6.5 0.85 -2.8 0.86 -5.7
Mg 2.56 -2.4 -7.7 - -
Mn 3.41 1.2 -2.7 - -
Ni 4.14 -0.48 -5 - -
Pb 6.29 - -0.86 3.4 -1.6
Sr 0.71 -1.6 -6.6 - -
Zn 5.04 -0.01 -4.4 - -7.6

1 2 3 4 5 6 7 8 9 10 11 12 13 14 15 16 17 18 19 20 21 22 23 24 25 26 27 28 29 30 31 32 33 34 35 36 37 38 39 40 41 42 43 44 45 46 47 48 49 50 51 52 53 54 55 56 57 58 59 60 61 62 63 64 65
20
Table 3.
log KMeOH log K≡XOMe log K≡XOMeOH log K≡YOMe log K≡YOMeOH
La 5.19 0.05 -3.67 -0.58 -6.34
Ce 5.66 0.17 -3.23 0.45 -5.41
Pr 5.68 0.18 -3.22 0.50 -5.37
Nd 5.82 0.22 -3.09 0.80 -5.10
Sm 6.16 0.31 -2.78 1.55 -4.43
Eu 6.24 0.33 -2.70 1.73 -4.27
Gd 6.17 0.31 -2.77 1.57 -4.41
Tb 6.36 0.37 -2.59 1.99 -4.03
Dy 6.41 0.38 -2.55 2.10 -3.94
Ho 6.44 0.39 -2.52 2.17 -3.88
Er 6.48 0.40 -2.48 2.25 -3.80
Tm 6.61 0.43 -2.36 2.54 -3.54
Yb 6.76 0.48 -2.23 2.87 -3.25
Lu 6.73 0.47 -2.25 2.80 -3.30

1 2 3 4 5 6 7 8 9 10 11 12 13 14 15 16 17 18 19 20 21 22 23 24 25 26 27 28 29 30 31 32 33 34 35 36 37 38 39 40 41 42 43 44 45 46 47 48 49 50 51 52 53 54 55 56 57 58 59 60 61 62 63 64 65
21
Table 4
log K≡XOMe log K≡YOMe
La -0.47 2.50
Ce 1.02 3.73
Pr -0.15 2.51
Nd -0.33 2.70
Sm -0.24 2.70
Eu -0.37 2.65
Gd -0.73 2.58
Tb -2.35 2.69
Dy -2.51 2.67
Ho -2.37 2.49
Er -1.79 2.61
Tm -1.55 2.45
Yb -3.86 2.69
Lu -1.49 2.61

1 2 3 4 5 6 7 8 9 10 11 12 13 14 15 16 17 18 19 20 21 22 23 24 25 26 27 28 29 30 31 32 33 34 35 36 37 38 39 40 41 42 43 44 45 46 47 48 49 50 51 52 53 54 55 56 57 58 59 60 61 62 63 64 65
22
Table 5
La Eu Lu
IS = 0.1 0.05 0.04 0.06
IS = 0.3 0.04 0.03 0.35
IS = 0.7 0.07 0.23 0.34

1 2 3 4 5 6 7 8 9 10 11 12 13 14 15 16 17 18 19 20 21 22 23 24 25 26 27 28 29 30 31 32 33 34 35 36 37 38 39 40 41 42 43 44 45 46 47 48 49 50 51 52 53 54 55 56 57 58 59 60 61 62 63 64 65
23
References
[1] E. D. Goldberg, M. Koide, R. A. Schmitt, R. H. Smith, J. Geophys. Res. 68
(1963) 4209-4217.
[2] P. Henderson, Rare earth element geochemistry, Elsevier, Amsterdam, 1984.
[3] H. J. W. De Baar, M. P. Bacon, P. G. Brewer, K. W. Bruland, Geochim.
Cosmochim. Acta 49 (1985) 1943-1959.
[4] E. R. Sholkovitz, H. Elderfield, Global Biogeochem. Cy. 2 (1988) 157-176.
[5] S. J. Goldstein, S. B. Jacobsen, Earth Planet. Sci. Lett. 89 (1988) 35-47.
[6] K. H. Johannesson, W. B. Lyons, D. A. Bird, Geophys. Res. Lett. 21 (1994)
773-776.
[7] P. L. Smedley, Geochim. Cosmochim. Acta 55 (1991) 2767-2779.
[8] M. Bau, Contrib. Mineral. Petrol. 123 (1996) 323-333.
[9] S. A. Wood, Chem. Geol. 82 (1990) 159-186.
[10] E. H. De Carlo, X.-Y. Wen, M. Irving, Aquat. Geochem. 3 (1998) 357-389.
[11] M. Bau, Geochim. Cosmochim. Acta 63 (1999) 67-77.
[12] A. Ohta, I. Kawabe, Geochem. J. 34 (2000) 439-454.
[13] A. Ohta, I. Kawabe, Geochim. Cosmochim. Acta 65 (2001) 695-703.
[14] K. A. Quinn, R. H. Byrne, J. Schijf, Aquat. Geochem. 10 (2004) 59-80.
[15] J. Schijf, K. S. Marshall, Mar. Chem. 123 (2011) 32-43.
[16] J. W. Tonkin, L. S. Balistrieri, J. W. Murray, Appl. Geochem. 19 (2004) 29-
53.
[17] D. Koeppenkastrop, E. H. De Carlo, Chem. Geol. 95 (1992) 251-263.
[18] M. Davranche, O. Pourret, G. Gruau, A. Dia, D. Jin, D. Gaertner, Chem. Geol.
247 (2008) 154-170.
[19] M. Davranche, O. Pourret, G. Gruau, A. Dia, M. Le Coz-Bouhnik, Geochim.
Cosmochim. Acta 69 (2005) 4825-4835.
[20] D. Z. Piper, Geochim. Cosmochim. Acta 38 (1974) 1007-1022.
[21] H. Elderfield, C. J. Hawkesworth, M. J. Greaves, S. E. Calvert, Geochim.
Cosmochim. Acta 45 (1981) 513-528.
[22] P. Venema, T. Hiemstra, W. H. van Riemsduk, J. Colloid Interface Sci. 181
(1996) 45-59.
[23] R. W. Smith, E. A. Jenne, Environ. Sci. Technol. 25 (1991) 525-531.
[24] P. W. Schindler, W. Stumm, in: The surface chemistry of oxides, hydroxides
and oxide minerals, W. Stumm (Ed.), Wiley: 1987, pp 83-110.
[25] S. Lofts, E. Tipping, Geochim. Cosmochim. Acta 62 (1998) 2609-2625.
[26] C. A. J. Appelo, D. Postma, Geochim. Cosmochim. Acta 63 (1999) 3039-
3048.
[27] D. G. Kinniburgh, D. M. Cooper PhreePlot: Creating graphical output with
PHREEQC, Available at: http://www.phreeplot.org: 2009.
[28] D. A. Dzombak, F. M. M. Morel, Surface complexation modeling-Hydrous
ferric oxide, Wiley New York, 1990.
[29] M. Kosmulski, Surface Charging and Points of Zero Charge, CRC Press, Boca
Raton, 2009.
[30] D. L. Parkhurst, C. A. J. Appelo, User's guide to PHREEQC (Version 2) - A
computer program for speciation, batch-reaction, one-dimensional transport, and
inverse geochemical calculations, 99-4259, U.S. Geological Survey Water-Resources
Investigations Report, 1999, p 309.

1 2 3 4 5 6 7 8 9 10 11 12 13 14 15 16 17 18 19 20 21 22 23 24 25 26 27 28 29 30 31 32 33 34 35 36 37 38 39 40 41 42 43 44 45 46 47 48 49 50 51 52 53 54 55 56 57 58 59 60 61 62 63 64 65
24
[31] W. Hummel, U. Berner, E. Curti, F. J. Pearson, T. Thoenen, Nagra / PSI
Chemical Thermodynamic Data Base 01/01, Universal Publishers, Parkland, Florida,
2002.
[32] G. D. Klungness, R. H. Byrne, Polyhedron 19 (2000) 99-107.
[33] Y.-R. Luo, R. H. Byrne, Geochim. Cosmochim. Acta 68 (2004) 691-699.
[34] J. Schijf, R. H. Byrne, Geochim. Cosmochim. Acta 68 (2004) 2825-2837.
[35] M. Bau, A. Koschinsky, Geochem. J. 43 (2009) 37-47.
[36] J. Tang, K. H. Johannesson, Geochim. Cosmochim. Acta 67 (2003) 2321-
2339.
[37] O. Pourret, M. Davranche, G. Gruau, A. Dia, Chem. Geol. 243 (2007) 128-
141.
[38] A. E. Martell, R. M. Smith, R. J. Motekaitis, NIST Critically Selected Stability
Constants of Metal Complexes Database. Version 8.0 for Windows, National Institute
of Standards and Technology, Texas A&M University, 2004.
[39] J. H. Lee, R. H. Byrne, Geochim. Cosmochim. Acta 56 (1992) 1127-1137.
[40] D. G. Brookins, in: Aqueous geochemistry of rare earth elements, P. H. Ribbe
(Ed.), The Mineralogical Society of America: Washington, 1989, pp 201-225.
[41] J. E. Post, P. Natl. Acad. Sci. USA 96 (1999) 3447-3454.
[42] J. W. Murray, J. Colloid Interface Sci. 46 (1974) 357-371.
[43] R. M. Cornell, U. Schwertmann , in The iron Oxides, John Wiley and Sons,
USA, 2003, p 703.
[44] H. Elderfield, Philos. T. Roy. Soc. A A325 (1988) 105-126.
[45] K. M. Towe, Palaeogeogr. Palaeocl. 97 (1991) 113-123.