sopheon 2012 annual report · pdf fileto 21% the year before. customers headquartered in ......
TRANSCRIPT

S O P H E O N 2 0 1 2
A N N U A L R E P O R T
Where innovation means business™

Sopheon partners with customers to provide complete
Enterprise Innovation Performance solutions including software,
expertise, and best practices to achieve exceptional long-term
revenue growth and profitability.

Summary Results and Trends .................................5
Statement from the Chairman and Chief Executive Officer ........................................... 6
Financial and Operating Review ............................8
Market and Solution Overview ...........................11
Interest Directors and Advisors ..........................17
Report on Directors’ Remuneration .................18
Directors’ Report ...................................................21
Statement of Directors’ Responsibilities ...........23
Auditors’ Report .....................................................24
Consolidated Income Statements .......................26
Consolidated and Company Balance Sheets .........................................................27
Consolidated and Company Cash Flow Statements ...........................................28
Consolidated and Company Statements of Changes in Equity ..............................................29
Notes to the Financial Statements .....................30

Sopheon’s software, expertise, and best practices enables our customers to improve innovation and new product development
performance for sustainable, profitable revenue growth.

Num
ber
of C
usto
mer
s
220
200
180
160
140
120
100
80
60
40
20
0
2002 2003 2004 2005 2006 2007 2008 2009 20112010 2012
In 2012, we grew our customer base to 203 licensees.
Summary Results and Trends
Annualized average growth since the launch of Accolade remains at 25%. As the business rebalanced towards new customer acquisition, we saw a total of 49 license orders in 2012, of which 31 were extensions. We expect today's new customers to drive further extension business in the future. Average license revenue per transaction was up on 2011, as is the maintenance base.
2002 2003 2004 2005 2006 2007
Recurring Revenues Extensions
2008 20122009
GB
P £
’000
14000
12000
10000
8000
6000
4000
2000
0
45
40
35
30
25
20
15
10
5
0
Un
its
2010 2011
In 2012 we saw a strong return to growth after a relatively flat performance the year before. Business from new customers picked up sharply, amounting to 51% of new orders compared to 21% the year before. Customers headquartered in China and the Middle East made a major contribution to this. The balance sheet was also improved with new funds from long-term investors to underpin ongoing growth strategies.
2012 2011 2010 2009 2008 2007
Revenue £'000 12, 663 10,276 10,537 8,260 9,304 6,332 EBITDA £'000 1,803 1,491 1,510 (195) 1,120 113 Profit before tax £'000 281 104 171 (1,494) 44 (443)Earnings per share pence 0.19 0.07 0.10 (1.03) 0.02 (0.32) Pre financing cashflow £'000 1,070 151 1,320 (1,276) 896 (551) Net assets £'000 3,264 3,082 3,008 2,685 4,268 3,310 Gross cash £'000 3,880 2,941 3,358 1,624 2,586 2,053 Working capital £'000 4,315 3,289 4,145 2,001 3,068 2,140 Long-term liabilities £'000 (2,121) (1,663) (2,290) (1,222) (1,105) (1,195)
Working capital is calculated as net current assets after adding back deferred income.

Performance
Last year represented solid progress on a number of fronts and this is particularly evident in our financial performance. Revenues were up 23 percent, from £10.3m in 2011 to £12.7m in 2012, and we are also pleased to report improvement in profitability. The EBITDA result was a profit of £1.8m compared to £1.5m in 2011. We are also very pleased to report further improvement to profit after tax, which rose to £0.3m (2011: £0.1m). Since 2010, we have steadily extended our resourcing and investment in key operational areas, as part of our ongoing growth strategy, and it is particularly pleasing to see these measures pay off in the context of improving financial performance.
We entered 2012 with plans to improve our acquisition rate of new clients and are glad to report that revenue from new clients generated 51 percent of our 2012 revenue, as compared to 21 percent in 2011.
Total license transactions including extension orders were 49 in 2012 (2011: 54). License revenues grew by 20 percent and reflected a higher average deal size, validating our expectation that smaller initial orders from the previous year would generate larger extensions in 2012. Growth in consulting and implementation services was even more marked and approached 50 percent.
From a geographical standpoint, customers headquartered in new territories such as China and the Middle East made a major contribution to the year. Our core innovation solution, Accolade® Process Manager™, continued to account for the majority of revenues at 91 percent compared to 84 percent in 2011.
At the date of this report, full-year 2013 revenue visibility incorporating booked revenue, contracted services business and the run rate of recurring contracts stands at £6.4m, compared to £6.0m at the same time last year. Revenue visibility is more fully defined in Note 4.
Strategy and Product
We have previously stated that Sopheon’s growth strategies for 2012 and beyond center on three key objectives:
• Increase our rate of growth by deploying vertical-specific marketing strategies. Coming into 2012 we realigned sales, product and marketing initiatives around target growth industries. We revised our marketing approach to be a more vertical-specific, integrated mix of tactics including digital, web-based and social media methods as well as more traditional approaches such as conferences and direct mail. Target sectors included consumer goods, food and beverage, chemical, high-tech and aerospace and defense. Although we have seen significant success in the majority of these sectors, aerospace and defense has been held back by well publicized uncertainties around government procurement.
• Broaden the use of our solutions within existing accounts. We continue to expand the range of our innovation
solutions to enable expansion within our customers. An example is our recent release of Accolade 8.2, which introduces a new module Accolade Innovation Planner™ to assist companies in creating strategic enterprise innovation plans. As reported last year, we also invested in our client growth strategy by focusing account management resources and marketing programs on growing within our customer base.
• Expand direct and indirect distribution channels to acquire new accounts. During 2011 we hired new sales people to expand our direct distribution channel. At the start of 2013, we underpinned our position in Germany through the acquisition of our reseller partner. We also continued to build our relationships with consulting partners. Evidence
6 STATEMENT FROM THE CHAIRMAN AND CHIEF EXECUTIVE OFFICER
S T A T E M E N T F R O M T h E C h A I R M A N
A N D C h I E F E x E C u T I v E O F F I C E R
Accolade is a registered trademark of Sopheon plc.Process Manager and Innovation Planner are trademarks of Sopheon plc.

of progress during 2012 included our first sale into China, through a partner, and the announcement of a joint product and service offering with Kalypso, a major consulting firm in the innovation market. In addition we won our second Saudi Arabia based customer and expect to expand into this region going forward.
Our investment in these strategic objectives started in 2011 and as we predicted, commercial results have started to come through in 2012. On the product front, in 2011 we completed a full refresh of the technology platform upon which our core software offerings are built to make them Microsoft® .net based. We also introduced a new Agile development methodology designed to build products faster and do a better job of ensuring that they are in step with real customer needs. In 2012, these changes resulted in a number of customer-focused releases, culminating in the landmark release of Accolade 8.2 at the start of 2013. With this release, Sopheon continues to extend the market leadership of the Accolade solution with expanded functionality for innovation users and business processes.
As Sopheon grows, our solutions and market position also continue to evolve. With the recent expansion of our solution footprint we have also evolved our market position. Sopheon partners with customers to provide complete Enterprise Innovation Performance solutions including software, expertise, and best practices to achieve exceptional long-term revenue growth and profitability. Sopheon’s Accolade solution provides unique, fully-integrated coverage for the entire innovation management and new product development lifecycle. For the first time, businesses can access a single source of the truth across strategic innovation planning, roadmapping, idea and concept development, process and project management, and portfolio and in-market management.
Our decision to sustain internal product development investment despite the ongoing economic uncertainty is serving us well in the present and will continue to fortify our business performance and potential in the days ahead.
People
Sopheon is differentiated in the market by its reputation for deep domain expertise in innovation management. That know-how is embodied in our people, whose best-practice understanding and experience have been developed through many years of helping top businesses achieve innovation success. We are very proud of the commitment that our people have shown in lifting Sopheon to a position of leadership in this area.
Sopheon continues to recruit, grow and develop our people. In 2011, as previously communicated, we identified that a key barrier to our ability to scale for growth was a lack of formal onboarding and certification training. During 2012, we recruited a dedicated training specialist to close this gap. We held our first formal training events during the year, which enjoyed excellent feedback. Our goal is to reduce the ramp-up time for new employees, and in turn, improve our ability to scale our organization with growth while maintaining customer satisfaction. This priority continues to have high visibility inside our company. In addition, as part of our Accolade version 8 roll out programs we offered customers packaged training classes at Sopheon facilities for the first time. The feedback and value received from our clients was overwhelmingly positive. We will expand this program in 2013.
Building on steps taken in 2011 to restructure and strengthen Sopheon’s executive management team, we were pleased to round out our executive team with the recruitment of Mike Frichol to spearhead global marketing. Mike has a great deal of experience with emerging high-growth software companies, and has held a number of senior positions in the industry at companies such as Great Plains Software, Infor, and Microsoft.
The Sopheon plc board is made up of three executive directors, augmented by three non-executive directors who bring a wealth of knowledge and experience to our business. Details about each board member can be found at the back of this report.
Outlook
We are delighted that revenues and profits for 2012 exceeded market expectations. In parallel with this positive financial performance, Sopheon continued to make strategic advances during the year. We announced major new product releases that further embed our leadership in enterprise innovation management. We started 2013 with the acquisition of a long-standing business partner in Germany, a key regional market. Through 2012 and also coming into 2013, we have continued our steady expansion of resources to keep pace with our growth plans. Nevertheless, market conditions remain hard to predict, and we continue to watch the cost base closely.
On the corporate front, we secured an additional £1.1m of convertible debt finance, giving us the confidence to continue execution of our expansion strategy. We moved our Amsterdam listing to the Alternext exchange, better suited to a company of our size. Separately, we shared our intent to undertake a corporate restructuring to reduce the accumulated deficit on the profit and loss account, and to consolidate shares. Precise details remain under review and we expect to request authorities for these changes at our 2013 annual general meeting.
Sopheon enters 2013 having made substantial progress on financial, operational and corporate fronts. We will continue our efforts in all areas and are excited by the opportunities ahead.
Barry Mence Andy MichudaExecutive Chairman Chief Executive Officer
20 March 2013
7STATEMENT FROM THE CHAIRMAN AND CHIEF EXECUTIVE OFFICER
Microsoft is a registered trademark of the Microsoft Corporation in the United States and/or in other countries.

F I N A N C I A L A N D O P E R A T I N G R E v I E W
Trading Performance
Sopheon’s consolidated turnover in 2012 was £12.7m, compared to £10.3m in 2011, an increase of 23 percent. Both regions showed good growth. Much of the EMEA region growth is attributable to substantial business sold into new territories in Asia and the Middle East. The overall shape of the business continues to be approximately one-third Europe and two-thirds North America. Currency effects had limited impact in 2012.
Total license transactions including extension orders were 49 in 2012 compared to 54 in 2011, a reduction of 9 percent. however, average revenue per transaction rose, which resulted in higher license revenues overall. historically, our license performance in the fourth quarter has tended to be very strong and to provide a substantial boost to overall annual revenues. In 2012, for the second year running, this fourth quarter spike did not come through and our strongest license quarter in the year was the second quarter.
Business Mix
The annualized average growth of the business since the launch of Accolade remains at 25 percent. Within this overall picture, maintenance revenues were broadly flat but license and services delivered increases of 20 percent and 50 percent respectively. It is particularly satisfying to see a return to license growth after a pause in 2011. Over the years we have frequently referred to the sensitivity of our license results to individual sales events. In 2011 this was compounded by an evolution of buying patterns whereby customers preferred extended validation phases, pilot projects and phased license orders as opposed to making substantial up-front orders as in the past. We expected this buying behavior to result in better license performance in 2012 and this came through as customers made extension orders. however, 2012 also saw a welcome improvement in the share of revenues from new customers as compared to existing customers, and this is a large part of the growth achieved. In 2012 just over 50 percent of the value of new business (excluding maintenance and hosting renewals) was derived from new customers, compared to 21 percent in 2011, and 38 percent in 2010. This improvement is due in part to rising market interest in our solutions but also to actions taken to reorganize and improve the focus on winning new customers, without compromising our existing customer relationships. We are very conscious that we need to continue to focus on both add-on business from existing customers as well as signing new clients; each customer represents an extended business opportunity for Sopheon to deliver value and grow revenue.
Similar to prior years certain customers reorganized and rationalized in reaction to the economic conditions, resulting in termination of their maintenance contracts. We did, however, see overall growth in the base of recurring business, which is almost £4.5m coming into 2013 compared to £4.1m coming into 2012, and £3.9m coming into 2011. This is a more substantial rise than in prior years due in part to the additional maintenance revenues brought on with the acquisition of our German business partner in January 2013. The majority of recurring income is represented by maintenance services, but also includes hosting services and license rentals. Overall, in 2012 our business delivered a 28:31:41 ratio of licenses, maintenance, and services respectively compared to 29:38:33 in the previous year.
Overall gross margins have fallen to just over 71 percent (2011: 73 percent), which can be largely attributed to the growth in service compared to license revenues and the associated higher costs. Within this overall picture, we did incur approximately £0.45m of third-party software costs (2011: £0.3m). As we have noted in prior annual reports, we anticipated that license margins will be affected by decisions to embed, rather than build, certain third-party components or methods of working into our software. This is expected to continue going forward. In the services area, the higher revenues resulted in a substantial rise in the overall cost of service resources. While subcontractor costs increased, the majority of this rise was due to actual staffing.
Research and Development Expenditure
We have continued our gradual expansion of investment in product development since 2010. This policy has resulted in actual expenditures in research and development being approximately £0.4m higher in 2012 than in 2011. In addition, this increase was boosted by the effect of providing for bonuses. The headline R&D reported in the income statement adjusts this basic expenditure for the effects of capitalization and amortization of development costs. The amount of 2012 research and development expenditure that met the criteria of IAS38 for capitalization was £1.2m (2011: £1.1m) offset by amortization charges of £1m (2011: £0.8m). These capitalized costs are largely attributable to the group’s investment in the Accolade 8.0, 8.1 and 8.2 releases.
8 FINANCIAL AND OPERATING REVIEW

As in prior years, the effect of capitalization was not completely offset by amortization, however by only £0.2m in 2012 compared to £0.3m in 2011. Accordingly, headline research and development expenditures reported in the income statement rose to £2.7m, compared to £2.2m in 2011, an overall net increase of £0.5m. A further £0.3m of amortization and impairment charges relating to acquired intangible assets (2011: £0.2m) has been charged to distribution costs. Including these costs, the overall effect of capitalization, amortization and impairment was to increase costs reported in the income statement by £0.1m.
Sopheon remains committed to product leadership, with excellence in research and software development as a critical core competency of the group. Since 2001 Sopheon’s reported research and development costs each year have been at least 20 percent of revenues reported in that year. For 2012, this metric was 21 percent (2011: 21 percent).
Operating Costs
Coming into 2012 Sopheon had 95 staff members. As noted elsewhere, during the year we steadily expanded resources in line with revenue growth, and by the end of the year the total staff count stood at 109. In addition to the impact of expanded staffing, all cost areas were affected by the fact that the improved 2012 performance led to a bonus award being made to all members of the company that participate in the corporate bonus scheme. The corporate bonus scheme covers the majority of the group’s executives and employees, with the principal exception of the sales teams for whom incentives are tied to individual or territory results. The costs of the bonus have been allocated to the relevant categories of the income statement. The group’s 2011 performance did not achieve the benchmarks required for bonus payment under the corporate scheme.
Detailed comments regarding professional services and research and development costs are noted above. headline sales and marketing costs have risen to £4.2m in 2012 compared to £3.5m in 2011. As noted above, £0.1m of this increase represents higher amortization and impairment of acquired intangible assets, leaving an actual spend increase of £0.6m. Increase in staffing is responsible for a third of this increase, reflecting the recruitment of staff in both Europe and America, and the remaining two thirds from higher commission and bonus costs linked to higher sales.
headline administration costs have risen by £0.1m. This follows a fall of £0.1m from 2010 to 2011. underlying administration costs and resourcing have remained broadly constant, as they have since 2007. The increase last year can be attributed to a blend of factors including limited expansion in resources, higher bonus costs and an increase in legal and professional fees. This last area was partly due to the company’s move to the Alternext exchange. Although administration costs will continue to be managed tightly as the group expands operational resources, we do anticipate some increase in this area in 2013 as we start to build out the group’s infrastructure to handle growth.
Results
The combined effect of the revenue and cost performance discussed above has resulted in Sopheon’s EBITDA (Earnings before Interest, Tax, Depreciation and Amortization) performance for 2012 rising to £1.8m, compared to £1.5m 2011.
In common with other technology businesses, the board believes EBITDA provides a useful indicator of the underlying performance of our business by removing the effect on earnings of tax, capital spend and financing. EBITDA is further defined and reconciled to profit before tax in Note 4. Our calculation of EBITDA is stated after charging (i) share-based payments of £38,000 (2011: £39,000); (ii) impairment charges of acquired intangible assets of £175,000 (2011: £66,000); and (iii) exchange losses of £36,000 (2011: gains of £55,000 ) but excludes depreciation and amortization charges for the year of £1.2m (2011: £1.0m) and net finance costs of £0.3m (2011: £0.4m).
Including the effect of interest, depreciation and amortization, the group reported a profit before tax for the year of £281,000 (2011: £104,000). No tax has been provided. The profit per ordinary share was 0.19p (2011: 0.07p).
Balance Sheet and Corporate
Consolidated net assets at the end of the year stood at £3.3m (2011: £3.1m). Gross cash resources at 31 December 2012 amounted to £3.9m (2011: £2.9m). Approximately £1.7m was held in uS Dollars, £1.6m in Euros and £0.6m in Sterling.
Intangible assets stood at £3.5m (2011: £3.7m) at the end of the year. This includes (i) £2.8m being the net book value of capitalized research and development (2011: £2.7m) and (ii) an additional £0.7m (2011: £1.0m) being the net book value of Alignent intangible assets acquired in 2007. The carrying value of the Alignent intangibles has been impacted by both
9FINANCIAL AND OPERATING REVIEW

amortization and impairment charges. Further details are set forth in Note 14.
In June 2007, the group entered into a $3.5m, 48-month mezzanine term loan with BlueCrest Capital Finance (“BlueCrest”), in connection with its acquisition of Alignent Software Inc. This term loan was repayable in equal monthly installments through to July 2011. In December 2010 the company signed an agreement with BlueCrest to refresh the mezzanine term loan back up to $3.5m, for a new 39-month term, repayable in equal monthly installments of $90,000 plus interest through March 2014. The loan bears interest at 13 percent per annum. No warrants were issued to BlueCrest in connection with the transaction.
In addition to the term loan, for a number of years the group has had access to a revolving line of credit with BlueCrest, secured against the trade receivables of Sopheon’s North American business and with a maximum draw capacity of $1.25m. The facility is periodically renewable and the next renewal date is 31 May 2013. As announced previously, the group has been advised that a change in ownership of BlueCrest Capital Finance may lead to uncertainty over future renewals of the facility.
To mitigate this risk, and to underpin the group’s expansion strategy, in October 2009 the company issued £0.85m of convertible unsecured loan stock (the “Loan Stock”) to a group of investors including key members of the board and senior management team. On 15 May 2012, the holders of the existing Loan Stock unanimously agreed to extend the maturity date of the Loan Stock by two years to 31 January 2015. This amendment was coupled with modification of the conversion price of the Loan Stock to 5p per share. On 23 August 2012, the investors subscribed for a further £1.15m of Loan Stock with the same maturity date of 31 January 2015 and conversion price of 5 pence per share. In accordance with the AIM Rules for Companies, Daniel Metzger, having consulted with the company’s Nominated Adviser, finnCap Limited, acted as independent director with respect to the amendment to the terms of the Loan Stock and further subscription of Loan Stock and considered that these were fair and reasonable insofar as the company’s shareholders are concerned.
Sopheon has an equity line of credit facility with GEM Global Yield Fund Limited ("GEM") was last renewed for a two-year term expiring on 23 December 2013. The facility, which has been renewed on a number of previous occasions, has been used to raise working capital once, in March 2004. This leaves approximately 90 percent of the original €10m facility available under the extended agreement. Drawings under the GEM equity line of credit are subject to conditions relating inter alia to trading volumes in Sopheon shares.
The principal risks and uncertainties facing the group are further described in the Directors’ Report on pages 21 to 22.
1 0 FINANCIAL AND OPERATING REVIEW
1 1MARKET AND SOLUTION OVERVIEW
M A R K E T A N D S O L u T I O N O v E R v I E W
How Sopheon Creates Value for Customers
Sopheon partners with customers to provide complete Enterprise Innovation Performance solutions including software, expertise, and best practices to achieve exceptional long-term revenue growth and profitability.
Sopheon’s Accolade solution provides unique, fully-integrated coverage for the entire innovation management and new product development lifecycle. This enables our customers to improve innovation and new product development performance for sustainable, profitable revenue growth.
For the first time, businesses can access a single source of the truth across:
• StrategicInnovationPlanningandRoadmapping• IdeaandConceptDevelopment• ProcessandProjectManagement• Portfolio,ResourceandIn-MarketManagement
Sopheon’s solutions have been implemented by over 200 customers with over 60,000 users in over 50 countries.
Research indicates that on average, only 50 percent of new products achieve their desired business objectives. We have helped customers implement effective innovation management processes to dramatically increase this success rate, with some as high as 85 percent.
A common innovation and new product development challenge companies face is coordinating resources to bring products to market. We help improve throughput efficiency, enabling 15-30 percent more products to be brought to market for the same investment.
Companies can increase the value of their portfolios by 75-100 percent or more, by connecting innovation planning to business objectives, developing better initiatives in the innovation funnel, more effectively managing processes, and optimizing portfolios with our Accolade solution.
Market Trends and Conditions
We see a confluence of several business, economic and market trends that play directly into Sopheon’s market position, solutions and investments. We believe that Sopheon is uniquely positioned to leverage these trends with our proven solutions, services, expertise and best practices. This unique position and belief was recently confirmed in two separate briefings with different Gartner analysts.
The following are major trends we are seeing with our customers, in the market, and from research sources where businesses are applying innovation beyond traditional product-related initiatives:
• Business Transformation – Companies are exploring innovative options to transform their business models for increased competitiveness, disruptive operating models, and greater connectedness with customers, and other strategic initiatives. Sopheon provides these companies with solutions to undertake these high-risk/high-reward initiatives with structured planning, governance and performance measurement that greatly improve success probabilities.
• Increased Operating Plan Cadence – Most companies are realizing that the traditional annual operating plan (AOP) done in spreadsheets and presentations is not effective and does not systematically drive relevant action, results and alignment in innovation initiatives. Sopheon’s solutions provide companies with the means to increase their operating plan cadence to quarterly, with integration that directly drives and connects monthly and daily operational activities with a feedback and performance loop. This condensed cadence enables the customers to operate with agility in responding to market conditions faster than the competition. Companies face increasing disruptive and unplanned events from their markets which requires an ability to quickly assess a situation, make fact-based informed decisions, and then implement appropriate actions and/or initiatives to respond in a timely or speedy manner to take advantage of market shifts. Sopheon’s solutions can be deployed across the enterprise to facilitate agility and manage the action plans for optimal results.

• Increased Rate of Services Innovation – Companies are increasingly turning their attention to services innovation for competitive differentiation, product augmentation, additional revenue opportunities and increasing profits. Sopheon’s solutions are designed from the ground up for flexibility to equally support product and/or service innovation.
• Enterprise Innovation – Customers, prospective buyers and industry analysts see the ‘top-down’ approach across the enterprise for driving innovation and managing portfolios that Sopheon has promoted for several years, as a key solution requirement to support and connect strategies and initiatives through and across the enterprise. This means that a CEO-level objective can be driven, propagated, managed and tracked through all areas and levels of the enterprise by Sopheon’s solutions. This trend calls for the enterprise to improve innovation process to gain productivity, efficiency and performance results. The flexibility with which Sopheon’s solutions can be applied uniquely supports this enterprise process need.
“In an increasingly volatile and uncertain world, competitive advantage is proving elusive. Knowing how to manage innovation, where to focus for maximum benefit, and where to develop holistic, forward-looking insight into the complex interactions between trends as they coalesce and mature are essential to success.” — Gartner, 2012
Sopheon’s Solutions
Sopheon made significant investments in our products that paid off in 2012 and will continue to generate increasing returns going forward. In 2011 we completed a multi-year effort to replace our core product platform with Microsoft .net technology – a modern software framework with increased design flexibility and an industry standard technology platform that brought new levels of efficiency to the software development process.
In 2011 we also began the journey to transition our product development process to an Agile software development methodology, which enables consistent product delivery cycles to meet customer and market needs faster and more efficiently. Our adoption of Agile also drives greater customer interaction and feedback directly into the development process. Our objective with the Agile methodology at that time was to deliver new product releases every four months. This objective was achieved in 2012. Sopheon, like most business software vendors, used to deliver new releases every 12-18 months on a particular product. Another benefit to our clients is that our Accolade 8 platform (see next paragraph) offers the flexibility to choose the timing of applying their upgrade cadence, which involves an easier and faster upgrade and installation path.
In our 2011 Annual Report we stated “Sopheon expects to introduce three significant new product releases in 2012”. We are pleased to report that we achieved our plan:
1. In April 2012 we released Accolade 8.0 – the new .net-based platform with several product enhancements including Innovation Planning, Accolade Mobile, Microsoft SharePoint® integration, and more. We also released FEI Optimizer based on Accolade Idea Lab™ as a joint solution with our partner, Kalypso for the front end of innovation, targeting consumer goods companies.
2. In July 2012 we released Accolade 8.1 with significant enhancements and additions for integrated innovation across all processes in the innovation and new product development lifecycle.
3. In December 2012 we released Accolade 8.2 with a new Accolade Portfolio Center™ that significantly expands our portfolio management, prioritization and optimization capability. The new Accolade Innovation Planner module for strategic enterprise planning and various enhancements to Stage-Gate® automation and other functionality were also included.
Feedback from customers on these 2012 releases has been very positive and while our new release cycle cadence requires customers to adjust past practices, they view this as a positive change to gain additional value from their investments in Sopheon’s solutions.
1 2 MARKET AND SOLUTION OVERVIEW
Idea Lab, Vision Strategist and Portfolio Center are trademarks of Sopheon plc.SharePoint is a registered trademark of the Microsoft Corporation in the United States and/or in other countries.Stage-Gate is a registered trademark of the Product Development Institute, Inc.

1 3MARKET AND SOLUTION OVERVIEW
Following is the current Accolade suite of offerings as we enter 2013:
"One of Philips central business strategies is to drive profitable growth through meaningful innovation… Accolade’s new features have given us the ability to model projects in a very dynamic manner and alter them quickly in response to shifts in market opportunities and needs…. We believe that these capabilities will help shorten our Idea to Market processes." — Paul de Wit
Director of Idea-to-Market Processes, Consumer Lifestyle BusinessPhilips
Growth Initiatives
We have previously stated that Sopheon’s growth strategies for 2012 and beyond center on three key objectives:
1. Invest in industry-specific vertical solutions2. Introduce new offerings to grow our existing customer base3. Expand our direct and indirect distribution channels to grow new customer acquisition
1. Invest in industry-specific vertical solutions
Last year we realigned sales, product and marketing initiatives around target growth industries. We revised our marketing approach to be more vertical-specific, and integrated a mix of tactics including digital, web-based and social media methods as well as more traditional approaches such as conferences and direct mail. Target sectors included consumer goods, food and beverage, chemical, aerospace & defense, and high-tech. During the fourth quarter of 2012 we made significant changes and investments in our global marketing organization to develop our markets and generate demand for our solutions through multiple channels including more focus on digital marketing methods, vertical industry marketing and establishing a greater presence for Sopheon in our target markets.
With Accolade release 8.2 we can now offer buyers multiple points of entry, to start in whichever area is of immediate concern—e.g. planning, portfolio, ideation, process management—and expand the solution footprint and usage as their needs evolve and capabilities mature. Buyers have additional flexible purchase options to buy only what they need to start, and to add user licenses and functionality as the solution usage and adoption expands.
Sopheon offers customers additional purchase and deployment flexibility with software rental options and Accolade Cloud hosting services.
2. Introduce new offerings to grow our existing customer base
We continue to expand the range of our innovation solutions to enable expansion within our customers. With Accolade 8.2 we can now align our solution with the innovation maturity of our customers, supporting everything from beginner to world class innovator. Accolade is designed so that different modules and functionality can be turned on and off depending on the need of the customer. This allows Sopheon to engage in long-term relationships with our customers as we work together to improve their innovation maturity and the corresponding business performance.
An example of our advancement in this regard is our recent introduction of Accolade Innovation Planner which assists companies in creating strategic enterprise innovation plans. This is a new offering never before available to our customer base. We have also started to create ‘customer only’ marketing programs to inspire cross-learning among our clients. Several such marketing events are scheduled for 2013 expanding on the success of our 2012 experience.
Sopheon’s Accolade solution provides integrated support for innovation planning, roadmapping, idea and concept development, process, project, portfolio, resource and in-market management.

3. Expand our direct and indirect distribution channels to grow new customer acquisition
During 2012 we hired new salespeople to expand our direct distribution channel in the united States and Europe. In addition, at the start of 2013 we expanded our position in Germany through the acquisition of our reseller partner. We also have our first sale into China through a new partner as part of our strategy to expand into Asia. Further, our expansion into Saudi Arabia has resulted in a second direct sale providing for a foundation in that part of the world for us to grow.
“Companies [are] making a conscious effort to pursue innovation. A sense that change is all around drives an orientation toward innovation in strategy and execution. This is a belief that surfaced again and again throughout the survey and interviews.” — Research from Forbes Insights and BMO Harris Bank
Harnessing Innovation to Jumpstart GrowthSeptember 2012
Customer and Buyer Business Challenges Addressed by Sopheon Solutions
In September 2011, Sopheon commissioned a research study done by Consumer Goods Technology (CGT) magazineto determine the common challenges companies face with their innovation and new product development initiatives. The results of this research not only validated Sopheon’s approach and value proposition, it has also provided insights for constructive consultative engagement with buyers during the sales process and on a continuing basis with customers. Some of the key insights from this study are:
• Only50percentofcompaniesreportthatnewproductlaunchesmeetprofitobjectives.• 79percentofcompanieslaunchproductstooorlatetomarket.• Only6percentofcompaniesreportthatthereisnogapinalignmentbetweenshort-termproductdevelopment
activities and long-term growth strategies.• 74percentindicatedthatingeneraltheirfront-endinnovationideasdonotsupporttheirbusinessstrategies.• Ideasat82percentofcompaniesgetstuckindevelopmenttosomemoderateorgreaterdegree.• 85percentofcompanieslackdataregardingthefeasibilityandriskassociatedwithinnovationandnewproduct
development projects.• 82percentofcompaniescan'ttellwhethertheirportfolioisalignedwithstrategictargets.• 85percentofcompaniesmakeinvestmentdecisionsbasedonpoliticsratherthandata.
Several important overriding themes from this study are apparent, primarily that companies lack the processes, functional integration and tools to make decisions and track meaningful performance. Sopheon’s Accolade solution is designed to support integrated decision-making throughout the entire innovation and new product development lifecycle.
As illustrated above, Accolade’s integrated support for the entire lifecycle enables critical decision-making at every step to help companies achieve significant innovation performance improvements across the enterprise.
1 4 MARKET AND SOLUTION OVERVIEW
What plans do we create to achieve business objectives?
Which strategies will we pursue?
How do we get morefrom our portfolio?
Is our portfolio achievingour performance goals?
Should this initiativemove forward for launch?
Should this initiativemove into development?
Which ideas/concepts support our strategic objectives?
Which ideas/conceptsare viable initiatives?

1 5MARKET AND SOLUTION OVERVIEW
“Our goal is to translate market trends and ideas from the scientific community into tangible innovations for our customers. Accolade provides us with a flexible backbone for managing our innovation projects, and it allows our senior management to have complete visibility of the projects in our innovation portfolio. Now we can prioritize our work more effectively and get our best new products to market faster.” — Manfred Hauptreif
Manager, Science Relations & Innovation ManagementBASF
Services
2012 was a busy year for our services organizations. We have gone through a major transformation organizationally in preparation for the next ‘step change’ in operating level required to support our continued growth plans.
Client Services
This organization is responsible for the business alignment between the Accolade solution and our customer needs. They deliver and configure the software, and provide rollout and training services for successful customer usage and adoption of the solutions.
We have transitioned from a regionally-based organization providing support around the world to a single global service delivery organization. Most of our customers operate globally and expect Sopheon to match their operating models. We now have a single global leader of our Customer Services organization supported by a number of global operating teams. These operating teams are customer-facing in their activities, relationships and service delivery. We have invested in the required infrastructure support to speed up the knowledge transfer and develop deep domain knowledge expected by our customers. Onboarding and transfer mentoring/training programs are now in place to expedite this learning process.
Customer Support
This organization provides on-demand customer support under our maintenance program. Similar to our Client Services organization, Customer Support has completed its transition from a regionally-based model with multiple contacts across our support organization, to a single global organization with people located across time zones to support local customer requests. The location and service enablement is transparent to our customers no matter where they are located providing consistent, high-quality service.
With the introduction of the Accolade 8 platform, our Customer Support organization led, facilitated and managed all customer upgrades with customer and Sopheon teams. Great progress was made with this key initiative in 2012 and we expect 2013 to be another very busy year for this team.
Sopheon introduced our first Customer Training Programs in 2012 which offered ongoing live training programs held at Sopheon facilities. With our inaugural year behind us we had a number of customers participate in several sessions and our customer surveys show they have been very pleased with the program. We will take customer suggestions to expand our customer training programs further in 2013.
Partnerships
Reseller Partners
Our resellers made strategic progress in a few areas in 2012:
• NewpartnershipshaveopenedtheAsianmarkettoSopheonresultinginourfirstsaleintoChina.Wearenowworking with our partner through the deployment and training process. We expect growth to take time in this region but are excited with the foundation we are laying to grow over time.
• OurpartnerinAustralasiacontinuestoexpandtheAccoladepresencewithtwonewcustomerssignedin2012.• OurUK-basedroadmappingpartnercontinuestogrowtheirmarket,signingnewlicensedealsduringtheyearand
also enjoying strong attendance at their annual conference.

Consulting Partners
2012 was a year in which we focused on growing our existing relationships with a core group of consulting services organizations, including Arthur D. Little, Deloitte, Accenture, Kalypso, and Stage-Gate International. We continue to see our ecosystem grow through relationships with such partners and have seen a good level of introduction activity. Our partners have expanded their Accolade competency and have in some cases already trained their people on Accolade 8. We anticipate we will continue to outsource services work to these partners as part of our scalability and growth plans.
We are also in discussions with a small number of potential new partners with whom we have done some initial work in the market and feel there are opportunities to learn and expand from our initial experience. We expect to sign additional consulting partners in 2013.
1 6 MARKET AND SOLUTION OVERVIEW
Sopheon provides global coverage through our locations and/or certified Valued Industry Alliance partners.
Consulting Partners
Sopheon Locations
ColoradoMinnesota
Resellers
Sweden
Italy
Germany
NL
UK
France
Israel
Saudi ArabiaIndia
Korea
New Zealand
Australia
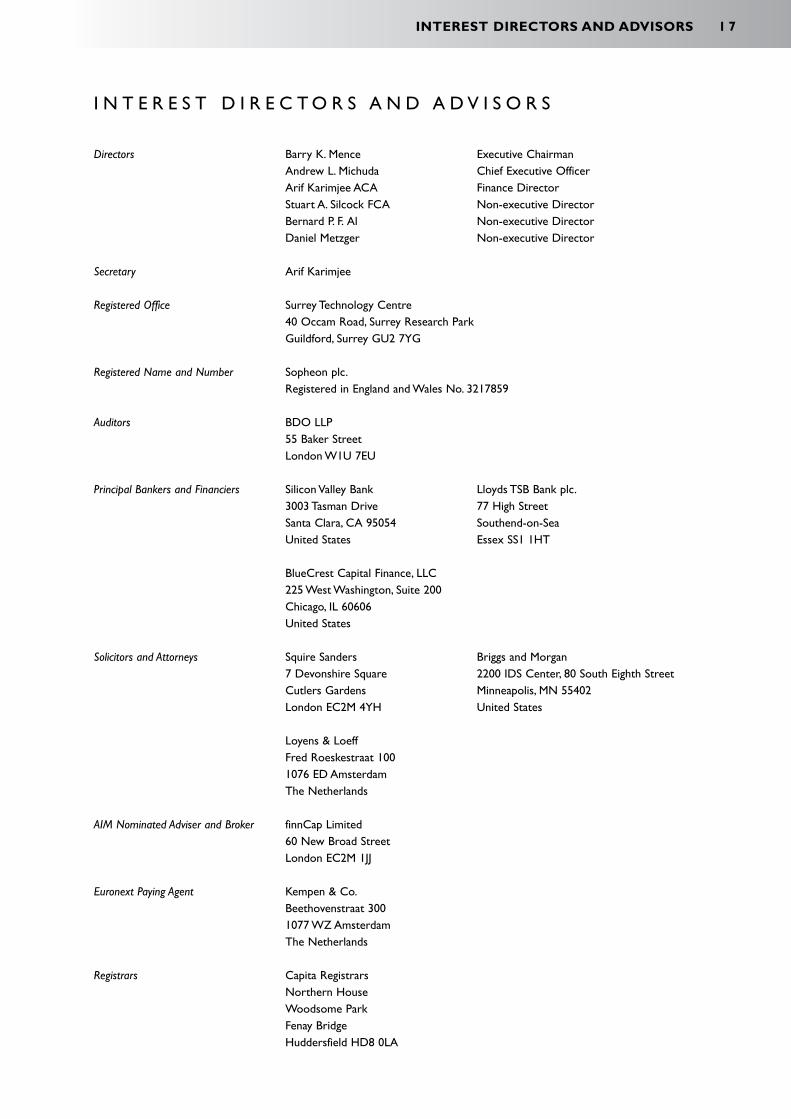
1 7INTEREST DIRECTORS AND ADVISORS
I N T E R E S T D I R E C T O R S A N D A D v I S O R S
Directors Barry K. Mence Executive Chairman Andrew L. Michuda Chief Executive Officer Arif Karimjee ACA Finance Director Stuart A. Silcock FCA Non-executive Director Bernard P. F. Al Non-executive Director Daniel Metzger Non-executive Director
Secretary Arif Karimjee
Registered Office Surrey Technology Centre 40 Occam Road, Surrey Research Park Guildford, Surrey Gu2 7YG
Registered Name and Number Sopheon plc. Registered in England and Wales No. 3217859
Auditors BDO LLP 55 Baker Street London W1u 7Eu
Principal Bankers and Financiers Silicon valley Bank Lloyds TSB Bank plc. 3003 Tasman Drive 77 high Street Santa Clara, CA 95054 Southend-on-Sea united States Essex SS1 1hT
BlueCrest Capital Finance, LLC 225 West Washington, Suite 200 Chicago, IL 60606 united States
Solicitors and Attorneys Squire Sanders Briggs and Morgan 7 Devonshire Square 2200 IDS Center, 80 South Eighth Street Cutlers Gardens Minneapolis, MN 55402 London EC2M 4Yh united States
Loyens & Loeff Fred Roeskestraat 100 1076 ED Amsterdam The Netherlands
AIM Nominated Adviser and Broker finnCap Limited 60 New Broad Street London EC2M 1JJ
Euronext Paying Agent Kempen & Co. Beethovenstraat 300 1077 WZ Amsterdam The Netherlands
Registrars Capita Registrars Northern house Woodsome Park Fenay Bridge huddersfield hD8 0LA

1 8 REPORT ON DIRECTORS’ REMUNERATION
R E P O R T O N D I R E C T O R S ’ R E M u N E R A T I O N
The remuneration committee of Sopheon plc is responsible for oversight of the contract terms, remuneration and other benefits for executive directors, including performance-related bonus schemes. The committee comprises all three non-executive directors and is chaired by B.P.F. Al. B.K. Mence would typically attend meetings of the committee as a guest by invitation. The committee makes recommendations to the board, within agreed parameters, on an overall remuneration package for executive directors and other senior executives in order to attract, retain and motivate high quality individuals capable of achieving the group’s objectives. The package for each director consists of a basic salary, benefits and pension contributions, together with performance-related bonuses and share options on a case-by-case basis. Consideration is given to pay and employment policies elsewhere in the group, especially when considering annual salary increases. During 2012, the board granted a 3 percent pay increase to executive directors as of 1 March 2012. This was consistent with the pay increase granted to the majority of the group’s employees. From time to time, the remuneration committee may take advice from appropriate remuneration consultants or to consult benchmarking data.
Contracts
The service contract between the company and Mr. Michuda is terminable on up to three months’ notice, with an additional twelve months’ salary in lieu of notice due by the company in the event of termination without cause. Service contracts between the company and the other executive directors are terminable on six to nine months’ notice.
Fees for Non-executive Directors
The fees for non-executive directors are determined by the board. The non-executive directors are not involved in any discussions or decisions about their own remuneration.
Directors’ Remuneration
Set out below is a summary of the fees and emoluments received by all directors during the year, translated where applicable into Sterling at the average rate for the period. Mr. Mence’s remuneration is largely fee-based and therefore subject to fluctuations from period to period. Mr. Michuda’s remuneration is payable in uS Dollars, the average exchange rate for which changes year on year. Benefits primarily comprise healthcare insurance and similar expenses. Details of directors’ interests in shares and options are set out in the Directors’ Report.
Pay and Fees Bonus Benefits Total Total 2012 2012 2012 2012 2011 £ £ £ £ £Executive Directors
B.K. Mence 132,787 31,500 5,278 169,565 141,816 A.L. Michuda 162,690 40,672 6,040 209,402 164,007 A. Karimjee 110,879 20,676 2,287 133,842 110,150
Non-executive Directors S.A. Silcock 20,000 - - 20,000 18,000 B.P.F. Al 20,000 - - 20,000 18,000 D. Metzger 20,000 - - 20,000 18,000 _______ _______ _______ _______ _______ 466,356 92,848 13,605 572,809 469,973 _______ _______ _______ _______ _______ _______ _______ _______ _______ _______
The remuneration committee establishes the objectives that must be met for each financial year if a cash bonus is to be paid. With the principal exception of members of Sopheon’s sales teams, for whom incentives are tied to individual or territory results, the committee concluded that the cash incentive should be tied to the financial performance of the group as a whole, and in 2011 and 2012 these objectives were set with regard to EBITDA performance. For 2012, these objectives were set such that incentive started to accrue from EBITDA of £1,600,000, after providing for the costs of the bonus itself. These measures were applied to all members of the executive board and management committee of the group, as well as the majority of the group’s employees.
In addition to the amounts disclosed above, pension contributions are made to individual directors’ personal pension schemes. During 2012 contributions of £4,875, £2,245 and £4,800 (2011: £4,875, £3,201 and £4,800) were paid respectively to the pension schemes of B.K. Mence, A.L. Michuda and A. Karimjee.

1 9REPORT ON DIRECTORS’ REMUNERATION
Performance Graph
The following graph shows the company’s share price performance on AIM since January 2006, compared with the performance of the FTSE AIM All Share index, which has been selected for this comparison as it is a broad-based index which the directors believe most closely reflects the performance of companies with similar characteristics as the company’s.
Directors’ Interests
The interests of the directors, who held office at the end of the year, in the share capital of the company (all beneficially held except those marked with an asterisk(*), which are held as trustee), were as follows: 8% Convertible Share Options Ordinary Shares Loan Stock
At 31 December 2012 2011 2012 2011 2012 2011
B.K. Mence 484,500 462,500 14,430,535 14,430,535 £640,000 £200,000A.L. Michuda 3,997,594 3,942,932 155,188 155,188 £45,000 £20,000A. Karimjee 1,150,000 1,137,500 87,667 87,667 £27,000 £12,000S.A. Silcock - - 950,000 950,000 £200,000 £100,000S.A. Silcock* - - 76,639 76,639 - -B.P.F. Al 25,000 - 650,000 650,000 £60,000 £40,000D. Metzger - - 100,000 100,000 - -
Of the 14,430,535 ordinary shares mentioned above B.K. Mence beneficially owns and is the registered holder of 10,129,715 ordinary shares. A further 2,300,820 ordinary shares are held by Inkberrow Limited, a company in which B.K. Mence is the majority shareholder and in which S.A. Silcock is a minority shareholder. In addition B.K. Mence is, or his wife or children are, potential beneficiaries under trusts holding an aggregate of 2,000,000 ordinary shares.
Aim All-Share (rebased to Sopheon)Sopheon
30
25
20
15
10
5
-
Pri
ce (
p)/v
alue
2006
2007
2008
2009
2010
2011
2012
2013

The following table provides summary information for each of the directors who held office during the year and who held options to subscribe for Sopheon ordinary shares. All options were granted without monetary consideration.
Date of Exercise At 31 Granted Expired At 31 Grant Price December During During December 2011 Year Year 2012 B.K. Mence (1) 30 April 2002 14.75p 100,000 - (100,000) -B.K. Mence (4) 15 April 2005 25.25p 62,500 - - 62,500B.K. Mence (6) 3 May 2006 22p 100,000 - - 100,000B.K. Mence (8) 29 June 2007 19p 100,000 - - 100,000B.K. Mence (8) 1 April 2008 13.25p 100,000 - - 100,000B.K. Mence (9) 29 September 2012 5.25p - 122,500 - 122,500A.L. Michuda (2) 30 April 2002 14.75p 487,932 - (487,932) -A.L. Michuda (2)(3) 5 November 2003 16.25p 2,225,000 - (2,225,000) -A.L. Michuda (4) 15 April 2005 25.25p 150,000 - - 150,000A.L. Michuda (6) 3 May 2006 22p 100,000 - - 100,000A.L. Michuda (7) 29 June 2007 19p 250,000 - - 250,000A.L. Michuda (4)(8) 1 April 2008 13.25p 250,000 - - 250,000A.L. Michuda (4) 27 June 2008 14p 230,000 - - 230,000A.L. Michuda (4) 27 August 2010 7.5p 250,000 - - 250,000A.L. Michuda (9) 29 September 2012 5.25p - 2,767,594 - 2,767,594A. Karimjee (1) 30 April 2002 14.75p 150,000 - (150,000) -A. Karimjee (3)(5) 5 November 2003 16.25p 300,000 - (300,000) -A. Karimjee (4) 15 April 2005 25.25p 62,500 - - 62,500A. Karimjee (6) 3 May 2006 22p 100,000 - - 100,000A. Karimjee 7) 29 June 2007 19p 100,000 - - 100,000A. Karimjee (4)(8) 1 April 2008 13.25p 175,000 - - 175,000A. Karimjee (4) 27 June 2008 14p 100,000 - - 100,000A. Karimjee (4) 27 August 2010 7.5p 150,000 - - 150,000A. Karimjee (9) 29 September 2012 5.25p - 462,500 - 462,500
None of the directors exercised any share options during the year.(1) Exercisable between the third and tenth anniversary of the date of grant.(2) One third of these options are exercisable from the date of grant, one third from the first anniversary of the date of grant and one third from the second anniversary.(3) vesting of a proportion of these options was subject to performance conditions relating to the achievement of positive EBITDA in two successive quarters. The conditions were met. These options, which were due to expire in 2013, were cancelled on 30 September 2012. (4) One third of these options are exercisable from the first anniversary of the date of grant, one third from the second anniversary, and the remainder from the third anniversary.(5) 93,846 of these options are exercisable between the third and tenth anniversary of the date of grant and 206,154 options are exercisable as to one third immediately and one third on each of the first and second anniversaries of the date of grant.(6) vesting of one half of these options was subject to performance conditions based on the achievement of certain financial objectives in 2006. The conditions were met.(7) vesting of one half of these options was subject to performance conditions based on the achievement of certain financial objectives in 2007. The conditions were met.(8) vesting of one half of these options was subject to performance conditions based on the achievement of certain financial objectives in 2008. The conditions were met.(9) These options are replacement options for options which expired in 2011 and 2012 and options due to expire in 2013 which were cancelled during 2012. They vest evenly over the three year period following grant.
The mid-market price of Sopheon ordinary shares at 31 December 2012 was 7.21p. During the financial year the mid-market price of Sopheon ordinary shares ranged from 5.5p to 8.45p.
Save as disclosed above, no director (or member of his family) or connected persons has any interest, beneficial or non-beneficial, in the share capital of the company.
Approved by the board on 20 March 2013 and signed on its behalf by:A. Karimjee Director
2 0 REPORT ON DIRECTORS’ REMUNERATION

D I R E C T O R S ’ R E P O R T
The group’s principal activities during the year continued to focus on the provision of software and services that improve the return on investment of product development, within the rapidly emerging product lifecycle management (PLM) market. A review of the development of the business during the year is given in the Statement from the Chairman and Chief Executive Officer on page xx and the subsequent Financial and Operating Review. This also includes reference to the group’s future prospects. An overview of the group’s products and markets incorporating advances in research and development is provided on page 6. The group’s result for the year ended 31 December 2012 is a profit after tax of £281,000 (2011: profit after tax of £104,000). The directors do not intend to declare a dividend.
Corporate Governance
The Sopheon board is committed to high standards of corporate governance and aims to follow appropriate governance practice, although as a company incorporated in the uK and listed on AIM and Alternext the company is not subject to the requirements of the uK Corporate Governance Code or the Netherlands Tabaksblat Committee. The board currently comprises three executive directors and three independent non-executive directors. Their biographies appear at the back of this annual report, and demonstrate a range of experience and caliber to bring the right level of independent judgment to the board.
The board is responsible for the group’s system of internal control and for reviewing its effectiveness. Such a system can only provide reasonable, but not absolute, assurance against material misstatement or loss. The board believes that the group has internal control systems in place appropriate to the size and nature of its business. The board is satisfied that the scale of the group’s activities do not warrant the establishment of an internal audit function. The board is also responsible for identifying the major business risks faced by the group and for determining the appropriate course of action to manage those risks. Formal meetings are held quarterly to review strategy, management and performance of the group, with additional meetings between those dates convened as necessary. During 2012, all directors attended all meetings either in person or by conference call. The audit committee, which comprises all of the non-executive directors and is chaired by Stuart Silcock, considers and determines actions in respect of any control or financial reporting issues they have identified or that are raised by the auditors. The board has a formal schedule of matters specifically reserved to it for decision. Details of the constitution of the remuneration committee are provided in the Report on Directors’ Remuneration on page 18.
Principal Risk Areas
As with any business at its stage of development, Sopheon faces a number of risks and uncertainties. The board monitors these risks on a regular basis. The key areas of risk identified by the board are summarized below.
Sopheon’s markets continue to be at a relatively early stage of development and it is possible that Sopheon's products may not sell in the quantities or at the prices required to achieve sustained profitability. The broad market for Sopheon’s software products continues to emerge and evolve. Sopheon has sought to focus its resources on the sub-segments that it believes offer the best short-term opportunity for growth, and on developing functionality which its research indicates customers in those segments require. however, determining the potential size, growth rate and needs of a particular market segment remains challenging. This risk has become particularly relevant in view of the economic turmoil that has affected the global economy. Sopheon continues to monitor market needs carefully, and has formalized processes for soliciting input to product strategy from analysts and customers.
Sopheon’s prospects of achieving sustained profitability are dependent on meeting sales targets. Sopheon has in past years experienced substantial net losses due, in part, to its investment in product development and marketing but also due to the fact that the timing and size of individual sales can have a substantial impact on performance in a given period. Sopheon’s ability to continue to finance its activities through to the point that its operations become cash generative on a sustained basis is dependent on the group maintaining sales growth alongside its investment strategy, or in the absence of such growth, its ability to secure funding through the company's facilities or other sources. Sopheon management carefully monitors short- and medium-term financing requirements and has regularly raised additional funding resources to meet requirements. Details of the resources available to Sopheon and the reasons why management consider that the company is able to continue as a going concern are set out in Note 2 to the financial statements.
Some of Sopheon’s competitors and potential competitors have greater financial resources than Sopheon. Sopheon remains a relatively small organization by global standards. Its resources are dwarfed by those of many larger companies that are capable of developing competitive solutions and it is difficult to overcome the marketing engine of a large global firm. Sopheon seeks to compete effectively with such companies by keeping its market communications focused, clear and consistent with its product and market strategy, and working to deliver first class quality of execution so that referenceability of the customer base is maximized.
2 1DIRECTORS’ REPORT
Sopheon is dependent upon skilled personnel, the loss of whom could have a material impact. While service agreements have been entered into with key executives, retention of key members of staff cannot be guaranteed and departure of such employees could be damaging in the short term. In addition the competition for qualified employees continues to be difficult and retaining key employees has become accordingly more challenging and expensive. As a relatively small business, Sopheon is more exposed to this risk than some of its larger competitors. Sopheon management checks staff remuneration against recognized benchmarks and other industry sources, and seeks to maintain pay at competitive levels appropriate to its business.
Sopheon will require relationships with partners who are able to market and implement its products. historically, Sopheon has devoted substantial resources to the direct marketing of its products, and its strategy to enter into strategic alliances and other collaborative relationships to widen the customer base and create a broad sales and implementation channel for its products is not yet mature. The successful implementation of this strategy is crucial to Sopheon’s prospects and its ability to scale effectively. however, Sopheon cannot be sure that it will select the right partners, or that the partners it does select will devote adequate resources to promoting, selling and becoming familiar with Sopheon's products. Over the years Sopheon has built up a network of both resellers and consulting partners, however this has yet to mature and the revenues delivered through these relationships remain a relatively small part of the total.
Sopheon could be subject to claims for damages for errors in its products and services. Sopheon may be exposed to claims for damages from customers in the event that there are errors in its software products or should support and maintenance service level agreements fail to meet agreed criteria. Sopheon has sought to protect itself from such risks through its development methodologies, its contract terms and insurance policies, and is not aware of any such claims at this time.
Share Option Schemes
Details of options granted are shown in Note 28 to the financial statements.
Supplier Payment Policy and Practice
It is the company’s policy that payments to suppliers are made in accordance with those terms and conditions agreed between the company and its suppliers, provided that all trading terms and conditions have been complied with. At 31 December 2012 the company had approximately 35 days’ purchases outstanding (2011: 21 days).
Charitable and Political Donations
The group has made no charitable or political donations during the year.
Auditors
All of the current directors have taken all the steps that they ought to have taken to make themselves aware of any information needed by the company’s auditors for the purposes of their audit and to ensure that the auditors are aware of that information. The directors are not aware of any relevant audit information of which the auditors are unaware. A resolution to reappoint BDO LLP as auditors will be put to the members at the Annual General Meeting.
Financial Instruments
Details of the group’s financial instruments and its policies with regard to financial risk management are given in Note 23 to the financial statements
Substantial Shareholdings
The directors are aware of the following persons who as at 20 March 2013 were interested directly or indirectly in 3 percent or more of the company’s issued ordinary shares: No. of % Issued Ordinary Shares Ordinary SharesNameB.K. Mence (director) 14,430,535 9.9Rivomore Limited 16,191,260 11.1
B.K. Mence’s interest represents direct beneficial holdings as well as those of his family.
Approved by the board on 20 March 2013 and signed on its behalf by:
A. Karimjee Director
2 2 DIRECTORS' REPORT

2 3STATEMENT OF DIRECTORS’ RESPONSIBILITIES
S T A T E M E N T O F D I R E C T O R S ’ R E S P O N S I B I L I T I E S
I N R E S P E C T O F T h E F I N A N C I A L S T A T E M E N T S
Company law requires the directors to prepare financial statements for each financial year. under that law the directors have elected to prepare the group and company financial statements in accordance with International Financial Reporting Standards (IFRSs) as adopted by the European union. under company law the directors must not approve the financial statements unless they are satisfied that they give a true and fair view of the state of affairs of the group and company and of the profit or loss of the group for that period. The directors are also required to prepare financial statements in accordance with the rules of the London Stock Exchange for companies trading securities on the Alternative Investment Market and the rules of the NYSE Alternext Amsterdam Stock Exchange.
In preparing these financial statements, the directors are required to:
• selectsuitableaccountingpoliciesandthenapplythemconsistently;• makejudgmentsandaccountingestimatesthatarereasonableandprudent;• statewhethertheyhavebeenpreparedinaccordancewithIFRSsasadoptedbytheEuropeanUnion,subjecttoany
material departures disclosed and explained in the financial statements; and• preparethefinancialstatementsonthegoingconcernbasisunlessitisinappropriatetopresumethatthecompany
will continue in business.
The directors are responsible for keeping adequate accounting records that are sufficient to show and explain the company’s transactions and disclose with reasonable accuracy at any time the financial position of the company and enable them to ensure that the financial statements comply with the requirements of the Companies Act 2006. They are also responsible for safeguarding the assets of the company and hence for taking reasonable steps for the prevention and detection of fraud and other irregularities.
Website Publication
The directors are responsible for ensuring the annual report is made available on a website. Annual reports are published on the company's website in accordance with legislation in the united Kingdom governing the preparation and dissemination of financial statements, which may vary from legislation in other jurisdictions. The maintenance and integrity of the company's website is the responsibility of the directors. The directors' responsibility also extends to the ongoing integrity of the annual reports contained therein.

I N D E P E N D E N T A u D I T O R S ’ R E P O R T T O T h E
M E M B E R S O F S O P h E O N P L C
We have audited the financial statements of Sopheon plc for the year ended 31 December 2012 which comprise the consolidated income statement, the consolidated statement of comprehensive income, the consolidated and company balance sheets, the consolidated and company cash flow statements, the consolidated and company statements of changes in equity, and the related notes. The financial reporting framework that has been applied in their preparation is applicable law and International Financial Reporting Standards (IFRSs) as adopted by the European union and, as regards the parent company financial statements, as applied in accordance with the provisions of the Companies Act 2006.
This report is made solely to the company’s members, as a body, in accordance with Chapter 3 of Part 16 of the Companies Act 2006. Our audit work has been undertaken so that we might state to the company’s members those matters we are required to state to them in an auditor’s report and for no other purpose. To the fullest extent permitted by law, we do not accept or assume responsibility to anyone other than the company and the company’s members as a body, for our audit work, for this report, or for the opinions we have formed.
Respective Responsibilities of Directors and Auditors
As explained more fully in the statement of directors’ responsibilities, the directors are responsible for the preparation of the financial statements and for being satisfied that they give a true and fair view. Our responsibility is to audit the financial statements in accordance with applicable law and International Standards on Auditing (uK and Ireland). Those standards require us to comply with the Auditing Practices Board’s (APB’s) Ethical Standards for Auditors.
Scope of the Audit of the Financial Statements
A description of the scope of an audit of financial statements is provided on the APB’s website at www.frc.org.uk/apb/scope/private.cfm
Opinion on Financial Statements
In our opinion:
•thefinancialstatementsgiveatrueandfairviewofthestateofthegroup’sandtheparentcompany’saffairsasat31December 2012 and of the group’s profit for the year then ended;
• thegroupfinancialstatementshavebeenproperlypreparedinaccordancewithIFRSsasadoptedbytheEuropeanunion;
• theparentcompanyfinancialstatementshavebeenproperlypreparedinaccordancewithIFRSsasadoptedbytheEuropean union; and
• thefinancialstatementshavebeenpreparedinaccordancewiththerequirementsoftheCompaniesAct2006.
Opinion on Other Matters Prescribed by the Companies Act 2006
In our opinion the information given in the Directors’ Report for the financial year for which the financial statements are prepared is consistent with the financial statements.
2 4 INDEPENDENT AUDITORS’ REPORT TO THE MEMBERS OF SOPHEON PLC

Matters on Which We are Required to Report by Exception
We have nothing to report in respect of the following matters where the Companies Act 2006 requires us to report to you if, in our opinion:
•adequateaccountingrecordshavenotbeenkeptbytheparentcompany,orreturnsadequateforouraudithavenotbeen received from branches not visited by us; or
• theparentcompanyfinancialstatementsarenotinagreementwiththeaccountingrecordsandreturns;or• certaindisclosuresofdirectors’remunerationspecifiedbylawarenotmade;or• wehavenotreceivedalltheinformationandexplanationswerequireforouraudit.
Julian Frost (senior statutory auditor)For and on behalf of BDO LLP, statutory auditor55 Baker StreetLondon W1u 7Euunited Kingdom
20 March 2013
BDO LLP is a limited liability partnership registered in England and Wales (with registered number OC305127).
2 5INDEPENDENT AUDITORS’ REPORT TO THE MEMBERS OF SOPHEON PLC

C O N S O L I D A T E D I N C O M E S T A T E M E N T
F O R T h E Y E A R E N D E D 3 1 D E C E M B E R 2 0 1 2 Notes 2012 2011 £’000 £’000 Revenue 3 12,663 10,276 Cost of sales (3,612) (2,731) _______ _______
Gross profit 9,051 7,545
Sales and marketing expense (4,238) (3,533)Research and development expense (2,696) (2,173) Administrative expense (1,510) (1,377) _______ _______
Operating profit 607 462 Finance income 8 9 8Finance expense 9 (335) (366) _______ _______
Profit before tax 281 104 Income tax expense 10 - - _______ _______
Profit for the year 281 104 _______ _______Earnings per shareBasic and fully diluted (pence) 12 0.19p 0.07p _______ _______ _______ _______
C O N S O L I D A T E D S T A T E M E N T O F C O M P R E h E N S I v E
I N C O M E F O R T h E Y E A R E N D E D 3 1 D E C E M B E R 2 0 1 2 2012 2011 £’000 £’000 Profit for the year 281 104 Other comprehensive incomeExchange differences on translation of foreign operations (187) (58) _______ _______ Total comprehensive income for the year 94 46 _______ _______ _______ _______
2 6 FINANCIAL STATEMENTS

C O N S O L I D A T E D A N D C O M P A N Y B A L A N C E S h E E T S
A T 3 1 D E C E M B E R 2 0 1 2
Group Company Notes 2012 2011 2012 2011 £’000 £’000 £’000 £’000Assets
Non-current Assets
Property, plant and equipment 13 197 166 - -Intangible assets 14 3,522 3,748 - -Investments in subsidiaries 15 - - 6,119 6,119 Other receivable 16 12 12 - - –––––––– –––––––– –––––––– ––––––––Total non-current assets 3,731 3,926 6,119 6,119 –––––––– –––––––– –––––––– ––––––––Current Assets
Trade and other receivables 17 3,959 3,265 - -Cash and cash equivalents 18 3,880 2,941 1,455 703 –––––––– –––––––– –––––––– ––––––––Total current assets 7,838 6,206 1,455 703 –––––––– –––––––– –––––––– ––––––––Total assets 11,570 10,132 7,574 6,822
Liabilities
Current Liabilities
Trade and other payables 19 2,386 1,467 363 301Borrowings 20 1,136 1,448 - -Obligations under finance leases 21 1 2 - -Deferred revenue 2,662 2,470 - - –––––––– –––––––– –––––––– ––––––––Total current liabilities 6,185 5,387 363 301 –––––––– –––––––– –––––––– ––––––––Non-current Liabilities
Borrowings 20 2,121 1,663 1,959 823 –––––––– –––––––– –––––––– ––––––––Total non-current liabilities 2,121 1,663 1,959 823 –––––––– –––––––– –––––––– –––––––– Total liabilities 8,306 7,050 2,322 1,124 –––––––– –––––––– –––––––– ––––––––Net assets 3,264 3,082 5,252 5,698 –––––––– –––––––– –––––––– –––––––– –––––––– –––––––– –––––––– ––––––––Equity
Share capital 24 7,279 7,279 7,279 7,279Capital reserves 25 55,619 55,803 55,619 55,803Translation reserve 175 362 - -Retained losses (59,809) (60,362) (57,646) (57,384) –––––––– –––––––– –––––––– ––––––––Total equity 3,264 3,082 5,252 5,698 –––––––– –––––––– –––––––– –––––––– –––––––– –––––––– –––––––– ––––––––
Approved by the board and authorized for issue on 20 March 2013.
Barry K. Mence Arif KarimjeeDirector Director
2 7FINANCIAL STATEMENTS

C O N S O L I D A T E D A N D C O M P A N Y C A S h F L O W
S T A T E M E N T S F O R T h E Y E A R E N D E D
3 1 D E C E M B E R 2 0 1 2
Group Company Notes 2012 2011 2012 2011 £’000 £’000 £’000 £’000Operating Activities
Profit for the year 281 104 (534) 42
Adjustments for:Finance income (9) (8) - (1)Finance costs 335 366 132 83Depreciation of property, plant and equipment 98 101 - -Amortization and impairment of intangible assets 1,273 994 - -Share-based payment expense 38 39 38 39Intra-group credits and charges - - (290) (250)Provisions against intra-group loans - - 115 (270) –––––––– –––––––– –––––––– ––––––––Operating cash flows before movements in working capital 2,016 1,596 (539) (357) Decrease/(increase) in receivables (744) 855 - (2)Increase/(decrease) in payables 1,135 (1,123) 62 (134) –––––––– –––––––– –––––––– ––––––––Net cash generated from/(used in) operating activities 2,407 1,328 (477) (493) –––––––– –––––––– –––––––– ––––––––
Investing Activities
Finance income 9 8 - 1Purchases of property, plant and equipment (136) (125) - -Development costs capitalized (1,210) (1,060) - -Intra-group loans - - (1,915) (803)Repayment of intra-group loans - - 2,091 1,323 –––––––– –––––––– –––––––– ––––––––
Net cash from/(used in) investing activities (1,337) (1,177) 176 521 –––––––– –––––––– –––––––– ––––––––
Financing Activities
Issue of convertible loan stock 1,150 - 1,150 -Repayment of borrowings (681) (673) - -(Decrease)/increase in lines of credit (252) 442 - -Interest paid (301) (342) (97) (59) –––––––– –––––––– –––––––– ––––––––Net cash from financing activities (84) (573) 1,053 (59) –––––––– –––––––– –––––––– ––––––––Net increase/(decrease) in cash and cash equivalents 986 (422) 752 (31) Cash and cash equivalents at the beginning of the year 2,941 3,358 703 734Effect of foreign exchange rate changes (47) 5 - - –––––––– –––––––– –––––––– ––––––––Cash and cash equivalents at the end of the year 18 3,880 2,941 1,455 703 –––––––– –––––––– –––––––– –––––––– –––––––– –––––––– –––––––– ––––––––
2 8 FINANCIAL STATEMENTS

C O N S O L I D A T E D A N D C O M P A N Y S T A T E M E N T S O F
C h A N G E S I N E Q u I T Y F O R T h E Y E A R E N D E D
3 1 D E C E M B E R 2 0 1 2
Group Share Capital Translation Retained Capital Reserves Reserve Losses Total £’000 £’000 £’000 £’000 £’000
At 1 January 2011 7,279 73,719 420 (78,410) 3,008Profit for the year - - - 104 104Exchange differences on translation of foreign operations - - (58) - (58) –––––––– –––––––– –––––––– –––––––– ––––––––Total comprehensive income for the year - - (58) 104 46 –––––––– –––––––– –––––––– –––––––– ––––––––Recognition of share-based payments - 39 - - 39Purchase of shares by Esot (Note 25) - (11) - - (11)Transfer of merger reserve to profit and loss reserve (see Note 25) - (17,944) - 17,944 - –––––––– –––––––– –––––––– –––––––– ––––––––At 1 January 2012 7,279 55,803 362 (60,362) 3,082Profit for the year - - - 281 281Exchange differences on translation of foreign operations - - (187) - (187) –––––––– –––––––– –––––––– –––––––– ––––––––Total comprehensive income for the year - - (187) 281 94 –––––––– –––––––– –––––––– –––––––– ––––––––Recognition of share-based payments - 38 - - 38Lapsing or expiry of share options - (272) - 272 -Equity element of convertible loan stock issued - 50 - - 50 –––––––– –––––––– –––––––– –––––––– ––––––––At 31 December 2012 7,279 55,619 175 (59,801) 3,264 –––––––– –––––––– –––––––– –––––––– –––––––– –––––––– –––––––– –––––––– –––––––– ––––––––
The translation reserve represents accumulated differences on the translation of assets and liabilities of foreign operations. Retained losses represent accumulated trading losses, including amortization and impairment charges in respect of goodwill and intangible assets arising from past acquisitions. Details and description of the capital reserves are set out in Note 25.
Company Share Capital Retained Capital Reserves Losses Total £’000 £’000 £’000 £’000
At 1 January 2011 7,279 65,954 (67,605) 5,628Profit and total comprehensive income for the year - - 42 42Recognition of share-based payments - 39 - 39Purchase of shares by Esot (Note 25) - (11) - (11)Transfer of merger reserve to profit and loss reserve (see Note 25) - (10,179) 10,179 - –––––––– –––––––– –––––––– ––––––––At 1 January 2012 7,279 55,803 (57,384) 5,698Profit and total comprehensive income for the year - - (534) (534) Recognition of share-based payments - 38 - 38Lapsing or expiry of share options - (272) 272 -Equity element of convertible loan stock issued - 50 - 50 –––––––– –––––––– –––––––– ––––––––At 31 December 2012 7,279 55,619 (57,646) 5,252 –––––––– –––––––– –––––––– –––––––– –––––––– –––––––– –––––––– ––––––––
2 9FINANCIAL STATEMENTS
1 . G E N E R A L I N F O R M AT I O N
Sopheon plc ("the company") is a public limited company incorporated in England and Wales. The address of its registered office and principal place of business is set out on page 17. The principal activities of the company and its subsidiaries are described in Note 3. The financial statements have been prepared in Pounds Sterling and rounded to the nearest thousand.
2 . S I G N I F I C A N T A C C O U N T I N G P O L I C I E S
The financial statements have been prepared in accordance with International Financial Reporting Standards and Interpretations issued by the International Accounting Standards Board as adopted by the European union and those parts of the Companies Act 2006 which apply to companies preparing their financial statements under IFRS. The principal accounting policies are set out below. The policies have been applied consistently to all the years presented.
A number of new standards, amendments and interpretations to existing standards have been adopted by the group, but have not been listed, since they have no material impact on the financial statements. None of the new standards, amendments and interpretations in issue but not yet effective are expected to have a material effect on the financial statements.
Going Concern
The financial statements have been prepared on a going concern basis. In reaching their assessment, the directors have considered a period extending at least 12 months from the date of approval of these financial statements. This assessment has included consideration of the forecast performance of the business for the foreseeable future, the cash and financing facilities available to the group, and the repayment terms in respect of the group’s borrowings, including the potential of having to repay convertible loan stock in January 2015.
During 2012, the group achieved revenues of £12.7m and a profit before tax of £281,000. This represents an improvement compared to the previous year. The performance in 2011 was flat over 2010. Coming into 2013, the group’s sales pipeline remains very active, and accordingly, the directors remain positive about the prospects for the business. In December 2010 the group renegotiated its loan note from BlueCrest Capital Finance (“BlueCrest”) for a new principal value of $3.5m, which brought in new working capital of approximately $2.7m. The principal is repayable in equal monthly installments of $90,000, plus interest, through March 2014. The group also has access to a revolving line of credit with BlueCrest which is secured against the trade receivables of Sopheon’s North American business. This facility is periodically renewable, and the current term is to 31 May 2013. The facility limit is $1,250,000. At 31 December 2012, $800,000 (£495,000) was drawn against this revolving facility. In addition, during 2012 the group extended a convertible loan to key investors from £850,000 to £2,000,000. The loan is repayable or convertible by 31 January 2015. Notwithstanding the group’s stable funding and trading position, the time-to-close and the order value of individual sales continues to vary considerably. When combined with the relatively low-volume and high-value nature of the group’s business, these are factors which constrain the ability to accurately predict revenue performance. In addition, to meet its strategic objectives, the group has expanded its staff levels. If sales fall short of expectations, there is a risk that the group’s facilities may prove insufficient to cover both operating activities and the repayment of its debt facilities, which latter point could be due to the regular repayment of the BlueCrest term loan, the possibility of non-renewal of the BlueCrest revolving line of credit, or the possibility of having to repay in cash £2,000,000 of convertible loan stock on 31 January 2015. In such circumstances, the group would be obliged to seek additional funding. The directors have concluded that the circumstances set forth above represent uncertainties, however they believe that taken as a whole, the factors described above enable the group to continue as a going concern for the foreseeable future. The financial statements do not include the adjustments that would be required if the company or group were unable to continue as a going concern.
Basis of Consolidation
The consolidated financial statements incorporate the financial statements of the company and entities controlled by the company ("subsidiaries"). Control is achieved where the company has the power to govern the financial and operating policies of an entity and to obtain benefits from its activities. All intra-group transactions, balances, income and expenses are eliminated on consolidation.
3 0 NOTES TO THE FINANCIAL STATEMENTS

Business Combinations
The acquisition of subsidiaries is accounted for within the consolidated financial statements using the purchase method, as set out within IFRS 3 Business Combinations for acquisitions made on or before 1 January 2010. The cost of the acquisition is measured at the aggregate of the fair values at the date of exchange, of assets given, liabilities incurred or assumed, and equity instruments issued by the group in exchange for control of the entity being acquired, together with any costs directly attributable to the business combination. The results of the acquired entities are included in the consolidated income statement from the date on which effective control is obtained. The identifiable assets, liabilities and contingent liabilities of the entity being acquired that meet the conditions for recognition are recognized at their fair values of the date of acquisition.
Identifiable intangible assets are capitalized at fair value as at the date of acquisition. The useful lives of these intangible assets are assessed and amortization is charged on a straight-line basis, with the expense taken to the income statement within sales and marketing expense (in respect of customer relationships) and research and development expense (in respect of IPR and technology). Intangible assets are tested for impairment when a trigger event occurs. useful lives are also examined on an annual basis and adjustments, where applicable, are made on a prospective basis.
Goodwill
Goodwill arising on the acquisition of a subsidiary represents the excess of the cost of acquisition over the group’s interest in the net fair value of the identifiable assets, liabilities and contingent liabilities of the subsidiary at the date of acquisition. Goodwill is initially recognized at cost and is subsequently measured at cost less any accumulated impairment losses.
For the purposes of impairment testing, goodwill is allocated to those cash-generating units of the group expected to benefit from the synergies of the business combination. Cash-generating units to which goodwill has been allocated are tested for impairment annually, or more frequently when there is an indication that the unit may be impaired. If the recoverable amount of the cash-generating unit is less than the carrying value of the unit, the impairment loss is allocated firstly to reduce the carrying cost of any goodwill allocated to the unit and then to any other assets of the unit pro rata to the carrying value of each asset of the unit. An impairment loss recognized for goodwill is not reversed in a subsequent period.
Revenue Recognition
Revenue is measured at the fair value of the consideration received or receivable and represents amounts receivable for goods and services provided in the normal course of business, net of discounts and sales-related taxes.
Sales of software products are recognized on delivery, provided that no significant obligations remain owing to the customer in connection with such product sale. Such significant obligations could include giving a customer a right to return the software product without any preconditions, or if the group has failed to deliver an element of the software product by the balance sheet date. Revenues relating to maintenance and post-contract support agreements are deferred and recognized over the period of the agreements.
Revenues from implementation and consultancy services are recognized as the services are performed, or in the case of fixed price or milestone-based projects, on a percentage basis as the work is completed and any relevant milestones are met, using latest estimates to determine the expected duration and cost of the project.
Leases
Assets held under finance leases are recognized as assets of the group at their fair value at the inception of the lease or, if lower, at the net present value of the minimum lease payments. The corresponding liability to the lessor is included in the balance sheet as a finance lease obligation. Lease payments are apportioned between finance charges and reduction of the lease obligation so as to achieve a constant rate of interest on the remaining balance of the liability. Finance charges are charged to the income statement.
Rentals payable under operating leases are charged to the income statement on a straight-line basis over the term of the relevant lease.
3 1NOTES TO THE FINANCIAL STATEMENTS

Interest on Borrowings
All interest on borrowings is recognized in the income statement in the period in which it is incurred.
Retirement Benefit Costs
Payments to defined contribution retirement benefit plans are charged as an expense as they fall due. The group does not operate any defined benefit retirement benefit plans.
Foreign Currencies
The individual financial statements of each group entity are presented in the currency of the primary economic environment in which the entity operates (its functional currency). In preparing the financial statements of the individual entities, transactions in currencies other than the entity’s functional currency (foreign currencies) are recorded at rates approximating to the transaction rates. At each balance sheet date, monetary items denominated in foreign currencies are retranslated at the rates prevailing on the balance sheet date. Exchange differences arising on the settlement of monetary items, and on the retranslation of monetary items, are included in the income statement for the period.
For the purpose of presenting consolidated financial statements, the assets and liabilities of the group’s foreign operations are expressed in Sterling using exchange rates prevailing on the balance sheet date. Income and expense items (including comparatives) are translated at the average exchange rates for the period. Exchange differences arising (including exchange differences on intra-group loans where there is no intention that these should be settled) are classified as equity and transferred to the group’s translation reserve. Such translation differences are recognized in the income statement in the period in which the foreign operation is disposed of.
On disposal of a foreign operation the cumulative exchange differences recognized in the foreign exchange reserve relating to that operation up to the date of disposal are transferred to the income statement as part of the profit or loss on disposal.
Deferred Tax
Deferred tax is recognized on differences between the carrying amounts of assets and liabilities in the financial statements and the corresponding tax bases used in the computation of taxable profit, and is accounted for using the balance sheet liability method. Deferred tax liabilities are generally recognized for all taxable temporary differences, but deferred tax assets are recognized only to the extent that it is probable that taxable profits will be available against which deductible temporary differences can be utilized.
Deferred tax is calculated at tax rates that have been enacted or substantively enacted at the balance sheet date, and that are expected to apply in the period when the liability is settled or the asset realized. Deferred tax is charged or credited to profit or loss, except when it relates to items charged or credited directly to equity, in which case the deferred tax is also dealt with in equity.
Property, Plant and Equipment
Computer equipment and fixtures and fittings are stated at cost less accumulated depreciation and any accumulated impairment losses. Depreciation is charged so as to write off the costs of assets over their estimated useful lives, using the straight-line method.
Assets held under finance leases are depreciated over their expected useful lives on the same basis as owned assets, or, when shorter, over the term of the relevant lease.
The gain or loss arising on the disposal or retirement of an item of property, plant and equipment is determined as the difference between the sale proceeds and the carrying amount of the asset and is recognized in the income statement.
The following rates are used for the depreciation of property, plant and equipment:
Computer equipment 20-33 percent on a straight-line basisFurniture and fittings 20-25 percent on a straight-line basis
3 2 NOTES TO THE FINANCIAL STATEMENTS

Investments
Investments in subsidiaries within the company balance sheet are stated at cost less impairment. Impairment tests are undertaken whenever events or changes in circumstances indicate that their carrying amount may not be recoverable. Where the carrying value of an investment exceeds its recoverable amount, the investment is written down accordingly.
Externally Acquired Intangible Assets
Externally acquired intangible assets are initially recognized at their fair values at the date of acquisition and are subsequently amortized on a straight-line basis over their useful economic lives. The amortization expense in respect of externally acquired technology and intellectual property (“IPR”) is included in research and development costs in the income statement, and the amortization expense in respect of externally acquired customer relationships is included in sales and marketing expense.
Internally Generated Intangible Assets (Research and Development Expenditure)
Development expenditure on internally developed software products is capitalized if it can be demonstrated that:•itistechnicallyfeasibletodeveloptheproduct;•adequateresourcesareavailabletocompletethedevelopment;•thereisanintentiontocompleteandselltheproduct;•thegroupisabletoselltheproduct;•salesoftheproductwillgeneratefutureeconomicbenefits;and•expenditureontheproductcanbemeasuredreliably.
Capitalized development costs are amortized over the period over which the group expects to benefit from selling the product developed. This has been estimated to be four years from the date of code-finalization of the applicable software release. The amortization expense in respect of internally generated intangible assets is included in research and development costs.
Development costs not satisfying the above criteria and expenditure on the research phase of internal projects are recognized in the income statement as incurred.
Impairment of Tangible and Intangible Assets (Excluding Goodwill)
At each balance sheet date, the group reviews the carrying amounts of its tangible and intangible assets to determine whether there is any indication that those assets have suffered an impairment loss. If any such indication exists, the recoverable amount of the asset is estimated in order to determine the extent of the impairment loss (if any). Where it is not possible to estimate the recoverable amount of an individual asset, the group estimates the recoverable amount of the cash-generating unit to which the asset belongs.
Recoverable amount is the higher of the fair value less costs to sell and value in use. In assessing the value in use, the estimated future cash flows are discounted to their net present value using a pre-tax discount rate that reflects current market assessments of the time value of money and the risks specific to the asset.
If the recoverable amount of an asset or cash-generating unit is estimated to be less than its carrying amount, the carrying amount of the asset or cash-generating unit is reduced to its recoverable amount. An impairment loss is recognized immediately in the administrative expenses line item in the income statement.
Where an impairment loss subsequently reverses, the carrying value of the asset or cash-generating unit is increased to the revised recoverable amount, but so that the increased carrying amount does not exceed the carrying amount which would have been determined had no impairment loss been recognized in prior years. A reversal of an impairment loss is recognized immediately in profit or loss.
3 3NOTES TO THE FINANCIAL STATEMENTS

Financial Instruments
1. Financial Assets
The group’s financial assets fall into the category of loans and receivables. The group does not have any financial assets in the categories of fair value through profit and loss or available for sale. The group has not classified any of its financial assets as held to maturity.
unless otherwise indicated, the carrying values of the group’s financial assets are a reasonable approximation of their fair values.
Loans and Receivables
These assets are non-derivative financial assets with fixed or determinable payments that are not quoted in an active market. They arise principally through the provision of goods and services (e.g. trade receivables) but also include cash and cash equivalents and other types of contractual monetary asset. They are initially recognized at fair value plus transaction costs that are directly attributable to the acquisition or issue and subsequently carried at amortized cost using the effective interest rate method, less provision for impairment. The effect of discounting on these financial instruments is not considered material.
Impairment provisions are recognized when there is objective evidence (such as significant financial difficulties, default or significant delay in payment on the part of the counter-party) that the group will be unable to collect all the amounts due under the terms of the receivable, the amount of such provision being the difference between the net carrying amount and the present value of the future expected cash flows associated with the receivable. For trade receivables, such provisions are recorded in a separate allowance account with the loss being recognized within administrative expenses in the income statement. On confirmation that the trade receivable will not be collectable, the gross carrying value of the asset is written off against the associated provision.
2. Financial Liabilities
The group classifies its financial liabilities in the category of financial liabilities at amortized cost.
Financial liabilities measured at amortized cost include:
• Tradepayablesandothershort-datedmonetaryliabilities,whichareinitiallyrecognizedatfairvalueandsubsequentlycarried at amortized cost using the effective interest rate method.
• Bankandotherborrowings(includingthehostdebtelementoftheconvertibleloannotedabove),whichareinitiallyrecognized at fair value net of any transaction costs directly attributable to the acquisition of the instrument. Such interest-bearing liabilities are subsequently measured at amortized cost using the effective interest rate method, which ensures that the interest expense over the period to repayment is at a constant rate on the balance of the liability carried in the balance sheet. Interest expense in this context includes initial transaction costs and premiums payable on redemption, as well as any interest payable while the liability is outstanding.
unless otherwise indicated, the carrying values of the group’s financial liabilities measured at amortized cost represent a reasonable approximation of their fair values.
3. Convertible Loan Stock
The host debt element of convertible loan stock is treated as a financial liability measured at amortized cost as further described above. The equity component of convertible loan stock arising on issue is reclassified from debt to capital reserves.
3 4 NOTES TO THE FINANCIAL STATEMENTS
4. Share Capital
Financial instruments issued by the group are treated as equity only to the extent that they do not meet the definition of a financial liability. The group’s ordinary shares are classified as equity. For the purpose of the disclosures given in Note 23(f) the group considers its capital to comprise its ordinary share capital, share premium and other capital reserves less its accumulated retained loss.
Share-based Payments
The group issues equity-settled share-based payments to certain employees. Equity-settled share-based payments are measured at fair value (excluding the effect of non-market-based vesting conditions) at the date of grant. The fair value determined at the date of grant is expensed on a straight-line basis over the vesting period, based on the group’s estimate of the shares that will eventually vest and adjusted for the effect of non-market-based vesting conditions.
Fair value is measured by the binomial option-pricing model. The expected life used in the model had been adjusted, based on management’s best estimate, for the effects of non-transferability, exercise restrictions and behavioral considerations.
As set out in Note 24, the group has also issued warrants to certain financing institutions which are also treated as equity-settled share-based payments.
Significant Accounting Estimates and Judgments
Management is required to make judgments, estimates and assumptions about the carrying amounts of assets and liabilities that are not readily apparent from other sources. The estimates and associated assumptions are based on historical experience and other factors that are considered to be relevant. Estimates and judgments adopted for property plant and equipment, externally acquired intangible assets and internally generated intangible assets are dealt with in the accounting policy notes set forth above that relate to these areas. Actual results may differ from these estimates, and accordingly they are reviewed on an ongoing basis. Revisions to accounting estimates are recognized in the period in which the estimate is revised if the revision affects only that period, or in the period of the revision and future periods if the revision affects both current and future periods.
3 5NOTES TO THE FINANCIAL STATEMENTS

3 . S E G M E N TA L A N A LY S I S
All of the group’s revenue in respect of the years ended 31 December 2012 and 2011 is derived from the design, development and marketing of software products with associated implementation and consultancy services, as more particularly described in the Directors’ Report. For management purposes, the group is organized geographically across two principal operating segments, which can be expressed geographically. The first segment is North America, and the second Europe, Middle East and Africa (EMEA). Information relating to these two segments is given below.
The information in the following table relating to external revenues includes analysis both by location of customer and by location of operations. The information relating to other items provides analysis by location of operations only. Inter-segment revenues are priced on an arm’s length basis.
Year ended 31 December 2012 North America EMEA Total £’000 £’000 £’000
Income StatementExternal revenues – by location of operations 7,792 4,871 12,663Operating profit before interest and tax 139 469 607 Finance income - 9 9Finance expense (202) (134) (336) Profit before tax (64) 345 281 Depreciation, amortization and impairment charges (1,191) (5) (1,196)EBITDA 1,330 473 1,803 –––––––– –––––––– ––––––––Balance Sheet Fixed asset additions 117 19 136 Capitalization of internally generated development costs 1,211 - 1,211Total assets 7,665 3,799 11,464Total liabilities (4,804) (3,437) (8,241) –––––––– –––––––– –––––––– –––––––– –––––––– ––––––––
Year ended 31 December 2011 North America EMEA Total £’000 £’000 £’000Income StatementExternal revenues – by location of operations 7,189 3,087 10,276Operating profit before interest and tax (139) 601 462 Finance income - 8 8Finance expense (281) (85) (366) Profit before tax (420) 524 104 Depreciation, amortization and impairment charges (1,090) (5) (1,095) EBITDA 884 607 1,491 –––––––– –––––––– ––––––––Balance Sheet Fixed asset additions 100 25 125Capitalization of internally generated development costs 1,060 - 1,060Total assets 7,701 2,431 10,132 Total liabilities (4,924) (2,126) (7,050) –––––––– –––––––– –––––––– –––––––– –––––––– ––––––––
One customer accounted for approximately 16 percent of the group’s revenues in 2012. A different customer accounted for approximately 10 percent or more of the group’s sales in 2011.
External revenues in 2012 exclude inter-segmental revenues which amounted to £1,245,000 (2011: £793,000) for North America and £215,000 (2011: £192,000) for EMEA.
Revenues attributable to customers in North America in 2012 amounted to £7,084,000 (2011: £6,565,000). Revenue attributable to customers in the Rest of the World amounted to £5,579,000 (2011: £3,711,000) of which £2,920,000 (2011: £3,546,000) was attributable to customers in the Eu. The segmental analysis above has been presented using information that is readily available to management.
3 6 NOTES TO THE FINANCIAL STATEMENTS

4 . E B I T D A A N D R E V E N U E V I S I B I L I T Y
EBITDA
The directors consider that EBITDA, which is defined as earnings/(loss) before interest, tax, depreciation and amortization, is an important measure, since it is widely used by the investment community. It is calculated as follows:
2012 2011 £’000 £’000
Profit for the year after tax 281 104 Interest payable 335 366 Interest receivable (9) (8) Amortization of intangible assets 1,098 928 Depreciation of property, plant and equipment 98 101 Income tax expense - - –––––––– ––––––––EBITDA 1,803 1,491 –––––––– –––––––– –––––––– ––––––––Revenue Visibility
Another performance indicator used by the group and referred to in narrative descriptions of the group’s performance is revenue visibility. At any point in time it comprises revenue expected from (i) closed license orders, including those which are contracted but conditional on acceptance decisions scheduled later in the year; (ii) contracted services business delivered or expected to be delivered in the year; and (iii) recurring maintenance, hosting and rental streams. The visibility calculation does not include revenues from new sales opportunities expected to close during the remainder of the year.
5 . P R O F I T F O R T H E Y E A R
The profit for the year has been arrived at after charging/(crediting):
2012 2011 £’000 £’000Continuing Operations Net foreign exchange (gains) 36 (55)Research and development costs (excluding amortization) 1,698 1,363Amortization of intangible assets 1,098 928Impairment of intangible assets 175 66Depreciation of property, plant and equipment 98 101Operating lease rentals – land and buildings 319 328 Operating lease rentals – other 74 80 –––––––– –––––––– –––––––– ––––––––
Net foreign exchange losses or gains arise on the translation of certain cash and trade balances held in Euros and uS Dollars and are accordingly included in administration expense.
6 . A U D I TO R S ’ R E M U N E R AT I O N
During the year the group obtained the following services from its auditors and associated firms. Fees for the audit of subsidiaries pursuant to legislation are not segregated from those for the group and are included in the amounts disclosed.
2012 2011 £’000 £’000
Audit of the financial statements of the group 50 50Review of interim financial information 10 10Audit of uS pension plan 5 5Tax services 24 35 –––––––– –––––––– –––––––– ––––––––
3 7NOTES TO THE FINANCIAL STATEMENTS

7 . S TA F F C O S T S 2012 2011 £’000 £’000 Wages and salaries 6,784 5,662 Social security costs 539 453 Pension contributions 134 123 Employee benefits expense 439 509 ––––––– ––––––– 7,896 6,747 –––––––– –––––––– –––––––– ––––––––
Included within the above are staff costs capitalized as development expenditure amounting to £1,210,000 (2011: £1,060,000). Included within wages and salaries are bonus and sales commission costs amounting to £833,000 (2011: £311,000).
The average monthly number of employees during the year was made up as follows: 2012 2011 Number Number Development and operations 70 61Sales and management 32 31 ––––––– ––––––– 102 92 –––––––– –––––––– –––––––– ––––––––
The above staff costs and the numbers of employees during the year include the executive directors. The remuneration of all directors was as follows: 2012 2011 £’000 £’000 Fees and emoluments 573 470Pension contributions 12 13 –––––––– –––––––– 585 483 –––––––– –––––––– –––––––– ––––––––
No director exercised share options during the year (2011: None). Pension contributions are to personal defined contribution schemes and have been made for three directors (2011: three) who served during the year.
Full details of directors’ remuneration are disclosed in the Report on Directors’ Remuneration on page 18.
8 . F I N A N C E I N C O M E 2012 2011 £’000 £’000Income on financial assets measured at amortized cost Interest income on bank deposits 9 8 –––––––– –––––––– –––––––– ––––––––
9 . F I N A N C E E X P E N S E 2012 2011 £’000 £’000 Interest expense on financial liabilities measured at amortized cost Interest on borrowings (335) (366) –––––––– –––––––– –––––––– ––––––––
3 8 NOTES TO THE FINANCIAL STATEMENTS

1 0 . I N C O M E TA X E X P E N S E 2012 2011 £’000 £’000
Income tax expense for the year – current tax - - –––––––– –––––––– –––––––– ––––––––
The charge for the year can be reconciled to the accounting profit as follows: 2012 2011 £’000 £’000 Profit before tax 281 104 –––––––– –––––––– –––––––– –––––––– Tax (charge) at the uK corporation tax rate of 24.5% (2011: 26.5%) (69) (28)Adjustment for differing rates of corporate taxation in overseas jurisdictions (12) (22) Tax effect of expenses that are not deductible in determining taxable losses (99) (98)Temporary differences arising from the capitalization and amortization of internally generated development costs 52 79utilization of prior year losses 128 69 –––––––– ––––––––Income tax expense for the year - - –––––––– –––––––– –––––––– ––––––––There is no tax arising on other comprehensive income.
The group has an unrecognized deferred tax asset arising from its unrelieved trading losses, which has not been recognized owing to uncertainty as to the level and timing of taxable profits in the future. The unrecognized deferred tax asset is made up as follows: 2012 2011 £’000 £’000
Shortfall of tax depreciation compared to book depreciation 165 165 Effect of timing differences arising from capitalization of internally generated development costs (994) (1,100)unrelieved trading losses 13,448 14,457 –––––––– ––––––––unrecognized deferred tax asset 12,619 13,522 –––––––– –––––––– –––––––– ––––––––
At 31 December 2012, tax losses estimated at £44m were available to carry forward by the Sopheon group, arising from historic losses incurred. These losses represent a potential deferred tax asset of £13.4m, based on the tax rates currently applicable in the relevant tax jurisdictions.
Of these tax losses, an aggregate amount of £8.5m (representing £3.0m of the potential deferred tax asset) represents pre-acquisition tax losses of Sopheon Corporation (Minnesota) and Alignent Software, Inc. The future utilization of these losses may be restricted under Section 382 of the uS Internal Revenue Code, whereby the ability to utilize net operating losses arising prior to a change of ownership is limited to a percentage of the entity value of the corporation at the date of change of ownership.
1 1 . L O S S D E A LT W I T H I N T H E F I N A N C I A L S TAT E M E N T S O F T H E
PA R E N T C O M PA N Y
The loss dealt with in the financial statements of the parent company for the year ended 31 December 2012 was £534,000 (2011: profit of £42,000). Advantage has been taken of Section 408 of the Companies Act 2006 not to present an income statement for the parent company.
3 9NOTES TO THE FINANCIAL STATEMENTS

1 2 . E A R N I N G S P E R S H A R E
2012 2011 £’000 £’000 Profit after tax 281 104 –––––––– –––––––– –––––––– –––––––– ’000s ’000sWeighted average number of ordinary shares for the purpose of basic earnings per share 145,579 145,579 –––––––– –––––––– –––––––– –––––––– The profit attributable to ordinary shareholders and the weighted average number of ordinary shares for the purpose of calculating the diluted earnings per ordinary share are the same as those used for calculating the basic earnings per ordinary share in both 2012 and 2011. This is (i) because the exercise of conversion rights attaching to the convertible loan stock (details of which are set out in Note 20), would have the effect in each year of increasing earnings per ordinary share (by virtue of the saving of loan stock interest, which would otherwise be payable, and of interest receivable on subscription proceeds), and are therefore not dilutive; and (ii) because the warrants to subscribe for 502,790 ordinary shares and the 12,739,930 share options to subscribe for ordinary shares (details of which are set out in Notes 24 and 28), either have a strike price above the average market price for the year, or have an immaterial impact.
1 3 . P R O P E R T Y, P L A N T A N D E Q U I P M E N T Group Computer Furniture Equipment & Fittings Total £’000 £’000 £’000CostAt 1 January 2011 2,260 434 2,694Additions 97 28 125Exchange differences 10 3 13Amounts written off (1,559) (279) (1,838) –––––––– –––––––– ––––––––At 1 January 2012 808 186 994Additions 127 9 136Exchange differences (35) (8) (43) –––––––– –––––––– ––––––––At 31 December 2012 900 187 1,087 –––––––– –––––––– ––––––––Accumulated DepreciationAt 1 January 2011 2,129 424 2,553Depreciation charge for the year 95 6 101Exchange differences 9 3 12Amounts written off (1,559) (279) (1,838) –––––––– –––––––– ––––––––At 1 January 2012 674 154 828Depreciation charge for the year 91 7 98Exchange differences (29) (7) (36) –––––––– –––––––– ––––––––At 31 December 2012 736 154 890 –––––––– –––––––– ––––––––Carrying Amount At 31 December 2012 164 33 197 –––––––– –––––––– –––––––– –––––––– –––––––– ––––––––At 31 December 2011 134 32 166 –––––––– –––––––– –––––––– –––––––– –––––––– ––––––––
The net carrying amount of property, plant and equipment includes £1,000 (2011: £2,000) in respect of assets held under finance leases.
CompanyThe company has no property, plant and equipment.
4 0 NOTES TO THE FINANCIAL STATEMENTS

1 4 . I N TA N G I B L E A S S E T S Development Technology Customer Goodwill Total Costs and IPR Relationships (Internally Generated) £’000 £’000 £’000 £’000 £’000CostAt 1 January 2011 6,307 891 1,670 627 9,495Additions (internally generated) 1,060 - - - 1,060Exchange differences 121 11 21 8 161 –––––––– –––––––– –––––––– –––––––– ––––––––At 1 January 2012 7,488 902 1,691 635 10,716Additions (internally generated) 1,210 - - - 1,210Exchange differences (348) (40) (74) (27) (489) –––––––– –––––––– –––––––– –––––––– ––––––––At 31 December 2012 8,350 862 1,617 608 11,437 –––––––– –––––––– –––––––– –––––––– ––––––––AmortizationAt 1 January 2011 3,894 575 652 - 5,121Charge for the year 764 46 118 - 928Exchange differences 78 10 13 - 101 –––––––– –––––––– –––––––– –––––––– ––––––––At 1 January 2012 4,736 631 783 - 6,150Charge for the year 998 - 100 - 1,098Exchange differences (224) (28) (35) - (287) –––––––– –––––––– –––––––– –––––––– ––––––––At 31 December 2012 5,510 603 848 - 6,961 –––––––– –––––––– –––––––– –––––––– ––––––––At 1 January 2011 - 268 473 - 741Impairment losses in year - - 66 - 66Exchange differences - 3 8 - 11 –––––––– –––––––– –––––––– –––––––– ––––––––At 1 January 2012 - 271 547 - 818Impairment losses in year - - 175 - 175Exchange differences - (12) (27) - (39) –––––––– –––––––– –––––––– –––––––– ––––––––At 31 December 2012 - 259 695 - 954 –––––––– –––––––– –––––––– –––––––– ––––––––Carrying AmountAt 31 December 2012 2,840 - 74 608 3,522 –––––––– –––––––– –––––––– –––––––– –––––––– –––––––– –––––––– –––––––– –––––––– –––––––– At 31 December 2011 2,752 - 361 635 3,748 –––––––– –––––––– –––––––– –––––––– –––––––– –––––––– –––––––– –––––––– –––––––– ––––––––
The amortization period for the internally generated development costs relating to the group’s software products is four years. The amortization periods for (a) technology & IPR and (b) customer relationships, arising from the acquisition of Alignent Software, Inc. in June 2007, are four years and eight years respectively. Goodwill is not amortized. The residual goodwill arising on the acquisition of Alignent is attributable to the enhanced market position of each of the group’s operating segments, due to the completeness of the solution that Sopheon can offer the market, in addition to the ability to penetrate wholly new markets such as aerospace and defense for the overall product set. The recoverable amount of the goodwill can be underpinned on a value in use basis by the expected performance of each of the group’s operating segments.
The valuation used for this purpose is based on cash-flow projections for the next two years, then extrapolated using a pre-tax discount rate of 14.6 percent and an annual growth assumption of 20 percent for four years, and thereafter for an indefinite period at a growth assumption of 3 percent. Sensitivity analysis performed on these projections demonstrates significant valuation headroom above the carrying value of goodwill even if the growth rate for the four year period is reduced to 5 percent. The annualized average growth of the business since the launch of the group’s core Accolade solution is approximately 25 percent.
The initial valuation of the intangible assets acquired with Alignent relating to technology and IPR, and to customer relationships, used an income-based approach. The recurring income from certain acquired Alignent customer base has or is expected to fall, due to a mix of factors including the conversion of certain rental licenses to perpetual, changes in rental levels, and cancellations. The overall reduction exceeds the rate of attrition of such recurring income estimated in the original valuation exercise, leading to impairments in the carrying value of the acquired Alignent customer relationships of £175,000 (2011: £66,000).
All other assumptions of the original valuation have been retained in the impairment review. The valuation exercise, and the recoverable amount of the intangible assets and goodwill, are based on value in use with a pre-tax discount rate of 14.6 percent. The remaining amortization period for the acquired Alignent customer relationships is 3.5 years.
CompanyThe company has no intangible assets.
4 1NOTES TO THE FINANCIAL STATEMENTS

1 5 . I N V E S T M E N T I N S U B S I D I A R I E S
At 31 December 2011 and at 31 December 2012 Company £’000
Cost 41,560Less: Amounts provided (35,441) ––––––––Carrying amount 6,119 –––––––– ––––––––
Details of the company’s subsidiaries at 31 December 2012 are set out below. Companies marked with an asterisk(*) are held via Sopheon uK Ltd and those with an obelus(†) are held via Orbital Software holdings plc. The common stock of Alignent Software, Inc. is held by Sopheon Corporation, Delaware, uSA.
Name of Company Nature of Ownership Proportion of Nature of BusinessPlace of Incorporation Interest Voting Rights Held Sopheon Corporation Common Stock 100% Software sales and services Minnesota, uSA Sopheon Corporation Common Stock 100% Software development and salesDelaware, uSA Alignent Software, Inc. Common Stock 100% Software sales and servicesCalifornia, uSA Sopheon Nv Ordinary Shares 100% Software sales and servicesThe Netherlands Sopheon uK Ltd Ordinary Shares 100% Software sales and servicesunited Kingdom Orbital Software holdings plc Ordinary Shares 100% holding companyunited Kingdom Orbital Software Inc.† Common Stock 100% DormantDelaware, uSA Sopheon Edinburgh Ltd† Ordinary Shares 100% Dormantunited Kingdom Orbital Software Europe Ltd† Ordinary Shares 100% Dormantunited Kingdom Network Managers (uK) Ltd* Ordinary Shares 100% Dormantunited Kingdom AppliedNet Ltd* Ordinary Shares 100% Dormantunited Kingdom Future Tense Ltd* Ordinary Shares 100% Dormantunited Kingdom Polydoc Ltd Ordinary Shares 100% Dormantunited Kingdom Applied Network Technology Ltd* Ordinary Shares 100% Employee Share Ownershipunited Kingdom Trust
4 2 NOTES TO THE FINANCIAL STATEMENTS

1 6 . OT H E R R E C E I VA B L E Group Company
2012 2011 2012 2011 £’000 £’000 £’000 £’000 Other receivable 12 12 - - –––––––– –––––––– –––––––– –––––––– –––––––– –––––––– –––––––– ––––––––
The other receivable represents a deposit paid in respect of a property leased by the group.
1 7 . T R A D E A N D OT H E R R E C E I VA B L E S
Group Company
2012 2011 2012 2011 £’000 £’000 £’000 £’000
Trade receivables 3,547 3,103 - -Other receivables 4 5 - - –––––––– –––––––– –––––––– ––––––––Total receivables 3,551 3,108 - -Prepayments 290 145 - 9Accrued income 118 12 - - –––––––– –––––––– –––––––– –––––––– 3,959 3,265 - 9 –––––––– –––––––– –––––––– –––––––– –––––––– –––––––– –––––––– –––––––– Trade and other receivables are stated net of allowances totaling £24,000 (2011: £30,000) for estimated irrecoverable amounts. The directors consider that the carrying amount of trade and other receivables approximates to their fair value. A full provision has been made against amounts totaling £40,015,000 (2011: £40,191,000) owed to the company by subsidiary undertakings, which are due after more than one year and are subordinated to the claims of all other creditors.
1 8 . C A S H A N D S H O R T- T E R M B A N K D E P O S I T S Group Company 2012 2011 2012 2011 £’000 £’000 £’000 £’000 Cash at bank 3,129 1,824 1,398 133Short-term bank deposits 751 1,117 57 570 –––––––– –––––––– –––––––– –––––––– 3,880 2,941 1,455 703 –––––––– –––––––– –––––––– –––––––– –––––––– –––––––– –––––––– –––––––– Cash and short-term bank deposits comprise cash held by the group, bank current accounts and short-term bank deposit accounts with maturities of three months or less and bearing interest at variable rates. The carrying amount of these assets represents a reasonable approximation to their fair value. Included in cash at bank of the group is an amount of £23,000 (2011: £23,000) held by the group’s employee share ownership trust.
4 3NOTES TO THE FINANCIAL STATEMENTS

1 9 . T R A D E A N D OT H E R PAYA B L E S Group Company
2012 2011 2012 2011 £’000 £’000 £’000 £’000 Trade payables 717 344 29 24Other payables 113 114 107 103 Tax and social security costs 231 221 - -Accruals 1,325 788 227 174 –––––––– –––––––– –––––––– –––––––– 2,386 1,467 363 301 –––––––– –––––––– –––––––– –––––––– –––––––– –––––––– –––––––– –––––––– Trade payables principally comprise amounts outstanding for trade purchases and ongoing costs. The directors consider that the carrying amounts of trade and other payables represent a reasonable approximation to their fair values.
2 0 . B O R R O W I N G S
Group Company 2012 2011 2012 2011 £’000 £’000 £’000 £’000 Current Loans and BorrowingsLine of credit 495 776 - - Loan notes (current portion) 641 672 - - –––––––– –––––––– –––––––– ––––––––Total current loans and borrowings 1,136 1,448 - -
Non-current Loans and BorrowingsLoan notes 162 840 - -8% convertible loan stock 2015 1,959 823 1,959 823 –––––––– –––––––– –––––––– ––––––––Total non-current loans and borrowings 2,121 1,663 1,959 823 –––––––– –––––––– –––––––– ––––––––Total loans and borrowings 3,257 3,111 1,959 823 –––––––– –––––––– –––––––– –––––––– –––––––– –––––––– –––––––– –––––––– a) Line of Credit The line of credit is denominated in uS Dollars and bears interest at a variable rate currently 10.95 percent. The line of credit is a revolving facility limited to the lesser of $1,250,000 and 75 percent of the eligible trade receivables of the group’s uS subsidiaries, which at 31 December 2012 amounted to $3,865,000 (£2,391,000) (2011: $3,483,000 (£2,252,000)). At 31 December 2012 $800,000 (£495,000) was drawn down under the line of credit facility (2011: $1,200,000 (£776,000)). b) Loan Notes The loan notes are denominated in uS Dollars and represent mezzanine loan finance provided by BlueCrest Capital Finance LLC (“BlueCrest”). The loan notes were issued in June 2007 for an initial principal amount of $3,500,000 repayable in equal installments over the four-year period to July 2011 bearing interest at a fixed rate of 11.03 percent. On 8 December 2010 the group entered into a new mezzanine loan with BlueCrest, for an amount of $3,500,000, equal to the principal amount of the original loan. Part of the proceeds after expenses were applied in repayment of the remaining balance outstanding on the original mezzanine loan, with the balance to provide additional working capital of approximately $2.7m for the group. The new mezzanine loan is repayable in 39 monthly installments of $90,000, together with interest at a fixed rate of 13 percent per annum, over the period to March 2014.
4 4 NOTES TO THE FINANCIAL STATEMENTS

The mezzanine loan and the line of credit, which is also provided by BlueCrest, are secured by a debenture and guarantee provided by Sopheon plc. The company has estimated the risk of this guarantee being called at 5 percent of the carrying value of the loan, and in its financial statements has included a provision for this amount within other payables. The directors consider that the carrying amounts for loan notes, and the line of credit, represent a reasonable approximation of the financial instruments’ fair values.
c) 8 Percent Convertible Loan Stock 2015 The convertible loan stock is denominated in Sterling and bears interest at a fixed rate of 8 percent per annum. The loan stock was issued at par in a nominal amount of £850,000 on 1 October 2009 with a maturity date of 30 September 2011. The original terms provided that the loan stock was convertible into Sopheon ordinary shares at a conversion price of 10p per share, and contained provisions for the amendment of the conversion price in the case of any subsequent equity issues by the company at a price per share lower than the conversion price. On 8 December 2010, the holders of the loan stock unanimously agreed to extend the maturity date by a further sixteen months to 31 January 2013 and to amend the conversion price to 7.75p. At the same time, the provisions for future amendment of the conversion price were removed, and the carrying value of the equity component represented by the conversion rights attaching to the loan stock, which amounted at that date to £51,000, was reclassified from debt to equity in the financial statements. On 15 May 2012 the maturity of the loan stock was extended by a further two years to 31 January 2015 and the conversion price was amended to 5p per share (representing a premium of 0.25p over the closing mid-market price of 4.75p for Sopheon shares on 14 May 2012). On 23 August 2012 the company made a further issue of loan stock in a nominal amount of £1,150,000 bearing the same interest rate, and with the same maturity date and conversion price, as the existing loan stock. The closing mid-market price of Sopheon shares on 22 August 2012 was 5p. Following this issue, the aggregate liability at maturity of the loan stock increased from £850,000 to £2,000,000. This transaction has resulted in an increase of £50,000 in the carrying value of the equity component represented by the conversion rights attaching to the loan stock, and this amount has been transferred from debt to equity in the financial statements. As set out below, of the total investment in further issue of £1,150,000, members of the board and management or their families subscribed for £665,000.
Initial Further Total £’000 £’000 £’000 Barry Mence, Chairman 200 440 640Stuart Silcock, Non-executive Director 100 100 200Bernard Al, Non-executive Director 40 20 60Andrew Michuda, Chief Executive Officer 20 25 45Arif Karimjee, Chief Financial Officer 12 15 27Other Members of Sopheon Management 43 65 98External Investors 435 485 930 –––––––– –––––––– ––––––––Total 850 1,150 2,000 –––––––– –––––––– –––––––– –––––––– –––––––– ––––––––
Of the £485,000 of Further Loan Stock being subscribed by external investors, £440,000 was subscribed by Rivomore Limited, an existing Significant Shareholder that was also interested in £200,000 of Initial Loan Stock. holders may convert the loan stock into Sopheon ordinary shares at any time up to the extended maturity date of 31 January 2015, and any loan stock not converted will be repaid at par on that date.
4 5NOTES TO THE FINANCIAL STATEMENTS

2 1 . O B L I G AT I O N S U N D E R F I N A N C E L E A S E S The present value of future lease payments is analyzed as: Group Company 2012 2011 2012 2011 £’000 £’000 £’000 £’000 Current liabilities 1 2 - - Non-current liabilities - - - - –––––––– –––––––– –––––––– –––––––– 1 2 - - –––––––– –––––––– –––––––– –––––––– –––––––– –––––––– –––––––– –––––––– The group leases a telephone system with a net carrying value at 31 December 2012 of £1,000 (2011: £2,000). Future lease payments are due as follows:
At 31 December 2012 Minimum Lease Present Payments Interest Value £’000 £’000 £’000 Within one year 1 - 1Due in one to five years - - - –––––––– –––––––– –––––––– 1 - 1 –––––––– –––––––– –––––––– –––––––– –––––––– ––––––––
At 31 December 2011 Minimum Lease Present Payments Interest Value £’000 £’000 £’000 Within one year 2 - 2Due in one to five years - - - –––––––– –––––––– –––––––– 2 - 2 –––––––– –––––––– –––––––– –––––––– –––––––– ––––––––
2 2 . O P E R AT I N G L E A S E A R R A N G E M E N T S At the balance sheet date the group had outstanding commitments under operating leases in respect of which the total future minimum lease payments were due as follows: Land & Land & Buildings Other Buildings Other 2012 2012 2011 2011 £’000 £’000 £’000 £’000 Due within one year 337 54 345 52Due after one year and within five years 74 76 279 18 –––––––– –––––––– –––––––– –––––––– 411 130 624 70 –––––––– –––––––– –––––––– –––––––– –––––––– –––––––– –––––––– ––––––––
The group leases its office accommodation in the uS, uK and the Netherlands and has operating leases for office equipment and vehicles.
CompanyThe company has no operating leases.
4 6 NOTES TO THE FINANCIAL STATEMENTS

2 3 . F I N A N C I A L I N S T R U M E N T S
Categories of Financial Assets and Liabilities
The following table sets out the categories of financial instruments held by the group. All of the group’s financial assets are in the category of loans and receivables, and all of its financial liabilities are in the category of financial liabilities measured at amortized cost.
1. Financial Assets Group Company Notes 2012 2011 2012 2011 £’000 £’000 £’000 £’000
Current Financial AssetsTrade receivables 17 3,547 3,103 - -Other receivables 17 4 5 - -Accrued income 17 118 12 - -Cash and cash equivalents 18 3,880 2,941 1,455 703 –––––––– –––––––– –––––––– –––––––– 7,549 6,061 1,455 703 –––––––– –––––––– –––––––– –––––––– –––––––– –––––––– –––––––– ––––––––Non-current Financial AssetsOther receivable 16 12 12 - - –––––––– –––––––– –––––––– –––––––– –––––––– –––––––– –––––––– ––––––––
The group does not have any financial assets in any other categories.
2. Financial Liabilities Group Company Notes 2012 2011 2012 2011 £’000 £’000 £’000 £’000
Current Financial LiabilitiesTrade payables 19 717 344 29 24Other payables 19 113 114 107 103 Accruals 19 1,325 788 227 174Loans and borrowings 20 1,136 1,448 - -Obligations under finance lease 21 1 2 - - –––––––– –––––––– –––––––– –––––––– 3,292 2,696 363 301 –––––––– –––––––– –––––––– ––––––––
Non-current Financial LiabilitiesLoans and borrowings 20 162 840 - -8% convertible loan stock 2015 20 2,000 823 2,000 823 –––––––– –––––––– –––––––– –––––––– 2,162 1,663 2,000 823 –––––––– –––––––– –––––––– –––––––– 5,454 4,359 2,363 1,124 –––––––– –––––––– –––––––– –––––––– –––––––– –––––––– –––––––– ––––––––
The amounts shown in respect of the 8% convertible loan stock 2015 represent the nominal value of the instrument. As set out in Note 20 the carrying value of the instrument at the balance sheet date reflects a deduction for the reclassification of the fair value of conversion rights into equity.
4 7NOTES TO THE FINANCIAL STATEMENTS

Financial Instrument Risk Exposure and Management
The group is exposed to risks that arise from its use of financial instruments. This note describes the group’s objectives, policies and processes for managing those risks and the methods used to measure them.
There have been no changes in the group’s exposure to financial instrument risks, its objectives, policies and processes for managing those risks or the methods used to measure them from previous periods, unless otherwise disclosed in this note. Principal Financial Instruments
The principal financial instruments used by the group, from which financial instrument risk arises, are as follows:
•Tradeandotherreceivables•Cashandcashequivalents•Tradeandotherpayables•Loannotes•Banklineofcredit•Convertibleloanstock
General Objectives, Policies and Processes
The board has overall responsibility for the determination of the group’s risk management objectives and policies and, whilst retaining ultimate responsibility for them, it has delegated the authority for designing and operating processes that ensure the effective implementation of the objectives and policies to the group’s finance function. The board receives quarterly reports from the group finance director through which it reviews the effectiveness of the processes put in place and the appropriateness of the objectives and policies it sets. The group’s risk management procedures are also reviewed periodically by the audit committee.
The overall objective of the board is to set policies that seek to reduce risk as far as possible without unduly affecting the group’s competitiveness and flexibility. Further details regarding these policies are set out below:
a) Credit Risk
Credit risk arises principally from the group’s trade receivables, other receivables and accrued income. It is the risk that the counterparty fails to discharge its obligations in respect of the instrument.
The group’s software is principally marketed at major international corporations of good credit standing, and the group’s historical bad debt experience is very low. Due to the potentially large size of certain individual sales, in a particular year one customer can account for a substantial proportion of revenues recorded. however, such concentrations rarely persist for multiple years and therefore the directors do not believe that the group is systematically exposed to credit risk concentration in respect of particular customers. In 2012, the largest single customer accounted for 16 percent of group revenues (2011:10 percent).
Credit risk also arises from cash and cash equivalents and deposits with banks and financial institutions. At the year end the group was holding a proportion of its deposits and bank balances with each of Lloyds Banking Group plc, Royal Bank of Scotland plc, and Silicon valley Bank.
The group does not enter into derivatives to manage credit risk.
The group's customers are major international corporations of high credit standing and therefore the group does not typically obtain credit ratings for individual customers. Nevertheless, current economic conditions have resulted in such major corporations slowing down payments and this is reflected in the ageing profile of the group’s receivables. however, impairment of trade receivables is very rare, and in the three years ending 31 December 2012 provisions or write offs against customer receivables amounted in total to less than 0.5 percent of revenues. Such impairments do not arise from credit defaults, but principally from disagreements with a very small number of former customers over their responsibility for renewal fees for maintenance or hosting contracts. Sopheon's policy is to pursue collection of such fees but to make provision against the applicable receivable if collection is uncertain.
4 8 NOTES TO THE FINANCIAL STATEMENTS
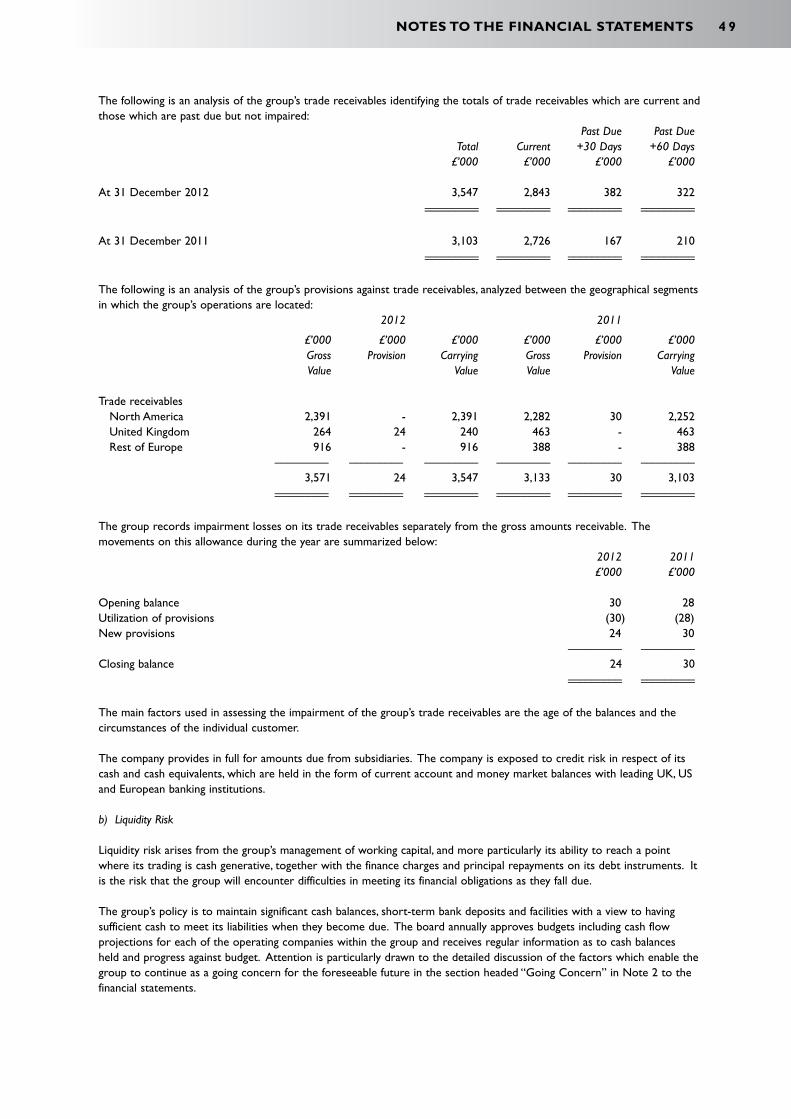
The following is an analysis of the group’s trade receivables identifying the totals of trade receivables which are current and those which are past due but not impaired: Past Due Past Due Total Current +30 Days +60 Days £’000 £’000 £’000 £’000
At 31 December 2012 3,547 2,843 382 322 ––––––––– ––––––––– ––––––––– ––––––––– ––––––––– ––––––––– ––––––––– –––––––––
At 31 December 2011 3,103 2,726 167 210 ––––––––– ––––––––– ––––––––– ––––––––– ––––––––– ––––––––– ––––––––– –––––––––
The following is an analysis of the group’s provisions against trade receivables, analyzed between the geographical segments in which the group’s operations are located: 2012 2011
£’000 £’000 £’000 £’000 £’000 £’000 Gross Provision Carrying Gross Provision Carrying Value Value Value Value
Trade receivables North America 2,391 - 2,391 2,282 30 2,252 united Kingdom 264 24 240 463 - 463 Rest of Europe 916 - 916 388 - 388 ––––––––– ––––––––– ––––––––– ––––––––– ––––––––– ––––––––– 3,571 24 3,547 3,133 30 3,103 ––––––––– ––––––––– ––––––––– ––––––––– ––––––––– ––––––––– ––––––––– ––––––––– ––––––––– ––––––––– ––––––––– –––––––––
The group records impairment losses on its trade receivables separately from the gross amounts receivable. The movements on this allowance during the year are summarized below: 2012 2011 £’000 £’000
Opening balance 30 28utilization of provisions (30) (28)New provisions 24 30 ––––––––– –––––––––Closing balance 24 30 ––––––––– ––––––––– ––––––––– –––––––––
The main factors used in assessing the impairment of the group’s trade receivables are the age of the balances and the circumstances of the individual customer. The company provides in full for amounts due from subsidiaries. The company is exposed to credit risk in respect of its cash and cash equivalents, which are held in the form of current account and money market balances with leading uK, uS and European banking institutions. b) Liquidity Risk Liquidity risk arises from the group’s management of working capital, and more particularly its ability to reach a point where its trading is cash generative, together with the finance charges and principal repayments on its debt instruments. It is the risk that the group will encounter difficulties in meeting its financial obligations as they fall due.
The group’s policy is to maintain significant cash balances, short-term bank deposits and facilities with a view to having sufficient cash to meet its liabilities when they become due. The board annually approves budgets including cash flow projections for each of the operating companies within the group and receives regular information as to cash balances held and progress against budget. Attention is particularly drawn to the detailed discussion of the factors which enable the group to continue as a going concern for the foreseeable future in the section headed “Going Concern” in Note 2 to the financial statements.
4 9NOTES TO THE FINANCIAL STATEMENTS

The following table sets out an analysis of the contractual maturity of the group’s and the company’s financial liabilities that must be settled gross, based on exchange rates prevailing at the relevant balance sheet date.
Group
At 31 December 2012 On Demand or Within Within Within Within Six Months One Year Two Years Five Years Total £’000 £’000 £’000 £’000 £’000
Trade and other payables 2,386 - - 2,386Line of credit 495 - - - 495Loan notes 333 333 166 - 832Future interest – loan notes 45 23 4 - 72Convertible loan stock - - - 2,000 2,000Future interest – convertible loan stock 80 80 160 14 334Finance lease 1 - - - 1 ––––––––– ––––––––– ––––––––– ––––––––– –––––––––Total financial liabilities 3,340 436 330 2,014 6,120 ––––––––– ––––––––– ––––––––– ––––––––– ––––––––– ––––––––– ––––––––– ––––––––– ––––––––– –––––––––
At 31 December 2011 On Demand or Within Within Within Within Six Months One Year Two Years Five Years Total £’000 £’000 £’000 £’000 £’000
Trade and other payables 1,444 - - 23 1,467Line of credit 776 - - - 776Loan notes 336 336 672 168 1,512Future interest – loan notes 92 70 72 3 237Convertible loan stock - - 850 - 850Future interest – convertible loan stock 34 34 6 - 74Finance lease 1 1 - - 2 ––––––––– ––––––––– ––––––––– ––––––––– –––––––––Total financial liabilities 2,683 441 1,600 194 4,918 ––––––––– ––––––––– ––––––––– ––––––––– ––––––––– ––––––––– ––––––––– ––––––––– ––––––––– –––––––––
Company
At 31 December 2012 On Demand or Within Within Within Within Six Months One Year Two Years Five Years Total £’000 £’000 £’000 £’000 £’000 Trade and other payables 363 - - - 363Convertible loan stock - - - 2,000 2,000Future interest – convertible loan stock 80 80 160 14 334 ––––––––– ––––––––– ––––––––– ––––––––– –––––––––Total financial liabilities 443 80 160 2,014 2,697 ––––––––– ––––––––– ––––––––– ––––––––– ––––––––– ––––––––– ––––––––– ––––––––– ––––––––– –––––––––
At 31 December 2011 On Demand or Within Within Within Within Six Months One Year Two Years Five Years Total £’000 £’000 £’000 £’000 £’000 Trade and other payables 301 - - - 301Convertible loan stock - - 850 - 850Future interest – convertible loan stock 34 34 6 - 74 ––––––––– ––––––––– ––––––––– ––––––––– –––––––––Total financial liabilities 335 34 856 - 1,225 ––––––––– ––––––––– ––––––––– ––––––––– ––––––––– ––––––––– ––––––––– ––––––––– ––––––––– –––––––––
5 0 NOTES TO THE FINANCIAL STATEMENTS

c) Market Risk
Market risk arises from the group’s use of interest-bearing and foreign currency financial instruments. It is the risk that the future cash flows of a financial instrument will fluctuate because of changes in interest rates (interest rate risk) or foreign exchange rates (currency risk). The group does not have any financial instruments that are publicly traded securities and is not exposed to other price risk associated with changes in the market prices of such securities.
d) Interest Rate Risk
The group’s fixed rate interest bearing liabilities comprise loan notes with a carrying value at 31 December 2012 of £803,000, which bear a fixed interest rate of 13 percent, and convertible loan stock with a carrying value of £2,000,000, which bears a fixed interest rate of 8 percent. These liabilities do not give rise to interest rate risk. The group also has a line of credit, on which £495,000 was outstanding at 31 December 2012, and which bears a variable interest rate based on a margin of 1.25 percent above the lender’s Prime Rate. Should this rate vary by 1 percent the annualized effect would be to increase or reduce finance costs by £5,000.
The company’s interest bearing liabilities consist of its convertible loan stock which bears a fixed rate of interest of 8 percent, which does not give rise to interest rate risk.
The group invests its surplus cash in bank deposits denominated in uS Dollars, Euros or Sterling, which bear interest based on short-term money market rates, and in doing so exposes itself to fluctuations in money market interest rates. The group’s surplus cash held in the form of bank deposits at 31 December 2012 was £737,000. During 2012 interest rates on money market deposits averaged around 0.5 percent in respect of Sterling and uS Dollar deposits and 0.75 percent in respect of Euro deposits. The annualized effect of a movement of 0.5 percent in the average interest rate received on the group’s bank deposits at the balance sheet date would result in an increase or decrease in the group’s and the company’s interest income of £4,000.
The company’s interest bearing deposits at the balance sheet date amounted to £57,000. The effect of a 0.5 percent changes in the rate of interest would be immaterial
e) Currency Risk
The following is an analysis of the group’s financial assets and liabilities, analyzed by the currency in which they are denominated:
At 31 December 2012 US Dollars Sterling Euro Total £’000 £’000 £’000 £’000Financial AssetsReceivables and accrued income 2,402 356 923 3681Cash and cash equivalents 1,640 1,638 602 3,880 ––––––––– ––––––––– ––––––––– –––––––––Total financial assets 4,042 1,994 1,525 7,561 ––––––––– ––––––––– ––––––––– ––––––––– ––––––––– ––––––––– ––––––––– –––––––––Financial LiabilitiesTrade and other payables 1,283 337 535 2,155Borrowings 1,299 2,000 - 3,299 ––––––––– ––––––––– ––––––––– –––––––––Total financial liabilities 2,582 2,337 535 5,454 ––––––––– ––––––––– ––––––––– ––––––––– ––––––––– ––––––––– ––––––––– –––––––––
At 31 December 2011 US Dollars Sterling Euro Total £’000 £’000 £’000 £’000Financial AssetsReceivables and accrued income 2,264 473 394 3,132Cash and cash equivalents 1,777 219 945 2,941 ––––––––– ––––––––– ––––––––– –––––––––Total financial assets 4,041 692 1,339 6,073 ––––––––– ––––––––– ––––––––– ––––––––– ––––––––– ––––––––– ––––––––– –––––––––Financial LiabilitiesTrade and other payables 693 237 316 1,246Borrowings 2,290 823 - 3,113 ––––––––– ––––––––– ––––––––– –––––––––Total financial liabilities 2,983 1,060 316 4,359 ––––––––– ––––––––– ––––––––– ––––––––– ––––––––– ––––––––– ––––––––– –––––––––
The amount shown in respect of Sterling borrowings at December 31, 2012 represents the nominal value of the instrument. As set out in Note 20 the carrying value of the instrument at the balance sheet date reflects a deduction for the reclassification of the fair value of conversion rights into equity.
5 1NOTES TO THE FINANCIAL STATEMENTS

The group’s policy is, where possible, to allow group entities to settle liabilities denominated in the functional currency with cash generated from their own operations in that currency. The group also maintains cash and bank deposits in the currencies which are the functional currencies of its operating entities, which are the uS Dollar, the Euro and Sterling.
The group is exposed to currency risk in respect of foreign currency denominated bank deposits and bank loans. Taking into account the fact that a large proportion of the group’s income and expenditure arise in uS Dollars and, to a lesser extent, in Euros, the group’s policy is not to seek to hedge such currency risk.
Foreign currency risk also arises where individual group entities enter into transactions denominated in currencies other than their functional currency, with fluctuations in exchange rates giving rise to gains or losses in the income statement. Where the foreign currency risk to the group is significant, consideration is given to hedging the risk through the forward currency market and, whilst this would be an economic hedge of the cash-flow risk, the group does not employ hedge accounting.
The following table shows the effects, all other things being equal, of changes to exchange rates on the group’s profit after tax and on the exchange differences on retranslation of the assets and liabilities of foreign operations which is recognized directly in equity. It illustrates the effects if the exchange rates for the uS Dollar and the Euro had been higher or lower than those which actually applied during the year and at the year end.
2012 2011 2012 2011 Effect of Increase/ Increase/ Exchange Differences (Decrease) (Decrease on Translation of in Profit in Profit Assets and Liabilities After Tax After Tax of Foreign Operations £’000 £’000 £’000 £’000
Weakening of uS Dollar by 10c 167 (10) (193) (118)Strengthening of uS Dollar by 10c (76) 3 214 134 Weakening of Euro by 10c (77) - (5) (57) Strengthening of Euro by 10c 91 (26) 7 67 ––––––––– ––––––––– ––––––––– ––––––––– ––––––––– ––––––––– ––––––––– –––––––––
The company holds certain assets, mainly bank deposits, and liabilities denominated in the functional currencies of its principal operating subsidiaries, which are the uS Dollar, the Euro and Sterling. The following table shows the effects, all other things being equal, of changes to exchange rates at the year end on the profit after tax of the company. It is based on the company’s assets and liabilities at the relevant balance sheet date.
2012 2011 (Increase)/Decrease in Profit After Tax £’000 £’000
Weakening of uS Dollar by 10c (18) (19) Strengthening of uS Dollar by 10c 21 22 Weakening of Euro by 10c (46) (22) Strengthening of Euro by 10c 54 25 ––––––––– ––––––––– ––––––––– –––––––––
f) Capital
The group considers its capital to comprise its share capital and share premium and other capital reserves less the accumulated retained losses. The group is not subject to any externally imposed capital requirements. In managing its capital, the group’s primary objective is to support the development of the group’s activities through to the point where they are cash generative on a sustained basis. The group’s capital is all equity capital and is summarized in Note 24.
5 2 NOTES TO THE FINANCIAL STATEMENTS

2 4 . S H A R E C A P I TA L Issued and Fully Paid 2012 2012 2011 2011 Number £’000 Number £’000 Ordinary shares of 5p each 145,579,027 7,279 145,579,027 7,279 ––––––––– ––––––––– ––––––––– ––––––––– ––––––––– ––––––––– ––––––––– –––––––––
The company has one class of ordinary shares, which carry no right to fixed income. At 31 December 2012 the company had outstanding 502,790 warrants to subscribe for ordinary shares at a price of 20p per share, which were issued in June 2007 to BlueCrest Capital Finance LLC in connection with the financing of the acquisition of Alignent Software, Inc. The warrants have a 10 year life.
2 5 . C A P I TA L R E S E R V E S Group Capital Share Merger Redemption Equity Premium Reserve Reserve Reserve Total £’000 £’000 £’000 £’000 £’000 At 1 January 2011 52,096 17,944 2,884 795 73,719Recognition of share-based payments - - - 39 39Purchase of shares by Esot - - - (11) (11)Transfer of merger reserve to profit and loss reserve - (17,944) - - (17,944) –––––––– –––––––– –––––––– –––––––– ––––––––At 1 January 2012 52,096 - 2,884 823 55,803Recognition of share-based payments - - - 38 38Lapsing or expiry of share options - - - (272) (272)Equity component of convertible loan stock - - - 50 50 –––––––– –––––––– –––––––– –––––––– ––––––––At 31 December 2012 52,096 - 2,884 639 55,619 –––––––– –––––––– –––––––– –––––––– –––––––– –––––––– –––––––– –––––––– –––––––– ––––––––
Company Capital Share Merger Redemption Equity Premium Reserve Reserve Reserve Total £’000 £’000 £’000 £’000 £’000 At 1 January 2011 52,096 10,179 2,884 795 65,954Recognition of share-based payments - - - 39 39Purchase of shares by Esot - - - (11) (11)Transfer of merger reserve to profit and loss reserve - (10,179) - - (10,179) –––––––– –––––––– –––––––– –––––––– ––––––––At 1 January 2012 52,096 - 2,884 823 55,803Recognition of share-based payments - - - 38 38Lapsing or expiry of share options - - - (272) (272)Equity component of convertible loan stock - - - 50 50 –––––––– –––––––– –––––––– –––––––– –––––––– At 31 December 2012 52,096 - 2,884 639 55,619 –––––––– –––––––– –––––––– –––––––– –––––––– –––––––– –––––––– –––––––– –––––––– ––––––––
5 3NOTES TO THE FINANCIAL STATEMENTS

Share premium represents the premium arising on the issue of shares and its use is governed by the provisions of the Companies Act 2006.
The merger reserve is a non-statutory reserve representing the premium on the issue of shares pursuant to certain past business combinations which meet specified criteria. The carrying values of such investments have since been subject to impairment charges exceeding the amount of the merger reserve, and accordingly the full amount of the merger reserve has been transferred to profit and loss reserve.
The capital redemption reserve is a non-distributable reserve arising from the cancellation in 2001 of deferred shares.
The equity reserve comprises the deemed value of outstanding share options granted in connection with the acquisition of Orbital Software holdings plc in 2001, together with the fair value of share-based payments to employees pursuant to the group’s share option schemes, the fair value of warrants to subscribe for Sopheon shares issued to BlueCrest Capital Finance LLC, and the equity component of the group’s 8 percent convertible loan stock 2015.
In addition, investment by the group’s employee share ownership trust (the “Esot”) in the company’s shares is deducted from equity in the consolidated balance sheet as if they were treasury shares, by way of deduction from the equity reserve. At 31 December 2012, the Esot held 185,244 (2011: 185,244) ordinary shares in the company, which represents 0.1 percent (2011: 0.1 percent) of the company’s ordinary share capital. The reserve of £11,000 (2011: £11,000) represents the cost of these shares held by the Esot at 31 December 2012. The purpose of the Esot is to facilitate the company’s policy of offering participation in the ownership of its shares to employees for reward and incentive purposes. At 31 December 2012 and at 31 December 2011, no shares held by the Esot were under option or had been gifted to any employees. Arrangements for the distribution of benefits to employees will be made at the Esot’s discretion in such manner as the Esot considers appropriate. Administration costs of the Esot are accounted for in the profit and loss account of the company as they are incurred.
2 6 . R E T I R E M E N T B E N E F I T P L A N S The group operates defined contribution retirement benefit plans which employees are entitled to join. The total expense recognized in the income statement of £134,000 (2011: £123,000) represents contributions paid to such plans at rates specified in the rules of the plans.
2 7 . R E L AT E D PA R T Y T R A N S A C T I O N S
Details of transactions between the group and related parties are disclosed below.
Compensation of Key Management Personnel
Details of directors’ remuneration are given in Note 7. The total remuneration of executive directors and members of the group’s operating and executive management committees during the year was as follows: 2012 2011 £’000 £’000
Emoluments and benefits 1,111 1,006 Pension contributions 30 30Share-based payments 27 24 ––––––– ––––––– 1,168 1,060 ––––––– ––––––– ––––––– –––––––
Subscriptions by members of the board and management to convertible loan stock are disclosed in Note 20.
5 4 NOTES TO THE FINANCIAL STATEMENTS

Transactions with Related Parties who are Subsidiaries of the Company
The following is a summary of the transactions of the company with its subsidiaries during the year:
2012 2011 £’000 £’000
Net amounts repaid by subsidiaries by way of interest-free loans 176 521Net management charges to subsidiaries 290 250 ––––––– –––––––
The amounts owed by subsidiary companies to the parent company at 31 December 2012 totaled £40,015,000 (2011: £40,191,000). A full provision has been made against these amounts, which are unsecured and are subordinated to the claims of all other creditors. During 2012 and 2011 the company granted share options to employees of subsidiary companies. Details of grants of share options are disclosed in Note 28. Other Related Party Transactions
There were no other related party transactions during the year under review or the previous year.
2 8 . S H A R E - B A S E D PAY M E N T S Equity-settled Share Option Schemes
The group has a number of share option schemes for all employees. Options are exercisable at a price equal to the market price on the date of grant. The normal vesting periods are as set out below.
Vesting
Sopheon plc (uSA) stock option plan In three equal tranches between the first and third anniversary of grantSopheon uK approved share option scheme On third anniversary of grantSopheon uK unapproved share option scheme Immediate or as per uSA planSopheon Nv share option scheme Immediate or as per uSA plan Details of the share options outstanding during the year are as follows:
Weighted Weighted Number of Average Number of Average Share Exercise Share Exercise Options Price Options Price 2012 2012 2011 2011 £ £
Outstanding at the beginning of the year 13,193,054 0.16 12,504,924 0.17 Granted during the year 5,465,598 0.05 880,000 0.09 Lapsed, expired or cancelled during the year (6,478,972) 0.17 (191,870) 0.63 ––––––––– ––––––––– ––––––––– –––––––––Outstanding at the end of the year 12,179,680 0.10 13,193,054 0.16 ––––––––– ––––––––– ––––––––– ––––––––– ––––––––– ––––––––– ––––––––– –––––––––
Exercisable at the end of the year 5,815,545 0.15 10,801,432 0.17 ––––––––– ––––––––– ––––––––– ––––––––– ––––––––– ––––––––– ––––––––– –––––––––
5 5NOTES TO THE FINANCIAL STATEMENTS

No share options were exercised during the year (2011: Nil). The options outstanding at the end of the year have a weighted average contractual life of 6.8 years (2011: 4.6 years). During the year share options were granted on 20 April 2012, when the exercise price of options granted was 5p and the estimated fair value was 2.96p, and on 29 September 2012, when the exercise price of options granted was 5.25p and the estimated fair value was 3.11p. During 2011, share options were granted on 26 April 2011 and on 28 September 2011, on both of which dates the exercise price was 8.75p and the estimated fair value was 5.2p. The fair values for options granted are calculated using the binomial option-pricing model. The principal assumptions used were:
April &Date of Grant September April September 2012 2012 2011
Share price at time of grant 5.25p 5p 8.75p Exercise price 5.25p 5p 8.75p Expected volatility 40% 40% 40% Risk-free rate 5% 5% 5% Expected dividend yield Nil Nil Nil
The expected contractual life of the options used was either five or ten years depending on the particular scheme rules. Expected volatility was determined by reference to the historic volatility of the company’s share price in the period before the date of grant. The group and company recognized total expenses of £38,000 (2011: £39,000) relating to equity-settled share-based payments during the year.
5 6 NOTES TO THE FINANCIAL STATEMENTS

Barry Mence, Executive Chairman. Barry Mence has served as executive chairman and as a director and substantial shareholder of Sopheon since its inception in 1993 when he was one of the founding members. From 1976 to 1990, Mr. Mence was a major shareholder and group managing director of the Rendeck Group of Companies, a software and services group based in the Netherlands.
Andrew Michuda, Executive Director. Andrew Michuda was appointed chief executive officer of Sopheon in September 2000. From 1997 to 2000 he served as chief executive officer and an executive director of Teltech Resource Network Corporation, which was acquired by Sopheon. he earlier held senior leadership positions at Control Data, including general manager of the business that evolved into Decision Data, the world's largest independent computer services provider.
Arif Karimjee, ACA, Executive Director. Arif Karimjee has served as chief financial officer of Sopheon since February 2000. Mr. Karimjee was previously an auditor and consultant with Ernst & Young in London, Brussels and Reading, from August 1988 until joining Sopheon.
Stuart Silcock, FCA, Non-executive Director. Stuart Silcock has served as a director of Sopheon from its inception in 1993. Since 1982, Mr Silcock has been a principal partner of Lawford & Co, chartered accountants and until 2010 a director of Lawfords Ltd. also chartered accountants. Mr. Silcock was a non-executive director of Brown & Jackson plc. for four years from June 2001 to July 2005 and currently holds a number of other directorships in the united Kingdom.
Bernard Al, Non-executive Director. Bernard Al was appointed as director of Sopheon in January 2001. he is a former chief executive officer of Wolters Kluwer in the Netherlands and has a background in science and linguistics.
Daniel Metzger, Non-executive Director. Daniel Metzger was until 1998 an executive vice president of Lawson Software, a leading ERP provider, where he was responsible for corporate strategy and marketing. Since then he has held similar roles at Parametric Technologies, where he led the business strategy and marketing around collaborative product development technologies, and at nQuire Software, which was subsequently sold to Siebel.
D I R E C T O R S

Where innovation means business™