some of my hardwork .pdf
TRANSCRIPT
The public reporting burden for this collection of information is estimated to average 1 hour per response, including the time for reviewing instructions,
searching existing data sources, gathering and maintaining the data needed, and completing and reviewing the collection of information. Send comments
regarding this burden estimate or any other aspect of this collection of information, including suggesstions for reducing this burden, to Washington
Headquarters Services, Directorate for Information Operations and Reports, 1215 Jefferson Davis Highway, Suite 1204, Arlington VA, 22202-4302.
Respondents should be aware that notwithstanding any other provision of law, no person shall be subject to any oenalty for failing to comply with a collection of
information if it does not display a currently valid OMB control number.
PLEASE DO NOT RETURN YOUR FORM TO THE ABOVE ADDRESS.
a. REPORT
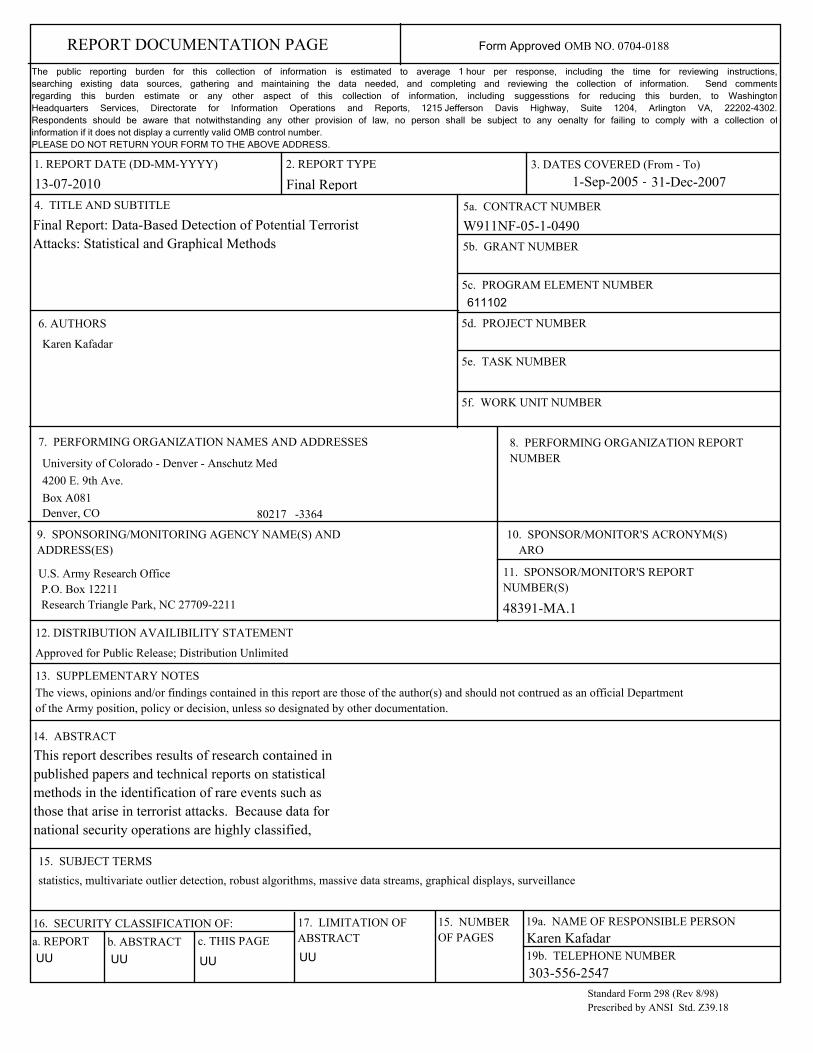
Final Report: Data-Based Detection of Potential Terrorist
Attacks: Statistical and Graphical Methods
14. ABSTRACT
16. SECURITY CLASSIFICATION OF:
This report describes results of research contained in
published papers and technical reports on statistical
methods in the identification of rare events such as
those that arise in terrorist attacks. Because data for
national security operations are highly classified,
1. REPORT DATE (DD-MM-YYYY)
4. TITLE AND SUBTITLE
13-07-2010
13. SUPPLEMENTARY NOTES
The views, opinions and/or findings contained in this report are those of the author(s) and should not contrued as an official Department
of the Army position, policy or decision, unless so designated by other documentation.
12. DISTRIBUTION AVAILIBILITY STATEMENT
Approved for Public Release; Distribution Unlimited
UU
9. SPONSORING/MONITORING AGENCY NAME(S) AND
ADDRESS(ES)
6. AUTHORS
7. PERFORMING ORGANIZATION NAMES AND ADDRESSES
U.S. Army Research Office
P.O. Box 12211
Research Triangle Park, NC 27709-2211
15. SUBJECT TERMS
statistics, multivariate outlier detection, robust algorithms, massive data streams, graphical displays, surveillance
Karen Kafadar
University of Colorado - Denver - Anschutz Medical Campus
4200 E. 9th Ave.
Box A081
Denver, CO 80217 -3364
REPORT DOCUMENTATION PAGE
b. ABSTRACT
UU
c. THIS PAGE
UU
2. REPORT TYPE
Final Report
17. LIMITATION OF
ABSTRACT
UU
15. NUMBER
OF PAGES
5d. PROJECT NUMBER
5e. TASK NUMBER
5f. WORK UNIT NUMBER
5c. PROGRAM ELEMENT NUMBER
5b. GRANT NUMBER
5a. CONTRACT NUMBER
W911NF-05-1-0490
611102
Form Approved OMB NO. 0704-0188
48391-MA.1
11. SPONSOR/MONITOR'S REPORT
NUMBER(S)
10. SPONSOR/MONITOR'S ACRONYM(S)
ARO
8. PERFORMING ORGANIZATION REPORT
NUMBER
19a. NAME OF RESPONSIBLE PERSON
19b. TELEPHONE NUMBER
Karen Kafadar
303-556-2547
3. DATES COVERED (From - To)
1-Sep-2005
Standard Form 298 (Rev 8/98)
Prescribed by ANSI Std. Z39.18
- 31-Dec-2007

Final Report: Data-Based Detection of Potential Terrorist Attacks: Statistical and Graphical Methods
Report Title
ABSTRACT
This report describes results of research contained in
published papers and technical reports on statistical
methods in the identification of rare events such as
those that arise in terrorist attacks. Because data for
national security operations are highly classified,
techniques are developed on massive data containing
rare events that arise in particle physics, internet
communications, and genomics. Results include:
(a) useful graphical displays; (b) conditioning
high-dimensional data; (c) penalized regression
estimators to filter out irrelevant variables.
(a) Papers published in peer-reviewed journals (N/A for none)
List of papers submitted or published that acknowledge ARO support during this reporting
period. List the papers, including journal references, in the following categories:

Beall, Jeffrey; Kafadar, Karen:
"The Proportion of NUC Pre-56 Titles Represented in OCLC
WorldCat," College & Research Libraries 66(5), 431-435 (2005).
Kafadar, Karen; Wegman, Edward J.:
"Visualizing `typical' and `exotic' Internet traffic data."
Computational Statistics and Data Analysis 50, 3721-3743 (2006).
Spiegelman, Clifford H.; Kafadar, Karen:
"Data Integrity and the Scientific Method: The Case of Bullet
Lead Data as Forensic Evidence (with discussion),"
Chance 19(2), 17-25 (2006).
Saha, Nilanjan; Watson, Layne T.; Kafadar, Karen; Onufriev, Alexey;
Ramakrishnan, Naren; Vasquez-Robinet, Cecilia; Watkinson, Jonathan:
"A General Probabilistic Model of the PCR Process,"
Applied Mathematics and Computation 182(1), 232--243 (2006).
Du, Yunzhi; Davisson, Muriel T.; Kafadar, Karen; Gardiner, Katheleen:
"A-to-I pre-mRNA editing of the serotonin 2C receptor: Comparisons
among inbred mouse strains,"
Gene 382: 39--46 (1 Nov 2006);
available online at http://www.sciencedirect.com.
Beall, Jeffrey; Kafadar, Karen:
"Measuring Typographical Errors' Impact on Retrieval in
Bibliographic Databases (invited),"
Cataloging & Classification Quarterly 44(3/4), 197-211 (2007).
Saha, Nilanjan; Watson, Layne T.; Kafadar, Karen; Ramakrishnan, Naren;
Onufriev, Alexey; Rao Mane, Shrinivas; Vasquez-Robinet, Cecilia:
"Validation and Estimation of Parameters for a General Probabilistic
Model of the PCR Process,"
Journal of Computational Biology 14(1): 97-112 (2007).
Bjork, Kathe E.; Kafadar, Karen:
"Systematic order dependent effect in expression values, variance,
detection calls and differential expression in Affymetrix GeneChips(R),"
Bioinformatics 2007; doi: 10.1093/bioinformatics/btm450
Beall, Jeffrey; Kafadar, Karen:
"Measuring the Extent of the Synonym Problem in Full-text Searching,"
Evidence Based Library and Information Practice 2008 3(4), 18-33.
Gehrke, Allison; Sun, Shaojun; Kurgan, Lukasz A.; Ahn, Natalie G.;
"Improved machine learning methods for analysis of gas phase
chemistry of peptides,"
Bioinformatics 2008 9:515; doi:10.1186/1471-2105-9-515.
Kafadar, K.; Bjork, K.E.:
"Microarray analysis",
In: Encyclopedia of Quantitative Risk Assessment, Volume 1
(Edward L. Melnick and Brian S. Everitt, eds.), Wiley, 2008.
Gonzales, Ralph; Corbett, Kitty K.; Wong, Shale; Glazner, Judith;
Gershman, Kenneth; Deas, Ann; Leeman-Castillo, Bonnie A.; Maselli,
Judith H.; Severt-Kuhlmann, Ann; Wigton, Robert S.;
Flores, Estevan; Kafadar, Karen:
``Get Smart Colorado'': Impact of a Mass Media Campaign
to Improve Antibiotic Use,''
Medical Care 46(6), 597-605 (2008).
Kafadar, K.; Prorok, P.C.:
"Effect of length-biased sampled sojourn times on the survival
distribution in randomized cancer screening trials,"
Statistics in Medicine, 28:2116-2146, 2009.
(b) Papers published in non-peer-reviewed journals or in conference proceedings (N/A for none)
12.00Number of Papers published in peer-reviewed journals:
Number of Papers published in non peer-reviewed journals:
(c) Presentations
0.00

(All presentations at meetings and seminars are shown)
Invited seminar,
Statistical Tests for Bullet Lead Comparisons,
Department of Statistics,
North Carolina State University, 21 March 2006.
Topics contributed paper,
Letter value plots,
Interface Symposium, Pasadena, May 2006;
Joint Statistics Meetings, Seattle, August 2006.
Seminar,
Length biased sampling in randomized screening trials,
Statistics Colloquium, CU-Denver, September 2006.
Seminar,
Measuring the effect of Length biased sampling,
Mathematical Sciences Section, National Security Agency,
19 September 2006.
Contributed paper,
Letter value plots,
Army Conference on Applied Statistics, Raleigh, October 2006.
Invited seminar,
Statistical Tests for Bullet Lead Comparisons,
Department of Statistics,
Florida State University, 7 December 2006.
Seminar,
Length biased sampling in randomized screening trials,
Department of Statistics, Texas A&M University, 22 January 2007.
Invited Member Presentation,
Statistical issues for NRC's Bullet Lead Committee,
Committee on National Statistics, 9 February 2007.
Invited seminar,
Statistical Tests for Bullet Lead Comparisons,
Department of Mathematics, Butler University, 7 March 2007.
Bernard Flury Lecture,
Statistical Tests for Bullet Lead Comparisons,
Department of Statistics,
Indiana University, 8 March 2007.
Plenary lecture,
Statistics in Forensic Sciences (with C.S. Spiegelman),
Army Conference on Applied Statistics, October 2007.
Neyman seminar,
Statistical Tests for Bullet Lead Comparisons,
UC-Berkeley, October 2007.
Invited seminar,

Statistical Tests for Bullet Lead Comparisons,
ASA San Francisco Bay Chapter, Jan 2008.
Invited seminar,
Statistical Tests for Bullet Lead Comparisons,
Washington Statistical Society, Feb 2008.
Invited seminar,
Massive Data Sets in High-Energy Physics,
Univ of California-San Francisco, Apr 2008.
Invited speaker,
Massive Data Sets in Scientific Applications,
Statistics Conference, West Point Academy, 17 Apr 2008.
Contributed paper,
Statistical Considerations in Large-Scale Screening
Programs: Impacts on the Public,
Joint Statistics Meetings, Denver, Aug 2008.
Contributed paper,
Massive Data Sets in High-Energy Physics.
Joint Statistics Meetings, Denver, Aug 2008.
Plenary lecture,
Statistical methods for massive data in physics and genomics,
International Conference on Robust Statistics,
Antalya, Turkey, September 2008.
Contributed paper,
Massive Data Sets in High-Energy Physics,
Army Conference on Applied Statistics, Lexington, VA, 23 Oct 2008.
Invited seminar,
Statistics in the Forensic Sciences,
Dept of Statistics, Univ of Illinois Urbana-Champaign, 22 Jan 2009.
Invited seminar,
Statistical methodology for massive data sets,
Department of Statistics, Stern School of Business,
New York University, 27 Feb 2009.
Invited seminar,
Statistical methodology for randomized cancer screening trials,
Department of Statistics and Actuarial Sciences,
University of Iowa, 9 Apr 2009.
Invited (with A. Mazza),
Statistical issues in the evaluation of fingerprint evidence,
Annual meeting of the Scientific Working Group on Friction
Ridge Analysis, Study and Technology, St. Paul MN, May 2009.
Invited,
Statistical methodology for high-energy physics data,
Jet Propulsion Laboratory, 19 May 2009.
Invited seminar,
Challenges in the statistical analysis of massive data sets,
Computer Science, Indiana University, 7 Oct 2009.
Invited seminar,
Length biased sampling in randomized screening trials,
Department of Statistics, Purdue University, 8 Oct 2009.
Contributed paper (with A.M. Santos, presenter):
Robust estimation of mixtures of long-tailed distributions.
Army Conference on Applied Statistics, Phoenix, 22 Oct 2009.
Contributed paper,
Statistical issues in the comparison of multi-dimensional profiles,
Army Conference on Applied Statistics, Phoenix, 23 Oct 2009.
Invited seminar,
Statistical issues in the analysis of massive data sets,
Dept of Statistics, Kansas State University, 11 Mar 2010.
Invited seminar,
Statistical analysis of randomized cancer screening trials,
ASA Chapter, Kansas, 11 Mar 2010.
Invited presentation,
"The NAS Report on Forensic Science,"
Los Angeles County Public Defender's Workshop on Forensic Training,
Los Angeles, 20 Mar 2010.
Invited presentation,
The NAS Report on Forensic Science,
Chesapeake Bay Regional Meeting of the International
Association for Identification, Norfolk VA, 25 Mar 2010.
Invited presentation,
Statistical considerations in evaluating forensic science methods,
National Association of Criminal Defense Lawyers, Atlanta, 15 Apr 2010.
Invited presentation,
Statistical considerations in evaluating forensic science methods,
District Court Federal Judges Workshop, 6 May 2010.
Invited presentation,
Effect of influential observations on penalized regression estimators,
International Conference on Robust Statistics, Prague, 29 Jun 2010.
Invited presentation,
Statistical issues in comparing multidimensional profiles,
International Symposium on Business and Industrial Statistics,
Portoroz Slovenia, 8 Jul 2010.
Number of Presentations: 37.00
Non Peer-Reviewed Conference Proceeding publications (other than abstracts):
Number of Non Peer-Reviewed Conference Proceeding publications (other than abstracts): 0
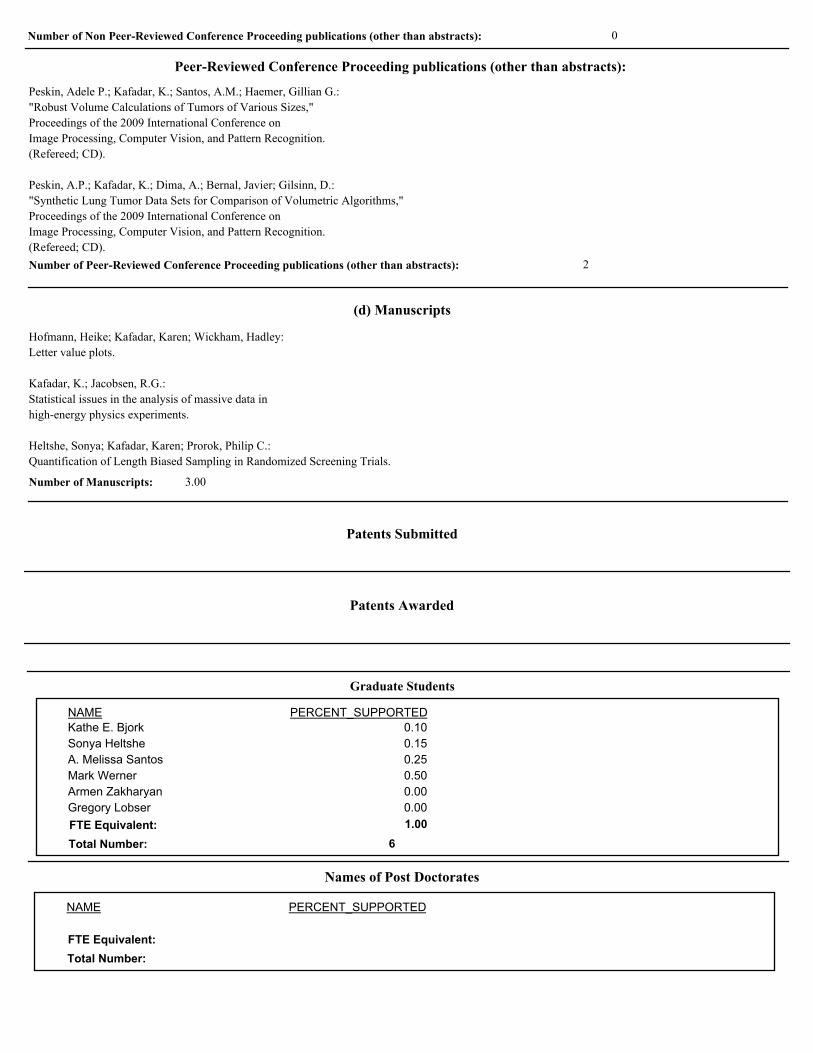
Peer-Reviewed Conference Proceeding publications (other than abstracts):
Peskin, Adele P.; Kafadar, K.; Santos, A.M.; Haemer, Gillian G.:
"Robust Volume Calculations of Tumors of Various Sizes,"
Proceedings of the 2009 International Conference on
Image Processing, Computer Vision, and Pattern Recognition.
(Refereed; CD).
Peskin, A.P.; Kafadar, K.; Dima, A.; Bernal, Javier; Gilsinn, D.:
"Synthetic Lung Tumor Data Sets for Comparison of Volumetric Algorithms,"
Proceedings of the 2009 International Conference on
Image Processing, Computer Vision, and Pattern Recognition.
(Refereed; CD).
Hofmann, Heike; Kafadar, Karen; Wickham, Hadley:
Letter value plots.
Kafadar, K.; Jacobsen, R.G.:
Statistical issues in the analysis of massive data in
high-energy physics experiments.
Heltshe, Sonya; Kafadar, Karen; Prorok, Philip C.:
Quantification of Length Biased Sampling in Randomized Screening Trials.
(d) Manuscripts
Number of Peer-Reviewed Conference Proceeding publications (other than abstracts): 2
Number of Manuscripts: 3.00
Patents Submitted
Patents Awarded
Graduate Students
PERCENT_SUPPORTEDNAME
Kathe E. Bjork 0.10
Sonya Heltshe 0.15
A. Melissa Santos 0.25
Mark Werner 0.50
Armen Zakharyan 0.00
Gregory Lobser 0.00
1.00FTE Equivalent:
6Total Number:
Names of Post Doctorates
PERCENT_SUPPORTEDNAME
FTE Equivalent:
Total Number:
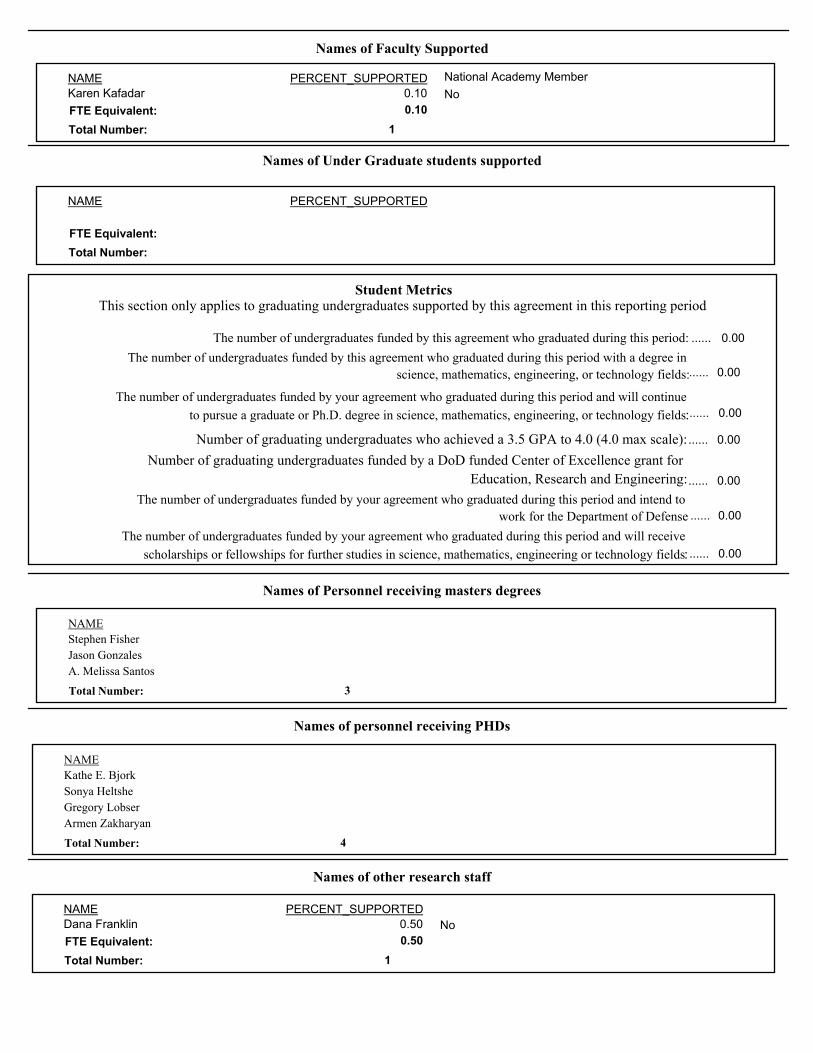
Names of Faculty Supported
National Academy MemberPERCENT_SUPPORTEDNAME
Karen Kafadar 0.10 No
0.10FTE Equivalent:
1Total Number:
Names of Under Graduate students supported
PERCENT_SUPPORTEDNAME
FTE Equivalent:
Total Number:
The number of undergraduates funded by this agreement who graduated during this period with a degree in
science, mathematics, engineering, or technology fields:
The number of undergraduates funded by your agreement who graduated during this period and will continue
to pursue a graduate or Ph.D. degree in science, mathematics, engineering, or technology fields:
Number of graduating undergraduates who achieved a 3.5 GPA to 4.0 (4.0 max scale):
Number of graduating undergraduates funded by a DoD funded Center of Excellence grant for
Education, Research and Engineering:
The number of undergraduates funded by your agreement who graduated during this period and intend to
work for the Department of Defense
The number of undergraduates funded by your agreement who graduated during this period and will receive
scholarships or fellowships for further studies in science, mathematics, engineering or technology fields:
0.00
0.00
0.00
0.00
0.00
0.00
......
......
......
......
......
......
Student MetricsThis section only applies to graduating undergraduates supported by this agreement in this reporting period
The number of undergraduates funded by this agreement who graduated during this period: 0.00......
Names of Personnel receiving masters degrees
NAME
Stephen Fisher
Jason Gonzales
A. Melissa Santos
3Total Number:
Names of personnel receiving PHDs
NAME
Kathe E. Bjork
Sonya Heltshe
Gregory Lobser
Armen Zakharyan
4Total Number:
Names of other research staff
PERCENT_SUPPORTEDNAME
Dana Franklin 0.50 No
0.50FTE Equivalent:
1Total Number:

Sub Contractors (DD882)
Inventions (DD882)
Final Report: Data-Based Detection of Potential Terrorist Attacks:
Statistical and Graphical Methods
June 2010
Karen Kafadar
Department of Mathematics
University of Colorado-Denver
Denver, Colorado 80217-3364
Present address:
Department of Statistics
Indiana University
Bloomington, Indiana 47408-3385
Table of Contents
Executive Summary – p.2
1. Statement of problem studied: Methods to identify outliers in massive data streams – p.2
2. Cybersecurity: Monitoring Internet Traffic Data – p.6
3. Forensic Science: Methods and evaluation – p.11
4. High-energy physics – p.13
5. Genomics: “Big p, small n” – p.15
6. Additional research: Length biased sampling and Library search – p.17
7. Impact – p.18
8. References – p.19
1
Executive Summary
This research has developed methods for analysis and display of massive data. A series of issues
were studied: graphical methods (letter value plots), dimension reduction, evaluation of forensic
science methods, analysis of gene expression data, and effects of length biased sampling. This
report summarizes the findings on each of these topics.
1 Statement of problem studied: Methods to identify outliers in
massive data streams
Statistical algorithms have been developed to detect unusual events or aberrations that may indicate
serious problems. The contexts for which these algorithms have been developed generally involve
very large numbers of records but often only a few outcome variables and covariates: for example,
high incidence of infectious diseases (possible epidemics), excessive charges on a credit card or
telephone (possible stolen card), or high levels of environmental pollutants. Another simplifying
feature of the data for these contexts is the ability to stratify the data into reasonably homogeneous
groups; e.g., by disease or disease category; by individual or family; by geographical locale. The
challenges today with massive data arise because of the disparate nature, source, and type of
data, such as passengers with accompanying baggage that have checked in for a flight, syndromic
surveillance, or computer operations or Internet sessions. The research that was conducted during
the period of this grant solves problems and develops methodology needed for the analysis of these
types of data.
The specific tasks documented in the proposal, and the results of the tasks, are outlined below.
1. Continue collaborations with Professor Wegman at George Mason University on the develop-
ment of “evolutionary graphical displays” through summer visits and using GMU’s Internet
traffic data.
The result of this collaboration was the published article:
Kafadar, Karen; Wegman, Edward J.: ”Visualizing ‘typical’ and ‘exotic’ Internet traffic data.”
Computational Statistics and Data Analysis 50, 3721-3743 (2006).
2
In this article, we propose new displays that can be used readily by non-technical personnel
for monitoring Internet communications. We develop skyline plots, moving histograms, and
use waterfall diagrams (Marchette and Wegman 2004).
2. Initiate research on the development of methods of analysis (metrics, information, residuals)
on graphical objects.
Research on this topic evolved to address methods for analyzing segmentation methods of
tumor image data, needed for accurate and precise estimates of tumor volumes. The work
involved collaborations with Dr. A.P. Peskin and colleagues at the National Institute of Stan-
dards and Technology. Two refereed conference proceedings were published:
• Peskin, Adele P.; Kafadar, K.; Santos, A.M.; Haemer, Gillian G.: “Robust Volume Cal-
culations of Tumors of Various Sizes,” Proceedings of the 2009 International Conference
on Image Processing, Computer Vision, and Pattern Recognition. (Refereed; CD).
Many advances in medicine today require the accurate reading of computerized tomo-
graphic (CT) images of the body. Tumors in the lung, for example, are classified accord-
ing to their detected growth, i.e. change in volume, over a period of time. CT data are
collected as sets of three-dimensional grid points. Tumors are often so small that a large
proportion of the pixels that represent the tumors lie near the tumor surfaces. If an edge
of a tumor lies between two pixel locations, radiologists must determine which of those
pixels should be included in a measurement of the tumor size, determinations which can
have large effects on estimated tumor volumes. Current techniques to measure these
“partial volumes,” or 3-D voxels in the grid that are only partially filled, in this case by
a tumor in a scan of the lung, vary widely in resulting tumor volume measurements. We
present a statistical method that leads to accurate estimates of these volumes.
• Peskin, Adele P.; Kafadar, K.; Dima, Alden; Bernal, Javier; Gilsinn, David: “Syn-
thetic Lung Tumor Data Sets for Comparison of Volumetric Algorithms,” Proceedings
of the 2009 International Conference on Image Processing, Computer Vision, and Pattern
Recognition. (Refereed; CD).
The change in pulmonary nodules over time is an important indicator of malignant
tumors. It is therefore important to be able to measure change in the size of tumors from
3

computed tomography (CT) data taken at different times and on potentially different CT
machines. A particular tumor may or may not be divided into slices at exactly the same
places on two different sets of scans. The pixel distributions and average background
values may also not be the same between two different sets of data. Standardized sets of
data are needed to compare techniques for calculating tumor volumes and/or the change
in tumor size between two sets of data. Combining phantom data with realistic lung data
could provide realistic standardized data sets, which include many of the measurement
challenges that are not available in pure phantom data alone. We present a set of
synthetic lung tumor data in which synthetic tumors of known volume are embedded in
real lung CT data in different background settings in the lung.
3. Study the robustness (validity, efficiency) of Hotelling’s T 2 statistic to misspecified covariance
matrix as part of the research into the development of methods of analysis on graphical objects
that contain multiple features.
The problem of accurate and precise estimates of covariance matrices among large numbers
of variables leads to the need for dimension reduction methods. Historically, the method
of principal components has provided a reduced set of orthogonal variables that are linear
combinations of the original variables. These principal components are useful but often not
insightful. Alternative methods include modifying the coefficients to “meaningful” values, or
penalized regression estimators as a way of shrinking (to zero) the coefficients for potentially
insignificant variables. We take the latter approach in this research. This work involved
collaborations with Guilherme V. Rocha, and early efforts have been presented at two recent
conferences:
• Effect of influential observations on penalized regression estimators, International Con-
ference on Robust Statistics, Prague, 29 Jun 2010.
• Invited presentation, Statistical issues in comparing multidimensional profiles, Interna-
tional Symposium on Business and Industrial Statistics, Portoroz Slovenia, 8 Jul 2010.
This research demonstrates that ordinary penalized regression estimators, such as ridge re-
gression (L2 loss function: minimize the sum of squared residuals; L2 penalty function on
4
the coefficients: sum of the squared coefficients constrained to be less than a pre-selected
limit), or Lasso (Tibshirani 1996: L2 loss function; L1 penalty function), can be influenced by
outliers. A good compromise that pays less attention to outliers, but performs well with both
Gaussian and long-tailed (Cauchy) data, combines the use of Lasso’s L1 penalty function with
an L1 loss function.
4. Work with Professor Robert L. Jacobsen (U.C. Berkeley) in the development of methods
and searches for “outliers” defined by specific combinations of events in massive high-energy
physics databases.
New statistical methods arise in response to new data types encountered in various disciplines;
e.g., design of experiments to identify influential factors in plant and animal studies, survival
analysis and sequential analysis of data from medical investigations, detection of echoes in
long-range time series data, nonparametric and robust methods for non-Gaussian data, mul-
tiple comparisons to address multiple hypothesis tests. Advances in both the scientific dis-
cipline and statistics result from successful collaborations between the scientific investigators
with the data and the statisticians with the tools to develop methods for analyzing them.
These opportunities exist for collaborations between statisticians and high-energy experi-
mental particle physicists, with high potential for significant research advances in both fields.
Particle physics experiments produce massive amounts of streaming data from the occurrence
of “events” (collisions between particles or other types of particle activity), whose constituents
are measured, recorded, and saved in huge data bases. As newer and faster accelerators lead
to ever-increasing amounts of data, the increasing amounts of data demand the development
of efficient statistical methods to identify subtle effects amidst immense, but largely already
well-established, effects. We outline in this article the framework under which experimental
physicists conduct their investigations and review areas where statistics has been applied al-
ready to advance knowledge in the field. We then focus on current challenges and provide
an approach to study massive data sets with the goal of identifying a very small fraction of
unusual “target” events. The analysis framework likely will be applicable to massive data
problems in fields such as protein identification, financial and marketing applications, and
public safety surveillance systems.
5
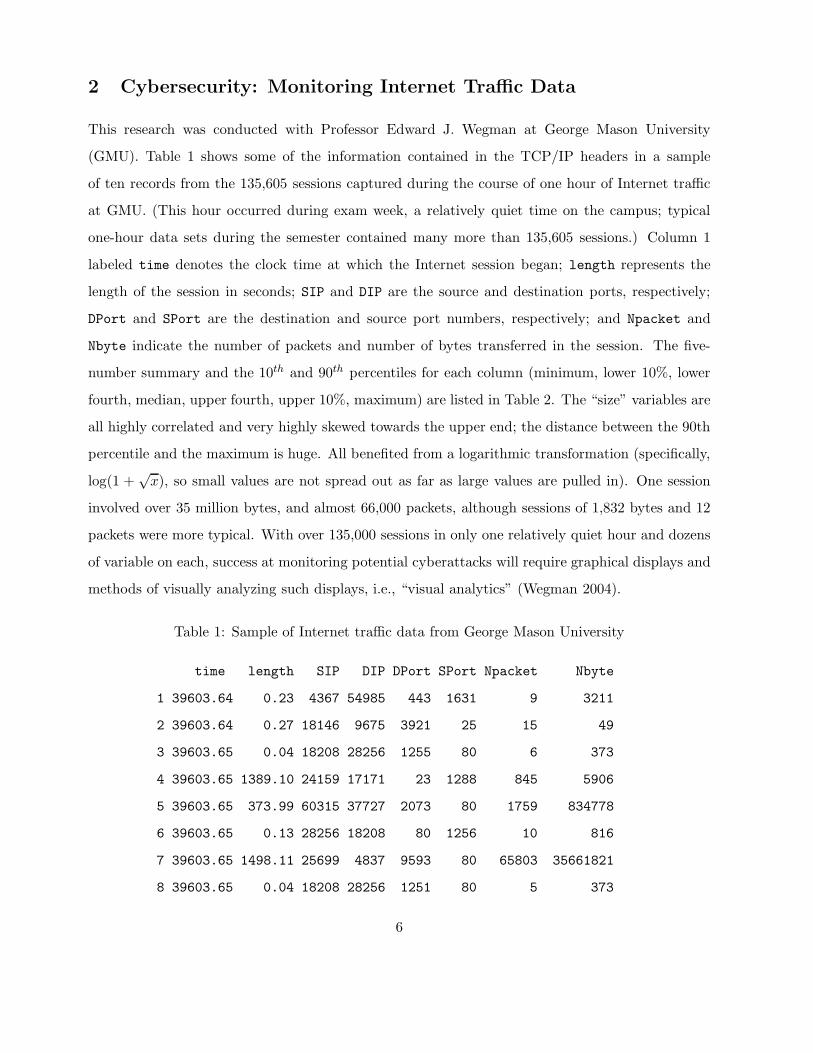
2 Cybersecurity: Monitoring Internet Traffic Data
This research was conducted with Professor Edward J. Wegman at George Mason University
(GMU). Table 1 shows some of the information contained in the TCP/IP headers in a sample
of ten records from the 135,605 sessions captured during the course of one hour of Internet traffic
at GMU. (This hour occurred during exam week, a relatively quiet time on the campus; typical
one-hour data sets during the semester contained many more than 135,605 sessions.) Column 1
labeled time denotes the clock time at which the Internet session began; length represents the
length of the session in seconds; SIP and DIP are the source and destination ports, respectively;
DPort and SPort are the destination and source port numbers, respectively; and Npacket and
Nbyte indicate the number of packets and number of bytes transferred in the session. The five-
number summary and the 10th and 90th percentiles for each column (minimum, lower 10%, lower
fourth, median, upper fourth, upper 10%, maximum) are listed in Table 2. The “size” variables are
all highly correlated and very highly skewed towards the upper end; the distance between the 90th
percentile and the maximum is huge. All benefited from a logarithmic transformation (specifically,
log(1 +√x), so small values are not spread out as far as large values are pulled in). One session
involved over 35 million bytes, and almost 66,000 packets, although sessions of 1,832 bytes and 12
packets were more typical. With over 135,000 sessions in only one relatively quiet hour and dozens
of variable on each, success at monitoring potential cyberattacks will require graphical displays and
methods of visually analyzing such displays, i.e., “visual analytics” (Wegman 2004).
Table 1: Sample of Internet traffic data from George Mason University
time length SIP DIP DPort SPort Npacket Nbyte
1 39603.64 0.23 4367 54985 443 1631 9 3211
2 39603.64 0.27 18146 9675 3921 25 15 49
3 39603.65 0.04 18208 28256 1255 80 6 373
4 39603.65 1389.10 24159 17171 23 1288 845 5906
5 39603.65 373.99 60315 37727 2073 80 1759 834778
6 39603.65 0.13 28256 18208 80 1256 10 816
7 39603.65 1498.11 25699 4837 9593 80 65803 35661821
8 39603.65 0.04 18208 28256 1251 80 5 373
6
9 39603.66 122.38 54985 4179 1298 443 99 85559
10 39603.66 0.13 28256 18208 80 1257 10 816
11 39603.66 0.00 18464 28256 1253 80 3 0
12 39603.67 33.17 22859 7765 1269 80 20 9221
13 39603.67 1270.91 17899 21649 2318 8028 29216 17438688
14 39603.67 237.70 7693 40669 1680 80 2553 637466
15 39603.68 1.01 14853 9675 3920 25 18 5415
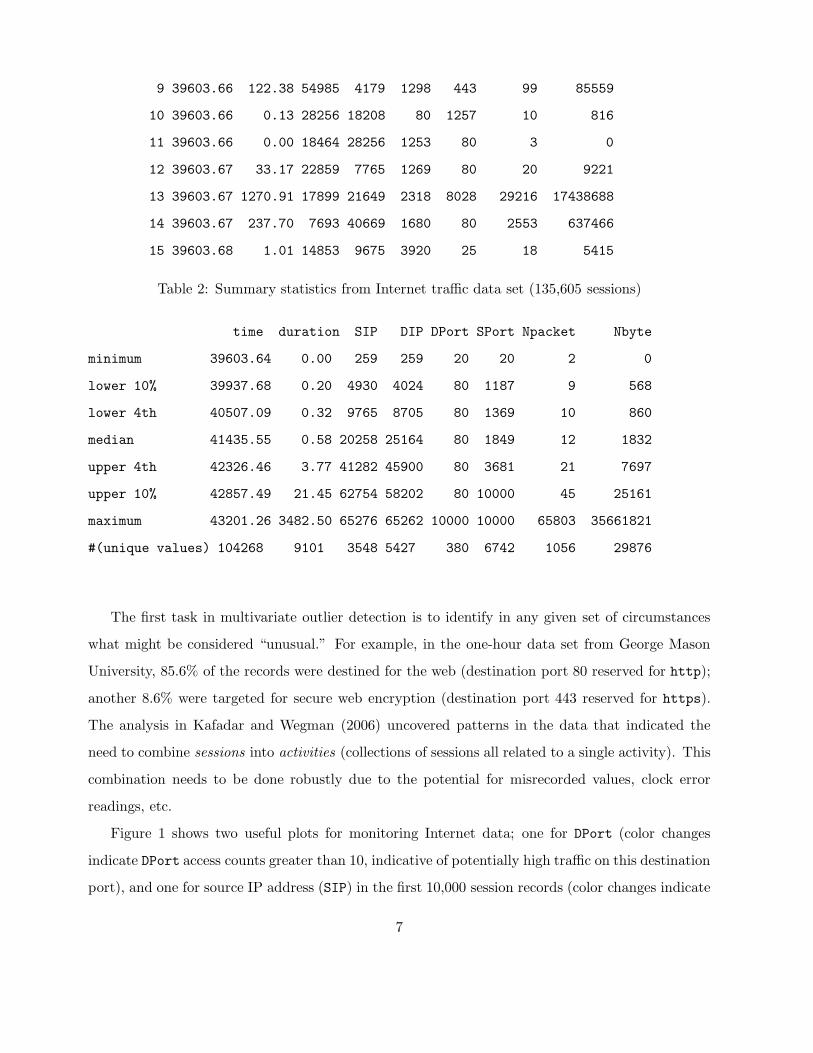
Table 2: Summary statistics from Internet traffic data set (135,605 sessions)
time duration SIP DIP DPort SPort Npacket Nbyte
minimum 39603.64 0.00 259 259 20 20 2 0
lower 10% 39937.68 0.20 4930 4024 80 1187 9 568
lower 4th 40507.09 0.32 9765 8705 80 1369 10 860
median 41435.55 0.58 20258 25164 80 1849 12 1832
upper 4th 42326.46 3.77 41282 45900 80 3681 21 7697
upper 10% 42857.49 21.45 62754 58202 80 10000 45 25161
maximum 43201.26 3482.50 65276 65262 10000 10000 65803 35661821
#(unique values) 104268 9101 3548 5427 380 6742 1056 29876
The first task in multivariate outlier detection is to identify in any given set of circumstances
what might be considered “unusual.” For example, in the one-hour data set from George Mason
University, 85.6% of the records were destined for the web (destination port 80 reserved for http);
another 8.6% were targeted for secure web encryption (destination port 443 reserved for https).
The analysis in Kafadar and Wegman (2006) uncovered patterns in the data that indicated the
need to combine sessions into activities (collections of sessions all related to a single activity). This
combination needs to be done robustly due to the potential for misrecorded values, clock error
readings, etc.
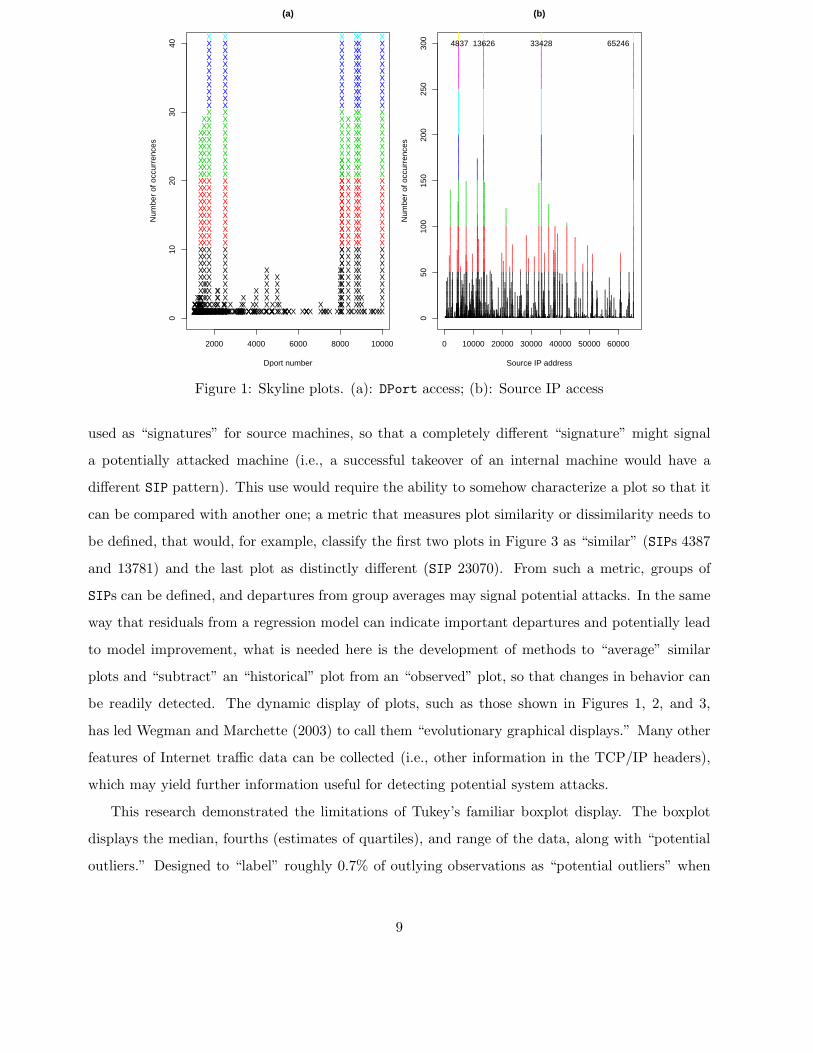
Figure 1 shows two useful plots for monitoring Internet data; one for DPort (color changes
indicate DPort access counts greater than 10, indicative of potentially high traffic on this destination
port), and one for source IP address (SIP) in the first 10,000 session records (color changes indicate
7
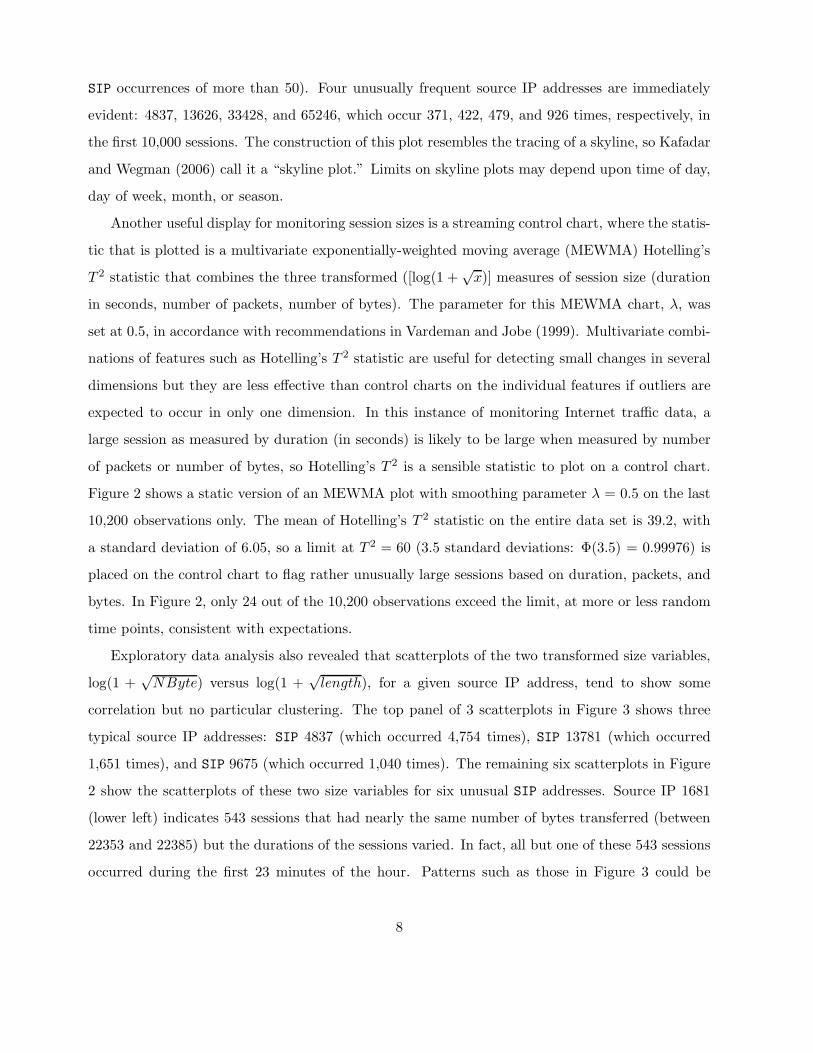
SIP occurrences of more than 50). Four unusually frequent source IP addresses are immediately
evident: 4837, 13626, 33428, and 65246, which occur 371, 422, 479, and 926 times, respectively, in
the first 10,000 sessions. The construction of this plot resembles the tracing of a skyline, so Kafadar
and Wegman (2006) call it a “skyline plot.” Limits on skyline plots may depend upon time of day,
day of week, month, or season.
Another useful display for monitoring session sizes is a streaming control chart, where the statis-
tic that is plotted is a multivariate exponentially-weighted moving average (MEWMA) Hotelling’s
T 2 statistic that combines the three transformed ([log(1 +√x)] measures of session size (duration
in seconds, number of packets, number of bytes). The parameter for this MEWMA chart, λ, was
set at 0.5, in accordance with recommendations in Vardeman and Jobe (1999). Multivariate combi-
nations of features such as Hotelling’s T 2 statistic are useful for detecting small changes in several
dimensions but they are less effective than control charts on the individual features if outliers are
expected to occur in only one dimension. In this instance of monitoring Internet traffic data, a
large session as measured by duration (in seconds) is likely to be large when measured by number
of packets or number of bytes, so Hotelling’s T 2 is a sensible statistic to plot on a control chart.
Figure 2 shows a static version of an MEWMA plot with smoothing parameter λ = 0.5 on the last
10,200 observations only. The mean of Hotelling’s T 2 statistic on the entire data set is 39.2, with
a standard deviation of 6.05, so a limit at T 2 = 60 (3.5 standard deviations: Φ(3.5) = 0.99976) is
placed on the control chart to flag rather unusually large sessions based on duration, packets, and
bytes. In Figure 2, only 24 out of the 10,200 observations exceed the limit, at more or less random
time points, consistent with expectations.
Exploratory data analysis also revealed that scatterplots of the two transformed size variables,
log(1 +√NByte) versus log(1 +
√length), for a given source IP address, tend to show some
correlation but no particular clustering. The top panel of 3 scatterplots in Figure 3 shows three
typical source IP addresses: SIP 4837 (which occurred 4,754 times), SIP 13781 (which occurred
1,651 times), and SIP 9675 (which occurred 1,040 times). The remaining six scatterplots in Figure
2 show the scatterplots of these two size variables for six unusual SIP addresses. Source IP 1681
(lower left) indicates 543 sessions that had nearly the same number of bytes transferred (between
22353 and 22385) but the durations of the sessions varied. In fact, all but one of these 543 sessions
occurred during the first 23 minutes of the hour. Patterns such as those in Figure 3 could be
8
2000 4000 6000 8000 10000
010
2030
40
(a)
Dport number
Num
ber
of o
ccur
renc
es
XX X XXXXX XX X XX XXX X X XXXX
XX X X
X
XX X XX XXXXX XXX XX XXX X XXXX XX X XXX XXX
XXXX XXXXX XX XX
XXXXXXX
X
XX XXXXX XXX XXX
XX
XXX XXXX
X
X
XX
X XXX XXX
X
XXX XX
X
X XXX XXX
X
X
XXXX
X
XX
X
X
X
X
X
XXXX XXX XXX X XX
XX
XX X XXX X
XX
XXX X
XX
XX XXXXXXXX
XXX
X
X
X
XX
XX
X
XX
XX
X
XX
X
XX
X
X
X
X
XXX
XXXXX
X
X
X X
X
X
X
X
X
X
X
X
XX
X
XX
XXXXX XX
X
X
X
X
X
X
X
X XX
X
XX
X
X
X
X
X
X
XXX
X
X
XX
X X
X
X
X
X
X
X
X
X
X
XX
X
X
X
XXX
X
X
X
X X
X
X
X
XX XXX
X
X
X
X
X
X
X
X X
X
X
XXXX X
X
X
XX
X
X
X
X
X
X
X
X
X
X
XX
X
X
X
X
X X
X
X
X
X
X
X
X
X X
XXX
XXX X
X
X
X
XXXXX
XX XXXX
XX
XXX
X
X
X
X
XXX XXX
X
X
X
X
XX
X
X
X
X
X
X
X
X
X
X
X
XXXX XX X
XXX
X
XXXXX
X
X
X
XX X
XXX
X
X
XX
X
X
X
X
X
X
X
X
X
X
X
XX
X
X
XX
X
X
X
X X
X
X
X
X
XX
XX
X
XXXXXXX
XXXXXXXXXXXXXX
X
XXXX
X
XXXXXXXXXXXXXXXXXX
X
X
XXXX
XXXXXXX
X
X
XX
X
XX
XXXX X
X
XX
X
X XXXX
X
X
X
XXXXXXXXXXXXXXXXXXXXXXXX
X
X
X
XXXXXXX
X
X
X
XX
X
X
X
XX
X
XXXXX
X
X XX
X
X
XX
X
XXXX
X
X
XXXX X XXX
X
XXXXX
XXXXX
X
XXXXX
X
XXX X
XXX
XXXX
X
X
X
XXXXXX
X
XXXX XX
XX
X
X
X
XX
X
X
XX
X
X
XXXX X
XXXX
XXX
X
XX
XX XX
XXX
X
XXX
XXX XX XXXXXXXXXX
X
X
X
X XX
XX X
XX
X
X
X
XX
XXXXXXXXXXXXXXXXXXX
X XX
XXXXXXXXXXXXXXXXXXX
XX
X
XXXX
XXX
XX
X
X
X
X
X
XXXX
X XXX
X
X
X
XXX
XX
0 10000 20000 30000 40000 50000 60000
050
100
150
200
250
300
(b)
Source IP address
Num
ber
of o
ccur
renc
es
. .. . .... ... ... . .. .. .. ... .. . . .. .... . ... . . .. . .. .. ..... .. .. .. . .... .... .. ....... . ..
. .... ....
..
...
...
.... . .... . . .. .
...
....
....
.. .. ... ...
..
. ... ..
..
....
.
.. .. . .....
.
. ..
.
.
.
.. .. . ... . ...
....
.
. . . ..
.
... ..
.. .. .... .. ..
..
. ...
... .
... .
..
..... ..
.
.. .
.
... . .... . .... .. . ....
... .... ...
..
..
. ..
.
.
...
.. ...
....
.
.
.
....
..
..
...
..
.... .
.. .. . .. .. .. ... ..
.. ......
.. .. .. ....... .
.
.........
.....
... .. .
..
...
.
..
.
. . . ...
... .
...
..
..
...
.. ...
.. .
.
.. . .....
....
...
.. ..
... ...
. .
..
. ..
..
. .. ....
.
..... .
.. ...
.... ....
.. ..
.
... . ... ...
. .. ...
.
. ..
...
.
.
...
.. ..
... . .. .....
....
..
.
.. .
..
... .
.
...
.
. ..
..
..
.
..
.
.
..
....
.
. ..
. ..
.
....
. ...
.
..
.
. ..
.
.......
.. ....
..
..
.
.
.
.
.
..
..
..
. .....
... .....
.
..
...
.. ....
.
...
. ...
..
. ... .
. .
.
...
..
...
.
.
..
...
..
..
.
.. .
.
.
.
.
.
.
...
..
.
. ..
.
.
.
..
.
. .
.
. .
..
.....
.
.
....
.
.
.
..
..
.
.
...
.
.
. .
.
.
.
.
.
. .
.
..
.
.
.
.
.
..
.. .... ..
..
.
..
.
..
..
.
.
..
.
.
...
.
.
..
.
.
...
..
. .. ..
.. .
..
.
.. ... ... . .
.
. ... ..
.
..
...
.
.
.....
..
..
.....
..
...
..
.....
.
.
......
.
.
..
.
...
. ..
.
.
.
...
.
. ..
.
.
.. .
.
.....
.
.
..
.
....
.
...
...
.
.
.
..
.
..
.
.
. .
.
..
.
..... .
...
.
.
.
. ..
.
..
.
.
.
.
.
...
.
.
.. ..
.
..
.
.
.
.. .
.
...
.. . ....
.. ...
.
..
.
.
.
..
......
.
.
.
.. .
...
.
.
..
.
.
....
.
.
.
....
.
.
....
.
.
. .. .....
.. ... ... ......
.
.
.. ... .
..
.. . .. .. .. . ...
.. . ...
.
.. .
.
. ...
...
.
.. .... ..
.
.. ... .
. ..... .
... .....
.
.
.
.
.. ..
.
.
.
. .
.
..
.
.
. ..
..
. .
.
. ..
...
..
.
.
..
.
.. ..
.
.
..
..
.
..
.
. .
.
..
..
..
.
.
.
.
.
..
..
.
.
.
.
.... .
. ..
. .
.
.. .. .. .
.
...
.
. .
.
.
..
..
.
.
.
. .. . . ..
.
..
.. .... . .
.
.. . .. ... .
.
....
...
. ..
.
..
.
.
.... .
..
. .. .. .
.
. .. .
.
..
.
.. ....
.
.
...
..
...
.
. . ..
.
..
..
.
. . .... .
.
. . ..
.
. ..
.
.
..
. .
.. .
.
.
.
.. . .
..
.. .
..
.
.
. .. ... ...
.
.
. ..
..
.....
.
.
.
....
.
.
.
... .. .
....
.. .
.
... ...
...... ....
..
.
..
.
...
..
..
... ..
..
..
.
.
... .
..
..
.
.
.
.... .
.
. ....
.
..
. .
.
. ..
... .
..
.
..
. ..
.
..
...
.
.
..
.
.
. .......
...
...
.
.
.
..
.
.
.
.
.
..
.
. .. ..
. ..
.
.
.
....
.. .
. .
.
.
.
.
. ..
.
.
. .
.
.
.
.
..
..
.. ...
.
.
.
.
..
..
..
..
..
.
.
.
.
.
.
.
.. ...
..
.
.. ........
...
.
. .
..
.
.
.
.
......
.
..
.
.
.
... ..
.
.
.
....
..
.
.
.
.
.
.
.
.
.
.
.
.
.
.
..
.
.
.. ...
.
.
.
.
.
.
.
...
.
.
.
.
.. .
.
.
.
.
. . .
.
..
.
.
.
....
.
.
..
..
.
..
..
.
.
.
..
..
.
.
..
.
.
.
..
..
...
..
.
.
..
.
.
.... .
..
..
.
....
..
.
.
.
.
.
.
.
.
.
. .
.
.
.
.
.
..
...
.
.
.
.
..
.
.
..
.
.
. . .. ...
..
.. .
.
.
.
.
... .
.
. .. .
.
.
..
.
..
.
.
..
.
... ...
....
.
.
.
..
.
. ..
.
.
.
.... . .
...
.
... ..
. .
.
.
.
..
.
..
.
. ..
. .
.
.... .
.
.
.
.
..
.
..
...
.
.
.. .
.
.
.. . ..
.. .
.
..
..
.
. .
.
..
.
.
.
.
.. ..
.
.
.
.
.
.
...
...
.
.
.
.
.
.
.
.
. . .. .
.
.... .. . .. . ...... .
.
....
..
.
.. ... ...
. ... . ...
.. ..
.... ....
...
.
. ...
..
..
.
...
.
.
.. .....
....
..
.
.
.
.
...
.
. .
. .
..
..
.
.
.
.
.
..
.
.
.
.. .
..
.
.........
.
.
. ..
.
.
... .
.
..
..
.
. ...
.
.
. ..
..
...
.
......
......
.
.
..
......
.....
..
.....
..
..
..
.
......
......
.....
.
.
.
.
..
.
.
.
.
..
.
.
..
..
. .. .....
.
.
.
.
.
.. .
.
.
.
.
...
..
.
.
.
..
...
.
.
.
.
..
.
..
.
.
..
.
. .
.
.
.
.
.. .....
.
.
..
.
.
..
.....
... ..
..
.
.. .
..
. ....
.
..
.. ..
.
.
.
..
.
.
. .
. ..
.
.
.
.
.
.
.
.
.
. ...
..
.
.
.
.
.
.
..
.
..
..
.
..
..
...
..
.
.
..
.
.
..
..
.
..
..
.
.
.
....
.
..
..
.
......
.
.
.
.
.
. .
.....
...
.
..
.
.
.
.
.
.
... .
..
......
.
..
.
.
.
.
.
.
..
.
..
.
..
...
..
.
.....
.
.
.
..
. ...
...
.
..
.... .
.
.
..
. .
.. .. ..
...
...
.
.. .
....
..
. ...
. .
. .
. .
.
.
.
..
.
...
.
.
.
....
.
..
..
.
.
.
..
.
.
.
..
.
.... ...
...
.
....
.
.
...
.
..
.
..
.
.
.
.
. ...
....
...
.
..
.
.
.
.
. ..
.
.. ..
. .. .
..
..
.
..
.
... ..
..
..
... .
..
..
..
. ..
..
.
.
...
..
..
..
.
. ..
.
.
. ..
.
.
..
... . ..
...
. ..
.
.
...
..
.
..
.
. ..
..
.. .
.
..
...
.
..
.
.
....
.
.
.
.
.
.
.
..
.
.
..
.
.
..
..
.
..
....
.
..
..
.
. ..
.
.
...
.
.
.
.
.
.
.
..
.
..
.
..
.
...
..
...
....
...
.
..
.
. ..
.
.
.
.
.
.
.
..
.
. ..
..
.
..
.
...
. ..
.
.
.
..
.
.....
.
..
..
.
. ...
..
.
..
.
.
.
. ..
.
. .
..
....
.
. ....
.
...
.
.
...
..
....
.
.
.. .
.
.
.
..
.
.
.
.
.
.. .
.
.
. ..
.
.
..
.
.
..
.
.
.
..
..
.
.
..
..
.
.
.
.. . .
..
. .
..
..
...
.
.
.
.
.
.
..
..
.
.
.
... .
.
.
.
..
.. ..
..
.
....
. ..
.
.
.
..
..
.
.
.
.
.
...
.
.
.
.
.
.
.
. . .
.
.
.
....
.
.
.
.
..
.
.
.
..
.
.
.
.
.. .
..
.
.
.
..
.
.
.
. . .. ...
.
...
.
.
..
..
.
.
.
.
.
.
..
..... .
.
...
.
.
.
..
.
.
.
.
. .
.
.
..
.
.
.. ...
.
.
..
.
.
.
.
.. .
.
.
.
.
.
.
...
.
..
.
..
.
.
.
.
.. .
.
.
.
.
.
.
.
...
.
.
...
.
.
.
.
.
..
...
.
.
.
..
.
....
.
.
..
.
.
.
.
..
.
..
.
.
.
..
.
.
...
.
.
.
.
..
.
.
.
.. .
.
.
.
.
.
.
...
.
.
.
.
.
.
.
.
..
.
..
... .
.
.. . .
.
.
.
.
.
. .
.
.
.
.
...
.
. ...
..
.
.
.
.
.
.
.
..
.
.
.
..
.
.
.
...
..
.
.
.
.....
.
.
..
.
. ...
.
.
.
....
.
..
.
.
.
..
.
.
.
.
..
.. .
..
.
.
.
.
..
.
.
.
.
.
.
.
.
.
.. .. ...... ...
.. ... ..
....
.
.
...
.
.
..
.
..
...
..
..
.
.
.
..
..
...
.
. .. ..
.
.
.
.
.
..
.
.
..
.
.
.....
.
.
.
.
.
.
... ....
.
.
.
.
..
.
..
..
..
..
.
..
....
. ..
.
.
...
......
... .
.
. .. ... .
.
. .
.
.
.
.
. .
..
..
.
.
.
.
.
.
.
.
...
.
...
.
.
.
.... .
.
.
.
...
.
.
.
.
.
....
.
.
..
.. .
..
..
.. .
.
.
.
.
.
.
.
..
..
.
.
.
..
..
.
.
.
.
..
.
. .
.
.
..
..
.
..
.
.
.
.
.
..
...
.
.
.
..
.
.
..
.
..
.
.
.
..
..
..
..
.
.
.
.
...
..
.
. .
.
.
..
.
.
.
...
.
.
.
.
.
.
.
.
.
.
.
.
.
..
.
.
...
...
.
.
.
.
..
. .
.
. .
.
.
..
.
.
..
..
.
.
.
....
.
.
.
..
.
....
.
....
.
.
.
...
..
.
.
.
. .
.
.
. .
...
.
.
.
.
...
..
.....
..
.
.. ........
.
.
.. ....
.
..
.
.
..
.
.. .
.
...
...
.
...
.
.
.
...
..
.
.
.
.
.
..
.
.
.
.
...
.
.
.
..
.
.
.
.
.
.
.
.
.
..
.
.
.
..
.
.
.
...
.
.
.
.
.
.
.
.
.... .
..
..
.
. ....
.
. .
.
. .
..
.
.
.
..
.
.
.
.
.
.
.
.
... ..
. .
.
.
.
.. ..
.
.
.
.
.
.
..
.
..
.
..
.
...
..
...
....
.
....
.
..
.
.
.
.
.
.
.
..
... .
.
..
.
.
.
.
..
.
. .
..
..
.
..
. .
..
.
....
..
.
.
...
.
..
.
...
.
..
.
..
...
.
.
.
..
.
.
..
.
..
.
.
.
.
.
.
.
.
.
.
.
.
...
...
..
.
.
.
..
.
.
.
.
..
..
.
..
..
..
.
.
.
.
.
.
.
.
...
.
.
.
.. .
....
.
.
.
.
. .
.
.
..
.
....
..
.
.
.
.
. .
.
.
.
...
.
. .
.
.
.
.
.
.
..
..
..
.
. ..
.
.
.
..
.
.
.
.
..
.
....
.
.
.
.
.
.
.
.
.
.
.
..
.
..
.
..
.
..
.
.
.
.
.
.
.
.
..
..
. ...
..
.
.
.
.
.
.
.
..
.
.
.
. .. ..
.
.
.
..
.
.. .
.
.
.
.
.
.
.
. .
.
..
.
.
.
.
.
.
.
..
.
.
.
..
.
.
.
.
..
.
..
...
.
.
.
. .
.
.
.
.
.
.....
.
...
.
.
...
.
.
.
.
.
.
.
..
..
.
.
. .
.
. .
..
..
.
.
..
.
.
...
..
.
..
.
.
..
.
..
.
.
.
.. .
.
..
.
.
.
..
. ..
.
.
.
.
.
...
.. .
...
.
. ..
.
.
.
.
.
.
.
..
..
.
.
.
.
.
.
.
..
.
..
.
.
.
.
.
.
.
.
.
.
..
.
...
.
.
.... .
.
..
.
..
.
...
..
.
.
..
.
.
.
....
.
...
.
....
.
.
.
.
....
..
..
..
..
.
.
..
.. .
.
.....
.
.
....
.
..
.
..
..
.
..
..
.
.
. ..
.
.
.
.
.
...
.
.
..
.
..
..
..
..
. ..
...
.
..
.
.
..
.
.
.
...
.
..
.
.
..
.
.
.
....
.
.
.
.
.
.
.
..
.
.
.
.
.
.
.
.
.
..
..
.
.
.
.
.
.
.
.
.
.
.
.
.
.. ..
..
.
.
..
.
.
.
.
.
...
.
..
.
.
.
.
.
.
.
.
.
..
.
.
.
..
.
..
.
..
.
.
.
.
.
.
.
. ..
. .
.
.
.
.
.
.
.
..
.
...
..
.
.
.
..
.
.
.
.
. .
.
....
.
.
..
...
.
.
..
.
..
.
..
.
...
...
.
.
.
.
.
.
.
.
.
.
.
.
.
.
..
.
.
.
.
.
.
.
.
.
.
..
.
.
.
.
..
.
..
.
.
.
.
.
.
.
.
.
.
.
.
.
.
.
.
.. .
..
..
.
..
.
.
.
.
.
.
.
.
.
.
.
.
..
...
..
.
.
.
.
.
.
.
.
.
.
.
.
.
.
.
. ..
.
..
..
.
.
.
.
.
...
..
.
.
.
..
.
.
.
.
...
.
..
.
..
..
..
.
.
.
.
.
.
. .
.
.
...
.
.
.. .
....
...
.
..
.
.
..
.
.
.
.
...
.
.
.
..
.
.
.
.
.
.
.
..
.
. .
... .
. .
.
.
.
..
.
.
.
.
...
.
. ..
.
.
..
.
.
.
.. .
.
...
.
.
..
.
...
.
.
.. . .
.
..
.
.
.
.
.
..
.
.
.
.
..
...
.
.
.
.
.
..
..
.
.
.... .
.
.
. .
..
.
.
..
.
...
. ....
.
.
.
.
...
. .
..
....
.
.
.
....
..
.
.
..
.
.
.
.
..
.
.
.
..
.
.
.
..
..
.
.
....
.
.
.
...
..
.
.
.
...
.
.
.
...
.
.
.
.
.
.
..
.
.
.
.
..
.
.
.
.
...
.
.
.
...
.
.
..
.
..
.
.
.
.
.
.
...
.
.
..
.
.
..
.
.
..
.
.
.
.
.
.
.
.
..
.
.
.
.
..
.
....
..
.
.
.
.
.
...
.
.
.
.
.
.
.
.
.
..
..
.
.
.
.
.
..
..
.
.
..
..
.
.
.
.
.
...
.
.
.
.
.
.
.
...
.
.
.
.
..
.
.
. .
.. ..
.
.
. . .
...
.
.
..
.
.
..
.
...
.
.
.
.
.
..
.
.
..
.
.
.
..
.
.
.
..
.
. .
.
...
.
..
..
.
.
...
.
.
.
.
..
.
.
...
. . .
.
..
.
. . .
..
.
.
.
..
..
..
.
..
.
.
.
.
.
.
.
.
...
..
.
..
.
.
.
.
..
.
..
.
.
.
.
...
..
..
.
.
..
.
. .
.
.
.
.. .
.
.
.
.
..
.
...
.
.
..
.
.
.
..
..
..
.
..
...
.
.
.
.
.
..
.
..
.
.
.
.
.
.
.
..
.
.
..
.
.
. ..
..
.
.
...
...
.
.
.
..
.
. .
.
.
.
..
.
.. .
.
..
.
..
.
...
.
..
.
..
.
.
.
.
.
.
.
.
.
.
.
.
.
.
.
.
.
..
.
.
.
.
.
.
...
.
.
.
.
.
..
.
..
.
.
....
.
.
.
.
. .
.
.
.
.
.
.
..
..
..
..
..
.
.
...
.
.
.
..
.
.
. .
.
.
.
.
...
.
.
.
.
..
.
.
.
.
..
...
.
.
. .
..
.
.
..
.
. .
..
.
.
.
...
...
.
...
..
..
...
..
.
..
.
.
.
..
..
.
..
.
.
.
.
.
.
.
.
.
.
..
.
.
.
.
.
.
.
.
.
.
.
..
.
.
.
. .
.
.
.
..
.
..
..
...
.
.
.
.
.
.
.
.
.
..
.
.
.
.
.
.
.
.
..
.
.
....
...
.. .. .
..
...
..
.
.
.
.
..
.. . .. .
..
..
....
.
..
..
....
.
.
.
.
...
.
.
.
.
.
.
.
.
..
. .
..
.
..
.
.
.. .
.
.
.
..
..
..
.
.
.
.
.
.
.
.
..
.
..
...
.
.
...
.
..
.
.
.
..
.
.
.
.
.
.
.
..
.
....
.
..
.
.
.
..
...
.
.
.
...
.
.
.
..
. .
..
....
.
... .
.
.
..
.
..
....
.
.
.
...
..
..... .
..
. .
.
.
.
....
.
.
.
.
.
..
.
.
..
..
.
. .
.
.
..
.
.
.
..
.
..
.
.
.
.
.
.
.
. ..
.
..
.
.
..
.
.
. ....
.
.
.
. .
.
..
..
..
.
.
.
.
.
..
.
.
.
.
.
.
.
.
...
..
.
.
.
.
...
....
..
.
.
.
.
.
...
..
.
.
.
...
.
..
.
.
.
...
.
.
.
.
.
.
.
.
.
.
.
..
.. ..
.
.
.
.
.. .
.
..
.
.
.
.
.
.
.
.
..
.
..
.
.
.
..
..
.
... .. ....
.
.
.
...
.
.
..
....
.
.
.
.
.
.
.
..
.
.
..
.
..
.
.
...
.
.
..
.
.
.
.
.
.
.
. .
.
.
..
. .
....
. .
.
.
.
.
.
.
.
. .
..
..
...
.
..
....
.
..
.
..
.
.
.
.
..
.
.
.
.
.
.
..
.
.
..
.
..
.
...
.
.
.
.
.
....
.
..
...
....
.
.
.
. .
.
.
.
.
.
.
.
.
.
.
.
. ..
.
.
.
.
.
.
.
.
.
..
.
...... .
....
.
.
......
.
..
.
..
.
.
.
....
.
.
......
.
...
.
....
.
.
.
.
.
.
.
.
....
.
...
.
.. ...
.
.
....
.
.
...
.
.
.
.
..
...
.
.
.
.
.
.
.
.
..
....
.
...
.
.
.
...
.
.
.
.
..
.
..
..
.
.
..
.....
.
..
.
.
.
.
...
.
.
....
.
..
...
.
..
.
.....
.
..
.
.
. .
...
.
.. .
.
.
.
.
..
...
...
.. .
.
...
. .
..
..
...
.
.
..
.
.
.
.
.
.
.
......
..
.
.....
.
...
. .
....
.
.
......
.
.
.
..
.....
..
.
..
.
..
.
.
.
.
..
.
.
.
.
.
..
.
.
..
.
.
....
. ...
.
..
.
.
....
.
.
..
..
..
.
.
..
..
..
.
.
.
...
.
.
.
...
.
.
.
..
.
.
.
.
.
.
.
.
.
.
.
.
.
..
.
..
.
.
..
..
.
.
.
.
.
.
..
..
..
.
...
.
.
.
.
.
.
.
.
..
.
.
.
..
..
..
..
..
.
....
. .
.
.
....
..
.
.
.
.
.
.. .
. .
.
.
.
.
.
..
..
.
.
.
.
.. ...
..
.
...
.
.
..
.
.
.
.
.
.
.
.
.
..
.
...
..
..
.
.
.
.
.
.
.
.
.
.
.
.
.
.
.
.
.
..
..
.....
.
.
.
.
.
.
..
.
.
.
.
.
..
..
.
.
.
....
.
.
....
..
.
...
.
.
.
..
..
..
.
.
...
...
.
.
.
...
.
.
.
.
.
.
.
..
.
.
.
.
...
.
.
.
.
.
.
...
.
.
.
..
.
.
.
..
.
.
.
.
.
.
..
..
.
.
.
.
.
.
.
..
..
.
.
.
.
.
..
.
.
.
.
.
.
.
.
.
.
..
.
.
....
.
.
.
...
.
...
......
.
...
.
.
..
.
.
.
..
..
.
.
..
.
.
...
.
.
.
.
.
.
....
.
...
.
.
..
..
.
. .
. .
. ..
.
...
.
.
......
.
.
..
.
.
.
.
.
...
.
..
.
.
.
.
..
.
..
.
.
..
...
.
. .
..
.
...
..
..
..
...
.
.
.
.
. ..
..
..
.
.
.
.
.
..
..
..
.
..
.
..
.
.
. .
.
..
...
..
...
.
.
.
.
.
.
.
.
.
..
..
..
..
.
..
.
.
.. .
.
.
..
.
.
...
..
.
..
.
.
.
.
.
.
.
.
.
.
.
.
..
.
.
.
.
.
...
.
. .
.
.
.
.
. .. .
.
.
..
...
.
.
.
.
...
.
. .
.
.
.
.
.
.
.
.
..
..
.
.
.
.
.
....
.
..
.
.
......
.
.
.
..
.
.
.
.
.
..
..
.
.
.
.
.
.
.
.
.
. ..
..
.
.
.
..
.
...
.
..
... .
.
. .
.
.
.
.
.
.
..
.
.
.
.
.
.
.
..
. ..
..
. .
.
. ..
.
.
.
..
..
.
.
.
.
.
. ..
.
. .
.
.
..
.
.
.
.
.
.
.
.
.
.
.
.
.
...
.
.
.
.
.
.
.
.
.
.
.
.
....
.
.
.
.
.
..
..
.
.
.
.
.
..
.
.
.
.
.
.
.
.
.
.
..
.
.
.
...
.
..
.
.
.
.
.
.
.
.
.
..
.
.
.
.
. .
.
..
.
.
.
.
.
.
...
.
.
..
.
..
..
.
.
.
.
.
..
.
.
..
.
..
.
..
. .
.
.
.
.. ..
.
..
..
.
.. ...
..
. ..
..
. .
.
...
.
.
.
.
.
...
......
.
.
.
.
.
.
.
..
..
..
.
.
.
..
.
.
. .
.
..
.
.
.
.
..
..
.
.
.
.
.
.
.
..
.
.
.
. ...
..
. .
.
.
.
.
.
..
.
.
.
.
..
.
.
. .
.
.
.
.
.
..
..
.
..
....
...
.
.
.
.
.
.. .
.
.... ..
..
.
.
.
..
..
.
...
.
....
.
.
. . .
...
.
.
.
....
.
.
..
.
.
.
.
.
.
.
.
.
.
.
.
.
.
.
.
.
.. ...
.
.
.
.
..
.
.
.
.
.
.
.
.
.
.
.
.
.
. ..
.
.
..
.
.
.
.
.
.
.
..
.
.
.
.
.
.
.
.
.
.
..
.
.
.
.
..
.
.
.
.
.
..
..
.
.
.
.
.... .
.
.
.
..
.
.
..
.
.
.
....
..
..
.
.
.
.
.
.
.
.
..
.
.
..
.
.
. .
.
. .
.
..
.
.
...
.
.
..
.
.
.
.
.
.
.
..
.
..
.
..
...
... .
..
..
...
. .
.
.
.
.
.... .
.
.
.
.
..
.
..
..
.
.
.
.
.
.
.
.
. .
.
.
.
.
.
...
..
.
.
..
. .....
.
...
.
..
.
.
.
.
.
.
...
.
.
..
..
...
.
..
.
.
..
.
..
..
.
.
. .
.
...
.
..
..
.
..
.
.
.
.
.
.
.
.
.
...
.
.
.
..
.
..
.
.
.
.
.
.
.
.. .
..
.. .
.
.
.
..
..
.
..
. .
.
..
.
.
.
..
.
..
.
...
.
.
.
.
.
..
..
.
.
.
......
.......
..
.
.
..
..
.
..
..
....
.
.
. .
.
. .
.
.
.
.... ....
.
.
..
.
.....
.
.
.
....
.
. ..
...
.
...
.
.
.
..
. .
..
.
...
...
.
. .. .
.
.
.
.
.. . . ...
.
. ..
..
. ...
.
...
.
.
.
.
. .
.
.
.
.
.
.
.
.
.
..
.
..
.
.
.
.
.
..
.
.
..
..
.
. ..
.
.
.
.
.
.
..
.
...
.
.
.
... .
.
..
.
.
.
. .
.
..
.
.
.
...
..
.
....
.
.
.
...
..
.
.
...
.. ..
..
..... ..
.
..
.
.
..
.. ...
....
..
.
...
.
.
.
..
..
.
.
.
..
..
.
.
.
.
.
.
.
.
.
.
.
.
.
.
.
..
.
. ..
..
..
..
.
.
.
.
.
. .
...
.
. ..
.
.
.
..
.
. . ...
. .
.
.
.
.
..
.
...
.
.
.
.
.
..
.
..
.
..
.
..
. .
.
.
. .
.
.
.
.
.
..
.
.
.
.
.
.
..
.
.
..
.
.
. ..
.
..
.
..
.
....
.
.
.
.
.
...
.
..
.
.
...
..
...
.
...
....
.
..
.
.
.
.....
......
. .
.
..
.
.
.
..
.
.
.
..
...
..
.
.
. .
...
.
.
.
...
..
.
.
.
.
.
.
. .
.
.
.
..
..
...
.
.
..
.
.
.
.
.
.
..
..
..
.
.
.
.
.
..
..
. .
.
.
.
.
.
..
..
.
..
.
.
.
.
.
.
..
.
.. .
.
.
..
.
...
.
.
.
.
.
.
..
.
..
..
.
..
. ..
.
...
.
.
..
.
.
..
.
.
.
.
.
.
.
.
.
.
.
..
.
..
.
.
.
..
.
.
...
.
.
.
..
.
.
.
.
.
.
.
.
.
.
.
.
.
.
..
.
.
.
..
....
.
..
.
.
. .
...
...
.
....
.
.
.
..
.
.
.
.
...
..
.
.
...
. ..
.
.
.
.
.
.
...
.
.
.
..
.
.
..
.
. ..
.....
.
...
. .
.
.
.
.
.
.
.
.
.
. .
.
..
.
..
.
.
.
..
.
.
.
.
.
.
.
.
..
.
.
.
.
.
..
.
.
..
.
... .
.
..
.
.
.
.
..
.... .
.
.
..
.
.
...
.
. ...
..
..
..
. ..
..
.
.
.
.
..
.
.
.
.
.
...
.
...
..
.
....
..
.
..
.
.
.. .
..
.
..
.
.
. .. .
.
..
.
....
.
.
.
..
.
..
.
....
.
.
..
.
.
.
.
.
.
.
.
.
..
.
.
.
.
..
.
.
.
.
.
.
.
.
. .
.
.
..
.
.
.
.
.
.
..
..
.
..
..
.
.
.
.
.
..
.... .
.
..
.. .
..
..
.
...
.
. .
.
..
.
.
.
.
..
...
..
..
..
..
.
..
.
..
.
.
..
...
.
..
.
..
.
..
.
.
..
.
.
.
.
.. ..
..
..
. . ..
.
.
.
.
.
.
..
.
.
..
....
.. .
.
.
.
...
..
..
.
.
.....
.
.....
.
.
.
.
..
.
. ..
...
.
..
.
.
..
.
..
.
..
.
.
....
..
.
.....
.
.
.
...
.
.
....
...
..
.
.
.
..
...
.. .. .
.
.
.
.
.
.
. .
.
.
.
.
.
.
. .
.
.
.
..
....
.
.
...
....
.
.
....
.
...
.
.
.
.
.
.
. . ..
.
.
.
......
.
.
.
....
.
.
.
.
.
.
.
..
..
..
.
.
.
.
.
.
.
.
.
.
..
.
.
.
.. ...
.
.
.
.. ..
4837 13626 33428 65246
Figure 1: Skyline plots. (a): DPort access; (b): Source IP access
used as “signatures” for source machines, so that a completely different “signature” might signal
a potentially attacked machine (i.e., a successful takeover of an internal machine would have a
different SIP pattern). This use would require the ability to somehow characterize a plot so that it
can be compared with another one; a metric that measures plot similarity or dissimilarity needs to
be defined, that would, for example, classify the first two plots in Figure 3 as “similar” (SIPs 4387
and 13781) and the last plot as distinctly different (SIP 23070). From such a metric, groups of
SIPs can be defined, and departures from group averages may signal potential attacks. In the same
way that residuals from a regression model can indicate important departures and potentially lead
to model improvement, what is needed here is the development of methods to “average” similar
plots and “subtract” an “historical” plot from an “observed” plot, so that changes in behavior can
be readily detected. The dynamic display of plots, such as those shown in Figures 1, 2, and 3,
has led Wegman and Marchette (2003) to call them “evolutionary graphical displays.” Many other
features of Internet traffic data can be collected (i.e., other information in the TCP/IP headers),
which may yield further information useful for detecting potential system attacks.
This research demonstrated the limitations of Tukey’s familiar boxplot display. The boxplot
displays the median, fourths (estimates of quartiles), and range of the data, along with “potential
outliers.” Designed to “label” roughly 0.7% of outlying observations as “potential outliers” when
9
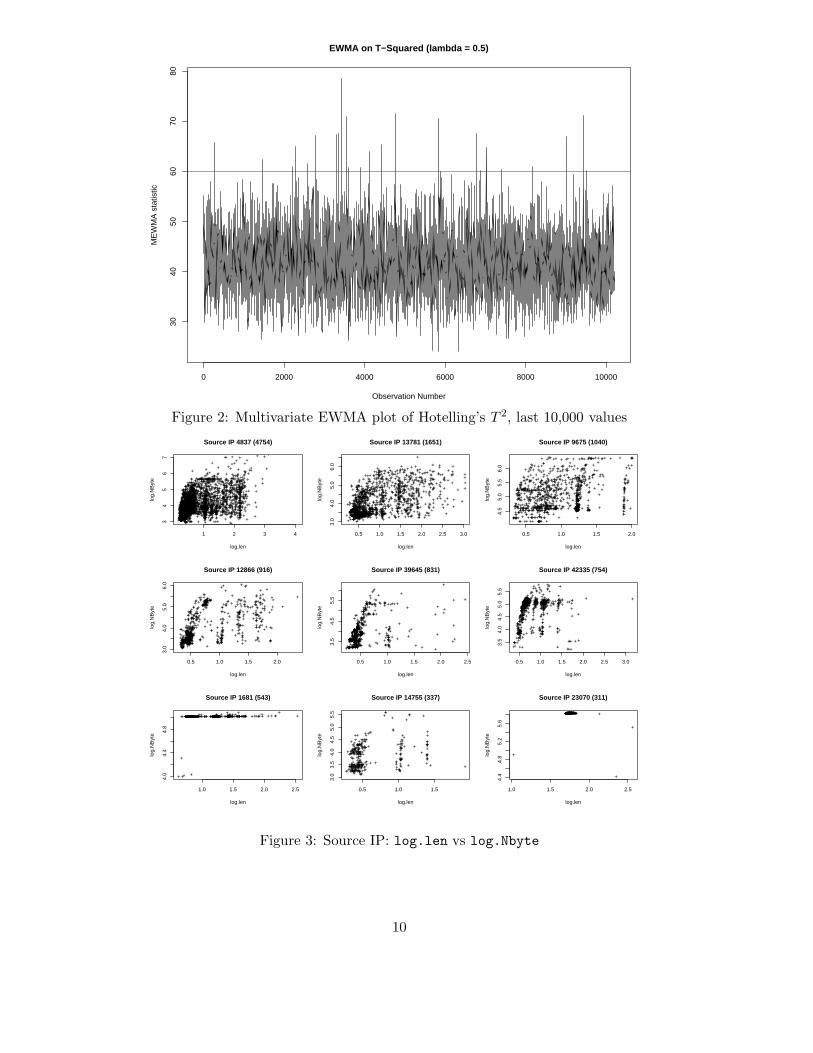
0 2000 4000 6000 8000 10000
3040
5060
7080
EWMA on T−Squared (lambda = 0.5)
Observation Number
ME
WM
A s
tatis
tic
Figure 2: Multivariate EWMA plot of Hotelling’s T 2, last 10,000 values
++++++
++
+
+++
+
++
+
++
+++
+
+++
+
+
+
++++++ +
+
+
+
+
+
+
+
+
+
+
+
+
+
++
+
+ ++++++++ +
+ ++
+++
+
+
++
+ +
++
++
++
+
++
+
+
+ +
++
+++ ++
+
+
+
++ +++
+ ++
+++
+
+++
+
+++
+
+
++
++
++
+
+
+
+
+
+
+
++
+++
+
++
++
+
++
++
+
+
+++
++
++
++
+
+++ +
+
+
+
+
+++++++++
+++
+
+ ++
+
+++ +
++
++
++
+
+ ++++++
++++
+
++
++++
+
+
+
+
+
+
+++
+
+++
+
+
+
+
++++++++
+
++ +
+
+
+
+
++
++
+
+
++
+
+++
+
+
+++
+++
+
+
+++
+
+
++
+
+
+
++
+
++++
++ +
++
+++ +++ + ++
++
+
++
+
+++
+ ++
+
++++ +
+
++
+ +++
+++
+
+
+
++++
+
++
+
+
+
+++
+
+ +
+
++
+
+++
+
+
+ +
+
++++
++
++
+
+
++ + +
++
+
+
++
+
++
+
+ +
+
++++
++
+++
++ + +
+
+++
+
+
+
+
+++++
+
+++ +++++++++++++++
+
++++++++++++++++
++
+
+ +++
+ +
++
+
++++++
++
+
+++
++
++++
++
++ +
++
++
+
+
++
++
++
+
+
+
++ +++
+
+
++
+
+
++++++++++++
+
+++++++++++
++++++
++++
+++
+
+
+
+++
+
++
+
+
+
+
++
++++++
+++++ +
+
+ ++ +
++
+
++
+
+
+++++++ ++
+ ++++++ +++ ++
++
+ +
+
++++
+
++
+
+
+
+++++
++
+
++
+
+++
+
++
++
+
+
++
++
+
++
+
+++
+
++
+
+
+++
+
+
++++
+
++
+
+++++
++++ ++
+
+
+
+++++
+
+++
+
+++++ +
+
+
+
+++++
+
+
+
+
+ ++++
+
+
+
++
+
+
++
++
++
+
+ +
+
+++
+
++
++
+++
++ +
++ ++
++++
+
+++ ++++++
+
++
++++
+
+++ +
+
+
+
+
+
++
+++ +++
++++
++
++ + +++ + ++++ +++
+
++ + +++ ++
++
+
++
+
+++ ++ ++
+
+
+ +
+ ++
++
+
+
+
+
+
++
++
+++++
+
+
+++
+
+
+ +
++
++++ +++
+
++++ +
+
+
+
+
++
+
+
++
++
+
+ ++ ++++ +
+ ++ +
++++
+
+++
++
++++
+
+++++ +++
++
++++++ + ++
+++
++++
++
+
+
+
++
++
+
++
+
+ +
+
+
+
+++
+++
++
+
+++ +
+ ++ +++
+
+
++ +++
+++++ +++
++ +++ +
+
+
+++
+
+
+
+
++++
++
+
+
+
+
+++
++
+
+++ +
+
++
++
+
++
+
+ +++
+
+
++ +++
+
+++
+
+
+
+
+++ +++
+
+
+++
+
+ ++
+
+++
++
+++
+
+++ +
+
++
+
+++
++
++
+++++ +++ ++
+
++
++
++++
+
+ ++
+
+
+
++++++
++
+
+
++
++
+
++
+++
++
++
+
++
+
++
+ +
+
++
+
+
+
+
+
++++
+
+
+
++++ +
++
+++++
++
+
+
++++
++++
+
+ ++++
+
++
+
+++
+++
+
+
+++ +
++
+
+
+
++
+
++++++++++++++ +++
+
+
+
++ +++++
++ +
+
+
++
+
+++++
+
+++
+
+
++
+ +
+
+
+ ++++++
+
++
++
++
+
++
+
+
++
+
+
+
+
++ ++
++
+
++
+ +++++++++
+++
+
++++
+++
+
++
+ +++
+
+
++ +++
+
++
+
+
++
++
++
+
++
+
+
+
+
++++
+
++
+
+
+
++
++++ +
+++
++ +++++ +
+
++
+
+
+ +
+ ++
+
++
+
+++
+
+ ++
++
++
+
+
+++ +
++
+
+
+
+++
+
+ +
++
+ +
+
+
++
++
++
+++
+++++ ++
++
++
++++
+
++ +++++
+++
++++
+
+++ +++
+
++ +
+
+
++++
++++
+ + +
+
+++ +
+
+
++
+
+
++
++
+ ++++
+
+++ +++
+
+++
+
+
++++
++ +
+++
+
++
+++
+
+
++
++
+++++++
+
++
+++
+ +
++ +
+++ +
++
++
+
++
+
+
+ ++
+
+
+
+
+
+++
+
+++
+
+
+
+
+
+++
+
+
+
+ +
++++
++ + +
+
+
+
++++
+
+
+
+
+
+
+
+
++
+
+
+
+
++ +++++ ++++++++++++
++
++ +
+
+
++++++++++++
+
+++
+
+
++
++++
+
+
+
+++ +
+
+++
+
+ +
++
+
+
+
+
++++
+
+
+
++
+
++
+
+ +
+
+++++++++
+
+++
+
++++
+
++
++
+++++
++
+
++
++++
+
+
++++
++
+
+
++
+
++
+
+
+++
+
++
+++
++
++++
+++
+
+
++
+
+
++
+
++
++
+
+++
+
+
++
++ ++
+
+
+
++++++
+++
++++
+++
++
++++
+
++
+
++
+
++
+
++
++++++
+
++
+
+++
+
+
+
++
++++
+
+
+
++
++++++++++
+
++
+
+
++
++ ++ +
+
++++
+++++
+
++++++ +
+
+
+
+
++++++
+
+++
++
+
+
+
+
+
+
++++
+
+
+ ++++++++++++++
+
++++++++++++++++++++
++
++ + +
+
+
+++ ++
++
+
+
++
+++ +
+
+
+++
+
+++++
++++
++
+
++
+
++
+++++
+ +
++
+ +
++
++
++++
+
+
+
+
++ +
+
+
++
+
+
++++
+
++
+
+
+
++
+
+
+++++
+
+++++
+++
+++++++
+
++
+
++
+++++
++
+
+++++
++
++
+
+
+++
++
+
+ +
+++
+++
+
+++
+
+ ++
+++
+
+
+ +
+
+
++
+
++
++++
+
+
++
+ +++
++
+
+ +
+
+
+
+
++
+
+
+++
+++ +++
+++++
+
+
+++++
+
++
+
+
+
+++
++++
+
+
+ +++
++ +++
++++
+
++ +
++
++++ ++
++++
+
+
+++
++
+
+
+
+
+
+++
+
+++++
+ +
+
++
+++
+
++
+
+
+
++
+
+++
+
++
+++
+
+
+
+
+++
++
++++++
+++
+
+++
+++
++
+
+ +
+
++++
++
+
+
+
++++
++
++
+
+
+
+++++
+++++
+
+
+
+
+
+++++
+
+++
++
+ +
+
++
++ ++
+
+
++
+
+
++
+
+
+
+
++++
++
++
+
++
++
++
++++
++ +
+
++++
+
++
+
++
+
+
+
+
+
+ +++++++++++++++++++++++++++
+
++ ++
+
+
++++
+++
+++++++ ++ ++ +
+
+
+
++
+
+++
+
+
+
+++++
+ +
+
+
+
++++
++
++
++ ++++
++
+
+
++
+
+
++
+
++
++
+
+
+ +
++
++
+
++ +
+++
++
+
++
+ ++
+
+
+
+
++++
+
+
++++++ ++
++
+
+++
+
+++ +
++
++++ ++++ ++
+
++
+ ++
+
++
+
+++
+
+
+
++
+
++
+
++
++
++++ ++++++++ + ++
++ ++
+
++
++++
+
+
+
+
+
++++
+
+ ++++
+
+
+
++
++++
+
+
++++
++
+
+++
+
+
+
+
+ +
++
++ +
+ ++++++ +
+
++
+
++ +
++++
++
++
++
+
+
+
++
+++
+
+
+
+
+
+
+++
+
++++ ++
+
++++
+
+
+
+
++++
++
+
+
+++
++
+
+++
+
++
++
+++
+
++
++++
+
+
+
++
+
+++
+ +
+
+
+
++
++++++++
++++++++
+
+++
++
++
+
++++++++++
+++
+
+
+
+++
++
+ +
+
+++
+
++++++
+
++
+
++++++++
+ ++
+
++++++++++
+
+
+++++
++++++++
+
+++
+
++++
++
++
+
+
+
+++++
++++
+
+
+++++
+
+
++++
+++++
+
+
+
+
++
++++
++ +
+++++++++++
+
+
+
+
+
+
+++++++
+++
+++++
+
+
++
++
+++
+
+++
+
++
+
+
+ +
+
+++++
+
+
+
+ ++
+
++
++++++
+ +
++++
+++
++ ++
++
+
++
+
+++
+
+
++
+
+++++++
+
++++ ++++++
+++ ++++++
++
+
+++++++++++++
+
+
+
+
+
+
++++++++
++
+
+ ++
+
+++
++
++++++
++
+++++++
+
++
+
+++++++
+
++
++
+
+
++
++
+
+
++++
+
+
+++
++
+
++++
+ ++
+
+
+
++++ ++++
+
++++
++++
+
++
+
+
++
+
+ ++
+
+++
++
+
+
++
+
++
+
+
++
++
+
+
+
++++
++
+
++ +++++
++
+
++
+
+
++++
+
+
+
+
+ ++
+
++
+
++
+
+++++++++++++
+
+
+++++
++
+++ ++
++
+
+
+
+
++
++
+
+
+++++
+
+ ++++++++
++++
+
++
++++++
+
+++
+
++
++++
++
++
+
+
+
+
+
+
+
+
++
++ +
+
+++
+
+++
+
+
+
+
+
+
+ ++
+
+
++
+
+++++
++
++++
++++
+++
+
+
++++
+
+++++++++
+
+
+++
+
++
++
+
+++
+
+
+
+
++
+
+++
++++
++ +
+
+++
++
++++ ++++ ++++++++
++
+
+
++
+
+
++
+
++
+++
+
++ +
++
+
+++
+
+
++
++
+
+
+
++++
++
+++++++++++
++++ +
+
+
++++
++ +
+
+
+
+
++++ +
+
++
++
+
+ +
++++
+
+
+
+++
+++
+
++
++++
++++
+
+
+
+ +
+
+
+
+
+
+
+
+
+
+++ ++
+ ++
++
+++++
+
+
+++
+
+++
+
++
+
+
++++++
++
+
+++++++++++++
+++++
+
+
+++
+
+
+++
++
++
+
++++
+
++
+
++++
+++++
++
++++++
+
+
++
+++
+++
+
++
+
+++++ +
+
++
+
+++++ ++ +
++
+
++ +
+ +
+
++++ +++++++++++++ +++++
+
+
++++
+
+
+++++++++++
+
++
+
+
+
++
+
+
+
+
++
+
+
+
+++
++
++ +++
+
+ ++++
+
++ +
+
+++++
+
+ ++
++++++++++++
++ + ++++
+
+
+
++
+
+
+
+
+
+
+
+
++++
++++++
+ +++
+++ +
++++++ +
+++
+
+
+
++
+
+
+
+
+ +
++
+
+ +++
+
++
++
+
+
++
++++
+
+
+
++ +
++
+ ++
+
+
+++ ++++++ +
+
++++
+
+
++
+
++
+
+
++
+
++
++
++
+
+
+ ++
++++
+++
+
++
+++
++
++
+
+
+
+
+
+
+
+++
+
+
+
+
++
++
+ +
++
++
+
++
+
++ + +
++
++
+
+
+
++
++
+
+
++
+++ +++ ++
+
+++
+
++ +
+
+
+ +++
++
+++
+
+
++
+
++
++
+
+
+
+
+
++
+
+
+
+
++
+
++
+
+
++
+ ++
++
++
+
+
++
+
+
+
++ ++
+
+
+
+++ ++
+
+
+
+
++++
++
+
++
+
++
+
++
+
+
+++
++
+
++++
+
+
+ ++
+
+
++++++++
+
+++
+
+
+
+
++
+
+++
+
++
++
+
++
+
++
+
+
++
+
+
++++
++
+
+
+
+
+
++
+
+++++
+
+
+
+
+ +
+++++
+
+ +
+++
++ + +
+++
++
+ +
+ +
+
++
++++++
++
+++
++++
+
++
+ +++
+
++ ++++
+
+
+++
+
++
++
+
++
+
++
+
+
+
+
+
+
+
+ +++
+
+
+
+++
+
++
+
++
+
+
++
+
+
+
+
+
++
+
++
+
+
+
+
++
++
+
+
+
++
++
+
+
++
++
+
+
+++ +
+
+++
+
++++
+
+++++++++
+
+
+++
++
++ ++++
+++ +
+
+
+++
+
+
+
+
+
+++
++
+
+
++
+
+++
++
+
+
+
+
+
+ ++
++
++
+ ++
+++
+
+
+
+
++
+
++
++
+
++
+++ +
+
+
+
+
+++
+
+
+
+
+
+
++
+++++++++++++++++
+
++++++
+++
+
+++++
++
+
++++
+
+
+
++
+++++++
++
+++++
+
+
+++
+
+++++++++++++
+
++
+ +++++++
+
+
++++
++
+
+
+
+
+
+
++++++ +
++ + +++
+
+++
++++
++
+
+++++
+
+
++
+
+
+
+
+
+++ +++ +++++++ +
+
+++
+++++
+++++ +++++++++++++++ +++++++
++ +++ +
+++
+
+
+
+++++
+
++
+
+
+
+ ++
++ ++ +++ ++ +++++++++++ ++++
+++ +++
+
+
+
+
+
++
+
++
+
+
+++
1 2 3 4
34
56
7
Source IP 4837 (4754)
log.len
log.
NB
yte
+
+
++++
+
+ +++
+++++
+
+++++++++
+
+++++++++++++++++++++++++++++++++++++ +
+
+
+++
++
++
+ + +
+
++
+
+
++
+
+
+
++ +
+
+
+
++
+
+
+
+++
+
+
+
+
+
+
++
+
++++++
+
+
+
+
+
+
+
+
+
++
++
+
+
+
++
++
+
+++
+
+
+
+++
+
++
++
++
+++++ ++
+
+
++
+
++
+
+
++
+
+
++
+
++
++
+
+ + +
+++
++ +
++
++++
+
++
+
+
+++ ++
+
+
+
+++
+
+
++
+
+
+ +
+
+
+
+
+
+
+
+
+
+
++
+
+
+
+
+
+
+
++
+
+
+
++
+
+
++
+
+
+
+
++
+
+
+
+ +
+
++
+
+
+
+
+
+
+++
+
++
++
+
+
+
++
+
+
+
++
+
+
+
+
++++
+
++
+
++
+++
+
+
+
+
++
++
+
+
++ +++
++++++++ ++ +
+
+
+
+
++
+
+++
+++
++
+
++
++
++
++
++++++ +
+
++
+++
+
+
+++
+
+
+
+
++
+
+
+
+
++
++
+
+
+
++
+
+
++
+
+
+
++ +
++
++
+++
++
++ ++
+
+
+
+
+
++
++
+
+
+
+
++
+
+
+ +
++
+
+
+
+
++++
++
+
+
+
+
++
+
++
+++
+ +
+
+ +
+ +
++
+
+
+
+
++
++
+
+
+
++
+++ +
++
+
+
+
++
+++
+ +++
+
+
+ +
+
+ ++
++
++
+
+
+
+
++++++++
+
+
++
+
+ +
+
+++
+
+
++
+ ++
+
+
+
+
+
++
+
++
+
++
+
+
++
+
+
+
++
+
+
+
+
+
+
+
+
+
+
++++
+
+++
+
+
+
+
+
++ +
+++
+
+
+
+
+
++
+
++
+
+
+
+
+
+++
+ +
++
+
+
+
+++++++
+
++
++
++ ++
+
+ +++
+
+
+
+ ++
+
+++++++++ +++
+ +
+
+
+
+
++++++++
+
++++
+++
+
++++
+
++
++ ++ ++
+
+
+
+ ++++++
+++++
+
+++
+
+
+++
+
+++
+
++
+
+
++
++
+
+
+
++
+
+
++++
+
++++
+++
++
+
++
+
++
+ +++++++ +++++
+++
+
+++
+
++
+
+++
+
+
+
+
++ +++++
+
+++ ++ +
++
+
+
+
+++++ +++
+++++++++
+++
+
++++ +++
++
+++
+
+++ ++++++
+
+++
+
++ +
+
+++++
+
+++
+
+++
+
+ +
++
+ +
+
++
+
+
+
+
+
+
+
+
+
+
++
+
+
+
++
++
+
+++++
+
++
+
+
+
++
++
++++ ++
++
+
+
+
+
+
+ ++
++
+ ++
+
+
+
+
+++
+
+++++
+
++
+++++++
++
+
++
+ +++++
+
+++
+
+++++ ++++
+
+++++++++
+
++ ++ ++++++++ +++++++++ ++
+
++++++
++++
++++ ++++++++++++
++
+++
+
+++++++
++
+
+++
+
++
+
+
+
+
+
+
++ +
+
+
++++
+
++
+
+
+
+
++
+
+
+ +
+ +++
+
++++
++++
+ + +++ ++
+++
+
+
++
+
++ ++
++++
++
+++
++
+
+ +
+
+++
+
+ +
++
+
+
+++
+
+
+
+
+
+
+
++
+
+
+
+
++
+++
+
+
++
++ +++
+
+
++
+
++
++
+
+
+
+
+
+
+
+
+ +
+
++
+
+
+
+++
+
+
+
+
++ ++
+++
+
+
+
+
+++ ++
+
+ ++
+
+++
+
+++
+
+
+
++
+
+
+++
+
+++
+
+
+
++
+
+
+
+
++
++
++
+++
+
++
++
+
++ ++
+
+
+
++
+
+
++
+
+
+
+
+
+
+
+
+
+
+
+
+
+
+
+ +++
+ +
+
+
+
++
+
+
+
+
+
+
++
+
+
++ +
++
+
+++
+++
++
++
+
+
+
+++
++
+ ++
++
++
+
+
++ +
+
++++ ++
+++
+++++++
+
+++
+
+
+
++
+
+
+
+
+
+
+
+++
+
+
+
+
+
+
+
++
+
++
+
+++++++++++++ ++++
+
+
+
++
++ +
+
+
++
+
++
+++++++++++++++++
+
++
++
++
++
++
++
+
+
++
++
+++
+
+
+
+
+
++
+
+
+
+++ ++
+
+
+
++++++++++++++++
+
+
+++
+++
+
++
+
++
++
+
+
+
+
+
+++++++++++++++++
+
+ +
+
+
+
++
+
++
+++
+++
+++++
+
++
+
+++
++
+
+
++
++
++
+
+
+++++++ ++++++++++
+
++
+
+
+++
+
+
++
+
++
+
++
+
+
+
+
+
+
++++
0.5 1.0 1.5 2.0 2.5 3.0
3.0
4.0
5.0
6.0
Source IP 13781 (1651)
log.len
log.
NB
yte
++ +
+
+
+++++ + + +
+
+ +++++++ +++++++
+
+
+
+
+
+
+
+
++++++
+
+ +++
+
++++
++
+
+ +++++++
+ +++ + +
+ ++
+++++ ++++ +
+
++++ +
+
++++++++
++
+
+ +++
+
+ +++
+
++ +++
+
++
+ ++ ++ + +
+++++ + + +
+++ + ++ +
++
+++ +
++ + ++
+++
+
++ +++ + +
+ +++ ++ + +
++
++ ++++
+ ++
++ +++ + + ++ +++ ++
++
+++++ ++++ ++++ ++ ++
++ + ++
+
+++
+
++
+
+
+
++++
++
+
+
+++
+
+
+
++++
+
+
+
+
+ +++
+
+
++++++
+
+
++
++++++
+
++
++
+
+
+
+
+
+
+++
+
+
+
+
+
+
+
++
++
+
+++
+
+
+
+
+
+
+ ++++
+
+++++
++
+
+
+
+
+
+ +++ + +
+
++
++
+
+
+
++++
++
+
+++
+
+
+
+
++
+
+
+
+
+
+
++
+
+++
++
+
+
+
+
+
+
+
+
+
++
++++ + ++ +++
+
+++
+ +++ +
+
+
+
+
+
++++ ++++
++
+
+
+
+
+
+
++++++++
+
+
+
+
++
+ ++ + +
+++
+
+
+ + ++ + +
+++
++
++
+
+ +++
+
+
+
++
++
+
+
+
+++
+++
+
+
+
+
+
+++
++
+++ +++ + + +
+++ +
+++++ + + +
++ + +
++++ + +++ +
++++
++ +
+ + ++ + ++ ++
+++
++ +++ + + +
++ +++
+ ++ ++
++ + +
+ +++
++
+++++
++
+
++++
+
+ +++++++++
+
++
+
+
+
+++++++
+
+++
+
++
+
+++
+++ ++++++++++
+
+++++
+ ++ ++ +
+ + +++
+
+ + ++ + ++ +++ ++++
+
++++ +++ +++ +
++++ ++++++
+
++
+ +++
+
+++
++++
+++
++ + ++ + + + +
+ ++++ + + +
++
++
++++ +++ + + ++ + ++
++
+ + ++ + + +
++ +
+++
++
++ + ++++ + +
++++ +++ + + +
++ ++ ++ ++ + ++ ++ ++ ++ ++ + ++ +++
+++ ++
+++ +++
+++ +
+++++ + +
+
++++
+
++++++++++
+
+ ++++++++++
+
+
+
++++++
+
++++++++++++
+
++
+
++++
+
++++
+ +++ +
+ ++ + + +
++
+++++++
+
+++++ ++++++++++++++
+
+
+
+++++++
++++
+
+ + ++++
++
+ ++ + ++++ + + +
++ ++
+ + ++ + + + +
+ ++ + +
++
+ + ++
+
+++
++
+ + ++ + +
+ ++++ ++ + ++++
+++ +
++
+ ++ +
+++ + + +
++ ++
++ ++ +
++
++ + +
+++
+
0.5 1.0 1.5 2.0
4.5
5.0
5.5
6.0
Source IP 9675 (1040)
log.len
log.
NB
yte
+ + ++
+
+ +
+
++
+
+
+
+
+
++
+
+
+
+
++ +
+
+
+
+
++
++
+
+
++
++
+++++
+
++++++
+
+
+++ +++
++
+ ++
++++++
+
+++++
+
+
+
+
+
+
+++
+
+++ +
+
++
++
+ ++
+
+
++++++++++
+++
+
+++
+
+++ +
+
++
+
+
+
++
+ ++
+
+
+
+
+
+
+++
++
+++++++
++++
+
+++++
+
+++++
+
++
+
+ +++
+
+
+
++++
+
++++++++
++
+++
+
++++
+
++
+
+
+
++++
++
++
++
++
+
++
++
++
++ +
+
+
+
+
+++
+
++ ++++ +++++++ +
+++
++
+
+
+
+
+
+
+
++
+
+
+
+
+
+
+
++
++
+
+
+
+
+
+
+
+
++++
++
+
++
+
+++
++++++++++++++++
+
+
+
+
+
+
++
+
+
+
+
+++
+
++
++
+
++
+
++
+
+++
+
+
+
++
++
+
+
++++
++
+
++
+
+
++
+
+
+
+
++
++
+
+
+
++
+
++
+
++
+
++
+
+
+
+
++
++
+
+
++
+
+
+ ++
++
+
+
+
+
+
+
++
+
+
+
+
+
++
++++
+
+
+
+
++
++++
+
+
+
+
++
+
+
++++
+
+
++
+
+
+
+
+
+
+
+++
+
+
++
+
+
+
+
++
+++
+
++
+
+
+
+
+
+
+
+
+
+
+
+
++
+
++
++
+
+
++
+
+
++
+
+
+
+
++
++
+
+
++
++++
+
+
++
+
+
++
+
+ +
++
+
+
+
+
+ +
+
+
++
+
+
+
+
+
++
++++++++
++
+
+
+
+
+++
+
+
+
+
+
+
+
++ +
+
+
+
+++
+
+
+
+
+
++
+
++
+
++
+
+
+
+
++
++
+++
+ +
+
+
+
+
++++
++
+
++++++ +
+++
+
+++ +
+
+++ ++++
+
+++++++
+
++
+
+++
+
+
+
++++
+
++ +++++++ ++++++++++ + +++
+
+++++
+
++
++
+
+
+
+ ++
++
+
++
+
+
+
+++++
+
++
+
+
+
+
++++
+
++++++++
++
+
+++
+++
+
+
++++
+
+++
+ +
+++
+
+ + +
++
++
+
++
+
+
+++
++
+
+
++
+
+
+++
+
+++++
+
++++++
+++++++++
+
+
++
++
++++++
+++++
+
+
+
+
+
+++++++++++++++++++++++ +++++++++++
+
+
+
+
+
++++
+
+
+
+
+++++
+
+++
+
+
++
+
+++
+
++ ++
+
++++
+
++
+
+
+++
0.5 1.0 1.5 2.0
3.0
4.0
5.0
6.0
Source IP 12866 (916)
log.len
log.
NB
yte
+
+
++
+
+
+++
+++
+
+
+
+++
++++
+++++
+
++
+
+
++
++++
+
+
++
++++
+
+
++
++ +++++++++++
+
++
+
+
+
++
+++
+
+
+
++
++
+++++++
+
+
+++ ++
+
+
+++ +++++
+++
+ +++
+++
+
+
++
++++++
++++++
+
+++++ +++++++ +++ +
++++
+
+++
+
++
+
++
+ +
++
+++
+
+++
++++++ +
+
+
+
++++++++ +++
++ +
+
+
++
+++
++++
++
++++++
+
++++ ++++ ++++ +++
+
++
+++ ++
++
+
+
+ ++
+++++
+++++
+
++
+
+
+++++ ++
+
+
+
+
++
+
+
+
+
+
+
+
+
+
++
+
+
+
+
+
+
+
+
+
++
+
+ +
+
+
+
+
+
+
++ + +
+
+
+++
+
+
++ ++
+
++ ++++
+++++++
++++++++
+
++++
+
++ ++
+
+
+
++++
+++ +
+
+
+++
+
+
++
+
++
+++
+
++++++
++++++++
+++++
+
+
+
+
+
++
+ +++
+
+++++++
++ +
++++
++
+
+
+
+
++++
++
+++
+
+++++++
+
++
+
+++
++ +
+
++
+
+
++
+
+++ ++
+
+
+
+
++
++
+
+
+
+
+
+
+
+
+++
++
+++
++++++++++++
++++
+
+
+
+ ++
+
+
+
+
+
+++
+
+
+
+
+
+++
++ +
++
++
++
+
++
++
++
+
+
+
+
+++
+
++
++
+++
+
++++++++++++
++
+
++
+
+ ++
+
+
+
++
+
+ +++
+
+
+++++
+
++++
+
+++++++
++++
++++
+++
+
+
+
+ +++
+++
+
+
+
+
+
+
+
+
+
+
+
++++
++
+
+
+
+ ++
+
+
+
+
+
++++++++
+
++
+
+
+
+
++
+
+
+
+
++
++
+
++++
+
++
+
+ +
+
++ +
+
+
++++
+
++
++ +
+
++
++
++
++
+
++
++++
+
++
+
+
+
+
+++++++++++ ++ ++++++++++++
+
+
+
+++ +
+
+++
++ +++++
+
+
+
++ +++
++
+
+
++
+++
++
++
+++ +
++
+
+ ++ ++
+
++++
+
++
+
+
++
+++
0.5 1.0 1.5 2.0 2.5
3.5
4.5
5.5
Source IP 39645 (831)
log.len
log.
NB
yte
+
+
++++++
+
+
++
+
+
+
+
+
+
+
+
+
+
+
+
+++
+
+
++
+
+
+
+ +
+ +
++
+
+
+++
+
+
+ +++
+
+
++
+
+
+
+
++
+++
+
++
+++
++
+++
+
+
++
+
+++
+
+
++
+
++
++++
++
+
+
+
++++
+
+
+
+
+
+
++
+
+ +
+
+
+
++
++
++ + +++
++
+
+
+
+ +
+ +
++
+
+
++++
+
+ +
+
+ +
++++
+
+
+
+
++
++
+ +++
+++ +++ ++ ++ + ++ +++ +++
++ +++ ++++ +++++ +++ +++ ++
+
+
+
+
++
+++++++ ++
++ ++ ++ + ++ ++
+++
+++
+ ++
++
++ ++ ++++
+
+
++++++ ++
+
++
+++
+ ++ ++++ ++++ +++++ ++++ ++ + +++
+++++++
++++ +++
++ +++
+++ ++++++ ++ ++++++ ++ ++++
+ + ++ ++++ ++
+++++ +++
+++ +
+
+
+
+
++ ++
+++ + ++++ ++
+++
++ ++++ +
+
++++
+ ++
++
++ +++
+++++ ++
+
++ ++++++
++ ++++ ++++
+++
++++++++ ++ +
+++
++++
+
+
+
+ + + ++++ +++ ++++++
+ ++
+ ++
+
++
+
+ ++ +++ +++
+
+
+
+
+
+
+
+
+
+
+
+
+
+
+
+
+
+
+
+
+
+
+
+
+
+
+
+
+
++
++
++
+ ++ ++++ ++ +++
+
++
+ +++
+
+
++ ++ ++ ++++++
++
++
++ +++++ ++ +++++++ +
+
++
+ +++
+
++ +++
++ +++ +++ ++ ++++
+
+
+
++
+
+
+ ++
+
++
++ ++ ++
+
++
+ ++
+
+ +
++ +
+
+
+
++++
+
+
+
+
+
+
+
+
+
++
+
+
++ ++ ++
+
+
+
+
+
+
+
++
+ +
+
+++
++++
+
+ +
+
+++++ +
+
++
++
+
++
++
+
+
++++
++
+
+
+
+ +
++
+
+
+
++
+
++++
+ +
+ ++
+++++
++++
++ ++ ++
++
++++
++
+
+
+
0.5 1.0 1.5 2.0 2.5 3.0
3.5
4.0
4.5
5.0
5.5
Source IP 42335 (754)
log.len
log.
NB
yte
+++++++ +++++++++++++ +++++++++ ++++ ++ ++++++++ + ++++++++++ ++++++++++++ ++ +++ ++++ ++ +++++++++++ +++ +++ ++++++ +++++ ++++ +++ +++ +++++ +++ ++++ +++++ + ++
++ +++ + ++++ ++++ +++
+
++ + ++ + +++ ++++ ++ +++ ++ ++ + +++ +++ ++++++ + +++ ++ ++ + ++ ++++ ++ ++ ++ +++++++++ ++++++ +++ ++++ +++++++++ + + +++ + +++ ++ +++ ++++ +++++ ++++ +++ +++++ +++ +++ +++ ++ +++ ++
+
++ ++ ++ + +++ +++ + +++ ++ + +++ +++++ ++ +++ +++ ++++ +++ +
+
+ ++++++ ++ +++ ++ ++ +++ ++ ++ + ++ +++ +++++ ++ +++ + ++ + +++ ++++++ ++ + ++++ ++++ + +++++ ++ +++ ++ ++++ ++++++ + +++++ ++ +++++ ++ ++++ ++ ++ + +++ ++ ++ +++++ ++ ++ ++ +++++++ +++ ++ ++ + ++++ ++ ++++ +++ +
+
+++++ ++ +++ ++ +++ + ++ +++++ +++ ++++++ ++ + ++++++++ ++
++
+
1.0 1.5 2.0 2.5
4.0
4.4
4.8
Source IP 1681 (543)
log.len
log.
NB
yte
++
++
+
+
+
+ +
+
++
+++++
+
+
++
++
+
+++
+++
+
+
+++
+
++
+++
+
++
+
++
++
++ +
++
+
++
+++
+++++
+
+
++
+
++
+
+
+
++
+
+
+
+
++ ++
++
+
++++
+
+
++
++
+
++
++++
+
+
+
+
++
+++
+
+
+
+
++
+
++
+
++
++
+
+
++
+
+
+
+
++++
++
++
++++
++
+++
++
++
++
+
+
++
+
++
+
+ ++
+
+
+
+
+
+
+
++
+
+
++++++
++
+
+
+
+
+
+
+++
+
+
+
+ +
++ +
++
+++
+++
+
+
+
+
++ +
++
+
+
+
+
++
+
++
+
++++
+
+
+
++
+
+
+++++ +
++
++
+++++
+
+
+
+
+
++
+++ +
++
++++
+
+++
+++
+
+
++
+
+
+
++ ++
+
+
++
+++ +
+
++
+
+
+
+
++
+
+
+
+
+
+
++
+
+
++
+
+
+
+
+
+
+++
+
+
0.5 1.0 1.5
3.0
3.5
4.0
4.5
5.0
5.5
Source IP 14755 (337)
log.len
log.
NB
yte
+
++++++++++++
+
+
+++++++++++++++++++++++ +++++++++++++++++++++++++++++++++++++++++++ ++++++++ +++++++++++++++++++++++++++++ +++ ++++++++++++++++++++++++++++++++++++++++++++++++ ++++++++++ ++++++++++++++++ ++++++ ++++++++++++++++++++++++++++++++ ++ ++++++++++++++++++++++++++++++++++++++ ++++++++++ ++++++++++++++++++++++++++++
1.0 1.5 2.0 2.5
4.4
4.8
5.2
5.6
Source IP 23070 (311)
log.len
log.
NB
yte
Figure 3: Source IP: log.len vs log.Nbyte
10
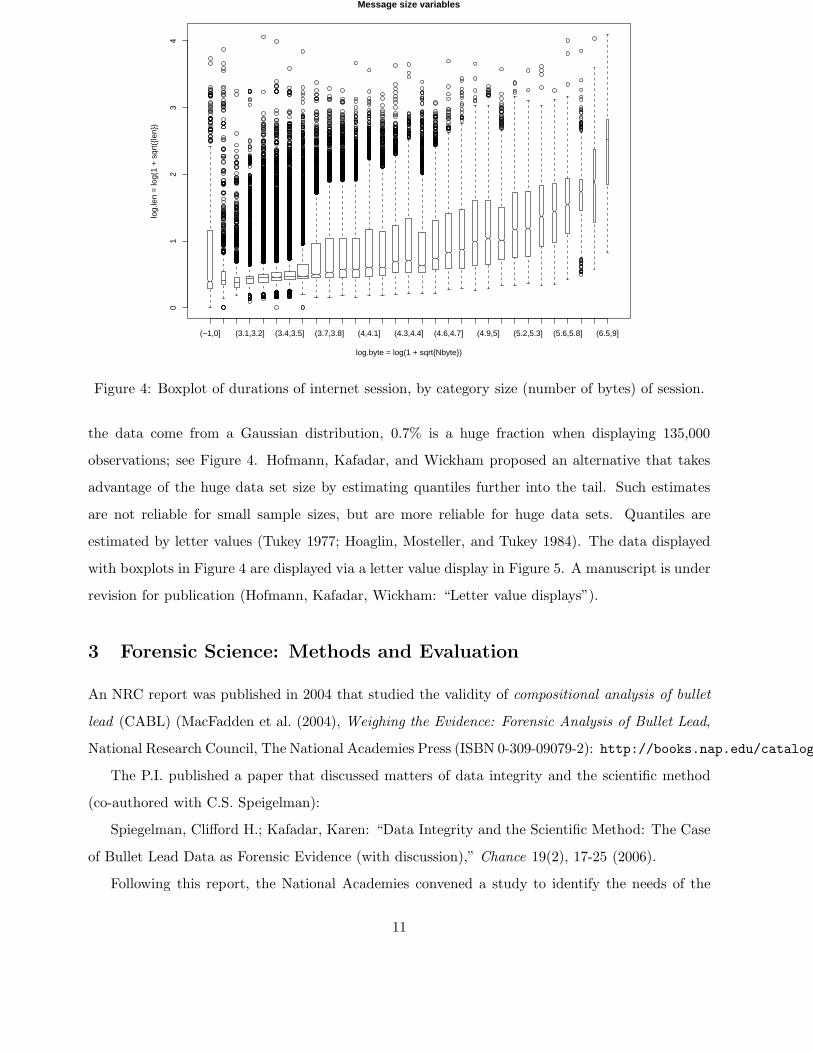
(−1,0] (3.1,3.2] (3.4,3.5] (3.7,3.8] (4,4.1] (4.3,4.4] (4.6,4.7] (4.9,5] (5.2,5.3] (5.6,5.8] (6.5,9]
01
23
4
Message size variables
log.byte = log(1 + sqrt{Nbyte})
log.
len
= lo
g(1
+ s
qrt(
{len}
)
Figure 4: Boxplot of durations of internet session, by category size (number of bytes) of session.
the data come from a Gaussian distribution, 0.7% is a huge fraction when displaying 135,000
observations; see Figure 4. Hofmann, Kafadar, and Wickham proposed an alternative that takes
advantage of the huge data set size by estimating quantiles further into the tail. Such estimates
are not reliable for small sample sizes, but are more reliable for huge data sets. Quantiles are
estimated by letter values (Tukey 1977; Hoaglin, Mosteller, and Tukey 1984). The data displayed
with boxplots in Figure 4 are displayed via a letter value display in Figure 5. A manuscript is under
revision for publication (Hofmann, Kafadar, Wickham: “Letter value displays”).
3 Forensic Science: Methods and Evaluation
An NRC report was published in 2004 that studied the validity of compositional analysis of bullet
lead (CABL) (MacFadden et al. (2004), Weighing the Evidence: Forensic Analysis of Bullet Lead,
National Research Council, The National Academies Press (ISBN 0-309-09079-2): http://books.nap.edu/catalog/10
The P.I. published a paper that discussed matters of data integrity and the scientific method
(co-authored with C.S. Speigelman):
Spiegelman, Clifford H.; Kafadar, Karen: “Data Integrity and the Scientific Method: The Case
of Bullet Lead Data as Forensic Evidence (with discussion),” Chance 19(2), 17-25 (2006).
Following this report, the National Academies convened a study to identify the needs of the
11
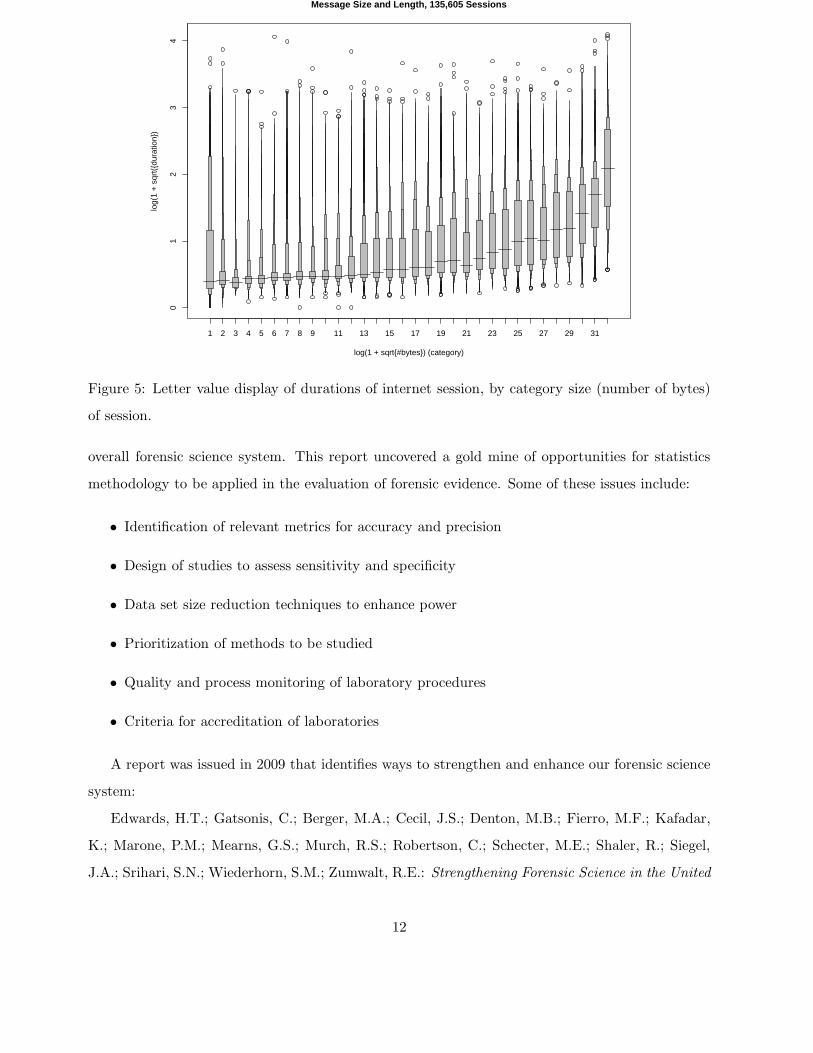
1 2 3 4 5 6 7 8 9 11 13 15 17 19 21 23 25 27 29 31
01
23
4
Message Size and Length, 135,605 Sessions
log(1 + sqrt{#bytes}) (category)
log(
1 +
sqr
t({d
urat
ion}
)
Figure 5: Letter value display of durations of internet session, by category size (number of bytes)
of session.
overall forensic science system. This report uncovered a gold mine of opportunities for statistics
methodology to be applied in the evaluation of forensic evidence. Some of these issues include:
• Identification of relevant metrics for accuracy and precision
• Design of studies to assess sensitivity and specificity
• Data set size reduction techniques to enhance power
• Prioritization of methods to be studied
• Quality and process monitoring of laboratory procedures
• Criteria for accreditation of laboratories
A report was issued in 2009 that identifies ways to strengthen and enhance our forensic science
system:
Edwards, H.T.; Gatsonis, C.; Berger, M.A.; Cecil, J.S.; Denton, M.B.; Fierro, M.F.; Kafadar,
K.; Marone, P.M.; Mearns, G.S.; Murch, R.S.; Robertson, C.; Schecter, M.E.; Shaler, R.; Siegel,
J.A.; Srihari, S.N.; Wiederhorn, S.M.; Zumwalt, R.E.: Strengthening Forensic Science in the United
12
States: A Path Forward, National Research Council, The National Academies Press (ISBN-10: 0-
309-13127-8; ISBN-13: 978-0-309-13127-8), 2009.
(http://books.nap.edu/catalog.php?record_id=12589)
4 High-energy physics
Experimental physicists study the properties, behavior, and rates of reactions among fundamental
particles (e.g., leptons such as tau particles, muons, electrons, neutrinos) via experiments designed
to accelerate the rate at which reactions occur. Experiments are conducted by accelerating beams
of particles through a medium (e.g., electrons through a two-mile tunnel, as at the Stanford Linear
Accelerator Center, or through a cyclotron, as at Lawrence Berkeley Laboratory). At the end
of the acceleration process is a detector consisting of hundreds of thousands of wires arranged so
that each wire will record a voltage if it detects energy (presumably from a particle). Most of
these particles fly past one another; experiments are designed to maximize particle collisions and
interactions (usually via colliding beams of particles aimed at each other). These collisions are called
“events” which are recorded by the data acquisition system, consisting of dozens of computers that
record each instance of a “trigger,” or particle that is detected by registering a current in one or
more of the wires in the detector. Following the data acquisition stage is the event reconstruction
stage, during which hundreds of computer programs aim to reconstruct, as accurately as possible,
the momentum, energy, and mass of detected particles at the time of the “trigger” as well as a
“nomination” for the type of particle observed and which particles likely came from the same event.
Experimental physicists interested in specific particle decay mechanisms. For example, if interest
lies in the decay mechanism of the J/ψ particle, they will select events that appear to be consistent
with current knowledge of this mechanism; if the event includes a particle with a mass that exceeds
that of the commonly accepted value of the J/ψ particle, this event would be deemed inconsistent
and the data would be excluded from this particular investigation. The goal is to abstract, from
the massive data base of events, as many apparent instances of the specific event, which are then
used to estimate parameters in a model of its decay process.
Due to the enormous volumes of data that are generated each minute from these events, most
of the data are simply ignored. Data are usually selected by censoring rules, called ”cuts.” Some
13
cuts are obvious (e.g., an event whose particles’ masses exceed that of the specific particle whose
decay reaction is being studied). Other cuts involve the inherent error in the measurement system.
For example, if the reaction is known to involve six particles, and the recorded “event” includes
nine particles, the experimental physicist is likely to dismiss that event. But if it includes five or
seven particles, this event might be retained, on the belief that one of the particles decayed before
it could be detected by a wire in the detector, or a particle from a different event was mistakenly
included. The “cut” on the number of particles would be 5–7; similar bounds are noted on the
other data values that are recorded with each event (e.g., total energy, estimated mass, momentum
in the x-, y-, and z-directions for each particle) Each data value is subject to measurement error,
including a “nomination” for the type of particle observed based on the its momentum, energy,
and mass. A computer applies all of the proposed “cuts” on the variables and returns a file of
perhaps only 1000–10,000 events whose particles satisfy the specified constraints. But because the
studied reaction is likely to be extremely rare (e.g., estimated frequency of about once a week), this
much reduced data includes mostly irrelevant events, called “background” events, from which the
“signal” (i.e., data on the relevant events) must be extracted and fitted to the proposed model. (In
practice, usually all of the data are fit, and some adjustments are made to “subtract” the effects
from the “background” data.)
Historically, experimental physicists have concentrated on the issues of “efficiency” (proportion
of events that are truly “signal”) and goodness-of-fit measures of the fitted data to the theoretical
predictions. Statistical issues include appropriate applications of time series (events may be cor-
related in time), robust methods (estimating parameters in the presence of contamination), and
Bayesian methods (considerable prior information is available). Before that stage, however, are
the stages of data acquisition and the methods of “cuts”. Presently, experiments are conducted on
two-year-old data, due to the time lag between the experiment and the compilation and “censor-
ing” of the data that generated it. It is also believed that thousands of events are censored by the
“cuts” and many more thousands are never even considered (dismissed at the first stage as being
“uninteresting”). A huge issue is in summarizing the data from experiment in a reliable fashion so
that those who might benefit from it can make decisions about its suitability.
Before being able to work on data from particle physics experiments, the P.I. needed to acquire
an adequate knowledge of the underlying scientific principles of particle physics theory. To do this,
14
the P.I. spent nine months in Berkeley with Professor Robert Jacobsen (Department of Physics
and Lawrence Berkeley Laboratory). A working paper is under revision for publication in an
applied statistics journal (Kafadar, K.; Jacobsen, R.: Statistical analysis of particle physics data,
in preparation). The paper provides methods for identifying target events from a massive database
of events.
5 Genomics: “Big p, small n”
Studies in genomics involve thousands covariates (gene expressions) on usually only tens or hundreds
of observations (DNA samples). The goal of most of these studies is to identify those genes that
are expressed in response to a treatment, stimulus, or condition (e.g. diabetes or cancer). This
problem involves research into methods for dimension reduction (identifying only the influential
covariates) as well as methods for analysis of gene expression data, modeling PCR, and classifying
peptides.
Dimension reduction: Penalized Regression Estimators
The problem of accurate and precise estimates of covariance matrices among large numbers of
variables leads to the need for dimension reduction methods. Historically, the method of principal
components has provided a reduced set of orthogonal variables that are linear combinations of the
original variables. These principal components are useful but often not insightful. Alternative
methods include modifying the coefficients to “meaningful” values, or penalized regression estima-
tors as a way of shrinking (to zero) the coefficients for potentially insignificant variables. We take
the latter approach in this research. This work involved collaborations with Guilherme V. Rocha,
and early efforts have been presented at two recent conferences:
• Effect of influential observations on penalized regression estimators, International Conference
on Robust Statistics, Prague, 29 Jun 2010.
• Invited presentation, Statistical issues in comparing multidimensional profiles, International
Symposium on Business and Industrial Statistics, Portoroz Slovenia, 8 Jul 2010.
This research demonstrates that ordinary penalized regression estimators, such as ridge re-
gression (L2 loss function: minimize the sum of squared residuals; L2 penalty function on the
15
coefficients: sum of the squared coefficients constrained to be less than a pre-selected limit), or
Lasso (Tibshirani 1996: L2 loss function; L1 penalty function), can be influenced by outliers. A
good compromise that pays less attention to outliers, but performs well with both Gaussian and
long-tailed (Cauchy) data, combines the use of Lasso’s L1 penalty function with an L1 loss function.
A paper is being prepared that presents the results of this current research, which is on-going.
Analyzing gene expression data: The Square Combining Table
Godfrey (1986) presents a method for obtaining an additive fit to a two-way table called the
square combining table. Originally it was proposed as an alternative to median polish (Tukey
1977; Mosteller and Tukey 1977; Hoaglin, Mosteller, and Tukey 1984). Though not as resistant as
median polish (which has breakdown equal to one-half of the minimum dimension of the table), it
is nonetheless more resistant than ordinary fitting by means (as in classical analysis of variance),
can tolerate as much as 20% outliers, and can handle missing data. The method involves taking
differences of pairs of columns and pairs of rows, and analyzes the paired-comparisons data. In fact,
gene expression data arise as paired comparisons, so the square combining table is a natural approach
to analyzing such data. This research is being applied to a designed gene experiment currently
underway at Indiana University (Andrews lab) and involves G.V. Rocha and R.T. Gutman.
Mathematical formulation of PCR
Gene expression measurements depend on amplification of DNA through a process known as
the polymerase chain reaction (PCR). A mathematical model of PCR was developed and validated
by experiments in two articles. A third article used PCR data to compare mouse strains. Machine
learning methods combined with statistical methods were developed for the classification of peptides
in the article by Gehrke et al. (2008).
• Saha, Nilanjan; Watson, Layne T.; Kafadar, Karen; Onufriev, Alexey; Ramakrishnan, Naren;
Vasquez-Robinet, Cecilia; Watkinson, Jonathan: “A General Probabilistic Model of the PCR
Process,” Applied Mathematics and Computation 182(1), 232–243 (2006).
• Saha, Nilanjan; Watson, Layne T.; Kafadar, Karen; Ramakrishnan, Naren; Onufriev, Alexey;
Rao Mane, Shrinivas; Vasquez-Robinet, Cecilia: “Validation and Estimation of Parameters
for a General Probabilistic Model of the PCR Process,” Journal of Computational Biology
14(1): 97-112 (2007).
16
• Du, Yunzhi; Davisson, Muriel T.; Kafadar, Karen; Gardiner, Katheleen: “A-to-I pre-mRNA
editing of the serotonin 2C receptor: Comparisons among inbred mouse strains,” Gene 382:
39–46 (1 Nov 2006).
• Gehrke, Allison; Sun, Shaojun; Kurgan, Lukasz A.; Ahn, Natalie G.; “Improved machine
learning methods for analysis of gas phase chemistry of peptides,” Bioinformatics 9:515;
doi:10.1186/1471-2105-9-515, 2008.
6 Additional research: Length Biased Sampling and Library Search
Length biased sampling
Data that are collected from any type of measurement system may be subjected to various types
of bias, such as selection bias, observation bias, etc. Some of these biases were discussed in the P.I.’s
co-authored report of NASA’s National Aviation Operations Monitoring Service (Nair et al. 2009).
An important, and often overlooked, bias arises when the size of the data value itself increases the
probability of the observation. This situation is known as length-biased sampling. It arises when
larger particles are more likely to be observed than smaller ones, or when longer durations are more
likely to be caught by the measurement process than shorter ones. In randomized cancer screening
trials, slower-growing disease that has a long pre-clinical duration is more likely to be captured by
a screening modality (e.g., mammography or PSA) than disease with short pre-clinical duration.
Length biased sampling influences the evaluation of screening: long pre-clinical duration is often
positively correlated with long clinical duration, and hence screen-detected cases will appear to live
longer (longer clinical durations) than non-screen-detected cases, even after having accounted for
lead time bias.
The effect of length biased sampling on the assessment of benefit (survival time) in randomized
cancer screening trials was studied in Kafadar and Prorok (2009):
Kafadar, K.; Prorok, P.C.: “Effect of length-biased sampled sojourn times on the survival
distribution in randomized cancer screening trials,” Statistics in Medicine 28:2116-2146, 2009.
In situations where pre-clinical and clinical durations are highly correlated, the effect can be
as large as 20-30%; i.e., if the “apparent” benefit of screening is extended survival by one year,
20-30% of that benefit is due simply to the length-biased sampling. This research has consequences
17
for many studies where the probability of observing the data depends on its size (length, volume,
etc.) and can influence inferences when data on smaller sizes are ignored (e.g., less frequent but
highly influential events).
Library Search
Length-biased sampling also arises in connection with the retrieval of library records, resulting
in missed references in common search engines. These issues were explored through designed studies
in library research:
• Beall, Jeffrey; Kafadar, K.: The effectiveness of copy cataloging at eliminating typographical
errors in shared bibliographic records, Library Resources & Technical Services 48(2): 92–101
(April 2004).
• Beall, Jeffrey; Kafadar, Karen: The Proportion of NUC Pre-56 Titles Represented in OCLC
WorldCat, College & Research Libraries 66(5): 431–435 (2005).
• Beall, Jeffrey; Kafadar, Karen: Measuring Typographical Errors’ Impact on Retrieval in
Bibliographic Databases (invited), Cataloging & Classification Quarterly 44(3/4): 197–211
(2007).
• Beall, Jeffrey; Kafadar, Karen: Measuring the Extent of the Synonym Problem in Full-text
Searching, Evidence Based Library and Information Practice 2008 3(4), 18–33.
7 Impact
The impact of this research has been the development of methods for analysis and display of
massive data. A series of issues were studied: graphical methods (letter value plots), dimension
reduction, evaluation of forensic science methods, analysis of gene expression data, and effects
of length biased sampling. Correct inferences from data depend critically on approriate methods
for analysis. As a result of this research, better methods for analyzing massive data have been
developed and demonsrated on data from diverse contexts, including genomics, imaging, forensics,
text search, internet communications, medical screening trials, and high-energy particle physics.
All have important implications in the understanding of data related to national security.
The research from this grant has been posted at http://mypage.iu.edu/ kkafadar.
18
8 References
Beall, Jeffrey; Kafadar, K.: The effectiveness of copy cataloging at eliminating typographical errors
in shared bibliographic records, Library Resources & Technical Services 48(2): 92–101 (April 2004).
Beall, Jeffrey; Kafadar, Karen: The Proportion of NUC Pre-56 Titles Represented in OCLC World-
Cat, College & Research Libraries 66(5): 431–435 (2005).
Beall, Jeffrey; Kafadar, Karen: Measuring Typographical Errors’ Impact on Retrieval in Biblio-
graphic Databases (invited), Cataloging & Classification Quarterly 44(3/4): 197–211 (2007).
Beall, Jeffrey; Kafadar, Karen: Measuring the Extent of the Synonym Problem in Full-text Search-
ing, Evidence Based Library and Information Practice 2008 3(4), 18–33.
Du, Yunzhi; Davisson, Muriel T.; Kafadar, Karen; Gardiner, Katheleen: “A-to-I pre-mRNA editing
of the serotonin 2C receptor: Comparisons among inbred mouse strains,” Gene 382: 39–46 (1 Nov
2006).
Edwards, H.T.; Gatsonis, C.; Berger, M.A.; Cecil, J.S.; Denton, M.B.; Fierro, M.F.; Kafadar, K.;
Marone, P.M.; Mearns, G.S.; Murch, R.S.; Robertson, C.; Schecter, M.E.; Shaler, R.; Siegel, J.A.;
Srihari, S.N.; Wiederhorn, S.M.; Zumwalt, R.E.: Strengthening Forensic Science in the United
States: A Path Forward, National Research Council, The National Academies Press (ISBN-10:
0-309-13127-8; ISBN-13: 978-0-309-13127-8), 2009.
Godfrey, K. (1986), Fitting by organized comparisons: The square combining table. Chapter 2 in
Exploring Data Tables, Trends, and Shapes (ed. D.C. Hoaglin, F. Mosteller, J.W. Tukey), 37–66.
Gehrke, Allison; Sun, Shaojun; Kurgan, Lukasz A.; Ahn, Natalie G.; “Improved machine learning
methods for analysis of gas phase chemistry of peptides,” Bioinformatics 9:515; doi:10.1186/1471-
2105-9-515, 2008.
Hoaglin, D.C.; Mosteller, F.; Tukey, J.W. (1984), Understanding Robust and Exploratory Data
Analysis, Wiley, New York.
Hoaglin, D.C.; Mosteller, F.; Tukey, J.W. (1986), Exploring Data Table, Trends, and Shapes, Wiley,
New York.
Hofmann, H.; Kafadar, K.; Wickham, H. (2009), Letter value boxplots, in preparation.
19

Kafadar, K.; Jacobsen, R. (2009), Statistical analysis of particle physics data, in preparation.
Kafadar, K.; Prorok, P.C. (2009), Effect of length-biased sampled sojourn times on the survival
distribution in randomized cancer screening trials, Statistics in Medicine 28:2116-2146, 2009.
MacFadden, K.O.; Castleman, A.W.; De Forest, P.R.; Denton, M.B.; Evans, C.A.; Finkelstein,
M.O.; Giannelli, P.C.; Greenberg, R.R..; Holcombe, J.A.; Kafadar, K.; McMahon, C.J.; Prescott,
S.R.; Spiegelman, C.; Voorhees, R.S.: Forensic Analysis: Weighing Bullet Lead Evidence, National
Research Council, The National Academies Press (ISBN-10: 0-309-09079-2: ISBN-13: 978-0-309-
09079-7), 2004.
Mosteller, F.; Tukey, J.W. (1977), Data Analysis and Regression: A Second Course in Statistics,
Addison-Wesley, Reading, MA.
Nair, V.N.; Oster, C.V.; Banks, D.L.; Bell, R.M.; Blair, J.; Broderick, A.J.; Danaher, J.; Griffiths,
P.; Johnstone, I.M.; Kafadar, K.; Lyall, B.A.; Richardson, D.W.; Sheridan, T.B.; Spain, A.T.;
Stokes, S.L.: An Assessment of NASA’s National Aviation Operations Monitoring Service, National
Research Council, The National Academies Press (ISBN-10: 0-309-14646-1; ISBN-13: 978-0-309-
14646-3), 2009.
Peskin, Adele P.; Kafadar, K.; Santos, A.M.; Haemer, Gillian G.: Robust Volume Calculations of
Tumors of Various Sizes. Proceedings of the 2009 International Conference on Image Processing,
Computer Vision, and Pattern Recognition (Refereed; CD).
Peskin, Adele P.; Kafadar, K.; Dima, Alden; Bernal, Javier; Gilsinn, David: Synthetic Lung
Tumor Data Sets for Comparison of Volumetric Algorithms. Proceedings of the 2009 International
Conference on Image Processing, Computer Vision, and Pattern Recognition (Refereed; CD).
Saha, Nilanjan; Watson, Layne T.; Kafadar, Karen; Onufriev, Alexey; Ramakrishnan, Naren;
Vasquez-Robinet, Cecilia; Watkinson, Jonathan: “A General Probabilistic Model of the PCR Pro-
cess,” Applied Mathematics and Computation 182(1), 232–243 (2006).
Saha, Nilanjan; Watson, Layne T.; Kafadar, Karen; Ramakrishnan, Naren; Onufriev, Alexey; Rao
Mane, Shrinivas; Vasquez-Robinet, Cecilia: “Validation and Estimation of Parameters for a General
Probabilistic Model of the PCR Process,” Journal of Computational Biology 14(1): 97-112 (2007).
20

Spiegelman, Clifford H.; Kafadar, Karen: “Data Integrity and the Scientific Method: The Case of
Bullet Lead Data as Forensic Evidence (with discussion),” Chance 19(2), 17-25 (2006).
Tibshirani, R. (1996), Regression shrinkage and selection via the lasso, J. Royal. Statist. Soc B
58(1): 267–288.
Tukey, J.W. (1977), Exploratory Data Analysis, Addison-Wesley.
Wegman, Edward J. (2004), “Visual analytics for Internet traffic data,” Keynote address, Eleventh
Annual Spring Research Conference, Gaithersburg, Maryland (May 19, 2004).
Wegman, Edward J.; Marchette, David J. (2003), “On some techniques for streaming data: A case
study of Internet packet headers,” 893–914. J. Comput. Graph. Stat. 12(4), 893–914.
Wegman, Edward J.; Marchette, David J. (2004), “Statistical analysis of network data for cyber-
security,” Chance, 9–19.
21