some like it vigorous: measuring individual differences … like it vigorous: measuring individual...
TRANSCRIPT

350
JOURNAL OF SPORT & EXERCISE PSYCHOLOGY, 2005, 27, 350-374© 2005 Human Kinetics, Inc.
1Dept. of Health & Human Performance, 253 Forker Bldg, Iowa State University, Ames, IA 50011; 2Dept. of Health & Human Performance, Elon University, Elon, NC 27244; 3Dept. of Kinesiology, University of Illinois, 906 S. Goodwin Ave., Urbana, IL 61801.
Some Like It Vigorous: Measuring Individual Differences in the Preference for and Tolerance of Exercise Intensity
Panteleimon Ekkekakis1, Eric E. Hall2, and Steven J. Petruzzello3
1Iowa State University; 2Elon University; 3University of Illinois
Individuals differ in the intensity of exercise they prefer and the intensity they can tolerate. The purpose of this project was to develop a measure of individual differences in the preference for and tolerance of exercise intensity. The steps involved in (a) item generation and face validation, (b) exploratory factor analysis and item selection, (c) structural validation, (d) examination of the internal consistency and test-retest reliability, (e) concurrent validation, and (f) construct validation are described. The Preference for and Tolerance of the Intensity of Exercise Questionnaire (PRETIE-Q) is a 16-item, 2-factor measure that exhibits acceptable psychometric properties and can be used in research aimed at understanding individual differences in responses to exercise and thus the psychological processes involved in the public health problem of exercise dropout.
Key Words: arousability, sensory modulation, affect, psychometrics
According to the World Health Organization (2003), it is estimated that world-wide over 60% of adults are not physically active enough to benefi t their health. Consequently, physical inactivity has become one of the main factors contributing to global morbidity and mortality from noncommunicable diseases, with 1.9 million deaths and 19 million disability-adjusted life-year losses attributed to it annually. The high rate of physical inactivity is the result of two related problems, namely, the low number of people who choose to initiate a regular program of physical activity, and the high rate of dropout, estimated to be approximately 50% within the fi rst few months (Dishman & Buckworth, 1996). With most of the research efforts in the last decade having been invested in the social and social-cognitive factors related to the process of initial engagement in physical activity, relatively little has been learned about the psychological processes leading to dropout.
Initially intuition, and now an increasing amount of scientifi c evidence, sug-gest that the intensity of physical activity has a negative association with adher-ence and a positive association with dropout (e.g., Cox, Burke, Gorely, Beilin, &

Some Like It Vigorous / 351
Puddey, 2003; Perri, Anton, Durning, et al., 2002). This relationship is possibly mediated by affect. Specifi cally, higher intensity may be experienced as aversive, or at least not enjoyable, and this absence of pleasure may in turn contribute to diminished adherence and increased risk of dropout. Although direct evidence is still lacking, this causal chain linking intensity, affect, and dropout is plausible. Studies have shown that most individuals, particularly those just starting an activity program, are not capable of accurately estimating and producing a prescribed level of intensity (e.g., Kollenbaum, Dahme, & Kirchner, 1996). In turn, higher intensity is typically associated with declines in affective valence (i.e., reduced pleasure or increased displeasure) during the activity (Ekkekakis & Petruzzello, 1999). These fi ndings underscore the importance of, and the need to better understand the factors that infl uence, the accurate self-monitoring and self-regulation of the intensity of physical activity.
Preference for and Tolerance of Exercise Intensity
Published studies reveal dramatic differences in the level of exercise intensity that individuals select, even when the intensity is expressed in relative terms as a percentage of each person’s maximal exercise capacity. For example, in a sample of 29 adult habitual walkers, Spelman, Pate, Macera, and Ward (1993) found that their average self-selected walking intensity was 51.5% of maximal aerobic capac-ity (VO2max) or 69.7% of maximal heart rate (HRmax), but the respective ranges were from 35.5% to 79.1% and from 56.0% to 89.3%. Likewise, in a sample of 6 distance runners, Farrell, Gates, Maksud, and Morgan (1982) found that the aver-age self-selected running intensity was 75.3% VO2max, but the individuals ranged from a low of 65% with no increase in blood lactate accumulation to a high of 90% with a blood lactate accumulation of 7.79 mmol·L–1.
Among individuals exercising for health and fi tness, large departures from a recommended range of intensity in either direction can have undesirable con-sequences (Dishman, 1994). Exceeding the appropriate intensity may lead to overexertion, injury, or discomfort, possibly leading one to avoid future activity. Conversely, an intensity that is lower than what is recommended may prevent or delay the accrual of noticeable health and fi tness benefi ts, causing frustration and, again, possibly dropout. Large interindividual differences are also observed in the tolerance exhibited by participants when the intensity of physical activity is imposed. In one study involving 30 minutes of stationary cycling at an imposed intensity of 60% estimated VO2max, 44% of participants reported a progressive improvement whereas 41% reported a progressive decline in affective valence (Van Landuyt, Ekkekakis, Hall, & Petruzzello, 2000).
There have been many calls for increased research attention to individual differences in the preference for and tolerance of exercise intensity. For example, the guidelines for exercise prescription issued by the American College of Sports Medicine (2000), when addressing the appropriate level of exercise intensity, focus mainly on physiological considerations but also state that “individual preferences for exercise must be considered to improve the likelihood that the individual will adhere to the exercise program” (p. 145). Likewise, according to Dishman, Farquhar, and Cureton (1994), “there is a scientifi c consensus that preferred and perceived exertion are possible determinants of self-selected exercise intensity, that they are understudied, and that they are priority areas for research. Exercise prescriptions
352 / Ekkekakis, Hall, and Petruzzello
based on preferred intensities might increase adherence to exercise programs” (p. 783). According to Morgan (1997), “the related issues of perceived and preferred exertion need to be considered in future research . . . A given relative intensity might be too low for some individuals and too high for others, and rigid prescrip-tions of this nature, theoretically, would not facilitate exercise adherence” (p. 9). However, to date these and several other calls have not resulted in a systematic investigation of the individual differences associated with the preference for and tolerance of exercise intensity.
Personality Traits and Responses to Bodily Stimuli †
Several traits have been theorized as being involved in arousability and sensory modulation. These are mainly conceptual descendants of the Pavlovian concept of the “strength” of the nervous system and include the dimension of introversion/extraversion (Eysenck, 1967), subjective augmentation vs. reduction of stimulus intensity (Petrie, 1967), impulsivity and behavioral activation/inhibi-tion (Gray, 1970), sensation-seeking (Zuckerman, 1979), reactivity (Kohn, 1985; Strelau, 1987), and predisposition to arousability (Coren, 1990), among others. However, the results from studies examining the association between these traits and responses to stimuli from the body have been mixed.
One case, which has received a considerable amount of research attention and can thus serve as an illustrative example, is the relationship between extraversion and pain threshold, sensitivity, or tolerance. According to Eysenck (1967), because of baseline differences in the degree of arousal of their reticular activating system (high for introverts, low for extraverts), introverts are expected to show more sensitivity to stimuli at the low end of the intensity spectrum whereas extraverts should have the capacity to respond to stimuli near the high end. Thus, for introverts the level of “hedonic tone” (i.e., affective valence) or preference is maximally positive at a lower intensity, whereas for extraverts this level is maximally positive at a higher intensity of sensory stimulation.
Given that intensities of stimulation beyond the optimal range will elicit declines in hedonic tone, it follows that the range of tolerance should also differ, with extraverts being able to tolerate higher levels of sensory stimulation than introverts. In Eysenck’s words, “we postulate a certain degree of stimulus hunger (sensation, arousal seeking) in the extravert and a certain degree of stimulus aver-sion in the intravert. Conversely, it would seem to follow that extraverts should be more tolerant of pain, intraverts of sensory deprivation” (1967, p. 110). However, the empirical evidence has not provided consistent support for these hypotheses, as some studies have shown a signifi cant association between extraversion and pain threshold, sensitivity, or tolerance (e.g., Lynn & Eysenck, 1961), whereas several others have not (e.g., Harkins, Price, & Braith, 1989).
Personality Traits and Exercise Related Bodily Stimuli †
The fi ndings of studies examining the role of traits related to arousability and sensory modulation in the domain of exercise have been similarly perplex-ing. Not only is the number of published studies surprisingly small, but the extant studies are also unsystematic (rarely more than one from the same research group), methodologically limited, and confl icting in their results. Moreover, although the majority of the studies seem to report signifi cant relationships in the hypothesized

Some Like It Vigorous / 353
direction, the impact of the “fi le drawer” problem (i.e., the nonpublication of null or contrary-to-hypothesis results) on this pattern cannot be ascertained.
The studies focusing on extraversion constitute the largest segment of the literature. In one study, 9 male participants exercised on a cycle ergometer against 5 levels of resistance (from 300 to 1,500 kpm) for 1 minute each. Extraversion scores were signifi cantly and negatively correlated with ratings of perceived exertion at 900 (–.62), 1,200 (–.69), and 1,500 kpm (–.71). Furthermore, when the participants were subsequently asked which intensity they would have chosen if the exercise session was to last for 30 min, their selected level of intensity also showed a signifi cant relationship (.70) to extraversion (Morgan, 1973). In another study, extraverts were found to exhibit better mood and lower perceptions of effort than introverts at high exercise intensities (Koller, Haider, & Recher, 1984).
Similarly positive results have been found for exercise tolerance. Costello and Eysenck (1961) reported that extraverts showed higher persistence in maintaining a static leg contraction compared to introverts. Shiomi (1980) found that extraverts could persist longer than introverts while cycling against a constant amount of resis-tance across a number of trials. Extraversion has also been found to be associated with participation in more physically active forms of recreation, more physically demanding leisure activities, and higher participation in endurance sports. Finally, some studies have also shown that extraversion is positively related to exercise participation and adherence (e.g., Courneya & Hellsten, 1998).
However, most of these fi ndings have been contradicted by other studies. A study involving 30 adolescent boys found no relationship between extraversion and ratings of perceived exertion at 30%, 60%, and 90% of individually determined maximal power output (Williams & Eston, 1986). Feldman (1964) and Smith (1968) found no relationship between extraversion and persistence in isometric and isotonic endurance tasks. Likewise, some studies have found no relationship between extraversion and exercise participation or adherence (e.g., Yeung & Hemsley, 1997a), and one has even shown that, contrary to expectations, higher extraversion was associated with lower attendance at exercise programs (Yeung & Hemsley, 1997b).
The role of most other relevant traits in infl uencing the preference for and tolerance of exercise intensity has not been examined. An exception is perceptual augmentation and reduction. It has been found that athletes tend to be reducers and tolerate more pain (Ryan & Foster, 1967) and that reducers report lower ratings of perceived exertion at the same absolute workloads compared to augmenters (Robertson, Gillespie, Hiatt, & Rose, 1977). However, we know of no published replications of these fi ndings.
Domain Relevance as an Explanation for Inconsistent FindingsThe literatures summarized in the two previous sections (on the role of per-
sonality in pain and exercise responses) illustrate some striking similarities, namely that in both literatures the number of studies is surprisingly small—given the impor-tance of the concept of personality and its theoretical relevance—and the fi ndings of these studies are confl icting. One possible explanation for these phenomena is that the theoretical predictions were wrong. However, before conceding that this is in fact the case, alternative explanations must also be examined. Principally, one should consider whether the available measures (e.g., of extraversion) capture the core elements of the trait in a comprehensive manner.

354 / Ekkekakis, Hall, and Petruzzello
Although nothing in the aforementioned theoretical models implies that they are applicable only to exteroceptive stimuli, the item pools of the available self-report measures clearly refl ect an imbalance in favor of exteroceptive (primarily social) and against interoceptive stimuli. In particular, the overemphasis on the social manifestations of extraversion (e.g., sociability) to the exclusion of other, perhaps more central, components has been discussed as problematic by several authors (e.g., Depue & Collins, 1999; Lucas, Diener, Grob, Suh, & Shao, 2000; Phillips & Gatchel, 2000).
The problem is not limited to measures of extraversion. An item review of the Temperament Inventory (Strelau, 1972); the Sensation Seeking Scale V (Zuck-erman, 1979); the Reducer-Augmenter Scale (Barnes, 1985; Vando, 1969, 1974); the Reducer-Augmenter Index (Weintraub, Green, & Herzog, 1973); the Reducer-Augmenter Scale Form G2 (Herzog, Williams, & Weintraub, 1985); the Revised Reducer-Augmenter Scale (Clapper, 1990); the Reactivity Scale (Kohn, 1985); the Arousability Predisposition Scale (Coren, 1988, 1990); and the Behavioral Inhibition System–Behavioral Activation System Questionnaire (Carver & White, 1994) also reveals that these measures are geared mainly toward responses to exteroceptive stimuli, involving primarily social situations. Only the Reducer-Augmenter Scale (Barnes, 1985; Vando, 1969) and the Revised Reducer-Augmenter Scale (Clapper, 1990) include one item each directly referring to exercise (i.e., “too much exercise” vs. “too little exercise” and “get much exercise” vs. “get a little exercise,” respec-tively). Only a few include one or two items inquiring about participation in sports (Barnes, 1985; Clapper, 1990; Herzog et al., 1985; Vando, 1969), and one includes an item referring to being able to “stand much physical labor” (Kohn, 1985).
Defi ning Intensity Preference and Intensity Tolerance
Based on the overall pattern of fi ndings reviewed above, we are inclined to believe that the confl icting fi ndings on the role of traits related to arousability and sensory modulation in the context of exercise may be due to two related reasons: (a) that the factors which infl uence the modulation of interoceptive stimuli, such as those elicited by exercise, are at least in part distinct from those that infl uence the modulation of exteroceptive and social stimuli; and (b) that the currently available general-purpose measures of the said traits focus heavily on responses to extero-ceptive and social stimuli while largely disregarding responses to interoceptive stimuli.
Thus we propose two new constructs, namely, “preference for exercise intensity” (or intensity-preference) and “tolerance of exercise intensity” (or inten-sity-tolerance). We defi ne preference for exercise intensity as a predisposition to select a particular level of exercise intensity when given the opportunity (e.g., when engaging in self-selected or unsupervised exercise). We defi ne tolerance of exercise intensity as a trait that infl uences one’s ability to continue exercising at an imposed level of intensity even when the activity becomes uncomfortable or unpleasant. We emphasize that we do not consider these traits to be the sole determinants of intensity selection or tolerance. Other factors including physical (e.g., fi tness, age, health status), experiential (e.g., learned coping skills, exercise history), and situational (e.g., self-effi cacy, social physique anxiety) are also likely to be important.
Our conceptualization of the intensity-preference and intensity-tolerance traits is underpinned by the following points. First, there is evidence of systematic

Some Like It Vigorous / 355
interindividual differences in the intensity of exercise that individuals choose (Far-rell et al., 1982; Spelman et al., 1993) and the intensity they can tolerate without a decline in affective valence when that intensity is externally imposed (Van Landuyt et al., 2000). Similar results have been obtained from animal studies, particularly in rodents, whose spontaneous running behavior has been studied extensively. In one study, for example, some rats were found to perform up to 37 times more wheel revolutions per hour than others (Premack & Schaeffer, 1963). Importantly, the differences between individuals appear to be substantially larger than the differ-ences within the same individuals across observations. Evidence both from human (Ekkekakis, Hall, Van Landuyt, & Petruzzello, 2000) and animal studies (Fried-man, Garland, & Dohm, 1992; Rhodes, Garland, & Gammie, 2003) shows that the choice of exercise intensity is remarkably consistent in the same individuals across repeated trials. Collectively, these fi ndings suggest the presence of stable individual-difference traits that infl uence the intensity of exercise a person is pre-disposed to select or tolerate.
Second, we regard the concepts of intensity-preference and intensity-tolerance as conceptual relatives of traits related to arousability and sensory modulation (i.e., strength of the nervous system, extraversion/introversion, augmenting/reducing, sensation-seeking). We also concur with views that the commonalities among these traits suggest a “common core” or a common central regulatory mechanism (Davis, Cowles, & Kohn, 1983; Depue & Collins, 1999; Dragutinovich, 1987; Kohn, 1985; Strelau, 1987). However, we postulate that the manifestations of this common core in response to exercise intensity and associated interoceptive stimuli (e.g., muscular and respiratory cues) may differ somewhat from manifestations in response to exteroceptive stimuli (e.g., visual, auditory, tactile).
The basis of this assertion is that the processing of exercise-related interocep-tive stimuli in the brain involves mechanisms that are distinct in terms of anatomy and design from the mechanisms responsible for the processing of exteroceptive stimuli. In particular, interoceptive stimuli are processed by a multilayered, increas-ingly complex, hierarchically organized system that extends from the brain stem to the somatosensory cortex (Craig, 2003). Consequently, a considerable amount of processing, involving such phenomena as intensity-based gating and redirection of neural impulses, takes place subcortically. Unlike exteroceptive sensory modalities, which may or may not involve functional subcortical pathways to the affective areas of the brain, such as the amygdala, interoceptive stimuli can reach these areas via multiple interconnected subcortical routes. The same assertion is the cornerstone of our claim for the need to develop a measure of preference for and tolerance of exercise intensity that is separate from general-purpose measures of traits related to arousability and sensory modulation. As explained above, although the intensity of exercise is primarily associated with interoceptive stimuli, the extant measures focus mainly on responses to exteroceptive stimuli and behavioral tendencies in social situations (e.g., sociability).
Third, there is evidence that, much like heritable variation in extraversion and sensation-seeking (Eysenck, 1983) and pain sensitivity and tolerance (Mogil, 1999), the variation in the preferred intensity of exercise might also be partly heritable. This is supported by studies on human twins (Beunen & Thomis, 1999; Lauderdale, Fabsitz, Meyer, et al., 1997; Maia, Thomis, & Beunen, 2002), human DNA studies (Simonen, Rankinen, Peruse, et al., 2003), animal DNA studies (Mayeda & Hofstetter, 1999), and animal artifi cial selection studies (Swallow, Carter, & Garland, 1998).
356 / Ekkekakis, Hall, and Petruzzello
Although the bulk of genotypic differences are linked to peripheral physi-ological traits, such as muscle glucose uptake, studies have also highlighted the important role of brain regulatory mechanisms (Rhodes et al., 2003; Simonen et al., 2003). Presumably, like the ability to tolerate pain and sensation-seeking (Zuckerman, 1990), the ability to tolerate and the tendency to seek out bodily stimulation related to exercise intensity would generally be adaptively neutral, hence contributing to substantial heritable variation. On the one hand, high prefer-ence for and tolerance of exercise intensity would enable an individual to perform more physical work (e.g., cover larger distances in search of food). On the other hand, the higher level of physical exertion would make one more susceptible to injury or exhaustion.
Fourth, we hypothesize that preference for exercise intensity and tolerance of exercise intensity will be moderately correlated in a positive direction (i.e., neither fully independent nor fully overlapping). This postulate is based on three lines of evidence. The fi rst pertains to the relationship between pain threshold and pain tol-erance, which has been found to range from low to moderate (e.g., Gelfand, 1964; Ryan & Kovacic, 1966). The second pertains to the relationship between muscle fatigue threshold and tolerance for isotonic and isometric tasks, which has been found to be moderate (.41 to .54; Smith, 1968). The third pertains to fi ndings that forced treadmill performance in rodents has been found to be only weakly related to self-selected wheel-running or open-fi eld locomotion (Dishman, Armstrong, Delp, Graham, & Dunn, 1988; Lambert, Van Zyl, Jaunky, Lambert, & Noakes, 1996; Lerman, Harrison, Freeman, et al., 2002).
Fifth, as an extension of the previous point, we speculate that preference for and tolerance of exercise intensity will have partly distinct anatomical and physi-ological substrates. However, the current state of knowledge in this fi eld does not permit the identifi cation of these substrates with any specifi city. Rhodes et al. (2003) recently identifi ed the dentate gyrus of the hippocampus as one area that might be related to the self-selection of wheel-running intensity in mice. Simonen et al. (2003) focused on dopamine as a factor that may regulate the amount of voluntary exercise since it appears to be the common denominator to movement and reward.
Along similar lines, we speculate that the preference for and tolerance of exercise intensity will be closely linked to affective responses to exercise. Thus, brain areas involved in such responses should be relevant to individual differences in intensity-preference and intensity-tolerance. In this context it is also possible, although as of yet untested, that areas which receive interoceptive afferents and are involved in affective responses, such as the insula, the amygdala, and the nucleus accumbens, might be involved in preference for exercise intensity, whereas areas involved in stress-induced analgesia, such as the periaqueductal gray, might be involved in tolerance for exercise intensity.
The purpose of this project was to develop a questionnaire measure of the traits “preference for exercise intensity” and “tolerance of exercise intensity,” as previously defi ned. All the participants in all studies described herein read and signed informed consent forms approved by university institutional review boards prior to their participation. Unless otherwise noted, they were students recruited from exercise science classes in universities in the United States. Their participa-tion was entirely voluntary and no incentive or reward, monetary or otherwise (e.g., course credit), was provided.

Some Like It Vigorous / 357
Phase 1: Item Generation and Face Validation
As a fi rst step, we assembled a group of 15 advanced undergraduate and post-graduate students (7 M, 8 F, mean age 22.4 yrs) with extensive exercise experience in order to develop an initial item pool. We asked them to write 5 items for each of the following 4 constructs: (a) preference for high exercise intensity; (b) prefer-ence for low exercise intensity; (c) high tolerance for intense exercise; and (d) low tolerance for intense exercise. The students were also given written instructions (a) to be creative; (b) to avoid rehashing the same basic ideas across items by using synonyms and instead to fi nd items that each “conveys a unique idea and highlights a different aspect” of the constructs in question; and (c) to use everyday expressions if these accurately conveyed the desired meaning. This process resulted in 300 items. After removing items that were identical or used very close synonyms, we reduced the item pool to 223 items. Specifi cally, out of 75 possible items in each category, there were 71 items for preference for high exercise intensity, 57 items for preference for low exercise intensity, 48 items for high tolerance for intense exercise, and 47 items for low tolerance for intense exercise.
As the second step, each of the three coauthors independently examined this pool of 223 items in order to select 25 items from each of the 4 categories that most closely refl ected the intended domain of content of the category, i.e., had the high-est face validity. Furthermore, they were given the following written instructions: (a) to avoid selecting redundant items and instead preferring items with distinct content; (b) to suggest corrections to the grammar and/or syntax of the items sub-mitted by the students; (c) to avoid selecting items that referred to specifi c modes (e.g., running) or amounts of exercise (e.g., speed expressed in minutes per mile), as these might be inapplicable to certain populations; (d) to avoid selecting items that refer to the cognitive evaluation of different exercise intensities (e.g., “I like high-intensity exercise because I know that it is more benefi cial”), as these evalu-ations may be unrelated to the intended domain of content; (e) to avoid selecting items that refer to responses which, although exercise-related, occur after some delay (e.g., “I hate exercising hard because I feel sore the next morning”); (f) to be very sensitive to the appropriate categorization of items denoting “preference” or “tolerance” and to discard any items that do not clearly refl ect one, and only one, of the two constructs; and (g) to supplement the list with their own items if they could not identify 25 items satisfying the above criteria.
All three coauthors were able to identify 25 face-valid items from each cat-egory, thus no new items were generated. Using a 66% agreement (i.e., 2 out of 3) among the coauthors as a selection criterion resulted in 53 items. Specifi cally, there were 14 items for preference for high exercise intensity, 14 items for preference for low exercise intensity, 13 items for high tolerance for intense exercise, and 12 items for low tolerance for intense exercise.
Phase 2: Exploratory Factor Analyses and Item Selection
The purpose of this phase was to further narrow the item pool by conducting an exploratory factor analysis and thus identifying items that more closely refl ected the underlying latent constructs (i.e., highest loadings on the hypothesized factor) and had the clearest factorial identity (i.e., lowest cross-loadings). The 53 items remain-ing from Phase 1 were administered to a sample of 287 undergraduate students (115

358 / Ekkekakis, Hall, and Petruzzello
M, 162 F, 10 of undisclosed gender; mean age 20.1 yrs). Of these, 33.5% reported no regular physical activity whereas the others reported, on average, 4.5 sessions per week, lasting for 74 min and performed at an intensity of 7.0 on Borg’s (1998) Category Ratio 10 scale. On average, they had been physically active for over 6 years (75 months) prior to the study. Each item was accompanied by a 5-point response scale ranging from “I totally disagree” to “I totally agree.” All but 5 of the 53 items had skewness values ±1.00 and the remaining 5 were within ±1.50.
The resultant item intercorrelation matrix was subjected to a principal-axis factor analysis with an oblique rotation, given the hypothesized correlation between the constructs of intensity-preference and intensity-tolerance. Consistent with the hypothesis that the item pool refl ected two underlying constructs, two factors were extracted. Also consistent with the hypothesis, one factor consisted mainly of items that had been selected as denoting preference for exercise intensity and the other factor consisted mainly of items that had been selected as denoting tolerance of exercise intensity. The former factor included items denoting preference for high exercise intensity (with positive loadings) and items denoting preference for low exercise intensity (with negative loadings), while the latter factor included items denoting high tolerance for intense exercise (with positive loadings) and items denoting low tolerance for intense exercise (with negative loadings).
Based on the factor loadings, items were eliminated (a) if their highest loading was on the opposite factor from the one originally hypothesized by the development sample and the judges, and (b) if they exhibited cross-loadings (more than |.20| on the other factor). Of the remaining items, 8 with the highest loadings on the “prefer-ence” factor (4 denoting preference for high intensity and 4 for low intensity) and 8 with the highest loadings on the “tolerance” factor (4 denoting high tolerance and 4 denoting low tolerance) were retained and subjected to a new principal-axis factor analysis with oblique rotation.
An examination of the scree plot (see Figure 1) suggests the presence of 2 factors, which accounted for 50.6% of the variance. As shown in Table 1, after the oblique rotation, the 2 factors had fairly simple structure. The average absolute loadings on the primary factors were .66 for the tolerance factor (F1) and .61 for the preference factor (F2), whereas the average absolute loadings on the secondary factors were .04 and .11, respectively. Based on these results, the 16 items (8 for preference and 8 for tolerance) were retained as the fi nal form of the questionnaire. The questionnaire was named “PRE-ference for and Tolerance of the Intensity of Exercise Questionnaire” (PRETIE-Q; see Appendix).
Phase 3: Structural Validity
A confi rmatory factor analysis was conducted on the fi nal, 16-item version of the PRETIE-Q to determine the validity of its hypothesized structure. The ques-tionnaire was administered to 184 undergraduate students (91 M, 93 F, mean age 19.7 yrs). Of these, 22.8% reported no regular physical activity whereas the others reported an average of 4.4 sessions per week, lasting for 66 min and performed at an intensity of 5.9 on Borg’s (1998) Category Ratio 10 scale. On average, they had been physically active for over 5 years (63 months) prior to the study. Each item was again accompanied by a 5-point response scale ranging from “I totally disagree” to “I totally agree.” Fifteen of the 16 items had skewness values of ±1.00 and the remaining one had ±1.15.

Some Like It Vigorous / 359
Tab
le 1
D
escr
ipti
ve S
tati
stic
s an
d R
esul
ts o
f E
xplo
rato
ry F
acto
r A
naly
sis
(pat
tern
mat
rix)
No.
Item
M
SD
F
1
F2
1.
Dur
ing
exer
cise
, if
my
mus
cles
beg
in to
bur
n ex
cess
ivel
y or
if I
fi nd
mys
elf
brea
thin
g ve
ry
ha
rd, i
t is
time
for
me
to e
ase
off.
3.22
1.04
.76
.04
2.
Feel
ing
tired
dur
ing
exer
cise
is m
y si
gnal
to s
low
dow
n or
sto
p.3.
56.9
1.7
2.0
2 3
. I’
d ra
ther
slo
w d
own
or s
top
whe
n a
wor
kout
sta
rts
to g
et to
o to
ugh.
3.78
.91
.67
–.06
4.
Whe
n m
y m
uscl
es s
tart
bur
ning
dur
ing
exer
cise
, I u
sual
ly e
ase
off
som
e.3.
23.9
8.6
6–.
07 5
. Fa
tigue
is th
e la
st th
ing
that
aff
ects
whe
n I
stop
a w
orko
ut; I
hav
e a
goal
and
sto
p on
ly w
hen
I
reac
h it.
3.30
1.05
–.63
–.01
6.
I bl
ock
out t
he f
eelin
g of
fat
igue
whe
n ex
erci
sing
.3.
27.9
1–.
63.0
4 7
. W
hen
exer
cisi
ng, I
try
to k
eep
goin
g ev
en a
fter
I f
eel e
xhau
sted
.3.
52.8
9–.
63–.
05 8
. I
alw
ays
push
thro
ugh
mus
cle
sore
ness
and
fat
igue
whe
n w
orki
ng o
ut.
3.47
.93
–.58
.07
9.
I w
ould
rat
her
wor
k ou
t at l
ow in
tens
ity le
vels
for
a lo
ng d
urat
ion
than
at h
igh
inte
nsity
leve
ls
for
a sh
ort d
urat
ion.
2.45
.96
–.07
–.84
10.
I w
ould
rat
her
have
a s
hort
, int
ense
wor
kout
than
a lo
ng, l
ow-i
nten
sity
wor
kout
.2.
51.9
7.1
3.7
311
. I’
d ra
ther
go
slow
dur
ing
my
wor
kout
, eve
n if
that
mea
ns ta
king
mor
e tim
e.2.
48.8
9.1
0–.
7112
. W
hen
I ex
erci
se, I
usu
ally
pre
fer
a sl
ow, s
tead
y pa
ce.
2.48
.99
.10
–.58
13.
Exe
rcis
ing
at a
low
inte
nsity
doe
s no
t app
eal t
o m
e at
all.
3.13
1.08
.03
.55
14.
Whi
le e
xerc
isin
g, I
pre
fer
activ
ities
that
are
slo
w-p
aced
and
do
not r
equi
re m
uch
exer
tion.
2.13
.80
.22
–.52
15.
Low
-int
ensi
ty e
xerc
ise
is b
orin
g.2.
631.
17–.
01.4
816
. T
he f
aste
r an
d ha
rder
the
wor
kout
, the
mor
e pl
easa
nt I
fee
l.2.
71.9
1–.
18.4
6
Eig
enva
lue
6.15
1.95
Perc
enta
ge o
f va
rian
ce a
ccou
nted
for
Pe
rcen
tage
of
vari
ance
acc
ount
ed f
or
Perc
enta
ge o
f va
rian
ce a
ccou
nted
for
38.4
12.2

360 / Ekkekakis, Hall, and Petruzzello
The analysis was conducted using EQS version 5.1 (Bentler, 1995) with the maximum likelihood method of estimation. The correlation among the “preference” and “tolerance” latent factors was not constrained but was left to be estimated. In addition to χ2, which is affected by sample size, the following indices of fi t were considered: (a) χ2 divided by the degrees of freedom (χ2/df/df/ ), with a level of 2.0 or df), with a level of 2.0 or dfless being considered indicative of adequate fi t; (b) the Goodness of Fit Index (GFI), with a level of .90 or higher indicating adequate fi t; (c) the Comparative Fit Index (CFI), with a level of .90 or higher indicating adequate fi t; and (d) the Root Mean Square Error of Approximation (RMSEA), with a level of .05 indicating close fi t and .08 indicating reasonable fi t (Browne & Cudeck, 1992).
The hypothesized 2-factor structure fi t the data reasonably well, yielding χ2
(103) = 216.3, p < .001, χ2/df/df/ = 2.10, CFI = .872, GFI = .874, and RMSEA = .078. df = 2.10, CFI = .872, GFI = .874, and RMSEA = .078. dfThe standardized factor loadings appear in Figure 2. The correlation among the “preference” and “tolerance” latent factors, theorized to be error-free, was estimated at .42, supporting our hypothesis that the two constructs are moderately related.
Although the model fi t the data reasonably well, it is apparent that there were some misspecifi cation problems that precluded even closer fi t. Because these prob-lems could be directly related to the structural validity of the PRETIE-Q (e.g., item cross-loadings), a post hoc Lagrange Multiplier (LM) test was conducted. The test revealed that the misspecifi cation was due to correlated error terms between certain items. The presence of correlated error terms implies that measurement error may be non-random and may be due instead to such systematic factors as response sets (Bollen, 1989, p. 232) or the response format of the measurement instrument (Byrne, 1991, p. 594). Although it has been argued that a model which forces errors to be uncorrelated is “highly restricted” and “rarely appropriate for real data” (Bentler & Chou, 1987, p. 108), the possible capitalization on chance entailed by post hoc
Figure 1 — The scree plot, based on a principal-axis factor analysis of 16 items, indi-cates the presence of 2 factors.

Some Like It Vigorous / 361
model respecifi cations that allow for correlated errors has led others to argue that this is “not an acceptable practice” unless such specifi cations are “supported by a strong substantive and/or empirical rationale” (Byrne, 1994, p. 299). In this case, the LM analysis suggested correlated errors between items of very similar content and/or similar sentence structures.
Specifi cally, the errors associated with the following items were shown to be correlated (the fi rst 3 from the preference factor and the 4th from the tolerance factor): (a) “I would rather work out at low intensity levels for a long duration than at high intensity levels for a short duration” and “I would rather have a short, intense workout than a long, low-intensity workout” (both items referring to low intensity); (b) “I’d rather go slow during my workout, even if that means taking more time” and “When I exercise, I usually prefer a slow, steady pace” (both items using the word slow); (c) “Exercising at a low intensity does not appeal to me at all” and “Low-intensity exercise is boring” (both items referring to boredom or lack of enjoyment); and (d) “During exercise, if my muscles begin to burn excessively or if I fi nd myself breathing very hard, it is time for me to ease off” and “When my muscles start burning during exercise, I usually ease off some” (both items referring to burning sensations in the muscles and the need to ease off).
When these error terms were allowed to correlate, the fi t was improved consid-erably, χ2 (99) = 128.0, p < .03, χ2/df/df/ = 1.29, CFI = .967, GFI = .922, and RMSEA df = 1.29, CFI = .967, GFI = .922, and RMSEA df
Figure 2 — The results of the confi rmatory factor analysis of the PRETIE-Q.

362 / Ekkekakis, Hall, and Petruzzello
= .040. The differences in the magnitude of factor loadings between the initial and respecifi ed models were minor (.06 or less). Also, the correlation between the “prefer-ence” and “tolerance” latent variables was essentially unaffected (.45 from .42).
In conclusion, the hypothesized 2-factor structure of the PRETIE-Q, without any correlated errors, exhibited a reasonable but not close fi t. The post hoc analysis showed that the remaining misspecifi cation did not involve problems with the basic structural postulates, but rather problems associated with syntactical and content-related similarities in certain items, which in turn resulted in correlated errors among 4 pairs of items. Based on these fi ndings, we believe that (a) the PRETIE-Q in its present form is structurally valid and therefore appropriate for use in research and practice, but (b) researchers should be aware of the likelihood of correlated errors among the aforementioned items and thus should allow for such correlations when testing covariance structure models involving the PRETIE-Q. Although the presence of correlated errors is not necessarily a problem, the desire for a more parsimonious structural model dictates that future refi nements of the PRETIE-Q should seek to further reduce content overlap and syntactical similarities between items.
Phase 4: Internal Consistency and Test-Retest Reliability
The internal consistency of the two scales of the PRETIE-Q was examined in the two samples used in Phases 2 and 3 (N = 287 and N = 287 and N N = 184, respectively) and N = 184, respectively) and Nan additional sample of 64 undergraduate students (37 M, 27 F, mean age 20.1 yrs). Cronbach’s alpha coeffi cients for the Preference scales were .85, .83, and .81, while the coeffi cients for the Tolerance scale were .87, .82, and .86. Item analyses revealed that no item had a negative contribution to internal consistency.
The test-retest reliability of the PRETIE-Q was examined in two samples. In one (N = 58; 27 M, 31 F, mean age 21.1 yrs) the second assessment took place N = 58; 27 M, 31 F, mean age 21.1 yrs) the second assessment took place Nafter a 3-month delay, while in the other (N = 52; 23 M, 29 F, mean age 20.7 yrs) N = 52; 23 M, 29 F, mean age 20.7 yrs) Nthe second assessment took place after a 4-month delay. The 3-month test-retest reliability coeffi cient was .67 for Preference and .85 for Tolerance. The 4-month test-retest reliability coeffi cient was .80 for Preference and .72 for Tolerance. All these fi gures are acceptably high, suggesting that the PRETIE-Q yields measure-ments that are internally consistent and reliable over time.
Phase 5: Concurrent Validity
The concurrent validity of the PRETIE-Q was examined in two samples of respondents. Sample A (N = 58) consisted of 37 women and 21 men, mean age 20.2 N = 58) consisted of 37 women and 21 men, mean age 20.2 Nyrs; Sample B (N = 91) consisted of 62 women and 29 men, mean age 19.1 yrs. The N = 91) consisted of 62 women and 29 men, mean age 19.1 yrs. The Nrespondents in Sample A completed, in addition to the PRETIE-Q, the following trait measures of arousability and sensory modulation: the Behavioral Activation System–Behavioral Inhibition System questionnaire (BIS/BAS; Carver & White, 1994); the Eysenck Personality Questionnaire (EPQ; Eysenck, 1989); the Revised Reducer-Augmenter Scale (RAS; Clapper, 1990); the Reactivity Scale (RS; Kohn, 1985); and the Arousability Predisposition Scale (APS; Coren, 1988, 1990). The respondents in Sample B completed only the latter 3 questionnaires.
In Sample A, the Preference scale was signifi cantly associated with the Drive scale of the Behavioral Activation System component of the BIS/BAS (r = .38, r = .38, rp < .01) and the Revised RAS (r = .31, r = .31, r p < .05). The Tolerance scale was associ-ated with the Drive scale of the Behavioral Activation System component of the

Some Like It Vigorous / 363
BIS/BAS (r = .41, r = .41, r p < .01), the Revised RAS (r = .34, r = .34, r p < .01), the RS (r = .35, r = .35, r p < .01) and, unexpectedly, with the Neuroticism scales of the EPQ (r = .30, r = .30, r p < .05). In Sample B, the Preference scale was signifi cantly associated with the Revised RAS (r = .18, r = .18, r p = .05). The Tolerance scale was associated with the Revised RAS (r = .35, r = .35, r p < .001) and the RS (r = .18, r = .18, r p < .05).
These correlations, which are generally weak, support the notion of the rela-tive independence of arousability and sensory modulation-related traits that pertain to the processing of exteroceptive and interoceptive stimuli. Although the presence of some signifi cant correlations indicates that individual differences in the prefer-ence for and the tolerance of exercise intensity may be a part of the cluster of traits related to arousability and sensory modulation, the low magnitude of these cor-relations also suggests that the relationship of these two constructs to the cluster is loose. Therefore these fi ndings can be interpreted as (a) tentatively supporting the concurrent validity of the scales of the PRETIE-Q and (b) justifying the need for the PRETIE-Q as a separate measure whose content does not duplicate the content of any existing measure.
Phase 6: Construct Validity
Three types of studies were conducted to test the construct validity of the scales of the PRETIE-Q. The fi rst type consisted of 4 studies examining the cross-sectional relationship of the scores on the Preference and Tolerance scales with the self-reported intensity of regular physical activity. The samples used in these 4 studies consisted of individuals who reported being regularly physically active (i.e., 3 or more times a week for at least 20 min/session). The sample sizes were 51 (31 M, 20 F, mean age 20.1 yrs), 58 (17 M, 41 F, mean age 19.0 yrs), 143 (66 M, 77 F, mean age 19.8 yrs), and 150 (63 M, 87 F, mean age 19.9 yrs). Self-reported intensity was assessed by a modifi ed form of Borg’s (1998) Category Ratio 10 scale, that is, using the same scale and anchors as the original except that, in the adapta-tion used in the present studies, the responses referred to the intensity of habitual physical activity rather than an ongoing bout of physical activity. The correlation between the Preference scale and self-reported intensity was .54, .45, .32, and .55, respectively, across the 4 samples. The correlation between the Tolerance scale and self-reported intensity was .28, .49, .55, and .46, all signifi cant.
In addition to intensity, we also examined the relationships to other attributes of habitual physical activity, namely frequency, session duration, and duration of lifetime involvement in physical activity. Frequency was assessed by the question, “How many days (on average) do you exercise per week?” Session duration was assessed by the question, “How long (on average) do you exercise per session?” (in minutes). Duration of lifetime involvement was assessed by the question “How long have you been exercising on a regular basis (at least 3 times per week, 20+ minutes per session)?” (in years and months, later converted to months). Preference correlated between .18 and .33 with frequency, .19–.21 with session duration, and .13–.27 with duration of lifetime involvement. Tolerance correlated between .22 and .39 with frequency, .21–.28 with session duration, and .12–.20 with duration of lifetime involvement. In general, these correlations tended to be weaker com-pared to those with self-reported intensity, supporting the idea that the scales of the PRETIE-Q tap primarily tendencies pertaining to the intensity of physical activity and not other aspects of physical activity participation.

364 / Ekkekakis, Hall, and Petruzzello
Finally, in one of the samples (N = 58) we assessed the relationships of self-N = 58) we assessed the relationships of self-Nreported habitual exercise intensity to other measures of arousability and sensory modulation. Specifi cally, we used the Revised Reducer-Augmenter Scale (Clapper, 1990), the Reactivity Scale (Kohn, 1985), and the Arousability Predisposition Scale (Coren, 1988, 1990). None of these showed a statistically signifi cant correlation with intensity (the coeffi cients were .15, .24, and .13, respectively), supporting our claim for the need of a measure that is specifi c to exercise.
The second type of study focused on the ability of the PRETIE-Q scales to predict affective responses to bouts of physical activity undertaken at different levels of intensity. Based on studies by Dishman et al. (1994) on young physically active participants, and by Lind, Joens-Matre, and Ekkekakis (2005) on middle-aged sedentary participants showing that the average self-selected intensity matches the ventilatory threshold (typically interpreted as the point of transition from an intensity that can be maintained by aerobic metabolism to one that requires anaerobic supple-mentation), we hypothesized that, when physically active participants are asked to exercise at an intensity near ventilatory threshold, their affective responses would be predicted by both the Preference scale and the Tolerance scale of the PRETIE-Q. This is because this intensity should be close to the one some participants would prefer, while it may begin to challenge the ability of others to tolerate it.
On the other hand, based on fi ndings that exceeding the intensity of the venti-latory threshold is accompanied by reduced pleasure or increased displeasure (e.g., Ekkekakis, Hall, & Petruzzello, 2004, and references therein), we hypothesized that when participants are asked to exercise at an intensity that exceeds the level of the ventilatory threshold, their (mostly negative) affective responses would be predicted primarily by the Tolerance scale of the PRETIE-Q. This is because an intensity that is experienced as unpleasant is unlikely to be freely selected and maintained for a prolonged period of time, so forcing one to engage in activity at that level would challenge one’s tolerance.
The sample consisted of 30 volunteers, 14 women (age 21.21 ± 2.04 yrs; height 167.28 ± 9.14 cm; weight 60.59 ± 6.63 kg) and 16 men (age 21.50 ± 2.45 yrs; height 182.17 ± 5.00 cm; weight 78.50 ± 9.20 kg). We focused on the core component of affective experience and the one that is most variable in response to exercise, namely affective valence (pleasure vs. displeasure). This dimension was assessed by the Feeling Scale (FS; Hardy & Rejeski, 1989), a self-report measure that, because of its brevity (single-item), is ideal for repeated assessments during the exercise bout. The FS is an 11-point bipolar rating scale of pleasure/displeasure ranging from +5 to –5. Anchors are provided at zero (Neutral) and at all odd integers ranging from “Very Good” (+5) to “Very Bad” (–5). Validity information has been provided by Hardy and Rejeski (1989).
Participation in the experiment entailed 5 visits to the laboratory, scheduled on different days. The purpose of the fi rst session was to determine each participant’s maximal aerobic capacity and ventilatory threshold (VT) through an incremental treadmill test performed until volitional exhaustion. The second visit was to verify the treadmill speeds that corresponded to intensities (a) 20% of maximal aerobic capacity below the VT (<VT), (b) at the VT (@VT), and (c) 10% of maximal aero-bic capacity above the VT (>VT). For the next 3 sessions the participants ran on a treadmill for 15 min at each of the 3 intensities (<VT, @VT, and >VT) and their responses to the FS were recorded every 3 min (at the end of a 5-min warm-up and during the last 15 sec of Minutes 3, 6, 9, 12, and 15).

Some Like It Vigorous / 365
A 3 × 7 (Intensity conditions × Time points: preexercise, warm-up, Minutes 3, 6, 9, 12, 15) repeated-measures ANOVA on the FS ratings showed that the effect of intensity condition, F(2, 58) = 15.68, p < .001; the effect of time, F(1.69, 48.93) = 14.86, p < .001; and their interaction, F(4.20, 121.71 = 6.04, p < .001, were sig-nifi cant. There were no signifi cant differences between the conditions before the beginning of exercise or at the end of the warm-up, but the patterns were different thereafter. The average FS ratings in the <VT condition showed a relatively small and nonsignifi cant decrease from the end of the warm-up to Minute 15, from 3.63 to 3.00. The decrease in the @VT condition during the same period was larger but still nonsignifi cant, from 3.47 to 2.17. Finally, in the >VT condition the decrease reached statistical signifi cance as early as Minute 6 and grew increasingly larger through Minute 15, from 3.13 to 0.80. These results suggest that indeed an inten-sity which exceeds the VT is experienced as unpleasant, and therefore it would be unlikely that an individual would select and maintain it over an extended period unless he or she was instructed or required to do so.
The bivariate correlations of the Preference and Tolerance scales with (a) the average FS ratings collected during each run (Minutes 3, 6, 9, 12, 15), (b) the FS rating at Minute 12, and (c) the FS rating at Minute 15 (fi nal) were examined next. These analyses were consistent with the hypothesis since they showed that (a) neither the Preference nor the Tolerance scale was signifi cantly related to affective responses in the <VT condition, (b) both the Preference and Tolerance scales were signifi cantly related to affective responses in the @VT condition, and (c) only the Tolerance scale was signifi cantly related to affective responses in the >VT condition. The correlation coeffi cients and associated probability levels are shown in Table 2.
Table 2 Bivariate Pearson P-M Correlations of Preference and Tolerance Scales With Feeling Scale (FS) Responses to Increasing Exercise Intensity
<VT @VT >VT Pref Tol Pref Tol Pref Tol
Average FS .27 .03 .52** .40* .16 .48**FS at Minute 12 .27 .10 .58** .47** .14 .53**FS at Minute 15 .32 .10 .50** .51** –.01 .40*
* p < .05; ** p < .01
Finally, two series of hierarchical multiple regression analyses were con-ducted. The FS ratings at Minutes 12 and 15 of each of the 3 intensity conditions were the dependent variables. The FS ratings before each exercise bout were entered in the analyses as Step 1. The scores of the Preference or the Tolerance scale of the PRETIE-Q were entered as Step 2. The detailed results are shown in Table 3 (for FS ratings at Minute 12) and Table 4 (for FS ratings at Minute 15). Both at Minutes 12 and 15 the pattern was similar. The Preference scale signifi cantly predicted affective responses only in the @VT condition, whereas the Tolerance scale signifi cantly predicted affective responses in both the @VT and >VT condi-

366 / Ekkekakis, Hall, and Petruzzello
tions. Neither scale predicted affective responses in the <VT condition. The results were also similar at Minute 9 (data not shown here). These fi ndings support the construct validity of the scales of the PRETIE-Q because they demonstrate that (a) the Preference and Tolerance scales can predict an important aspect of human functioning in response to exercise performed at different levels of intensity (i.e., presumably “preferred” and “nonpreferred”), namely affective responses, and (b) the Preference and Tolerance scales, although not fully statistically independent (correlated .40 in the present sample), tap constructs that are not only conceptually but also empirically separable and distinct.
The third type of study used in evaluating the validity of the PRETIE-Q examined whether the Preference scale could predict the self-selection of physi-ologically defi ned exercise intensity in a sample of previously sedentary middle-aged women. Because of its complexity, that study is described in a separate publication (Ekkekakis, Lind, & Joens-Matre, in press). Briefl y, 23 sedentary women (mean age 43.4 yrs, mean VO2peak = 23.0 ml·kg–1·min–1) participated in 20 min of treadmill exercise during which they were allowed to change the speed of the treadmill every 5 min (Minutes 0, 5, 10, 15). The intensity they selected, expressed as a percentage of the oxygen uptake associated with their previously determined VT, stabilized at a level not signifi cantly different from VT at Minutes 15 and 20 (approx. 97% of the oxygen uptake at VT at Minute 20). However, individuals in the sample
Table 3 Results of Hierarchical Multiple Regression Analyses, With FS at Minute 12 as the Dependent Variable
β p R R2change FchangeFchangeF p
Preference<VT Pre-FS .447 .019 .447 .200 6.233 .019
Pre-FS .434 .021 Pref .247 .172 .510 .061 1.978 .172
@VT Pre-FS .504 .007 .504 .254 8.499 .007 Pre-FS .368 .032 Pref .445 .011 .658 .180 7.615 .011
>VT Pre-FS .155 .441 .155 .024 .613 .441 Pre-FS .158 .438 Pref .138 .496 .207 .019 .477 .496Tolerance
<VT Pre-FS .455 .012 .455 .207 7.308 .012 Pre-FS .453 .013 Tol .090 .602 .464 .008 .279 .602
@VT Pre-FS .510 .004 .510 .260 9.844 .004 Pre-FS .452 .005 Tol .399 .012 .645 .156 7.205 .012
>VT Pre-FS .240 .201 .240 .058 1.714 .201 Pre-FS .253 .115 Tol .540 .002 .591 .291 12.092 .002

Some Like It Vigorous / 367
selected intensities ranging from as low as 62% to as high as 160% of the oxygen uptake at VT at Minute 20.
The Preference scale of the PRETIE-Q accounted for 17% and 18% of this variance (at Minutes 15 and 20, respectively) beyond the variance accounted for by age, body mass index, and VO2peak. On the other hand, Tolerance was not associ-ated with self-selected intensity, providing additional evidence for the discriminant validity of the two scales. This study was an important extension of the initial validation of the PRETIE-Q because (a) unlike the previous validation studies, it involved a middle-aged sedentary sample, and (b) it was the fi rst to demonstrate that a self-reported trait, namely preference for exercise intensity, could predict actual, physiologically defi ned exercise intensity. This element makes this one of the few studies in exercise psychology to provide reliable evidence of a relationship between a self-reported and a physiological variable.
Conclusions and Future Research Directions
The objective of the studies described herein was to develop a self-report measure of individual differences in the preference for and tolerance of exercise intensity. The end product of the 6 phases and several studies that were described was a 16-item questionnaire, named PRETIE-Q, which includes 2 factors, Prefer-
Table 4 Results of Hierarchical Multiple Regression Analyses, With FS at Minute 15 as the Dependent Variable
β p R R2change FchangeFchangeF p
Preference<VT Pre-FS .572 .002 .572 328 12.187 .002
Pre-FS .557 .002 Pref .287 .080 .640 .082 3.340 .080
@VT Pre-FS .369 .058 .369 .136 3.941 .058 Pre-FS .239 .194 Pref .425 .026 .547 .164 5.606 .026
>VT Pre-FS .025 .900 .025 .001 .016 .900 Pre-FS .025 .736 Pref –.006 .977 .026 .000 .001 .977Tolerance
<VT Pre-FS .568 .001 .568 .322 13.318 .001 Pre-FS .566 .001 Tol .080 .617 .573 .006 .255 .617
@VT Pre-FS .366 .047 .366 .134 4.325 .047 Pre-FS .297 .069 Tol .468 .006 .590 .214 8.882 .006
>VT Pre-FS .115 .547 .115 .013 .372 .547 Pre-FS .124 .485 Tol .399 .031 .415 .159 5.194 .031

368 / Ekkekakis, Hall, and Petruzzello
ence and Tolerance, consisting of 8 items each. The results of the psychometric investigations indicate that the measure exhibits simple structure, has acceptable structural validity, is internally consistent, is reliable over time, and shows promis-ing signs of construct validity.
The cornerstone of our claim for the necessity of the PRETIE-Q was the obser-vation that, although behavior (e.g., the selection of exercise intensity) and responses (e.g., affective responses to different levels of exercise intensity) in the context of exercise differ substantially between individuals, traits related to arousability and sensory modulation have not been shown to account reliably for a portion of this variability. We attributed this phenomenon to two related reasons: (a) the possibil-ity that the modulation of interoceptive sensory cues may rely on mechanisms that differ at least in part from those for exteroceptive sensory cues, and (b) the possible lack of relevance of the items in the standard self-report measures of arousability and sensory modulation to exercise-induced interoceptive cues.
This speculation appears to be supported by our fi ndings, as we noted gener-ally low correlations between the scales of the PRETIE-Q and most popular mea-sures of arousability and sensory modulation. Furthermore, although the scales of the PRETIE-Q showed consistently signifi cant correlations with the self-reported intensity of physical activity, other theoretically relevant measures such as the gen-eral-purpose scales developed by Clapper (1990), Kohn (1985), and Coren (1988, 1990) did not. To our knowledge, the development of the PRETIE-Q is the fi rst systematic effort to examine individual differences in the preference for and toler-ance of exercise intensity, and as such it is the fi rst answer to the numerous calls to investigate these potentially important infl uences on exercise behavior (American College of Sports Medicine, 2000; Dishman et al., 1994; Morgan, 1997). Therefore we believe that the PRETIE-Q does fi ll a signifi cant void in the literature.
Our postulate that Preference and Tolerance are related but distinct constructs was supported. Although the two scales were moderately correlated (typically between .40 and .50) and both were related to the self-reported intensity of habitual physical activity to an almost equal degree (.32 to .55 for Preference and .28 to .55 for Tolerance), the analyses focusing on the prediction of affective responses to different levels of exercise intensity and the prediction of self-selected intensity showed them to be separable. We postulated that (a) an intensity corresponding to VT would be close to that preferred or likely to be chosen by physically active individuals (Dishman et al., 1994; Lind et al., 2005) and (b) an intensity that exceeds VT would challenge the participants’ tolerance, as it is known to be accompanied by signifi cant decreases in pleasure and/or increases in displeasure (e.g., Ekkekakis et al., 2004). Consequently, we had hypothesized that affective responses to exer-cise performed at VT would be related to both preference and tolerance, whereas affective responses to exercise performed at an intensity exceeding VT would be related to tolerance.
The results supported these hypotheses. Although neither scale was related to affective responses to exercise undertaken at an intensity below VT, both the Preference and Tolerance scales accounted for signifi cant portions of the variance in affective valence when the intensity was at VT, while only the Tolerance scale accounted for signifi cant portions of the variance when the intensity exceeded VT. Specifi cally, Preference accounted for 22% and 19% of the variance in ratings of affective valence at Minutes 12 and 15 of the run at the VT, but only for 2% and 0% at the corresponding time points of the run above VT. Conversely, the Tolerance

Some Like It Vigorous / 369
scale accounted for 19% and 25% of the variance at Minutes 12 and 15 of the run at VT, and for 29% and 16% of the variance at the same time points of the run above VT. Likewise, in the study involving sedentary middle-aged women (Ekkekakis et al., in press), only the Preference, but not the Tolerance, scale accounted for signifi cant portions of the variance (17% and 18%) in physiologically defi ned self-selected intensity (% of oxygen uptake at VT).
Overall, the psychometric analyses did not reveal reasons for concern, and consequently we offer the PRETIE-Q to the scientifi c community for use in research and additional testing (see Appendix). Perhaps the only caveat at this stage, as we noted, is that researchers wishing to incorporate the PRETIE-Q in structural equa-tion models should consider the possible presence of correlated errors among some items (specifi ed in the section on structural validity).
There are also some limitations in the studies reported herein that future work should address. First, all but one of the studies reported here involved young, healthy, and mostly physically active college-age students. Although we tried to avoid making the items of the PRETIE-Q relevant onlyto some populations or certain modes of exercise, is should be clear that in the absence of empirical evidence, one should not assume the scales will maintain their reliability and validity when used with populations other than those used here. There-fore, we strongly recommend testing the psychometric properties of the PRETIE-Q in other populations (e.g., middle-aged and elderly, physically unfi t, low-active, previously sedentary, and patients with exercise-limiting conditions).
Second, since validation is a continuous process, we encourage researchers to continue testing the validity of the Preference and Tolerance scales by devising new methods of operationalizing preference and tolerance in the context of exercise. For example, tolerance could be operationalized as the amount of time or added workload a person can endure either in spite of a decline in affective valence or after surpassing a meaningful physiological marker (the ventilatory or lactate threshold, a respiratory exchange ratio of 1.0 or 1.1, etc.).
Pending replication of the data supporting the psychometric integrity of the PRETIE-Q, particularly among diverse populations, we envision that it could be deployed in fi tness, preventive, and rehabilitative settings as a screening device, the outcomes from which could help identify those with a predisposition toward over- or underexertion or to help tailor exercise prescriptions to the characteristics of each individual within the range of intensity that is both effective and safe. The ultimate goal of the effort initiated with the development of this questionnaire is to better understand the psychological processes leading to dropout from physical activity and, by doing so, to devise methods for reducing the rate of dropout and improving health.
References
American College of Sports Medicine (2000). ACSM’s guidelines for exercise testing and prescription (6th ed.). Philadelphia: Lippincott, Williams & Wilkins.
Barnes, G.E. (1985). The Vando R-A scale as a measure of stimulus reducing-augmenting. In J. Strelau, F.H. Farley, & A. Gale (Eds.), The biological bases of personality and behavior: Theories, measurement techniques, and development (Vol. 1; pp. 171-180). behavior: Theories, measurement techniques, and development (Vol. 1; pp. 171-180). behavior: Theories, measurement techniques, and developmentWashington, DC: Hemisphere.
Bentler, P.M. (1995). EQS structural equations program manual. Encino, CA: Multivariate Software.

370 / Ekkekakis, Hall, and Petruzzello
Bentler, P.M., & Chou, C.P. (1987). Practical issues in structural modeling. Sociological Methods and Research, 16, 78-117.
Beunen, G., & Thomis, M. (1999). Genetic determinants of sports participation and daily physical activity. International Journal of Obesity, 23(Suppl. 3), S55-S63.
Bollen, K.A. (1989). Structural equations with latent variables. New York: Wiley.Borg, G. (1998). Borg’s perceived exertion and pain scales. Champaign, IL: Human Kinetics.Browne, M.W., & Cudeck, R. (1992). Alternative ways of assessing model fi t. Sociological
Methods and Research, 21, 230-258.Byrne, B.M. (1991). The Maslach Burnout Inventory: Validating factorial structure and
invariance across intermediate, secondary, and university educators. Multivariate Behavioral Research, 26, 583-605.
Byrne, B.M. (1994). Testing for the factorial validity, replication, and invariance of a measur-ing instrument: A paradigmatic application based on the Maslach Burnout Inventory. Multivariate Behavioral Research, 29, 289-311.
Carver, C.S., & White, T.L. (1994). Behavioral inhibition, behavioral activation, and affec-tive responses to impending reward and punishment: The BIS/BAS scales. Journal of Personality and Social Psychology, 67, 319-333.
Clapper, R.L. (1990). Adult and adolescent arousal preferences: The revised Reducer-Augmenter Scale. Personality and Individual Differences, 11, 1115-1122.
Cox, K.L., Burke, V., Gorely, T.J., Beilin, L.J., & Puddey, I.B. (2003). Controlled comparison of retention and adherence in home- vs center-initiated exercise interventions in women ages 40–65 years: The S.W.E.A.T. study (Sedentary Women Exercise Adherence Trial). Preventive Medicine, 36, 17-29.
Coren, S. (1988). Prediction of insomnia from arousability predesposition scores: Scale devel-opment and cross-validation. Personality and Individual Differences, 26, 415-420.
Coren, S. (1990). The arousal predisposition scale: Normative data. Bulletin of the Psycho-nomic Society, 28, 551-552.
Costello, C.G., & Eysenck, H.J. (1961). Persistence, personality, and motivation. Perceptual and Motor Skills, 12, 169-170.
Courneya, K.S., & Hellsten, L.A.M. (1998). Personality correlates of exercise behavior, motives, barriers and preferences: An application of the Five Factor Model. Personality and Individual Differences, 24, 625-633.
Craig, A.D. (2003). A new view of pain as a homeostatic emotion. Trends in Neurosciences, 26, 303-307.
Davis, C., Cowles, M., & Kohn, P. (1983). Strength of the nervous system and augmenting-reducing: Paradox lost? Personality and Individual Differences, 4, 491-498.
Depue, R.A., & Collins, P.F. (1999). Neurobiology of the structure of personality: Dopa-mine, facilitation of incentive motivation, and extraversion. Behavioral and Brain Sciences, 22, 491-569.
Dishman, R.K. (1994). Prescribing exercise intensity for healthy adults using perceived exertion. Medicine and Science in Sports and Exercise, 26, 1087-1094.
Dishman, R.K., Armstrong, R.B., Delp, M.D., Graham, R.E., & Dunn, A.L. (1988). Open-fi eld behavior is not related to treadmill performance in exercising rats. Physiology and Behavior, 43, 541-546.
Dishman, R.K., & Buckworth, J. (1996). Increasing physical activity: A quantitative synthesis. Medicine and Science in Sports and Exercise, 28, 706-719.
Dishman, R.K., Farquhar, R.P., & Cureton, K.J. (1994). Responses to preferred intensities of exertion in men differing in activity levels. Medicine and Science in Sports and Exercise, 26, 783-790.

Some Like It Vigorous / 371
Dragutinovich, S. (1987). Stimulus intensity reducers: Are they sensation seekers, extraverts, and strong nervous types? Personality and Individual Differences, 8, 693-704.
Ekkekakis, P., Hall, E.E., & Petruzzello, S.J. (2004). Practical markers of the transition from aerobic to anaerobic metabolism during exercise: Rationale and a case for affect-based exercise prescription. Preventive Medicine, 38, 149-159.
Ekkekakis, P., Hall, E.E., Van Landuyt, L.M., & Petruzzello, S.J. (2000). Walking in (affec-tive) circles: Can short walks enhance affect? Journal of Behavioral Medicine, 23, 245-275.
Ekkekakis, P., Lind, E., & Joens-Matre, R.R. (in press). Can self-reported preference for exercise intensity predict physiologically defi ned self-selected exercise intensity? Research Quarterly for Exercise and Sport.
Ekkekakis, P., & Petruzzello, S.J. (1999). Acute aerobic exercise and affect: Current status, problems, and prospects regarding dose-response. Sports Medicine, 28, 337-374.
Eysenck, H.J. (1967). The biological basis of personality. Springfi eld, IL: C.C Thomas.Eysenck, H.J. (1983). A biometrical-genetical analysis of impulsive and sensation-seeking
behavior. In M. Zuckerman (Ed.), Biological bases of sensation seeking, impulsivity, and anxiety (pp. 1-27). Hillsdale, NJ: Erlbaum.
Eysenck, H.J. (1989). Adult Eysenck Personality Questionnaire. In L.J. Eaves, H.J. Eysenck, & N.G. Martin (Eds.), Genes, culture and personality: An empirical approach (pp. 420-423). London: Academic.
Farrell, P.A., Gates, W.K., Maksud, M.G., & Morgan, W.P. (1982). Increases in plasma β-endorphin/β-lipotropin inmmunoreactivity after treadmill running in humans. Journal of Applied Physiology, 52, 1245-1249.
Feldman, M.P. (1964). Drive level and stimulus input: An optimal stimulation approach. In H.J. Eysenck (Ed.), Experiments in motivation (pp. 118-131). New York: Macmillan.
Friedman, W.A., Garland, T., & Dohm, M.R. (1992). Individual variation in locomotor behavior and maximal oxygen consumption in mice. Physiology and Behavior, 52, 97-104.
Gelfand, S. (1964). The relationship of experimental pain tolerance to pain threshold. Cana-dian Journal of Psychology, 18, 36-42.
Gray, J.A. (1970). The psychophysiological basis of introversion-extraversion. Behaviour Research and Therapy, 8, 249-266.
Hardy, C.J., & Rejeski, W.J. (1989). Not what, but how one feels: The measurement of affect during exercise. Journal of Sport & Exercise Psychology, 11, 304-417.
Harkins, S.W., Price, D.D., & Braith, J. (1989). Effects of extraversion and neuroticism on experimental pain, clinical pain, and illness behavior. Pain, 36, 209-218.
Herzog, T.R., Williams, D.M., & Weintraub, D.J. (1985). Meanwhile, back at personality ranch: The augmenters and reducers ride again. Journal of Personality and Social Psychology, 48, 1342-1352.
Kohn, P.M. (1985). Sensation-seeking, augmenting-reducing, and strength of the nervous system. In J.T. Spence & C.E. Izard (Eds.), Motivation, emotion and personality (pp. 167-173). Amsterdam: Elsevier.
Kollenbaum, V.E., Dahme, B., & Kirchner, G. (1996). “Interoception” of heart rate, blood pressure, and myocardial metabolism during ergometric work load in healthy young subjects. Biological Psychology, 42, 183-197.
Koller, M., Haider, M., & Recher, H. (1984). Metabolic stress during different work loads as personality-related risk factor. Activitas Nervosa Superior, 26, 134-137.
Lambert, M.I., Van Zyl, C., Jaunky, R., Lambert, E.V., & Noakes, T.D. (1996). Tests of running performance do not predict subsequent spontaneous running in rats. Physiol-ogy and Behavior, 60, 171-176.

372 / Ekkekakis, Hall, and Petruzzello
Lauderdale, D.S., Fabsitz, R., Meyer, J.M., Sholinsky, P., Ramakrishnan, V., & Goldberg, J. (1997). Familial determinants of moderate and intense physical activity: A twin study. Medicine and Science in Sports and Exercise, 29, 1062-1068.
Lerman, I., Harrison, B.C., Freeman, K., Hewett, T.E., Allen, D.L., Robbins, J., & Lein-wand, L.A. (2002). Genetic variability in forced and voluntary endurance exercise performance in seven inbred mouse strains. Journal of Applied Physiology, 92, 2245-2255.
Lind, E., Joens-Matre, R.R., & Ekkekakis, P. (2005). What intensity of physical activity do previously sedentary middle-aged women select? Evidence of a coherent pattern from physiological, perceptual, and affective markers. Preventive Medicine, 40, 407-419.
Lucas, R.E., Diener, E., Grob, A., Suh, E.M., & Shao, L. (2000). Cross-cultural evidence for the fundamental features of extraversion. Journal of Personality and Social Psy-chology, 79, 452-468.
Lynn, R., & Eysenck, H.J. (1961). Tolerance for pain, extraversion and neuroticism. Per-ceptual and Motor Skills, 12, 161-162.
Maia, J.A.R., Thomis, M., & Beunen, G. (2002). Genetic factors in physical activity levels: A twin study. American Journal of Preventive Medicine, 23(Suppl. 2), 87-91.
Mayeda, A.R., & Hofstetter, J.R. (1999). A QTL for the genetic variance in free-running period and level of locomotor activity between inbred strains of mice. Behavior Genetics, 29, 171-176.
Mogil, J.S. (1999). The genetic mediation of individual differences in sensitivity to pain and its inhibition. Proceedings of the National Academy of Sciences, 96, 7744-7751.
Morgan, W.P. (1973). Psychological factors infl uencing perceived exertion. Medicine and Science in Sports, 5, 97-103.
Morgan, W.P. (1997). Methodological considerations. In W.P. Morgan (Ed.), Physical activity and mental health (pp. 3-32). Washington, DC: Taylor & Francis.
Perri, M.G., Anton, S.D., Durning, P.E., Ketterson, T.U., Sydeman, S.J., Berlant, N.E., Kanasky, W.F., Newton, R.L., Limacher, M.C., & Martin, A.D. (2002). Adherence to exercise prescriptions: Effects of prescribing moderate versus higher levels of intensity and frequency. Health Psychology, 21, 452-458.
Petrie, A. (1967). Individuality in pain and suffering. Chicago: University of Chicago Press.Phillips, J.M., & Gatchel, R.J. (2000). Extraversion-introversion and chronic pain. In R.J.
Gatchel & J.N. Weisberg (Eds.), Personality characteristics of patients with pain (pp. 181-202). Washington, DC: American Psychological Association.
Premack, D., & Schaeffer, R.W. (1963). Some parameters affecting the distributional properties of operant-level running in rats. Journal of the Experimental Analysis of Behavior, 6, 473-475.
Rhodes, J.S., Garland, T., & Gammie, S.C. (2003). Patterns of brain activity associated with variation in voluntary wheel-running behavior. Behavioral Neuroscience, 117, 1243-1256.
Robertson, R.J., Gillespie, R.L., Hiatt, E., & Rose, K.D. (1977). Perceived exertion and stimulus intensity modulation. Perceptual and Motor Skills, 45, 211-218.
Ryan, E.D., & Foster, R. (1967). Athletic participation and perceptual augmentation and reduction. Journal of Personality and Social Psychology, 6, 472-476.
Ryan, E.D., & Kovacic, C.R. (1966). Pain tolerance and athletic participation. Perceptual and Motor Skills, 22, 383-390.
Shiomi, K. (1980). Performance differences between extraverts and introverts on exercise using an ergometer. Perceptual and Motor Skills, 50, 356-358.
Simonen, R.L., Rankinen, T., Pérusse, L., Leon, A.S., Skinner, J.S., Wilmore, J.H., Rao, D.C.,

Some Like It Vigorous / 373
& Bouchard, C. (2003). A dopamine D2 receptor gene polymorphism and physical activity in two family studies. Physiology and Behavior, 78, 751-757.
Smith, L.E. (1968). Relationship between muscular fatigue, pain tolerance, anxiety, extra-version-intraversion and neuroticosm traits of college men. In G.S. Kenyon (Ed.), Contemporary psychology of sport: Proceedings of the 2nd International Congress of Sport Psychology (pp. 259-274). Chicago: Athletic Institute.
Spelman, C.C., Pate, R.R., Macera, C.A., & Ward, D.S. (1993). Self-selected exercise intensity of habitual walkers. Medicine and Science in Sports and Exercise, 25, 1174-1179.
Strelau, J. (1972). A diagnosis of temperament by nonexperimental techniques. Polish Psychological Bulletin, 3, 97-105.
Strelau, J. (1987). Personality dimensions based on arousal theories: Search for integration. In J. Strelau & H.J. Eysenck (Eds.), Personality dimensions and arousal (pp. 269-Personality dimensions and arousal (pp. 269-Personality dimensions and arousal286). New York: Plenum.
Swallow, J.G., Carter, P.A., & Garland, T. (1998). Artifi cial selection for increased wheel-running behavior in house mice. Behavior Genetics, 28, 227-237.
Vando, A. (1969). A personality dimension related to pain tolerance. Unpublished doctoral dissertation. Columbia University, New York.
Vando, A. (1974). The development of the R-A scale: A paper-and-pencil measure of pain tolerance. Personality and Social Psychology Bulletin, 1, 28-29.
Van Landuyt, L.M., Ekkekakis, P., Hall, E.E., & Petruzzello, S.J. (2000). Throwing the mountains into the lakes: On the perils of nomothetic conceptions of the exercise-affect relationship. Journal of Sport & Exercise Psychology, 22, 208-234.
Weintraub, D.J., Green, G.S., & Herzog, T.R. (1973). Kinesthetic aftereffects day by day: Trends, task features, reliable individual differences. American Journal of Psychol-ogy, 86, 827-844.
Williams, J.G., & Eston, R.G. (1986). Does personality infl uence the perception of effort? The results from a study of secondary schoolboys. Physical Education Review, 9, 94-99.
World Health Organization. (2003). Annual global Move for Health initiative: A concept paper. Geneva, Switzerland: Author.
Yeung, R.R., & Hemsley, D.R. (1997a). Personality, exercise and psychological well-being: Static relationships in the community. Personality and Individual Differences, 22, 47-53.
Yeung, R.R., & Hemsley, D.R. (1997b). Exercise behaviour in an aerobics class: The impact of personality traits and effi cacy cognitions. Personality and Individual Differences, 23, 425-431.
Zuckerman, M. (1979). Sensation seeking: Beyond the optimal level of arousal. Hillsdale, NJ: Erlbaum.
Zuckerman, M. (1990). The psychophysiology of sensation seeking. Journal of Personality, 58, 313-345.
†The peer-reviewed version of the manuscript contained additional references selected by the authors to document the points made in this section. Due to space limita-tions not all could be included here. They are available from the fi rst author upon request: [email protected]
Manuscript submitted: July 30, 2004; Revision accepted: May 29, 2005 Appendix→
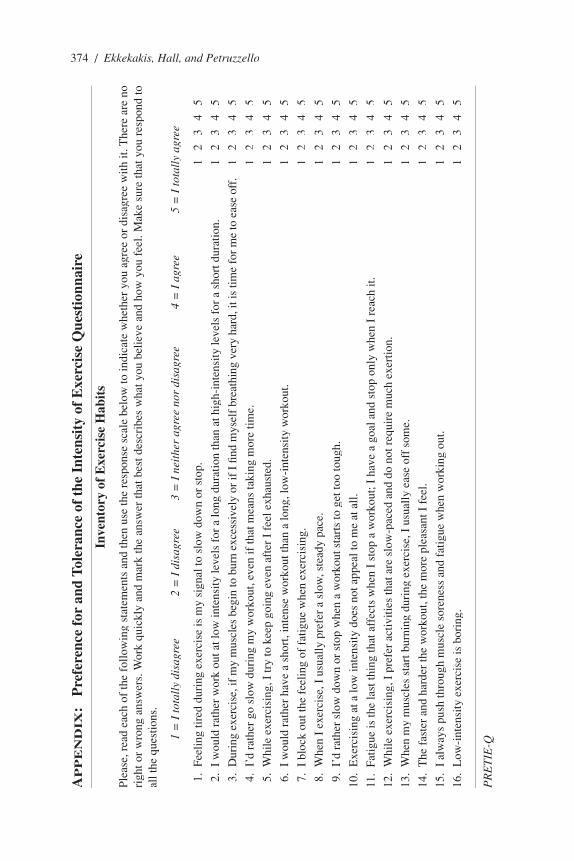
374 / Ekkekakis, Hall, and Petruzzello
AP
PE
ND
IX:
Pre
fere
nce
for
and
Tole
ranc
e of
the
Int
ensi
ty o
f E
xerc
ise
Que
stio
nnai
re
In
vent
ory
of E
xerc
ise
Hab
its
Plea
se, r
ead
each
of
the
follo
win
g st
atem
ents
and
then
use
the
resp
onse
sca
le b
elow
to in
dica
te w
heth
er y
ou a
gree
or
disa
gree
with
it. T
here
are
no
righ
t or
wro
ng a
nsw
ers.
Wor
k qu
ickl
y an
d m
ark
the
answ
er th
at b
est d
escr
ibes
wha
t you
bel
ieve
and
how
you
fee
l. M
ake
sure
that
you
res
pond
to
all t
he q
uest
ions
.
1 =
I to
tall
y di
sagr
ee2
= I
dis
agre
e3
= I
nei
ther
agr
ee n
or d
isag
ree
4 =
I a
gree
5 =
I to
tall
y ag
ree
1.
Feel
ing
tired
dur
ing
exer
cise
is m
y si
gnal
to s
low
dow
n or
sto
p.
1 2
3
4
5
2.
I w
ould
rat
her
wor
k ou
t at l
ow in
tens
ity le
vels
for
a lo
ng d
urat
ion
than
at h
igh-
inte
nsity
leve
ls f
or a
sho
rt d
urat
ion.
1
2
3 4
5
3.
Dur
ing
exer
cise
, if
my
mus
cles
beg
in to
bur
n ex
cess
ivel
y or
if I
fi nd
mys
elf
brea
thin
g ve
ry h
ard,
it is
tim
e fo
r m
e to
eas
e of
f.1
2
3 4
5
4.
I’d
rath
er g
o sl
ow d
urin
g m
y w
orko
ut, e
ven
if th
at m
eans
taki
ng m
ore
time.
1
2
3 4
5
5.
Whi
le e
xerc
isin
g, I
try
to k
eep
goin
g ev
en a
fter
I f
eel e
xhau
sted
.
1
2
3 4
5
6.
I w
ould
rat
her
have
a s
hort
, int
ense
wor
kout
than
a lo
ng, l
ow-i
nten
sity
wor
kout
.
1
2
3 4
5
7.
I bl
ock
out t
he f
eelin
g of
fat
igue
whe
n ex
erci
sing
.
1 2
3
4
5
8.
Whe
n I
exer
cise
, I u
sual
ly p
refe
r a
slow
, ste
ady
pace
.
1 2
3
4
5
9.
I’d
rath
er s
low
dow
n or
sto
p w
hen
a w
orko
ut s
tart
s to
get
too
toug
h.
1
2
3 4
5
10.
Exe
rcis
ing
at a
low
inte
nsity
doe
s no
t app
eal t
o m
e at
all.
1
2
3 4
5
11.
Fatig
ue is
the
last
thin
g th
at a
ffec
ts w
hen
I st
op a
wor
kout
; I h
ave
a go
al a
nd s
top
only
whe
n I
reac
h it.
1
2
3 4
5
12.
Whi
le e
xerc
isin
g, I
pre
fer
activ
ities
that
are
slo
w-p
aced
and
do
not r
equi
re m
uch
exer
tion.
1 2
3
4
5
13.
Whe
n m
y m
uscl
es s
tart
bur
ning
dur
ing
exer
cise
, I u
sual
ly e
ase
off
som
e.
1
2
3 4
5
14.
The
fas
ter
and
hard
er th
e w
orko
ut, t
he m
ore
plea
sant
I f
eel.
1 2
3
4
5
15.
I al
way
s pu
sh th
roug
h m
uscl
e so
rene
ss a
nd f
atig
ue w
hen
wor
king
out
.
1 2
3
4
5
16.
Low
-int
ensi
ty e
xerc
ise
is b
orin
g.
1
2
3 4
5
PR
ET
IE-Q