measuring individual differences in statistical … individual differences in statistical learning:...
TRANSCRIPT
Measuring individual differences in statistical learning:Current pitfalls and possible solutions
Noam Siegelman1& Louisa Bogaerts2 & Ram Frost1,3,4
Published online: 4 March 2016# Psychonomic Society, Inc. 2016
Abstract Most research in statistical learning (SL) has fo-cused on the mean success rates of participants in detectingstatistical contingencies at a group level. In recent years, how-ever, researchers have shown increased interest in individualabilities in SL, either to predict other cognitive capacities or asa tool for understanding the mechanism underlying SL. Mostif not all of this research enterprise has employed SL tasks thatwere originally designed for group-level studies. We arguethat from an individual difference perspective, such tasks arepsychometrically weak, and sometimes even flawed. In par-ticular, the existing SL tasks have three major shortcomings:(1) the number of trials in the test phase is often too small (or,there is extensive repetition of the same targets throughout thetest); (2) a large proportion of the sample performs at chancelevel, so that most of the data points reflect noise; and (3) thetest items following familiarization are all of the same typeand an identical level of difficulty. These factors lead to highmeasurement error, inevitably resulting in low reliability, andthereby doubtful validity. Here we present a novel methodspecifically designed for the measurement of individual dif-ferences in visual SL. The novel task we offer displays sub-stantially superior psychometric properties. We report data
regarding the reliability of the task and discuss the importanceof the implementation of such tasks in future research.
Keywords Statistical learning . Individual differences .
Psychometrics
Statistical learning (SL), the ability to extract the distributionalproperties of sensory input across time and space, is taken to bethe main mechanism by which cognitive systems discover theunderlying regularities of their environments. Starting from theseminal work of Saffran and her colleagues (Saffran, Aslin, &Newport, 1996), a large number of studies have unequivocallydemonstrated a remarkable ability of humans to detect subtledifferences in the transitional probabilities embedded in a con-tinuous input, whether it is auditory (Endress & Mehler, 2009)or visual (Kirkham, Slemmer, & Johnson, 2002), verbal(Pelucchi, Hay, & Saffran, 2009) or nonverbal (Gebhart,Newport, & Aslin, 2009), comprising adjacent or nonadjacentcontingencies (Gómez, 2002; Newport & Aslin, 2004), with-out overt attention (Evans, Saffran, & Robe-Torres, 2009), andfrom a very early age (as young as 1- to 3-day-old newborns;Bulf, Johnson, & Valenza, 2011). The common aim of all ofthese important studies has been to show that the often com-plex distributional properties of a given input can indeed beextracted and learned, shaping behavior (see Erickson &Thiessen, 2015; Thiessen, Kronstein, & Hufnagle, 2013, forreviews). From an operational perspective, this end wasachieved by demonstrating that the mean success rate of thesampled participants in detecting a variety of statistical contin-gencies is significantly above chance.
In recent years, however, there has been substantial theoret-ical interest in individual capacities of SL. In general, re-searchers have focused on individual rather than group-levelperformance to achieve one of two goals. The first is to use SL
* Noam [email protected]
1 Department of Psychology, Hebrew University of Jerusalem, MountScopus, Jerusalem 91905, Israel
2 Department of Psychology, Ghent University, Ghent, Belgium3 Basque Center of Cognition, Brain and Language (BCBL), San
Sebastian, Spain4 Haskins Laboratories, New Haven, CT, USA
Behav Res (2017) 49:418–432DOI 10.3758/s13428-016-0719-z

ability to predict a range of related cognitive capacities (mostnotably, linguistic functions), thereby demonstrating a theoret-ical link between SL and these functions. In this vein, perfor-mance in implicit artificial grammar learning (AGL) tasks wasshown to predict sentence comprehension (Misyak &Christiansen, 2012), the processing of relative-clause sentenceswith long-distance dependencies (Misyak, Christiansen, &Tomblin, 2010), and speech perception abilities (Conway,Bauernschmidt, Huang, & Pisoni, 2010; Conway, Karpicke,& Pisoni, 2007). Similarly, visual SL has been demonstratedto predict reading abilities in one’s first language (L1; Arciuli& Simpson, 2012), as well as literacy acquisition in a secondlanguage (L2; Frost, Siegelman, Narkiss, & Afek, 2013), andauditory SL was found to predict lexical and oral languageskills in the L1 (Mainela-Arnold & Evans, 2014; Singh,Steven Reznick, & Xuehua, 2012; Spencer, Kaschak, Jones,& Lonigan, 2014). A second approach to the study of individ-ual differences stems from the assumption that understandingthe source of such differences in SL holds the promise ofrevealing critical insight regarding the cognitive operationsunderlying its mechanisms, leading to deeper comprehensionof what SL capacity could predict and why (see Frost,Armstrong, Siegelman, & Christiansen, 2015, for atheoretical discussion). For example, researchers have recentlyinvestigated individual performance in SL to examine the rolesof explicit versus implicit knowledge (Batterink, Reber,Neville, & Paller, 2015; Bertels, Boursain, Destrebecqz, &Gaillard, 2014; Bertels, Franco, & Destrebecqz, 2012; Kim,Seitz, Feenstra, & Shams, 2009), the relation between differenttypes of computations in SL (Romberg & Saffran, 2013), andthe impact of input modality (Siegelman & Frost, 2015), aswell as to pinpoint the neurocircuitry involved in the detectionof regularities (Karuza et al., 2013; Turk-Browne, Scholl,Chun, & Johnson, 2009).
Although these studies have targeted individual differ-ences as their main interest, they have all employed theoriginal tasks that were designed for group-level explora-tions, with little to no modification (but see Bertels et al.,2014, and Bertels et al., 2012, for task modifications).Note that this same trend has been revealed across othertypes of implicit-learning paradigms, so that tasks de-signed to show learning at the group level are used toprobe individual capacities (i.e., AGL, Conway et al.,2010; a serial reaction time task, Kaufman et al., 2010;or Hebbian repetition learning, Mosse & Jarrold, 2008).Here we raise a critical methodological concern: Althoughall of the tasks reported here have advanced us consider-ably in understanding the promise of SL as a theoreticalconstruct, they are not suited to study and measure indi-vidual differences, because they are psychometricallyweak, and from this perspective they are sometimes evenflawed. The concern we raise is not simply methodologi-cal; rather, it is deeply theoretical. Psychometric
considerations require any task to display a series of im-portant criteria. These include (among others), a largeenough variance of the output scores, split-half reliability,test–retest reliability, and internal validity. If these criteriaare not met, the task cannot reliably predict other capac-ities, and this raises doubts regarding its predictive valid-ity. In a nutshell, if a task does not reliably tap the theo-retical construct it is supposed to tap (in our case, a pos-tulated individual capacity in SL), its explanatory adequa-cy remains empty.
To explicate these concerns in detail, in the following sec-tions we will focus on the popular visual statistical learning(VSL) task that has served many recent individual differencesstudies, including our own (Frost et al., 2013). This task istaken, however, simply as a token example to make a moregeneral point, common to many other experimental tasks re-cently employed for the study of individual differences.
The visual statistical learning task (VSL): A test case
A popular test of SL performance in the visual modality hasemployed a sequential stream of meaningless shapes with ad-jacent contingencies to demonstrate the general ability of pick-ing up regularities in the visual modality (e.g., Emberson,Conway, & Christiansen, 2011; Glicksohn & Cohen, 2013;Kirkham et al., 2002; Turk-Browne, Junge, & Scholl, 2005).Similar to most SL tasks, the VSL task includes a familiariza-tion phase that is immediately followed by a test phase. In thecommon variant of the VSL task (e.g., Frost et al., 2013),familiarization includes 24 abstract shapes (but some haveused 12 shapes only), such as those presented in Fig. 1.Unbeknownst to participants, the shapes are organized intoeight triplets, all with transitional probabilities (TPs) of 1.These triplets are then repeatedly presented during familiariza-tion, which usually spans about 10min (with the constraint thatthe same triplet cannot be immediately repeated). Since theinput appears as a continuous stream, the only source of infor-mation regarding its triplet composition lies in the statisticalproperties of the shapes in the sequence (TPs of the shapes
Fig. 1 Example shapes for standard visual statistical learning (VSL)tasks
Behav Res (2017) 49:418–432 419

within a triplet are 1, whereas the TPs of shapes between trip-lets are 1/7). Following familiarization, the test phase begins. Itconsists of a series of two-alternative forced choice (2AFC)trials, each contrasting one of the triplets presented duringlearning and one Bfoil^—a group of three shapes that neverappeared together in the familiarization phase (TPs = 0). Ineach trial of the test, one foil and one triplet are presented,and participants are asked to decide which group of shapesappears more familiar, given the stream they have seen.
In recent years, this popular task was borrowed with littlemodification to serve as an individual measure of one’s visualSL ability, mainly to predict other cognitive functions such L1literacy (Arciuli & Simpson, 2012), L2 literacy (Frost et al.,2013), implicit RT-basedmeasures (Bertels et al., 2014; Bertelset al., 2012), auditory SL abilities (Siegelman & Frost, 2015),and so forth. Given these objectives, we will now consider thistask from a psychometric perspective and outline its criticalshortcomings for studying individual differences.
Psychometric shortcomings
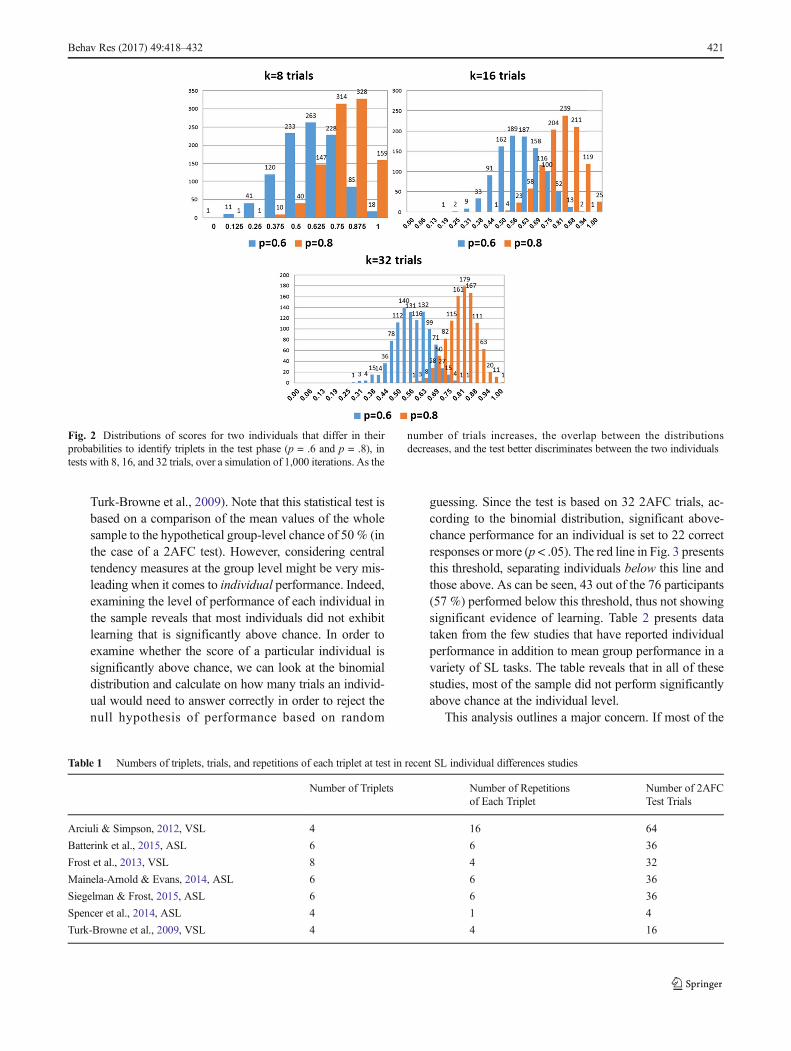
a. Number of trials in the test phase The first dimension toconsider is the number of trials employed in the test phaseto assess individual learning following familiarization.Given memory constraints, the number of triplets in thefamiliarization phase of SL tasks is relatively small, usu-ally set to eight triplets (but sometimes even to four; e.g.,Arciuli & Simpson, 2012). Hence, unless triplets are re-peated, the test phase would involve four to eight binarydecisions. However, psychometrical considerations in in-dividual differences studies require a significantly largernumber of trials, to increase the resolution of the measureand to allow for larger variance within the sample, therebyreducing measurement error. Figure 2 presents a simula-tion of two individuals, A and B, who differ in their sen-sitivities to TPs (see Frost et al., 2015, for discussion). Theprobability of individual A in detecting a triplet in thestream is set to .6, whereas that of individual B is set to.8. The figure demonstrates the extent of separability ofthe distributions of correct responses, that belonging toindividual A and that belonging to individual B, whenthe test phase comprises 4, 8, 16, or 32 2AFC trials (k =1,000 samples). It is evident that the number of 2AFCtrials in the test phase is critical for discerning the twoindividuals. For example, if the obtained test score of in-dividual B (who has a .8 chance to answer correctly oneach question) is, say, 75 % correct responses, the proba-bility of correctly identifying him/her by his/her score in atest comprising eight trials is p = .58 [i.e., P(B) / {P(B) +P(A)} = 314/542], whereas the probability of falsely iden-tifying individual A is p = .42 (228/542). However, if thesame two individuals are tested with 32 2AFC trials, the
chances of correctly identifying individual B increase to.87, whereas the chances of falsely identifying individualA decrease to .13. Perhaps unaware of this problem, re-searchers in some recent studies have used as few as fourtest trials (e.g., Spencer et al., 2014) to predict individualabilities. Our simple simulation demonstrates that correla-tions obtained in such studies are most probably spurious,reflecting noise. Consequently, the theoretical conclusionthat success in the task is related to a given cognitiveability is simply unwarranted.
A possible solution for this problem is to introduce intothe test phase several repeated, 2AFC trials in which thesame triplet is contrasted with different or repeated foils.Indeed, this is the solution that most individual differencesstudies in SL have used to date. Table 1 presents the num-ber of patterns, number of repetitions, and number of trialsemployed in some recent studies. As can be seen, moststudies have extensively repeated the same triplets in mul-tiple trials during test, with as many as 16 repetitions ofonly four triplets, aiming for a test with 64 items (Arciuli& Simpson, 2012). This solution, however, does not comewithout a cost. With extensive repetitions, performance inthe test intermixes the learning of the initial stream withmemory of items reappearing again and again in the testphase, introducing other sources of noise in the measure-ment. With extensive repetitions it is not evident whetherthe score obtained in the test phase reflects learning of theoriginal stream or episodic memory of the previous re-sponses that were given to the same triplet during the test.This leads us, then, to our first conclusion: A good test ofindividual differences must have a large number of trials,but a minimal number of repetitions.
b. Chance-level performance for most of the sampleAnother critical shortcoming of the VSL task (and evenmore so in other current SL tasks) is that a large propor-tion of the sample performs at chance level. This problemis underemphasized, since most studies of SL report themean group performance, showing that it is significantlyabove chance, without reporting the individualscatterplots. However, from an individual differences per-spective, if many participants in the sample perform atchance, even if the mean group performance is abovechance, a large proportion of data points in the samplereflect simple noise in terms of their predictive validity.Figure 3 presents an individual performance histogram inthe VSL task with a relatively large sample of participants(n = 76, 32 trials in the test) from a recent study(Siegelman & Frost, 2015). The mean performance ofthe sample is 67 %, significantly better than chance(50 %) at the group level [t(75) = 8.84, p < .001], repli-cating many studies that have used this task (e.g., Arciuli,von Koss Torkildsen, Stevens, & Simpson, 2014;Glicksohn & Cohen, 2013; Turk-Browne et al., 2005;
420 Behav Res (2017) 49:418–432
Turk-Browne et al., 2009). Note that this statistical test isbased on a comparison of the mean values of the wholesample to the hypothetical group-level chance of 50 % (inthe case of a 2AFC test). However, considering centraltendency measures at the group level might be very mis-leading when it comes to individual performance. Indeed,examining the level of performance of each individual inthe sample reveals that most individuals did not exhibitlearning that is significantly above chance. In order toexamine whether the score of a particular individual issignificantly above chance, we can look at the binomialdistribution and calculate on how many trials an individ-ual would need to answer correctly in order to reject thenull hypothesis of performance based on random
guessing. Since the test is based on 32 2AFC trials, ac-cording to the binomial distribution, significant above-chance performance for an individual is set to 22 correctresponses or more (p < .05). The red line in Fig. 3 presentsthis threshold, separating individuals below this line andthose above. As can be seen, 43 out of the 76 participants(57 %) performed below this threshold, thus not showingsignificant evidence of learning. Table 2 presents datataken from the few studies that have reported individualperformance in addition to mean group performance in avariety of SL tasks. The table reveals that in all of thesestudies, most of the sample did not perform significantlyabove chance at the individual level.
This analysis outlines a major concern. If most of the
Fig. 2 Distributions of scores for two individuals that differ in theirprobabilities to identify triplets in the test phase (p = .6 and p = .8), intests with 8, 16, and 32 trials, over a simulation of 1,000 iterations. As the
number of trials increases, the overlap between the distributionsdecreases, and the test better discriminates between the two individuals
Table 1 Numbers of triplets, trials, and repetitions of each triplet at test in recent SL individual differences studies
Number of Triplets Number of Repetitionsof Each Triplet
Number of 2AFCTest Trials
Arciuli & Simpson, 2012, VSL 4 16 64
Batterink et al., 2015, ASL 6 6 36
Frost et al., 2013, VSL 8 4 32
Mainela-Arnold & Evans, 2014, ASL 6 6 36
Siegelman & Frost, 2015, ASL 6 6 36
Spencer et al., 2014, ASL 4 1 4
Turk-Browne et al., 2009, VSL 4 4 16
Behav Res (2017) 49:418–432 421

sample does not show significant evidence of learning,the variance in performance of this part of the samplemay be driven by random guess, leading to spurious cor-relations with the cognitive measures that SL is supposedto predict. In other words, the existing tasks provide reli-able information for the higher (and smaller) part of thedistribution of individuals’ performance, whereas thelower (and larger) part of the distribution most likely re-flects noise. This leads us to our second conclusion: SLtasks must be designed so they provide information forlarger portions of the sample to enable reliable measure-ments of performance.
c. All test items are of the same type and same level ofdifficulty The test phases inmost existing SL tasks includea few dozen 2AFC trials (but see, for example, Bertelset al., 2014, and Bertels et al., 2012, for tests with 4AFCtrials only), each contrasting a Breal^ triplet from thelearning phase (TPs of shapes typically set to 1.0) and afoil (TPs of shapes typically set to 0.0). Thus, the testphase comprises multiple items measuring the same typeof knowledge, with the same level of difficulty. This leadsto two psychometric problems, one that is theoretical, andone that is statistical.
From a theoretical perspective, repeating items of the sametype constrains the test to tap only a small part of the measuredability. To best exemplify this problem, we draw on facettheory (a systematic approach to theory construction anddata collection for complex, multifaceted constructs; see,e.g., Shye, Elizur, & Hoffman, 1994) and phrase the followingmapping sentence to describe the range of measurement of thecurrent VSL task: The VSL task measures the ability torecognize sequences of triplets, of TP = 1, from foils ofTP = 0, without violation of positions. This mapping sentencehighlights the limited range of computations that are assessedby the existing VSL task. Visual SL as a theoretical constructnaturally involves a wide scope of potential computations(e.g., production as well as recognition, contingencies of se-quences of different lengths rather than triplets only, sensitiv-ity to a range of quasiregularities rather than sensitivity to fullregularity, graded sensitivity to violations of positions in thefoils, etc.). Consequently, the test should be able to tap a largeportion of the ability range, and this can be done only byincluding items that will expand the mapping sentence. Forexample, a comprehensive VSL task should have in its testphase items that involve the production of learned patterns(rather than recognition only), with both pairs and triplets astargets (instead of just triplets), with a range of TPs of thetriplets and foils (instead of a set value across all items), withand without violation of positions in the foils, and so forth.This leads us to our third criterion: SL tests must be designedso they provide better coverage of the measured ability.
The statistical concern of using a test that comprises itemswith the same properties and level of difficulty stems fromitem response theory (IRT; e.g., Embretson & Reise, 2000).In IRT, each test item is characterized by its item responsefunction. Figure 4 presents an example of such a theoreticalcurve. The figure depicts the expected probability to answercorrectly for a given item i, as a function of the theoreticalconstruct that is measured by the test. The most commonmodel in IRT is the three-parametric logistic model, first de-veloped by Birnbaum (1968), in which the item responsefunction is derived from three parameters: (1) the discrimina-tion index of the item (the maximal slope of the function), (2)
Fig. 3 Performance histogram of n = 76 participants in a VSL task, fromSiegelman and Frost (2015). The red line depicts the individual chance-level threshold—that is, the number of correct trials needed for a givenindividual to show learning
Table 2 Numbers of participants significantly above chance at the individual level in published studies that have reported individual performance. Ascan be seen, most participants do not display evidence of learning
Number of Participants Number of Participants SignificantlyAbove Chance at the IndividualLevel (%)
Endress & Mehler, 2009; Exp. 2; ASL 14 3 (21 %)
Frost et al., 2013, VSL 27 13 (48 %)
Misyak & Christiansen, 2012, AGL 30 8 (27 %)
Saffran, Newport, Aslin, Tunick, & Barrueco, 1997, Exp. 1, ASL 24 (12 adults, 12 children) 8 (33 %)
Saffran, Johnson, Aslin, & Newport, 1999, ASL 35 17 (47 %)
422 Behav Res (2017) 49:418–432

the item difficulty (the point on the x-axis with the maximalfunction slope), and (3) chance-level performance (the inter-cept; i.e., the probability of answering correctly with minimalability in the construct). According to IRT, a given item pro-vides information about performance only in areas of the dis-tribution where the slope is larger than zero. For example, theitem in Fig. 4 does not provide any information for individualperformance in areas less than or more than 1.5 standard de-viations from the population mean performance, and it cannotdiscriminate between participants in these ranges of ability.
Since all items in current SL tasks share the same propertiesand the same level of difficulty, they all provide informationregarding the same area of the distribution. This leaves theupper and lower parts of the distribution to reflect mostlynoise: Low-level statistical learners cannot answer any of theitems correctly (aside from chance success), and therefore areindistinguishable from one another. Similarly, high-level sta-tistical learners can answer all items correctly, and are againindistinguishable from one another. This noise inevitably in-creases measurement error and reduces the task’s reliability.Note that current SL tasks stand in contrast to most standardcognitive tests, such as IQ or working memory, in which thetest items are specifically set to represent a wide range ofdifficulty, thereby maximizing discrimination between indi-viduals and increasing the test’s reliability. This leads us toour fourth criterion: A good task should provide informationacross most parts of the distribution. This can be achievedonly by varying the levels of difficulty of the items in the test.
In a recent investigation, Siegelman and Frost (2015) ex-amined the test–retest reliability of the VSL task (as well as ofother tasks routinely employed in SL literature), reporting rel-atively mediocre scores (r = .58 for VSL, r = .6 for auditorySL, whereas reliability coefficients in psychological measure-ment are typically about r = .8: Nunnally & Bernstein, 1994).
Although this provides preliminary evidence that SL is a sta-ble and reliable capacity of an individual, the tasks clearlyleave a lot to be desired in terms of their psychometric prop-erties. Further analysis of the VSL task reveals a split-halfreliability of .64 (.76, Spearman–Brown corrected), and aCronbach’s alpha coefficient of .75, which is yet again belowstandards (e.g., Raven’s Advanced Progressive Matrices havea test–retest reliability of .91 and an alpha of .86; Raven,Court, & Raven, 1992). The other SL tasks examined in thisstudy did not fare better. Given our theoretical discussion sofar, this should not come as a surprise.
This brings us to the initial discussion of SL as a theoreticalconstruct. SL is taken to underlie a wide range of sensory,motor, and cognitive abilities, and it plays key roles in seg-mentation, discrimination, prediction, and categorization.Unsurprisingly, since these are fundamental functions, SL iscurrently attracting much attention, similar to the g factor de-cades ago. Mapping SL as an individual capacity is becoming,then, a major theoretical challenge for cognitive and educa-tional science. However, success in this research enterpriserequires an infrastructure of psychometrically valid and reli-able SL tasks. This is the goal of the present research.
Toward bettermeasurement of individual differencesin SL: Blueprints for new SL tasks
In this study, we aimed to develop a new, better, and morereliable SL task. We did so by dealing directly with the psy-chometric shortcomings described above. To preview ourfindings, we show that we can reduce noise and maximizetask sensitivity by increasing the number of items in the testwhile minimizing the number of repeated items across trials.Second, we show that by including items of different difficul-ties and of different types, we can improve discriminationbetween participants and cover a wider range of SL abilities.Third, by Bpushing^ more of the population above chance-level performance, we demonstrate how information regard-ing a larger part of the distribution can be obtained.
The new VSL
The new visual SL task includes 16 complex visual shapes(taken from Fiser & Aslin, 2001; see Appendix A). As incurrent SL tasks, the task includes two parts: a familiarizationphase followed by a test phase.
Prior to familiarization, the 16 shapes (hereinafter labeledwith the numbers 1 to 16) are randomly organized for eachparticipant into eight triplets. In contrast to current SL tasks,the eight triplets are not all similar in terms of their TPs, butrather are of two subtypes: (1) four triplets with TPs = .33(made from four shapes: 1–2–3, 2–1–4, 4–3–1, and 3–4–2)
Fig. 4 Item response function for a hypothetical item. The x-axisrepresents the ability in the measured construct, and the y-axis depictsthe expected probability to answer correctly on this specific item. Thecenter square highlights the region where the item is informative anddiscriminative, whereas the adjacent rectangles marks the regions of thedistribution in which the item is not informative
Behav Res (2017) 49:418–432 423
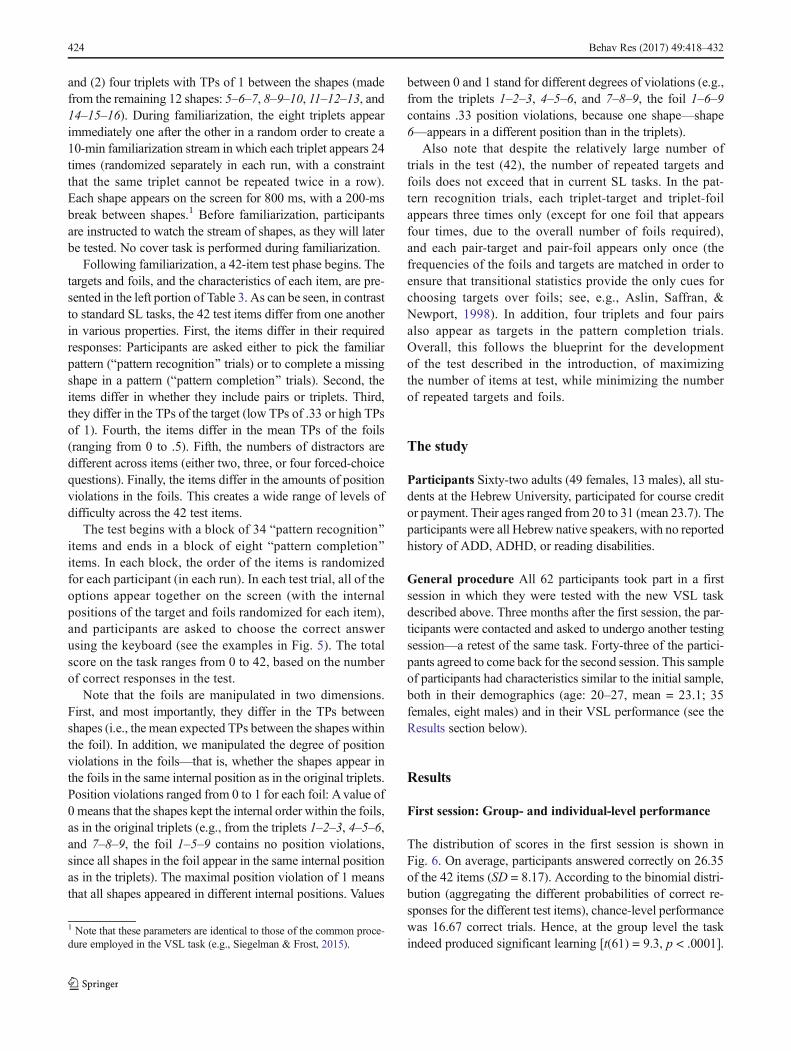
and (2) four triplets with TPs of 1 between the shapes (madefrom the remaining 12 shapes: 5–6–7, 8–9–10, 11–12–13, and14–15–16). During familiarization, the eight triplets appearimmediately one after the other in a random order to create a10-min familiarization stream in which each triplet appears 24times (randomized separately in each run, with a constraintthat the same triplet cannot be repeated twice in a row).Each shape appears on the screen for 800 ms, with a 200-msbreak between shapes.1 Before familiarization, participantsare instructed to watch the stream of shapes, as they will laterbe tested. No cover task is performed during familiarization.
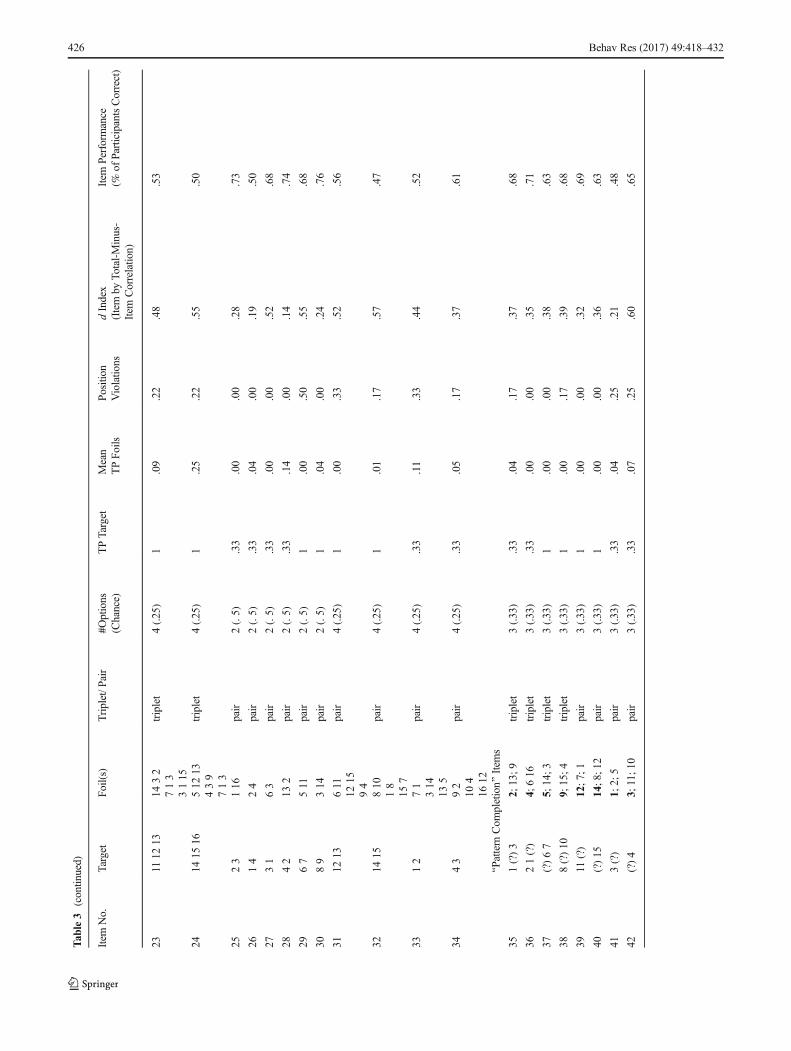
Following familiarization, a 42-item test phase begins. Thetargets and foils, and the characteristics of each item, are pre-sented in the left portion of Table 3. As can be seen, in contrastto standard SL tasks, the 42 test items differ from one anotherin various properties. First, the items differ in their requiredresponses: Participants are asked either to pick the familiarpattern (Bpattern recognition^ trials) or to complete a missingshape in a pattern (Bpattern completion^ trials). Second, theitems differ in whether they include pairs or triplets. Third,they differ in the TPs of the target (low TPs of .33 or high TPsof 1). Fourth, the items differ in the mean TPs of the foils(ranging from 0 to .5). Fifth, the numbers of distractors aredifferent across items (either two, three, or four forced-choicequestions). Finally, the items differ in the amounts of positionviolations in the foils. This creates a wide range of levels ofdifficulty across the 42 test items.
The test begins with a block of 34 Bpattern recognition^items and ends in a block of eight Bpattern completion^items. In each block, the order of the items is randomizedfor each participant (in each run). In each test trial, all of theoptions appear together on the screen (with the internalpositions of the target and foils randomized for each item),and participants are asked to choose the correct answerusing the keyboard (see the examples in Fig. 5). The totalscore on the task ranges from 0 to 42, based on the numberof correct responses in the test.
Note that the foils are manipulated in two dimensions.First, and most importantly, they differ in the TPs betweenshapes (i.e., the mean expected TPs between the shapes withinthe foil). In addition, we manipulated the degree of positionviolations in the foils—that is, whether the shapes appear inthe foils in the same internal position as in the original triplets.Position violations ranged from 0 to 1 for each foil: Avalue of0 means that the shapes kept the internal order within the foils,as in the original triplets (e.g., from the triplets 1–2–3, 4–5–6,and 7–8–9, the foil 1–5–9 contains no position violations,since all shapes in the foil appear in the same internal positionas in the triplets). The maximal position violation of 1 meansthat all shapes appeared in different internal positions. Values
between 0 and 1 stand for different degrees of violations (e.g.,from the triplets 1–2–3, 4–5–6, and 7–8–9, the foil 1–6–9contains .33 position violations, because one shape—shape6—appears in a different position than in the triplets).
Also note that despite the relatively large number oftrials in the test (42), the number of repeated targets andfoils does not exceed that in current SL tasks. In the pat-tern recognition trials, each triplet-target and triplet-foilappears three times only (except for one foil that appearsfour times, due to the overall number of foils required),and each pair-target and pair-foil appears only once (thefrequencies of the foils and targets are matched in order toensure that transitional statistics provide the only cues forchoosing targets over foils; see, e.g., Aslin, Saffran, &Newport, 1998). In addition, four triplets and four pairsalso appear as targets in the pattern completion trials.Overall, this follows the blueprint for the developmentof the test described in the introduction, of maximizingthe number of items at test, while minimizing the numberof repeated targets and foils.
The study
Participants Sixty-two adults (49 females, 13 males), all stu-dents at the Hebrew University, participated for course creditor payment. Their ages ranged from 20 to 31 (mean 23.7). Theparticipants were all Hebrew native speakers, with no reportedhistory of ADD, ADHD, or reading disabilities.
General procedure All 62 participants took part in a firstsession in which they were tested with the new VSL taskdescribed above. Three months after the first session, the par-ticipants were contacted and asked to undergo another testingsession—a retest of the same task. Forty-three of the partici-pants agreed to come back for the second session. This sampleof participants had characteristics similar to the initial sample,both in their demographics (age: 20–27, mean = 23.1; 35females, eight males) and in their VSL performance (see theResults section below).
Results
First session: Group- and individual-level performance
The distribution of scores in the first session is shown inFig. 6. On average, participants answered correctly on 26.35of the 42 items (SD = 8.17). According to the binomial distri-bution (aggregating the different probabilities of correct re-sponses for the different test items), chance-level performancewas 16.67 correct trials. Hence, at the group level the taskindeed produced significant learning [t(61) = 9.3, p < .0001].
1 Note that these parameters are identical to those of the common proce-dure employed in the VSL task (e.g., Siegelman & Frost, 2015).
424 Behav Res (2017) 49:418–432

Tab
le3
Summaryof
the42
testitemsof
thenewVSL
task
(datafrom
thefirstadm
inistrationof
thetask
only).The
leftsectionof
thetabledepictsthetargetsandfoils
(eachshapeisrepresentedby
anumberfrom1to16)and
thevariouspropertiesof
each
item(itemsexam
iningknow
ledgeof
pairs/triplets;num
bero
foptions
inquestio
n;transitio
nprobability(TP)
ofthetarget;m
eanTPof
thefoils;and
degree
ofpositio
nviolations).The
rightsectio
nof
thetableshow
sthediscriminationindex,as
wellastheperformance
rate(percentageof
participantscorrecto
neach
item)
Item
No.
Target
Foil(s)
Triplet/P
air
#Options
(Chance)
TPTarget
Mean
TPFoils
Position
Violatio
nsdIndex
(Itemby
Total-Minus-
Item
Correlatio
n)
Item
Performance
(%of
ParticipantsCorrect)
BPattern
Recognitio
n^Item
s
1123
213
8triplet
2(.5)
.33
.00
.67
.40
.66
2214
124
triplet
2(.5)
.33
.19
.00
.22
.39
3431
439
triplet
2(.5)
.33
.17
.00
.26
.77
4342
713
triplet
2(.5)
.33
.09
.33
.25
.77
5567
9511
triplet
2(.5)
1.00
1.00
.49
.68
68910
1611
6triplet
2(.5)
1.07
1.00
.43
.73
711
1213
14610
triplet
2(.5)
1.00
.00
.35
.77
814
1516
3115
triplet
2(.5)
1.17
.67
.37
.73
9123
1514
triplet
2(.5)
.33
.02
.33
.35
.63
10214
14610
triplet
2(.5)
.33
.00
.00
.46
.68
11431
284
triplet
2(.5)
.33
.00
.33
.44
.63
12342
1611
6triplet
2(.5)
.33
.07
1.00
.16
.81
13567
1432
triplet
2(.5)
1.02
.00
.34
.76
148910
512
13triplet
2(.5)
1.50
.00
.31
.63
1511
1213
124
triplet
2(.5)
1.19
.00
.14
.63
1614
1516
16710
triplet
2(.5)
1.00
.67
.42
.73
17123
9511
284
1432
triplet
4(.25)
.33
.01
.44
.19
.53
18214
9511
1611
6124
triplet
4(.25)
.33
.09
.67
.37
.34
19431
16710
213
8284
triplet
4(.25)
.33
.00
.56
.45
.56
20342
512
1315
14
3115
triplet
4(.25)
.33
.28
.22
.23
.47
21567
16710
14610
213
8
triplet
4(.25)
1.00
.44
.51
.52
228910
124
439
1514
triplet
4(.25)
1.18
.11
.27
.53
Behav Res (2017) 49:418–432 425
Tab
le3
(contin
ued)
Item
No.
Target
Foil(s)
Triplet/P
air
#Options
(Chance)
TPTarget
Mean
TPFoils
Position
Violatio
nsdIndex
(Itemby
Total-Minus-
Item
Correlatio
n)
Item
Performance
(%of
ParticipantsCorrect)
2311
1213
1432
713
3115
triplet
4(.25)
1.09
.22
.48
.53
2414
1516
512
13439
713
triplet
4(.25)
1.25
.22
.55
.50
2523
116
pair
2(.5)
.33
.00
.00
.28
.73
2614
24
pair
2(.5)
.33
.04
.00
.19
.50
2731
63
pair
2(.5)
.33
.00
.00
.52
.68
2842
132
pair
2(.5)
.33
.14
.00
.14
.74
2967
511
pair
2(.5)
1.00
.50
.55
.68
3089
314
pair
2(.5)
1.04
.00
.24
.76
3112
13611
1215
94
pair
4(.25)
1.00
.33
.52
.56
3214
15810
18
157
pair
4(.25)
1.01
.17
.57
.47
3312
71
314
135
pair
4(.25)
.33
.11
.33
.44
.52
3443
92
104
1612
pair
4(.25)
.33
.05
.17
.37
.61
BPattern
Com
pletion^
Item
s
351(?)3
2;13;9
triplet
3(.33)
.33
.04
.17
.37
.68
3621(?)
4;616
triplet
3(.33)
.33
.00
.00
.35
.71
37(?)67
5;14;3
triplet
3(.33)
1.00
.00
.38
.63
388(?)10
9;15;4
triplet
3(.33)
1.00
.17
.39
.68
3911
(?)
12;7
;1pair
3(.33)
1.00
.00
.32
.69
40(?)15
14;8
;12
pair
3(.33)
1.00
.00
.36
.63
413(?)
1;2;
5pair
3(.33)
.33
.04
.25
.21
.48
42(?)4
3;11;1
0pair
3(.33)
.33
.07
.25
.60
.65
426 Behav Res (2017) 49:418–432

However, as we noted above, from a psychometric perspec-tive, a critical measure is the number of participants who per-form above chance, not the mean performance of the sample.We therefore calculated the individual chance level, which isthe number of trials on which a given participant would needto answer correctly in order to show above-chance perfor-mance at an individual level. We calculated this individualthreshold using a computer simulation of 10,000 iterations2
and found that correct responses on 23 trials or more wouldpresent significant evidence of learning with an alpha of 5 %(i.e., fewer than 5 % of the iterations had a score of 23 ormore). As is shown in Fig. 6, 37 out of the 62 participants(60 %) performed above this threshold. This represents animportant increase in the participants who performed signifi-cantly above chance (about 40 % only in the original VSLtask, as reported by Siegelman & Frost, 2015).
Reliability and internal consistency
To examine the internal reliability and consistency of the ob-tained scores, we calculated the split-half and Cronbach’s al-pha coefficients. Our results show increases in both measuresas compared to the old VSL task: Cronbach’s alpha = .88(95 % CI [.84, .92]; as compared to .75, 95 % CI [.67, .83]in the old VSL task), split half reliability (Spearman–Browncorrected) = .83 (95 % CI [.72, .9]; as compared to .76, 95 %CI [.65, .86], in the old VSL task). These indices suggest thatthe new task is indeed better in terms of the degree to which allitems in the task tap the underlying construct, probably due toless noise in the measurement. Note that the presently
observed coefficient of the new VSL task reaches the valuesof standard psychometric tests (with recommended values ofCronbach’s alpha typically ranging from .8 to .95; seeStreiner, 2003). The high Cronbach’s alpha value also sug-gests that the test taps into a single latent variable. This is alsosupported by a confirmatory factor analysis with one underly-ing SL factor (comparative fit index = .987, Tucker–Lewisindex = .978, root mean squared error = .062; all values rep-resent a good model fit—see Hu & Bentler, 1999).
Item analysis
To further examine the psychometric properties of the newtask, we conducted an item analysis in which we calculatedthe discrimination index (d) for each item, by computing thecorrelation between the success with the item and the overallsuccess rate in the test minus the success with the item (i.e.,item by total-minus-item correlations; e.g., Everitt &Skrondal, 2010). This index reflects how well each item dis-criminates between participants with low and high visual SLability. The discrimination indexes of the items ranged from.14 to .6 (see Table 3 above for the observed ds for all items),with a mean of .36. This constitutes a significant improvementrelative to the old VSL task, in which the mean discriminationindex was .26 [two-sample t(72) = 4.05, p < .001].
In addition, to validate our manipulation of levels ofdifficulty across items, and to see whether indeed the TPsof the targets and foils influenced performance, we con-ducted a mixed-effect logistic regression model (using thelme4 package in R; Bates, Maechler, Bolker, & Walker,2015). The dependent measure of this analysis was cor-rectness (correct/incorrect) on each experimental trial,with the TP of the target, the mean TPs of the foils, andthe mean position violations in the foils as fixed effects,and chance level for the item (1 divided by the number ofoptions for the item) and mean-centered trial number ascontrol variables. The model also included a by-item ran-dom intercept and by-subject random slopes for the TP ofthe target and the mean TPs of the foils (the maximalrandom-effect structure justified by the data that con-verged; see Barr, Levy, Scheepers, & Tily, 2013).
2 In contrast to the computation of group-level chance, or to a calculationof the individual chance level in a test in which all items have the samenumber of trials, the calculation of the individual chance level in a testwith items with different numbers of options is not straightforward. Thiswas the reason for using a computer simulation for this calculation insteadof analytical calculation. In each iteration, the computer randomly select-ed a series of 42 responses (for all test trials), and the total score for thisiteration was calculated. Following 10,000 iterations, we calculated thevalue for which fewer than 5 % of the iterations resulted in higher scores.Hence, scores above the obtained threshold (of 23 correct responses) havea p < .05 probability of resulting from a Type I error under the nullhypothesis of random guessing.
Fig. 5 Example of three trials from the test (left to right): (1) a four-forced-choice pattern recognition trial with triplets; (2) a two-forced-choice patternrecognition trial with pairs; and (3) a pattern completion trial for a triplet. The instructions were originally presented in Hebrew
Behav Res (2017) 49:418–432 427

Collinearity in the model was small (correlations betweenthe fixed effects were smaller than .25). Theoretically, wepredicted that performance would improve with higherTPs of the targets, lower mean TPs of the foils, and moreposition violations. The results of the model, shown inTable 4, confirmed the TP manipulation: We found a sig-nificant positive effect for TP of the target (B = 0.72, SE= 0.25, p < .01) and a significant negative effect for theTPs of the foils (B = −1.32, SE = 0.51, p = .01). Nosignificant effect of position violations was found (B =0.03, SE = 0.16, p = .86), suggesting that position viola-tions in foils may not influence performance. This, how-ever, will require additional investigation.
Second session: Test–retest reliability
As we noted above, three months following the first adminis-tration of the task, all participants were contacted and invitedto return for another testing session, in which a retest of thetask was conducted. Forty-three of the participants returnedfor the retest. Their mean score in the first administration ofthe task did not differ significantly from the score of those whodid not came back for the retest [27.14 vs. 24.7 correct items,t(60) = 1.09, p = .28]. The mean score of the second session(i.e., the retest) was 26.3 correct trials (SD = 7.51), showing nooverall improvement from the first administration of the task
at the group level [t(42) = −0.78, p = .44]. This conforms toprevious findings showing no improvement in performance inmultiple testing sessions (Siegelman & Frost, 2015). Mostimportantly, the second administration of the test enabled usto estimate the task’s test–retest reliability: Figure 7 shows thetest–retest scatterplot of observed scores in the two sessions.The observed test–retest reliability coefficient was .68 (95 %CI [.48, .81]), an increased value as compared to the previousVSL task reported in Siegelman and Frost (2015), which had atest–retest reliability of .58 (95 % CI [.4, .71]).
Discussion
In the present article, we have outlined the pitfalls of existingSL tasks for measuring individual differences in SL ability,and offer blueprints for novel tasks specifically designed tomeasure individual performance in visual SL. Specifically,current SL tasks, which were originally designed for group-level investigations, have three major limitations: (1) an insuf-ficient number of trials in the test phase (or repeated testing ofthe same targets), (2) chance-level performance for most of thesample, and (3) equal levels of difficulty across all of the testitems. This led us to develop a visual SL task with a maximalnumber of trials and a minimal number of repeated patterns,which presents above-chance performance for a larger portionof the population,3 and includes items that vary in difficulty tocover a wider range of the measured ability. Following theimplementation of these modifications, the new VSL task in-deed displays superior and improved psychometric properties,as compared with previous tasks.
Table 4 Estimates of the fixed effects for the item analysis
Fixed Effect β Estimate (SE) Z p Value
Intercept −0.95 (0.2) −4.84 <.001
TP of target 0.72 (0.25) 2.84 <.01
Mean TP of foils −1.32 (0.51) −2.57 .01
Position violations 0.03 (0.16) 0.18 .86
Chance level for item (1/k) 3.25 (0.4) 8.06 <.001
Trial number (mean centered) 0.005 (0.0038) 1.32 .19
3 Note that more participants performing above chance level may actuallydecrease variance, since in the binomial distribution the variance is de-pendent on the performance level, SD ¼ ffiffiffiffiffiffiffiffi
npqp
, so that chance-leveldecisions (p = q = .5) yield the highest value. However, the variancearound chance is not reliable, because it is derived from randomguesses.
Fig. 6 Distribution of scores in the first session. The black dashed line shows the group chance level (success on 16.67 trials), and the solid red lineshows the individual chance level (success on 23 trials or more)
428 Behav Res (2017) 49:418–432

However, in addition to the improved psychometric prop-erties, from a theoretical perspective, the new VSL task has animportant advantage. Current SL tasks are limited in theircoverage of the scope of VSL ability, because they measureonly one kind of response (mostly, selecting a familiar pat-tern), applied only to sequences of three elements, with targetsand foils with only a single TP structure (typically, 1 and 0),and nomanipulation of position violations. As we noted in theintroduction, in line with facet theory, this can be formalizedby comparing the complexities of the respective mappingsentences that describe the current and new tasks: Whereasthe current VSL task measures the ability to recognize se-quences of triplets, of TP = 1, from foils of TP = 0, withoutviolation of positions, the new VSL task measures the ability
torecognizecomplete
� �sequences of
tripletspairs
� �, of
TP ¼ 1TP ¼ :33
� �,
from foils of,ranging from
0 to :5
� �,
withdifferentdegreeof
� �violation
of positions. The latter mapping sentence shows the betterconceptual coverage of the scope of the measured ability(i.e., visual SL) in the new VSL task. In addition, it also pro-vides the blueprints for further expanding the coverage of theability, by possibly adding other parameters to the facets (e.g.,by including more values of TPs for the targets, by includingadditional types of responses, etc.), which can be implementedin future, improved versions of the task.
Developing adequate SL tasks to study individual dif-ferences has important theoretical implications. If SL istaken to predict a cognitive measure (such as, for exam-ple, linguistic capacity), the predictive validity of the taskis constrained by its reliability: The correlation betweenthe score obtained in the SL task (x) and the measuredcognitive capacity (y) is upper-bounded by the square rootof the product of the measures’ reliabilities
ρxy≤ffiffiffiffiffiffiffiffiffiffiffiffiffiffiρxx*ρyy
p� �. Current SL tasks, having relatively
mediocre reliability, are then limited in the extent of thecorrelations they can display with various cognitive mea-sures. The new SL task, therefore, has the potential ofbetter predicting linguistic abilities (see, e.g., Arciuli &Simpson, 2012; Frost et al., 2013) or providing more ac-curate estimations of the interrelations between differentSL tasks (e.g., Romberg & Saffran, 2013; Siegelman &Frost, 2015). In addition, it can serve as a better measurefor behavioral SL performance that can then be correlatedwith neural activation during the process of identifyingthe neurocircuitry underlying SL (e.g., Karuza et al.,2013; Turk-Browne et al., 2009).
We should emphasize that the advantage of using morereliable tasks is not limited to studies of individual differ-ences. The use of more reliable SL measures also has thepromise of increasing the statistical power of group-levelinvestigations, simply by decreasing the error variance.For example, two recent studies investigating the role ofawareness in SL (Arciuli et al., 2014; Batterink et al.,2015) independently reported better, albeit nonsignificant,performance in an intentional-learning condition relativeto an unintentional one (an advantage of 5.4 % in theArciuli et al., 2014, study, and an advantage of 4.7 % inthe Batterink et al., 2015, study). This converging patternof Bnull results^ may hint, however, that a real advantageof intentional learning was simply masked by the exten-sive noise related to the tasks’ low reliability. Using psy-chometrically improved tasks in group-level investiga-tions could then reduce possible Type II errors.
Current limitations and future research
Although the present investigation goes some way toward thedevelopment of better SL tasks for measuring individual dif-ferences, it is clear that there is still room for improvement interms of reliability and discriminative power. In this section,we outline directions that can guide future development ofsuch tasks.
In the new task, 60 % of the sample exhibited learning,suggesting that the novel task still does not provide reli-able information about the SL abilities of a relativelylarge proportion of the sample. A possible avenue to fur-ther improve the ratio of participants who show above-chance-level performance, thereby increasing the test’s re-liability, would be to reduce the difficulty level of some ofthe items (through altering target and foil similarity).Improved reliability could also be obtained by using only4AFC-format test items, which would reduce baselinechance-level performance and decrease the error variancethat stems from random guesses.
Another option to further increase the discriminativepower of the task would be to use a weighted scoringmethod, in which correct responses on more difficult
Fig. 7 Test–retest reliabilities for the new VSL task
Behav Res (2017) 49:418–432 429

items (i.e., with lower TPs of the targets, higher TPs ofthe foils, and a higher number of foils) or with higherdiscriminative power (i.e., with a higher discriminationindex) would credit the participants with more test points.As can be seen in Table 3, the items in the present taskvary across all of these dimensions, and our data suggestthat performance is indeed influenced by these factors.Future research could take these factors as weights forthe scores in a new, independent sample and examine, asa cross-validation, whether this scoring procedure im-proves the reliability of the scores and their predictivepower. Similarly, an adaptive testing procedure, in whicheach participant is presented with items of a certain levelof difficulty based on his or her performance on the pre-ceding items, could result in a maximally precise testscore (while using even fewer items). However, the de-velopment of adaptive tests is a complex process thatrequires precise knowledge of what the factors are thatinfluence SL performance, and their relative degrees ofimpact. We believe the present investigation may serveas a first step in this direction.
Note also that the factors contributing to SL perfor-mance are important not only from a methodologicalpe r spec t ive , bu t a l so f rom a theore t i ca l one .Specifically, empirical evidence regarding the relevantfactors that determine performance may serve as impor-tant constraints for computational models of SL, specify-ing the computations involved in extracting regularitiesfrom the input. Although not the main focus of the pres-ent investigation, the results from the novel task alreadyprovide some preliminary insights regarding SL compu-tations. For example, we found that although the TPs ofthe targets and foils affected performance, violations ofposition did not. This finding suggests that participantsare not sensitive to the locations of shapes within pat-terns. Another interesting theoretical issue stemmingfrom the present data is that, although the stream ofshapes was made of chunks of triplets, pairs (i.e., Bpart-chunks^ of the triplets) were learned just as well (meanperformance index for triplet items = .384, mean perfor-mance for pair items = .381).4 Future research can buildupon these preliminary findings to investigate the effectsof these factors (and others) in order to accurately predictSL performance.
Future research also requires us to examine whethersimilar modifications to SL tasks in other modalities(e.g., auditory SL) and with different types of stimuli(e.g., verbal) would have the same positive effect on the
tasks’ psychometric characteristics. However, some of theproposed modifications might present challenges for tasksin the auditory modality; for example, the auditory pre-sentation of four alternatives in the same test item mightexceed the working memory capacities of some individ-uals. A possible issue in using the same procedure withverbal materials could stem from interference withexisting linguistic knowledge, due to the large numberof different foils. Despite these challenges, we believe thattask construction across different modalities and materialsis a crucial step toward the understanding of how bothmodality-specific and domain-general processes result ina given individual’s performance in a given SL task (for adiscussion, see Frost et al., 2015).
Conclusions
To summarize, the present article reports a novel method forassessing individual differences in SL. The development ofsuch tasks is crucial, in light of the growing interest in indi-vidual differences in SL, both as a predictor of other capacitiesand as a tool for understanding the mechanisms underlyingSL. The measures reported here with the new task demon-strate its superior psychometric properties, and thus can serveas guidelines for future studies in this important line ofresearch.
Author note This article was supported by the Israel ScienceFoundation (ISF Grant No. 217/14 awarded to R.F.), and by theNICHD (Grant No. RO1 HD 067364 awarded to Ken Pugh and R.F.,and Grant No. PO1-HD 01994 awarded to Haskins Laboratories).
Appendix A
4 To control for the different chance-level in different items, we calculatedthe mean performance on pair and triplet items according to the formulapo−pe1−pe
, where po stands for the percent of participants who answeredcorrectly on the item, and pe is the chance level. The 16 shapes used in the new VSL task
430 Behav Res (2017) 49:418–432
References
Arciuli, J., & Simpson, I. C. (2012). Statistical learning is related toreading ability in children and adults. Cognitive Science, 36, 286–304. doi:10.1111/j.1551-6709.2011.01200.x
Arciuli, J., von Koss Torkildsen, J., Stevens, D. J., & Simpson, I. C.(2014). Statistical learning under incidental versus intentional con-ditions. Frontiers in Psychology, 5, 747. doi:10.3389/fpsyg.2014.00747
Aslin, R. N., Saffran, J. R., & Newport, E. L. (1998). Computation ofconditional probability statistics by 8-month-old infants.Psychological Science, 9, 321–324. doi:10.1111/1467-9280.00063
Barr, D. J., Levy, R., Scheepers, C., & Tily, H. J. (2013). Random effectsstructure for confirmatory hypothesis testing: Keep it maximal.Journal of Memory and Language, 68, 255–278. doi:10.1016/j.jml.2012.11.001
Bates, D., Maechler, M., Bolker, B., & Walker, S. (2015). lme4: Linearmixed-effects models using Eigen and S4 (R package version 1.1-8).Retrieved from cran.r-project.org/package=lme4
Batterink, L. J., Reber, P. J., Neville, H. J., & Paller, K. A. (2015). Implicitand explicit contributions to statistical learning. Journal of Memoryand Language, 83, 62–78. doi:10.1016/j.jml.2015.04.004
Bertels, J., Boursain, E., Destrebecqz, A., & Gaillard, V. (2014). Visualstatistical learning in children and young adults: How implicit?Frontiers in Psychology, 5, 1541. doi:10.3389/fpsyg.2014.01541
Bertels, J., Franco, A., & Destrebecqz, A. (2012). How implicit is visualstatistical learning? Journal of Experimental Psychology. Learning,Memory, and Cognition, 38, 1425–1431. doi:10.1037/a0027210
Birnbaum, A. (1968). Some latent trait models and their use in inferringan examinee’s ability. In F. M. Lord & M. R. Novick (Eds.),Statistical theories of mental test scores (pp. 397–472). Reading:Addison-Wesley.
Bulf, H., Johnson, S. P., & Valenza, E. (2011). Visual statistical learningin the newborn infant. Cognition, 121, 127–132. doi:10.1016/j.cognition.2011.06.010
Conway, C.M., Bauernschmidt, A., Huang, S. S., & Pisoni, D. B. (2010).Implicit statistical learning in language processing: Word predict-ability is the key. Cognition, 114, 356–371. doi:10.1016/j.cognition.2009.10.009
Conway, C. M., Karpicke, J., & Pisoni, D. B. (2007). Contribution ofimplicit sequence learning to spoken language processing: Somepreliminary findings with hearing adults. Journal of Deaf Studiesand Deaf Education, 12, 317–334. doi:10.1093/deafed/enm019
Emberson, L. L., Conway, C. M., & Christiansen, M. H. (2011). Timingis everything: Changes in presentation rate have opposite effects onauditory and visual implicit statistical learning.Quarterly Journal ofExperimental Psychology, 64, 1021–1040. doi:10.1080/17470218.2010.538972
Embretson, S. E., & Reise, S. P. (2000). Item response theory forpsychologists. Mahwah: Erlbaum.
Endress, A. D., & Mehler, J. (2009). The surprising power of statisticallearning: When fragment knowledge leads to false memories ofunheard words. Journal of Memory and Language, 60, 351–367.doi:10.1016/j.jml.2008.10.003
Erickson, L. C., & Thiessen, E. D. (2015). Statistical learning of lan-guage: Theory, validity, and predictions of a statistical learning ac-count of language acquisition. Developmental Review, 37, 66–108.doi:10.1016/j.dr.2015.05.002
Evans, J., Saffran, J., & Robe-Torres, K. (2009). Statistical learning inchildren with specific language impairment. Journal of Speech,Language, and Hearing Research, 52, 321–335. doi:10.1044/1092-4388(2009/07-0189)
Everitt, B. S., & Skrondal, A. (2010). Cambridge dictionary of statistics.Cambridge: Cambridge University Press.
Fiser, J., & Aslin, R. N. (2001). Unsupervised statistical learning ofhigher-order spatial structures from visual scenes. PsychologicalScience, 12, 499–504. doi:10.1111/1467-9280.00392
Frost, R., Armstrong, B. C., Siegelman, N., & Christiansen,M. H. (2015).Domain generality versus modality specificity: The paradox of sta-tistical learning. Trends in Cognitive Sciences, 19, 117–125. doi:10.1016/j.tics.2014.12.010
Frost, R., Siegelman, N., Narkiss, A., & Afek, L. (2013). What predictssuccessful literacy acquisition in a second language? PsychologicalScience, 24, 1243–1252. doi:10.1177/0956797612472207
Gebhart, A. L., Newport, E. L., & Aslin, R. N. (2009). Statistical learningof adjacent and nonadjacent dependencies among nonlinguisticsounds. Psychonomic Bulletin & Review, 16, 486–490. doi:10.3758/PBR.16.3.486
Glicksohn, A., & Cohen, A. (2013). The role of cross-modal associationsin statistical learning. Psychonomic Bulletin & Review, 20, 1161–1169. doi:10.3758/s13423-013-0458-4
Gómez, R. L. (2002). Variability and detection of invariant structure.Psychological Science, 13, 431–436. doi:10.1111/1467-9280.00476
Hu, L., & Bentler, P. M. (1999). Cutoff criteria for fit indexes in covari-ance structure analysis: Conventional criteria versus new alterna-tives. Structural Equation Modeling: A Multidisciplinary Journal,6, 1–55. doi:10.1080/10705519909540118
Karuza, E. A., Newport, E. L., Aslin, R. N., Starling, S. J., Tivarus,M. E.,& Bavelier, D. (2013). The neural correlates of statistical learning ina word segmentation task: An fMRI study. Brain and Language,127, 46–54. doi:10.1016/j.bandl.2012.11.007
Kaufman, S. B., DeYoung, C. G., Gray, J. R., Jiménez, L., Brown, J., &Mackintosh, N. (2010). Implicit learning as an ability. Cognition,116, 321–340. doi:10.1016/j.cognition.2010.05.011
Kim, R., Seitz, A., Feenstra, H., & Shams, L. (2009). Testing assumptionsof statistical learning: Is it long-term and implicit? NeuroscienceLetters, 461, 145–149. doi:10.1016/j.neulet.2009.06.030
Kirkham, N. Z., Slemmer, J. A., & Johnson, S. P. (2002). Visual statisticallearning in infancy: Evidence for a domain general learning mech-anism. Cognition, 83, B35–B42. doi:10.1016/S0010-0277(02)00004-5
Mainela-Arnold, E., & Evans, J. L. (2014). Do statistical segmentationabilities predict lexical-phonological and lexical-semantic abilitiesin children with and without SLI? Journal of Child Language, 41,327–51. doi:10.1017/S0305000912000736
Misyak, J. B., & Christiansen, M. H. (2012). Statistical learning andlanguage: An individual differences study. Language Learning,62, 302–331. doi:10.1111/j.1467-9922.2010.00626.x
Misyak, J. B., Christiansen, M. H., & Tomblin, J. B. (2010). On-lineindividual differences in statistical learning predict language pro-cessing. Frontiers in Psychology, 1, 31. doi:10.3389/fpsyg.2010.00031
Mosse, E. K., & Jarrold, C. (2008). Hebb learning, verbal short-termmemory, and the acquisition of phonological forms in children.Quarterly Journal of Experimental Psychology, 61, 505–514. doi:10.1080/17470210701680779
Newport, E. L., & Aslin, R. N. (2004). Learning at a distance I. Statisticallearning of non-adjacent dependencies. Cognitive Psychology, 48,127–162. doi:10.1016/S0010-0285(03)00128-2
Nunnally, J., & Bernstein, I. (1994). Psychometric theory (3rd ed.). NewYork: McGraw-Hill.
Pelucchi, B., Hay, J. F., & Saffran, J. R. (2009). Statistical learning in anatural language by 8-month-old infants. Child Development, 80,674–685. doi:10.1111/j.1467-8624.2009.01290.x
Raven, J. C., Court, J. H., & Raven, J. (1992). Manual for Raven’s pro-gressive matrices and vocabulary scales. Oxford: OxfordPsychologist Press.
Romberg, A. R., & Saffran, J. R. (2013). All together now: Concurrentlearning of multiple structures in an artificial language. CognitiveScience, 37, 1290–1320. doi:10.1111/cogs.12050
Behav Res (2017) 49:418–432 431
Saffran, J. R., Aslin, R. N., & Newport, E. L. (1996). Statistical learningby 8-month-old infants. Science, 274, 1926–1928. doi:10.1126/science.274.5294.1926
Saffran, J. R., Johnson, E. K., Aslin, R. N., & Newport, E. L. (1999).Statistical learning of tone sequences by human infants and adults.Cognition, 70, 27–52. doi:10.1016/S0010-0277(98)00075-4
Saffran, J. R., Newport, E. L., Aslin, R. N., Tunick, R. A., & Barrueco, S.(1997). Incidental language learning: Listening (and learning) out ofthe corner of your ear. Psychological Science, 8, 101–105. doi:10.1111/j.1467-9280.1997.tb00690.x
Shye, S., Elizur, D., & Hoffman, M. (1994). Introduction to facet theory:Content design and intrinsic data analysis in behavioral research.Thousand Oaks: Sage Publishing.
Siegelman, N., & Frost, R. (2015). Statistical learning as an individualability: Theoretical perspectives and empirical evidence. Journal ofMemory and Language, 81, 105–120. doi:10.1016/j.jml.2015.02.001
Singh, L., Steven Reznick, J., & Xuehua, L. (2012). Infant word segmen-tation and childhood vocabulary development: A longitudinal anal-ysis. Developmental Science, 15, 482–495. doi:10.1111/j.1467-7687.2012.01141.x
Spencer, M., Kaschak, M. P., Jones, J. L., & Lonigan, C. J. (2014).Statistical learning is related to early literacy-related skills.Reading and Writing, 28, 467–490. doi:10.1007/s11145-014-9533-0
Streiner, D. L. (2003). Starting at the beginning: an introduction to coef-ficient alpha and internal consistency. Journal of PersonalityAssessment, 80, 99–103. doi:10.1207/S15327752JPA8001_18
Thiessen, E. D., Kronstein, A. T., & Hufnagle, D. G. (2013). The extrac-tion and integration framework: A two-process account of statisticallearning. Psychological Bulletin, 139, 792–814. doi:10.1037/a0030801
Turk-Browne, N. B., Junge, J. A., & Scholl, B. J. (2005). The automatic-ity of visual statistical learning. Journal of ExperimentalPsychology. General, 134, 552–564. doi:10.1037/0096-3445.134.4.552
Turk-Browne, N. B., Scholl, B. J., Chun, M. M., & Johnson, M. K.(2009). Neural evidence of statistical learning: Efficient detec-tion of visual regularities without awareness. Journal ofCognitive Neuroscience, 21, 1934–1945. doi:10.1162/jocn.2009.21131
432 Behav Res (2017) 49:418–432