solid assets ‒ solid earnings - bmo global asset...
TRANSCRIPT

For professional investors only
Solid assets ‒ solid earnings
Marcus Phayre-Mudge
Head of Property Equities
Guy Glover
Manager, F&C UK Property Fund

Marcus Phayre-Mudge
Head of Property Equities, lead manager of
the TR Property Trust and F&C Global Real
Estate Securities Fund
Guy GloverManager, F&C UK Property
Fund
Introduction
2
Paul Myles
Director, Sales & Client
Relationships
100
120
140
160
180
200
220
240
2007 2008 2009 2010 2011 2012 2013 2014 2015
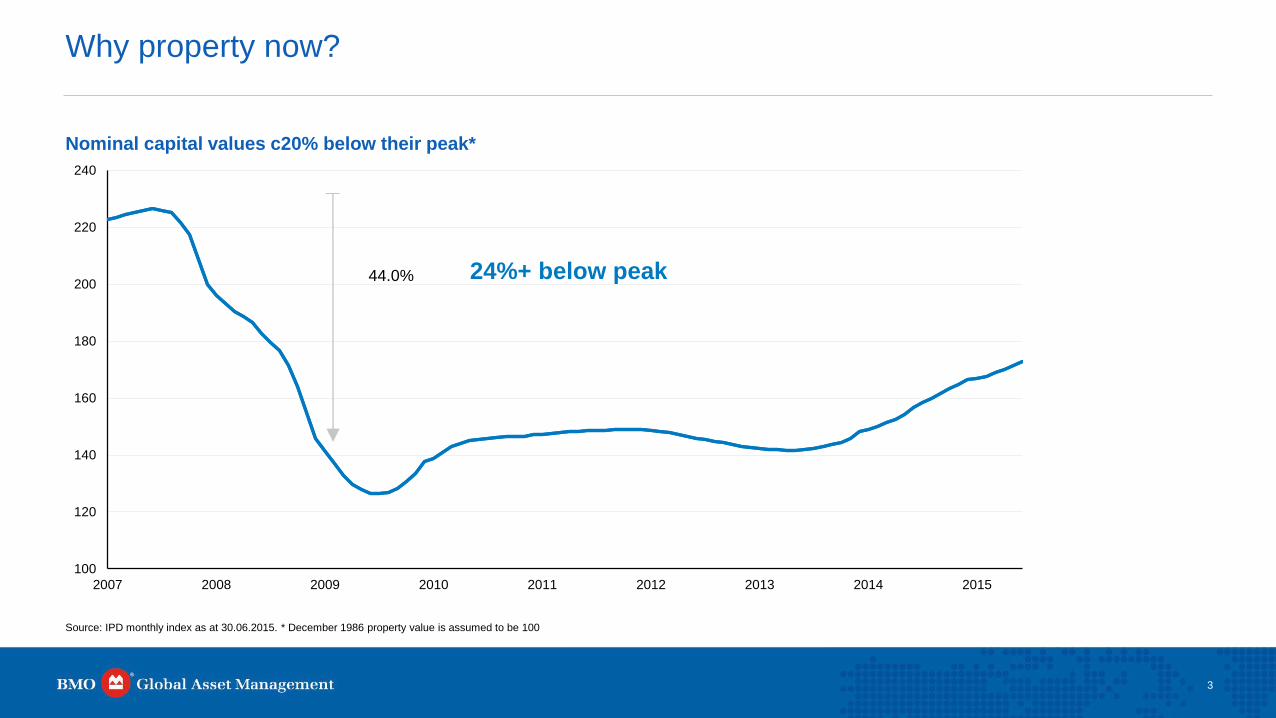
Nominal capital values c20% below their peak*
Why property now?
3
44.0% 24%+ below peak
Source: IPD monthly index as at 30.06.2015. * December 1986 property value is assumed to be 100
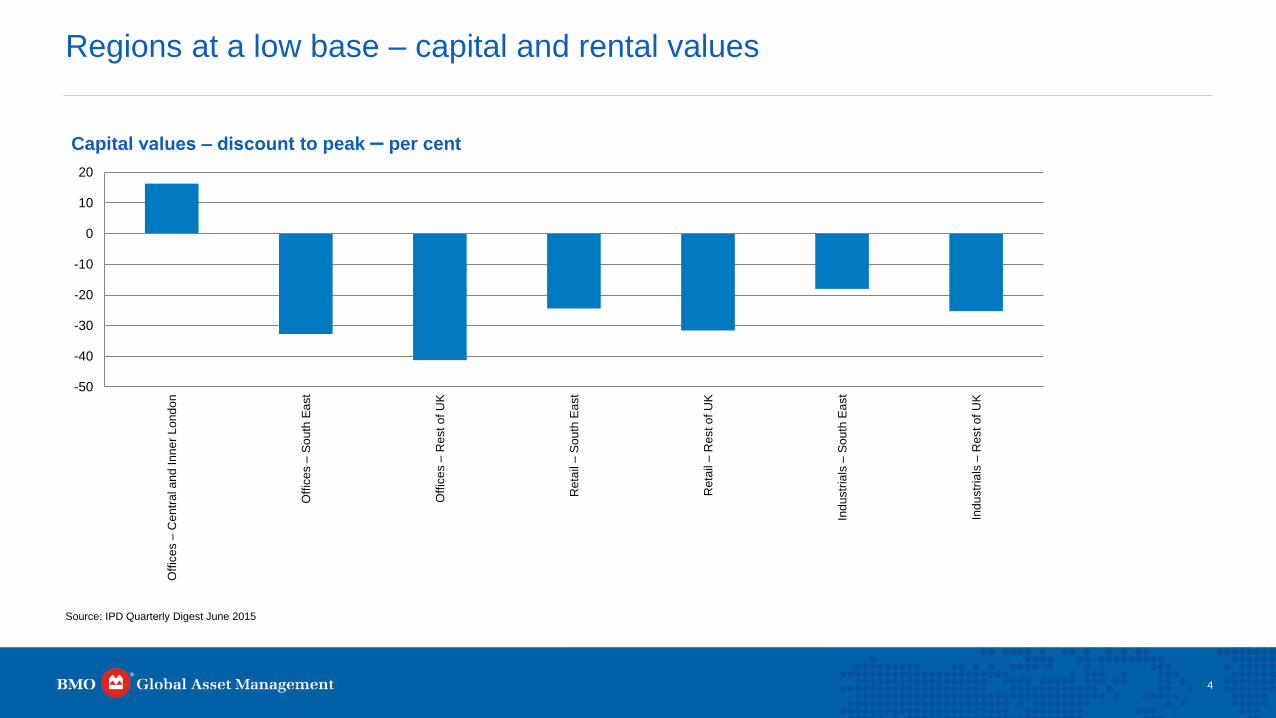
Regions at a low base – capital and rental values
4
-50
-40
-30
-20
-10
0
10
20O
ffic
es –
Cen
tra
l a
nd
In
ne
r L
on
do
n
Off
ice
s –
So
uth
Ea
st
Off
ice
s –
Rest o
f U
K
Reta
il –
So
uth
Ea
st
Reta
il –
Rest o
f U
K
Ind
ustr
ials
–S
ou
th E
ast
Ind
ustr
ials
–R
est o
f U
K
Capital values ‒ discount to peak ‒ per cent
Source: IPD Quarterly Digest June 2015

5.9
0.5
2.0
3.9
3.7
0
1
2
3
4
5
6
7
8
9
10
Jan 00 Jul 01 Jan 03 Jul 04 Jan 06 Jul 07 Jan 09 Jul 10 Jan 12 Jul 13 Jan 15
%
IPD UK Monthly Index Income Return UK base rates 10 year gilts IBOXX £ Corporate Bond Index FTSE 100 Income Return
Why property now?
5
Source: IPD monthly index, Datastream as at 30.06.2015. FTSE International Limited (“FTSE”) © FTSE 2015.
Income return January 2000 – May 2015 (%)

Property vs. gilt yield
6
Source: Thomson Datastream, IPD, Capital Economics
Bps – basis points
All-Property Initial Yields Less 10-Year Gilt Yields (Bps) (1993-2019) (Latest = May 15)

EPRA dividend yields vs. corporate bond yields
BBB yield vs. EPRA dividend yield
0
1
2
3
4
5
6
Aug 12 Dec 12 Apr 13 Aug 13 Dec 13 Apr 14 Aug 14 Dec 14 Apr 15
%
Source : Investment Property Databank (IPD), Bloomberg. Data as at 31.07.2015
FTSE EPRA/NAREIT Developed Europe Index Div Yield
FTSE Euro Corporate BBB average Yield
2014 (A) 2015 (E)
Earnings Yield* 4.2% 4.7%
Dividend Yield* 3.1% 3.7%
*Source: Internal Model. Data as at 31.08.2015. FTSE International Limited (“FTSE”) © FTSE 2015
(A) = Actual; (E) = Estimate
Estimates and forecasts are provided for illustrative purposes only. They are not a guarantee of future performance and should not be relied upon for any investment decision.
Estimates are based on assumptions and subject to change without notice.
7

Listed real estate delivering competitive returns
8
Source: Novelinvestor as at 31.12.2014. http://novelinvestor.com/investing/15-year-look-asset-class-sector-country-returns/

UK direct property market outlook
9
Comparative forecasts - total returns - end 2014-19 per cent per annum
Sources: BMO Real Estate Partners, Property Market Analysis (PMA), Real Estate Strategies (RES), IPF and Capital Economics (Cap Econ) as at 07.07.2015
*All industrials
Note: Estimates and forecasts are provided for illustrative purposes only. They are not a guarantee of future performance and should not be relied upon for any investment decision.
Estimates are based on assumptions and subject to change without notice.
BMO REP PMA Cap Econ RES IPF
Standard retail 8.0 6.9 8.5 8.4 7.0
Shopping centres 6.3 5.4 7.8 6.7 7.1
Retail warehouses 6.6 5.4 9.9 5.2 7.2
City offices 8.9 6.2 8.5 7.8 6.7
West End offices 9.8 5.3 8.4 8.1 6.6
South Eastern offices 9.9 6.5 11.9 7.3
Rest of UK offices 7.4 6.5 11.3 5.1
Standard industrials 7.4 7.4* 9.7* 7.5 8.2*
Distribution 7.8 6.4 7.5
All property 7.8 5.9 9.4 7.1 7.5

Offices - June 2013 Offices – March 2015
UK Property annual rental growth - offices
10
Key: Green >2%, Orange 0 to +2%, Red <0%
Source: BMO Real Estate Partners, IPD

Land securities – NAV (net asset value) and share price
11
Source: BMO Global Asset Management, Datastream, Exane BNP Paribas, as at 28.08.2015
Estimates and forecasts are provided for illustrative purposes only. They are not a guarantee of future performance and should not be relied upon for any investment decision.
Estimates are based on assumptions and subject to change without notice.
0
500
1000
1500
2000
2500
Mar 91 Mar 93 Mar 95 Mar 97 Mar 99 Mar 01 Mar 03 Mar 05 Mar 07 Mar 09 Mar 11 Mar 13 Mar 15 Mar 17
Pence
NAV Estimated NAV Share price

Central London – development profile
12
0
2
4
6
8
10
12
14
16
198
8
198
9
199
0
199
1
199
2
199
3
199
4
199
5
199
6
199
7
199
8
199
9
200
0
200
1
200
2
200
3
200
4
200
5
200
6
200
7
200
8
200
9
201
0
201
1
201
2
201
3
201
4
201
5
201
6
201
7
201
8
201
9
Completed U/C Let/Under Offer U/C Available Proposed Let/ Under Offer Proposed Available
10 year average take up
12.5m sq. ft.
Central London vacancy rate – 3.7%
Source: CBRE 31.12.2014
U/C – Under Construction
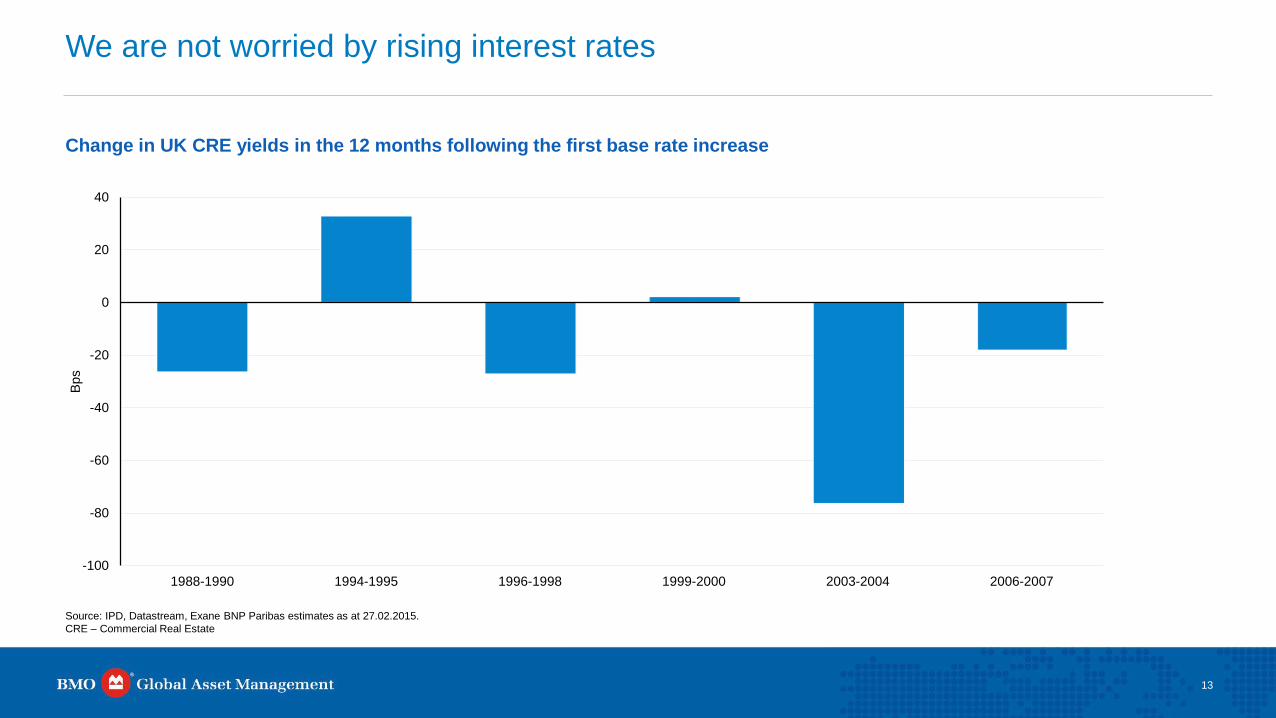
Change in UK CRE yields in the 12 months following the first base rate increase
We are not worried by rising interest rates
13
-100
-80
-60
-40
-20
0
20
40
1988-1990 1994-1995 1996-1998 1999-2000 2003-2004 2006-2007
Bps
Source: IPD, Datastream, Exane BNP Paribas estimates as at 27.02.2015.
CRE – Commercial Real Estate

Macro has dominated the sector in the past year
14
Relatively well insulated from emerging market risk
0%
5%
10%
15%
20%
25%
30%
35%
40%
45%
50%
Basic
Resou
rce
s
Foo
d &
Be
ve
rage
s
Pers
onal &
Hou
se
hold
Goo
ds
Ch
em
ica
ls
Techn
olo
gy
Industr
ial G
oo
ds &
Se
rvic
es
Oil
& G
as
Banks
Auto
s &
Part
s
Telc
om
s
Fin
ancia
l S
erv
ices
Co
nsum
er
& M
ate
rials
Re
tail
He
althcare
Insu
rance
Me
dia
Tra
vel &
Leis
ure
Utilit
ies
Re
al E
sta
te
Source: Datastream, Exane BNP Paribas estimates, September 2015

15
0
500
1000
1500
2000
2500
Dec 98 Dec 00 Dec 02 Dec 04 Dec 06 Dec 08 Dec 10 Dec 12 Dec 14
FT
SE
EP
RA
/NA
RE
IT D
evelo
ped I
ndex
US REIT performance during past Fed rate hikes
Past Fed rate
hike periods
Source: Bloomberg. Data as at 31.08.2015.
16
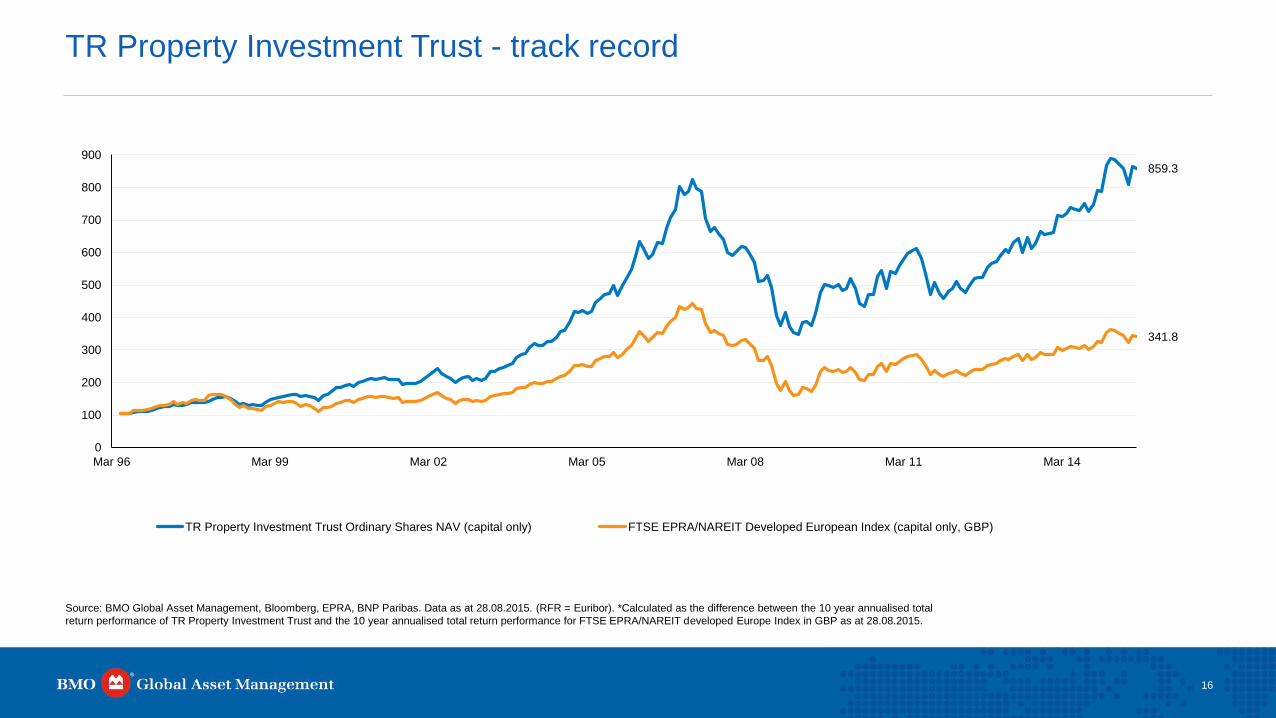
TR Property Investment Trust - track record
Source: BMO Global Asset Management, Bloomberg, EPRA, BNP Paribas. Data as at 28.08.2015. (RFR = Euribor). *Calculated as the difference between the 10 year annualised total
return performance of TR Property Investment Trust and the 10 year annualised total return performance for FTSE EPRA/NAREIT developed Europe Index in GBP as at 28.08.2015.
859.3
341.8
0
100
200
300
400
500
600
700
800
900
Mar 96 Mar 99 Mar 02 Mar 05 Mar 08 Mar 11 Mar 14
TR Property Investment Trust Ordinary Shares NAV (capital only) FTSE EPRA/NAREIT Developed European Index (capital only, GBP)

• Since inception, the fund has
produced a +101% total return.
+34% of alpha (net of all fees)
outperforming its benchmark in 19
out of 21 quarters
• Annual outperformance of 3.8%.
Information ratio of 2x
Alpha (excess return vs. benchmark) since launch*
17
F&C Real Estate Securities Fund:Outperformed in 19 out of 21 quarters since launch
Source: BMO Global Asset Management. Data as at 28.08.2015
*NAV of F&C Real Estate Securities fund (B GBP Acc) net of all fees vs. FTSE EPRA/NAREIT Developed Europe Capped Index TR (Net of Withholding Tax) GBP.
-2%
3%
8%
13%
18%
23%
28%
33%
38%
Apr 10 Aug 10 Dec 10 Apr 11 Aug 11 Dec 11 Apr 12 Aug 12 Dec 12 Apr 13 Aug 13 Dec 13 Apr 14 Aug 14 Dec 14 Apr 15 Aug 15

BMO REP – IPD monitored performance
18
BMO REP IPD-managed funds, if aggregated into a hypothetical single ‘house’ fund, has
outperformed the benchmark on a 1, 3, 5 and 10 year basis
Source: IPD as at 30 June 2015. ¹ BMO Real Estate Partners IPD monitored products
1 Year 3 Years 5 Years 10 Years
BMO REP house returns¹ 16.6% 12.9% 10.8% 7.4%
Percentile rank 39th 32nd 24th 19th
Benchmark (IPD Quarterly Universe) 15.7% 12.2% 10.2% 6.0%

Sector analysis Geographic analysis
F&C UK Property Fund geographic and sector analysis
19
Standard Retail13.0%
Retail Warehouse
28.5%
Offices36.1%
Industrial18.9%
Leisure3.6% Rest London
13.3%
South East34.0%
South West11.0%
Eastern3.8%
East Midlands1.8%
West Midlands12.2%
York / Humber9.7%
North West4.3%
Scotland10.0%
Source: BMO Real Estate Partners. Data as at 30.06.2015

Factors affecting the forecasts
20
• Domestic
‒ Timing and extent of interest rate normalisation
‒ Concerns about impact of EU referendum vote (BREXIT)
‒ Banks (and others), are lending again - £45bn in 2014
‒ What happens when the assets sold off in loan packages are marketed?
• External factors
‒ Subdued Eurozone GDP growth, ECB quantitative easing an unknown.
The Eurozone debt crisis is not over
‒ Oil price falls, possible deflation
‒ Geo-political considerations, Russia, emerging markets, China, Middle
East, Ukraine
‒ US – timing of interest rate rises
PMA predicts that a “BREXIT” scenario
would reduce UK all property total
returns by 3 percentage points per
annum in five years to 2019
– Central London offices especially
vulnerable to correction
Sources: De Montfort Survey May 2015, Property Market Analysis June 2015 (PMA). GDP- Gross domestic product,
ECB- European Central Bank
BREXIT = British exit from the EU
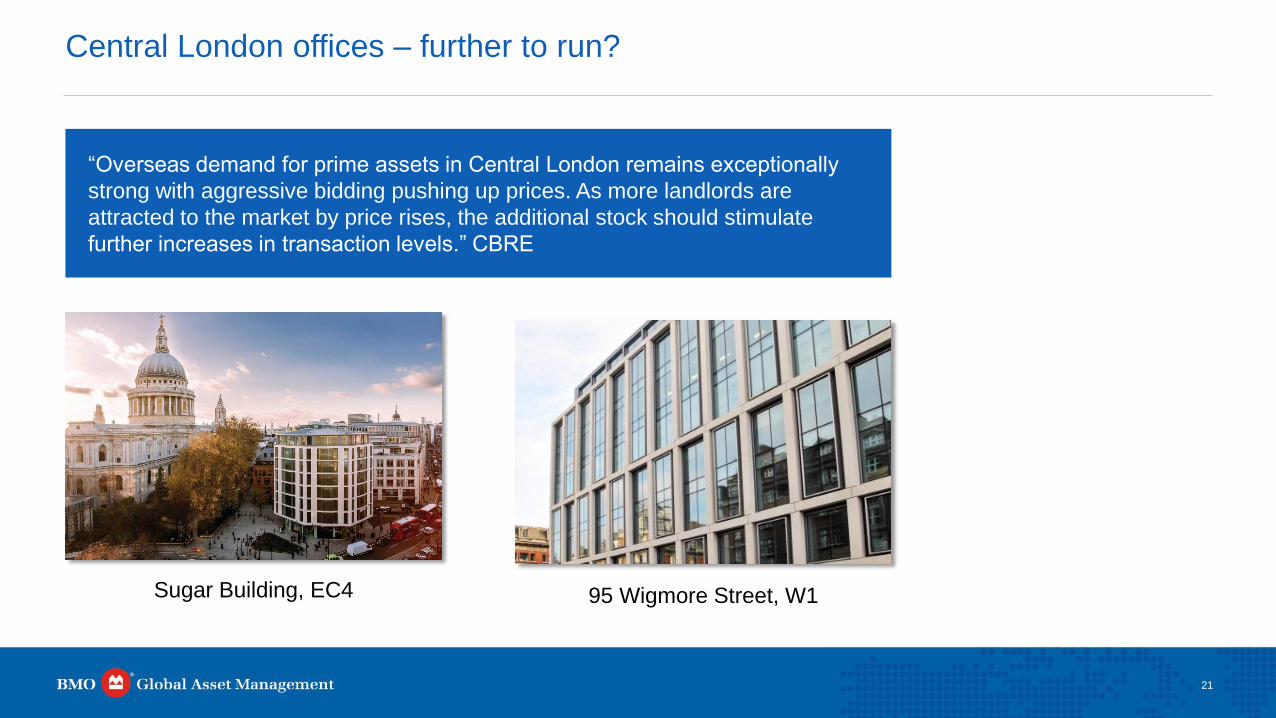
Central London offices – further to run?
21
Sugar Building, EC4
“Overseas demand for prime assets in Central London remains exceptionally
strong with aggressive bidding pushing up prices. As more landlords are
attracted to the market by price rises, the additional stock should stimulate
further increases in transaction levels.” CBRE
95 Wigmore Street, W1

Conclusion
22
• UK commercial property has seen 3 years of double digit returns. Will it continue to
perform in 2015 and beyond and where will this performance come from?
‒ 2015/16 forecasts are positive
‒ Regional yield shift plus increasing rental growth
‒ Income
• Is it still a good relative buy compared to other asset classes?
‒ Aims of investor
‒ Fair value
‒ Underpinned by fundamentals

Past performance should not be seen as an indication of future performance. The value of investments and income derived from them can go down as well as up
as a result of market or currency movements and investors may not get back the original amount invested.
Disclaimer
Copyright © 2015, S&P Capital IQ (and its affiliates, as applicable). This may contain information obtained from third parties, including ratings from credit ratings
agencies such as Standard & Poor’s. Reproduction and distribution of third party content in any form is prohibited except with the prior written permission of the
related third party. Third party content providers do not guarantee the accuracy, completeness, timeliness or availability of any information, including ratings, and
are not responsible for any errors or omissions (negligent or otherwise), regardless of the cause, or for the results obtained from the use of such content. THIRD
PARTY CONTENT PROVIDERS GIVE NO EXPRESS OR IMPLIED WARRANTIES, INCLUDING, BUT NOT LIMITED TO, ANY WARRANTIES OF
MERCHANTABILITY OR FITNESS FOR A PARTICULAR PURPOSE OR USE. THIRD PARTY CONTENT PROVIDERS SHALL NOT BE LIABLE FOR ANY
DIRECT, INDIRECT, INCIDENTAL, EXEMPLARY, COMPENSATORY, PUNITIVE, SPECIAL OR CONSEQUENTIAL DAMAGES, COSTS, EXPENSES, LEGAL
FEES, OR LOSSES (INCLUDING LOST INCOME OR PROFITS AND OPPORTUNITY COSTS OR LOSSES CAUSED BY NEGLIGENCE) IN CONNECTION
WITH ANY USE OF THEIR CONTENT, INCLUDING RATINGS. Credit ratings are statements of opinions and are not statements of fact or recommendations to
purchase, hold or sell securities. They do not address the suitability of securities or the suitability of securities for investment purposes, and should not be relied on
as investment advice.
FTSE International Limited (“FTSE”) © FTSE 2015. “FTSE®” is a trade mark of the London Stock Exchange Group companies and is used by FTSE International
Limited under licence. All rights in the FTSE indices and/or FTSE ratings vest in FTSE and/or its licensors. Neither FTSE nor its licensors accept any liability for
any errors or omissions in the FTSE indices and/or FTSE ratings or underlying data. No further distribution of FTSE Data is permitted without FTSE’s express
written consent.
24

Contact Us
BMO Global Asset Management (EMEA) - Head Office
Exchange House
Primrose Street
London EC2A 2NY
Tel: +44 (0) 20 7628 8000
bmogam.com
© 2015 BMO Global Asset Management. All rights reserved. BMO Global Asset Management is a trading name
of F&C Management Limited, which is authorised and regulated by the Financial Conduct Authority.
Extensive worldwide investment capabilities
• Total focus on clients
• Comprehensive range of products and solutions
• Defined expertise – including a suite of specialist
investment boutiques
• Scale and stability – our parent company is the
Bank of Montreal, one of Canada’s largest banks