solaractivityandearthrotationvariability · adepartamento de fisica de la atmosfera y de los...
TRANSCRIPT
www.elsevier.com/locate/jog
Solar activity and earth rotation variability
R. Abarca del Rioa,*, D. Gambisb, D. Salsteinc,P. Nelsonc, A. Daid
aDepartamento de Fisica de la Atmosfera y de los Oceanos (DEFAO), Facultad de Ciencias Fisicas y Matematicas,Universidad de Concepcion, Casilla 160-C, Concepcion, Chile
bInternational Earth Rotation Service (IERS), UMR8630, Observatoire de Paris, 61 Av de l’Observatoire, Paris, FrancecAtmospheric and Environmental Research Inc, 131 Hartwell Avenue, Lexington, MA 02421, USA
dNational Center for Atmospheric Research, Boulder, CO 80303, USA
Abstract
The analysis of variability in Atmospheric Angular Momentum (AAM) and Length of day (LOD) ofAbarca del Rio et al. [Ann. Geophys. 18 (2000) 347] is extended to investigate a possible connection withsolar activity fluctuations from interannual to secular time scales. The southern oscillation index andrecords of sea surface temperature are used as proxy series in this analysis during the era prior to theavailability of AAM analyses. At interannual times scales, the variability in AAM and LOD agrees withthat in solar activity with regard to the decadal cycle in the stratospheric quasi biennial oscillation andsolar activity but whose phases are slowly shifting from one another with time, while the stratosphericquasi biennial cycle agrees with the solar quasi biennial cycle, though led by 6 years. At decadal times scales,AAM varies statistically with the solar decadal cycle over much of the last century since 1930–1940. The dec-adal mode in AAM is suggested here to be generated by upward propagation of surface atmospheric modes,from the surface throughout the troposphere through the stratosphere. Equatorial Sea Surface Temperature(SST) variability may be considered a proxy index for AAM variability because of the relationship to the ElNino/Southern Oscillation; its analysis over the last three centuries (1730–2000) and that of LOD since 1830confirm the agreement found over the last part of the 20th century, as well as the general disagreement before.# 2003 Elsevier Ltd. All rights reserved.
1. Introduction
The Sun drives the thermal balance of our planet and when modulated by orbit-based para-meters, determines the seasonal weather cycles of our planet. Until recently Solar irradiance was
0264-3707/03/$ - see front matter # 2003 Elsevier Ltd. All rights reserved.
doi:10.1016/S0264-3707(03)00060-7
Journal of Geodynamics 36 (2003) 423–443
* Corresponding author. Fax: +56-41-204002.
E-mail address: [email protected] (R. Abarca del Rio).

assumed to be invariant and thus the power intercepting a unit area at the Earth’s mean distancefrom the sun was called the solar constant. Current satellite- and rocket-based instrumentsdemonstrate a variation in solar irradiance (Hoyt and Schatten, 1997) which is tied to theapproximate decadal cycle seen in sunspot numbers (Parker, 2000). This variability is relativelysmall, 1–3 Wm2, corresponding to between 0.1 and 0.3% of the total solar irradiance reaching theearth (Pap and Frohlich, 1999).Recently, a number of studies have shown that from interannual to secular times scales,meteorological and climatic data are correlated with solar variability (see reviews by Sadourny,1994; Reid, 1995; Hoyt and Schatten, 1997; Lean and Rind, 1999; and Nesme-Ribes and Thuil-lier, 2000). The earlier solar-climate link debate (Pittock, 1978, 1983) was revitalized with newstudies (Arnold and Robinson, 1998; Shindell et al., 1999) searching for a physical mechanism bywhich small changes in solar output could be amplified in the Earth’s atmosphere. In fact, atwavelengths not visible to humans, such as the Ultraviolet and Extreme Ultraviolet, the percen-tage variability is much larger, changing by factors of 100 or more over time scales of minutes tohours, and the Earth receives other types of energy such as outflows of charged particles.According to the recent Sun-Climate (2000) connection workshop held by NASA the research onsuch links has been organized into general areas that we summarize here. (1) Direct forcing oftropospheric climate by changes in the near UV, visible, and IR radiation. (2) Indirect forcing ofclimate by solar induced changes in the stratosphere, such as through ozone interactions resultingin temperature and other changes around the 30 hPa level, possibly modulating the Quasi-Bien-nial oscillation (QBO). (3) Influence of energetic particles, such as the galactic cosmic rays andenergetic electron precipitation modulated by the solar wind that can alter cloud cover as well asinduce upper and lower atmosphere couplings.Recent results by Friis-Christensen and Lassen (1991), Crowley and Kim (1996), Diamantides(1998), Kishcha et al. (1999), Mann et al. (2000) and Crowley (2001) as well as numerous refer-ences in Lean and Rind (1999) have intensified the debate. Many of these investigations correlatedifferent indices of solar activity with hemispheric time series of surface temperature, suggestingthat up to 30–50% of the interdecadal - century time scale variance in surface temperature couldbe attributed to solar forcing. However, numerical experiments (Cubasch et al., 1997; Tett et al.,1999; Bertrand et al., 1999; Meehl et al., 2003) show that although a combination of solar varia-bility (interpreted nevertheless in view of reconstructed past solar activity indices), and volcanicactivities (e.g. Mann et al., 2000; Crowley, 2001) could have forced climate at secular time scalesup to roughly 1930, these can not be responsible for global warming, currently being observedand reported about by IPCC (2001).Because of the absence of consensus regarding physical processes relating solar activity to cli-mate variations, this topic has caused much speculation (Pittock, 1978, 1983) and controversy.Given results at secular and interdecadal time scales, one expects a similar relationship betweenthe powerful 11-year Schwabe cycle in solar activity and decadal times scales in climate indices,though such results may be inconsistent; Nitta and Yoshimura (1993) as Parker et al. (1994),analyzing global air (land + marine) temperatures, suggest that decadal variability in globalaveraged air surface temperature anomalies and the 11-year solar cycle, though related, areunrelated linearly before 1940. On the other hand, Lau and Weng (1995) and White et al. (1997),found significant solar-related signals in the equatorial sea surface temperature over the entire20th century. Recently, though contested (Gierens and Ponater, 1999) it has been shown that
424 R. Abarca del Rio et al. / Journal of Geodynamics 36 (2003) 423–443

global cloud coverage (Svensmark and Friis-Christensen, 1997) contains a decadal cycle. Addi-tionally, suggestions of the 11-year cycle appear in stratospheric parameters like geopotentialheight, zonal winds and temperatures (Labitzke and van Loon, 1997) and noted in general forsome characteristics of the quasibiennial oscillation (Baldwin et al., 2001) over the last 40 years.On this topic, much of the analyses has been performed with climate indexes at the surface inthe troposphere or in the stratosphere, or at individual geographically located parameters. In thepresent study however, we will analyze an index representing and measuring the dynamic state ofthe whole atmosphere, the atmospheric angular momentum (AAM). In fact, much of the historicdevelopment of modern meteorology is connected with the study of how atmospheric momentumis maintained locally or transported from one region to another and how it is exchangingmomentum with the oceans and solid Earth (Peixoto and Oort, 1992). Its conservation propertiesare closely linked with those of energy conservation (White, 1989). It is therefore a fundamentalcirculation index used to characterize the dynamic state of the general circulation of the atmo-sphere, and climate (Peixoto and Oort, 1992). AAM is known to exhibit pronounced high fre-quency (Schuh and Schmitz-Hubsch, 2000) and seasonal fluctuations (Marcus et al., 1998;Hopfner, 1998, 2001), interannual times scales associated with large scale flow anomalies (Rosenet al., 1991; Dickey et al., 1992; Black et al., 1996; Chen et al., 1996; Dickey et al., 1999; Abarcadel Rio, 2000) and decadal oscillations (Abarca del Rio, 1997; Rosen and Salstein, 2000). Inaddition, its knowledge is also important for space geodesy and interplanetary navigation, sinceon all the above time scales, AAM is highly correlated with length of day (LOD) variations, ameasure of the Earth’s rotation rate (see review by Eubanks, 1993).The present paper explores relations between solar activity (SA) described in indices like theWolf sunspot number (WSN), and atmospheric angular momentum (AAM), from interannual todecadal times scales. This study covers two time scales; interannual and decadal. In the first part,we emphasize stratospheric quasi biennial (QB) variability as evidenced in AAM. We also inves-tigate the triennial-quadrennial and six year oscillation (TQO and SYO respectively). In the sec-ond section, we will concentrate our analysis in the decadal oscillation in AAM and LOD.
2. Data
2.1. Atmospheric angular momentum (AAM)
The axial AAM about the polar axis of a layer of the atmosphere, may be calculated followingBarnes et al. (1983):
AAM ¼2�R3
g
ðPt
Ps
ð��=2
�=2
ð2�0
u cos2’@l @’@p ð1Þ
where R is the radius of the Earth, g acceleration due to gravity and u zonal wind speed. The termis integrated over all latitudes, ’, longitudes, l, and pressures, p (from 1000 hPa, near the surface,to 10 hPa in the stratosphere. A second AAM term, related to changes in the mass distribution ofthe atmosphere (surface pressure variations), plays a much smaller role in global AAM budget(less than 5%) on most time scales (Eubanks, 1993), and is not accounted for in the following.
R. Abarca del Rio et al. / Journal of Geodynamics 36 (2003) 423–443 425
Using the zonal wind fields from the recent NCEP reanalysis (Kalnay et al., 1996), we constructeda 52-year long set of monthly global AAM from January 1949 to December 2000. The reanalysisfields are available on 2.5��2.5� latitude-longitude grids over 17 layers from 1000 hPa to 10 hPa,with five levels over the stratosphere (70, 50, 30, 20 and 10 hPa). These fields allow computationof AAM up to 10 hPa using Eq. 1. Recently, Rosen and Salstein (2000) showed that AAM dataissued from an atmospheric model (UKMO Hadley Center Model) forced by SST fields (GISST)over 1870 to 1998 showed comparable variability to that of the reanalysis (over 1950–1998) inseasonal to interannual times scales. With this in mind, we construct another AAM set withdata issued from similar model experiments (NCAR CCM3, Kiehl et al., 1998), forced by thesame sea surface temperature fields (GISST) over 1870–1997. From these models runs we con-structed two ensemble averages of simulations of AAM, respectively for the UKMO andNCAR models.The AAM data can be expressed in millisecond (ms) of length of day (LOD) variability,assuming that changes in AAM for the entire atmosphere are accompanied by equivalent changesin the angular momentum of the Earth, through the following relation (Rosen and Salstein,1983):
DLOD msð Þ ¼ 1:68 10�29DAAM kg m2=s� �
ð2Þ
2.2. Length of day (LOD)
The LOD data are taken from the compilation of the International Earth Rotation Service(IERS annual report, 1999) based on a combination of astrometric and space-geodetic methods,from 1700 to 1830 at an annual resolution, from 1830 to 1949 seasonally, and from 1949 to2000 monthly. From this data set we constructed a continuous series extending from 1700 to2000. This data set matches well with the recent combined annual LOD data series from Gross(2001).
2.3. Sea surface temperature (SST)
We will also analyze the equatorial SST variability from year 1730 up to 1980, taking advantageof the recent annual reconstructed (marine + land) fields by Mann et al. (2000). For comparativepurposes we will also investigate the Kaplan et al. (1998) monthly fields of sea surface tempera-ture from to 1856 to 2000. From these fields we constructed two main time series: Kaplan20 andMann5. The Kaplan20 time series is constructed by averaging globally (all oceans) from 20�S to20�N the Kaplan et al. (1998) SST anomaly fields which are available monthly over 1855–2000 onequal 5� latitude–longitude grids. The Mann5 time series is constructed by averaging globally (alloceans) from 5�S to 5�N the anomaly fields of SST of the Mann et al. (2000) reconstruction,which are available annually from 1730 to 1980 on 5��5� latitude–longitude grids. For both fieldswe choose only grids which were complete over the entire time span and we constructed Pacific,Atlantic, and Indian Ocean equatorial SST averages. In the case of the Kaplan fields, for com-parative purposes, we also constructed 5� and 10� averages (Kaplan5 and Kaplan10 respectively).Finally we will also use the global temperature (marine + land) time series by Mann et al. (2000),extending from 1700 to 2000 hereinafter named GT.
426 R. Abarca del Rio et al. / Journal of Geodynamics 36 (2003) 423–443

2.4. Solar variability
For analytical purposes the intensity of the solar radio flux values at 2800 MHz (the 10.7 cmradiation or F10.7 index), which measures the variable solar photon inputs into the atmosphere, islikely the best suited for comparison with climate indices, though it starts in the 1950s (Gorney,1990). For studies involving longer data series, the varying number of sunspots has been subjectof observation through several hundred years and may be regarded as reliable since 1750 (Eddy,1976). The Wolf sunspot number (WSN) is highly correlated with Sun’s output of the radiation inthe extreme ultraviolet (EUV) wavelength band, and it varies identically with the 10.7 cm radia-tion, with the eleven year period being its dominant oscillation (Gorney, 1990). In preliminaryanalyses, we performed comparative analyses between the WSN and the F10.7 index over theiroverlapping period (1950–2000) in all the frequency bands studied. We confirm that both seriesare identical. Therefore we will use the Wolf sunspot numbers (the WSN) as a solar activity index(herein after SA). Let’s note here that the decadal oscillation in solar activity is also called theSchwabe cycle following its discovery by Schwabe (1843).
3. Analyses
3.1. Interannual times scales
Interannual signals in AAM and LOD are dominated by a number of distinct bands (Abarcadel Rio et al., 2000). A 6-year oscillation can be noted (Abarca del Rio et al., 2000) in LOD andup to 5 years, a pair of scales, related to ENSO emerges (Dickey et al., 1992; Black et al., 1996) inboth AAM and LOD, those at 3–5 years, and 2–3 years, also related to the quasi biennial oscil-lation. We separate below the interannual fluctuations into low and higher frequency (LF and HFrespectively) variability.
3.1.1. LF interannual variabilityAssociation between ENSO and SA at interannual time scales have not been documented todate. Results connecting the two processes appear to be confined to much longer times scales, the80–90 year Gleissberg cycle (Michaelsen, 1986), but such scales are far beyond those under con-sideration here.Given the close relationship documented between the southern oscillation index SOI and AAM(see Abarca del Rio et al., 2000), and the availability of the SOI for over a century, since 1866, wecompared the interannual variability in this monthly SOI with the WSN series We computed thespectra of each series, as well as co-spectra and squared coherence spectra (Fig. 1). We separatedthe analyses into three spectral regions addressed in AGS, the six-year oscillation (SYO), the tri-ennial-quadrennial oscillation (TQO) and the quasibiennial band (which is presented in the highfrequency section).
3.1.1.1. The six-year oscillation (SYO). Though neither the SOI nor the WSN peak near 6 years,they do cohere strongly with each other at this frequency. Wavelet analysis of both series (Tor-rence and Compo, 1998), are in phase in the 5.5–7 year band over 1866–2000 (not shown) though
R. Abarca del Rio et al. / Journal of Geodynamics 36 (2003) 423–443 427
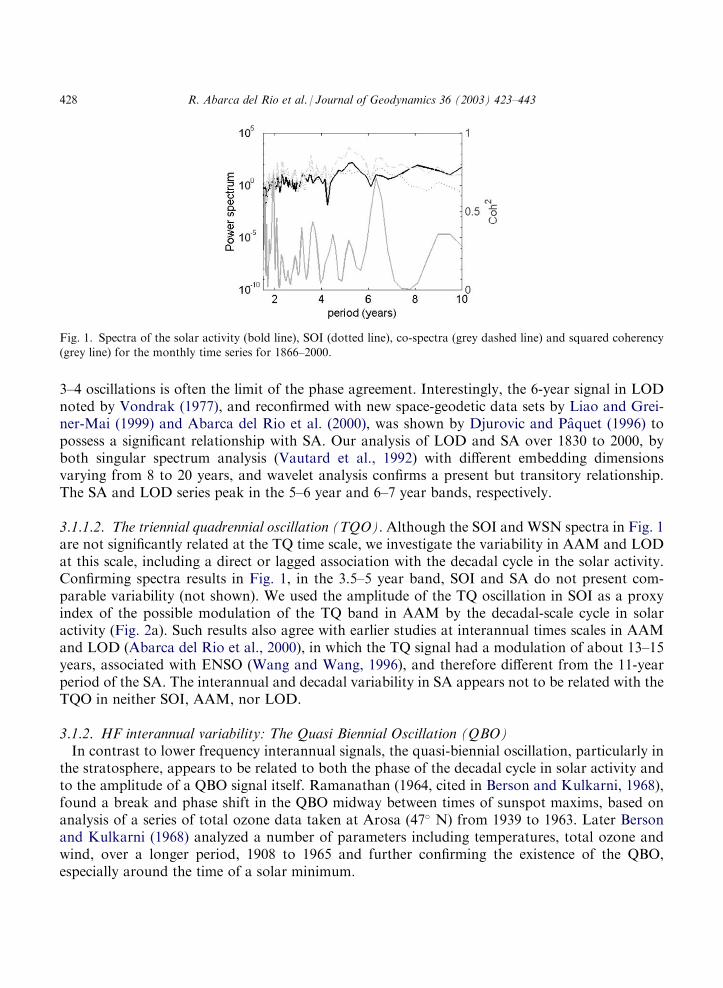
3–4 oscillations is often the limit of the phase agreement. Interestingly, the 6-year signal in LODnoted by Vondrak (1977), and reconfirmed with new space-geodetic data sets by Liao and Grei-ner-Mai (1999) and Abarca del Rio et al. (2000), was shown by Djurovic and Paquet (1996) topossess a significant relationship with SA. Our analysis of LOD and SA over 1830 to 2000, byboth singular spectrum analysis (Vautard et al., 1992) with different embedding dimensionsvarying from 8 to 20 years, and wavelet analysis confirms a present but transitory relationship.The SA and LOD series peak in the 5–6 year and 6–7 year bands, respectively.
3.1.1.2. The triennial quadrennial oscillation (TQO). Although the SOI and WSN spectra in Fig. 1are not significantly related at the TQ time scale, we investigate the variability in AAM and LODat this scale, including a direct or lagged association with the decadal cycle in the solar activity.Confirming spectra results in Fig. 1, in the 3.5–5 year band, SOI and SA do not present com-parable variability (not shown). We used the amplitude of the TQ oscillation in SOI as a proxyindex of the possible modulation of the TQ band in AAM by the decadal-scale cycle in solaractivity (Fig. 2a). Such results also agree with earlier studies at interannual times scales in AAMand LOD (Abarca del Rio et al., 2000), in which the TQ signal had a modulation of about 13–15years, associated with ENSO (Wang and Wang, 1996), and therefore different from the 11-yearperiod of the SA. The interannual and decadal variability in SA appears not to be related with theTQO in neither SOI, AAM, nor LOD.
3.1.2. HF interannual variability: The Quasi Biennial Oscillation (QBO)In contrast to lower frequency interannual signals, the quasi-biennial oscillation, particularly inthe stratosphere, appears to be related to both the phase of the decadal cycle in solar activity andto the amplitude of a QBO signal itself. Ramanathan (1964, cited in Berson and Kulkarni, 1968),found a break and phase shift in the QBO midway between times of sunspot maxims, based onanalysis of a series of total ozone data taken at Arosa (47� N) from 1939 to 1963. Later Bersonand Kulkarni (1968) analyzed a number of parameters including temperatures, total ozone andwind, over a longer period, 1908 to 1965 and further confirming the existence of the QBO,especially around the time of a solar minimum.
Fig. 1. Spectra of the solar activity (bold line), SOI (dotted line), co-spectra (grey dashed line) and squared coherency(grey line) for the monthly time series for 1866–2000.
428 R. Abarca del Rio et al. / Journal of Geodynamics 36 (2003) 423–443
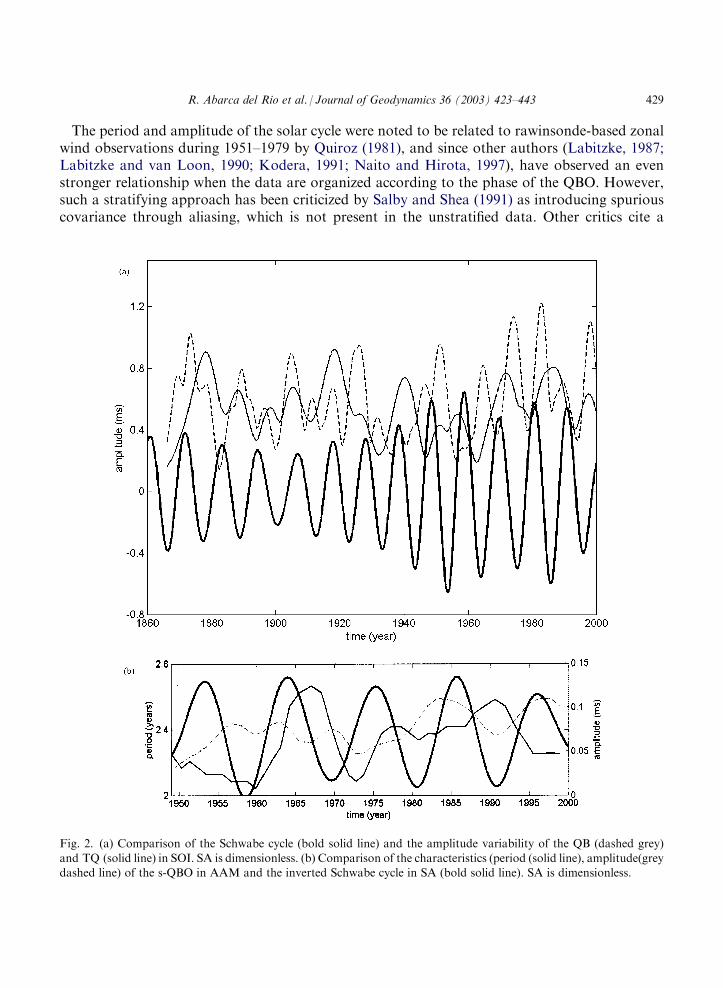
The period and amplitude of the solar cycle were noted to be related to rawinsonde-based zonalwind observations during 1951–1979 by Quiroz (1981), and since other authors (Labitzke, 1987;Labitzke and van Loon, 1990; Kodera, 1991; Naito and Hirota, 1997), have observed an evenstronger relationship when the data are organized according to the phase of the QBO. However,such a stratifying approach has been criticized by Salby and Shea (1991) as introducing spuriouscovariance through aliasing, which is not present in the unstratified data. Other critics cite a
Fig. 2. (a) Comparison of the Schwabe cycle (bold solid line) and the amplitude variability of the QB (dashed grey)
and TQ (solid line) in SOI. SA is dimensionless. (b) Comparison of the characteristics (period (solid line), amplitude(greydashed line) of the s-QBO in AAM and the inverted Schwabe cycle in SA (bold solid line). SA is dimensionless.
R. Abarca del Rio et al. / Journal of Geodynamics 36 (2003) 423–443 429

relative short data length and the quality of data in the early part of the last century (Hamilton,1990). Pessimistically, Hamilton (1998) provides a negative perspective on reconstructing a con-tinuous and viable index of past stratospheric variability 1950.Here we compare the quasi biennial variability in AAM (tropospheric and stratospheric) firstwith the decadal cycle in solar activity (subsection 3.1.2.1) and then with a comparable oscillationin solar activity (subsection 3.1.2.2).
3.1.2.1. Association of the quasi biennial variability in AAM with the decadal cycle in solar activity.The quasi biennial oscillation in AAM appears to originate from two separate processes, one inthe troposphere and linked with ENSO (the t-QBO), and the stratospheric (the s-QBO). Whereaswe were unable to note a link between the amplitude and phase of the t-QBO in AAM and thedecadal cycle in solar activity (Fig. 2a), we did determine, in contrast, a relationship, thoughweak, with the s-QBO.The evolution of the period and amplitude of the s-QBO are presented along with the inverteddecadal solar signal in Fig. 2b. Over much of the 50 years analyzed, a relationship ship existswhose phase lag with the inverted decadal solar cycle appears to average 4 years, though itvacillates from about 3 years in 1965 to 5 years in 1995. The variability in this lag might indicatean origin for the decadal modulation other than solar activity, and furthermore the annual reso-lution of earlier studies can partially mask the QBO period, particularly when segregated into theeast and west phases. To mitigate these issues in part, we were able to confirm the above rela-tionship, with the vacillating time lags, using the expanded QBO index of Naujokat (1986) fromthe mid-1950s between the 100 and 10 hPa levels. Following earlier studies separating the eastand west-directed phase, we found that part of the association between the decadal cycle in SAand the period of s-QBO in AAM was due to a contraction of the east-to-west (through to peak)changeover. When the contraction and expansion of the east to west change over is taken alone thecorrelation appears to be amplified, but the association is also present in the west to east change over.
3.1.2.2. Association with the quasi biennial cycle in SA. Djurovic and Paquet (1993) noted therelationship between a QB oscillation in green corona activity and one in Earth rotation. AAMbeing the main contributor to LOD at these scales, it is therefore important to understand thesolar imprint, if there is one, within this band over the atmosphere.Solar activity presents a quasi-biennial cycle, observed especially in sunspot numbers (Shapiroand Ward, 1962; Akioka et al., 1987) as well as other solar activity indexes: solar variability (Baoand Zhang, 1998; Benevolenskaya, 1998), neutrino flux (Sakurai, 1979, 1981), magnetic field(Riven and Obidko, 1992), radio flux at 10.7 cm, solar flare rate, X-ray burst, sunspot area, solardiameter variations in addition to the green corona activity noted above. It is a well-establishedpeak in solar activity although its amplitude is rather weak when compared to the 11-year cycle.We will study its relationship respectively with the t-QBO and the s-QBO of AAM.
The t-QBO. The correlation of the quasi biennial oscillation in SA (QBO-SA) with the QBO ofAAM in the troposphere, is weak (correlation found is 0.41 SA at a time lead of 73 months) whilethe correlation with the global AAM (troposphere and stratosphere) is 0.6, with the SAleading (also by 73 months). An extended analysis of SA with SOI over 1866 to 2000 revealscorrelations of about 0.3, and moreover with the SOI leading SA by 50 months. However
430 R. Abarca del Rio et al. / Journal of Geodynamics 36 (2003) 423–443
when considering only the recent period since 1950, a similar level of correlation exists, thoughwith a reversal in the sense of the lag, with SA leading SOI.
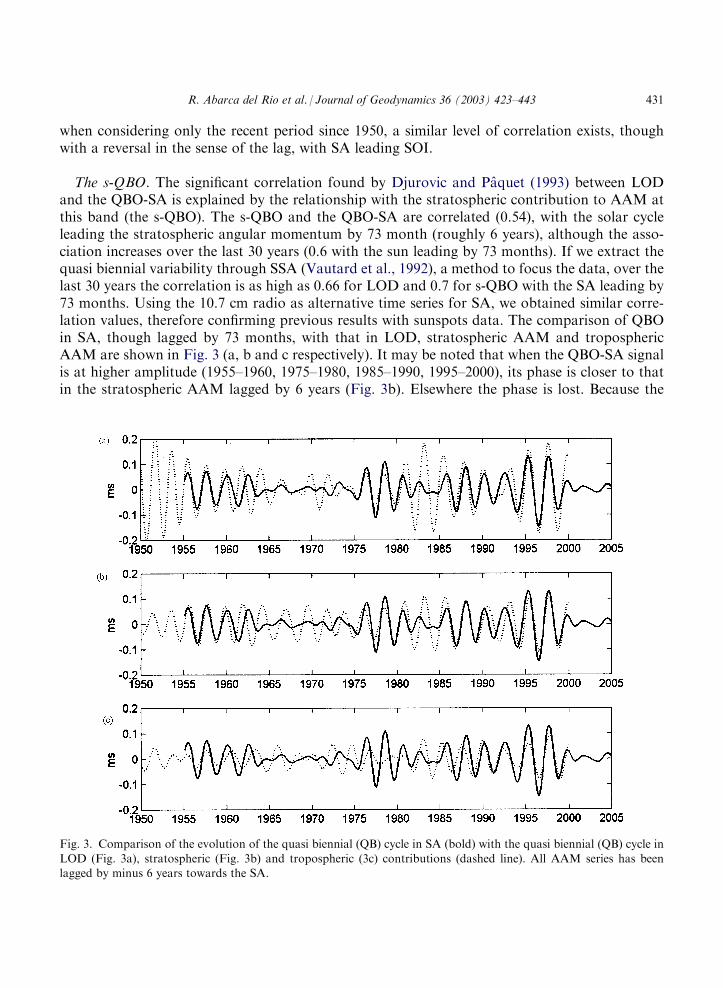
The s-QBO. The significant correlation found by Djurovic and Paquet (1993) between LODand the QBO-SA is explained by the relationship with the stratospheric contribution to AAM atthis band (the s-QBO). The s-QBO and the QBO-SA are correlated (0.54), with the solar cycleleading the stratospheric angular momentum by 73 month (roughly 6 years), although the asso-ciation increases over the last 30 years (0.6 with the sun leading by 73 months). If we extract thequasi biennial variability through SSA (Vautard et al., 1992), a method to focus the data, over thelast 30 years the correlation is as high as 0.66 for LOD and 0.7 for s-QBO with the SA leading by73 months. Using the 10.7 cm radio as alternative time series for SA, we obtained similar corre-lation values, therefore confirming previous results with sunspots data. The comparison of QBOin SA, though lagged by 73 months, with that in LOD, stratospheric AAM and troposphericAAM are shown in Fig. 3 (a, b and c respectively). It may be noted that when the QBO-SA signalis at higher amplitude (1955–1960, 1975–1980, 1985–1990, 1995–2000), its phase is closer to thatin the stratospheric AAM lagged by 6 years (Fig. 3b). Elsewhere the phase is lost. Because the
Fig. 3. Comparison of the evolution of the quasi biennial (QB) cycle in SA (bold) with the quasi biennial (QB) cycle in
LOD (Fig. 3a), stratospheric (Fig. 3b) and tropospheric (3c) contributions (dashed line). All AAM series has beenlagged by minus 6 years towards the SA.
R. Abarca del Rio et al. / Journal of Geodynamics 36 (2003) 423–443 431
stratospheric AAM signal showed in this figure is the sum of all contributions from 70 hPa up to10 hPa [see Eq. (1)], we also investigate the correlation of the QBO in solar activity with the QBOin each layer over the stratosphere. In an analysis for the period between 1949 and 2000, AAM atthe10 hPa level leads SA by 12 months, and such lags increase up to 76 months at the lower 50and 70 hPa levels. Similar analysis with a monthly QBO index of three location in the equatorialzonal winds during 1956–1999 (Naujokat, 1986) reveals a downward signal propagation, withphases, at the 20, 30, 40, 50 and 70 hPa layers, increasingly lagging the solar signal by 64, 68, 71,73, and 76 months, respectively. Such correlations approach 0.5 over this 44-year period, butincreases if we only take in account the last 30 years. Longer periods would be necessary toreconfirm the relationship with the quasi biennial oscillation characteristics (Hamilton, 1998),though historical series are likely unobtainable.
3.2. Decadal time scales
Five decades of AAM are available from the NCEP-NCAR reanalyzes; however to study theatmosphere during the last century, we rely on atmospheric models run with boundary sea sur-face temperature forcing. For even lengthier analysis, we also extend our study into the historicpast by the use of a proxy climate indices of two equatorial sea surface temperature (SST) timeseries (Kaplan20 and Mann5) over 1730–2000.
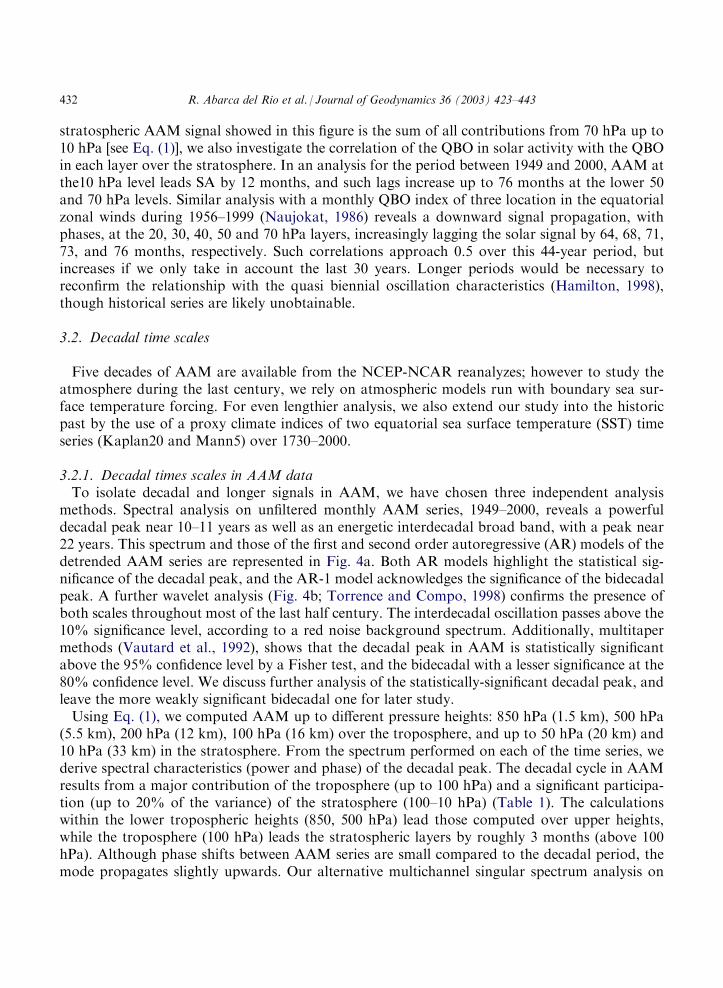
3.2.1. Decadal times scales in AAM dataTo isolate decadal and longer signals in AAM, we have chosen three independent analysismethods. Spectral analysis on unfiltered monthly AAM series, 1949–2000, reveals a powerfuldecadal peak near 10–11 years as well as an energetic interdecadal broad band, with a peak near22 years. This spectrum and those of the first and second order autoregressive (AR) models of thedetrended AAM series are represented in Fig. 4a. Both AR models highlight the statistical sig-nificance of the decadal peak, and the AR-1 model acknowledges the significance of the bidecadalpeak. A further wavelet analysis (Fig. 4b; Torrence and Compo, 1998) confirms the presence ofboth scales throughout most of the last half century. The interdecadal oscillation passes above the10% significance level, according to a red noise background spectrum. Additionally, multitapermethods (Vautard et al., 1992), shows that the decadal peak in AAM is statistically significantabove the 95% confidence level by a Fisher test, and the bidecadal with a lesser significance at the80% confidence level. We discuss further analysis of the statistically-significant decadal peak, andleave the more weakly significant bidecadal one for later study.Using Eq. (1), we computed AAM up to different pressure heights: 850 hPa (1.5 km), 500 hPa(5.5 km), 200 hPa (12 km), 100 hPa (16 km) over the troposphere, and up to 50 hPa (20 km) and10 hPa (33 km) in the stratosphere. From the spectrum performed on each of the time series, wederive spectral characteristics (power and phase) of the decadal peak. The decadal cycle in AAMresults from a major contribution of the troposphere (up to 100 hPa) and a significant participa-tion (up to 20% of the variance) of the stratosphere (100–10 hPa) (Table 1). The calculationswithin the lower tropospheric heights (850, 500 hPa) lead those computed over upper heights,while the troposphere (100 hPa) leads the stratospheric layers by roughly 3 months (above 100hPa). Although phase shifts between AAM series are small compared to the decadal period, themode propagates slightly upwards. Our alternative multichannel singular spectrum analysis on
432 R. Abarca del Rio et al. / Journal of Geodynamics 36 (2003) 423–443
zonal wind in vertical layers (see Abarca del Rio et al., 2000) also confirms such upward propa-gation from the surface throughout the troposphere and into the stratosphere.To quantify the common signal between solar activity and atmospheric angular momentum, weapplied a co-herency applied coherency spectrum (Fig. 4c; Hinich and Clay, 1968) to the AAMand solar activity series. Results indicate significant relationship at decadal time scales with sta-tistical significance (Julian, 1974) for the 95% limit (P=0.63). The phase spectrum shows nosignificant phase lead or lag between the series. The coherency spectrum suggests as well that theseries are unrelated at other low frequencies, such as the bidecadal peak in AAM. A waveletcoherency approach (Torrence and Webster, 1999) also confirmed these results.When the series is subjected to low-pass filtering with a cut-off at 8 years (Fig. 5a), a rela-tionship between solar activity and AAM at decadal time scales emerges. The maximum corre-lation between the two series is 0.74, solar activity leading LOD by 2-months.With these series
Fig. 4. Decadal variability in AAM. (a) Power spectra of AAM (solid), AR1 (dashed) and AR2 (solid grey) models. (b)Wavelet power spectrum. Contour levels are chosen so that 75%, 50%, 25% and 5%of the wavelet power is above each level,
respectively. Black contour is the 10% significance level, using a red noise (autoregressive lag=0.98) background spectrum. (c)Square Coherency (solid line) and phase shift (dashed grey line) of the AAM and SA for periods from 2 to 30 years.
R. Abarca del Rio et al. / Journal of Geodynamics 36 (2003) 423–443 433

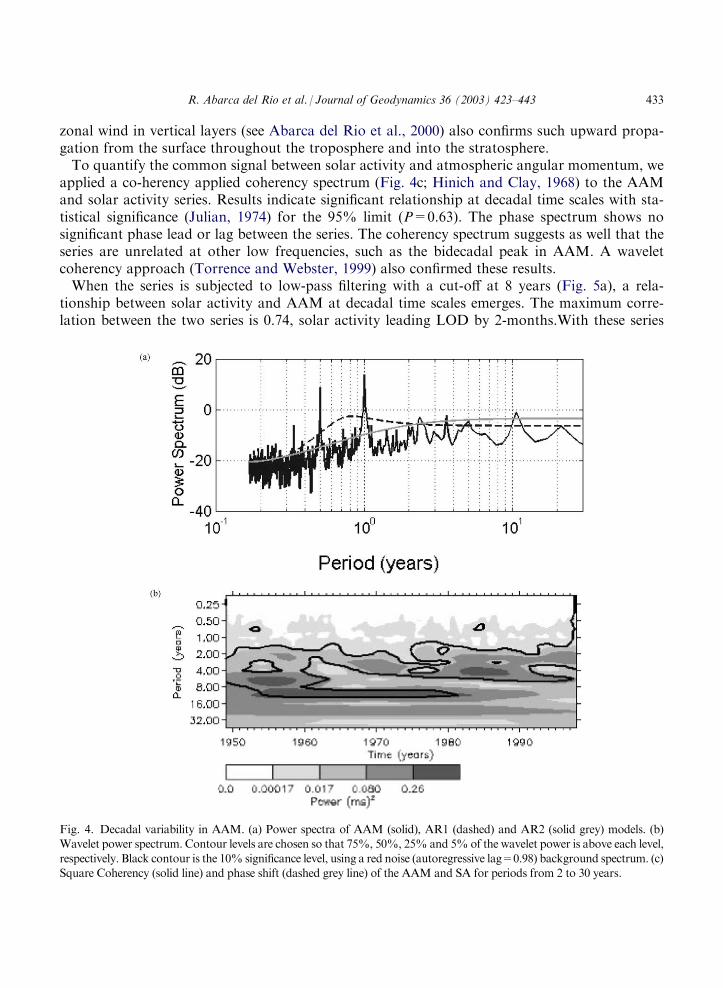
band-pass filtered between 8 and 16 years (Fig. 5b), the relationship at decadal time scales isfurther clarified. The AAM signal shows decadal fluctuations of about 0.07 ms, with peaks closeto the years 1960, 1970, 1980 and 1990, almost coincident with those of the solar cycles. Thecorrelation between decadal cycles increases to 0.91 with a 2-month lag (solar input leading).When the AAM and SA series of Figs. 5a and b are directly subtracted (5a�5b), separating lowertime scales, the AAM series displays interdecadal fluctuations of about 0.02 ms, with peaks near1960 and 1980, revealing a periodicity of about 20 years (in grey in Fig. 5b), agreeing thereforewith the above spectral analysis (Fig. 4a and b).
Fig. 4. (continued)
Table 1Characteristics of the decadal cycle in the AAM series integrated up to different pressures heights (hPa) in the
atmosphere
Height
Amp (%) Lag (m)10
100 050
93.2 �2.5 100 80.6 �3 200 60.4 �3.5500
31.6 �4 850 6.3 �4.5The first column presents the upper atmospheric height integrated. The second and third columns, the variance (inpercentage), and the phase (in months), with respect to the AAM series integrated up to 10 hPa.
434 R. Abarca del Rio et al. / Journal of Geodynamics 36 (2003) 423–443
This figure confirms that although AAM and the solar activity series present a related varia-bility at decadal times scales, they appear to be unrelated at lower frequencies.We take advantage of the long series of AAM from the model runs of both NCAR (Kiehl et al.,1998) and theHadley Centre (Rosen and Salstein, 2000).We applied the same technique than above forfiltering the raw data, i.e. resulting in a 8–13 years band pass filtering. In this figure, the solar decadalcycle and the decadal cycle in AAMagree only over the last decades (Fig. 6a).Moreover, the amplitudeof the annual cycle of AAM (Fig. 6b) appears to be well related to the variability in the solar forcing.
3.2.2. Decadal time scales in sea surface temperature (SST) fieldsHistorical values of SA are compared to the lengthy nearly-three century long series in seatemperature Kaplan20 and Mann5 time series (Fig. 7a and b, respectively). We made sure to limit
Fig. 5. Comparison of SA (solid line) and AAM (dashed). (a) Low pass filtered (> 8 years). (b) Band pass filtered(8–16 years) and low pass filtered (> 16 years, in grey).
Fig. 6. Top: Comparison of ensemble averages of simulations of AAM by NCAR (dashed) and UKMO (solid) and theSA (bold solid), band pass filtered between 8 and 13 years since 1870. Bottom: Similar but for amplitude of the annualcycle.
R. Abarca del Rio et al. / Journal of Geodynamics 36 (2003) 423–443 435
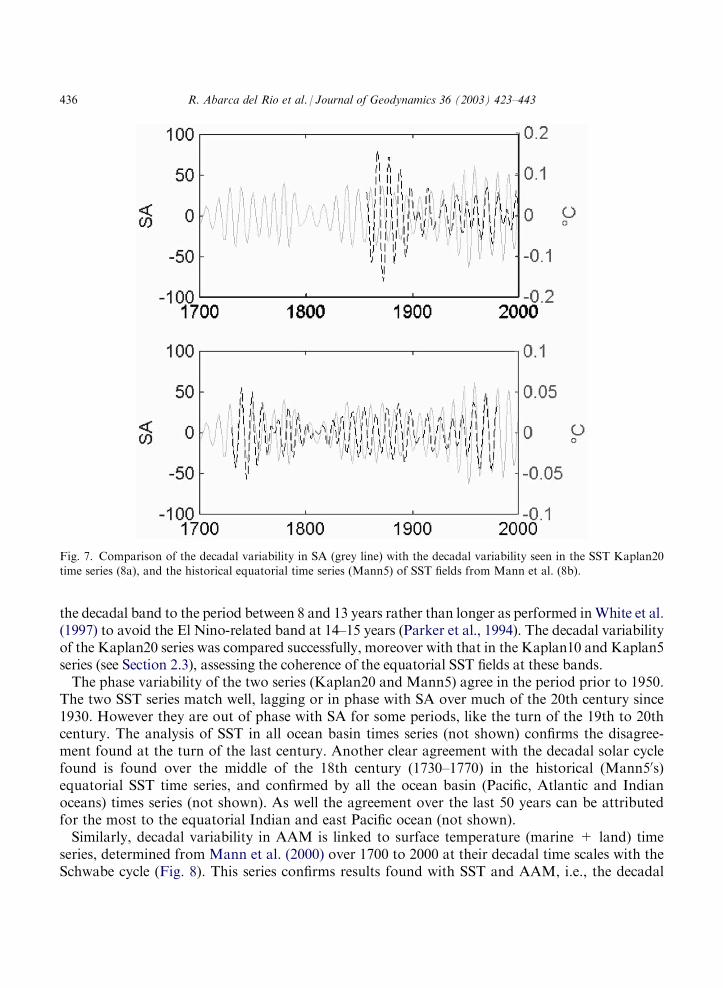
the decadal band to the period between 8 and 13 years rather than longer as performed inWhite et al.(1997) to avoid the El Nino-related band at 14–15 years (Parker et al., 1994). The decadal variabilityof the Kaplan20 series was compared successfully, moreover with that in the Kaplan10 and Kaplan5series (see Section 2.3), assessing the coherence of the equatorial SST fields at these bands.The phase variability of the two series (Kaplan20 and Mann5) agree in the period prior to 1950.The two SST series match well, lagging or in phase with SA over much of the 20th century since1930. However they are out of phase with SA for some periods, like the turn of the 19th to 20thcentury. The analysis of SST in all ocean basin times series (not shown) confirms the disagree-ment found at the turn of the last century. Another clear agreement with the decadal solar cyclefound is found over the middle of the 18th century (1730–1770) in the historical (Mann50s)equatorial SST time series, and confirmed by all the ocean basin (Pacific, Atlantic and Indianoceans) times series (not shown). As well the agreement over the last 50 years can be attributedfor the most to the equatorial Indian and east Pacific ocean (not shown).Similarly, decadal variability in AAM is linked to surface temperature (marine + land) timeseries, determined from Mann et al. (2000) over 1700 to 2000 at their decadal time scales with theSchwabe cycle (Fig. 8). This series confirms results found with SST and AAM, i.e., the decadal
Fig. 7. Comparison of the decadal variability in SA (grey line) with the decadal variability seen in the SST Kaplan20time series (8a), and the historical equatorial time series (Mann5) of SST fields from Mann et al. (8b).
436 R. Abarca del Rio et al. / Journal of Geodynamics 36 (2003) 423–443
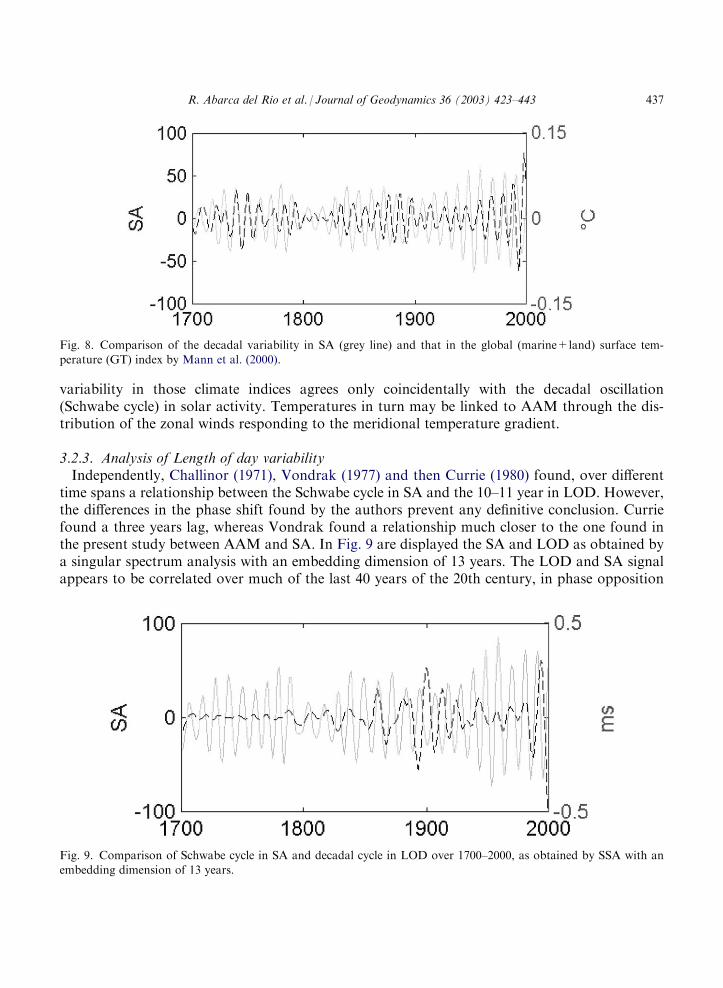
variability in those climate indices agrees only coincidentally with the decadal oscillation(Schwabe cycle) in solar activity. Temperatures in turn may be linked to AAM through the dis-tribution of the zonal winds responding to the meridional temperature gradient.
3.2.3. Analysis of Length of day variabilityIndependently, Challinor (1971), Vondrak (1977) and then Currie (1980) found, over differenttime spans a relationship between the Schwabe cycle in SA and the 10–11 year in LOD. However,the differences in the phase shift found by the authors prevent any definitive conclusion. Curriefound a three years lag, whereas Vondrak found a relationship much closer to the one found inthe present study between AAM and SA. In Fig. 9 are displayed the SA and LOD as obtained bya singular spectrum analysis with an embedding dimension of 13 years. The LOD and SA signalappears to be correlated over much of the last 40 years of the 20th century, in phase opposition
Fig. 8. Comparison of the decadal variability in SA (grey line) and that in the global (marine+land) surface tem-perature (GT) index by Mann et al. (2000).
Fig. 9. Comparison of Schwabe cycle in SA and decadal cycle in LOD over 1700–2000, as obtained by SSA with anembedding dimension of 13 years.
R. Abarca del Rio et al. / Journal of Geodynamics 36 (2003) 423–443 437
about the turn of 19th to the 20th centuries and out of phase before. Determining such relation-ships with LOD data before 1950, particularly before 1920 is difficult due to the lower precisionthen (Jordi et al., 1994). In particular, the variable evolution of phase shift between the Schwabecycle and the climatic decadal cycle, seen in number of surface parameters presented here ismaintained.
4. Discussion and conclusion
Atmospheric angular momentum (AAM) as a useful indicator of the whole atmosphericdynamic state, allows an unprecedented opportunity to test and understand solar-atmosphereconnections. The results obtained in this research can be subdivided in two sections: interannualand decadal times scales.
4.1. Interannual times scales
At interannual time scales, we extended to AAM during 1949–2000, the relationship betweenthe decadal cycle in solar activity (the so called Schwabe cycle) found by other authors andother parameters, and the period of the quasi biennial oscillation (QBO) over the stratosphere,here in the stratospheric part of atmospheric angular momentum (the s-QBO). A deeper analy-sis shows that the lag between those decadal oscillations is not constant and varies slightly fromabout 3 years in 1965 to 5 years in 1995. It is also possible that the internal tropospheric climatevariability plays a role too in the quasi-biennial period variability, though less likely, accordingto our results. Additionally, these phase lags could be contaminated by other sources of internalvariability, such as volcanism (Robock, 1978) which may affect stratospheric variability, or theproximity of a decadal oscillation in ENSO (Hanson et al., 1989; Dovgalyuk and Klimenko,1996). Nevertheless, the amplitude variability of the stratospheric QBO in AAM is closer too tothe decadal scales seen in ENSO (13–14 years) (Hanson et al., 1986; Dovgalyuk and Klimenko,1996).The quasi biennial cycle in solar activity is also interesting. QBO in the stratospheric compo-nent of AAM as well as that of the index of the stratospheric winds (Naujokat, 1986) presents aphase variability lagged by 6 years (73 months) with regards to the QB cycle present in solaractivity, explaining a result found by Djurovic and Paquet (1993) regarding a correlation betweenLOD and solar activity at this band. However the weak amplitude of this signal in solar activity(when compared to the more powerful Schwabe cycle) as well as the time dependence of theassociation found (the signals over the stratosphere are in phase only when the amplitude of thesolar QB cycle is strong) prevents any definitive conclusion. It is difficult to believe that a pow-erful decadal cycle may not imprint the decadal variability in climate, and it is the case for aweaker QBO. An interesting possibility is to consider the Schwabe cycle to control the phase ofthe quasi biennial cycle in solar activity and in the stratosphere. Therefore, both relationshipscould support each other independently. The 6-year lag between both quasi biennial oscillationscould be interpreted as an indication that the association between solar variability and climate islagged. Consequently, we might consider that the atmosphere is imprinted by solar activity at thisscale. This possible association needs further investigations.
438 R. Abarca del Rio et al. / Journal of Geodynamics 36 (2003) 423–443

Conversely, the quasibiennial oscillation and the tri-quadrennial oscillation over the tropo-sphere do not appear to be related with solar activity, either directly or modulated by decadalvariability and comparable phase variability. In the case of the quasi-biennial cycle, it appearsthat it is somewhat correlated with the quasi biennial oscillation in solar activity (QBO-SA) overthe last 50 years, though leading SA through part of the last century. It is fortunate here that anmonthly index of the southern oscillation went back as far as 1866, which allows us to test this lagthrough times. Unfortunately, determination of stratospheric variability typically requires in situdata, and thus is not extant prior to the rocket age as well as not much information is availableprior to the International Geophysical Year, 1958.
4.2. Decadal times scales
Relative AAM, based on zonal wind reanalysis of NCEP/NCAR from 1949 to 2000, integratedup to 10 hPa (99% of the total mass of the atmosphere), exhibits a significant decadal period of10–12 years and an interdecadal oscillations of 22 years, with somewhat less statistical sig-nificance. Its variance, roughly 0.07 and 0.03 ms, respectively, are important for the globalangular momentum of the Earth and should be further investigated.The decadal cycle in AAM is shown here to be due to the whole atmosphere in both magnitudeand phase, with the troposphere contributing up to 80% of the total power. We also showed thatthis decadal cycle can originate in surface processes, as the troposphere leads the stratosphere.The decadal cycle in the global AAM presents no significant phase shift (2 months in average)with the solar decadal cycle.At the turn of the 20th century, decadal variability in AAM as given by the NCAR and HadleyCentre atmospheric model runs, as well as in LOD, appears to be out of phase with the Schwabecycle, and thus in phase with each other. It is interesting to note here, that although the quality ofLOD data is considerably lower at the early part of the 20th century, it could kept well the phaseof the atmospheric signature.On the other hand,LauandWeng (1995) asWhite et al. (1997), find significant solar-related signals inequatorial SST over the entire century. The discrepancy seen between their SST signals and our AAMseries, given particularly that the UKMO and NCAR model runs from which is issued the AAMinvestigated here were forced by SST fluxes, lead us to investigate decadal variability in SST. The twoSST series, the Kaplan20 (1856–2000) and Mann5 (1730–1980) indicate a lag with solar activity since1930but isoutofphaseprior toabout1900;however, partial agreementwaspresentduring themid18thcentury.We extended the comparison to decadal variability in the global surface (land+marine) tem-perature (GT) reconstruction by Mann et al. (2000) back to 1700 and found agreement with theabove; series of GT are similar to those of SST regarding agreement with the solar signal. Itappears therefore that independent measurements (SST, GT, AAM, LOD) confirms the out ofphase lag of the climatic decadal variability at the turn of the 19th to the 20th century, as well asthe partial agreement over the last 50 years. Based on this historical analysis of decadal variabilityin climate and geodetic variables, it is possible to say that the particular relationship found sinceat least 50 years between SA and equatorial SST is most probably coincidental.Nonetheless, note that a partial relationship over the last few decades and phase opposition at theturn of the century, which may agree well with a relationship found at decadal times scalesbetween solar activity, surface air temperature changes (Nitta and Yoshimura, 1993; Parker et al.,
R. Abarca del Rio et al. / Journal of Geodynamics 36 (2003) 423–443 439
1994), decadal variability in SST, AAM and LOD, can be also very well explained by the presence ofvery close independent decadal periods in solar activity and climate (for example, 11 years and 10.2years).We may note here that the failure of decadal atmospheric variations to remain coherent withthe solar cycle prior to around 1900 does not preclude such agreement since that time. As dis-cussed by Feynmann and Crooker (1978), the yearly means of the geomagnetic index Aa, which isrepresentative of solar wind velocity and magnetic field disturbances were between a half and athird of its strength during the last three decades when compared to that at the beginning of thecentury. With weaker forcing by the solar wind the phase lock to the solar cycle of internal decadalvariability could have been lost. Also, reconstruction of past solar irradiance (Hoyt and Schatten,1997) shows an increase since at least 1940, with the largest irradiance ever measured, a likelyexplanation for the current association. Moreover, since decadal atmospheric variability may notuniquely identified with the 11-year solar cycle, a lack of full agreement with the solar forcing evenmore recently does not exclude its impact on the climate and momentum-related indices.However, whatever the source of the decadal cycle in AAM may be, internal or external, thisoscillation in the global atmosphere (troposphere and stratosphere) is suggested here to be gen-erated by upward propagation of surface atmospheric modes, from the surface throughout thetroposphere through the stratosphere. Because AAM represents the dynamic state of the globalatmosphere, decadal vacillations seen in different parameters over the stratosphere (geopotentialheight, temperature, zonal winds, clouds, see Section 1) are most probably associated with thesedynamics, and show the influence of surface processes within the troposphere rather than anexternal forcing directly into the middle atmosphere. Also, because the long-term analysis per-formed here in either proxy, reconstructed or measurements associated with tropical SST or globaltemperature do not show a full association with the Schwabe cycle, such decadal stratosphericvacillations associated with the solar cycle may not have been evident in past times. However, thestrength of the stratospheric QBO indicates an atmospheric role, through historical tropical surfacetemperature and other measurements. The present results indicate the need for better understandingof atmospheric dynamics at decadal time scales. It seems that the coming years will be fruitful in thisregard, given the advent of extended and improved atmospheric and solar data.
Acknowledgements
The authors are grateful to two referees whose useful comments helped improve the originalversion of the paper. The National Center for Atmospheric Research is sponsored by the USNational Science Foundation. The work is partially supported by the US NASA Solid Earth andNatural Hazards Program.
References
Abarca del Rio, R., Gambis, D., Salstein, D.A., 2000. Interannual signals in length of day and atmospheric angular
momentum. Ann. Geophys. 18, 347–364.Abarca del Rio, R., 1997. La rotation de la Terre: Etude du cycle annuel et de la variabilite basse frequence. Etudeclimatique de la rotation Terrestre. PhD thesis, Universite Paul Sabatier.
440 R. Abarca del Rio et al. / Journal of Geodynamics 36 (2003) 423–443

Akioka, M., et al., 1987. The 17-month periodicity of sunspot activity. Solar. Phys. 112, 313–316.
Arnold, N.F., Robinson, T.R., 1998. Solar cycle changes to planetary wave propagation and their influence on themiddle atmosphere circulation. Ann. Geophys. 16, 69–76.Baldwin, M.P., Gray, L.J., Dunkerton, T.J., Hamilton, K., Haynes, P.H., Randel, W.J., Holton, J.R., Alexander, M.J.,
Hirota, I., Horinouchi, T., Jones, D.B.A., Kinnersley, J.S., Marquardt, C., Sato, K., Takahashi, M., 2001. TheQuasi-biennial oscillation. Reviews of Geophysics 39 (2), 179–229.Bao, S., Zhang, H., 1998. Patterns of current helicity for the solar cycle 22. Astrophys. J. 496, 43–46.
Barnes, R.T.H., Hide, R., White, A.A., Wilson, C.A., 1983. Atmospheric angular momentum fluctuations, length ofday changes and polar motion. Proc. R. Soc. Lon. 387, 31–73.Benevolenskaya, E.E., 1998. A model of the double magnetic cycle of the sun. Astrophys. J. 59, 49–52.Berson, F.A., Kulkarni, R.N., 1968. Sunspot cycle and the quasibiennial oscillation. Nature 217, 1133–1134.
Bertrand, C., van Ypersele, J.-P., Berger, A., 1999. Volcanic and solar impacts on climate since 1700. Clim. Dyn. 15,355–367.Black, R.X., Salstein, D.A., Rosen, R.D., 1996. Interannual modes of variability in atmospheric angular momentum. J.
Clim. 9, 2834–2849.Challinor, R.A., 1971. Variations in the rate of rotation of the Earth. Science 172, 1022–1024.Chen, T.-C., Tribbia, J.J., Yen, M.C., 1996. Interannual variation of global atmospheric angular momentum. J. Atm.
Sci. 53, 2852–2857.Crowley, T.J., Kim, K.-Y., 1996. Comparison of proxy records of climate change and solar forcing. Geophys. Res.Lett. 23, 359–362.
Crowley, T.J., 2001. Causes of climate change over the past 1000 years. Science 289, 270–277.Cubasch, U., Voss, R., Hegerl, G.C., Waszkewitz, J., Crowley, T.J., 1997. Simulation of the influence of solar radiationvariations on the global climate with an ocean-atmosphere general circulation model. Clim. Dyn. 13, 757–767.Currie, R.G., 1980. Detection of the 11-yr sunspot cycle signal in Earth rotation. Geophys. J. R. Astr. Soc. 61, 131–140.
Diamantides, N.D., 1998. Long-term solar activity and terrestrial connections. Part II: at the beckon of the sun? Ann.Geophys. 16, 492–509.Dickey, J.O., Marcus, S.L., Hide, R., 1992. Global propagation of interannual fluctuations in atmospheric angular
momentum. Nature 357, 484–488.Dickey, J.O., Gegout, P., Marcus, S.L., 1999. Earth-atmosphere angular momentum exchange and ENSO: the rota-tional signature of the 1997–98 event. Geophys. Res. Lett. 26, 2477–2488.
Djurovic, D., Paquet, P., 1993. Quasi-biennial oscillation in green corona activity and Earth rotation. Astron. Astro-phys. 277, 669–676.Djurovic, D., Paquet, P., 1996. The common oscillations of solar activity, the geomagnetic field, and the Earth rota-
tion. Solar. Phys. 167, 427–439.Dovgalyuk, V.V., Klimenko, V.V., 1996. On long term variations in the intensity of El Nino occurrences. Geophys.Res. Lett. 23, 3771–3774.Eddy, J.A., 1976. The Maunder Minimum. Science 192, 1189–1202.
Eubanks, T.M., 1993. Variations in the orientation of the Earth. In Contributions of Space Geodesy to geodynamics,edited by S.D.E., and D.L. Turcotte, 24, pp. 1–54, American Geophysical Union, Washington, DC.Feynman, J., Crooker, N.U., 1978. The solar cycle at the turn of the century. Nature 275, 626.
Friis-Christensen, E., Lassen, K., 1991. Length of the solar cycle: an indicator of solar activity closely associated withclimate. Science 254, 698–700.IERS Annual Report for 1999, Observatoire de Paris, Gambis (Ed.).
Gierens, K., Ponater, M., 1997. Comment on ‘‘Variation of cosmic ray flux and global cloud coverage—a missing linkin solar-climate relationships’’ by H. Svensmark and E. Friis-Christensen. J. Atmos. Solar-Terr. Phys. 61, 795–797.Gorney, D.J., 1990. Solar cycle effects on the near-Earth space environment. Rev. Geophys. 28, 315–336.Gross, R.S., 2001. A combined length-of-day series spanning 1832–1997: LUNAR97. Phys. Earth Planet. Inter. 123,
65–76.Hamilton, K., 1990. A look at the recently proposed solar-QBO-weather relationship. J. Clim. 3, 497–503.Hamilton, K., 1998. Observations of tropical stratospheric winds before world war II. Bull. Amer. Meteor. Soc. 79,
1367–1371.
R. Abarca del Rio et al. / Journal of Geodynamics 36 (2003) 423–443 441
Hanson, K., Brier, G.W., Maul, G.A., 1989. Evidence of significant non random behavior in the recurrence of strong
El Nino between 1525 and 1988. Geophys. Res. Lett. 16, 1181–1184.Hinich, M.J., Clay, C.S., 1968. The application of the discrete Fourier transform in the estimation of power spectra,coherence, and bispectra of geophysical data. Rev. Geophys. 6, 347–363.
Hopfner, J., 1998. Seasonal variations in length of day and atmospheric angular momentum. Geophys. J. Int. 135, 407–437.Hopfner, J., 2001. Atmospheric, oceanic and hydrological contributions to seasonal variations in length of day. J.Geod. 75, 137–150.
Hoyt, D.V., Schatten, K.H., 1997. The Role of the Sun in Climate Change. Oxford University Press, New York.IPCC (Intergovernmental Panel on Climate Change), 2001. Climate change. In: Houghton, G.J., Jenkins, G.J.,Ephraums, J.J. (Eds.), The IPCC scientific assessment. Cambridge University Press, Cambridge, p. 364.Jordi, C., Morrison, L.V., Rosen, R.D., Salstein, D.A., Rosello, G., 1994. Fluctuations in the earth’s rotation since
1830 from high resolution astronomical data. Geophys. J. Int. 117, 811–818.Julian, P.R., 1974. Comments on the determination of significance of the coherence statistic. J. Atm. Res. 32, 836–837.Kalnay, E., Kanahitsu, M., Kistler, R., Collins, W., Deaven, D., Gandin, L., Iredell, H., Saha, S., White, S., Woollen,
J., Zhu, Y., Chelliah, M., Ebisuzaki, W., Higgins, W., Jandwiak, J., Mo, K.C., Ropelewski, C., Wang, J., Leetma,A., Reynolds, R., Jenne, R., Joseph, D., 1996. The NCEP/NCAR 40-year reanalysis project. Bull. Amer. Meteor.Soc. 77, 437–471.
Kaplan, A., Cane, M., Kushnir, Y., Clement, A., Blumenthal, B., Rajagopalan, B., 1998. Analyses of global sea surfacetemperature 1856–1991. J. Geophys. Res. 103, 18567–18589.Kiehl, J.K., Hack, J.J., Bonan, G.B., Boville, B.A., Williamson, D.L., Rasch, P.J., 1998. The National Center for
Atmospheric Research Community Climate Model: CCM3. J. Clim 11, 1151–1178.Kishcha, P.V., Dmitrieva, I.V., Obridko, V.N., 1999. Long-term variations of the solar-geomagnetic correlation, totalsolar irradiance, and the northern hemispheric temperature (1868–1997). J. Atm. Terr. Phys. 61, 799–808.Kodera, K., 1991. The solar and equatorial QBO influences on the stratospheric circulation during early northern
winter. Geophys. Res. Lett. 18, 1023–1026.Labitzke, K., 1987. Sunspots, the QBO, and the stratospheric temperature in the north polar region. Geophys. Res.Lett. 14, 535–537.
Labitzke, K., van Loon, H., 1990. Association between the 11-year solar cycle, the quasi-biennial oscillation and theatmosphere: a summary of recent work. Phil. Trans. Roy. Soc. London., A 330, 577–589.Labitzke, K., van Loon, H., 1997. The signal of the 11-year sunspot cycle in the upper troposphere-lower stratosphere.
Space Science Reviews 80, 393–410.Lau, K.-M., Weng, H., 1995. Climate signal detection using wavelet transform: how to make a time series sing. Bull.Am. Meteor. Soc. 76, 2391–2402.
Lean, J., Rind, D., 1999. Evaluating sun-climate relationships since the little ice age. J. Atm. Terr. Phys. 61, 25–35.Liao, D.C., Greiner-Mai, H., 1999. A new DELTA LOD series in monthly intervals (1892.0-1997.0) and its compar-ison with other geophysical results. J. Geodesy 73, 466–477.Mann, M.E., Gille, E., Bradley, R.S., Hughes, M.K., Overpeck, J., Keimig, F.T., Gross, W., 2000. Global temperature
patterns in past centuries : an interactive presentation. Earth Interactions 4, 4, 1–28.Marcus, S.L., Chao, Y., Dickey, J.O., Gegout, P., 1998. Detection and modeling of non tidal oceanic effects on earth’srotation rate. Science 281, 1656–1659.
Meehl, G.A., Washington, W.M., Wigley, T.M.L, Arblaster, J.M., Dai, A., 2003. Solar and greenhouse gas forcing andclimate response in the twentieth century. J. Climate 16, 426–444.Michaelsen, J., 1986. Long period fluctuations in El Nino amplitude and frequency reconstructed from tree-rings. In:
Peterson, D.H. (Ed.), Aspects of Climate Variability in the Pacific and Western Americas, Geophysical Monograph55. American Geophysical Union, Washington DC, pp. 69–74.Naito, Y., Hirota, I., 1997. Interannual variability of the northern winter stratospheric circulation related to the QBOand the solar cycle. J. Meteor. Soc. Japan 75, 925–937.
Naujokat, B., 1986. An update of the observed quasi-biennial oscillation of the stratospheric winds over the tropics. J.Atmos. Sci. 43, 1873–1877.Nesme-Ribes, E., Thuillier, G., 2000. Histoire solaire et climatique, Ed. Belin, Paris, Coll ‘‘Pour la Science’’ (Scientific
American).
442 R. Abarca del Rio et al. / Journal of Geodynamics 36 (2003) 423–443
Nitta, T., Yoshimura, J., 1993. Trends and interannual and interdecadal variations of global land surface air tem-
perature. J. Meteor. Soc. Japan 67, 375–383.Pap, J.P., Frohlich, C., 1999. Total solar irradiance variations. J. Atm. Terr. Phys. 61, 15–24.Parker, D.E., Jones, P.D., Folland, C.K., Bevan, A., 1994. Interdecadal changes of surface temperature since the late
nineteenth century. J. Geophys. Res. 99, 14373–14399.Parker, E.N., 2000. The physics of the sun and the gateway to the stars. Physics Today 53, 26–31.Peixoto, J.P., Oort, A.H., 1992. Physics of Climate. American Institute of Physics, New York.
Pittock, A.B., 1978. A critical look at long-term sun-weather relationships. Rev. Geophys. Space. Phys. 16, 400–420.Pittock, A.B., 1983. Solar variability, weather and climate: an update. Quart. J. Roy. Met. Soc. 109, 23–57.Quiroz, R.S., 1981. Period modulation of the stratospheric quasi-biennial oscillation. Mon. Wea. Rev. 109, 665–674.Reid, G.C., 1995. The sun-climate question: Is there a real connection ? Rev. Geophys. 33, 535–538.
Riven, Y.R., Obidko, V.N., 1992. Frequency composition of multiyear variations of the magnetic field of the sun as awhole. Sov. Astron. (American Institute of Physics translation) 36, 557–560.Robock, A., 1978. Internally and externally caused climate changes. Amer. Meteor. Soc. 35, 1111–1122.
Rosen, R.D., Salstein, D.A., 1983. Variations in atmospheric angular momentum on global and regional scales andlength of day. J. Geophys. Res. 88, 5451–5470.Rosen, R.D., Salstein, D.A., Wood, D.A., 1991. Zonal contributions to global momentum variations on intrasea-
sonnal through interannual time scales. J. Geophys. Res. 96, 5145–5151.Rosen, R.D., Salstein, D.A., 2000. Multidecadal signals in the interannual variability of atmospheric angular momen-tum. Clim. Dyn. 16, 693–700.
Sadourny, R., 1994. L’influence du Soleil sur le climat. C.R. Acad. Sci. Paris 319, 1325–1342.Salby, M.L., Shea, D.J., 1991. Correlations between solar activity and the atmosphere: an unphysical explanation. J.Geophys. Res. 96, 22579–22595.Sakurai, K., 1979. Quasi-biennial variations of the solar neutrino flux and solar activity. Nature 278, 146–148.
Sakurai, K., 1981. Quasi-biennial periodicity in the solar neutrino flux and its relation to the solar structure. SolarPhys. 74, 35–41.Schuh, H., Schmitz-Hubsch, H., 2000. Short period variations in Earth rotation as seen by VLBI. Surveys in Geo-
physics 21, 499–520.Schwabe, H., 1843. Solar observations during 1843. Astron. Nachr. 21, 233–237.Shapiro, R., Ward, F., 1962. A neglected cycle in sunspot numbers. J. Atmos. Sci. 19, 506–508.
Shindell, D.T., Rind, D., Balachandran, N., Lean, J., Lonergan, P., 1999. Solar cycle variability, ozone, and climate.Science 284, 305–308.Sun-Climate Connections, 2000. In: Sprigg, William A. Nasa Workshop in Sun-Climate Connections: Summary
report, 31 pp., University of Arizona, Arizona.Svensmark, H., Friis-Christensen, E., 1997. Variation of cosmic ray flux and global cloud coverage—a missing link insolar-climate relationships. J. Atmos. Solar-Terr. Phys. 59, 1225–1232.Tett, S.F.B., Stott, P.A., Allen, M.A., Ingram, W.J., Mitchell, J.F.B., 1999. Causes of twentieth-century temperature
change near the Earth’s surface. Nature 399, 569–572.Torrence, C., Compo, G.P., 1998. A practical guide to wavelet analysis. Bull. Amer. Meteor. Soc. 123, 309–336.Torrence, C., Webster, P.J., 1999. Interdecadal changes in the ENSO-Monsoon system. J. Clim. 12, 2679–2690.
Vautard, R., Yiou, P., Ghil, M., 1992. Singular spectrum analysis: a toolkit for chaotic time series. Physica D 38, 74–95.Vondrak, J., 1977. The rotation of the Earth between 1955.5 and 1976.5. Studia geoph. et geod 21, 107–117.
Wang, B., Wang, Y., 1996. Temporal structure of the southern oscillation as revealed by waveform and waveletanalysis. J. Clim. 9, 1586–1598.White, A.A., 1989. A relationship between energy and angular momentum conservation on dynamical models. J. Atm.Sci. 46, 1855–1860.
White, W.B., Lean, J., Cayan, D.R., Dettinger, M.D., 1997. Response of global upper ocean temperature to changingsolar irradiance. J. Geophys. Res. 102, 3255–3266.
R. Abarca del Rio et al. / Journal of Geodynamics 36 (2003) 423–443 443