soil ecosystem services in agricultural systems viewed ... · staple-crop area includes cereals,...
TRANSCRIPT

3 May 2010 Soil Ecosystem Services, Sacramento CA 1
Soil Ecosystem Services in Agricultural Systems Viewed Through a Provisioning Lens
Kenneth G. Cassman Robert B. Daugherty Professor of Agronomy
University of Nebraska—Lincoln www.yieldgap.org

Backcasting Global Food Security
• What are the driving variables that will determine potential to achieve a food secure world in 2050 under a changing climate? • Slowing population growth to zero (9.5 billion
plateau) by mid-century, then gradual decline • Rate of economic growth and impact on diets and
energy use • Rate of increase in crop yields on existing crop land • Land-use change, especially the expansion of
agriculture into carbon-rich and bio-diverse natural ecosystems
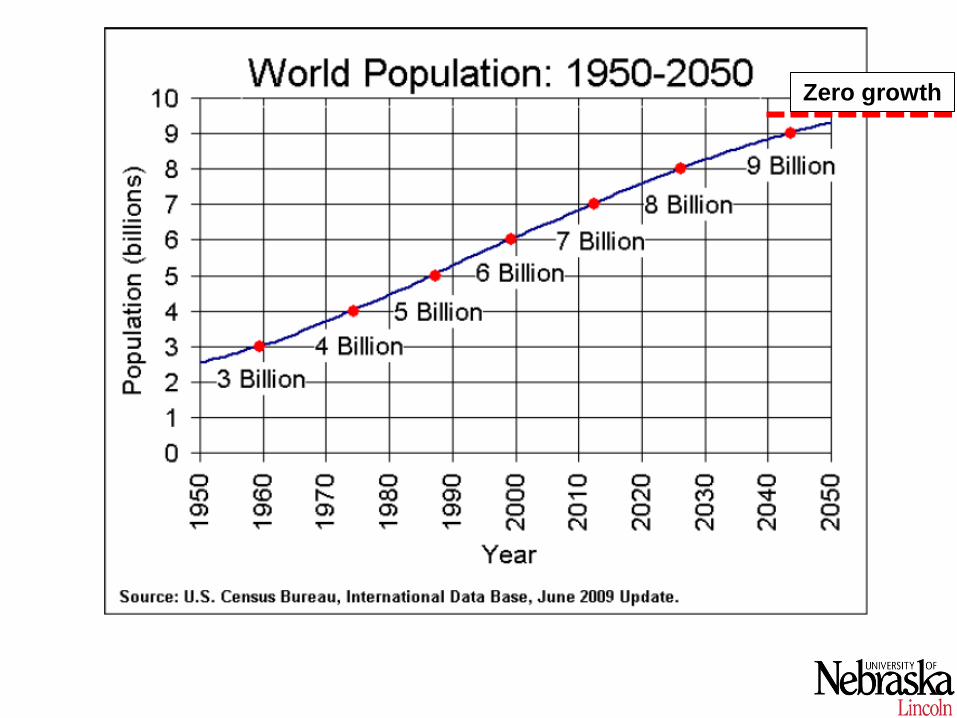
Zero growth

FOOD SECURITY adequate supply
accessible affordable
ECONOMIC GROWTH RATE
PER C
APITA
INC
OM
E
POPULATION GROWTH RATE
ENVI
RO
NM
ENTA
LQ
UA
LITY
VIRTUOUS CYCLE OR SPIRAL OF DEGRADATION? (per capita income of ~$5,000/yr required for zero population growth)

Research Priorities in Different Worlds
• World of plenty (the prevalent view in 2001) – Too much food, low commodity prices, reduced
poverty and malnutrition – Focus on alternative uses of grain (ethanol, bio-
plastics, higher end-use value…..) and policies that reduce crop production (land set-asides, multifunctional landscapes, organic agriculture…….)
• World of scarcity – Too little food, high commodity prices, increased
poverty and malnutrition – Increased yield and yield potential, ecological
intensification, yield gap analysis…..
From: Cassman KG. 2001. Crop science research to assure food security. In: Noesberger J et al (eds). Crop Science Progress & Prospects. CABI Intl

Estimating Future Food Demand • Econometric models
– Global computational equilibrium (partial equilibrium) models, such as IMPACT, GTAP
– Based on assumptions about population and income growth rates, available land area suitable for cultivation, trajectories in crop yields (assumptions about investment in research and translation to yield)
• How do food demand estimates compare with reality since 2001?
UNDERESTIMATED BY A LARGE MARGIN – Projected economic growth rates in world’s most populous
developing countries (e.g. China, India, Indonesia, Brazil, Russia, etc) were far too low
– Overestimated crop yield growth rates and did not account for biophysical yield limits
From: Cassman KG. 2001. Crop science research to assure food security. In: Noesberger J et al (eds). Crop Science Progress & Prospects. CABI Intl

Estimates of Future Food Supply • Econometric models (previous slide) • Biophysical estimates
– Based on rough estimates of available land, water, and simulated crop yield potential, assuming global “optimal use and management” and generic crop simulation models
• How do food supply estimates compare with reality since 2001? OVERESTIMATED BY A LARGE MARGIN – Competition for land and water not accounted for – Land suitability for high-yield production not
realistic From: Cassman KG. 2001. Crop science research to assure food security. In: Noesberger J et al (eds). Crop Science Progress & Prospects. CABI Intl

Year1965 1980 1995 2010 2025 2040 2055A
vera
ge U
S m
aize
yie
ld (k
g ha
-1)
0
5000
10000
15000
20000
25000
30000
35000
(15)
Extrapolation of 1965-2011
linear regression
(12)
(12)
(13)
(14,16)
SOLID LINE:linear regression (1965-2011)
y = -220114 + 114 xr2 = 0.87 (P<0.01)
Historic versus projected U.S. maize yield trends
Grassini, Eskridge & Cassman, Nature Comm (2014)
• Actual yield trends are decidedly linear
• Econometric models have primarily used exponential yield growth rates
• When linear rates have been used, they continue indefinitely without slowing

Year1960 1970 1980 1990 2000 2010
Gra
in y
ield
(Mg
ha-1
)
1
2
3
4
5Maize yield
slope = 65 kg ha-1 y-1
Rice yieldslope = 52 kg ha-1 y-1
Wheat yieldslope = 40 kg ha-1 y-1
1965
maize: 2.8%
rice: 2.9%
wheat: 2.9%
maize: 1.3%
2011
rice: 1.2%
wheat: 1.4%
Global Cereal Yield Trends, 1965-2011 (tyranny of linear growth rates)
Source: FAOSTAT

Year1960 1970 1980 1990 2000 2010
Gra
in y
ield
(t h
a-1)
0
2
4
6
8
R.Korea
China
Indonesia
India
Rice
Year1960 1970 1980 1990 2000 20100
2
4
6
8
Year1960 1970 1980 1990 2000 20100
2
4
6
8
10
12Wheat Maize
China
India
Northwest Europe
Brazil
China
USA-irrigated
USA-rainfed
Stagnating yields for RICE in Korea, Japan, and China; WHEAT in northwest Europe and India; MAIZE in China, and IRRIGATED MAIZE in the USA.
Cassman, 1999. PNAS, 96: 5952-5959 Grassini et al., 2011. FCR 120:142-152
Cassman et al., 2003, ARER 28: 315-358
Cassman et al., 2010, Handbook of Climate Change

1965 1975 1985 1995 2005
Year1965 1975 1985 1995 2005
Gra
in y
ield
(kg
ha-1
)
Linear (L) Quadratic-plateau (QP)
Linear piecewise (PW) Linear, upper plateau (LUP)
Exponential (EXP)Linear, lower plateau (LLP)
xy b + a = 00
0 x ify
x if ² c + b + a = >=≤
xyxxxy
0000
x if) x- ( c + y = x if b + a = >≤
xxyxxy
000
x if y = x if b + a =
>≤
xyxxy
00000
x if ) x- ( b + y = x if y = >≤
xxyxy xi- 1) + (b a xy =
Decreasingrate (PW-)
Increasingrate (PW+)
Robust, statistical analysis of crop yield trends
Grassini, Eskridge & Cassman, Nature Comm (2014)

Year1970 1980 1990 2000 2010
Ric
e gr
ain
yiel
d (M
g ha
-1)
0
2000
4000
6000
8000
10000
California
Korea, Rep.
South-central
China
Indonesia
Vietnam
India
United States:
Rice yield trends in selected countries
Grassini, Eskridge & Cassman, Nature Comm (2014)

Year1970 1980 1990 2000 2010
Whe
at g
rain
yie
ld (k
g ha
-1)
0
2000
4000
6000
8000
10000
India (LUP)
China (L)
Australia (L)
The Netherlands (LUP)
United Kingdom (LUP)
France (LUP)
Wheat yield trends in selected countries
Grassini, Eskridge & Cassman, Nature Comm (2014)

Year1970 1980 1990 2000 2010
Mai
ze g
rain
yie
ld (
kg h
a-1)
0
2000
4000
6000
8000
10000
12000
western, irrigated (L)
eastern (L)western, rainfed (L)
Italy (LUP)
China (PW-)
India (LLP)
Brazil (PW+)
Central Africa (LLP)
U.S. Corn Belt:
Maize yield trends in selected countries
Grassini, Eskridge & Cassman, Nature Comm (2014)

Global analysis of crop yield trends
• Since 1965, yield trends of major cereal crops best-fit linear increase models in all countries
• No evidence of exponential rate of gain • 31% of total global production of major
cereal crops comes from countries in which rate of yield increase has markedly decreased or stagnated
• Rate of return on yield-enhancing research has fallen y 75% since 1965
From: Cassman KG. 2001. Crop science research to assure food security. In: Noesberger J et al (eds). Crop Science Progress & Prospects. CABI Intl

Staple-crop area includes cereals, oilseed, pulses, sugar, root, fiber, and tuber crops. Source: FAOSTAT
Year1970 1980 1990 2000 2010
Cro
p ha
rves
ted
area
(Mha
)
400
450
500
550
900
1000
1100
1200
1965-1980slope = 3.9 Mha y-1
Staple crops area
1965-1982slope = 5.3 Mha y-1
1982-2002slope = 1.6 Mha y-1
Rice + wheat + maize area
2002-2011slope = 9.8 Mha y-1
2003-2011slope = 5.9 Mha y-1
Under the radar: 22nd Century “Agricultural Bomb” 82% due to M, R, W, Soy

Brave New World Since 2005 • Rapid, sustained economic growth in most populous
developing countries • Rapid rise in energy demand and petroleum prices • Convergence of energy and agriculture • Smaller supply, relative to demand, of staple food crops;
increased price volatility • Slowing progress in reducing poverty and malnutrition • Limited supplies of good quality arable land and fresh
water to support high-yield agriculture • Stagnating yields in some of the most productive
cropping systems (no biotech panaceas) • Increasing concerns about environment and climate
change • These are likely to be LONG-TERM MEGATRENDS, which
means we are in a race against time to achieve global food security

The Challenge is Clear: Race against time
• Increase food supply +70% (cereals +60%) on existing crop and pasture land
• Substantially decrease environmental footprint of agriculture –Protect water quality and conserve water for
non-agriculture uses –Maintain or improve soil quality –Reduce greenhouse gas emissions –Protect wildlife and biodiversity
• Called “ecological intensification” (also called “sustainable” intensification)

The Challenge is Clear: Race against time
• Increase food supply +70% (cereals +60%) on existing crop and pasture land
• What about reducing post-harvest losses and waste, or changing human diets?
– Chris Barrett, Ag Economist, Cornell Univ.: Reducing food waste and changing diets to reduce food demand are ASPIRATIONS not components of a viable food security strategy
• Clear food supply target is essential to inform policies and to effectively focus investments in agricultural research and development, climate change, and land use

Issues Viewed Through a Food Security Lens
• Answers to questions about how future agriculture should look, and policies to get there, depend on scale at which the question is asked: local versus regional, national or global food security – Organic agriculture vs conventional – GMOs (recombinant DNA technology) – “Localvore" vs liberalized global trade – Cropping system diversity in terms of crop species
and crop germplasm – Large-scale confined feeding livestock operations
versus grassfed grazing systems

Staple-crop area includes cereals, oilseed, pulses, sugar, root, fiber, and tuber crops. Source: FAOSTAT
Year1970 1980 1990 2000 2010
Cro
p ha
rves
ted
area
(Mha
)
400
450
500
550
900
1000
1100
1200
1965-1980slope = 3.9 Mha y-1
Staple crops area
1965-1982slope = 5.3 Mha y-1
1982-2002slope = 1.6 Mha y-1
Rice + wheat + maize area
2002-2011slope = 9.8 Mha y-1
2003-2011slope = 5.9 Mha y-1
Under the radar: 22nd Century “Agricultural Bomb” 82% due to M, R, W, Soy

Ecosystem services that soils can provide
• Provisioning of food – Physical matrix for plant support and to absorb and supply water – Nutrient supply and buffering – Suppressive to diseases and insect pests
• Conservation of water quality and filtering of pollutants
• Flood control • Mitigation of climate change • Habitat for bio-diversity, which influences
biodiversity of terrestrial plant communities supported by soil

Why research on soil environmental services?
• Basic research – For its own sake – As component of natural ecosystems
• Mission-oriented applied research – Component of restoration ecology
(remediation, reconstitution, renewal) – To guide land-use decisions
– To improve performance of agricultural systems (ecological intensification for global
food security)

Research on soil ecosystem services (ES) that support the quest for ecological intensification
• Provides an opportunity to move beyond “descriptive” to “functional” soil biology/ecology, where the function is to support substantially higher yields while also reducing yield variability and improving other ecosystem services
• Key questions – Which soil properties support increased yields and
yield stability? – What are the critical thresholds for these properties? – Of these, which also provide other beneficial
ecosystem services? Thresholds for these?

Research on soil ecosystem services (ES) that support the quest for ecological intensification
• Key hypothesis Soil properties that support increased yields and yield stability also provide other beneficial ecosystem services
• Converse, are there biological, chemical, or physical soil properties that, if improved for crop production, do not also contribute to biodiversity, climate change mitigation/adaptation, flood control, water quality, etc.?
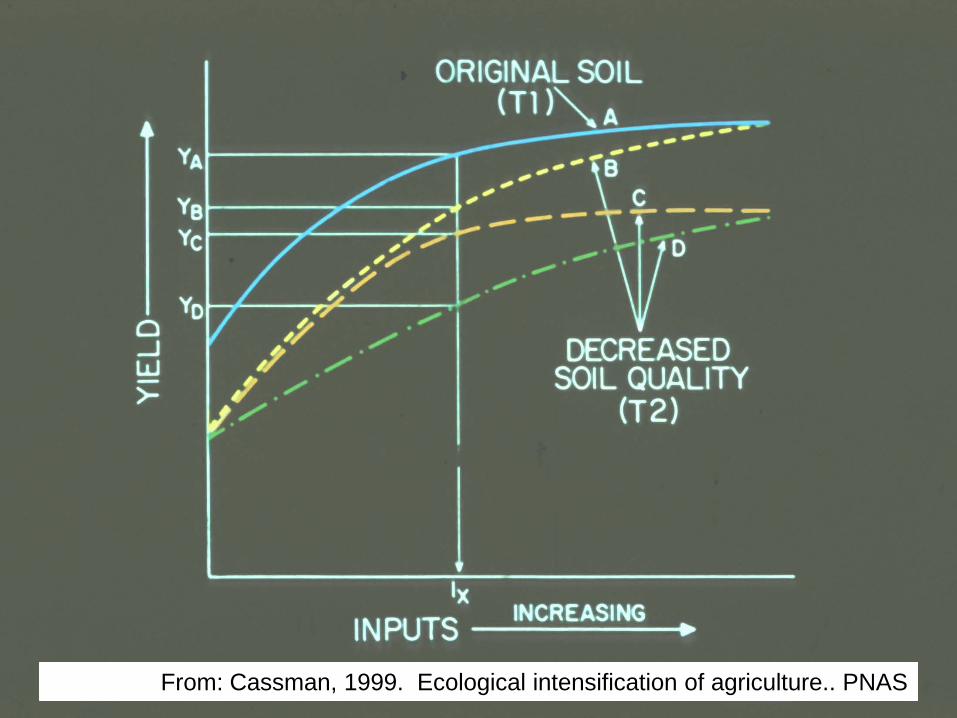
From: Cassman, 1999. Ecological intensification of agriculture.. PNAS

Long-term field experiment with wheat, Pendleton, Oregon: 1932-1966
From: Cassman et al. 1995. Long-term experiments and productivity indexes to evaluate sustainability of cropping systems. in Agricultural Sustainability in Economic, Environmental, and Statistical Terms. John Wiley & Sons ,UK

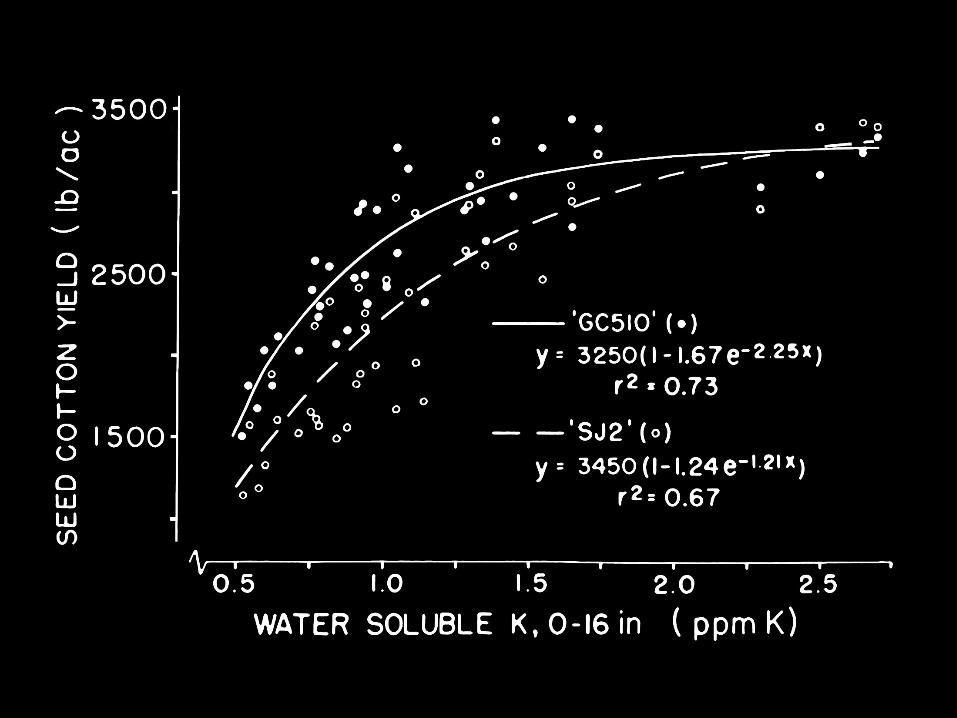
Soils of California’s San Joaquin Valley: Sedimentary origin on west side and granitic origin on east side
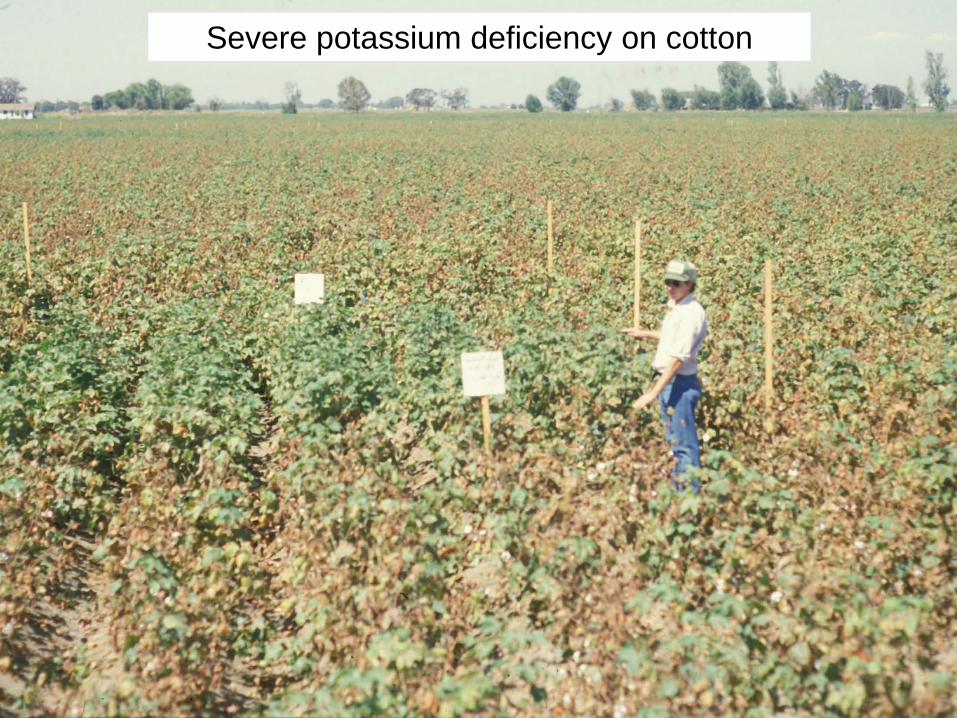
Severe potassium deficiency on cotton

9 February 2006 UC Davis 30
cations
cations
Vermiculite
hyrated
hyrated k k k
Ca
k k k k
Ca Mg
Hydrobiotite
K K K K
K K K K K K K K K K K K K K
K K K K K K K K
Biotite mica
Clay < 2 x 10⁻⁶ m Silt 2 - 20 x 10-6 m
10-9m
Hydrous mica


9 February 2006 UC Davis 33


Ln to
tal e
xtra
ctab
le K
(mg
kg-1
)
(b) -0.48MPa MHA k = - 0,0015 d-1, r2 = 0.99
Control k = -0.00014 d-1, r2 = 0.97
100 20 40 60 80 Time (days)
(a) -0.03MPa MHA k = - 0,00072 d-1, r2 = 0.86
4.80
5.10
4.90
5.00
Control k = -0.00044 d-1, r2 = 0.83
100 20 40 60 80 Time (days)
Influence of mobile humic acids (MHA) on solution-phase and ammonium-extractable K+ in a Grangeville soil after K addition
From: Olk and Cassman. 1995. Soil Sci. Soc. Amer. J. 59: 125-1255

6-yr on-farm study • Four levels of applied K fertilizer first 3 yrs, with or
without barely cover crop • Residual K fertilizer benefit measured in next 3 yrs,
with and without manure (K input equalized)

Residual K benefit from K fertilizer applications from 1984-1987 in long-term field study on a Grangeville soil in the San Joaquin Valley

Ecosystem services “Counter-intuitivities” in agriculture
• Diversity is essential for stability? – Continuous double-crop rice systems in Asia – Continuous high-yield maize systems in the USA – Wheat-fallow systems worldwide
• High N fertilizer rates and irrigated agriculture are bad for the environment? – N uptake efficiency and water productivity higher in
many irrigated systems compared to lower-yielding, lower input rainfed systems
• Organic matter is a good proxy for soil quality – Not for irrigated lowland rice systems in Asia

Contest-winning maize field in SE Nebraska that produced 18.5 t/ha grain. Management included: • Continuous maize under rainfed conditions (18.5 t residue/ha-yr
returned to soil) • Higher than average plant population and N fertilizer rate, but NUE was
much higher than US average • Early planting, longer-maturing hybrid

Contest-winning maize field in Iowa, 1997. Yield = 18 t/ha

Contest-winning farmers appear to create a large volume of high quality soil, which provides a conducive environment for root growth, extension, and function: • Nutrient supply • Water holding capacity • Disease and insect pest
suppressive • Beneficial microbes? But, we have poor knowledge of critical thresholds for these factors

Soil in contest winning maize field in Iowa, 1997
Do such soils also provide other environmental services?


On-farm analysis: maize fields in the Tri-Basin NRD
---FARMER REPORTED DATA --- 3 years of data (2005, 2006, and 2007) --- 777 field-year data identified with
100% irrigated maize
13 August 2013 N Fertilizer Efficiency Conf

Crop-system variable Rainfed Irrigated Difference ¶
Grain yield (t ha-1) 5.9 (CV = 23%)
13.2 (CV = 3%)
+124%
Energy input (GJ ha-1) 10.8 30.0 +178%
Net energy yield (grain energy minus fossil-fuel energy)
74 159 +115%
N fertilizer efficiency (kg grain kg-1 N)
54 71 +32
Water productivity (kg ha-1mm-1) 8.8 14.0 +59
GHG intensity (kg CO2e t-1)‡ 388 231 -40%
Grain yield, energy yield and efficiency, and greenhouse gas (GHG) emissions from maize production in Nebraska
¶ Relative to rainfed maize values. Based on data from 2005-2007. † Includes emissions of CO2, N2O, and CH4 adjusted for CO2 warming equivalent. N2O estimated by the N-surplus method of Van Groenigen et al. (2010). ‡ GHG emissions per metric ton of grain production
Grassini & Cassman, 2012: Proc. Natl Acad. Sci.
Crop-system variable Rainfed Irrigated Difference ¶
Grain yield (t ha-1) 5.9 (CV = 23%)
13.2 (CV = 3%)
+124%
Energy input (GJ ha-1) 10.8 30.0 +178%
Net energy yield (grain energy minus fossil-fuel energy)
74 159 +115%
N fertilizer efficiency (kg grain kg-1 N)
54 71 +32
Water productivity (kg ha-1mm-1) 8.8 14.0 +59
GHG intensity (kg CO2e t-1)‡ 388 231 -40%

Take home from Environmental Assessment of Irrigated Corn in Nebraska
• Compared to rainfed corn, NE irrigated corn receives much larger inputs of N fertilizer, water, and energy, but irrigated corn has: – Greater N fertilizer and water use efficiency – Greater net energy yield – Smaller global warming potential intensity
• Good news for modern, science-based agriculture – Goals of high yield, high input efficiency, large energy
yield, and minimal GHG emissions are complementary – Significant potential to further improve environmental
performance of high-yield systems

Raison d’etre for soil ES research in agriculture
• Benchmarks • Thresholds • Metrics (transparent, robust, reproducible, low-
cost, scientifically defendable) – Requires simplification on the far side of
complexity – Requires good science and appropriate
context for the system in question – In many cases, establishing thresholds
requires tradeoffs between productivity and ES

Metrics, Benchmarking, and Monitoring What are most appropriate metrics for
quantifying progress towards EI? N use efficiency versus N productivity (also called
partial factor productivity) Water use efficiency vs water productivity GHG emissions per acre or GHG emissions
intensity Soil quality (yield without applied nutrients)
Why benchmark and monitor performance? To get higher prices for environmental
performance To quantify impact from improved management To comply with regulations
13 August 2013 N Fertilizer Efficiency Conf

Summary and Conclusions • It will be impossible to achieve global food security
without an improvement in soil quality as related to soil’s provisioning function
• Improving production-enhancing soil properties is likely to also enhance capacity to provide other ecosystem services
• Lack of quantitative understanding of relationships between key soil properties and crop performance in terms of yield, nutrient and water input requirements, and pest protection costs makes it difficult to estimate costs and benefits from management practices that improve soil quality
• We need thresholds, metrics, and monitoring of soil properties governing ES within food security context