software productivity consortium
TRANSCRIPT
Copyright © 2001, Software Productivity Consortium NFP, Inc. All rights reserved.
1-1S O F T W A R E
P R O D U C T I V I T YC O N S O R T I U M
SOFTWAREPRODUCTIVITYCONSORTIUM
Concepts of Return on Investment forProcess Improvement
Presentation for PSM Conference
July, 2001
Bob MacIver

Copyright © 2001, Software Productivity Consortium NFP, Inc. All rights reserved.
1-2S O F T W A R E
P R O D U C T I V I T YC O N S O R T I U M
Typical ConcernsTypical Concerns
• How can I maximize my process improvement
efforts?
• Which process improvement
technologies are the most cost
effective?
• How can I measure the return
on investment (ROI) for process
improvement initiatives?

Copyright © 2001, Software Productivity Consortium NFP, Inc. All rights reserved.
1-3S O F T W A R E
P R O D U C T I V I T YC O N S O R T I U M
A SurveyA Survey
• What kind of organizations and projects are represented?
• How is process improvement currently measured and
justified?
— What indicators?
— Which initiatives?
• How are benefits measured?
• How are costs measured?

Copyright © 2001, Software Productivity Consortium NFP, Inc. All rights reserved.
1-4S O F T W A R E
P R O D U C T I V I T YC O N S O R T I U M
Maturity Levels of RespondentsMaturity Levels of Respondents
0 2 4 6 8 10 12 14 16
NoLevel
1
2
3
4
5 SW CMM
SE CMM
EIA 731
Number of Organizations
Matu
rity Level

Copyright © 2001, Software Productivity Consortium NFP, Inc. All rights reserved.
1-5S O F T W A R E
P R O D U C T I V I T YC O N S O R T I U M
SurveySurveyGeneral FindingsGeneral Findings
• Survey size was small, but relevant
• Respondents were evenly distributed across CMM Levels
• Little consistency in the definition of measures used among
organizations
• Most of the organizations track SPI using a growth or
improvement factor, rather than financially
• Very few organizations are tracking the true cost or benefit of
their SPI initiatives
• No definitive patterns associated with CMM Maturity, or
Government vs. Commercial Marketplace
(Exception was Earned Value)
Copyright © 2001, Software Productivity Consortium NFP, Inc. All rights reserved.
1-6S O F T W A R E
P R O D U C T I V I T YC O N S O R T I U M
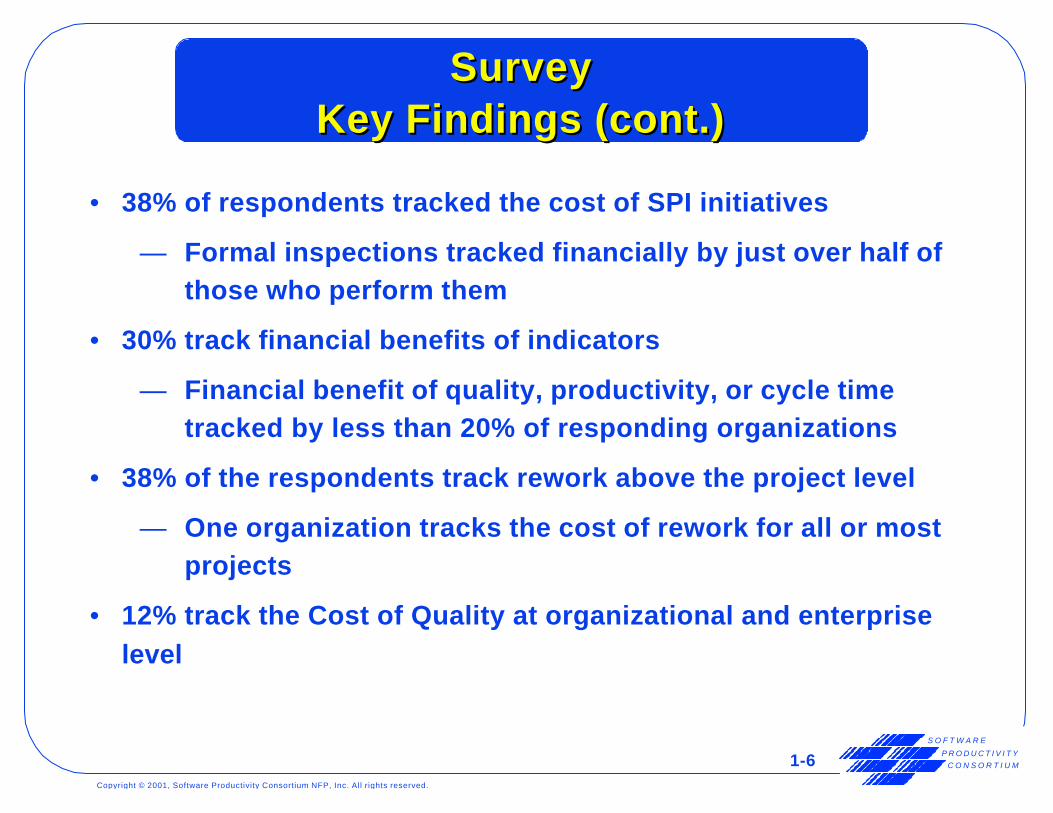
SurveySurveyKey Findings (cont.)Key Findings (cont.)
• 38% of respondents tracked the cost of SPI initiatives
— Formal inspections tracked financially by just over half of
those who perform them
• 30% track financial benefits of indicators
— Financial benefit of quality, productivity, or cycle time
tracked by less than 20% of responding organizations
• 38% of the respondents track rework above the project level
— One organization tracks the cost of rework for all or most
projects
• 12% track the Cost of Quality at organizational and enterprise
level

Copyright © 2001, Software Productivity Consortium NFP, Inc. All rights reserved.
1-7S O F T W A R E
P R O D U C T I V I T YC O N S O R T I U M
Survey ConclusionsSurvey Conclusions
• Responses reflect a strong engineering focus with a relatively
low level focus on cost/benefit of SPI
• Respondents generally are not well positioned to calculate
financial ROI of their SPI program
• Lack of standard measurement definitions and ROI process
models inhibit progress in justifying SPI from a financial
perspective

Copyright © 2001, Software Productivity Consortium NFP, Inc. All rights reserved.
1-8S O F T W A R E
P R O D U C T I V I T YC O N S O R T I U M
The Problem With ROIThe Problem With ROI
Rework Cost ?
Productivity ?
Quality ?Customer
Satisfaction
???
Multiple Relationships Make it Difficult toMultiple Relationships Make it Difficult to
Assign the BenefitsAssign the Benefits
Cycle Time ?
IV&V ?
Inspections,Peer Reviews
Direct Relationship
Potential Relationship
How do we showrelationships to
profitability and value?
Copyright © 2001, Software Productivity Consortium NFP, Inc. All rights reserved.
1-9S O F T W A R E
P R O D U C T I V I T YC O N S O R T I U M
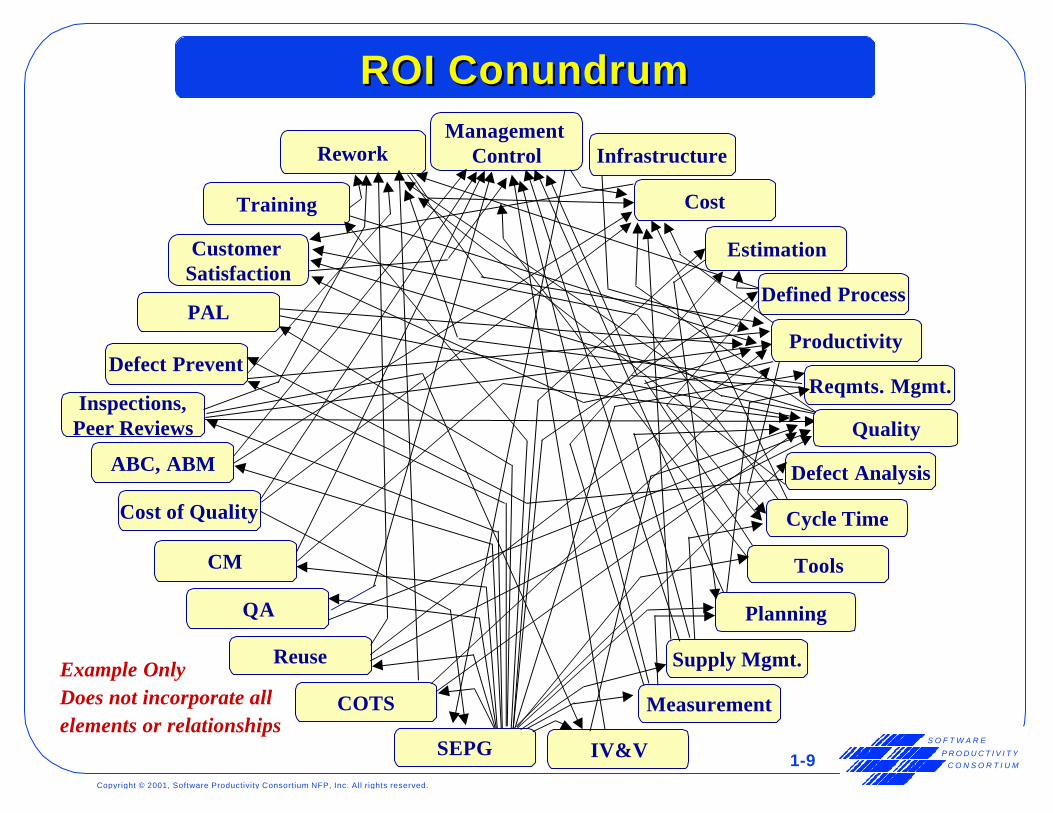
ROI ConundrumROI Conundrum
Training
Productivity
Management Control
Defect Prevent
Customer Satisfaction
Cost
Inspections,Peer Reviews
ABC, ABM
Cost of Quality
CM
Measurement
QA
Estimation
Quality
Defect Analysis
Cycle Time
Tools
Planning
Rework Infrastructure
Supply Mgmt.Reuse
PAL
Reqmts. Mgmt.
COTS
SEPG IV&V
Defined Process
Example OnlyDoes not incorporate allelements or relationships

Copyright © 2001, Software Productivity Consortium NFP, Inc. All rights reserved.
1-10S O F T W A R E
P R O D U C T I V I T YC O N S O R T I U M
Key IndicatorsKey Indicators
Primary Indicators
ü Quality
ü Productivity
ü Cycle Time
ü Cost
ü Customer Satisfaction
Other Important Indicators
ü Cost of Quality
ü Cost of Rework

Copyright © 2001, Software Productivity Consortium NFP, Inc. All rights reserved.
1-11S O F T W A R E
P R O D U C T I V I T YC O N S O R T I U M
- 1 = ROI
5Process
ImprovementInitiatives
ProcessImprovement
Initiatives
ProcessImprovement
Initiatives
2
� (Benefits)f (x)
3
� (Costs)f (labor, equipment, training,…)
4
Conceptual ROI ModelConceptual ROI Model
Why?
1
Processes IndicatorsBase Measures

Copyright © 2001, Software Productivity Consortium NFP, Inc. All rights reserved.
1-12S O F T W A R E
P R O D U C T I V I T YC O N S O R T I U M
Secondary IndicatorsPrimary Indicators Business Goals
QualityCustomer
Satisfaction
Cycle Time Cost
Reducedrework
RequiredFunctionality,
Fewerfailures
Lower price
Lower support andmaintenance costs
Productivity
Increasedcapacity
Reducedeffort
Market ShareProfit
Shorterschedules
Time-to-market
Higher marginLow-costprovider
RetentionReferrals
Award feesBonuses
Image
ProducesDrives
Indicator RelationshipsIndicator Relationships
Copyright © 2001, Software Productivity Consortium NFP, Inc. All rights reserved.
1-13S O F T W A R E
P R O D U C T I V I T YC O N S O R T I U M
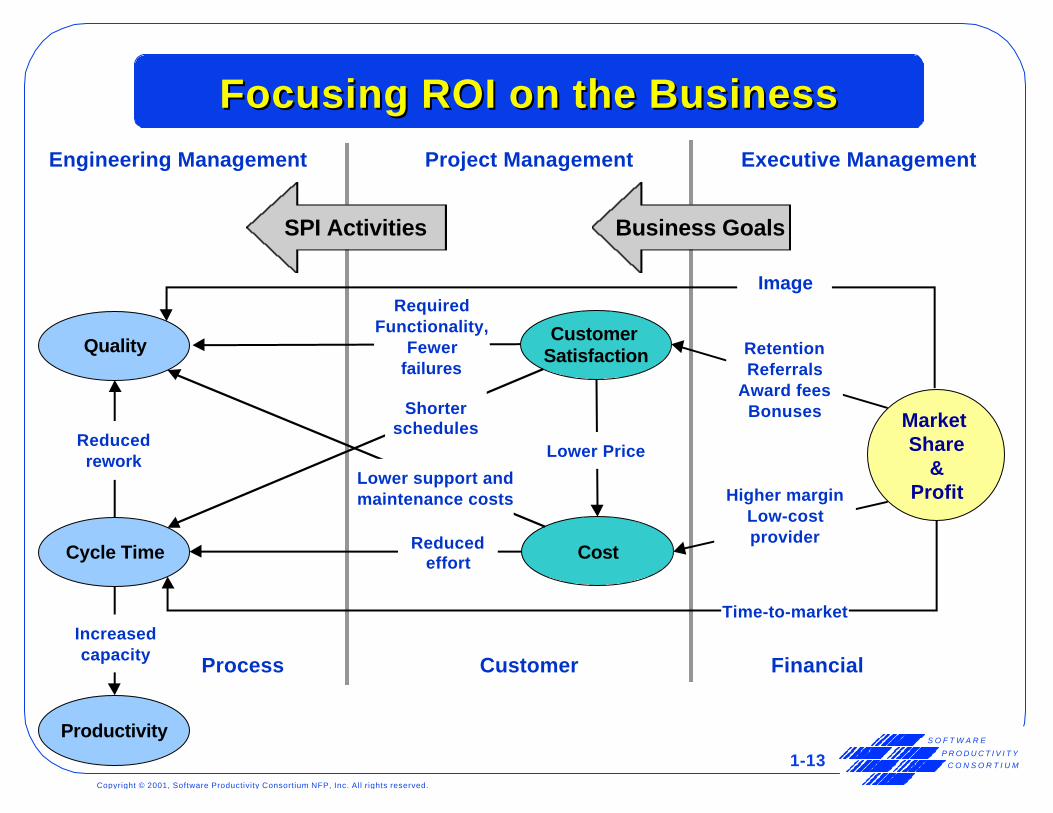
Project ManagementEngineering Management Executive Management
Business Goals
QualityCustomer
Satisfaction
Cycle Time Cost
Reducedrework
RequiredFunctionality,
Fewerfailures
Lower Price
Lower support andmaintenance costs
Productivity
Increasedcapacity
Reducedeffort
Market Share
&Profit
Shorterschedules
Time-to-market
Higher marginLow-costprovider
RetentionReferrals
Award feesBonuses
Image
SPI Activities
Focusing ROI on the BusinessFocusing ROI on the Business
CustomerProcess Financial
Copyright © 2001, Software Productivity Consortium NFP, Inc. All rights reserved.
1-14S O F T W A R E
P R O D U C T I V I T YC O N S O R T I U M
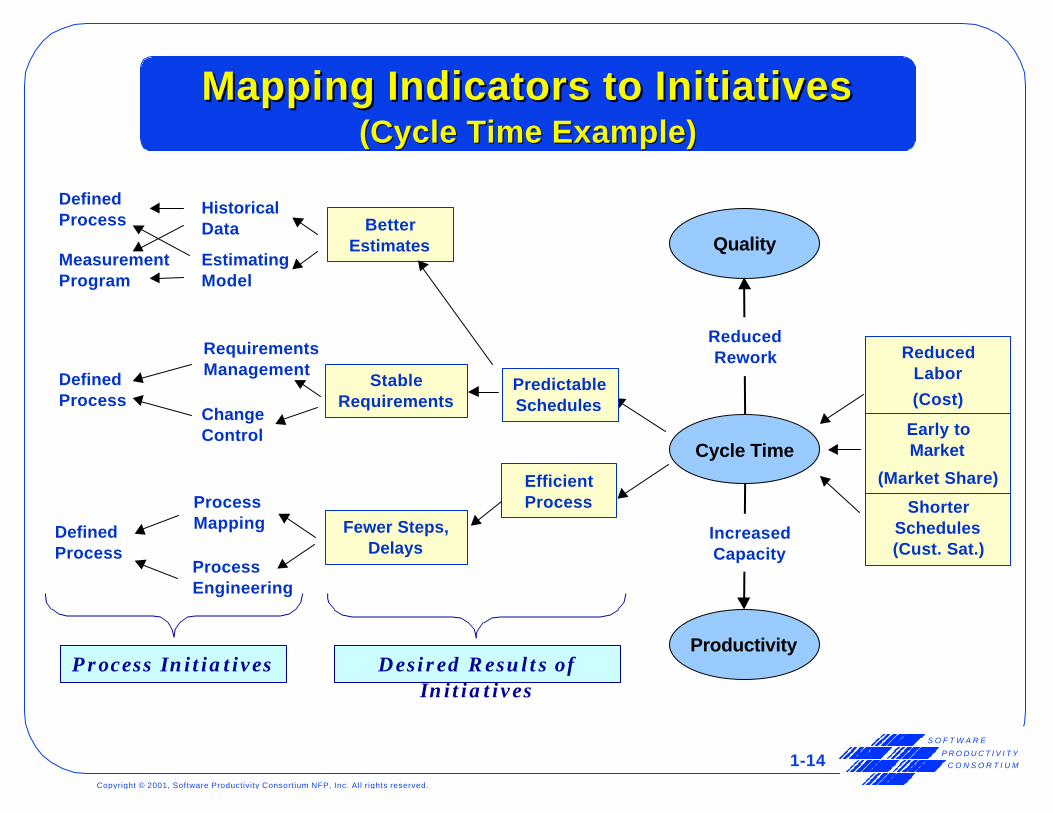
Mapping Indicators to InitiativesMapping Indicators to Initiatives(Cycle Time Example)(Cycle Time Example)
DefinedProcess
HistoricalData
EstimatingModel
ChangeControl
RequirementsManagement
DefinedProcess
MeasurementProgram
Quality
Cycle Time
ReducedRework
Productivity
IncreasedCapacity
ShorterSchedules(Cust. Sat.)
ReducedLabor
(Cost)
Early toMarket
(Market Share)EfficientProcess
PredictableSchedules
DefinedProcess
ProcessEngineering
ProcessMapping
Process Initiatives Desired Results ofInitiatives
BetterEstimates
StableRequirements
Fewer Steps,Delays
Copyright © 2001, Software Productivity Consortium NFP, Inc. All rights reserved.
1-15S O F T W A R E
P R O D U C T I V I T YC O N S O R T I U M
Cost of Quality (COQ)Cost of Quality (COQ)
• What is the cost of poor quality?
• What are the key drivers?
• What is the cost of achieving higher quality?
• Which should be the highest priorities?
• How successful are the efforts designed to drive the COQ
downward?

Copyright © 2001, Software Productivity Consortium NFP, Inc. All rights reserved.
1-16S O F T W A R E
P R O D U C T I V I T YC O N S O R T I U M
Elements of COQElements of COQ
Cost of Poor Quality
(Non-conformance)
Cost of AchievingHigher Quality
Cost of Internal Failure
Defects Discovered Prior to Shipment
Cost of External Failure
Defects Discovered After Shipment
Appraisal Costs
Testing, Inspections, Quality Audits, Assessments
Prevention CostsSEPG, SQA, CM,
Reqmts. Management, Defect Prevention,
Training, Risk Mgmt.

Copyright © 2001, Software Productivity Consortium NFP, Inc. All rights reserved.
1-17S O F T W A R E
P R O D U C T I V I T YC O N S O R T I U M
0
0.1
0.2
0.3
0.4
0.5
0.6
0.7
0.8
0.9
1
% o
f To
tal P
roje
ct C
ost
s
1988 1989 1990 1991 1992 1993Years
Cost of performanceCost of appraisalCost of preventionCost of nonconformance
Reducing the Cost of QualityReducing the Cost of Quality
Adapted from: Dion, R., Process Improvement and the Corporate Balance Sheet , IEEE Software, July 1993
Copyright © 2001, Software Productivity Consortium NFP, Inc. All rights reserved.
1-18S O F T W A R E
P R O D U C T I V I T YC O N S O R T I U M
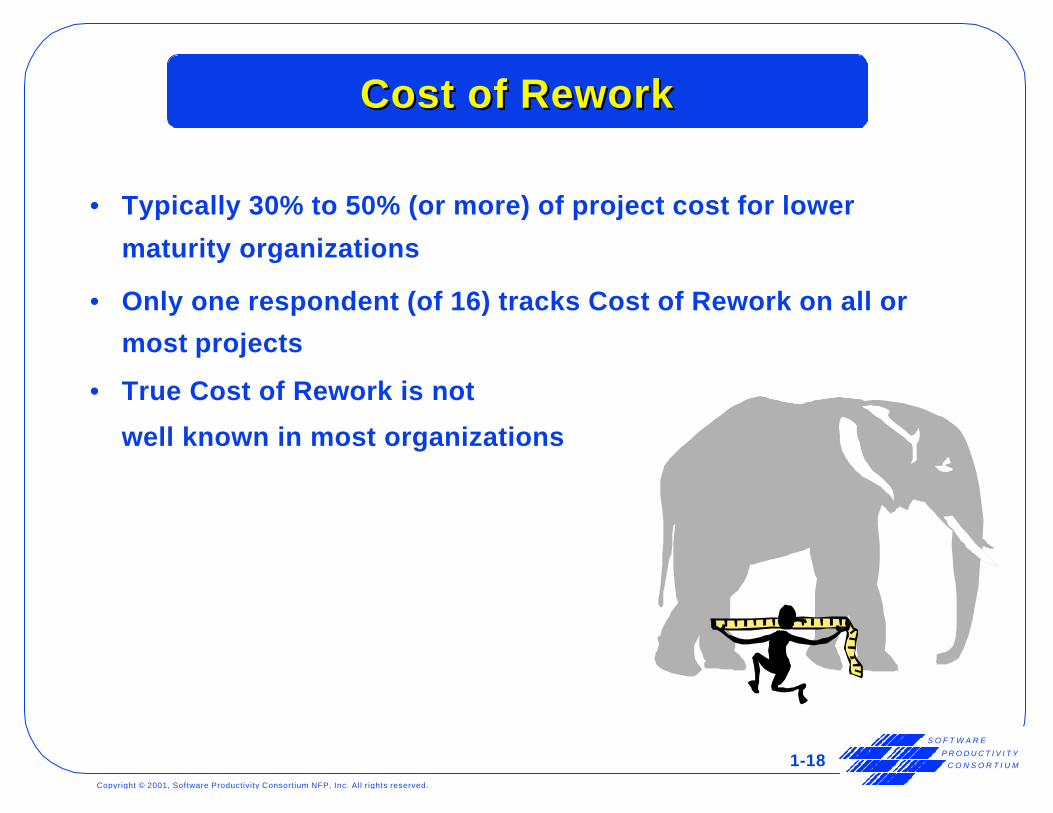
Cost of ReworkCost of Rework
• Typically 30% to 50% (or more) of project cost for lower
maturity organizations
• Only one respondent (of 16) tracks Cost of Rework on all or
most projects
• True Cost of Rework is not
well known in most organizations
Copyright © 2001, Software Productivity Consortium NFP, Inc. All rights reserved.
1-19S O F T W A R E
P R O D U C T I V I T YC O N S O R T I U M
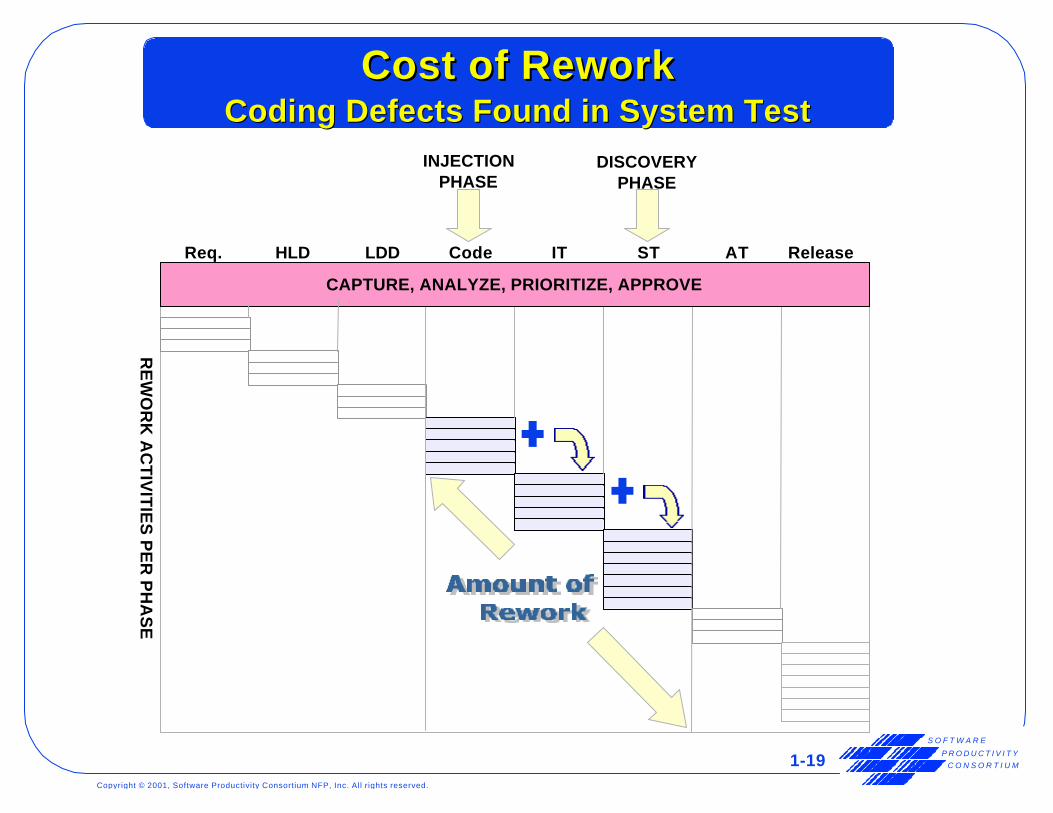
INJECTIONPHASE
CAPTURE, ANALYZE, PRIORITIZE, APPROVE
RE
WO
RK
AC
TIV
ITIE
S P
ER
PH
AS
E
Req. HLD LDD Code IT ST ReleaseAT
DISCOVERYPHASE
Cost of ReworkCost of ReworkCoding Defects Found in System TestCoding Defects Found in System Test
Copyright © 2001, Software Productivity Consortium NFP, Inc. All rights reserved.
1-20S O F T W A R E
P R O D U C T I V I T YC O N S O R T I U M
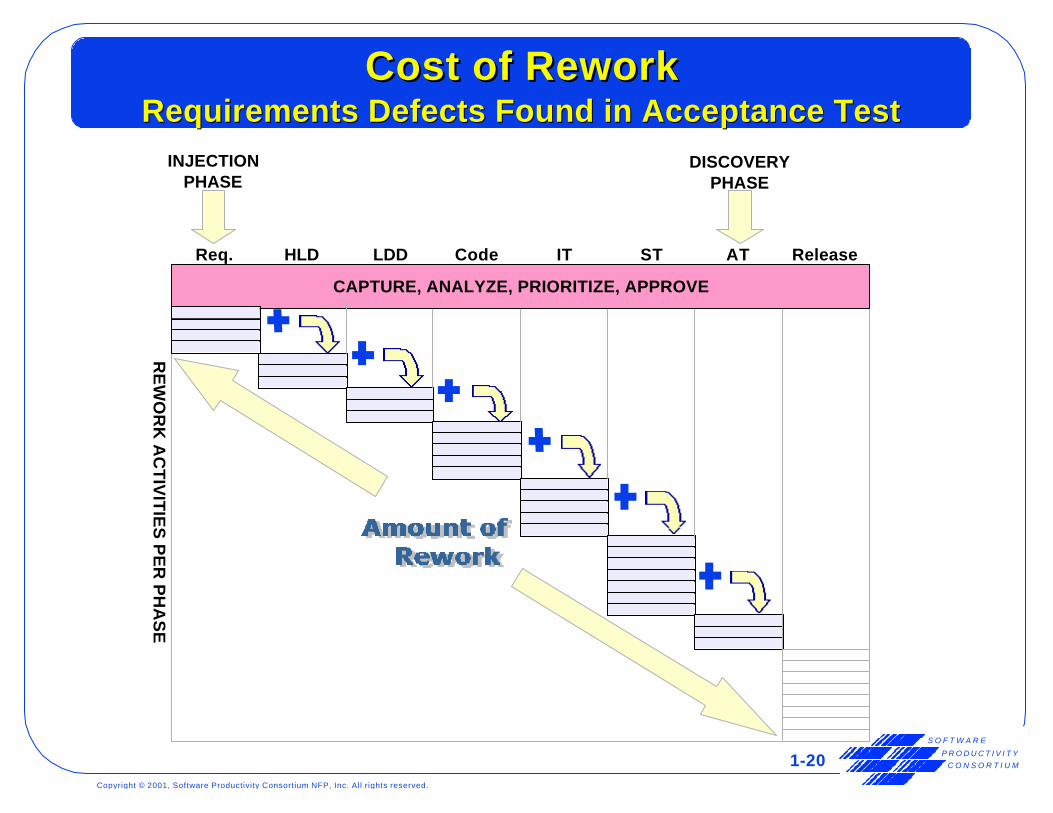
INJECTIONPHASE
CAPTURE, ANALYZE, PRIORITIZE, APPROVE
RE
WO
RK
AC
TIV
ITIE
S P
ER
PH
AS
E
Req. HLD LDD Code IT ST ReleaseAT
DISCOVERYPHASE
Cost of ReworkCost of ReworkRequirements Defects Found in Acceptance TestRequirements Defects Found in Acceptance Test
Copyright © 2001, Software Productivity Consortium NFP, Inc. All rights reserved.
1-21S O F T W A R E
P R O D U C T I V I T YC O N S O R T I U M
SummarySummary
• Measurement programs are typically focused on engineering
effectiveness rather than business case
• Organizations generally are not well positioned to calculate
financial ROI of their SPI program
• ROI Conundrum can be resolved by focusing on costs and
benefits separately
• A focus on Cost of Quality and Cost of Rework can provide
significant results
• Data indicate ROI is a ‘growth area’
— Provides a means for focusing SPI investments on business goals andpriorities
— Helps in establishing effective measurement programs/habits