softronics inc. for use of msw logo. - amazon...
TRANSCRIPT

1 Key Stage 3 National Strategy / ICT Sample teaching unit 8.4 © Crown copyright 2002
AcknowledgementsThe assistance of the pilot LEAs in developing these materials is gratefullyacknowledged.
Images of Microsoft products are reprinted with permission from MicrosoftCorporation.
Images of mobile phones are reproduced by kind permission of Siemens plc andMotorola plc.
Acknowledgements are also due to Kelkoo.com for use ofhttp://www.buy.co.uk//kelkoo/r5/mobiles.asp; Softronics Inc. for use of MSW logo.
DisclaimerThe Department for Education and Skills wishes to make clear that the Department andits agents accept no responsibility for the actual content of any of the materialssuggested as information sources in this document, whether these are in the form ofprinted publications or on a website.
Contents
About the ICT sample teaching units for Key Stage 3 3
Unit 8.4 Models and presenting numeric data 4
ICT Framework objectives 4
Timing 4
Tasks 4
Resources 4
Prior learning 5
Subject knowledge needed by teachers 5
Lesson outlines 5
Lesson plans
Lesson 1 Introducing the unit 7
Lesson 2 Developing a new model 15
Lesson 3 Using graphs to model with spreadsheets 22
Lesson 4 Investigating models 29
Lesson 5 Simulations and models 37
2 Key Stage 3 National Strategy / ICT Sample teaching unit 8.4 © Crown copyright 2002

About the ICT sample teaching units for Key Stage 3
This unit is one of a series that illustrates how yearly objectives from the Framework forteaching ICT capability: Years 7, 8 and 9 can be grouped together and taught.
There is no requirement to use the units. They contain sample lesson plans that you can,if you wish, amend to suit your local circumstances and the needs of your pupils. Forexample, it may be appropriate to change the exemplar contexts, to use differentactivities to teach objectives or to teach the unit to a different year group. Wordversions of the lesson plans will be published on the Key Stage 3 website atwww.standards.dfes.gov.uk/keystage3 so that you can download them and modify the plans.
The units contain plans for lessons of 60 minutes. Each activity in the lessons has aguide time. The guide times will help you to fit the activities into the time available inschools where the lesson length is different. For example, the activities in one lessoncould be taught over two lessons, or a skills-based lesson, to teach particular aspects ofmore complex software, could be inserted at an appropriate point. In both cases, thestructure of lessons could be maintained, with the insertion of some extra starter andplenary activities.
The Framework for teaching ICT capability: Years 7, 8 and 9 recommends that schoolsoffer one hour each week, or 38 hours per year, for the discrete teaching of ICT lessons.The teaching units for a year, if taught without amendment, would require less teachingtime than 38 hours. This leaves time for lessons of your own design at appropriatepoints. So, for example, objectives could be revisited to consolidate learning or toprovide opportunities for assessment.
The lesson plans are intentionally very detailed to give busy teachers a full picture of howeach lesson might be taught. Teachers’ own plans would probably be much less detailed.
Apart from sample teaching unit 7.1, which should be used before any of the others, theorder in which the units are taught is not important.
About this sample teaching unitUnit 8.4 builds on unit 7.4, which introduces pupils to using spreadsheets formodelling, and for presenting numeric data.
3 Key Stage 3 National Strategy / ICT Sample teaching unit 8.4 © Crown copyright 2002

8.4Models and presenting numeric data
ICT Framework objectives
DEVELOPING IDEAS AND MAKING THINGS HAPPEN
Models and modelling• Develop ICT-based models and test predictions by changing variables and rules.
• Draw and explain conclusions.
• Review and modify ICT models to improve their accuracy and extend their scope.
FINDING THINGS OUT
Organising and investigating• Explore and interpret collected data in order to draw conclusions.
Timing
This unit is expected to take five lessons of 60 minutes. However, each activity has aguide time, which you can adjust to alter the number and duration of lessons, to suityour own school timetable.
Task
In this unit, pupils will use spreadsheet software to develop models. They will beintroduced to techniques to enable them to create more complex models and tointerrogate and analyse them. They will be shown how to generate random numbersto provide test data and to simulate events. They will then consider the purposes forwhich simulations and animations are used.
The examples used in this unit include a school fete, tossing a coin and mobiletelephone tariffs. Teachers can achieve the same learning objectives with a range ofother topics.
The lessons are designed for pupils working at Levels 5 and 6 with an extension activityfor pupils working at higher levels. The extension activity is suggested in lesson 4 but itcould take the form of a project which pupils develop as the unit progresses. If used, itshould be treated flexibly and at appropriate stages in the unit to match the needs ofthe pupils.
Resources• Computer room (minimum of one PC per two pupils)
• Internet access
• Access to shared area
• Large computer display for teacher demonstrations and pupil presentations
• Presentation software
• Spreadsheet software
4 Key Stage 3 National Strategy / ICT Sample teaching unit 8.4 © Crown copyright 2002
Unit
• Whiteboard or flipchart
• Wall displays
• Teacher resources: – 8.4T1a, 8.4T1e, 8.4T1g, 8.4T2a, 8.4T2d, 8.4T2e, 8.4T3a, 8.4T3e, 8.4T3f,
8.4T4a, 8.4T4c, 8.4T4e, 8.4T4f, 8.4T5a
• Pupil resources: – 8.4P1b, 8.4P1c, 8.4P1d, 8.4P1f, 8.4P2b, 8.4P2c, 8.4P3b, 8.4P3c, 8.4P3d,
8.4P4b, 8.4P4d, 8.4P5b, 8.4P5c, 8.4P5d
Prior learning
Pupils should already know how to:
• enter text, numeric data and formulae into a spreadsheet;
• format cells;
• create simple charts using the Chart Wizard;
• explore a basic model;
• select print areas.
Subject knowledge needed by teachers
To teach this unit, teachers will need to know how to:
• log on to the network;
• load and save work in a shared area;
• use a large screen display or interactive whiteboard effectively;
• enter formulae, numbers and labels into a spreadsheet;
• enter absolute and relative cell references;
• copy a formula along a row or down a column, using the fill handle;
• select non-adjacent columns;
• format spreadsheets;
• produce and edit charts, using a spreadsheet;
• use Goal Seek… for forecasting values;
• access websites;
• use the RANDBETWEEN function (for Microsoft Excel) or the equivalent function inother data-handling software.
Lesson outlines
LESSON 1Introducing the unit
1 Starter: Revising modelling
2 The aim of the unit
3 Using and interrogating a model
4 Using Goal Seek...
5 Key Stage 3 National Strategy / ICT Sample teaching unit 8.4 © Crown copyright 2002
5 Plenary: Reviewing the model
Homework: Collecting information about mobile phones
LESSON 2Developing a new model
1 Starter: Identifying variables
2 Comparing tariffs
3 Structuring a model
4 Developing, exploring and analysing the model
5 Input and output values in a model
6 Plenary: Evaluating the model
Homework: Choosing the best tariff
LESSON 3Using graphs to model with spreadsheets
1 Starter: Using charts
2 Cell referencing
3 Extending the model
4 Reviewing the model
5 Plenary: Evaluating the use of charts and graphs
Homework: Considering other variables
LESSON 4Investigating models
1 Starter: Tossing a coin
2 Testing a model with a random number generator
3 Exploring an online model
4 Plenary: Reviewing the phone model
Homework: Types of model
Extension activity
LESSON 5Simulations and models
1 Starter: Defining simulations and models
2 Explaining the objectives and setting the task
3 Demonstrating the task
4 Investigating simulations and models
5 Plenary: Reviewing the unit and the key vocabulary
Homework: Reviewing the units
6 Key Stage 3 National Strategy / ICT Sample teaching unit 8.4 © Crown copyright 2002

1Introducing the unit
ICT Framework objectives
DEVELOPING IDEAS AND MAKING THINGS HAPPEN
Models and modelling• Develop ICT-based models and test predictions by changing variables and rules.
• Review and modify ICT models to improve their accuracy and extend their scope.
Key vocabulary
From Year 6: cell, chart, column, copy, drag, label, model, paste, row, sort
From Year 7: formula
From Year 8: goal seek
Preparation and planning• Ensure that you are familiar with the pupil and teacher resources for the lesson.
• Ensure that 8.4T1a Starter.ppt, 8.4P1d School fete worksheet.doc, 8.4T1h Goalseek helpsheet.doc and 8.4P1c School fete.xls are available in the shared area.
• Print sufficient copies of 8.4P1b Starter.doc, 8.4 P1d School fete worksheet.docand 8.4P1g Goal seek.doc to have one for each pupil.
• Create a key vocabulary wall display for the unit which will be added to each weekas lessons progress. This should include the key vocabulary as well as anyadditional vocabulary you may wish to have available for the pupils.
• If necessary, prepare guidance for the pupils to support the software being used,either as a handout or available on the school’s intranet.
• Display the teaching objectives phrased so that all pupils will understand them.
• Prepare an extended definition list of the key terms you will be using to providesupport to those pupils who need it.
Resources• Large computer screen display
• Sufficient computers for pupils to work in pairs or small groups
• Spreadsheet software
• Shared network area, or alternative way to pass spreadsheet data to pupils
• Whiteboard or flipchart
7 Key Stage 3 National Strategy / ICT Sample teaching unit 8.4 © Crown copyright 2002
Lesson

• Resource files:
– 8.4T1a Starter.ppt
– 8.4P1b Starter.doc
– 8.4P1c School fete.xls
– 8.4P1d School fete worksheet.doc
– 8.4T1e School fete worksheet answers.doc
– 8.4P1f Goal seek.doc
– 8.4T1g Goal seek helpsheet.doc
Lesson outline 60 minutes
1 Starter: Revising modelling Completing worksheet 10 minutesIndividual work
2 The aim of the unit Discussion 5 minutesWhole class
3 Using and interrogating Using software 15 minutes a model Paired work
4 Using Goal Seek ... Demonstrating software 15 minutes Whole class
5 Plenary: Reviewing the model Evaluation 15 minutes Whole class
Homework Individual work
8 Key Stage 3 National Strategy / ICT Sample teaching unit 8.4 © Crown copyright 2002
9 Key Stage 3 National Strategy / ICT Sample teaching unit 8.4 © Crown copyright 2002
10 minutesUnit 1 Starter: Revising modelling
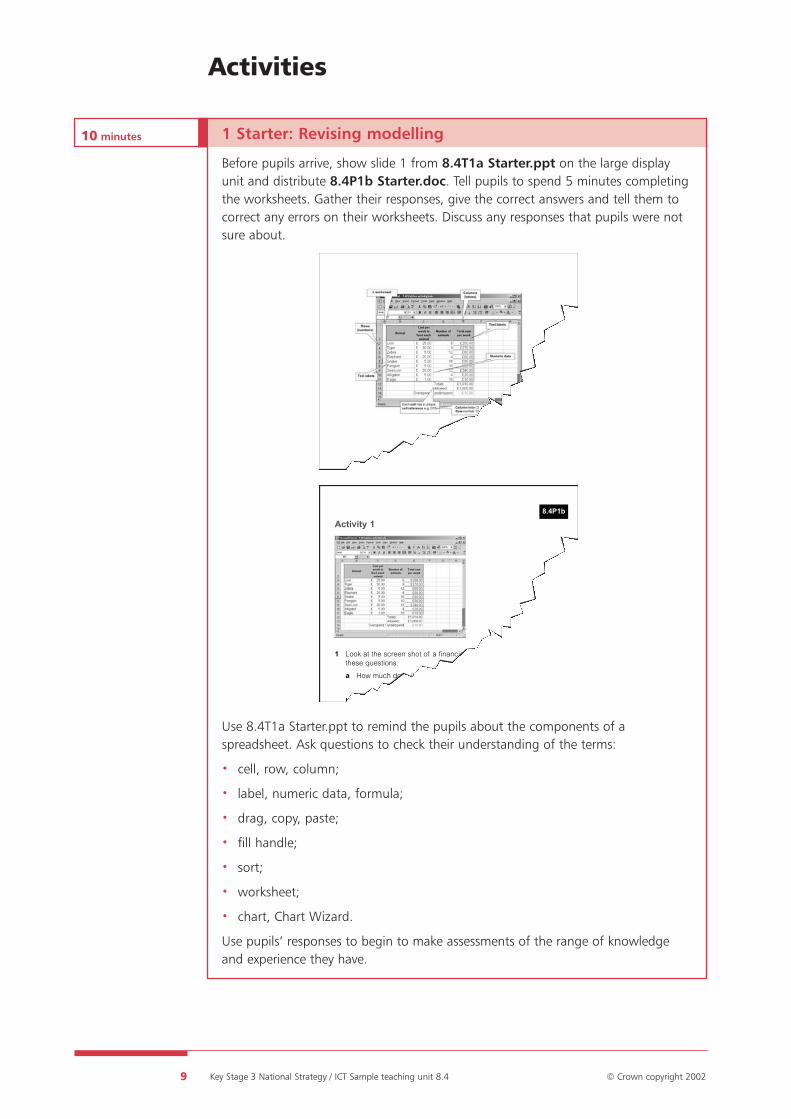
Before pupils arrive, show slide 1 from 8.4T1a Starter.ppt on the large displayunit and distribute 8.4P1b Starter.doc. Tell pupils to spend 5 minutes completingthe worksheets. Gather their responses, give the correct answers and tell them tocorrect any errors on their worksheets. Discuss any responses that pupils were notsure about.
Use 8.4T1a Starter.ppt to remind the pupils about the components of aspreadsheet. Ask questions to check their understanding of the terms:
• cell, row, column;
• label, numeric data, formula;
• drag, copy, paste;
• fill handle;
• sort;
• worksheet;
• chart, Chart Wizard.
Use pupils’ responses to begin to make assessments of the range of knowledgeand experience they have.
Activities
Activity 1
1 Look at the screen shot of a financial model of a zoo and answerthese questions.
a How much does it cost to feed the lions?
b How much is spent in total each week?
8.4P1b
10 Key Stage 3 National Strategy / ICT Sample teaching unit 8.4 © Crown copyright 2002
Differentiation
You may wish to distribute the handout of simple definitions of the key terms usedfor this activity to those pupils who need it. Make sure that you use theterminology consistently during the demonstration.
15 minutesUnit
2 The aim of the unit
Ask pupils if they remember any work they did on modelling in Year 6 or Year 7.The spreadsheet example is taken from sample teaching unit 7.4.
Find out what pupils know by asking them to explain what they understand amodel to be. If necessary, prompt by saying that:
• a model is a tool that enables you to put different data into the system and look at the outcomes this produces;
• a model is a tool you can use to ask ‘What if…?’ questions by changingvariables or formulae.
Tell pupils that they can use a spreadsheet for modelling. Remind them that thebenefits of using spreadsheets to create a model are:
• speed;
• accuracy;
• automatic calculations;
• the data put into the spreadsheet can be changed easily.
Tell pupils that in this unit they will learn:
• to use a spreadsheet to generate models;
• to ask questions of the models in order to analyse and present data;
• to use techniques to generate more effective models;
• to understand the relationship between input and output values in a model;
• to discuss other types of modelling that can be used to simulate different events.
Explain the objectives for this lesson, referring to the wall display.
5 minutesUnit
3 Using and interrogating a model
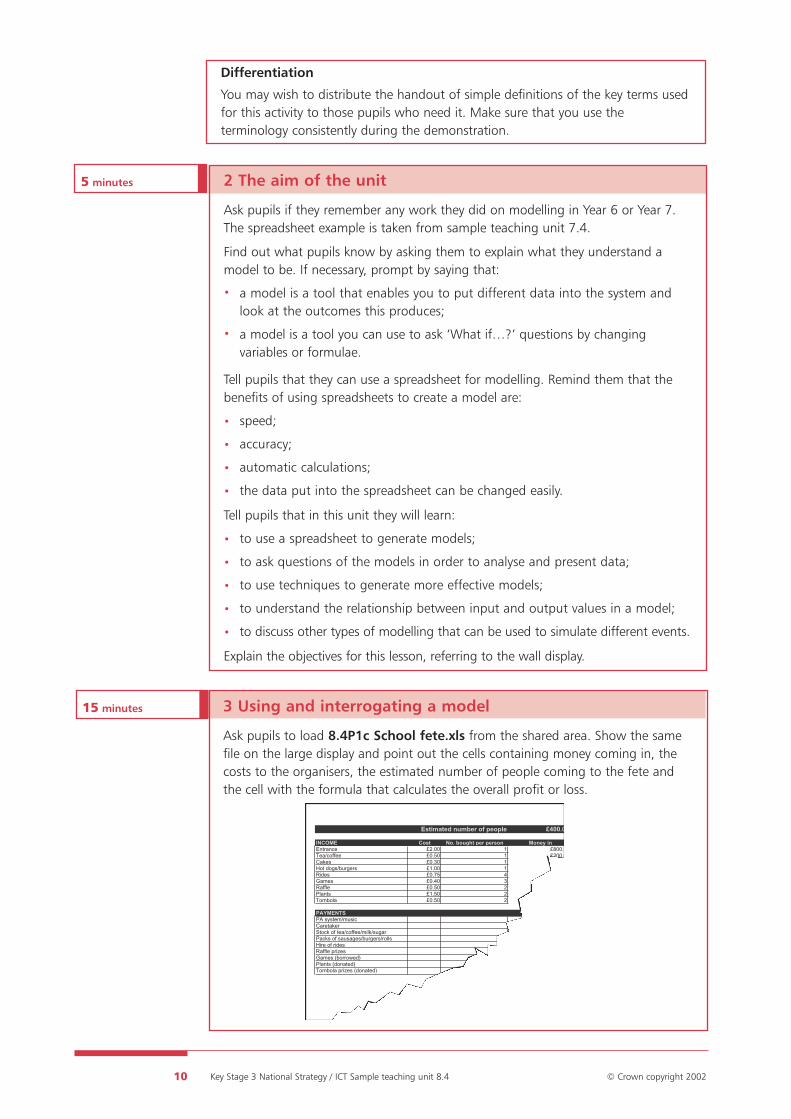
Ask pupils to load 8.4P1c School fete.xls from the shared area. Show the samefile on the large display and point out the cells containing money coming in, thecosts to the organisers, the estimated number of people coming to the fete andthe cell with the formula that calculates the overall profit or loss.
Estimated number of people £400.0
INCOME Cost No. bought per person Money inEntrance £2.00 1 £800.0Tea/coffee £0.50 1 £200.0Cakes £0.30 1 £120.0Hot dogs/burgers £1.00 1 £400.0Rides £0.75 4 £1200.0Games £0.40 3 £480.0Raffle £0.50 2 £400.0Plants £1.50 2 £1200.0Tombola £0.50 2 £400.0
£5200.0PAYMENTS Money outPA system/music £650Caretaker £150Stock of tea/coffee/milk/sugar £43Packs of sausages/burgers/rolls £180Hire of rides £500Raffle prizes £150Games (borrowed) £0Plants (donated) £0Tombola prizes (donated) £0
£1673.0
£3527.0
11 Key Stage 3 National Strategy / ICT Sample teaching unit 8.4 © Crown copyright 2002
As you indicate the different cells in the model, check pupils’ understanding of thespreadsheet functions by asking selected pupils to say whether cells containnumeric data, labels or formulae.
Ask pupils to identify which cells contain variables – numeric data that can bechanged to different values. Check that pupils understand what is meant byincome, expenditure, profit and loss.
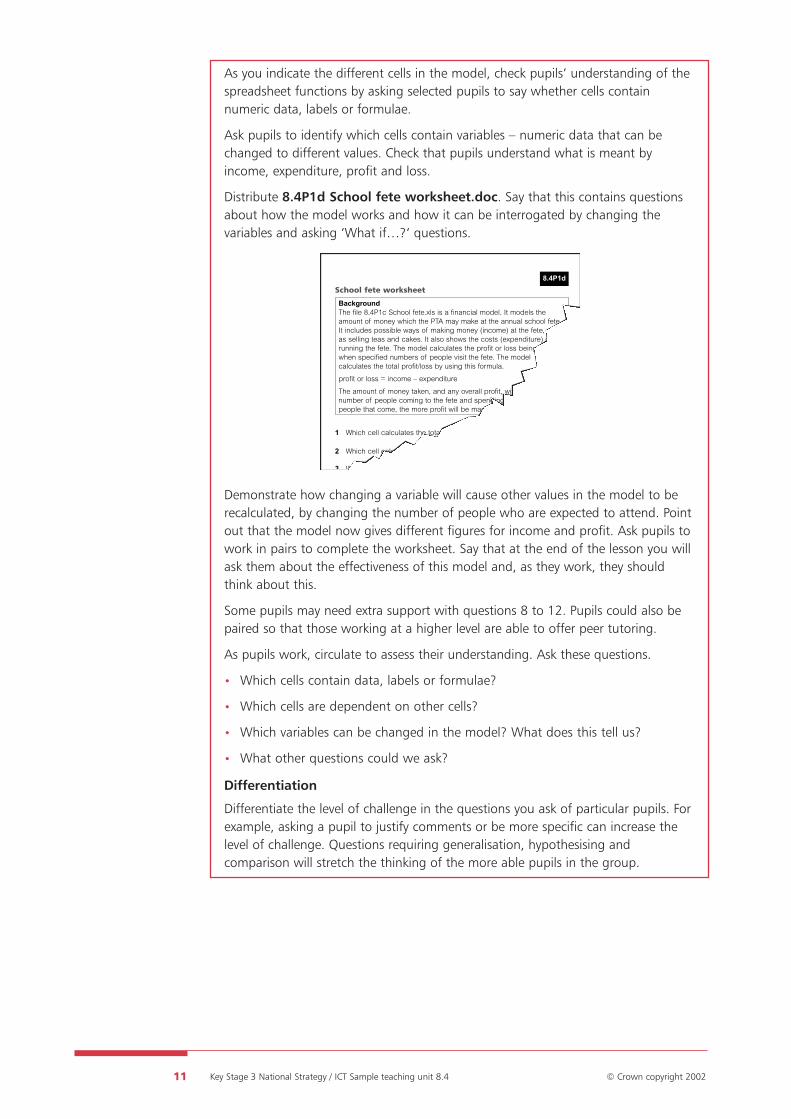
Distribute 8.4P1d School fete worksheet.doc. Say that this contains questionsabout how the model works and how it can be interrogated by changing thevariables and asking ‘What if…?‘ questions.
Demonstrate how changing a variable will cause other values in the model to berecalculated, by changing the number of people who are expected to attend. Pointout that the model now gives different figures for income and profit. Ask pupils towork in pairs to complete the worksheet. Say that at the end of the lesson you willask them about the effectiveness of this model and, as they work, they shouldthink about this.
Some pupils may need extra support with questions 8 to 12. Pupils could also bepaired so that those working at a higher level are able to offer peer tutoring.
As pupils work, circulate to assess their understanding. Ask these questions.
• Which cells contain data, labels or formulae?
• Which cells are dependent on other cells?
• Which variables can be changed in the model? What does this tell us?
• What other questions could we ask?
Differentiation
Differentiate the level of challenge in the questions you ask of particular pupils. Forexample, asking a pupil to justify comments or be more specific can increase thelevel of challenge. Questions requiring generalisation, hypothesising andcomparison will stretch the thinking of the more able pupils in the group.
School fete worksheet
BackgroundThe file 8.4P1c School fete.xls is a financial model. It models theamount of money which the PTA may make at the annual school fete.It includes possible ways of making money (income) at the fete, suchas selling teas and cakes. It also shows the costs (expenditure) ofrunning the fete. The model calculates the profit or loss being madewhen specified numbers of people visit the fete. The modelcalculates the total profit/loss by using this formula.
profit or loss = income – expenditure
The amount of money taken, and any overall profit, will depend on thenumber of people coming to the fete and spending money. The morepeople that come, the more profit will be made.
1 Which cell calculates the total income?
2 Which cell calculates the total expenditure?
3 Which cell calculates the profit/loss?
8.4P1d

Use 8.4T1e School fete worksheet answers.doc to check pupils’ work. Identifypupils who need more help and group them so that you can work with them.
Bring the class back together to check and discuss answers to the worksheet. Askselected pupils to explain their ‘What if…?‘ questions and to describe how theychanged the model to find the answer. Demonstrate on the large display as eachpupil explains the procedure. Ask other pupils to check if this is correct. Prompt forfurther explanation if the procedure is not clear.
Before moving on to the next activity, ensure that you have explored the last ‘Whatif…?‘ question with pupils. Check that the pupils understand that a good‘guesstimate’ can be used as a starting point in the model for ‘What if…?’questions and that a model is able to refine this ‘guesstimate’.
15 minutesUnit
12 Key Stage 3 National Strategy / ICT Sample teaching unit 8.4 © Crown copyright 2002
School fete worksheet answers
BackgroundThe file 8.4P1c School fete.xls is a financial model. It models theamount of money which the PTA may make at the annual school fete.It includes possible ways of making money (income) at the fete, suchas selling teas and cakes. It also shows the costs (expenditure) ofrunning the fete. The model calculates the profit or loss being madewhen specified numbers of people visit the fete. The modelcalculates the total profit/loss by using this formula.
profit or loss = income – expenditure
The amount of money taken, and any overall profit, will depend onthe number of people coming to the fete and spending money. Themore people that come, the more profit will be made.
1 Which cell calculates the total income?
2 Which cell calculates the total expenditure?
3 Which cell calculates the profit/loss?
8.4T1e
D13
D24
D26
4 Using Goal Seek ...
Ask pupils what they thought about the trial-and-improvement method for findingthe break-even number of people. If necessary, prompt them by saying:
• it can be slow getting to the answer;
• it can be tedious;
• it can be difficult to find a starting point.
Tell pupils that, although they could use trial and improvement, spreadsheetsoftware has tools that are more efficient. Explain that the Goal Seek… function inMicrosoft Excel is one example. Demonstrate the Goal Seek… function by using itto calculate the number of people required to make neither a profit nor a loss atthe school fete.
Ask pupils to reflect on the processes which the spreadsheet is carrying out byasking these questions.
• What do you think is happening when the Goal Seek… function starts?
• What do you think the message means when it indicates that Goal Seek… has ‘found a solution’?
• How do you think it found this solution?
• Consider the answer it produces [128.6923077]. Can this be right?
• Why do you think it produces an answer of a part of a person?
• What are some of the limitations of using a computer model?

15 minutesUnit
Distribute 8.4P1f Goal seek.doc. Ask pupils to think about the question. Ask apupil to explain which cells will need to be changed. Ask another pupil to explainhow to use the Goal Seek… function. Demonstrate on the large screen. Tell pupilsto work in pairs, using the Goal Seek… function to complete the other questions.
Differentiation
Pair up pupils with similar attainment. Work with pupils who need extra support,making small groups as appropriate. Provide handouts of 8.4T1g Goal seekhelpsheet.doc.
13 Key Stage 3 National Strategy / ICT Sample teaching unit 8.4 © Crown copyright 2002
Goal Seek… worksheet
1 What if you want a profit of £3000 and only 350 people attend? How much should you charge for the entrance fee?
2 What if you charge £0.50 for the cakes and £1.50 for hot dogs or burgers? How many people do you now need if you want to break even?
3 What if each person buys 6 rides and 4 raffle tickets? How many people do you now need ifyou want to make a profit of £3500?
4 Write two ‘What if…?’ questions of your own. Ask another pupil to tryto answer them. Make sure you have worked out the answersyourself first! Write the questions and correct answers below.
Your question 1: Answer:
8.4P1f
Goal Seek… help sheet
This sheet is designed for teacher demonstration.It can be adapted to suit local needs.
1 Load the school fete file. As an example, say you want to find thenumber of people required to make a profit of £5000.The profitformula is held in cell D29.
2 Select the Goal Seek… option.
3 Now enter the relevant details into the Goal Seek… dialogue box asshown below.
8.4T1g
5 Plenary: Reviewing the model
Ask pupils to consider what makes a good model. Possible answers may includethat it:
• is easy to use;
• is accurate;
• simulates a real situation;
• simulates a real situation which answers some questions.
Ask pupils to reflect on the school fete model they have been using. Ask thesequestions.
• Do you think the school fete model is a good model?
• How accurate is it?

• How could we find out?
• How could it be improved?
Draw out the following points.
• The accuracy could be checked by trying out the model with test data.
• It would be easy to add new variables, for example, to calculate income and purchases.
• The rules of the model could be extended to take account of other factors suchas weather, advertising and past enjoyment.
• The model is limited because it is assumed that people will spend equal amounts or undertake the same activities.
• The accuracy could be checked by comparing the model with a real schoolfete.
14 Key Stage 3 National Strategy / ICT Sample teaching unit 8.4 © Crown copyright 2002
Homework
Tell pupils that in the next lesson they will create their own models based onmobile telephones. Their model will help answer the question: ‘What is the best-value phone for me?’ Gather some responses about the factors to be taken intoaccount when choosing a mobile phone. Tell pupils that in the next lesson they willbe looking specifically at the cost of running a mobile phone. Ask pupils to collectinformation on the costs of running two types of mobile phone and to identify thesimilarities and differences between the packages.
Differentiation
If there are pupils who will find it difficult to list the variables they found, youcould direct their thinking by providing a simple frame on which to record theirlist, for example, by including prompts such as:
• different charges at different times of the day;
• free offers;
• fixed costs.
15 Key Stage 3 National Strategy / ICT Sample teaching unit 8.4 © Crown copyright 2002
2Developing a new model
ICT Framework objectives
DEVELOPING IDEAS AND MAKING THINGS HAPPEN
Models and modelling• Draw and explain conclusions.
• Review and modify ICT models to improve their accuracy and extend their scope.
Key vocabulary
From Year 7: variable
From Year 8: assumption, goal seek
Preparation and planning• Prepare a wall display to collect information about mobile phones from pupils’
homework.
• Decide how you are going to pair pupils for working on the computers.
• Ensure that you have access to 8.4T2a Phone starter.ppt and 8.4P2b Mobyphone 1.xls and that 8.4P2b Mobyphone 1.xls is also available in theshared area.
• Print sufficient copies of 8.4P2c Phone worksheet.doc for each pupil to have one.
• Prepare a simple input – process – output diagram for activity 5, on thewhiteboard or flipchart.
• Prepare a simple frame to support pupils in recording their answers in activity 2.
• If necessary, prepare guidance for the pupils to support the software being used,either as a handout or available on the school’s intranet.
• Display the teaching objectives, phrased so that all pupils will understand them.
• Add new vocabulary to the wall display.
Resources • Large computer screen display
• Sufficient computers for pupils to work in pairs or small groups
• Spreadsheet software
• Shared network area, or alternative way to pass spreadsheet data to pupils
• Whiteboard or flipchart
Lesson

16 Key Stage 3 National Strategy / ICT Sample teaching unit 8.4 © Crown copyright 2002
• Resource files:
– 8.4T2a Phone starter.ppt
– 8.4P2b Mobyphone 1.xls
– 8.4P2c Phone worksheet.doc
– 8.4T2d Mobyphone 1 answers.xls
– 8.4T2e Phone worksheet answers.doc
Lesson outline 60 minutes
1 Starter: Identifying variables Discussion 5 minutesWhole class
2 Comparing tariffs Discussion 5 minutesWhole class
3 Structuring a model Discussion 10 minutesWhole class
4 Developing, exploring and Using software 25 minutesanalysing the model Paired work
Whole class
5 Input and output values in Explanation 5 minutesa model Whole class
6 Plenary: Evaluating the model Discussion 10 minutesWhole class
Homework Individual work
5 minutesUnit
5 minutesUnit 1 Starter: Identifying variables
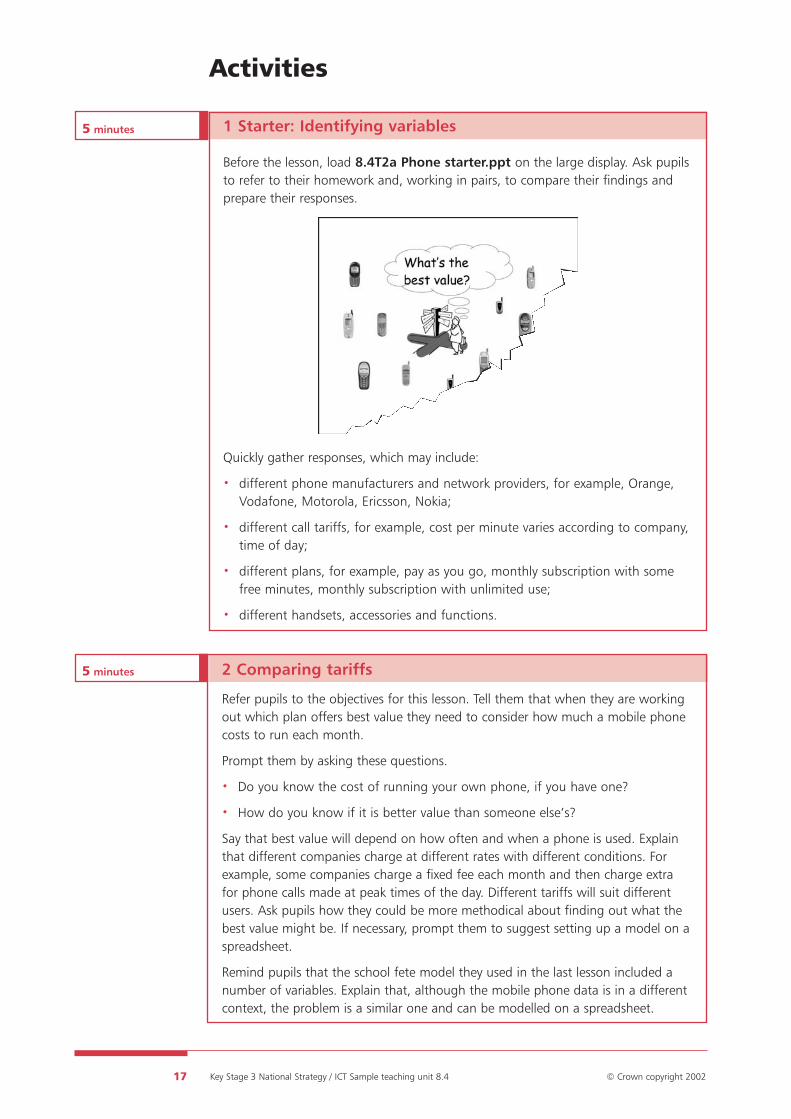
Before the lesson, load 8.4T2a Phone starter.ppt on the large display. Ask pupilsto refer to their homework and, working in pairs, to compare their findings andprepare their responses.
Quickly gather responses, which may include:
• different phone manufacturers and network providers, for example, Orange,Vodafone, Motorola, Ericsson, Nokia;
• different call tariffs, for example, cost per minute varies according to company,time of day;
• different plans, for example, pay as you go, monthly subscription with somefree minutes, monthly subscription with unlimited use;
• different handsets, accessories and functions.
17 Key Stage 3 National Strategy / ICT Sample teaching unit 8.4 © Crown copyright 2002
2 Comparing tariffs
Refer pupils to the objectives for this lesson. Tell them that when they are workingout which plan offers best value they need to consider how much a mobile phonecosts to run each month.
Prompt them by asking these questions.
• Do you know the cost of running your own phone, if you have one?
• How do you know if it is better value than someone else’s?
Say that best value will depend on how often and when a phone is used. Explainthat different companies charge at different rates with different conditions. Forexample, some companies charge a fixed fee each month and then charge extrafor phone calls made at peak times of the day. Different tariffs will suit differentusers. Ask pupils how they could be more methodical about finding out what thebest value might be. If necessary, prompt them to suggest setting up a model on aspreadsheet.
Remind pupils that the school fete model they used in the last lesson included anumber of variables. Explain that, although the mobile phone data is in a differentcontext, the problem is a similar one and can be modelled on a spreadsheet.
Activities
Remind pupils of work on the school fete model in lesson 1, where they asked‘What if…?’ questions to analyse the data.
Tell pupils that in this lesson they will use a spreadsheet to construct a modelwhich will enable them to make decisions about the best-value mobile phonetariff.
18 Key Stage 3 National Strategy / ICT Sample teaching unit 8.4 © Crown copyright 2002
10 minutesUnit 3 Structuring a model
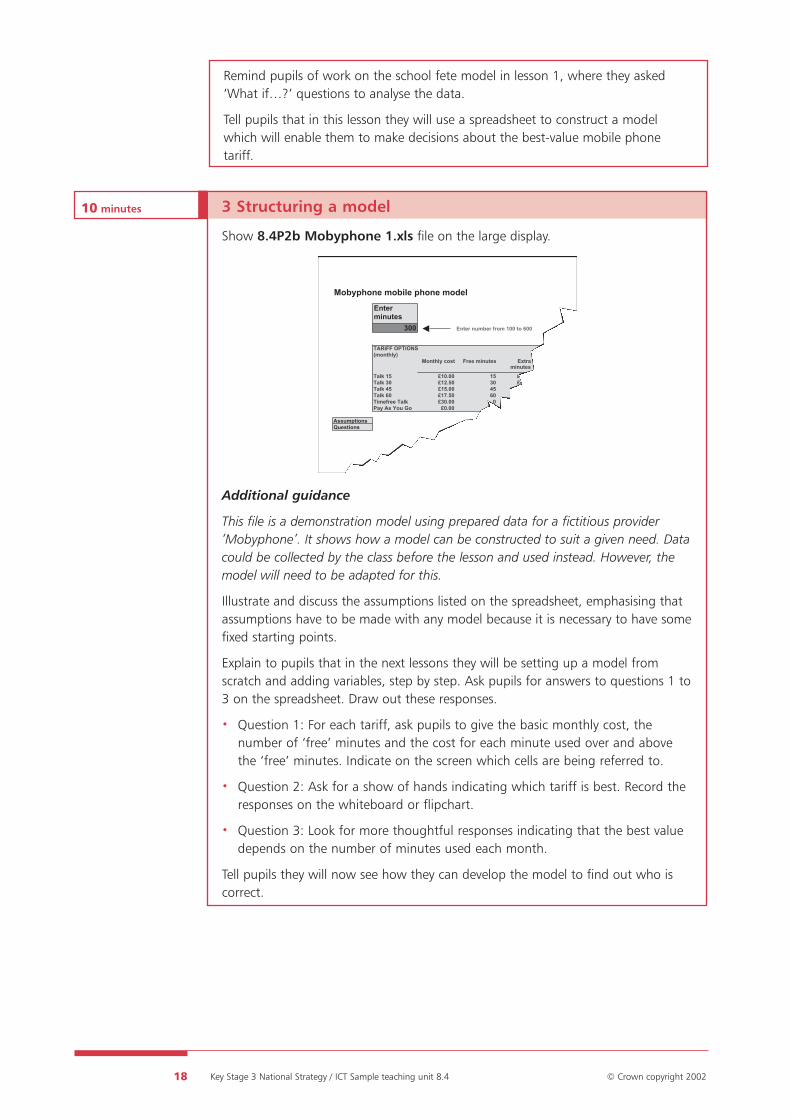
Show 8.4P2b Mobyphone 1.xls file on the large display.
Additional guidance
This file is a demonstration model using prepared data for a fictitious provider‘Mobyphone’. It shows how a model can be constructed to suit a given need. Datacould be collected by the class before the lesson and used instead. However, themodel will need to be adapted for this.
Illustrate and discuss the assumptions listed on the spreadsheet, emphasising thatassumptions have to be made with any model because it is necessary to have somefixed starting points.
Explain to pupils that in the next lessons they will be setting up a model fromscratch and adding variables, step by step. Ask pupils for answers to questions 1 to3 on the spreadsheet. Draw out these responses.
• Question 1: For each tariff, ask pupils to give the basic monthly cost, thenumber of ‘free’ minutes and the cost for each minute used over and abovethe ‘free’ minutes. Indicate on the screen which cells are being referred to.
• Question 2: Ask for a show of hands indicating which tariff is best. Record theresponses on the whiteboard or flipchart.
• Question 3: Look for more thoughtful responses indicating that the best valuedepends on the number of minutes used each month.
Tell pupils they will now see how they can develop the model to find out who iscorrect.
Mobyphone mobile phone model
300 Enter number from 100 to 600
TARIFF OPTIONS(monthly)
Monthly cost Free minutes Extraminutes
Talk 15 £10.00 15 £0.06 300Talk 30 £12.50 30 £0.05 300Talk 45 £15.00 45 £0.04 300Talk 60 £17.50 60 £0.03 300Timefree Talk £30.00 0 £0.00 300Pay As You Go £0.00 0 £0.08 300
AssumptionsQuestions
Enter minutes
19 Key Stage 3 National Strategy / ICT Sample teaching unit 8.4 © Crown copyright 2002
4 Developing, exploring and analysing the model
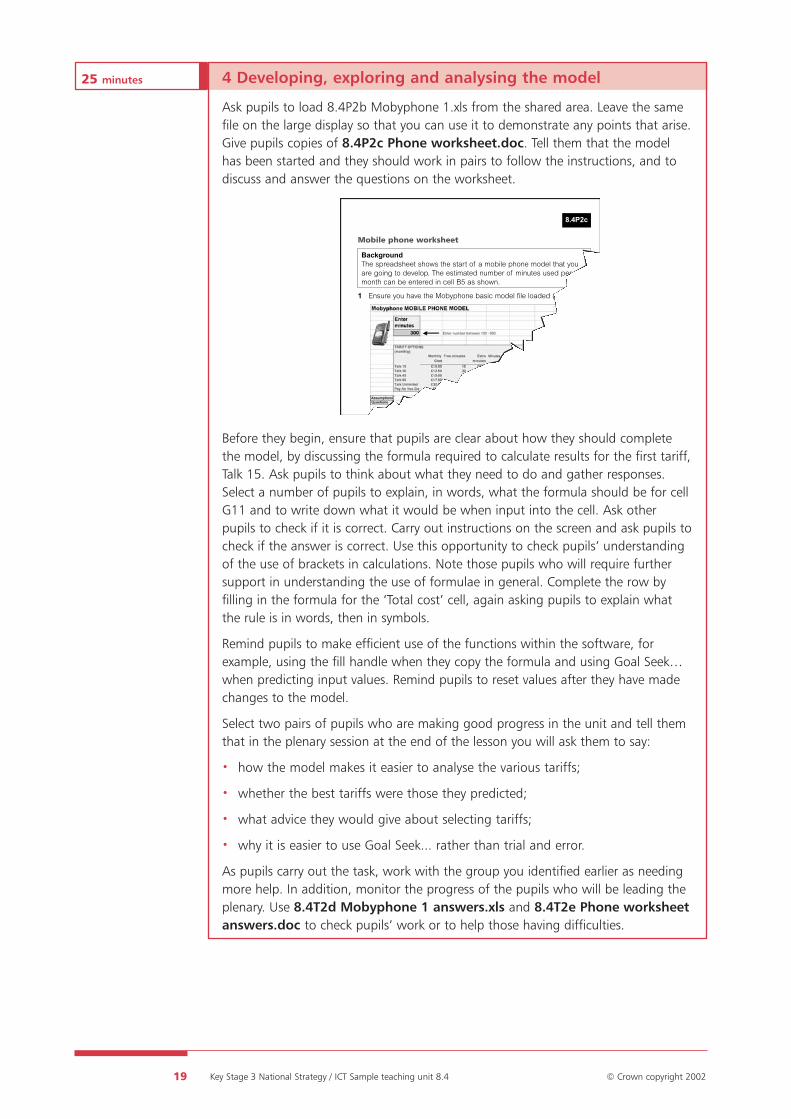
Ask pupils to load 8.4P2b Mobyphone 1.xls from the shared area. Leave the samefile on the large display so that you can use it to demonstrate any points that arise.Give pupils copies of 8.4P2c Phone worksheet.doc. Tell them that the modelhas been started and they should work in pairs to follow the instructions, and todiscuss and answer the questions on the worksheet.
Before they begin, ensure that pupils are clear about how they should completethe model, by discussing the formula required to calculate results for the first tariff,Talk 15. Ask pupils to think about what they need to do and gather responses.Select a number of pupils to explain, in words, what the formula should be for cellG11 and to write down what it would be when input into the cell. Ask otherpupils to check if it is correct. Carry out instructions on the screen and ask pupils tocheck if the answer is correct. Use this opportunity to check pupils’ understandingof the use of brackets in calculations. Note those pupils who will require furthersupport in understanding the use of formulae in general. Complete the row byfilling in the formula for the ‘Total cost’ cell, again asking pupils to explain whatthe rule is in words, then in symbols.
Remind pupils to make efficient use of the functions within the software, forexample, using the fill handle when they copy the formula and using Goal Seek…when predicting input values. Remind pupils to reset values after they have madechanges to the model.
Select two pairs of pupils who are making good progress in the unit and tell themthat in the plenary session at the end of the lesson you will ask them to say:
• how the model makes it easier to analyse the various tariffs;
• whether the best tariffs were those they predicted;
• what advice they would give about selecting tariffs;
• why it is easier to use Goal Seek... rather than trial and error.
As pupils carry out the task, work with the group you identified earlier as needingmore help. In addition, monitor the progress of the pupils who will be leading theplenary. Use 8.4T2d Mobyphone 1 answers.xls and 8.4T2e Phone worksheetanswers.doc to check pupils’ work or to help those having difficulties.
25 minutesUnit
Mobile phone worksheet
BackgroundThe spreadsheet shows the start of a mobile phone model that youare going to develop. The estimated number of minutes used permonth can be entered in cell B5 as shown.
1 Ensure you have the Mobyphone basic model file loaded (as shown).
8.4P2c
5 minutesUnit 5 Input and output values in a model
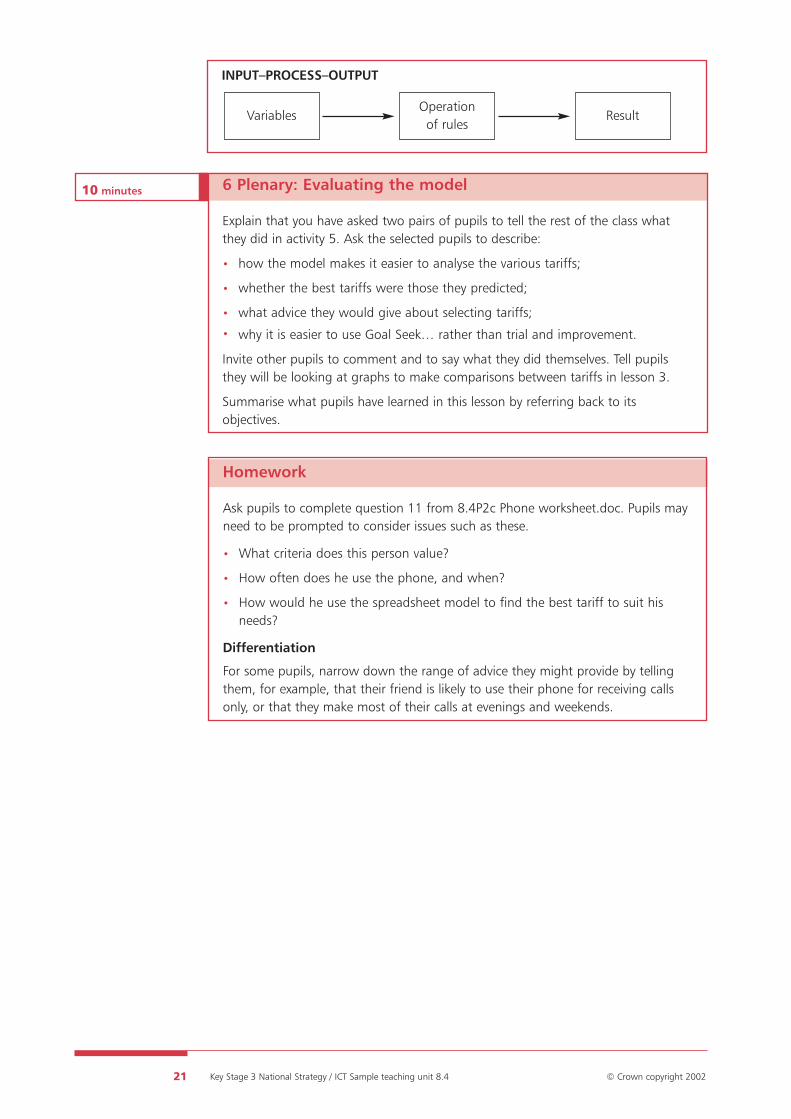
When most of the pupils have completed question 9, draw the class together todiscuss the use of Goal Seek... in a model. Explain the difference between inputand output values on a model by telling pupils that models can work both ways.Say that they can either enter input values to calculate an output value or set theoutput value (target value) to determine the input value required to reach it.Illustrate this, using the diagram that you prepared earlier on the whiteboard orflipchart.
20 Key Stage 3 National Strategy / ICT Sample teaching unit 8.4 © Crown copyright 2002
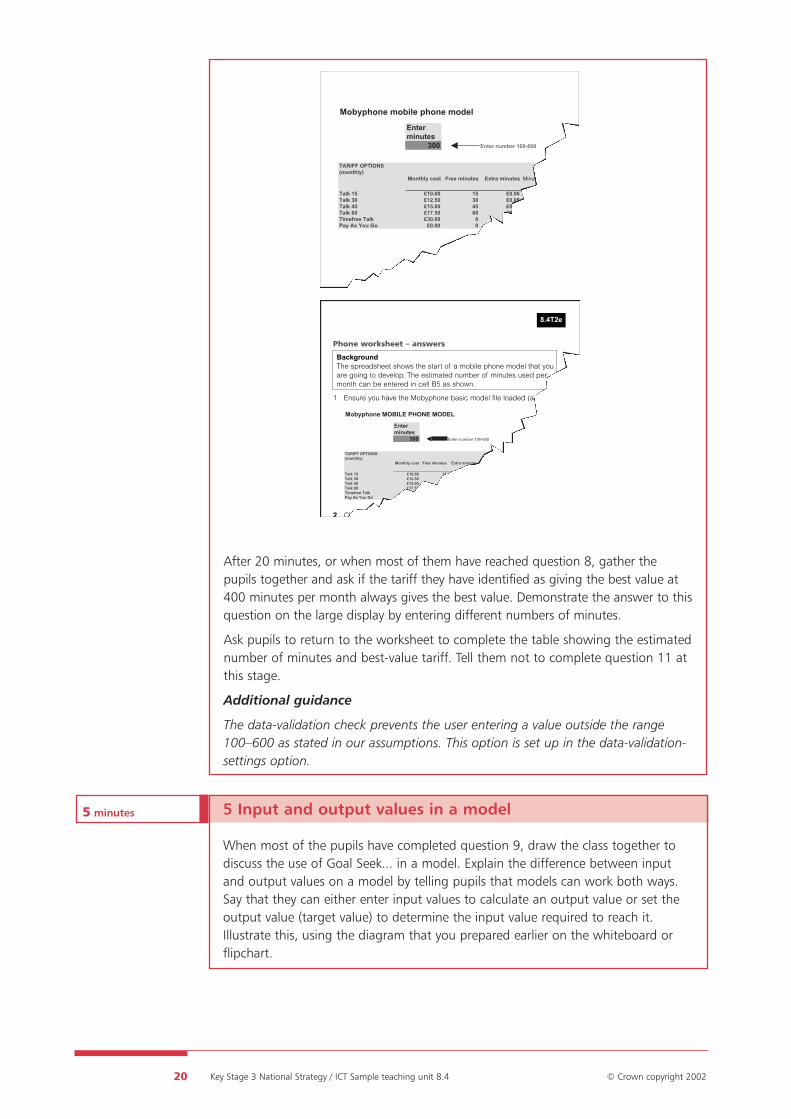
After 20 minutes, or when most of them have reached question 8, gather thepupils together and ask if the tariff they have identified as giving the best value at400 minutes per month always gives the best value. Demonstrate the answer to thisquestion on the large display by entering different numbers of minutes.
Ask pupils to return to the worksheet to complete the table showing the estimatednumber of minutes and best-value tariff. Tell them not to complete question 11 atthis stage.
Additional guidance
The data-validation check prevents the user entering a value outside the range100–600 as stated in our assumptions. This option is set up in the data-validation-settings option.
Mobyphone mobile phone model
Enterminutes
300 Enter number 100-600
TARIFF OPTIONS(monthly)
Monthly cost Free minutes Extra minutes Minute
Talk 15 £10.00 15 £0.06 300 £Talk 30 £12.50 30 £0.05 300 £Talk 45 £15.00 45 £0.04 300 £Talk 60 £17.50 60 £0.03 300Timefree Talk £30.00 0 £0.00 300Pay As You Go £0.00 0 £0.08 300 £
Phone worksheet – answers
BackgroundThe spreadsheet shows the start of a mobile phone model that youare going to develop. The estimated number of minutes used permonth can be entered in cell B5 as shown.
1 Ensure you have the Mobyphone basic model file loaded (as shown).
2 Change the number of minutes in B5. What happens to the values in
8.4T2e
21 Key Stage 3 National Strategy / ICT Sample teaching unit 8.4 © Crown copyright 2002
Homework
Ask pupils to complete question 11 from 8.4P2c Phone worksheet.doc. Pupils mayneed to be prompted to consider issues such as these.
• What criteria does this person value?
• How often does he use the phone, and when?
• How would he use the spreadsheet model to find the best tariff to suit hisneeds?
Differentiation
For some pupils, narrow down the range of advice they might provide by tellingthem, for example, that their friend is likely to use their phone for receiving callsonly, or that they make most of their calls at evenings and weekends.
10 minutesUnit 6 Plenary: Evaluating the model
Explain that you have asked two pairs of pupils to tell the rest of the class whatthey did in activity 5. Ask the selected pupils to describe:
• how the model makes it easier to analyse the various tariffs;
• whether the best tariffs were those they predicted;
• what advice they would give about selecting tariffs;
• why it is easier to use Goal Seek… rather than trial and improvement.
Invite other pupils to comment and to say what they did themselves. Tell pupilsthey will be looking at graphs to make comparisons between tariffs in lesson 3.
Summarise what pupils have learned in this lesson by referring back to itsobjectives.
INPUT–PROCESS–OUTPUT
VariablesOperationof rules
Result
22 Key Stage 3 National Strategy / ICT Sample teaching unit 8.4 © Crown copyright 2002
Lesson 3Using graphs to model withspreadsheets
ICT Framework objectives
DEVELOPING IDEAS AND MAKING THINGS HAPPEN
Models and modelling• Develop ICT-based models and test predictions by changing variables and rules.
FINDING THINGS OUT
Organising and investigating• Explore and interpret collected data in order to draw conclusions.
Key vocabulary
From Year 8: absolute cell reference, relative cell reference
Preparation and planning• Decide how you are going to pair pupils for working on the computers.
• Identify pupils who will need extra support.
• Ensure that you are familiar with the pupil and teacher resources for the lesson.
• If necessary, adapt the resources to suit your particular software.
• Ensure that 8.4P3b School fete.xls, 8.4T3a Graph starter.ppt and 8.4P3cMobyphone 2 extended model.xls are available electronically and that 8.4T3eMobyphone 2 extended model answers.xls is available in the shared area.
• Copy 8.4P3e Phone worksheet 2.doc for pupils.
• If necessary, prepare guidance for the pupils to support the software being used,either as a handout or available on the school’s intranet.
• Display the teaching objectives, phrased so that all pupils will understand them.
• Add new vocabulary to the wall display.
Resources• Large computer screen display
• Sufficient computers for pupils to work in pairs or small groups
• Spreadsheet software
• Shared network area, or alternative way to pass spreadsheet data to pupils
• Resource files:
– 8.4T3a Graph starter.ppt
– 8.4P3b School fete formulae.xls
– 8.4P3c Mobyphone 2 extended model.xls
– 8.4P3d Phone worksheet 2.doc
– 8.4T3e Mobyphone 2 extended model answers.xls
– 8.4T3f Plenary.ppt
Lesson outline 60 minutes
1 Starter: Using charts Finding information 10 minutesIndividual work
2 Cell referencing Demonstrating software 10 minutesWhole class
3 Extending the model Using software 20 minutesWhole classPaired work
4 Reviewing the model Data investigation 10 minutesPaired work
5 Plenary: Evaluating the Discussion 10 minutesuse of charts and graphs Whole class
Homework Individual work
23 Key Stage 3 National Strategy / ICT Sample teaching unit 8.4 © Crown copyright 2002
24 Key Stage 3 National Strategy / ICT Sample teaching unit 8.4 © Crown copyright 2002
10 minutesUnit Activity 1 Starter: Using charts
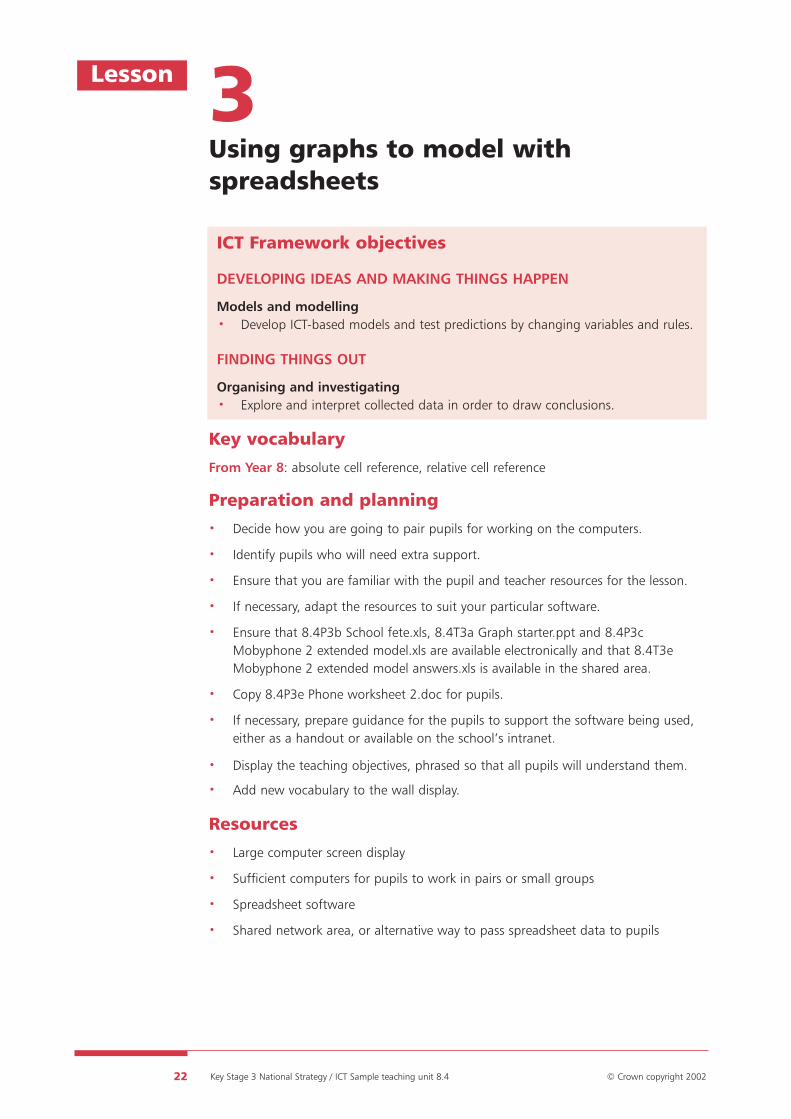
Load 8.4T3a Graph starter.ppt on to the large display. This asks pupils toexamine a set of graphs comparing monthly tariffs for mobile phones. As pupilsenter the room, ask them to start the activity. After 2 to 3 minutes, gatherresponses in preparation for later activities. Extend pupils by asking them to thinkabout how easy it is to read information from the graph.
Show the second slide (containing the spreadsheet from lesson 2). Ask pupils tothink about how they used the table in the model in the last lesson, to decidewhich tariff was the best value and to consider which is the easier way to make thecomparison.
Ask pupils to consider the limitations of the model and the graph in makingcomparisons. Gather responses, which may include these points:
• The graph only shows costs for a selected number of calls.
• The table is difficult to read to make comparisons.
• The variables in the model can be changed to show different numbers of callsbut comparison is difficult.
Ask one or two pupils to share their homework responses with the class. Use theseto review the correct responses to question 11 from 8.4P2c Phone worksheet.doc.
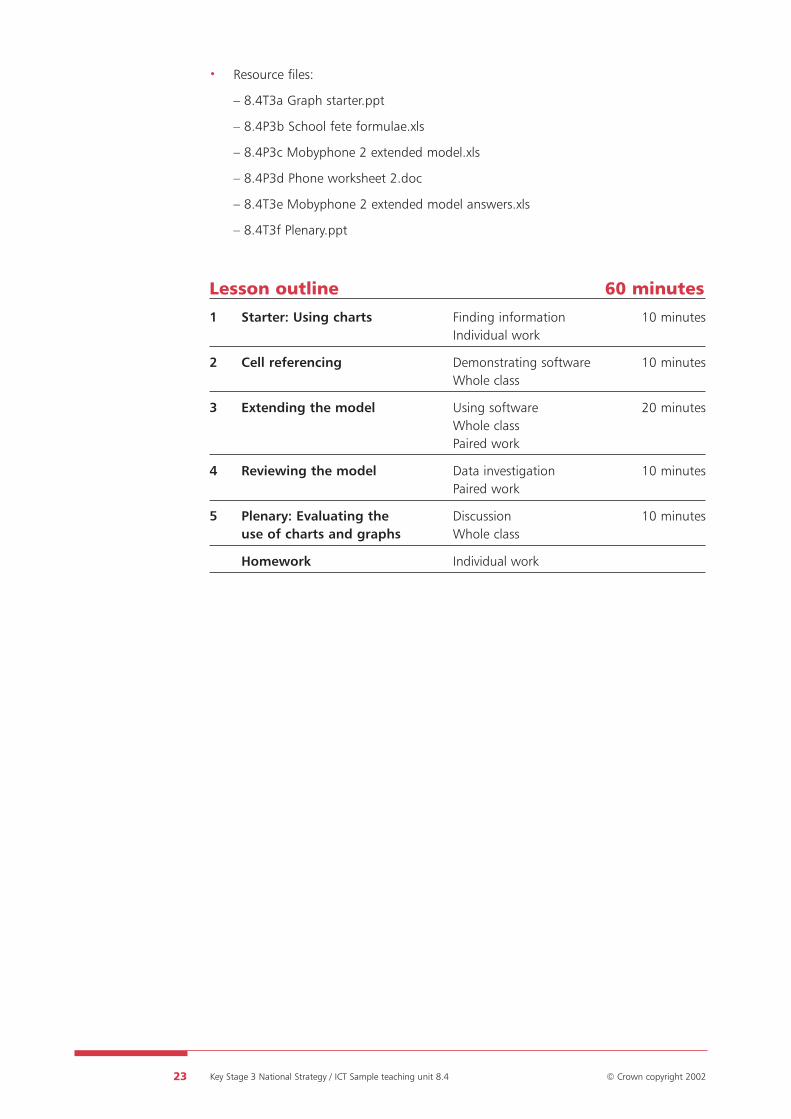
Show the third slide (containing a line graph), displaying only the Talk 15 tariff.
Activities
10 minutesUnit
25 Key Stage 3 National Strategy / ICT Sample teaching unit 8.4 © Crown copyright 2002
Click the mouse until the Talk 15 graph appears (red line). Ask pupils what thisdisplays. Ask selected pupils to use the graph to answer these questions.
• I use 200 minutes’ worth of calls a month. How much will this cost?
• I have a budget of £40 a month. How many minutes can I buy?
Add the next two lines to the chart. Prompt pupils to think about using this chartto make comparisons, by asking these questions.
• Which tariff is the cheapest if I use 500 minutes’ worth of calls a month?
• Which is the best value if I can afford £20 per month for my phone?
Tell pupils that this graph models the mobile phone tariffs in a way that makes iteasier to make comparisons. Tell pupils that in this lesson they will construct theirown graph, similar to this one, so that they can compare tariffs. Refer them to thedisplayed objectives for the lesson.
2 Cell referencing
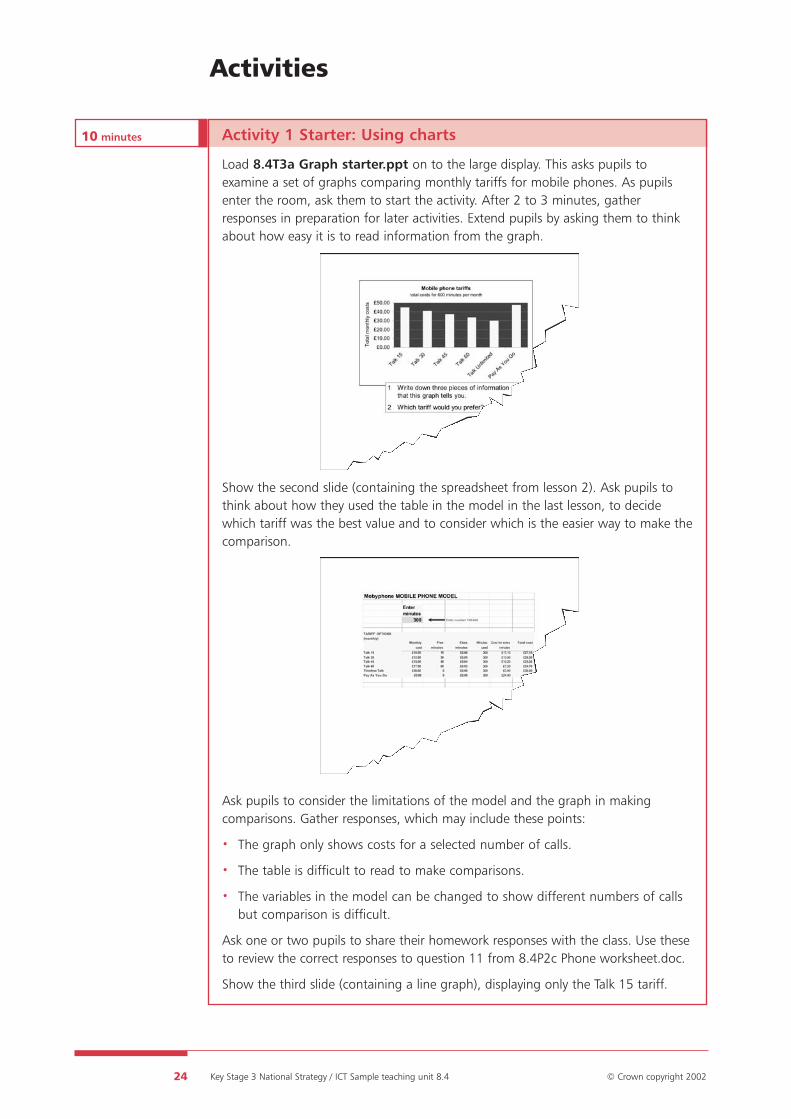
Explain that, before they look in detail at developing their mobile phone model,pupils are going to learn about a new technique that they will need to use. Remindthem about the spreadsheet they used before and how they used it to model thepossible finances of the school fete. Display the school fete model 8.4P3b Schoolfete formulae.xls on the large display screen.
Click on cell D4 and ask the pupils to remind you of the formula that was in thecell and what it calculated. Enter the formula (the best way of doing this as ademonstration is to click on the cell D7, then type =, click on cell B4, type *, clickon C4, type *, click on D1 – this shows logically and mathematically that cell D7 =B7*C7*D1).
Estimated number of people 4
INCOME Cost No. bought per person Money inEntrance £2.00 1Tea/coffee £0.50 1Cakes £0.30 1Hot dogs/burgers £1.00 1Rides £0.75 4Games £0.40 3Raffle £0.50 2Plants £1.50 2Tombola £0.50 2
£0PAYMENTS Money outPA system/musicCaretakerStock of tea/coffee/milk/sugarPacks of sausages/burgers/rollsHire of ridesRaffle prizesGames (borrowed)Plants (donated)Tombola prizes (donated)
£0
£0
Now say that the formula will be the same in each of the cells from D4 to D12.Remind pupils that the quickest way to copy the same formula into each of thesecells is to click on cell D4 then use the copy handle to drag and copy the formulainto each of the cells to D12. Demonstrate this.
Since the copy facility will copy relative values, the calculations will appear to fail.Ask the pupils why they think this has happened. Click on cell D5 and ask themwhat is wrong with the formula there. You may also click on other cells in thecolumn to reinforce the point. Ask the pupils what has happened.
Tell the pupils that the software has changed the formula to reflect the relativepositions of the cells. The contents of the cell change according to their columnand row position. Tell them that this works for the cells in columns B and C butnot for the cell which holds the number of people attending the fete (cell D1),because we always want the formula to refer to the number of people attending.
Explain that the software has tried to be helpful and predict what the user requiresbut, in this case, it has been too clever. Tell the pupils that they need to tell thesoftware that the cell D1 is not relative to the positions of the other cells in theformula but is always in the same, absolute, position. Pupils may find it useful toremember the sentence, ‘If you absolutely want cell D1 then you need to makesure it’s an absolute reference.’
Remind pupils that the way to specify that the cell is an absolute (unchanging)reference is to put a $ sign in front of the column and row labels ($D$1). Explainthat this does not indicate a currency but is simply a character used to give aninstruction to the software. If the pupils have studied sample teaching unit 7.4they will have met this before.
Move the edit cursor to D1 on the formula edit bar. Click to make sure it staysthere. Now press <F4> once. This changes the formula in cell D7 to=B7*C7*$D$1. Then use the copy handle to copy the formula down the cells toD12, as before.
The calculations will now be correct. By clicking on any of the cells from D4 to D12it will be possible to see that each cell now refers to the absolute position of $D$1but to relative positions for the cells in columns B and C.
26 Key Stage 3 National Strategy / ICT Sample teaching unit 8.4 © Crown copyright 2002
20 minutesUnit 3 Extending the model
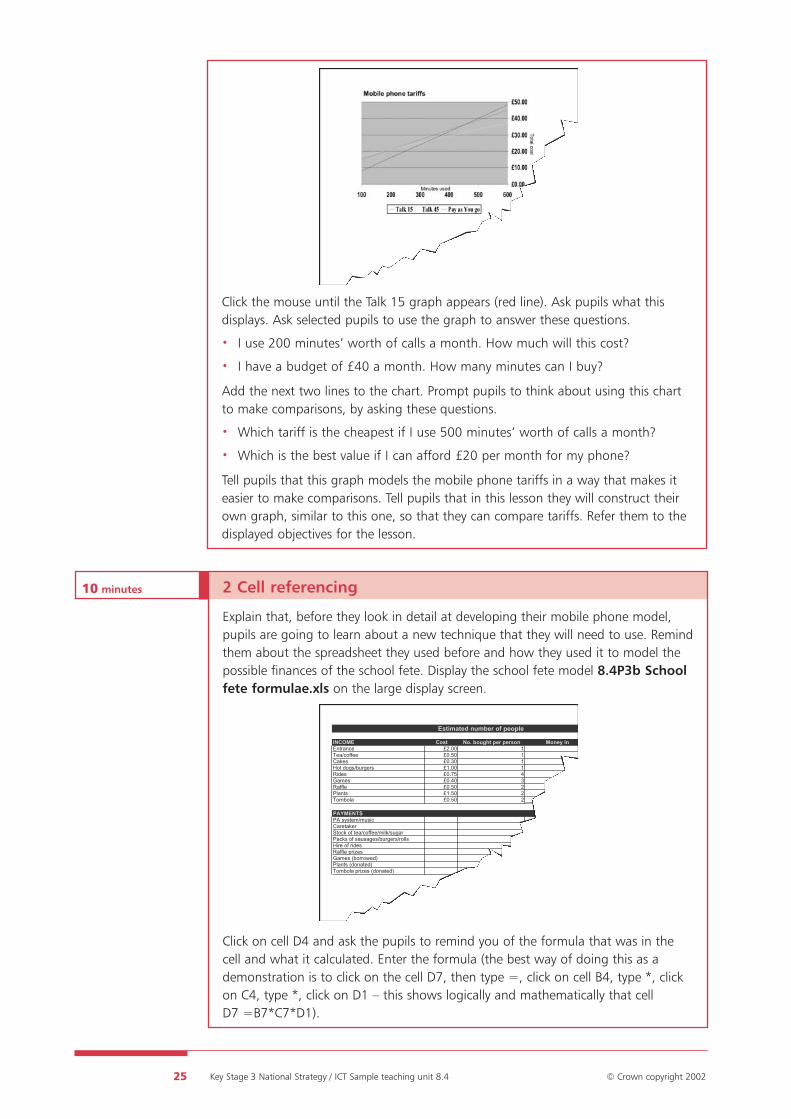
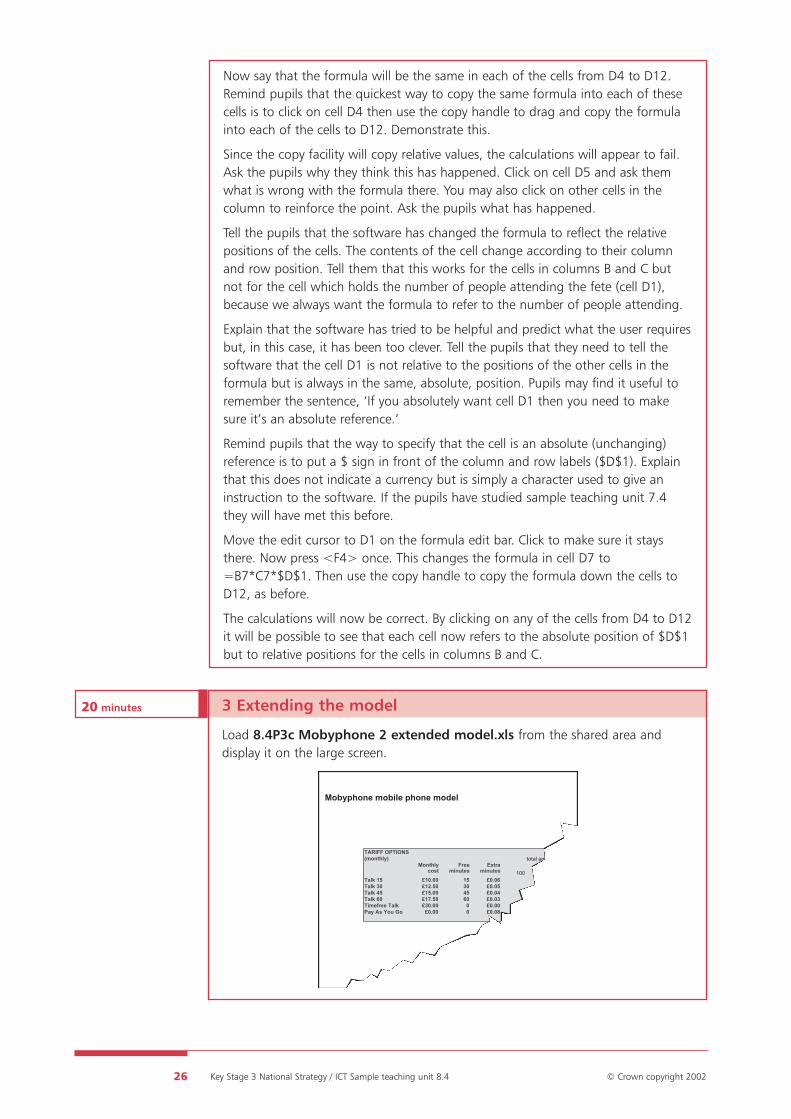
Load 8.4P3c Mobyphone 2 extended model.xls from the shared area anddisplay it on the large screen.
Mobyphone mobile phone model
TARIFF OPTIONS(monthly)
Monthlycost
Freeminutes
Extra minutes 100
Talk 15 £10.00 15 £0.06Talk 30 £12.50 30 £0.05Talk 45 £15.00 45 £0.04Talk 60 £17.50 60 £0.03Timefree Talk £30.00 0 £0.00Pay As You Go £0.00 0 £0.08
total am

27 Key Stage 3 National Strategy / ICT Sample teaching unit 8.4 © Crown copyright 2002
Ask pupils to think about the model structure. Explain that you need to structurethe model in this way to be able to create a graph. Ask pupils to say what willneed to go into cell F11. Ask them to describe it in words and then as a formula.Demonstrate how to do this on the screen.
Before using the Fill Down function, ask pupils to think about what will happen.Use the fill handle to replicate the formula into cells F12 to F16. Discuss the resultswith the pupils and ask for suggestions for creating correct formulae. If necessary,move the discussion to the use of absolute cell references. Demonstrate how to dothis. A comment has been inserted into cells F11 and G11 as a reminder of yourdiscussion with the pupils.
Distribute 8.4P3d Phone worksheet 2.doc and tell pupils to load 8.4P3bMobyphone 2 extended model.xls from the shared area. Ask pupils to completethe tasks on the worksheet. Circulate as pupils work, helping them and using8.4T3e Mobyphone 2 Extended model answers.xls to check their progress.
Identify any pupils or small groups having difficulty with creating a comparativeline graph in question 3. Help these pupils to:
• select minute headings;
• select an appropriate line graph;
• select appropriate rows or columns;
• remove gridlines for easier viewing;
• add a suitable title and labels for axes.
Mobile phone worksheet 2
BackgroundThe questions and tasks below focus on how the model can beextended by using absolute cell references.
Load the file 8.4P3c Mobyphone 2 extended model.xls.
8.4P3d
Mobyphone mobile phone model
TARIFF OPTIONS(monthly)
Monthlycost
Free minutes
Extra minutes 100
Talk 15 £10.00 15 £0.06 £15.10 £21.10 £27.1Talk 30 £12.50 30 £0.05 £16.00 £21.00 £26.0Talk 45 £15.00 45 £0.04 £17.20 £21.20 £25.2Talk 60 £17.50 60 £0.03 £18.70 £21.70 £24.7Timefree Talk £30.00 0 £0.00 £30.00 £30.00 £30.0Pay As You Go £0.00 0 £0.08 £8.00 £16.00 £24.0

28 Key Stage 3 National Strategy / ICT Sample teaching unit 8.4 © Crown copyright 2002
10 minutesUnit
10 minutesUnit
4 Reviewing the model
Ask selected pupils to describe to the whole group what they did in activity 2 andwhat they found out. If necessary, group pupils who have had difficulty withactivity 2 in such a way that you, or pupils who have made good progress, canhelp them to complete the worksheet.
5 Plenary: Evaluating the use of charts and graphs
Show 8.4T3f Plenary.ppt on the large display and give pupils 2 minutes todiscuss, in pairs, which three statements they consider to be the top three benefitsof using ICT to produce charts, rating them 1, 2 and 3.
Take feedback from as many pairs as possible. Identify which three features theclass considers to be the most useful and discuss why they think so. Show slide 2and discuss the disadvantages of using ICT to generate graphs.
Stress that graphs that are the most appealing visually are not always valid, andoften do not present information in its most useful form.
Summarise the lesson by reminding pupils about the new techniques they havelearned. Remind them how these have helped them to amend and extend themodel. Say that in the next lesson they will work with models that use randomly-produced numbers as variables.
Homework
Tell the pupils that decisions are often made by taking into account a wide range ofvariables. The model being used in these lessons has only used the tariff for mobilephones as a variable. Ask pupils to list other variables that they would wish to takeinto account when buying their own mobile phone and selecting a service provider.
You may wish to give particular pupils some prompts, such as design, weight,coverage.

29 Key Stage 3 National Strategy / ICT Sample teaching unit 8.4 © Crown copyright 2002
Lesson 4Investigating models
ICT Framework objectives
DEVELOPING IDEAS AND MAKING THINGS HAPPEN
Models and modelling• Develop ICT-based models and test predictions by changing variables and rules.
• Review and modify ICT models to improve their accuracy and extend their scope.
Key vocabulary
From Year 7: random number, variable
From Year 8: random number generator
Preparation and planning• As this lesson uses ideas of probability, it would be helpful to consult the
mathematics department about pupils’ familiarity with this topic beforehand.
• Decide how you are going to pair pupils for working on the computers.
• Ensure that you are familiar with the pupil and teacher resources for the lesson.
• If necessary, adapt the resources to suit your particular software.
Ensure that the random number function is activated on the computers. InMicrosoft Excel this is the RANDBETWEEN function. To ensure that this is active,go to Tools, Add-Ins… and select Analysis Toolpak VBA. If this function is notavailable, install it from the purchased software.
• Ensure that 8.4T4a Coin.xls is available electronically and that 8.4P4b Mobyphone2.xls is available in the shared area. You may also want to have 8.4T4dMobyphone 2 answers.xls available.
• Copy 8.4P4c Kelkoo.doc for pupils.
• Ensure that you have access to the Internet and check thathttp://www.buy.co.uk/kelkoo/r5/mobiles.asp is still active.
• Add the Internet address that pupils will be using to the school’s intranet.
• Write the question for activity 1 on the whiteboard or flipchart.
• Prepare the tally chart for activity 2 on the whiteboard or flipchart.
• If necessary, prepare guidance for the pupils to support the software being used,either as a handout or available on the school’s intranet.
• Display the teaching objectives, phrased so that all pupils will understand them.
• Add new vocabulary to the wall display.

30 Key Stage 3 National Strategy / ICT Sample teaching unit 8.4 © Crown copyright 2002
Resources• Large computer screen display
• Sufficient computers for pupils to work in pairs or small groups
• Spreadsheet software
• Shared network area, or alternative way to pass spreadsheet data to pupils
• Access to the Internet
• Resource files:
– 8.4T4a Coin.xls
– 8.4P4b Mobyphone 2.xls
– 8.4T4c Mobyphone 2 answers.xls
– 8.4P4d Kelkoo.doc
– 8.4 T4e Mobile phone extension 1.xls
– 8.4T4f Mobile phone extension 2.xls
Lesson outline 60 minutes
1 Starter: Tossing a coin Demonstrating software 15 minutesWhole class
2 Testing a model with a Using software 20 minutesrandom number generator Paired work
3 Exploring an online model Using a website 15 minutesPaired work
4 Plenary: Reviewing the Discussion 10 minutesphone model Whole class
Homework Individual work
Extension activity
10 minutesUnit 1 Starter: Tossing a coin
As they arrive, direct pupils to the question on the whiteboard or flipchart.
• If you toss a coin ten times, are you likely to get more heads or more tails?
Ask pupils to toss a coin 10 times and record the results.
After 5 minutes gather responses. Ask these questions.
• Will the results always be the same?
• How could we test this hypothesis?
• How could we use a model to test this hypothesis?
Review the homework from the last lesson by asking one or two pupils for theirresponses. Use these to introduce the idea of using a random number generator toproduce plenty of data for a model.
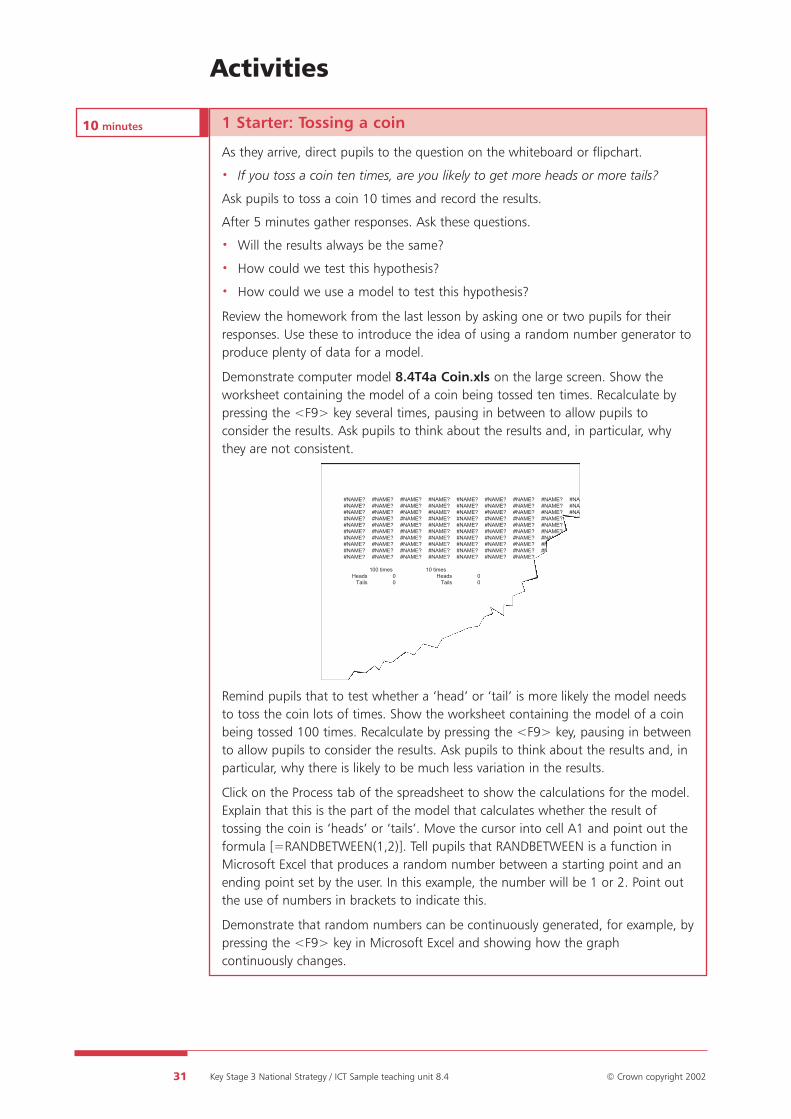
Demonstrate computer model 8.4T4a Coin.xls on the large screen. Show theworksheet containing the model of a coin being tossed ten times. Recalculate bypressing the <F9> key several times, pausing in between to allow pupils toconsider the results. Ask pupils to think about the results and, in particular, whythey are not consistent.
Remind pupils that to test whether a ‘head’ or ‘tail’ is more likely the model needsto toss the coin lots of times. Show the worksheet containing the model of a coinbeing tossed 100 times. Recalculate by pressing the <F9> key, pausing in betweento allow pupils to consider the results. Ask pupils to think about the results and, inparticular, why there is likely to be much less variation in the results.
Click on the Process tab of the spreadsheet to show the calculations for the model.Explain that this is the part of the model that calculates whether the result oftossing the coin is ‘heads’ or ‘tails’. Move the cursor into cell A1 and point out theformula [=RANDBETWEEN(1,2)]. Tell pupils that RANDBETWEEN is a function inMicrosoft Excel that produces a random number between a starting point and anending point set by the user. In this example, the number will be 1 or 2. Point outthe use of numbers in brackets to indicate this.
Demonstrate that random numbers can be continuously generated, for example, bypressing the <F9> key in Microsoft Excel and showing how the graphcontinuously changes.
31 Key Stage 3 National Strategy / ICT Sample teaching unit 8.4 © Crown copyright 2002
Activities
#NAME? #NAME? #NAME? #NAME? #NAME? #NAME? #NAME? #NAME? #NA#NAME? #NAME? #NAME? #NAME? #NAME? #NAME? #NAME? #NAME? #NA#NAME? #NAME? #NAME? #NAME? #NAME? #NAME? #NAME? #NAME? #NA#NAME? #NAME? #NAME? #NAME? #NAME? #NAME? #NAME? #NAME? #NA#NAME? #NAME? #NAME? #NAME? #NAME? #NAME? #NAME? #NAME? #NA#NAME? #NAME? #NAME? #NAME? #NAME? #NAME? #NAME? #NAME? #NA#NAME? #NAME? #NAME? #NAME? #NAME? #NAME? #NAME? #NAME? #NA#NAME? #NAME? #NAME? #NAME? #NAME? #NAME? #NAME? #NAME? #NA#NAME? #NAME? #NAME? #NAME? #NAME? #NAME? #NAME? #NAME? #NA#NAME? #NAME? #NAME? #NAME? #NAME? #NAME? #NAME? #NAME? #NA
100 times 10 timesHeads 0 Heads 0
Tails 0 Tails 0
32 Key Stage 3 National Strategy / ICT Sample teaching unit 8.4 © Crown copyright 2002
2 Testing a model with a random number generator
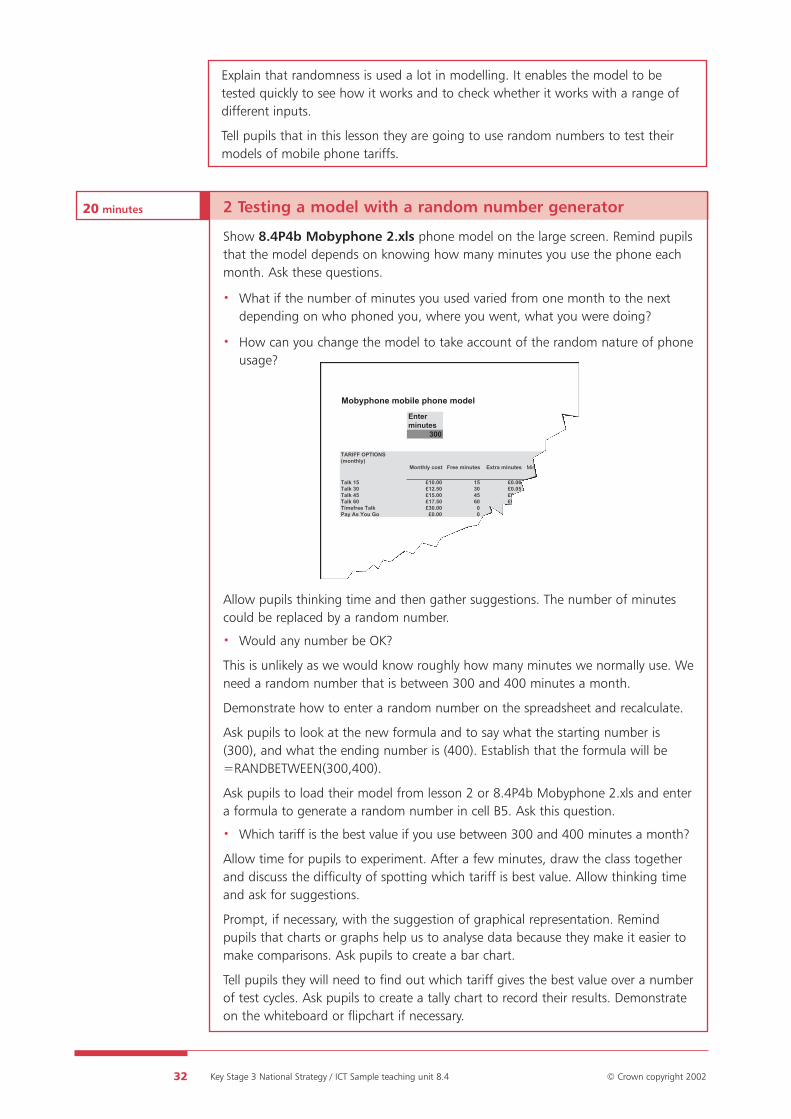
Show 8.4P4b Mobyphone 2.xls phone model on the large screen. Remind pupilsthat the model depends on knowing how many minutes you use the phone eachmonth. Ask these questions.
• What if the number of minutes you used varied from one month to the nextdepending on who phoned you, where you went, what you were doing?
• How can you change the model to take account of the random nature of phoneusage?
Allow pupils thinking time and then gather suggestions. The number of minutescould be replaced by a random number.
• Would any number be OK?
This is unlikely as we would know roughly how many minutes we normally use. Weneed a random number that is between 300 and 400 minutes a month.
Demonstrate how to enter a random number on the spreadsheet and recalculate.
Ask pupils to look at the new formula and to say what the starting number is(300), and what the ending number is (400). Establish that the formula will be=RANDBETWEEN(300,400).
Ask pupils to load their model from lesson 2 or 8.4P4b Mobyphone 2.xls and entera formula to generate a random number in cell B5. Ask this question.
• Which tariff is the best value if you use between 300 and 400 minutes a month?
Allow time for pupils to experiment. After a few minutes, draw the class togetherand discuss the difficulty of spotting which tariff is best value. Allow thinking timeand ask for suggestions.
Prompt, if necessary, with the suggestion of graphical representation. Remindpupils that charts or graphs help us to analyse data because they make it easier tomake comparisons. Ask pupils to create a bar chart.
Tell pupils they will need to find out which tariff gives the best value over a numberof test cycles. Ask pupils to create a tally chart to record their results. Demonstrateon the whiteboard or flipchart if necessary.
20 minutesUnit
Mobyphone mobile phone model
Enterminutes
300
TARIFF OPTIONS(monthly)
Monthly cost Free minutes Extra minutes Minu
Talk 15 £10.00 15 £0.06 300Talk 30 £12.50 30 £0.05 300Talk 45 £15.00 45 £0.04 300Talk 60 £17.50 60 £0.03 300Timefree Talk £30.00 0 £0.00 300Pay As You Go £0.00 0 £0.08 300
Explain that randomness is used a lot in modelling. It enables the model to betested quickly to see how it works and to check whether it works with a range ofdifferent inputs.
Tell pupils that in this lesson they are going to use random numbers to test theirmodels of mobile phone tariffs.
33 Key Stage 3 National Strategy / ICT Sample teaching unit 8.4 © Crown copyright 2002
15 minutesUnit
Tariff Tally Total
Talk 15
Talk 30
Talk 45
Talk 60
Timefree Talk
Pay As You Go
Pupils who finish early could try the extension activity on page 35. Use focusedgroup work with pupils who need extra support in creating graphs. Use 8.4T4cMobyphone 2 answers.xls as a guide for pupils requiring support.
Towards the end of the activity, gather the class together and discuss theeffectiveness of the use of random numbers in testing their model.
Show 8.4T4c Mobyphone 2 answers.xls on the large screen as a prompt. Point outthat the scale on the x-axis has been fixed to allow easier comparisons to be made.Check how many pupils did this on their own models. Tell pupils that using arandom number generator provides one way of testing the model but that in reallife each user is generally consistent in the way they use the phone. Tell pupils thatthey are now going to look at a different way of modelling mobile phone tariffs.
3 Exploring an online model
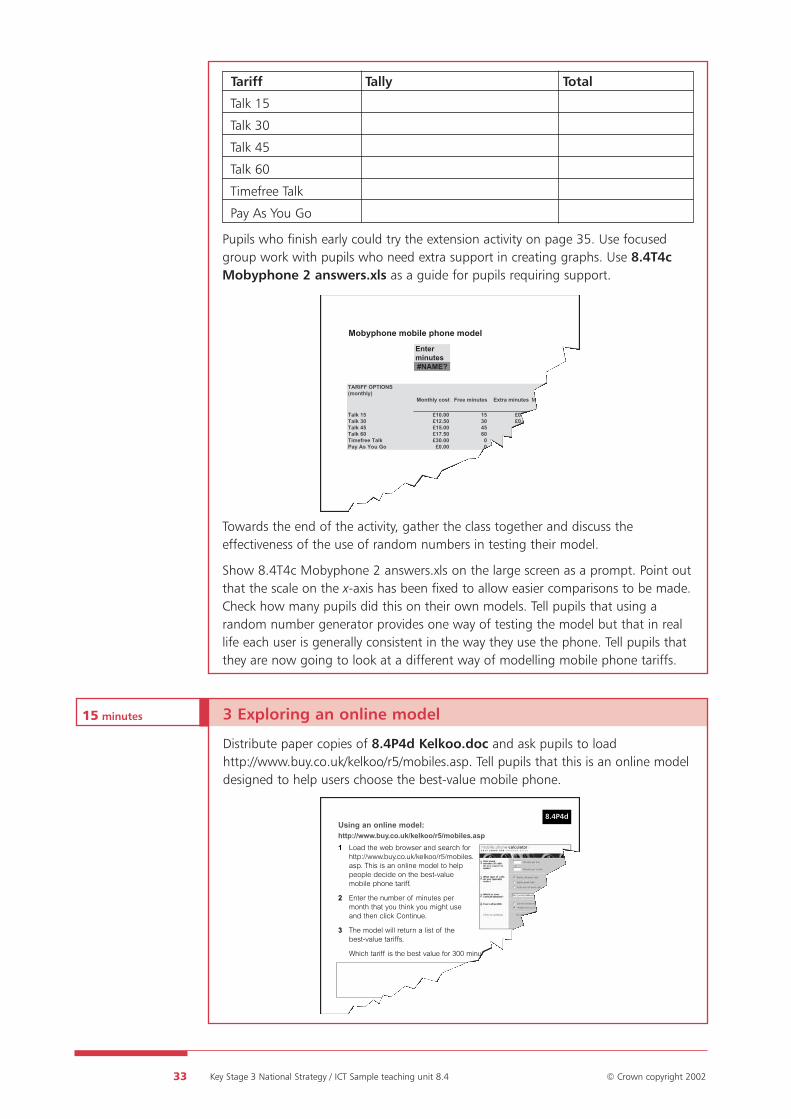
Distribute paper copies of 8.4P4d Kelkoo.doc and ask pupils to loadhttp://www.buy.co.uk/kelkoo/r5/mobiles.asp. Tell pupils that this is an online modeldesigned to help users choose the best-value mobile phone.
Mobyphone mobile phone model
Enterminutes#NAME?
TARIFF OPTIONS(monthly)
Monthly cost Free minutes Extra minutes Mi
Talk 15 £10.00 15 £0.06 #NAME? #NTalk 30 £12.50 30 £0.05 #NAME? #NTalk 45 £15.00 45 £0.04 #NAME? #NTalk 60 £17.50 60 £0.03 #NAME? #NTimefree Talk £30.00 0 £0.00 #NAME? #NPay As You Go £0.00 0 £0.08 #NAME? #N
Using an online model:http://www.buy.co.uk/kelkoo/r5/mobiles.asp
1 Load the web browser and search forhttp://www.buy.co.uk/kelkoo/r5/mobiles.asp. This is an online model to help people decide on the best-value mobile phone tariff.
2 Enter the number of minutes per month that you think you might use and then click Continue.
3 The model will return a list of the best-value tariffs.
Which tariff is the best value for 300 minutes?
8.4P4d
4 Plenary: Reviewing the mobile phone model
Ask pupils to think about the differences between the two models. Allow time forreflection before gathering responses, which may include these points.
• Kelkoo is online instead of a spreadsheet – does this make it easier to use?
• Kelkoo uses a user profile instead of a set number of minutes.
• The Kelkoo model uses more variables (peak, off-peak, local, long distance,premium, other mobile networks).
• Kelkoo does not have a limit to the number of minutes used.
• Kelkoo includes additional features, for example, text mail, WAP.
Extend the discussion to the whole class and ask them to evaluate their ownmodel by asking pupils which features they would like to explore, and why.
34 Key Stage 3 National Strategy / ICT Sample teaching unit 8.4 © Crown copyright 2002
10 minutesUnit
Ask pupils to work in pairs to investigate the model and to work out how thevariables they input affect the suggested tariff. Say that, in the plenary, you will beasking them for advice to help you choose a mobile phone. They should thinkabout how this model differs from their own. They should think about thesequestions.
• What extra variables does it use?
• How accurate is their user profile?
Differentiation
Pupils who need extra support should accept the profile of usage provided so thatthey are only using the first screen with its limited range of variables.
Homework
Tell pupils that they have explored ways of using spreadsheets to create modelsbut there are many other methods of using ICT to create models. Say that in thenext lesson they will explore other types of model and simulation. Quickly gathersome responses from pupils about models and simulations they may have used.Responses may include:
• computer games and simulations;
• models in other subjects, such as design and technology or geography;
• models used in control, such as Flowol;
• CGI animation in TV and cinema films, such as Shrek.
Ask pupils to write down the word ‘simulation’ (the key word to be used in lesson5) and then to summarise, in note form, what they understand that it means. Theyshould illustrate their description with a few examples from their work in othersubjects.
35 Key Stage 3 National Strategy / ICT Sample teaching unit 8.4 © Crown copyright 2002
Extension activity
Additional guidanceIn this activity selected pupils extend their mobile phone model further byincorporating additional variables.
Lead a discussion with the pupils about the variables they should add to the modelto make it more realistic. Draw out responses such as:
• the cost of buying or renting the handset;
• different tariffs, for example, peak, off-peak, local, long distance, premium,other mobile networks;
• variable use, for example during the summer holidays, at Christmas;
• different range of minutes used;
• additional features, for example text mail, WAP.
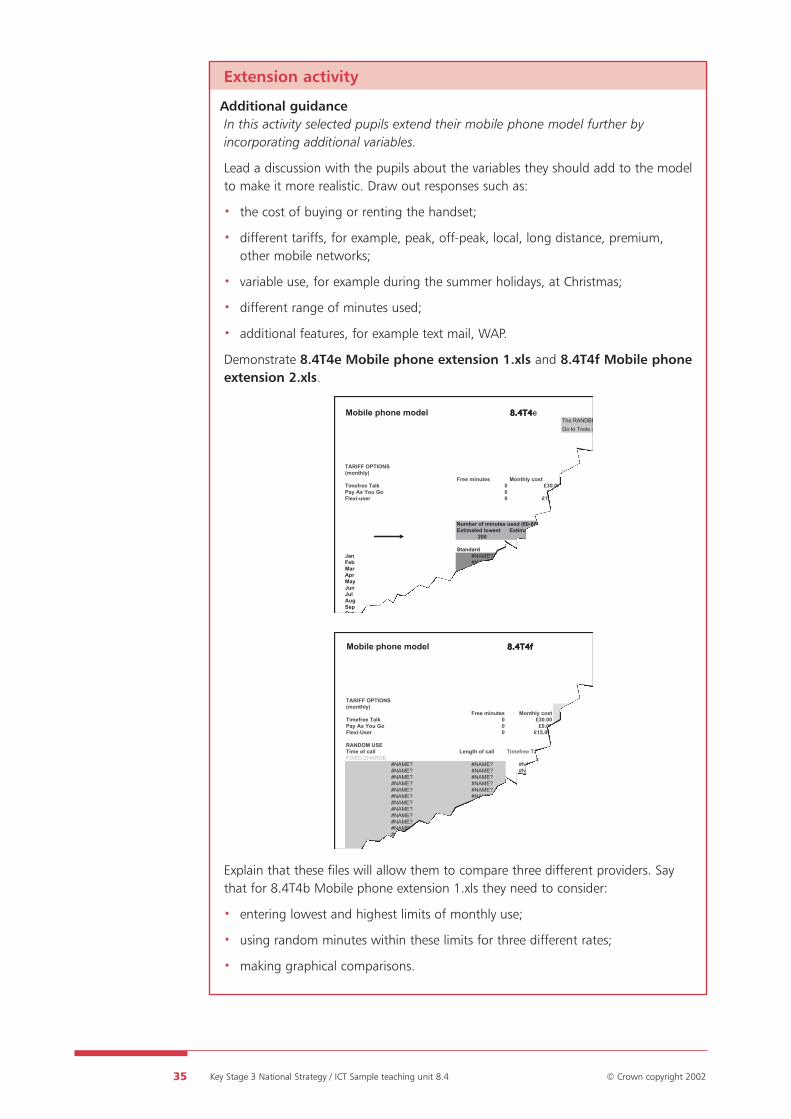
Demonstrate 8.4T4e Mobile phone extension 1.xls and 8.4T4f Mobile phoneextension 2.xls.
Explain that these files will allow them to compare three different providers. Saythat for 8.4T4b Mobile phone extension 1.xls they need to consider:
• entering lowest and highest limits of monthly use;
• using random minutes within these limits for three different rates;
• making graphical comparisons.
Mobile phone model 88.4.4T4T4e The RANDBE
Go to Tools -
TARIFF OPTIONS(monthly)
Free minutes Monthly cost StandardTimefree Talk 0 £30.00 £0Pay As You Go 0 £0.00 £0Flexi-user 0 £15.00 0
Number of minutes used (60-600)
Estimated lowest Estimated highest 200 500
Standard Off Peak PremiumJan #NAME? #NAME? #NAME?Feb #NAME? #NAME? #NAME?Mar #NAME? #NAME? #NAME?Apr #NAME? #NAME? #NAME?May #NAME? #NAME? #NAME?Jun #NAME? #NAME? #NAME?Jul #NAME? #NAME? #NAME?Aug #NAME? #NAME? #NAME?Sep #NAME? #NAME? #NAME?Oct #NAME? #NAME? #NAME?
Mobile phone model 8.4T4f8.4T4f
TARIFF OPTIONS(monthly) Tariff
Free minutes Monthly cost StandarTimefree Talk 0 £30.00 £0.0Pay As You Go 0 £0.00 £0.0Flexi-User 0 £15.00 0.0
RANDOM USETime of call Length of call Timefree Talk Pay As You GoFIXED CHARGE £30.00 £0.0
#NAME? #NAME? #NAME? #NAME?#NAME? #NAME? #NAME? #NAME?#NAME? #NAME? #NAME? #NAME?#NAME? #NAME? #NAME? #NAME?#NAME? #NAME? #NAME? #NAME?#NAME? #NAME? #NAME? #NAME?#NAME? #NAME? #NAME? #NAME?#NAME? #NAME? #NAME? #NAME?#NAME? #NAME? #NAME? #NAME?#NAME? #NAME? #NAME? #NAME?#NAME? #NAME? #NAME? #NAME?#NAME? #NAME? #NAME? #NAME?#NAME? #NAME? #NAME? #NAME?#NAME? #NAME? #NAME? #NAME?
Ask pupils to explore the effects of:
• using their own estimates of amount of use, or information from a survey orfrom published sources;
• hanging the balance between standard, off-peak and premium calls;
• different amounts of use in different months.
Tell pupils that for 8.4T4b Mobile phone extension 2.xls they need to consider:
• random calls at different times, for example weekday and evening;
• using IF statements to analyse data.
Ask pupils to explore how to:
• make all tariffs equally attractive or marketable;
• include random receipt of text messages at a given cost.
Show the Kelkoo website at http://www.buy.co.uk/kelkoo/r5/mobiles.asp again.
Remind pupils of 8.4P4c Kelkoo profile.doc and say that this site also includesuseful information about cost comparisons, together with an ‘industry standard’profile of a ‘normal’ user based on research. Ask pupils to use these and otherideas to develop their model and to present their findings in a report.
36 Key Stage 3 National Strategy / ICT Sample teaching unit 8.4 © Crown copyright 2002
5Simulations and models
ICT Framework objectives
DEVELOPING IDEAS AND MAKING THINGS HAPPEN
Models and modelling• Develop ICT-based models and test predictions by changing variables and rules.
• Draw and explain conclusions.
Key vocabulary
From Year 6: simulation
Preparation and planning• Ensure that you have access to the Internet and that the suggested links are still
active.
• Ensure that you have the software, for example Shockwave, to support thewebsites chosen.
• Look at the list of suggested websites and decide if you will use some or all ofthose listed, or choose alternatives.
• Ensure that you are familiar with the pupil and teacher resources for the lesson.
• If necessary, adapt the resources to suit your particular software.
• Adapt 8.4P5c Investigations 2.doc (the trainline.com activity) so that it matcheslocal stations and so that dates are relevant. Users of this website need to registerin advance.
• Ensure that 8.4P5d Weblinks and programs.doc is available in the shared area.
• Print out copies of 8.4P5b Investigations 1.doc and 8.4P5c Investigations 2.doc forall pupils.
• If necessary, prepare guidance for the pupils to support the software being used,either as a handout or available on the school’s intranet.
• Display the teaching objectives, phrased so that all pupils will understand them.
• Add new vocabulary to the wall display.
Resources• Large computer screen display
• Enough computers for pupils to work in pairs or small groups
• Spreadsheet software
• Shared network area, or alternative way to pass spreadsheet data to pupils
• Whiteboard or flipchart
37 Key Stage 3 National Strategy / ICT Sample teaching unit 8.4 © Crown copyright 2002
Lesson
• Access to these websites:
– modelling weather forecastshttp://www.metoffice.com/weather/charts/animation.html
– modelling ocean wave swellhttp://www.metoffice.com/research/ocean/operational/wave/swellanim.html
– best value comparison http://uk.kelkoo.com/
– http://www.flightline.co.uk/villas/villas.asp
– http://www.thetrainline.com/
• The following activities, reviewed and downloaded ready for use:
– http://familygames.com/free/vendld.html
– http://familygames.com/free/jumble.html
– http://www.geocities.com/helmi79/gravity/jgrav.zip
• Resource files:
– 8.4P1c School fete.xls
– 8.4T5a Starter.ppt
– 8.4P5b Investigations 1.doc
– 8.4P5c Investigations 2.doc
– 8.4P5d Weblinks and programs.doc
Lesson outline 60 minutes
1 Starter: Defining simulations Defining a simulation 10 minutesand models and reviewing homework
Whole class
2 Explaining the objectives Explanation 5 minutesand setting the task Whole class
3 Demonstrating the task Demonstration of 10 minutessimulations and modelsWhole class
4 Investigating simulations Exploring simulations and 25 minutesand models models on the Internet
Paired work
5 Plenary: Reviewing the unit Discussion 10 minutesand the key vocabulary Whole class
Homework Individual work
38 Key Stage 3 National Strategy / ICT Sample teaching unit 8.4 © Crown copyright 2002
1 Starter: Defining simulations and models
Before the start of the lesson, display 8.4T5a Starter.ppt on the large screen.
Tell pupils to have their homework to hand. Invite three or four pupils to give examples of models or simulations that they have brought from their homework task.
• Gather and record some other responses from pupils and tell them that you willreturn to this at the end of the lesson.
• Ensure that by the end of this activity you have agreed a definition of the word‘simulation’: in ICT simulations are used to predict likely behaviour in real-lifesituations.
2 Explaining the objectives and setting the task
Tell pupils that in this lesson they will be exploring and investigating a range ofsimulations and models. They will look at some models and simulations and makepredictions about what will happen if they change any of the variables. They willalso be looking at some models to help them plan journeys or holidays and makeconclusions about:
• the most affordable holiday;
or
• the cheapest and most efficient way to make a train journey.
3 Demonstrating the task
Use one of the downloaded simulations from:
• http://familygames.com/free/jumble.html;
• http://familygames.com/free/vendld.html;
• http://www.geocities.com/helmi79/gravity/jgrav.zip.
Demonstrate the game as an example of a simulation. Explain that it is a simulationbecause it uses variables to change the outcome. You will need to have selectedone or two variables from the simulation in order to demonstrate what choices can
39 Key Stage 3 National Strategy / ICT Sample teaching unit 8.4 © Crown copyright 2002
10 minutesUnit
5 minutesUnit
10 minutesUnit
Activities
40 Key Stage 3 National Strategy / ICT Sample teaching unit 8.4 © Crown copyright 2002
25 minutesUnit
be made and how they affect the game. Explain that simulations often usegraphics to create a lifelike world that we can manipulate.
Remind pupils that they have spent a few weeks looking at using computers tomodel real-life situations. Briefly show 8.4P1c School fete.xls again and remindpupils that, when they looked at spreadsheets, they modelled different numbers ofpeople coming to the school fete, to see how the income would be affected.
4 Investigating simulations and models
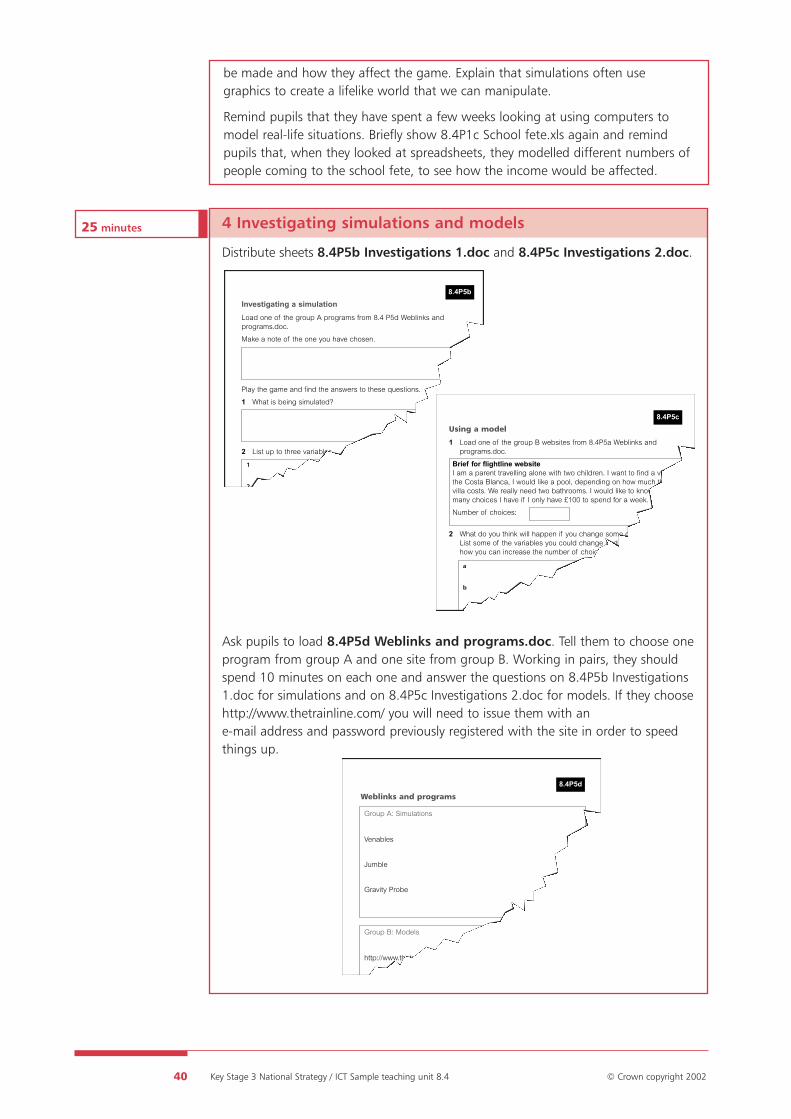
Distribute sheets 8.4P5b Investigations 1.doc and 8.4P5c Investigations 2.doc.
Ask pupils to load 8.4P5d Weblinks and programs.doc. Tell them to choose oneprogram from group A and one site from group B. Working in pairs, they shouldspend 10 minutes on each one and answer the questions on 8.4P5b Investigations1.doc for simulations and on 8.4P5c Investigations 2.doc for models. If they choosehttp://www.thetrainline.com/ you will need to issue them with an e-mail address and password previously registered with the site in order to speedthings up.
Investigating a simulation
Load one of the group A programs from 8.4 P5d Weblinks andprograms.doc.
Make a note of the one you have chosen.
Play the game and find the answers to these questions.
1 What is being simulated?
2 List up to three variables.
1
2
8.4P5b
Using a model
1 Load one of the group B websites from 8.4P5a Weblinks andprograms.doc.
Brief for flightline websiteI am a parent travelling alone with two children. I want to find a villa inthe Costa Blanca, I would like a pool, depending on how much thevilla costs. We really need two bathrooms. I would like to know howmany choices I have if I only have £100 to spend for a week.
Number of choices:
2 What do you think will happen if you change some of the variables?List some of the variables you could change and try them to seehow you can increase the number of choices.
8.4P5c
a
b
c
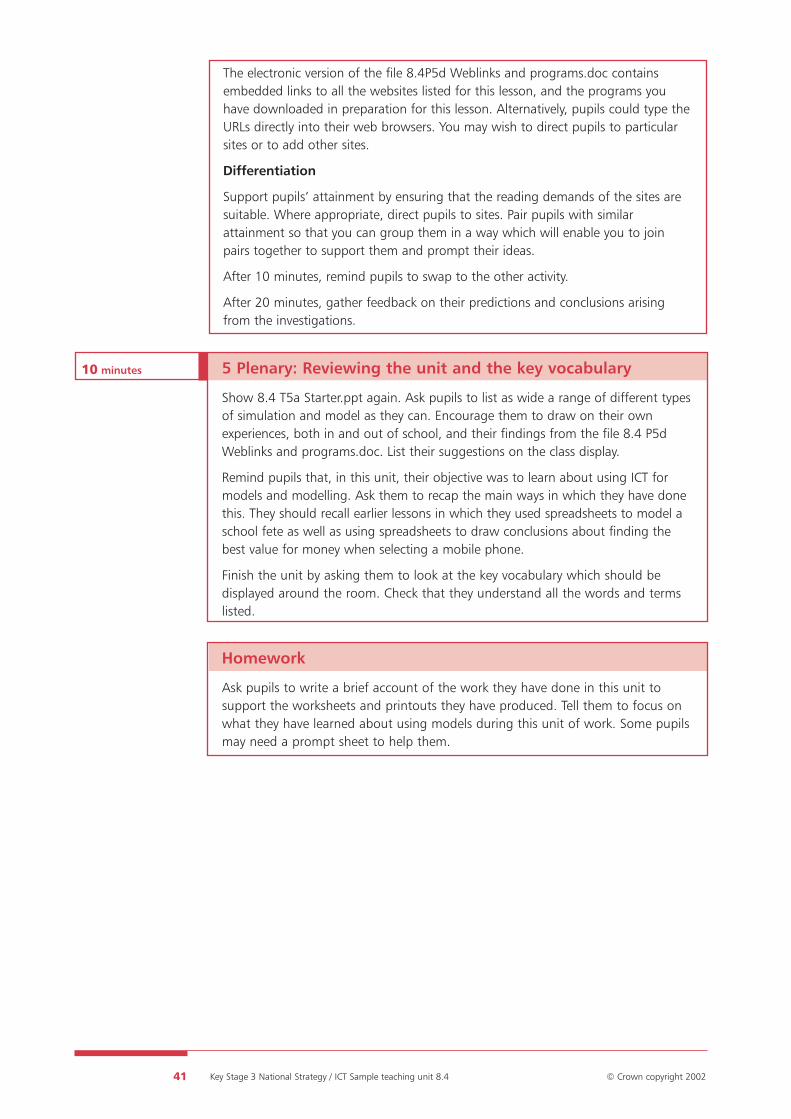
Weblinks and programs
Group A: Simulations
Venables
Jumble
Gravity Probe
Group B: Models
http://www.thetrainline.com/
8.4P5d
The electronic version of the file 8.4P5d Weblinks and programs.doc containsembedded links to all the websites listed for this lesson, and the programs youhave downloaded in preparation for this lesson. Alternatively, pupils could type theURLs directly into their web browsers. You may wish to direct pupils to particularsites or to add other sites.
Differentiation
Support pupils’ attainment by ensuring that the reading demands of the sites aresuitable. Where appropriate, direct pupils to sites. Pair pupils with similarattainment so that you can group them in a way which will enable you to joinpairs together to support them and prompt their ideas.
After 10 minutes, remind pupils to swap to the other activity.
After 20 minutes, gather feedback on their predictions and conclusions arisingfrom the investigations.
41 Key Stage 3 National Strategy / ICT Sample teaching unit 8.4 © Crown copyright 2002
5 Plenary: Reviewing the unit and the key vocabulary
Show 8.4 T5a Starter.ppt again. Ask pupils to list as wide a range of different typesof simulation and model as they can. Encourage them to draw on their ownexperiences, both in and out of school, and their findings from the file 8.4 P5dWeblinks and programs.doc. List their suggestions on the class display.
Remind pupils that, in this unit, their objective was to learn about using ICT formodels and modelling. Ask them to recap the main ways in which they have donethis. They should recall earlier lessons in which they used spreadsheets to model aschool fete as well as using spreadsheets to draw conclusions about finding thebest value for money when selecting a mobile phone.
Finish the unit by asking them to look at the key vocabulary which should bedisplayed around the room. Check that they understand all the words and termslisted.
10 minutesUnit
Homework
Ask pupils to write a brief account of the work they have done in this unit tosupport the worksheets and printouts they have produced. Tell them to focus onwhat they have learned about using models during this unit of work. Some pupilsmay need a prompt sheet to help them.

Activity 1
1 Look at the screen shot of a financial model of a zoo and answerthese questions.
a How much does it cost to feed the lions?
b How much is spent in total each week?
c Is the zoo overspending or underspending?
2 This model is created with a spreadsheet. Label these parts of aspreadsheet on the screenshot above.
cell, column, row, label, numeric data, print button, save button,Chart Wizard button, Sort button
3 Are spreadsheets always the best tools? Look at the chart belowand tick the boxes for each activity.
Spreadsheets are the True False Not sure best tool to help:
Draw pictures
Store numeric data
Draw charts and graphs
Present information
Write reports
Make calculations
42 Key Stage 3 National Strategy / ICT Sample teaching unit 8.4 © Crown copyright 2002
8.4P1b

School fete worksheet
BackgroundThe file 8.4P1c School fete.xls is a financial model. It models theamount of money which the PTA may make at the annual school fete.It includes possible ways of making money (income) at the fete, suchas selling teas and cakes. It also shows the costs (expenditure) ofrunning the fete. The model calculates the profit or loss being madewhen specified numbers of people visit the fete. The modelcalculates the total profit/loss by using this formula.
profit or loss = income – expenditure
The amount of money taken, and any overall profit, will depend on thenumber of people coming to the fete and spending money. The morepeople that come, the more profit will be made.
1 Which cell calculates the total income?
2 Which cell calculates the total expenditure?
3 Which cell calculates the profit/loss?
4 What is the formula in this cell?
5 In your own words, explain what the formula in the cell is doing tocalculate the profit or loss.
6 If 400 people attend the fete, the model calculates a profit of £3527.What if 100 or 200 or 300 – or any other number of people – attend?Complete the table below.
43 Key Stage 3 National Strategy / ICT Sample teaching unit 8.4 © Crown copyright 2002
Estimated number Projected of people profit or loss
100
200
300
400 £3527
8.4P1d
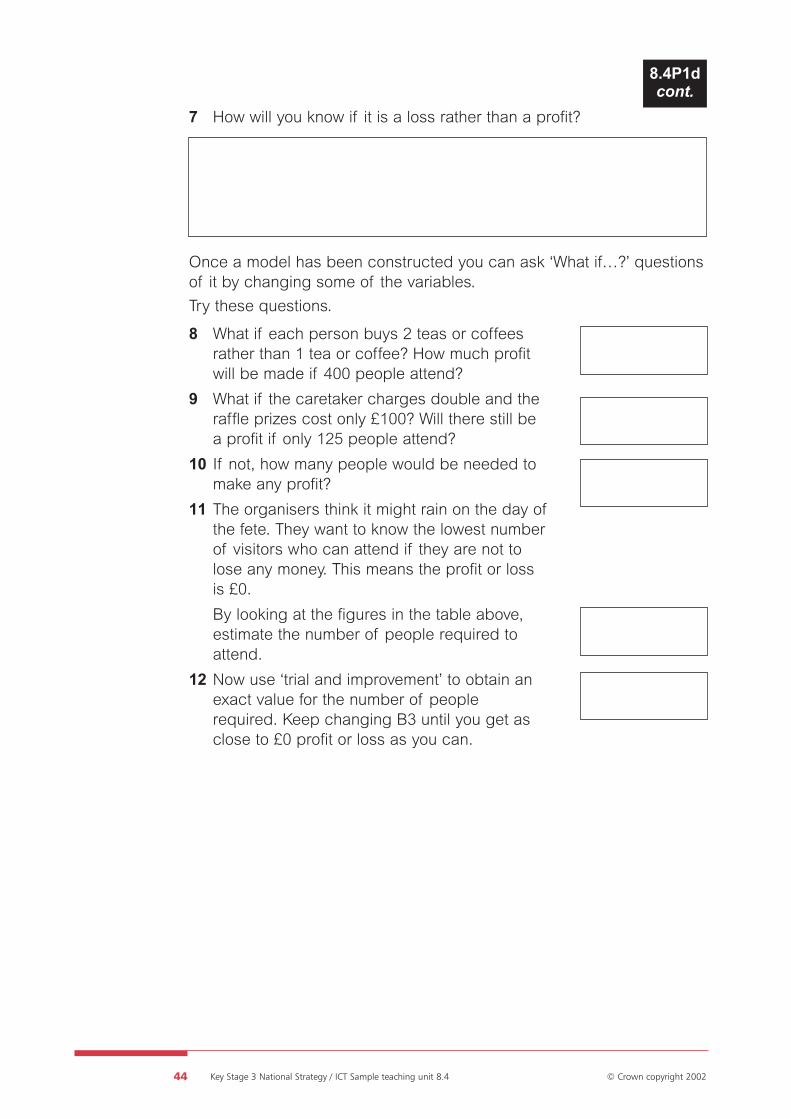
7 How will you know if it is a loss rather than a profit?
Once a model has been constructed you can ask ‘What if…?’ questionsof it by changing some of the variables.
Try these questions.
8 What if each person buys 2 teas or coffeesrather than 1 tea or coffee? How much profitwill be made if 400 people attend?
9 What if the caretaker charges double and theraffle prizes cost only £100? Will there still bea profit if only 125 people attend?
10 If not, how many people would be needed tomake any profit?
11 The organisers think it might rain on the day ofthe fete. They want to know the lowest numberof visitors who can attend if they are not tolose any money. This means the profit or lossis £0.
By looking at the figures in the table above,estimate the number of people required toattend.
12 Now use ‘trial and improvement’ to obtain anexact value for the number of peoplerequired. Keep changing B3 until you get asclose to £0 profit or loss as you can.
44 Key Stage 3 National Strategy / ICT Sample teaching unit 8.4 © Crown copyright 2002
8.4P1dcont.
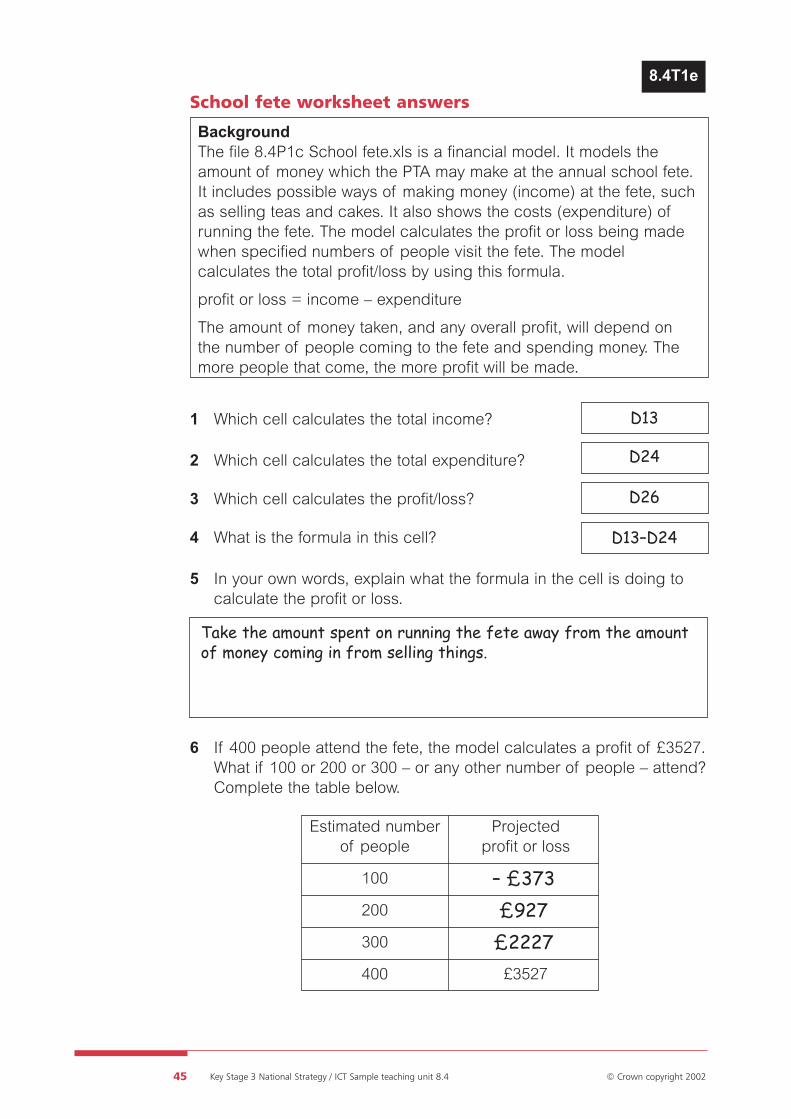
School fete worksheet answers
BackgroundThe file 8.4P1c School fete.xls is a financial model. It models theamount of money which the PTA may make at the annual school fete.It includes possible ways of making money (income) at the fete, suchas selling teas and cakes. It also shows the costs (expenditure) ofrunning the fete. The model calculates the profit or loss being madewhen specified numbers of people visit the fete. The modelcalculates the total profit/loss by using this formula.
profit or loss = income – expenditure
The amount of money taken, and any overall profit, will depend onthe number of people coming to the fete and spending money. Themore people that come, the more profit will be made.
1 Which cell calculates the total income?
2 Which cell calculates the total expenditure?
3 Which cell calculates the profit/loss?
4 What is the formula in this cell?
5 In your own words, explain what the formula in the cell is doing tocalculate the profit or loss.
6 If 400 people attend the fete, the model calculates a profit of £3527.What if 100 or 200 or 300 – or any other number of people – attend?Complete the table below.
45 Key Stage 3 National Strategy / ICT Sample teaching unit 8.4 © Crown copyright 2002
8.4T1e
Estimated number Projected of people profit or loss
100
200
300
400 £3527
D13
D24
D26
D13–D24
Take the amount spent on running the fete away from the amountof money coming in from selling things.
– £373£927
£2227
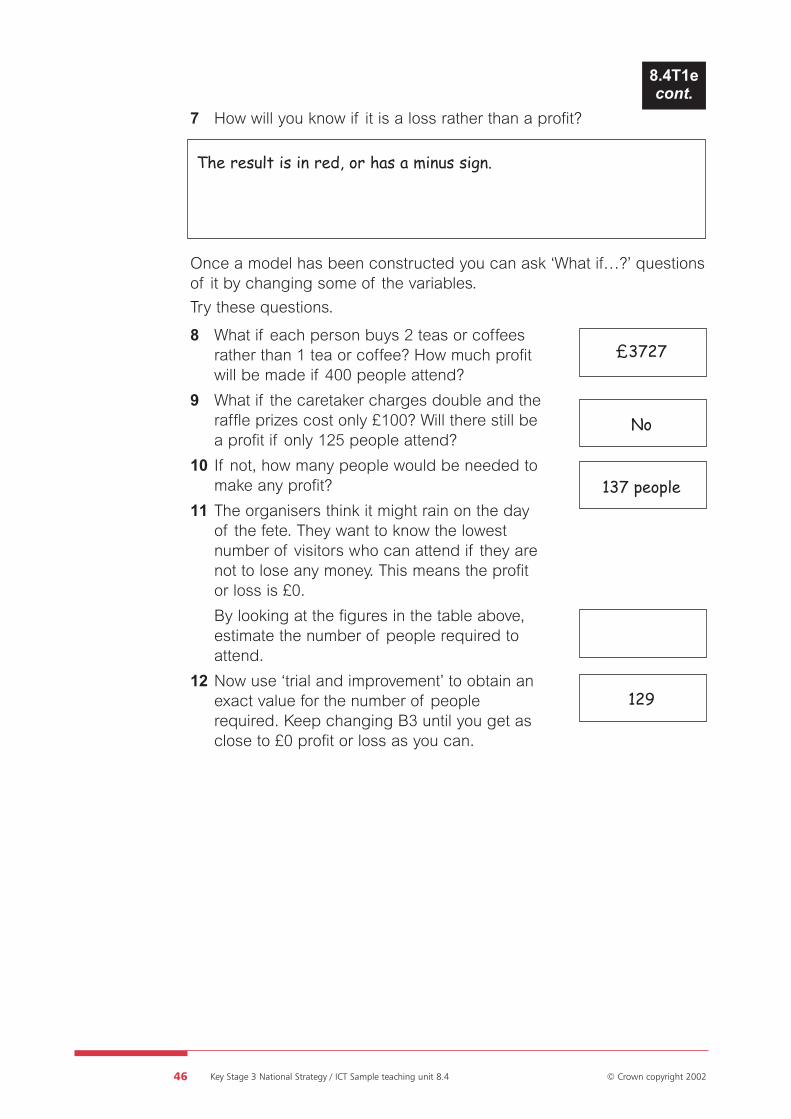
7 How will you know if it is a loss rather than a profit?
Once a model has been constructed you can ask ‘What if…?’ questionsof it by changing some of the variables.
Try these questions.
8 What if each person buys 2 teas or coffeesrather than 1 tea or coffee? How much profitwill be made if 400 people attend?
9 What if the caretaker charges double and theraffle prizes cost only £100? Will there still bea profit if only 125 people attend?
10 If not, how many people would be needed tomake any profit?
11 The organisers think it might rain on the dayof the fete. They want to know the lowestnumber of visitors who can attend if they arenot to lose any money. This means the profitor loss is £0.
By looking at the figures in the table above,estimate the number of people required toattend.
12 Now use ‘trial and improvement’ to obtain anexact value for the number of peoplerequired. Keep changing B3 until you get asclose to £0 profit or loss as you can.
46 Key Stage 3 National Strategy / ICT Sample teaching unit 8.4 © Crown copyright 2002
8.4T1econt.
The result is in red, or has a minus sign.
£3727
No
137 people
129
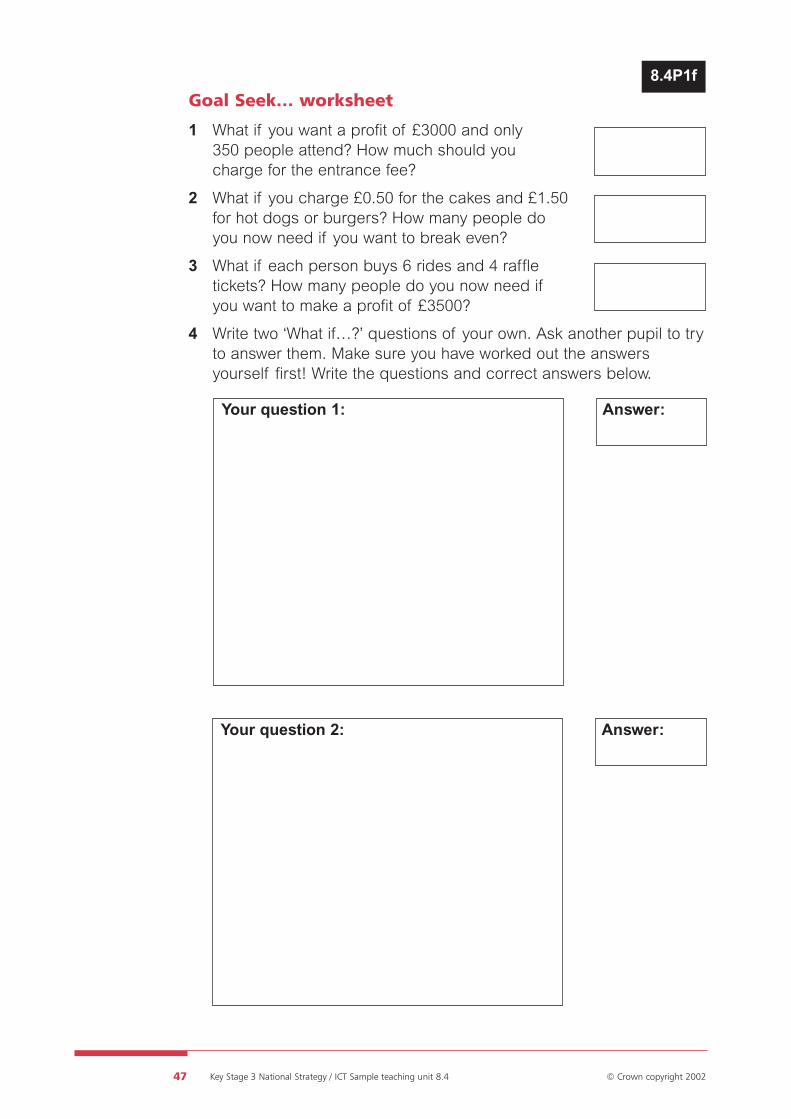
Goal Seek… worksheet
1 What if you want a profit of £3000 and only 350 people attend? How much should you charge for the entrance fee?
2 What if you charge £0.50 for the cakes and £1.50 for hot dogs or burgers? How many people do you now need if you want to break even?
3 What if each person buys 6 rides and 4 raffle tickets? How many people do you now need ifyou want to make a profit of £3500?
4 Write two ‘What if…?’ questions of your own. Ask another pupil to tryto answer them. Make sure you have worked out the answersyourself first! Write the questions and correct answers below.
47 Key Stage 3 National Strategy / ICT Sample teaching unit 8.4 © Crown copyright 2002
Your question 1: Answer:
Your question 2: Answer:
8.4P1f

Goal Seek… help sheet
This sheet is designed for teacher demonstration.It can be adapted to suit local needs.
1 Load the school fete file 8.4T1g goal seek helpsheet 1.xls. As anexample, say you want to find the number of people required tomake a profit of £5000.The profit formula is held in cell D29.
2 Select the Goal Seek… option.
3 Now enter the relevant details into the Goal Seek… dialogue box asshown below.
4 Click on OK.
48 Key Stage 3 National Strategy / ICT Sample teaching unit 8.4 © Crown copyright 2002
8.4T1g
Select the GoalSeek option fromthe Tools menu ofthe spreadsheet
Enter the value youwish to get to (the‘target value’). 5000
Enter the cell you wishto change to get thedesired ‘target value’. B3
Enter the cellreference wherethe formula isheld. D29
A Goal Seek…dialogue boxappears
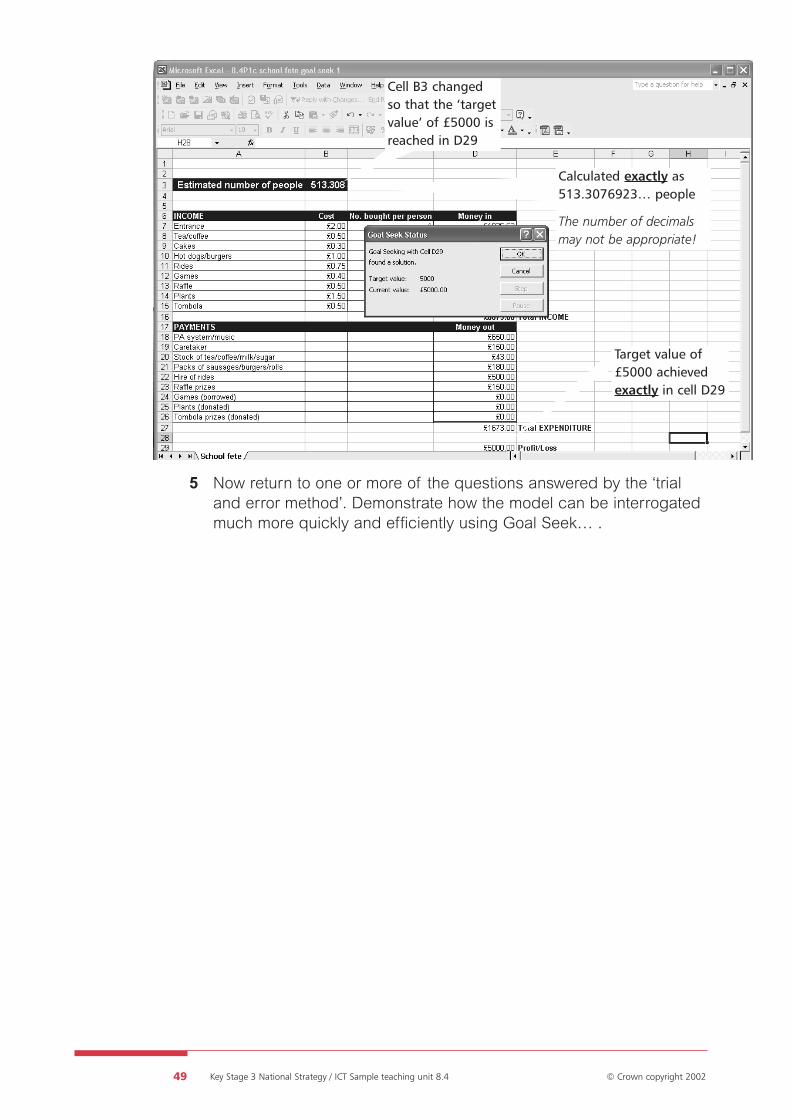
5 Now return to one or more of the questions answered by the ‘trialand error method’. Demonstrate how the model can be interrogatedmuch more quickly and efficiently using Goal Seek… .
49 Key Stage 3 National Strategy / ICT Sample teaching unit 8.4 © Crown copyright 2002
Cell B3 changedso that the ‘targetvalue’ of £5000 isreached in D29
Calculated exactly as513.3076923… people
The number of decimalsmay not be appropriate!
Target value of£5000 achievedexactly in cell D29

Mobile phone worksheet
BackgroundThe spreadsheet shows the start of a mobile phone model that youare going to develop. The estimated number of minutes used permonth can be entered in cell B5 as shown.
1 Ensure you have the Mobyphone basic model file loaded (as shown).
2 Change the number of minutes in B5. What happens to the valuesin column F under the ‘minutes used’ heading? Why does thishappen?
3 What do cells E11–E16 contain?
4 You need to create a formula in G11 that calculates the cost of extraminutes used for the Talk 15 tariff. Work out what the formula needsto calculate. Write it in words and then as a spreadsheet formula.
50 Key Stage 3 National Strategy / ICT Sample teaching unit 8.4 © Crown copyright 2002
8.4P2c
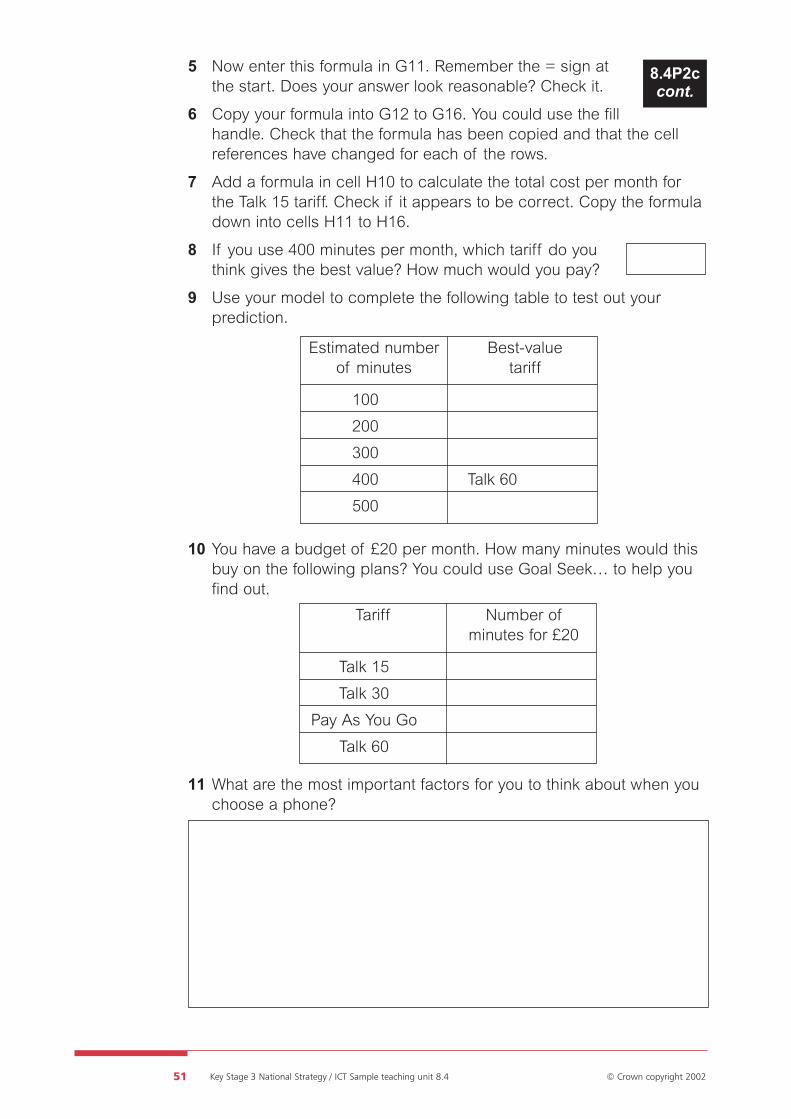
5 Now enter this formula in G11. Remember the = sign at the start. Does your answer look reasonable? Check it.
6 Copy your formula into G12 to G16. You could use the fillhandle. Check that the formula has been copied and that the cellreferences have changed for each of the rows.
7 Add a formula in cell H10 to calculate the total cost per month forthe Talk 15 tariff. Check if it appears to be correct. Copy the formuladown into cells H11 to H16.
8 If you use 400 minutes per month, which tariff do you think gives the best value? How much would you pay?
9 Use your model to complete the following table to test out yourprediction.
10 You have a budget of £20 per month. How many minutes would thisbuy on the following plans? You could use Goal Seek… to help youfind out.
11 What are the most important factors for you to think about when youchoose a phone?
51 Key Stage 3 National Strategy / ICT Sample teaching unit 8.4 © Crown copyright 2002
Estimated number Best-value of minutes tariff
100
200
300
400 Talk 60
500
Tariff Number ofminutes for £20
Talk 15
Talk 30
Pay As You Go
Talk 60
8.4P2ccont.
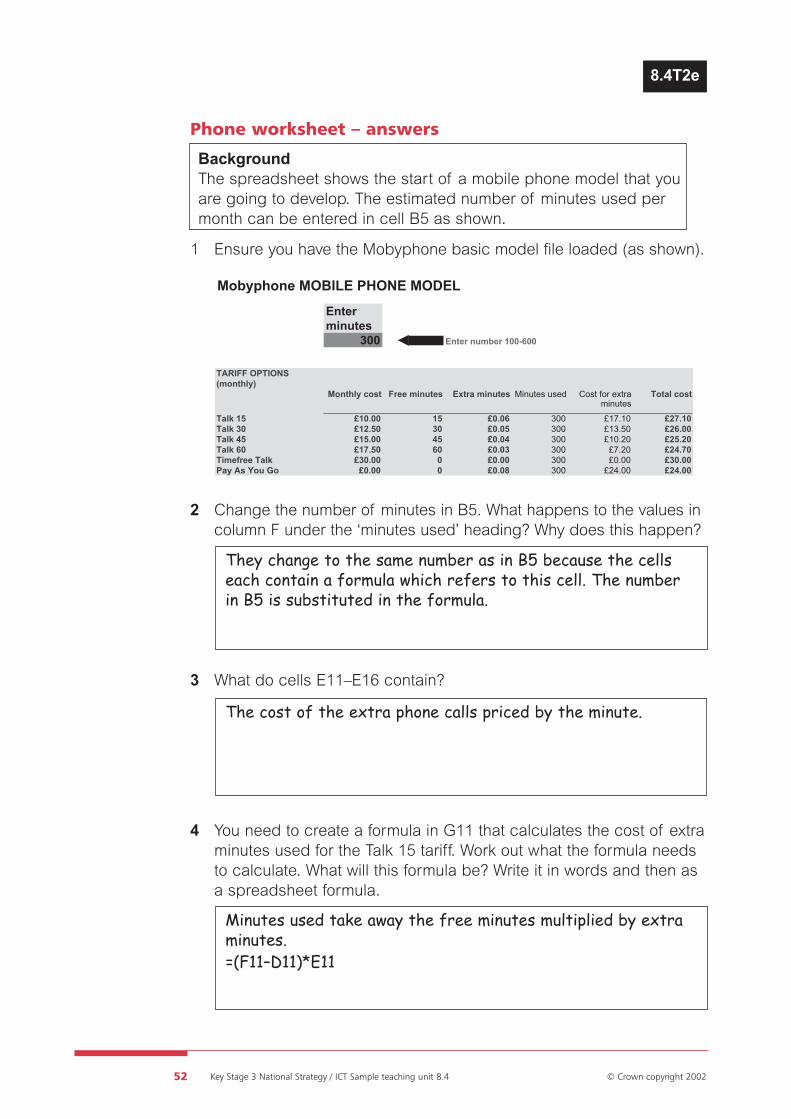
Phone worksheet – answers
BackgroundThe spreadsheet shows the start of a mobile phone model that youare going to develop. The estimated number of minutes used permonth can be entered in cell B5 as shown.
1 Ensure you have the Mobyphone basic model file loaded (as shown).
2 Change the number of minutes in B5. What happens to the values incolumn F under the ‘minutes used’ heading? Why does this happen?
3 What do cells E11–E16 contain?
4 You need to create a formula in G11 that calculates the cost of extraminutes used for the Talk 15 tariff. Work out what the formula needsto calculate. What will this formula be? Write it in words and then asa spreadsheet formula.
52 Key Stage 3 National Strategy / ICT Sample teaching unit 8.4 © Crown copyright 2002
They change to the same number as in B5 because the cellseach contain a formula which refers to this cell. The numberin B5 is substituted in the formula.
The cost of the extra phone calls priced by the minute.
Minutes used take away the free minutes multiplied by extraminutes.=(F11–D11)*E11
8.4T2e

5 Now enter this formula in G11. Remember the = sign at the start. Does your answer look reasonable? Check it.
6 Copy your formula into G12 to G16. You could use the fill handle. Check that the formula has been copied and that the cellreferences have changed for each of the rows.
7 Add a formula in cell H10 to calculate the total cost per month forthe Talk 15 tariff. Check if it appears to be correct. Copythe formula into the other cells H11 to H16.
8 If you use 400 minutes per month, which tariff do you thinkgives the best value? How much would you pay?
9 Use your model to complete the following table to test out yourprediction.
10 You have a budget of £20 per month. How many minutes would thisbuy on the following plans? You could use Goal Seek… to help youfind out.
11 What are the most important factors for you to think about when youchoose a phone?
53 Key Stage 3 National Strategy / ICT Sample teaching unit 8.4 © Crown copyright 2002
Decide how often you use your phone. Decide if you want to paymore for ‘free’ calls or to pay a lower monthly charge. Do youwant to enter into a tariff contract or pay as you go? To beable to use the model to find the best tariff you will need toestimate the number of minutes you might use in a month.
Talk 60£27.70
Estimated number Best-value of minutes tariff
100 Pay as You Go200 Pay as You Go300 Pay as You Go400 Talk 60500 Timefree Talk
Tariff Number ofminutes for £20
Talk 15 182Talk 30 180
Pay As You Go 250Talk 60 143
8.4T2econt.

Mobile phone worksheet 2
BackgroundThe questions and tasks below focus on how the model can beextended by using absolute cell references.
Load the file 8.4P3c Mobyphone 2 extended model.xls.
1 The model has been reorganised slightly so that you can investigateother ways of analysing the data. What formula do you need tocreate in F11? Try not to use 100 in the formula but make F10 anabsolute cell reference.
You can click on the red dots in cells F11 and G11 to check you areon the right track.
2 Enter similar formulae for G11, H11, I11, J11 and K11. Copy eachformula down through the columns. Check that the absolute cellreferences have been copied correctly.
54 Key Stage 3 National Strategy / ICT Sample teaching unit 8.4 © Crown copyright 2002
8.4P3d

3 Create a line graph that shows all of the tariffs at once foreasy comparison. Here are some tips to help you.
• Select B10–B16 then F10–K16 so that minute headings areincluded.
• Select a suitable Chart Type for line graph – suggest first one.(Chart Wizard Step 1)
• Select rows rather than columns in Chart Source Data for correctdata. (Chart Wizard Step 2)
• Remove the gridlines for easier viewing – Chart Options –Gridlines tab. (Chart Wizard Step 3)
• Add a suitable title and label the axes – Chart Options – Titles tab.(Chart Wizard Step 3)
4 Print out the chart and use it to answer these questions.
a Which tariff offers the best value for money ifyou use 200 minutes’ worth of calls per month?
b Which tariff offers the best value for money ifyou use 450 minutes’ worth of calls per month?
c What is the best value if you can spend £30.00 per month?
d What is the best value if you can spend £25.00 per month?
5 There are certain points on the graph where it is difficult to seeclearly. For example, look closely at the area around 200–300minutes. Change the values in row 10 to 200, 220, 240, 260, 280,and 300 to graph this area more clearly. Now redraw the graph.You will need to rescale the y-axis. To do this:
• double-click anywhere on the y-axis of the graph;
• select the scale tab and change the minimum value from 0 to 20.
What does the graph tell you now?
What is the best value if you can afford £24.00 per month?
6 Use your model to explore other areas in detail, for example, if youuse between 300 and 400 minutes each month.
55 Key Stage 3 National Strategy / ICT Sample teaching unit 8.4 © Crown copyright 2002
8.4P3dcont.
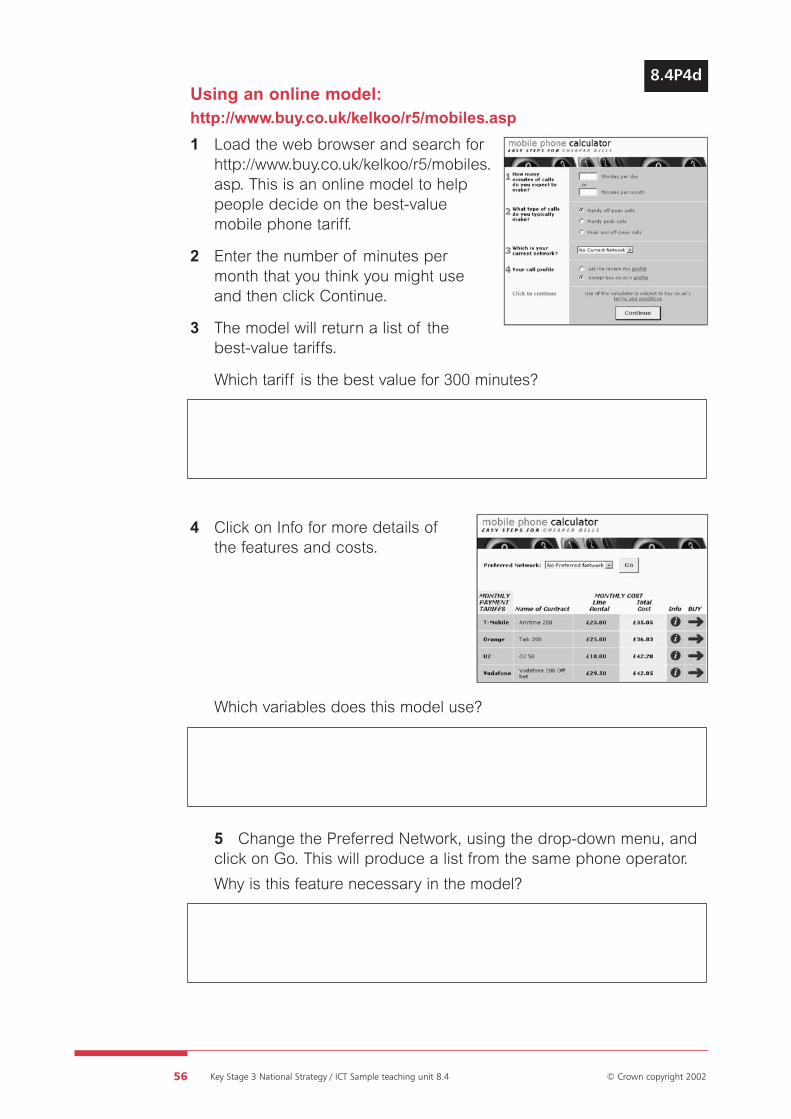
Using an online model:http://www.buy.co.uk/kelkoo/r5/mobiles.asp
1 Load the web browser and search forhttp://www.buy.co.uk/kelkoo/r5/mobiles.asp. This is an online model to help people decide on the best-value mobile phone tariff.
2 Enter the number of minutes per month that you think you might use and then click Continue.
3 The model will return a list of the best-value tariffs.
Which tariff is the best value for 300 minutes?
4 Click on Info for more details ofthe features and costs.
Which variables does this model use?
5 Change the Preferred Network, using the drop-down menu, andclick on Go. This will produce a list from the same phone operator.
Why is this feature necessary in the model?
56 Key Stage 3 National Strategy / ICT Sample teaching unit 8.4 © Crown copyright 2002
8.4P4d

6 Select Review Call Profile. This willshow you how the model thinks youuse your phone. Change the variablesto reflect your likely usage.
Is the same tariff still the best value for you?
Try different profiles. How does this affect the tariff chosen?
7 Think about how this model differs from your own.
Write down as many differences as you can.
57 Key Stage 3 National Strategy / ICT Sample teaching unit 8.4 © Crown copyright 2002
8.4P4dcont.

Investigating a simulation
Load one of the group A programs from 8.4 P5d Weblinks andprograms.doc.
Make a note of the one you have chosen.
Play the game and find the answers to these questions.
1 What is being simulated?
2 List up to three variables.
3 Choose one variable and describe how it affects the outcome.
4 Change one of the variables. Can you predict the outcome?Describe what it will be and then check if you were right.
58 Key Stage 3 National Strategy / ICT Sample teaching unit 8.4 © Crown copyright 2002
1
2
3
8.4P5b
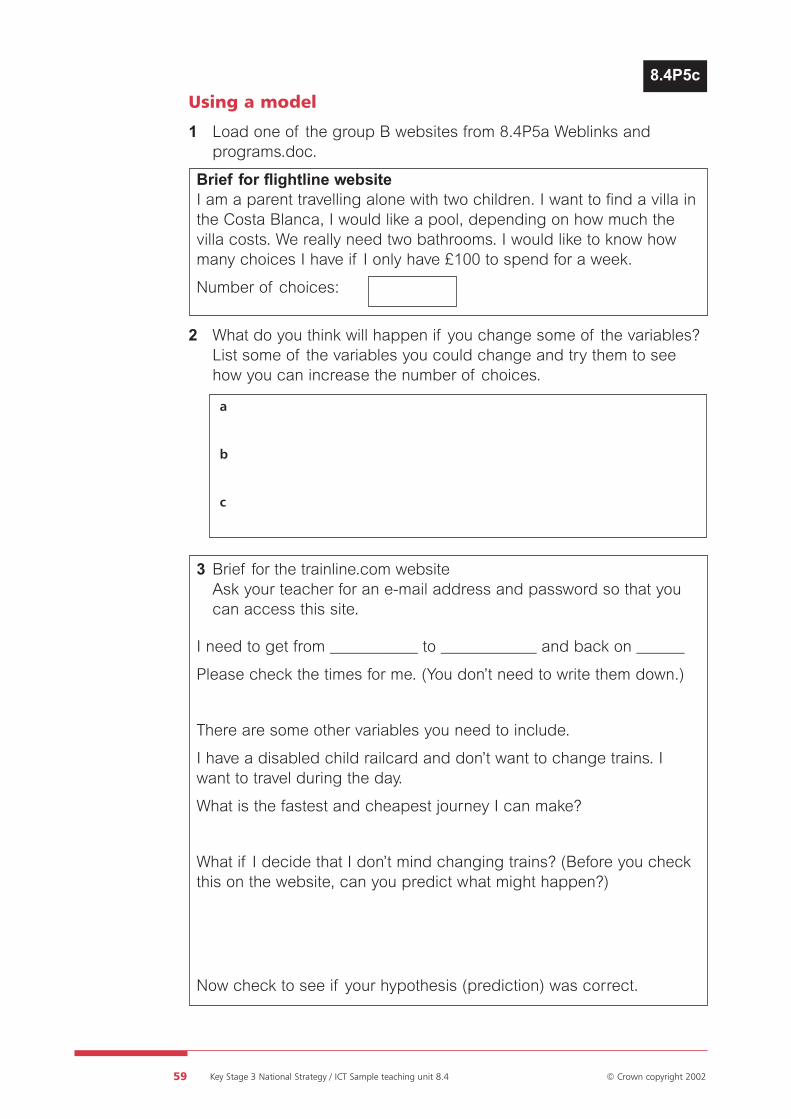
Using a model
1 Load one of the group B websites from 8.4P5a Weblinks andprograms.doc.
Brief for flightline websiteI am a parent travelling alone with two children. I want to find a villa inthe Costa Blanca, I would like a pool, depending on how much thevilla costs. We really need two bathrooms. I would like to know howmany choices I have if I only have £100 to spend for a week.
Number of choices:
2 What do you think will happen if you change some of the variables?List some of the variables you could change and try them to seehow you can increase the number of choices.
3 Brief for the trainline.com websiteAsk your teacher for an e-mail address and password so that you can access this site.
I need to get from ___________ to ____________ and back on ______
Please check the times for me. (You don’t need to write them down.)
There are some other variables you need to include.
I have a disabled child railcard and don’t want to change trains. Iwant to travel during the day.
What is the fastest and cheapest journey I can make?
What if I decide that I don’t mind changing trains? (Before you checkthis on the website, can you predict what might happen?)
Now check to see if your hypothesis (prediction) was correct.
59 Key Stage 3 National Strategy / ICT Sample teaching unit 8.4 © Crown copyright 2002
8.4P5c
a
b
c

Weblinks and programs
Group A: Simulations
Venables
Jumble
Gravity Probe
Group B: Models
http://www.thetrainline.com/
http://www.flightline.co.uk/villas/villas.asp
Other useful sites
Modelling weather forecasts
http://www.metoffice.com/weather/charts/animation.html
Modelling ocean wave swell
http://www.metoffice.com/research/ocean/operational/wave/swellanim.html
Best-value comparison
http://uk.kelkoo.com/
60 Key Stage 3 National Strategy / ICT Sample teaching unit 8.4 © Crown copyright 2002
8.4P5d