social security and coverage for all restructuring the ... · restructuring the social security...
TRANSCRIPT

ILO PROJECT INS/00/M04/NET
International Labour OfficeJakarta
SOCIAL SECURITY and COVERAGE FOR ALL
Restructuring the Social Security Scheme in Indonesia —Issues & Options
Version Date:- 20th December 2002

Copyright©International Labour Organization 2002
First published 2003
Publications of the International Labour Office enjoy copyright under Protocol 2 of the Universal Copyright Convention.Nevertheless, short excerpts from them may be reproduced without authorization, on condition that the source is indicated.For rights of reproduction or translation, application should be made to the Publications Bureau (Rights and Permissions),International Labour Office, CH-1211 Geneva 22, Switzerland. The International Labour Office welcomes such applications.
Libraries, institutions and other users registered in the United Kingdom with the Copyright Licensing Agency, 90 TottenhamCourt Road W1T 4LP [Fax: (+44)(0)20 7631 5500; email: [email protected]], in the United States with the Copyright ClearanceCenter, 222 Rosewood Drive, Danvers, MA 01923 [Fax: (+1)(978) 750 4470; email: [email protected]] or in other countrieswith associated Reproduction Rights Organization, may make photocopies in accordance with the licences issued to them forthis purpose.
ILOSocial Security and Coverage for All: Restructuring the Social Security Scheme in Indonesia - Issues & OptionsJakarta, International Labour Office, 2003
ISBN 92-2-113568-3
The designations employed in ILO publications, which are in conformity with United Nations practice, and the presentationof material there in do not imply the expression of any opinion whatsoever on the part of the International Labour Officeconcerning the legal status of any country, area or territory or of its authorities, or concerning the delimitation of its frontiers.
The responsibility for opinions expressed in signed articles, studies and other contributions rests solely with their authors,and publication does not constitute an endorsement by the International Labour Office of the opinions expressed in them.
Reference to names of firms and commercial products and processes does not imply their endorsement by the InternationalLabour Office, and any failure to mention a particular firm, commercial product or process is not a sign of disapproval.
ILO publications can be obtained through major booksellers or ILO local offices in many countries, or direct from ILOPublications, International Labour Office, CH-1211 Geneva 22, Switzerland or from the ILO Office in Jakarta, UN Building, 5thfloor, Jl. MH Thamrin 14, Jakarta 10340, Catalogues or lists of new publications are available free of charge from the aboveaddress, or by email: [email protected] ; [email protected].
Visit our website: www.ilo.org/publns ; www.un.or.id/ilo
Printed in Jakarta

iii
Table of ContentsANNEXES ............................................................................................................................................. viiLIST OF FIGURES AND TABLES ............................................................................................................. ixGLOSSARY ............................................................................................................................................ xiiiFOREWORD ........................................................................................................................................... xviiINTRODUCTION ....................................................................................................................................... xixDEFINITIONS ............................................................................................................................................ xxi
PART I SOCIAL SECURITY DEVELOPMENT BACKGROUND ...................................................1CHAPTER 1 THE ILO PROJECT — RESTRUCTURING THE SOCIAL SECURITY SYSTEM ......1
General Background..................................................................................................................... 1Immediate Objectives & Outputs ................................................................................................. 2
CHAPTER 2 OVERVIEW OF SOCIAL SECURITY IN INDONESIA ...................................................4General ........................................................................................................................................... 4Social Security Responsibilities ................................................................................................... 4Regional Autonomy ....................................................................................................................... 6Government and Private Employees Social Security Schemes ................................................. 6Labour Force and Social Security Membership ......................................................................... 8
PART II JAMSOSTEK ................................................................................................................................9Executive Summary........................................................................................................................ 9Rangkuman Eksekutif ................................................................................................................. 11
CHAPTER 3 JAMSOSTEK SOCIAL SECURITY PROGRAMMES ...................................................13Jamsostek Programs .................................................................................................................... 13Statistical Overview of Jamsostek Programs ............................................................................ 13Social Security Coverage of the General Population in Indonesia ....................................... 15
CHAPTER 4 STATUS OF JAMSOSTEK ................................................................................................16Implications of JAMSOSNAS for ‘Trust Fund’ Status of Institutions ..................................... 20
CHAPTER 5 JAMSOSTEK CORE BUSINESS......................................................................................22CHAPTER 6 JAMSOSTEK OPERATIONS & IT SYSTEMS ...............................................................23
Executive Summary...................................................................................................................... 23Rangkuman Eksekutif ................................................................................................................. 26Introduction.................................................................................................................................. 30Jamsostek Organization .............................................................................................................. 30Jamsostek Operational Processes.............................................................................................. 30Information Systems in Jamsostek ............................................................................................. 46Observations and Discussion ..................................................................................................... 56Conclusion ................................................................................................................................... 77
CHAPTER 7 COMPLIANCE .................................................................................................................. 78CHAPTER 8 JAMSOSTEK CONTRIBUTIONS STRUCTURE ........................................................... 82CHAPTER 9 HUMAN RESOURCES .....................................................................................................83CHAPTER 10 JAMSOSTEK FINANCE AND INVESTMENTS ............................................................84
Executive Summary...................................................................................................................... 84Ramgkuman Eksekutif ................................................................................................................ 86Financial Analysis of Jamsostek ................................................................................................ 88Issues in the Investment of the Jamsostek Fund ....................................................................... 94
Table of Contents

iv
PART III BENEFIT PROGRAMME STUDIES .....................................................................................97CHAPTER 11 PENSION REFORM IN INDONESIA. ............................................................................97
Executive Summary...................................................................................................................... 97Rangkuman Eksekutif ................................................................................................................. 98Jamsostek JHT Scheme and the Need for Change................................................................... 99A Notional Defined Contribution Scheme ............................................................................... 102A Mandatory Defined Contribution Scheme .......................................................................... 103A Mixed Pension System ........................................................................................................... 104A Defined Benefit Scheme ........................................................................................................ 105A Scheme for the Informal Sector ............................................................................................ 107A Scheme for the Self-Employed .............................................................................................. 109Pensions Administration ........................................................................................................... 109The Civil Service Pension Scheme Run by PT Taspen. .......................................................... 111Employer-Based and Financial Institution Pension Plans .................................................... 111Preparation for a New Pension Scheme ................................................................................. 112Conclusions................................................................................................................................ 113
CHAPTER 12 EMPLOYMENT INJURY AND DEATH BENEFITS ...................................................... 118Executive Summary.................................................................................................................... 118Rangkuman Eksekutif ............................................................................................................... 120Overview of the Legal Provisions and Their Implementation ............................................... 123Systems for Fixing Rates of Contribution ............................................................................... 125The Case for Accident Benefit .................................................................................................. 128JKK Scheme Benefits ................................................................................................................. 129Death Benefit Scheme ............................................................................................................... 131Implementation and Experience of the Schemes .................................................................... 131Recommended Benefit, Contribution and Administration Structure ..................................... 133Recommended Administrative Changes ................................................................................... 135Death Benefit Scheme ............................................................................................................... 136
CHAPTER 13 MATERNITY PROTECTION ......................................................................................... 137Executive Summary.................................................................................................................... 137Rangkuman Eksekutif ............................................................................................................... 138Maternity Protection in Indonesia ........................................................................................... 140Analysis of the Programme ....................................................................................................... 141Recommendations ...................................................................................................................... 143Other Issues ............................................................................................................................... 145
CHAPTER 14 UNEMPLOYMENT BENEFIT INSURANCE............................................................... 146Executive Summary.................................................................................................................... 146Rangkuman Eksekutif ............................................................................................................... 147Employment and Unemployment In Indonesia ........................................................................ 148Unemployment ........................................................................................................................... 148Impact of the 1997 Crisis ......................................................................................................... 148Impact on Women....................................................................................................................... 149Redundancy Payments and Use of Retirement Savings ......................................................... 150Options for Unemployment Cover ........................................................................................... 151Unemployment Insurance with Private Companies ................................................................ 152Compulsory Savings Schemes .................................................................................................. 152Unemployment Insurance with a Central Fund ...................................................................... 152
Table of Contents

v
The Feasibility of Unemployment Benefit in Indonesia ......................................................... 153Attitudes of The Social Partners and Other Stakeholders .................................................... 155Possible Characteristics of Unemployment Insurance in Indonesia .................................... 156How an Unemployment Insurance Benefit might be Funded. ............................................... 158Replacing Severance Pay with Unemployment Benefit ......................................................... 159Use of Jamsostek Surpluses ..................................................................................................... 159Other Financing Options for Informal Sector Workers ........................................................ 160Jamsostek as a Potential Administrator of Unemployment Insurance ................................. 160Benefit Costs .............................................................................................................................. 162Implementation Strategy ........................................................................................................... 164Implementation and the Economy ............................................................................................ 165Conclusions................................................................................................................................ 165
CHAPTER 15 SOCIAL ASSISTANCE ................................................................................................... 167Executive Summary.................................................................................................................... 167Rangkuman Eksekutif ............................................................................................................... 169The 1997 Crisis and the Social Safety Net ............................................................................. 172The Size of the Social Safety Net Initiatives ........................................................................... 172Effectiveness of the Social Safety Net Programmes ............................................................... 173Summary on Social Safety Net Programmes ........................................................................... 176Other Anti Poverty Measures ................................................................................................... 176Social Safety Nets and Social Assistance................................................................................ 177Unmet Needs .............................................................................................................................. 177Scale of Funding Needed ......................................................................................................... 178Characteristics of Effective Social Assistance Systems ......................................................... 179Possible Strategies for Indonesia ............................................................................................ 180Administrative Improvements .................................................................................................... 182Feasible Types of Social Assistance ........................................................................................ 183Funding Sources ........................................................................................................................ 183Data for Targeting ..................................................................................................................... 184Summary ..................................................................................................................................... 184
CHAPTER 16 JAMSOSTEK HEALTH CARE PROGRAMME ........................................................... 186Executive Summary.................................................................................................................... 186Rangkuman Eksekutif ............................................................................................................... 188Current Health Care Policy and Delivery ............................................................................... 190Health Care Financing ............................................................................................................. 191Micro Financing Schemes ........................................................................................................ 194Access to Primary Care ............................................................................................................. 196Access to Hospital Services ...................................................................................................... 197Quality of Health Services........................................................................................................ 199Direction of Health Care Reform ............................................................................................. 201Analysis of the Organization of Health Care.......................................................................... 204The Alternative Scenarios for Reform ..................................................................................... 204JPK Jamsostek (Health Insurance Component of Jamsostek) .............................................. 206Summary of JPK Jamsostek Problems ..................................................................................... 213Possible Design of Health Insurance for Indonesia.............................................................. 214Health Benefits to be Covered and the Related Contributions ............................................. 217Recommendation for the Revision of Jpk Jamsostek ............................................................. 221
Table of Contents

vi
PART IV OTHER STUDIES .................................................................................................................... 224CHAPTER 17 EXTENSION OF COVERAGE TO EXCLUDED GROUPS ........................................ 224
Executive Summary.................................................................................................................... 224Rangkuman Eksekutif ............................................................................................................... 227General Overview of the Issues for Extension of Coverage ................................................. 230Introduction................................................................................................................................ 234The Incidence Of Poverty in Indonesia................................................................................... 235Social Security in Indonesia..................................................................................................... 243The Employment Sectors in Indonesia ..................................................................................... 245Findings And Options ............................................................................................................... 254
CHAPTER 18 THE SOCIAL BUDGET .................................................................................................. 276Executive Summary.................................................................................................................... 276Rangkuman Eksekutif ............................................................................................................... 277The Demographic and Socio-Economic Context .................................................................... 278Analysis of The Aggregate Social Insurance Expenditure – ................................................. 287Financial Projections of Social Insurance Schemes other than Jamsostek ........................ 289Functional Summary of Social Insurance Benefits ................................................................ 294Concluding Remarks ................................................................................................................. 295
CHAPTER 19 KLATEN REVISTED ....................................................................................................... 296Executive Summary.................................................................................................................... 296Rangkuman Eksekutif ............................................................................................................... 297Introduction................................................................................................................................ 298Essential Background ............................................................................................................... 298Health Sector Finance Project ................................................................................................. 299The Results of the HSF Project ................................................................................................ 300The Klaten Integrated Health Care Reform Field Trial ......................................................... 302The Two -Year IHCR project extension (Apr 1996 - Mar 1998) ........................................... 307Analysis and the Aftermath ....................................................................................................... 311Conclusions................................................................................................................................ 315Summary ..................................................................................................................................... 317
CHAPTER 20 CONCLUSION ................................................................................................................. 318BAB 20 Kesimpulan .................................................................................................................................. 320BIBLIOGRAPHY ...................................................................................................................................... 389
vii
ANNEXES
ANNEX 1 JAMSOSTEK SERVICE IMPROVEMENT SUMMARY .............................................................................. 322
ANNEX 2 TAXATION COLLECTION IN INDONESIA ............................................................................................... 331
ANNEX 3 JAMSOSTEK FINANCIAL STATISTICS ................................................................................................... 333
ANNEX 4 JAMSOSTEK RETIREMENT PROGRAMME - OVERVIEW ....................................................................... 340
ANNEX 5 MONTHLY MINIMUM WAGES BY PROVINCE, YEAR 2000 .................................................................... 341
ANNEXE 6 MONTHLY SALARY / WAGES – URBAN AND RURAL FORMAL SECTOR ........................................... 342
ANNEX 7 FORMAL SECTOR – FEMALE SALARY EARNERS BY AGE ................................................................... 343
ANNEX 8 FORMAL SECTOR – MALE SALARY EARNERS BY AGE........................................................................ 344
ANNEX 9 NEW ENTRANTS TO JAMSOSTEK PROVIDENT FUND 1998 - 2000 ....................................................... 345
ANNEX 10 OLD AGE DEPENDENCY RATIOS .............................................................................................................. 346
ANNEX 11 POPULATION PROJECTIONS 1998 –2040................................................................................................... 347
ANNEX 12 WORKFORCE COMPOSITION IN INDONESIA ......................................................................................... 348
ANNEX 13 AVERAGE DECLARED EARNINGS; JAMSOSTEK CONTRIBUTORS 2000 .............................................. 349
ANNEX 14 WITHDRAWALS FROM JAMSOSTEK PROVIDENT FUND ..................................................................... 350
ANNEX 15 INDONESIA POPULATION PROJECTIONS................................................................................................ 351
ANNEX 16 AVERAGE WAGES FOR CONTRIBUTORS TO JAMSOSTEK ................................................................... 352
ANNEX 17 LIFE EXPECTANCY ..................................................................................................................................... 353
ANNEX 18 GROUPS OF BUSINESSES ........................................................................................................................... 354
ANNEX 19 ANNUAL REPORT, MINISTRY OF MANPOWER AND TRANSMIGRATION 2001 .................................. 359
ANNEX 20 TOTAL NUMBER OF FEMALES BY AGE AND PERCENTAGE 1995 TO 2000 ........................................... 360
ANNEX 21 MARITAL STATUS OF URBAN RESIDENTS MALE & FEMALE ABOVE AGE 10 ................................... 361
ANNEX 22 UNEMPLOYMENT INSURANCE STATISTICS .......................................................................................... 362
ANNEX 23 A DRAFT SHORT PERIOD UNEMPLOYMENT BENEFIT SCHEME .......................................................... 370
ANNEX 24 ALTERNATIVE PROJECTIONS OF UNEMPLOYMENT INSURANCE OUTCOMES ................................. 371
ANNEX 25 COMPARISON OF SCHEMES BY ACCUMULATED FUNDS AS % OF COSTS ........................................ 375
ANNEX 26 SOCIAL ASSISTANCE STATISTICS ........................................................................................................... 376
ANNEX 27 SELECTED INTERNATIONAL EXPERIENCE IN EXTENSION OF SOCIAL SECURITY ............................ 380
ANNEX 28 INFORMAL SECTOR SURVEY – TABLES OF RESULTS ............................................................................ 382
ANNEX 29 TRANSACTION COSTS BASED ON MAXIMUM CONTRIBUTIONS ...................................................... 387
Annexes


ix
LIST OF FIGURES AND TABLESFigure 1 Social Security Responsibilities .......................................................................................................................... 5Figure 2 Indonesian Social Security System - Overview .................................................................................................. 7Figure 3 Table of Labour Force and Social Security Statistics .......................................................................................... 8Figure 4 Table of Membership Statistics .........................................................................................................................11Figure 5 Jamsostek Programs Overview ..........................................................................................................................12Figure 6 Possible Form of Jamsosnas Council .................................................................................................................19Figure 7 Labour Force Statistics ......................................................................................................................................25Figure 8 Membership Statistics .......................................................................................................................................26Figure 9 Jamsostek Structure ...........................................................................................................................................26Figure 10 President Director ..............................................................................................................................................27Figure 11 Operations and Services Directorate .................................................................................................................27Figure 12 Finance and Information Directorate .................................................................................................................27Figure 13 Investments Directorate ....................................................................................................................................27Figure 14 Personnel and General Affairs Directorate .........................................................................................................28Figure 15 Planning & Development Directorate ................................................................................................................28Figure 16 Regional Office Locations .................................................................................................................................28Figure 17 Service Delivery Network ..................................................................................................................................29Figure 18 Regional Office Structure ...................................................................................................................................30Figure 19 Branch Office Structure .....................................................................................................................................31Figure 20 Contributions Overview ....................................................................................................................................32Figure 21 Retirement Programs Claim Process ...................................................................................................................33Figure 22 Work Injury Program Claims Process .................................................................................................................34Figure 23 Health Care Registration ....................................................................................................................................36Figure 24 Health Care Treatment and Payment Process ....................................................................................................36Figure 25 Current Balance Sheet .......................................................................................................................................37Figure 26 Investment Management Process .....................................................................................................................39Figure 27 SIPT Context Diagram ........................................................................................................................................40Figure 28 Existing Communications Summary ...................................................................................................................41Figure 29 Proposed Communications Summary (first stage) .............................................................................................42Figure 30 Existing IT Organization ....................................................................................................................................43Figure 31 IT Organization (Proposed) ...............................................................................................................................44Figure 32 Regional Office IT Section .................................................................................................................................45Figure 33 Branch Office IT Organization ...........................................................................................................................46Figure 34 Software Inventory ............................................................................................................................................46Figure 35 SIPT Overview Diagram .....................................................................................................................................47Figure 36 Current Data Architecture .................................................................................................................................48Figure 37 Hardware - Server Summary ...............................................................................................................................49Figure 38 Jamsostek Employee Membership Card ............................................................................................................53Figure 39 National Index Sample Data ...............................................................................................................................57Figure 40 The National Index in a single site .....................................................................................................................58Figure 41 Inter Branch record updates ..............................................................................................................................58Figure 42 Interim National Index Option ............................................................................................................................60Figure 43 Overlap between Social Security Customers .....................................................................................................63Figure 44 Typical Social Security Customer Lifecycle .......................................................................................................63Figure 45 Business Re-engineering ...................................................................................................................................69Figure 46 Initial Business Reengineering Plan for Jamsostek ............................................................................................70Figure 47 Table of Jamsostek Contributions .....................................................................................................................76
List of Figures and Tables

x
Figure 49 Table of Coverage of Jamsostek, 2000 ............................................................................................................... 81Figure 50 Table of Breakdown of Contribution Rates of Jamsostek ..................................................................................81Figure 51 An Example of Jamsostek Annuity ....................................................................................................................91Figure 52 Estimated Actuarial Annuity Factors at Age 55 for Selected Interest Rates & Guarantee Periods ...................92Figure 53 Social Security Priorities for Workers in the Informal Economy ........................................................................99Figure 54 Table of Estimated Benefits under the Defined-Benefit Option in 2001 Prices................................................. 107Figure 55 Table of Membership Statistics of Jamsostek .................................................................................................. 112Figure 56 Table of Labour Force, Employment and Jamsostek Membership ................................................................... 112Figure 57 Table of Schemes, Contributions and Benefits in Jamsostek ........................................................................... 116Figure 58 Table of Amount of Benefit Expenditure & Number of Cases ......................................................................... 118Figure 59 Table of Employment Injury Contributions and Benefit Data 1994- 2001 ......................................................... 120Figure 60 Table of Number of Cases of Withdrawal ........................................................................................................ 120Figure 61 Table of Income and Expenditure – Employment Injury for Construction Industry ........................................ 120Figure 62 Table of Death Benefits by Cases, Contributions and Benefits ....................................................................... 121Figure 63 Table of Female Sex Ratios in the Asian Region ............................................................................................. 126Figure 64 Table of Age-specific Female Sex Ratios in Indonesia ..................................................................................... 126Figure 65 Population 15 Years of Age and over by Age Group and Types of Activity ................................................... 128Figure 66 Table of Female Employees Wages: Salaries per Month by Region (August 2000) ........................................ 128Figure 67 Table of Maternal Deaths and Births in Hospitals in Indonesia year 2001 ...................................................... 128Figure 68 Table of Distribution of Patients By Gynaecological Problems in Hospitals during 1999 ................................ 129Figure 69 Table of Distribution of Patients receiving Gynaecology Treatment by Age (1999) ....................................... 129Figure 70 Table of Assumed Average Wage Calculations .............................................................................................. 131Figure 71 Table of Programme Calculations and cost Estimates ...................................................................................... 131Figure 72 Table of Jamsostek Programmes as % of Operating Costs .............................................................................. 146Figure 73 Average Weekly Cost per Benefit Paid ............................................................................................................ 147Figure 74 Cost per Beneficiary per Benefit Payment Paid ................................................................................................ 148Figure 75 Annual Claims Grants ...................................................................................................................................... 148Figure 76 Costs of alternative Replacement Rate and Time Duration of Benefit Payments ............................................. 148Figure 77 Table of Contribution Costs ............................................................................................................................ 149Figure 78 Table of Non-oil Subsidies ............................................................................................................................... 154Figure 79 Table of Five Leading Causes of Death from Series of Household Health Survey .......................................... 170Figure 80 Table of Health Care Financing in Selected Countries in Asia, 1997................................................................ 171Figure 81 Government Allocation of Health Services as Percent of Total Government Expenditures ............................. 172Figure 82 Visit Rates for Any Outpatient Care by Income Deciles, 1998 ......................................................................... 176Figure 83 Differences in Visit Rates for Primary Health Care Utilization by Income 1998 ................................................ 177Figure 84 Hospital Inpatient Days per 1000 People by Income Groups and Insurance Status, 1998. .............................. 178Figure 85 Average Financial Burden of Households (times household monthly expenditure) ........................................ 178Figure 87 Memberships Growth of Health Insurance Component of (JPK) Jamsostek, 1991-2000 .................................. 187Figure 88 Table of Utilization Rates per 1,000 Members of JPK Jamsostek 1992-2000 ..................................................... 193Figure 89 Possible Design of Social Health Insurance Scheme in Indonesia .................................................................. 195Figure 90 Agenda for Universal Coverage in the Proposed Compulsory Health Insurance Scheme .............................. 196Figure 91 Table of Estimates of the People below Poverty Line ...................................................................................... 214Figure 92 Table of the Official BPS Poverty Line (in Rupiah). ......................................................................................... 215Figure 93 Table of Estimates of the Incidence of Poverty, 1996-1999. ............................................................................. 215Figure 94 Numbers Below the Poverty Line 1984 - 1999 .................................................................................................. 216Figure 95 Table on the Proportion of Population below the BPS Poverty Line by Province ........................................... 216Figure 96 Table on the Incidence of Poverty by Main Sector of Occupation (%) ........................................................... 217Figure 97 Table of Poverty Profile by Education Level of Household Head (%) ............................................................. 217Figure 98 Enterprises by Employment Sector .................................................................................................................. 219Figure 99 Workers by Sector and Industry 2000 ............................................................................................................. 221
List of Figures and Tables

xi
Figure 100 Table of Comparison between Formal and Informal Economy ......................................................................... 223Figure 101 Industry Groupings in the Informal Economy ................................................................................................. 224Figure 102 Composition of Employment in Indonesia in 2000 ........................................................................................... 224Figure 103 Government Stakeholders in the Informal Economy ........................................................................................ 224Figure 104 Distribution of Formal Sector Enterprises ........................................................................................................ 229Figure 105 A Social Insurance Model based on Self-help Groups .................................................................................... 241Figure 106 A Possible Organization for a Social Security Pilot ......................................................................................... 243Figure 107 Table - Destination of Migrant Workers by Region ......................................................................................... 244Figure 108 Regional Office Locations ............................................................................................................................... 247Figure 109 Jamsostek Program Cost estimate 1997 ............................................................................................................ 248Figure 110 Summary of Estimated Transaction Costs in Jamsostek .................................................................................. 249Figure 111 Table of Main Demographic Indicators of Indonesia, 1970-2000 ..................................................................... 252Figure 112 Table of Key Assumptions of the Population Projection (intermediate scenario), 1995-2050 .......................... 253Figure 113 Table of Key Results of the Population Projection (intermediate scenario), 2000-2050 ................................... 254Figure 114 Table of Growth Rates of Real GDP, 1983-2000 ................................................................................................ 254Figure 115 GDP by Sector 1983 – 2000 .............................................................................................................................. 255Figure 116 Table of Growth Rates of the Labour Productivity, 1989-2000 ......................................................................... 255Figure 117 Table of Growth Rates of Employment, 1987-2000 ........................................................................................... 255Figure 118 Employment by Sector 1990 - 2000................................................................................................................... 256Figure 119 Labour Force Participation Rates by Sex, 1986 – 2000 ..................................................................................... 256Figure 120 Labour Force Participation Rates by Age Group 1986 – 2000 .......................................................................... 257Figure 121 Open Unemployment Rates by Age Group 1986 - 2000 ................................................................................... 257Figure 122 Table of Key Economic Assumptions, 2001-2030 ............................................................................................ 258Figure 123 Percentage of Workers in Formal Sector and Informal Economy 1986 – 2000 .................................................. 260Figure 124 The Social Budgeting Process ......................................................................................................................... 262Figure 125 Table of Taspen Financial Indicators ............................................................................................................... 263Figure 126 Askes Basic Indicators 1995, 1999 ................................................................................................................... 264Figure 127 Table of Social Insurance Expenditure and Revenue, 2000-2030...................................................................... 266Figure 128 Table of Social I nsurance Expenditure by Benefit, 2000-2030 ......................................................................... 267Figure 129 Old age and Short Term Benefits as % of GDP ................................................................................................ 268Figure 130 Short Term Benefits as % of GDP .................................................................................................................... 268Figure 131 Components of the Klaten IHR........................................................................................................................ 276Figure 132 Initial Budget Proposals for 1996-98 ................................................................................................................ 279Figure 133 Table of Project Finance 1988-99...................................................................................................................... 283Figure 134 Target Achievement by March 1999 ................................................................................................................ 284
List of Figures and Tables


xiii
GLOSSARYASABRI Social insurance system designed to provide
pension and endowment insurance benefitsto Indonesian Armed forces personnelAsuransi Sosial Angatan BersenjataRepublik Indonesia
ASKES PT Askes, (PT Asuransi KesehatanIndonesia), the State-owned, autonomous,for-profit insurance company administeringthe Public Service health insurance schemefor government civil servants, their familiesand for government civil service retirees. Italso provides health care service on behalf ofAsabri for members of the armed forces andtheir families.
ASTEK A state corporation (Perum) established in1990 and responsible for Employees SocialSecurity. Changed to JAMSOSTEK (Persero)in 1995.
BAPEL The carrier of JAMSOSTEK health insuranceprogramme also known as JPKM
BAPPENAS The National Development Planning agency
BBP Basic Benefit Package - essential healthservices in regulation Menkes #527
BPS Busan Pusat Statistik. The National StatisticsAgency in Indonesia
BUMD Badan Usaha Milik Daerah, - is a form ofcompany owned by local a government, eitherfully (100% shares) or partially. Unlike BUMN,these local companies are not sub-dividedinto several stages/forms. The objective ofBUMD is also profit.
BUMN (Badan Usaha Milik Negara) - is a legal statusof state-owned companies. The structure ofthis type of company is that of an ordinarypublic corporation in which there is a boardof directors and commissioners. Normally, theboards are drawn from civil servants orgovernment employees (including militarypersonnel). There are three tiers of BUMN:
Perjan (Perusahaan Jawatan) is the lowestlevel of companies, attached to certainministries for the purpose of technicaloversight. They are under the supervision ofthe Ministry of Finance for financial matters.In the health sector for instance, currently 13
central hospitals are being transformed intoPerjans. Under this status, the company isnot subject to the government accountingsystem. The mission of this type of companyis to provide services or goods to the public.In terms of financial goals, the company maypursue profits but must take intoconsideration its social objectives. Perjansmay receive subsidies from the government.
Perum (Perusahaan Umum) is the second stage ofprivatization. This type of company must befinancially independent and may not receivesubsidies from the government. A ministrystill holds the authority to oversee technicalaspects while the Ministry of Finance willoversee financial aspects. Any profitgenerated from the operation must be sharedwith the General Treasurer.
PT. Persero (Perseroan Terbatas) is the third stage ofprivatization of government institutions. Inthis form, all shares are owned by thegovernment but the company is managed asa fully private corporation with its goal tomaximize profit. The Indonesian socialsecurity system (comprised of: PT Jamsostek,PT Askes, PT Taspen and PT Asabri) ismanaged by Perseros but it is now consideredto be inappropriate for administration of socialsecurity.
Contract Doctor Postgraduate non-civil service doctor 2-3 year non-renewable contract
CV Perseroan Komanditer/ComanditairVenootschap is a type of proprietorship torun a business between individual(s) whois(are) willing to manage the business andtake full responsibility including privateassets of the other proprietor(s) not wishingto manage the business but willing only toassume limited responsibility in accordancewith their assets invested in the company.
DANA ALOKASI KHUSUS special allocationfunds.
DANA SEHAT Health fund a form of community healthcare financing or a micro financing schemethat was introduced by the Ministry of Healthand or a community initiative to share theburden of health care among the members ofthe community. Membership is voluntary,contribution level is based on consensus, andthe benefits are normally limited to healthservices in public health centre.
Glossary
xiv
DEPKES (Departemen Kesehatan) Department ofHealth.
DEPNAKERTRANS Depertamen Tenaga Kerja DanTransmigrasi. Department of Manpower andTransmigration
DINAS KERJA The provincial organization that hasassumed the responsibilities of localDepnakertrans functions under regionalautonomy. A Dinas is a district governmentorganization.
DINAS KESEHATAN District or Provincial HealthOffice.
DUKM Dana Upaya Kesehatan Masyarakat (healthfunds for the people)
FIRMA Firma is an establishment in the form of apartnership to run a business in a commonname with shared responsibility and profits.
FORMAL SECTOR The formal sector represents themore administratively visible part of theeconomy and society, namely the public andprivate corporate sector and comprisesenterprises and the professional self-employed that have been accorded LegalStatus and are regarded as legal entities
GOI Government of Indonesia
HMB A licensed JPKM company established inKlaten
HSF the Health Sector Finance Project
ICW Colonial Dutch law requiring remittance of allpublic revenues
IHCR Integrated Healthcare Reform
IJIN DIPARDA/SIUP Ijin Diparda is a specialpermit for establishments dealing in tourismin the form of Surat Ijin Usaha Pariwisata(SIUP) which is a business permit issued bythe tourist board in the local government.Included in this category are touristbusinesses operating under local governmentpermit other than a Diparda i.e. legal enterprisewithout a tourist permit.
INFORMAL ECONOMY The urban informal economycomprises those individuals and employersthat have not been accorded legal status andhave commenced their operations oftenwithout the sanction or knowledge of thelocal authorities (e.g. cottage workers)
JABOTABEK Jakarta – Bogor – Tangerang – Bekasi.The title given to the conglomeration ofJakarta and the surrounding cities.
JAMSOSTEK PT Jaminan Sosial Tenaga Kerja. The statecorporation (Persero) established in 1990 andresponsible for Employees (private sector)Social Security. Changed to JAMSOSTEKfrom ASTEK in 1995.
JASINDO Parastatal insurance company
JPKM Jaminan Pemeliharaan Kesehatan Masyarakat(or Jaring Pengaman Kesehatan Masyarakat)(JPKM) – translated as ‘Community HealthMaintenance Protection’ currentlyadministered as a Directorate of the Ministryof Health.
JPS Social Safety Net (General)
JPS-BK Social Safety Net (Health)
KARTU KELUAGA Family identity card issued bylocal administrations to the head of the family
KARTU SEHAT Health card issued to poor families toprovide them with free care in public healthcentre or public hospitals. It was introducedwhen the government launched a social safetynet program during the financial crisis in 1998.
KJKHM A secondary level dedicated servicecooperative established in Klaten
Klaten A district in South Central Java
KOPERASI Cooperative is an economic organisationbased on social spirit and comprised ofindividual and company members under amutual ownership system.
KTP KARTU TANDA Personal Identity cardissued by local administrations to allresidents.
LAN Local Area Network
LEGAL ENTITY An enterprise that has legal authority inthe form of Perum, PD, PT,/NV, CV, Firma,Koperasi, Yayasan, SIPD, Diparda, Villagecredit scheme, foreign company etc.
Ltd/Corporation Legal status of foreign enterprises thathave licences to operate in Indonesia
MOH Ministry of Health
Glossary

xv
PCD Post Contract Doctor
PD Perusahaan Daerah is a company of whichthe shares are owned by local governmentwith the assets separated from the localgovernment assets. A Perusahaan Daerah isrun for maximising profit to support localregional development.
PERATURAN PEMERINTAH G o v e r n m e n tRegulation.
PERJAN A Perjan is a non-profit oriented, governmentfunded departmental agency that provides aspecialized public service e.g. railways. Theother government public company types arePersero and Perum
PERSERO (PT) A Persero is a profit orientated, limitedliability, state company where thegovernment’s capital is based on shares,100% of which are owned by the government.The Ministry of Finance acts as a shareholderand the Ministry of State Owned Enterprisesis the authorized shareholder. The companyassets are separated from state owned assets.The other state company types are Perjan andPerum.
PERUM Perusahaan Umum Negara is a company notmerely aimed at making profit but also forproviding services to the public in the formof vital public utilities, by considering notonly its efficiency, effectiveness, economicaland its goods and services. The company’sentire capita is owned by the state and isdivorced from state owned assets. Thecompany can accept credit in the form ofgovernment bonds and can deal with othercompanies as part of its business. A typicalPerum is a non-profit oriented, public utilitycompany (e.g. electricity) that is not basedon shares divisions
Perum Husada Bhakti Previous name of Askes
Posyandu Health post
PT/NV. Perusahan Terbatas is a company owned byshareholders, with the shareholders assuminga limited liability no more than the nominalvalue of shares. Each shareholder has votingrights to participate in the running of thebusiness, depending on the number of sharesheld or by agreement among shareholders.PT is equivalent to Pty Ltd.
PTT Temporary contract healthcare employee ofthe government
Puskesmas Government health centre
RDU Rational Drug Use
RITSBLAAD/STAATSBLAAD Is an arrangement thatregulates the establishment of various villagecredits
GOVERNOR/BUPATI enterprises within Java andMadura.
SIPD (C class quarrying) is a local mining permit toconduct quarrying of rock, sand, clays, kaolinetc.
SWADANA Autonomous hospital
TASPEN Tabungan Asuransi Pegawai Negeri; Annuitypensions and endowment insurance benefitsscheme for government civil servants Pensiundan asuransi hari tua pagawai negeri sipil
USAID United States Agency for InternationalDevelopment
WAN Wide Area Network
YAYASAN A foundation that is a non-profit establish-ment mainly used for social service relatedpurposes with separately identified assets.
Glossary


xvii
FOREWORDSocial Security Reform is one of the great challenges facing Indonesia.The East Asian economic and financial crisis resulted in a significant increase in unemployment, underemploymentand poverty in Indonesia. It highlighted weaknesses in the social security system and increased the awareness ofthe need for change and improvement.The ILO has sought to assist in the process of change and improvement through the project “Restructuring ofthe Social Security System in Indonesia”, which was funded by the Government of the Netherlands.The ILO views the improvement of social security systems as part of an overall objective of providing decentwork for all men and women. The ILO believes that “decent work” is what workers throughout the world seek,namely work which is productive, which provides adequate income to meet their needs, in which their rights areprotected, and with adequate social protection.As part of the project, a series of research papers and reports were prepared by the Chief Technical Advisor andexpert consultants. The reports cover areas of crucial importance in improving the structure and operation of theSocial Security System in Indonesia and, in particular, the Employees’ Social Security Programme (Jamsostek).These include issues regarding:• Reform of pensions;• Options for improving benefits and arrangements in regard to work injuries;• Scope for provision of unemployment benefits and other social assistance to those unable to find work;• Ways in which the coverage of social security schemes might be extended to cover excluded groups (e.g.
migrant workers and those engaged in the informal economy); and• Administration of existing schemes – including the review of management operations and information technology;
and• Actuarial review of the current scheme and analysis of social security expenditure.The reports were presented to a meeting of stakeholders and experts held on 28-29 November 2002 in Jakarta.The consultation meeting brought together representatives of government, employers and workers together withmembers of the Presidential Task Force on Social Security Reform, managers of Jamsostek and other schemes,academics and NGOs. The main purpose of the consultation was to share the findings and get feedback fromparticipants in order to improve and finalize the reports and to consider how the reports might contribute to theSocial Security reform process in Indonesia, including the work of the Task Force. The proceedings included apresentation on the work of the National Task Force on Social Security Reform by its Chairman, ProfessorYaumil Achir.Following the consultations, the reports have been revised and collected together in this publication. The bookcontains a series of expert reports on major issues for consideration in the reform of social security in Indonesia.I believe that awareness about these issues, and discussion about realistic steps to be taken to improve bothaccess to social security and the type and level of benefits available, are essential to the development of aneffective plan of action to improve social security protection for workers in Indonesia. The ILO is highlightingsuch issues through its global campaign on Social Security and Coverage for All.Finally, I would like to thank and congratulate the persons involved in the project and in the preparation of thispublication. In particular I would like to thank Mr. Mike Smith, the Chief Technical Adviser of the project, and theconsultants who have prepared the reports. I would also like to thank the Department of Manpower andTransmigration for its support and collaboration throughout the project. In this regard I would like to acknowledgethe contribution of Mr. Syaufii Syamsuddin, National Project Director and Mr. Masri Hasyar, Director of SocialSecurity in the Department. The ILO is pleased to have been able to work with the Department on this importantexercise. The ILO is also most grateful for the support of the Dutch Government throughout the project.We trust that this book will be a valuable reference source for those concerned with the development of a bettersocial security system in Indonesia.
Alan BoultonDirectorILO Jakarta OfficeDecember 2002
Forward


xix
he International Labour Office has been involved in the development of social security in Indonesia formore than 20 years but during the last decade this has been limited to technical advice drawing attentionto the weaknesses in the national social security system. The financial crisis again exposed these
weaknesses and following a further analysis in early 1999 and an increased level of public criticism againstJamsostek (the social security institution administering social security for the private sector), the ILO providedresources for short-term technical assistance between September and December 1999. The need to restructurethe social security system and, in particular, to address the weaknesses of Jamsostek were analyzed by a NationalSteering Committee, established by the Ministry of Manpower in September 1999 to work with ILO specialists.This culminated in a National Workshop on the Restructuring of Social Security held in Jakarta on 16/17 November1999.
The report produced at the end of this technical assistance input (ILO/TAP/ Indonesia/R.20) set out recommendationsfor follow-up and the project: “Restructuring of the Social Security System” (INS/00/M04/NET) was implementedas a direct result of these recommendations. The objectives of the project were the establishment of a newinstitutional structure for the national social security scheme and the development of a national strategic plan forthe restructuring of the social security system.
The Director-General of the International Labour Office appointed Mr Michael Smith, an international expert onsocial security planning and administration as Chief Technical Adviser of the project. Also appointed were: MessrsJohn Angelini, Ole Nielsen, David Gent, Aniceto Orbeta, David Preston and Paguman Singh — respectivelyinternational experts on Information Technology; Actuarial Valuation; Pensions Policy; Labour Market Economy;Unemployment Insurance and Social Assistance Policy; and Occupational Injuries and Maternity Benefits Policy— to undertake detailed work on the studies. The Director General also appointed Mr Kenichi Hirose of the ILOSocial Security Finance, Actuarial and Statistical Services Branch and Mr Cristian Baeza of the ILO GlobalSTEP Programme to participate in the studies. Professor Sentanoe Kertonegoro, Dr Hasbullah Thabrany MD,Dr James R. Marzolf MD and Messrs Carunia Firdausy, Wendi Usino and Mrs Sofiati Mukadi were appointed asnational experts to the project. All the above national and international experts contributed in varying degrees tothe project reports and, therefore, to this publication. Mr Clive Bailey, Senior Social Security Specialist, of the ILOSocial Security Department, Geneva also contributed significantly — not only with material but also throughsupport to the project and to the cause of social security development in Indonesia over many years.
The Government Agency responsible for managing the project was the Department of Manpower andTransmigration (Depnakertrans) which appointed Mr Mohd. Syaufii Syamsuddin as National Project Director.From 1st August 2002 he was succeeded by Mr Masri Hasyar. Other cooperating agencies were the Departmentof Health and PT Jamsostek.
The purpose of this Publication is to present the series of studies undertaken during the project and others closelyassociated with it in a consolidated, readable form — hopefully with wider appeal than the formal project reportpresented to the government of Indonesia following the end of the project which ran from 1st April 2001 to 31st
December 2002 (with a break in project activities between 30th May and 1st August 2002). To this end, many ofthe Chapters in this Publication commence with their own Executive Summary.
This Publication was edited by Mike Smith, assisted by John Angelini.
INTRODUCTION
TIntroduction


xxi
n order to aid comprehension of the issues a listof definitions of social security terms used in thisPublication follows.
Social Security
The protection which society provides for its members,through a series of public measures against the distressthat otherwise would be caused by the stoppage orsubstantial reduction of earnings — resulting from:sickness, maternity, unemployment, invalidity, old age, ordeath. Social security also includes the provision of medicalcare and the provision of subsidies to families with children.
Social security is composed of:• Social Insurance;• Social Assistance;• Family Benefits;• Provident Funds; and• Provisions made by Employers such as:• Workmen’s Compensation Schemes; and• Other, complementary programmes.
Social Insurance
Social insurance is based on the principle of the pooling ofrisk. Thus everyone covered by a social insurance schememakes a contribution to a common fund. When a contributormeets the prescribed conditions for benefits ¾ his or herneeds (or at least part of them) are met from the insurancefund.
Social Insurance schemes may differ from one another buttheir principle elements are that:
• They are financed by contributions normally sharedbetween workers and employers, (often with some Stateparticipation);
• Require compulsory participation;• The contributions are paid into special funds out of
which benefits are paid.
In social insurance schemes:
• Surplus (reserve) funds are invested to earn furtherincome – returned to members through improvedbenefits;
• Benefits are guaranteed on the basis of the qualifyingconditions set out in the legislation, with regard to thepayment of contributions and without means testing(i.e. taking income and wealth into account);
• Contributions and benefit are often proportionate toearnings;
• Employment injury schemes are usually financed whollyby employers.
DEFINITIONSSocial Assistance
In social assistance schemes, benefits are provided as alegal right when the prescribed conditions are met. Generallyspeaking, means are taken into account when arriving atthe assessment of the benefit to be paid.
Social Protection
Social protection is a broader concept reflectinginternational economic and social change. It includes:• Social security; also• Private or non-statutory schemes.
Social protection also includes:
• Occupational or employer-based schemes;• Community based support systems; and• Micro-insurance schemes.
3-Tier Social Protection Systems
Many social protection systems consist of three tiers orlayers of protection:
! 1st Tier — a social safety net providing basic protectionsuch as primary health care and subsistence levelincome security (which would ordinarily be providedby the State, financed from taxes). 1st Tier PensionSchemes are, therefore, normally non-contributory. Tothe extent that the option of a 1st tier pension has beenconsidered under the present project, it will be mentionedin the Feasibility Study on Social Assistance.
! 2nd Tier — Social insurance schemes financed bycontributions from employers and workers – providingincome maintenance benefits during periods ofinterruption of employment and a broader range ofhealth care with some redistribution of income withinand between generations. The pension scheme optionsdiscussed in this report are 2nd Tier Pension Schemes(except where stated otherwise).
! 3rd Tier — Supplementary (voluntary) private provisionby individuals, employers or occupational schemes forpension savings and health insurance.
Defined Benefit Schemes
In defined benefit schemes the rules or the insurancecontract (in a public scheme, the provisions of thelegislation) clearly define the benefit rights of members (inline with a range of criteria: replacement rate, referenceearnings, duration, etc.) while leaving the contribution rateand the financial system to be set by actuarial assessment.
IDefinitions

xxii
Definitions
Members are thus guaranteed (and can predict) entitlementto a benefit representing a certain rate of replacement oftheir former earnings. Responsibility for the scheme’ssolvency is borne by those who finance it, usually employersand workers, who may be required to supplement theircontributions or to raise the book reserves which providefor the benefit payments. Sometimes governmentscontribute directly to the Fund or meet part of theadministration costs and, in the case of a public schemeestablished by law, government stands behind the promisesmade by the legislation and is the ultimate guarantor.
Defined Contribution Schemes
In defined contribution schemes, only the contribution ratesand bases of calculation are determined in advance. Thebenefit is a direct product of the contributions paid togetherwith the return on their investment. Consequently, thefinancial risk is borne by the employees. Benefit levels canvary significantly, depending on how the investmentsperform. There are no guarantees in this regard becausethe employer makes no commitment as to the value of thepensions. On the other hand the cost of the scheme iseasier to control.
Social Security Financing
(i) Pay-As-You-Go (PAYG)
Under PAYG systems of financing, no funds are set asidein advance (except for a small contingency reserve) andbenefits plus administrative costs are paid from currentcontributions. Each worker and employer pays a monthlycontribution into a common fund from which pensions arepaid to current pensioners who have contributed duringthe years when they were working. Thus currentcontributors pay for the benefits of current pensioners andincome is transferred vertically between generations. Risksare shared under a PAYG scheme. For example if an
unmarried worker dies say, one year after retirement, hispension dies with him. If his twin brother, also single, livesuntil he is 95 years old, he will have been paid a monthlypension for the whole of his life. In PAYG funding for short-term benefits (e.g. maternity benefit or unemploymentbenefit) financing is again by current contributionsrepresenting horizontal income transfer (i.e. within the samegeneration).
Given the pattern of rising annual expenditures in socialinsurance schemes, contribution rates (as a percentage ofinsured earnings) tend to be low in the early years of ascheme and increase annually for many years thereafter.
(ii) Advance Funding
With advance funding systems the annual contribution andinvestment income will exceed annual outgo on benefitsand administrative costs in the early years allowing reservesto be built up that are available for investment. The returnon investments is then used to supplement contributionincome when the annual disbursement eventually exceedsthe annual contributions. This build-up of reserves duringthe early years delays the need to increase contributionrates. But the contribution rate should not exceed thecapacities of workers, employers and the economy tosupport it; the reserves generated should not exceed thecapacity of the country to absorb the investments; andcontribution rates should remain relatively stable forextended periods of time ¾ with only gradual increases.
(iii) Funding from Taxation
Some social security schemes, particularly social assistanceand residence-based schemes, are funded through taxation.As there is no direct link between the sums paid by anindividual by way of tax and the amount of benefit that heor she may receive, funding from taxation is generally lesspopular than other forms of social security financing.

1
General Background
The development of social security in Indonesia canbe seen as having had the following majorcharacteristics:• A strong reliance on the extended family and
communities to provide an informal social safety netagainst loss of income, ill health or other misfortune;
• Limited reliance on employers through labourlegislation reinforced by collective agreements, todirectly provide benefits such as wages duringsickness and maternity and on termination ofemployment;
• Only limited social insurance for the private sectorwith reliance on the provident fund system to providea lump sum on retirement;
• An integrated package of conditions of service andsocial benefits for civil servants and members of thearmed forces.
Responsibility for the different elements of the systemis spread between different Ministries and publicorganisations. The Department of Manpower andTransmigration is responsible for the labour legislationand for the supervision of Jamsostek and theimplementation of its related legislation; the Ministryof Finance acting for the Ministry of State OwnedEnterprises is responsible for the oversight of all publiclimited liability companies (Perseros such asJamsostek, Askes and Taspen) as well as for thesupervision of insurance companies and pensionschemes; the Ministry of Health is responsible for theprovision of health care but health insurance schemesare implemented by PT Jamsostek and PT Askes. Theresponsibility for Social Welfare has been passedbetween the National Social Welfare Agency, theMinistry of Health & Social Welfare and the Ministryof People’s Welfare. This division of responsibilitytogether with the absence of a clear strategy or anycoordinating mechanism has resulted in a piecemealapproach to social security development and to someuncertainty and policy inconsistency. There have alsobeen differing views as regards the respective rolesand responsibilities of the public and private sector in
PART I SOCIAL SECURITY DEVELOPMENT BACKGROUND
CHAPTER 1 THE ILO PROJECT — RESTRUCTURING THE SOCIALSECURITY SYSTEM
the provision of social security. The general inabilityof existing social security institutions to provideeffective social protection in response to the needsexposed by the crisis reopened general concerns as tothe structural weaknesses and the management of thesystem and in particular of Jamsostek. This linkedwith reports of political interference and themismanagement of funds stimulated calls for the reformof Jamsostek from various quarters.
The need to restructure the social security system and,in particular, to address the weaknesses of Jamsostekwere analysed by a National Steering Committee,established by the Ministry of Manpower in September1999 to work with ILO specialists. This culminated ina National Workshop on the Restructuring of SocialSecurity held in Jakarta on 16/17 November 1999 whichresulted in the following conclusions:• There is a need to define the respective roles of the
State, the private sector, employers and individualsin providing social protection and a strategy forreform of the social security system should be devisedon this basis;
• Jamsostek should remain the core of the system butits legal status should be changed to reflect this sothat it should be constituted on trust fund principleswith a tripartite supervisory body comprised ofrepresentatives of the Government, employers andworkers;
• There is a need to improve the benefit programmeto include, for example, pensions for private sectorworkers, extended access to health insurance,maternity benefits and to consider the feasibility ofunemployment benefit;
• The scheme should extend coverage to at least allthose who work as employees and progressively alsoto the self-employed;
• The investment programme of the scheme must beboth more professional and more transparent;
• The service to insured persons and employers mustbe improved and linked to prescribed performanceindicators and targets;
• Strengthening of compliance and enforcement wasessential and combined with improved service and
Part I Chapter 1

2
public relations would, to an extent, address thecoverage problem;
• The programme provided by Jamsostek should beuniversal and cover all employees: they would providea social protection floor of basic protection and privatesector provision and employer based schemes wouldbe essential to provide better benefits for those whosought them and who together with their employershad the resources to provide them.
The present legal status of Jamsostek under Law 3 of1992 as a Persero, a public limited liability companyrequired to make profits and pay taxes, is widelyconsidered to be inappropriate for a system based onState responsibility and constitutional rights.
Accordingly the government of Indonesia soughttechnical assistance from the ILO, with funding fromthe Royal Netherlands Government, to execute aproject to restructure the social security system. Theproject commenced on 1 April 2001 and wascompleted on 31 December 2002.
The strategy of the project was to reconstituteJamsostek as a public social security institution thatwill hold its members’ contributions in trust againstfuture benefit entitlement under the supervision of atripartite Board. Alongside this the project was to focuson the reform of the institution to ensure that it will beable to undertake the role envisaged as the core of thesocial security system in Indonesia entailing review ofthe organizational and administrative system aiming atimproved accountability and efficiency and improvedservice to the public.
On the basis that whatever improvements are made ingovernance and operating efficiency would still leavethe programme weaknesses, the project had a secondobjective of studying options for improvements in thebenefit programme including:• The feasibility of replacement or partial repayment
of the existing provident fund scheme (JHT) by aSocial Insurance Pension scheme;
• Improvements to the Occupational Injuries (JKK)scheme — to introduce pensions more fully intoemployment injury insurance for long-termcontingencies of serious disablement and death withinthe present financial system;
• The feasibility of converting the employers’ liabilityMaternity Benefit into a social insurance benefitby utilizing the same resources as are now expendedby employers — in order to overcome evasion andavoid discrimination against the employment offemale workers;
• The feasibility of introducing an UnemploymentBenefit Insurance scheme;
• The feasibility of introducing Social Assistance —establishing a basic social safety net to the mostvulnerable of the poor; and
• A Social Budget which analyses and projects totalsocial expenditure against anticipated income — thisto include an actuarial analysis and an assessmentof the administrative implications andrecommendations for policy decisions.
The project was also to undertake a special study toformulate policy options for the extension of coverageto those presently excluded i.e. those who work forsmall employers, the informal economy and the self-employed.
Immediate Objectives & OutputsThe immediate objectives of the Social SecurityReconstruction project related to the establishment ofa new institutional structure for the national socialsecurity scheme and to the development of a nationalstrategic plan for the restructuring of the social securitysystem. These objectives were detailed in the ProjectDocument as follows:IMMEDIATE OBJECTIVE 1:
The government will by the end of the project haveestablished an autonomous social securityorganisation based on trust fund principles underthe supervision of a tripartite Board of Directorswhose roles and responsibilities and relationshipwith Government are prescribed and understood.It will also have enhanced its capacity to managethe funds of the institution and have establishedan investment policy and management unit.
This immediate objective was to be achieved by anumber of outputs supported by activities such asworkshops, seminars and training — both in Indonesiaand through study tours overseas. The outputs wereto be:
Output 1.1.Legislation to amend the status of Jamsostek, todetermine the roles and responsibilities of theGovernment, the Board of Directors and theexecutive management of the scheme.
Output 1.2.Publicity material and presentation on new statusof Jamsostek.
Output 1.3.Establishment of the Board of Directors.
Part I Chapter 1

3
Output 1.4.Policy and code of practice on investment andfinancial management.
Output 1.5.Establishment of investment management Committeeand specialist unit.
IMMEDIATE OBJECTIVE 2
By the end of the project, the Government will haveformulated a national strategic plan for the reformand development of the social security system,based on studies which will have componentsrelating to improvement and expansion of thebenefit programmes, the extension of coverage tosections of the labour force at present excludedand to improvements in the capacity of the socialscheme administration to provide an effectiveservice to its members and to employers.
This immediate objective was to be achieved by thefollowing outputs, also supported by workshops,seminars and training:
Output 2.1.
Technical reports relating to studies conducted asto the design and costing of different policy optionsfor benefit programme reforms on —• A social budget which analyses and projects total
social expenditure against anticipated income;• The replacement or partial replacement of the JHT
provident fund by a defined benefit pensionscheme;
• The replacement of lump sum payments in respectof employment injury benefit by periodicpayments;
• The introduction of a maternity benefit schemebased on social insurance principles to replacereliance on employers liability provisions;
• The introduction of an unemployment insurancescheme;
• The establishment of a social assistance systemas a component of a permanent social safety net.
Output 2.2.
A Report setting out policy recommendations onthe extension of coverage to sections of the labourforce not covered and with regard to theimprovement in compliance of those who arecurrently liable to be covered under the schemebut not in practice within its scope.
Output 2.3.
Technical reports on the organisational andadministrative structure of Jamsostek includingrecommendations for improvements in efficiencyand customer service.
Separate reports on the benefit programme studiesreferred to above, a report on the provision of HealthCare under the Jamsostek JPK programme and thetechnical report on Jamsostek Operations and ITSystems will be published by the ILO and form thebasis of later Chapters in this publication. Alsoreproduced here is material from a special reportcommissioned by the project on the social safety netproject in Klaten, “Klaten Revisted”. A further studyof the state of Occupational Health and Safety (OHS)in Indonesia was commissioned from Ms PiaMarkkanen under the Project but will be publishedseparately by the ILO. OHS is actually classified bythe ILO under the wider term, ‘social protection’, ratherthan social security but it has important implicationsfor employment injury programmes since effectiveOHS measures can greatly reduce the incidence ofemployment injury and disease and consequently savebenefit costs.
The Reports took account of information gained fromindividual meetings between the Experts andrepresentatives of the principal stakeholders in socialsecurity in Government, Employers’ and Workers’Associations and other agencies. Views were alsogathered at a series of workshops held in Jakarta,Medan, Bandung, Makassar, Balikpapan and Surabayaduring January to March 2002 and a TechnicalConsultation meeting held jointly with Depnakertransand the Presidential Task Force in Jakarta on 28/29November 2002.
In the absence of decisions on the change of status,provisions for the nomination and appointment ofTrustees, the status of social security inspectors, etc.it was not possible to undertake all the related trainingand publicity activities anticipated in the projectdocument. However, a valuable study tour wasarranged for some senior staff of Jamsostek andDepnaker (including some commissioners), membersof the Presidential Task Force on Social SecurityReform and also for Jamsostek IT staff. This gaveexposure to social security activities in the AustralianDepartment of Family and Community Services (FaCS)and the servicing agency, Centrelink, in Canberra andSydney, Australia.
Part I Chapter 1

Part I Chapter 2
4
CHAPTER 2 OVERVIEW of SOCIAL SECURITY IN INDONESIA
GeneralSocial security in Indonesia is generally available onlyto people in formal employment and who are obligedor entitled to participate in a variety of social insuranceschemes. These schemes provide social insurancecover for retirement, work accident, health, maternityand death. The schemes are funded by contributionsfrom employers, employees or a combination ofcontributions from both.
The current social security provisions extend toemployees of the military, civil service and privatecompanies above a prescribed staff size and salary.The remainder of the population employed in smallerenterprises, self-employed in the informal employmentsector and the unemployed or aged, rely on privateinsurance or support from immediate and extendedfamilies and the local community.
In the short term it is likely that social securityprovisions may be extended to include more of thepeople employed in the formal sector and the self-employed. In the medium term additional programs ofunemployment benefits and social assistance toselected sectors of the population may be possible. Itis most likely that the extension of social securityentitlements to the entire population will be a long-termgoal.
Social Security ResponsibilitiesResponsibility for different elements of the socialsecurity system rests with various government
departments and public agencies. The Department ofManpower and Transmigration (Depnakertrans) isresponsible for Labour legislation, for Jamsostek andthe implementation of its related legislation. The Ministryof State Owned Enterprises is responsible for theoversight of all public limited liability companies1
(Persero’s like Jamsostek, Askes and Taspen). TheDepartment of Finance is responsible for thesupervision of insurance companies and private pensionschemes. The Department of Health is responsible forthe provision of Health care but Jamsostek and Askesimplement health insurance schemes. Social welfareis the responsibility of the National Social WelfareAgency.
The present social security program has developed ina piecemeal, uncoordinated way, however the needfor an integrated and nationally coordinated socialsecurity system has been recognised and theresponsibility for reform of social security in Indonesiarests with two national co-coordinating Ministries. TheCoordinating Ministry for Economy, Finance andIndustry is responsible for issues relating to therestructuring of social security. The CoordinatingMinistry for People’s Welfare and Poverty Alleviationis responsible for efforts to empower the poor throughpoverty alleviation policies and has established a SocialSecurity Reform Task force to co-ordinate the reformprocess. This task force and the coordinating Ministriesreport to the President of the Republic of Indonesia.The social security responsibilities are illustrated inFigure 1.
1 The limited liability company types and their titles are defined in the Glossary.

Part I Chapter 2
5
Figure 1 Social Security Responsibilities
SOCIAL SECURITY RESPONSIBILITIES

Part I Chapter 2
6
Regional Autonomy
Set against a backdrop of several decades of increasingcentral government authority, decentralization is aradical move. Redistributing administrative power andpublic revenues offers the hope of moderating long-term political problems, including those that have ledto intercommunity violence. Despite widespreadconcerns, the formal process of decentralization hasproceeded relatively smoothly and few servicedisruptions or staff problems have been reported andlocal governments appear to have made considerableefforts to meet their new responsibilities. However,major deficiencies remain in operating guidelines forlocal service providers, particularly in introducingminimum service standards and ensuring complianceand consistency between local regulations and nationalpolicies. Some national ministries have experiencedsome difficulties maintaining their formal links withsome provincial governments and the provision ofinformation and policy dissemination have not alwaysbeen uniform or regular. In addition, withdecentralization and the added responsibilities given todistrict governments, local governments have mademany attempts to increase their revenues by raisingtaxes and fees. Many of these measures threaten todiscourage trade, tourism, and business activities acrossregions. To ensure that the promise of decentralization
is fully met during implementation, the centralGovernment is addressing this and related problems.
The devolution includes the functions, responsibility,staff, property and resources of the Ministries andDepartments. Public companies and utilities such asJamsostek and five national Ministries2 are exemptedfrom the devolution process. The full impact of regionalautonomy on the operations of Depnakertrans and itsrelationship with Jamsostek has not yet been fullyqualified in all Provinces.
Government and Private EmployeesSocial Security Schemes
There are three major social security schemesoperating in Indonesia and these schemes providesocial insurance cover to civil servants employed ingovernment departments, the armed forces (anddefence civilian employees) and a limited group ofprivate employees. Limited liability private companiesmanage the programs and schemes and they are oversighted by the Department of Finance as the authorisedshareholder of the companies with the Minister ofFinance as the single shareholder in each of thecompanies.
A summary of the existing social security systems,their legal entities, contributions, benefits andmanagement institutions is shown in Figure 2.
2 The Ministries exempt from Regional Autonomy are Finance, Defence, Foreign Affairs, Justice and Religion.
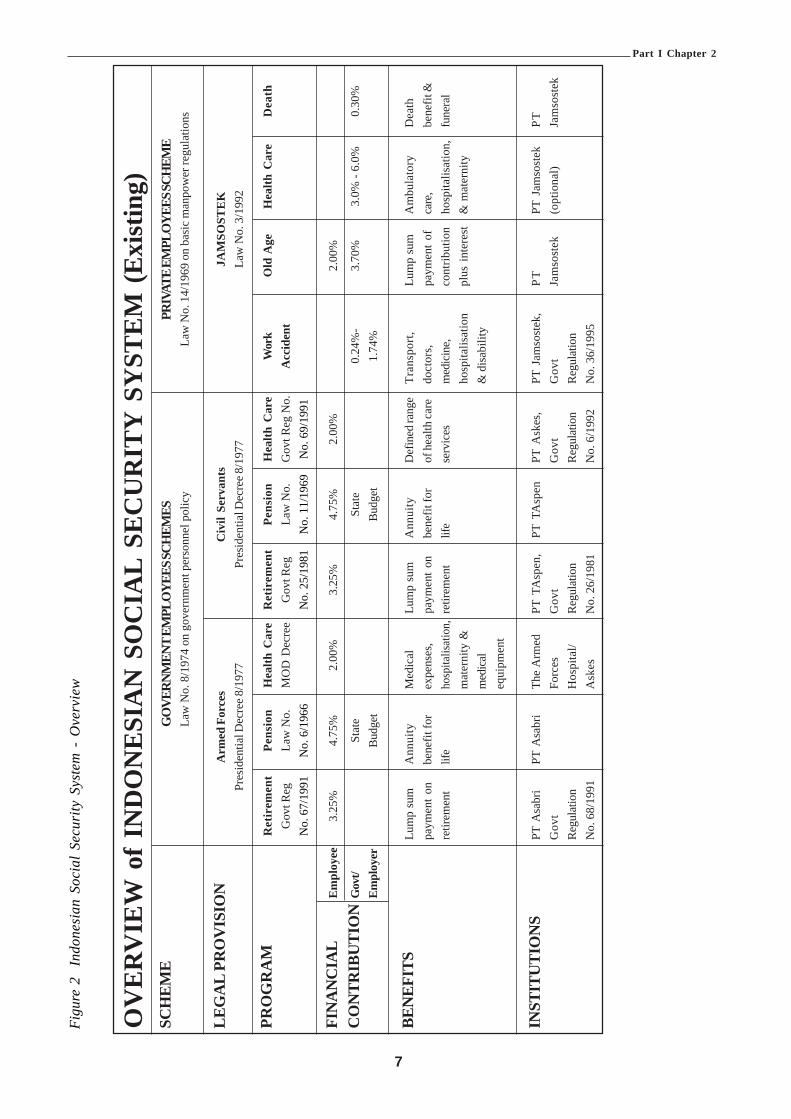
Part I Chapter 2
7
Fig
ure
2In
done
sian
Soc
ial
Secu
rity
Sys
tem
- O
verv
iew
OV
ERV
IEW
of
IND
ON
ESIA
N S
OC
IAL
SEC
UR
ITY
SY
STEM
(Ex
istin
g)SC
HEM
EG
OVE
RNM
ENT
EMPL
OYE
ES SC
HEM
ESPR
IVAT
E EM
PLO
YEES
SCH
EME
Law
No.
8/1
974
on g
over
nmen
t per
sonn
el p
olic
yLa
w N
o. 1
4/19
69 o
n ba
sic
man
pow
er re
gula
tions
LEG
AL
PRO
VIS
ION
Arm
ed F
orce
sC
ivil
Serv
ants
JAM
SOST
EK
Pres
iden
tial D
ecre
e 8/1
977
Pres
iden
tial D
ecre
e 8/1
977
Law
No.
3/1
992
PRO
GR
AM
Ret
irem
ent
Pens
ion
Hea
lth C
are
Ret
irem
ent
Pens
ion
Hea
lth C
are
Wor
kO
ld A
geH
ealth
Car
eD
eath
Gov
t Reg
Law
No.
MO
D D
ecre
eG
ovt R
egLa
w N
o.G
ovt R
eg N
o.A
ccid
ent
No.
67/
1991
No.
6/1
966
No.
25/
1981
No.
11/
1969
No.
69/
1991
FIN
AN
CIA
LE
mpl
oyee
3.25
%4.
75%
2.00
%3.
25%
4.75
%2.
00%
2.00
%
CO
NTR
IBU
TIO
NG
ovt/
Stat
eSt
ate
0.24
%-
3.70
%3.
0% -
6.0%
0.30
%Em
ploy
erBu
dget
Budg
et1.
74%
BEN
EFIT
SLu
mp
sum
Ann
uity
Med
ical
Lum
p su
mA
nnui
tyD
efin
ed ra
nge
Tran
spor
t,Lu
mp
sum
Am
bula
tory
Dea
thpa
ymen
t on
bene
fit fo
rex
pens
es,
paym
ent o
nbe
nefit
for
of h
ealth
care
doct
ors,
paym
ent
ofca
re,
bene
fit &
retir
emen
tlif
eho
spita
lisat
ion,
retir
emen
tlif
ese
rvic
esm
edic
ine,
cont
ribut
ion
hosp
italis
atio
n,fu
nera
lm
ater
nity
&ho
spita
lisat
ion
plus
int
eres
t&
mat
erni
tym
edic
al&
dis
abili
tyeq
uipm
ent
INST
ITU
TIO
NS
PT A
sabr
iPT
Asa
bri
The
Arm
edPT
TA
spen
,PT
TA
spen
PT A
skes
,PT
Jam
sost
ek,
PTPT
Jam
sost
ekPT
Gov
tFo
rces
Gov
tG
ovt
Gov
tJa
mso
stek
(opt
iona
l)Ja
mso
stek
Regu
latio
nH
ospi
tal/
Regu
latio
nRe
gula
tion
Regu
latio
nN
o. 6
8/19
91A
skes
No.
26/
1981
No.
6/1
992
No.
36/
1995

Part I Chapter 2
8
Labour Force and Social Security Membership
3 Source BPS4 Source B. Purwoko, July 2001 (for Jamsostek totals). Other totals are from BPS and Taspen.5 This figure includes the public service but does NOT include the military where manning levels remain confidential.6 The Additional potential Jamsostek members total shown in figure 4 is understated because it has been derived from the difference
between the Formal labour force sector and Jamsostek members’ statistics. The total number of Jamsostek members (18.6 million)includes the multiple records and members already paid retirement benefits. A more accurate representation of the Jamsostekmembers’ is about 9.3 million which represents only about one third of the potential formal sector employees. See figure 7 forJamsostek membership details.
An overview of the labour force and some of the socialsecurity membership is shown in Figure 3. It should benoted that the main retirement schemes, work injuryand death benefits schemes are shown. The healthcare schemes are not shown as the Jamsostek Health
Insurance scheme has an opt out clause for employerswho provide for equivalent private health care for theiremployees and current membership of the Jamsostekhealth care program is about 1.3 million workers andcovers a total of 2 million including families.
Figure 3 Table of Labour force and Social Security Statistics
No. Item 19993 20014
(millions) (millions)
1 Population aged 15 years and over 141.10 144.032 Labour force 94.85 98.813 Labour force employed 88.82 90.814 Formal sector (employers with legal entity) 26.65 27.305
5 Informal sector (employers without legal entity) 62.17 63.516 Job seekers 6.03 8.007 Jamsostek members (total data records held) 16.42 18.608 Additional potential Jamsostek members 10.23 8.709 Estimated Actual Jamsostek Individual Contributors6 9.3
10 Estimated Maximum Additional Jamsostek Contributors (formal sector 13.98less Jamsostek actual less Civil service i.e. line 4 – 9 – 11)
11 Civil Service (Taspen Civil service Pension scheme contributors) 4.0212 Taspen Pensioners 1.7813 Population below poverty line aged 15 years and over 48.00 48.0014 Taxpayers (Tax file number holders - includes 600,000 companies) 2.20
The formal employment sector represents about 30%of the labour force and this is the current capture groupfor Jamsostek membership. The employer groups ex-cluded under current legislation are those employerswith less than 10 employees AND a monthly grosspayroll of less than Rp. 1 million. The legislation does
not restrict compulsory contribution to Jamsostek tothe enterprises with legal entities (formal sector) andif the legislation is interpreted as its original intent, thenthe potential capture group for Jamsostek could be ashigh as 70% of the workforce.
9
Executive Summary
Immediate objective 1 of the ILO Project envisagedthe establishment of a new institutional structure forthe national social security scheme and thus focusedon Jamsostek. The rationale for this was that thepresent legal status of Jamsostek under Law 3 of 1992as a Persero, a public limited liability company requiredto make profits and pay taxes, is widely considered tobe inappropriate for a system based on Stateresponsibility and constitutional rights. The strategyof the project was to reconstitute Jamsostek as a publicsocial security institution that will hold its members’contributions in trust against future benefit entitlementunder the supervision of a tripartite Board. Alongsidethis the project was to focus on the reform of theinstitution to ensure that it will be able to undertake therole envisaged as the core of the social security systemin Indonesia entailing review of the organizational andadministrative system aiming at improved accountabilityand efficiency and improved service to the public.
The change of status of Jamsostek to a trust fund —new Jamsostek, ‘Jamsostek Baru’ — implies that itwill enjoy a measure of independence from theGovernment in its day-to-day operations as well as itslonger-term policy direction. Government supervisionwould be replaced with supervision by the tripartiteboard of trustees. This more direct and focused controlis expected to lead to improved public perception ofJamsostek as a social security institution and help meetthe two important conclusions about Jamsostekreached at the 1999 workshop on restructuring thesocial security system which were:
• “The service to insured persons and employers mustbe improved and linked to prescribed performanceindicators and targets”; and
• “Strengthening of compliance and enforcement isessential and, combined with improved service andpublic relations should, to an extent, address thecoverage problem”.
PART II JAMSOSTEK
Many meetings were held on the status of Jamsostekand an informal consensus reached that the Perseroshould be changed to a Trust Fund supervised by atripartite Board. Workshops were also held in Jakartaand 5 Regions confirming the central consensus. Butdespite the fact that a Bill to amend Law No.3 of 1992went to the House of Representatives during thecourse of the project, further capacity building wasconsidered necessary before an informed, formalconsensus could be reached. It was hoped that thismight be achieved during a possible extension to theproject but, although the project was finally extendedtwice — firstly to 31st October (with a break duringJune and July) and subsequently to the end of 2002 —little further progress was made towards achieving thisoutput. However, after the description of JamsostekProgrammes that follows this summary, the ILOrecommendations on the need for a change of status,options for such change and proposals for a processby which such change could be achieved are discussedin this Part. The need for an independent, tripartitebody to supervise policy development, investments, etc.in the interests of the members brings into questionpressures to expand Jamsostek core business fromsimply collecting contributions and paying benefits towider, commercial ventures. The implications of thisare also discussed.
The 1999 national workshop that conceived the recentILO project also drew attention to the need to improvethe efficiency of Jamsostek operations and this Partalso describes the detailed study conducted intoJamsostek Operations & IT Systems. The report ofthis study indicates operational improvements andpaves the way for establishing MIS systems that maybe used to monitor the achievement of performanceindicators. But these will have to be devised andnegotiated as the systems are developed and link inwith possible changes in the management system andculture, including support for human resourcesdevelopment of Jamsostek Baru. It is believed thatfurther technical assistance will be necessary toestablish the new management control systems that
Part II Executive Summary

1 0
could form part of a second phase project designed tofurther strengthen Jamsostek.
The workshop also identified as a major weakness,the enforcement of compliance that the study estimatedto be as low as 40%. This has implications for thesustainability of most, if not all, of the Jamsostek benefitprogramme and the ILO Project recommendedstrongly that the responsibility for this should be movedfrom Depnaker/Dinas to Jamsostek itself. The projectteam obtained the views of government and socialpartners on ways of improving the control of complianceand there was a general consensus that Jamsostekinspectors should replace the present enforcement bylabour inspectors. A potential stumbling block to thisseemed to be the legal requirement that lawenforcement could only be undertaken by governmentofficials, although a possible way around this might beto second labour inspectors to Jamsostek. But nodecision on this issue was reached before the end ofthe project. Inevitably changing the responsibility forenforcement to Jamsostek will have implications for
human resources, particularly recruitment, training andcareer structure. The issues are discussed later in thisPart.
The need to improve compliance with the Jamsosteklaw raises the issue of simplification of the contributionsstructure and gave rise to recommendations that aunified contribution rate would not only make detectionand enforcement less complicated than the presentdifferential rate for both the employment injury andseparate health care programme but also be in linewith the general direction towards social insuranceprinciples of shared risk. The issues are discussed laterin this Part.The Jamsostek investment provisions were studied bythe ILO Actuary and are dealt with in the separatereport: “Report to the Government on the Financingand Investment of Jamsostek and Social Budgeting inIndonesia”. Investment issues from this report arediscussed later in Part II and the social budget in PartIV of this Publication.
Part II Executive Summary

1 1
Rangkuman Eksekutif
Tujuan jangka pendek yang pertama dari Proyek ILOini ialah menginginkan adanya pembentukan strukturkelembagaan baru bagi skema jaminan sosial nasionaldan karena itu difokuskan pada Jamsostek. Alasannyaadalah bahwa status hukum PT Jamsostek saat inimenurut UU No. 3/ 1992 sebagai Persero, yaitu suatuperusahaan perseroan terbatas umum yang dituntutuntuk menghasilkan laba dan membayar pajak, dinilaitidak cocok untuk suatu sistem yang dibentukberdasarkan tanggung jawab Negara dan hak-hakkonstitusional. Strategi proyek ini diharapkan dapatmerekonstitusi (membentuk ulang) PT Jamsosteksebagai suatu lembaga jaminan sosial umum yangmengelola iuran-iuran yang dipercayakan kepadanyaoleh para anggotanya di bawah pengawasan suatuDewan Tripartit untuk nantinya dikembalikan sebagaihak atas manfaat di masa yang akan datang. Seiringdengan itu, proyek ini diharapkan dapat difokuskan padaupaya mereformasi lembaga Jamsostek itu sendiri gunamemastikan bahwa lembaga tersebut akan sanggupmenjalankan peran yang diharapkan sebagai inti sistemjaminan sosial di Indonesia yang memerlukan suatukajian ulang terhadap sistem organisasi dan administrasiyang ada dengan tujuan untuk meningkatkanpertanggungjawaban, effisiensi dan perbaikanpelayanan kepada masyarakat.
Perubahan status Jamsostek menjadi dana wali amanat— ‘Jamsostek Baru’ — menyiratkan bahwaJamsostek akan mandiri dan tidak lagi tergantung padaPemerintah baik dalam operasinya sehari-hari maupundalam penetapan arah kebijakan jangka panjang yangdiambilnya. Pengawasan Pemerintah akan digantikandengan pengawasan oleh dewan wali amanat yangbersifat tripartit. Kendali yang lebih langsung danterfokus ini diharapkan akan dapat memperbaikipersepsi publik terhadap Jamsostek sebagai lembagajaminan sosial serta ikut membantu mewujudkan keduakesimpulan penting tentang Jamsostek yang dicapaidalam lokakarya tahun 1999 mengenai restrukturisasisistem jaminan sosial, yaitu:
• “Pelayanan kepada orang-orang yangdiasuransikan dan pengusaha harus ditingkatkan
dan dikaitkan dengan indikator dan sasaran kinerjayang telah ditetapkan sebelumnya”; dan
• “Meningkatkan kepatuhan dan penegakanmerupakan upaya yang amat penting dan, biladikombinasikan dengan perbaikan pelayanan danhubungan masyarakat, pada suatu tingkat tertentuhendaknya akan dapat mengatasi masalahkurangnya kepesertaan anggota.”
Telah banyak dilakukan pertemuan untuk membahasstatus Jamsostek dan telah dicapai suatu konsensusinformal bahwa status Persero yang dimiliki PTJamsostek saat ini sebaiknya diubah menjadi suatu DanaWali Amanat (Trust Fund) yang ditempatkan di bawahpengawasan suatu Dewan tripartit. Konsensus pentingini telah mendapat konfirmasi dalam lokakarya-lokakarya yang diselenggarakan baik di Jakarta maupundi lima daerah lain di Indonesia. Meskipun selamaberlangsungnya proyek ini, suatu RUU untukmengubah UU No. 3 Tahun 1992 telah diajukan keDPR, masih perlu dilakukan pemberdayaan kapasitaslebih lanjut sebelum dapat tercapai suatu konsensusformal dapat tercapai. Konsensus formal ini diharapkandapat dicapai dalam jangka waktu perpanjanganproyek. Tetapi, meskipun proyek ini pada akhirnya telahdiperpanjang hingga dua kali — yang pertamadiperpanjang hingga tanggal 31 Oktober (dengan jedaselama bulan Juni dan Juli) dan kemudian diperpanjanglagi hingga akhir tahun 2002 — tak banyak kemajuanyang diperoleh dalam mencapai keluaran ini. Kendatidemikian, setelah pemaparan mengenai program-program Jamsostek yang mengikuti rangkuman ini,Bagian ini mendiskusikan rekomendasi-rekomendasiILO mengenai perlunya melakukan perubahan status,pilihan-pilihan untuk perubahan tersebut serta proposal-proposal bagi suatu proses untuk mewujudkanperubahan tersebut. Perlu adanya suatu badan tripartitindependen untuk mengawasi penyusunankebijaksanaan, investasi dan hal-hal lain bagikepentingan anggota membuat tekanan-tekanan untukmemperluas operasi inti Jamsostek dari sekedarmengumpulkan iuran dan membayar manfaat keusaha-usaha komersial yang lebih luas menjadi suatuhal yang patut dipertanyakan. Implikasi-implikasi yangtimbul dari hal ini juga didiskusikan.

1 2
Lokakarya nasional tahun 1999 yang menjadi titik tolakproyek ILO ini juga menyoroti perlunya upayameningkatkan efisiensi (daya guna) operasi Jamsostekdan, sehubungan dengan itu, Bagian ini jugamemberikan penjelasan mengenai studi rinci yang telahdilakukan terhadap sistem operasi dan teknologiinformasi PT Jamsostek. Laporan studi tersebutmemberikan petunjuk mengenai perbaikan-perbaikanoperasional yang perlu dilakukan serta membuka jalanbagi pembentukan sistem-sistem manajemen informasiyang dapat digunakan untuk memantau pencapaianindikator-indikator kinerja. Tetapi sistem-sisteminformasi manajemen tersebut nantinya akan harusdisusun dan dinegosiasikan pada saat sistem-sistem inidikembangkan dan dihubungkan dengan perubahan-perubahan yang mungkin terjadi dalam sistemmanajemen dan budaya, termasuk dukungan bagipengembangan sumber daya manusia Jamsostek Baru.Kami berkeyakinan bahwa bantuan teknis lanjutanakan diperlukan untuk membentuk sistem-sistempengawasan manajemen baru yang dapat menjadibagian dari suatu proyek tahap kedua yang dirancanguntuk lebih memberdayakan Jamsostek.
Lokakarya nasional tahun 1999 tersebut jugamenyebutkan bahwa kelemahan utama Jamsostekterletak pada penegakan kepatuhan, yang dalam studitersebut diperkirakan serendah 40%. Rendahnyapenegakan kepatuhan ini menimbulkan implikasi-implikasi terhadap kesinambungan sebagian besar,kalau tidak dapat dikatakan seluruh, program manfaatJamsostek. Karena itulah, Proyek ILO ini sangatmenyarankan supaya tanggung jawab atas penegakankepatuhan dialihkan dari Depnaker/ Disnaker keJamsostek. Tim proyek ini memperoleh pandangan-pandangan dari pemerintah dan para mitra sosialmengenai cara-cara memperbaiki pengawasankepatuhan. Di samping itu telah ada suatu konsensusumum bahwa para pengawas dari Jamsostek
hendaknya bertugas melakukan penegakan mengganti-kan tugas penegakan yang saat ini masih dijalankanoleh pegawai pengawas ketenagakerjaan. Yangtampaknya berpotensi menjadi batu sandungan terhadapupaya pengalihtugasan ini adalah ketentuan hukumyang menetapkan bahwa penegakan hukum hanyadapat dilakukan oleh pejabat pemerintah, meskipunsebenarnya ketentuan ini dapat disiasati denganmemperbantukan pegawai pengawas ketenagakerjaanDepnaker ke Jamsostek. Sayangnya, tidak adakeputusan yang dicapai mengenai hal ini sebelumproyek ini berakhir. Tak terelakkan lagi, pengalihantanggung jawab penegakan dari Depnaker keJamsostek akan memberikan implikasi-implikasiterhadap sumber daya manusia, terutama yangmenyangkut perekrutan, pelatihan dan struktur karir.Hal-hal ini dibahas lebih lanjut dalam Bagian ini.
Adanya kebutuhan untuk meningkatkan kepatuhanterhadap ketentuan undang-undang Jamsostekmenimbulkan pemikiran untuk menyederhanakanstruktur iuran serta merekomendasikan bahwa suatutingkat iuran yang seragam tidak saja akan membuatpendeteksian dan penegakan menjadi lebih sederhanadaripada tingkat iuran yang saat ini berbeda-beda untukprogram jaminan kecelakaan kerja maupun programjaminan perawatan kesehatan tetapi juga sesuaidengan arah arah umum prinsip asuransi sosialmengenai risiko pertanggungan. Hal-hal inilah yangakan dibahas kemudian dalam Bagian ini. Ketentuan-ketentuan yang berkaitan dengan investasi Jamsostektelah dipelajari oleh Aktuaris ILO dan dibahas dalamsuatu laporan tersendiri berjudul “Laporan kepadaPemerintah mengenai Keuangan dan InvestasiJamsostek dan Penyusunan Anggaran Sosial diIndonesia.” Masalah-masalah yang berkaitan denganinvestasi dari laporan ini dibahas dalam Bab IIsedangkan hal-hal mengenai anggaran sosial dibahasdalam Bagian IV dari Publikasi ini.

1 3
Figure 4. Table of Membership Statistics
Employees Active Inactive Claimants TotalMales 6,309,902 4,074,907 2,322,971 10,649,568Females 3,072,884 1,694,920 995,560 5,763,364
TOTAL 9,382,786 5,769,827 3,318,531 18,471,144
CHAPTER 3 JAMSOSTEK SOCIAL SECURITY PROGRAMMES
7 Concentrating on formal sector employers is an administrative decision and not a legislative requirement.8 This reflects the fact that using the average contribution wage of 480,000 Rp per month then in reality only employers with two or less
employees would be exempt from contribution. i.e. only about 5 – 10% of employees would work for an employer exempt fromcompulsory contribution. Source BPS employment statistics 2000.
9 Source Jamsostek IT Bureau 13 September 2001
Part II Chapter 3
BackgroundIn 1992 PT Jamsostek was inaugurated by assumingthe social insurance functions of Astek (formed in 1977)and extending the range of programmes provided byAstek from retirement and death benefits to includework accident insurance and health care. In 1993 theJamsostek retirement programmes, the range of eligibleemployees was extended from employers with at least100 employees in addition to a monthly gross payrollof Rp. 5 million to employers having at least 10 staffand gross payroll of Rp. 1 million per month.The limited company status of Jamsostek (Persero)also introduced a taxation liability on company profit(but not on investment earnings) that has served tolimit the growth of investments and subsequent returnto contributors. Some of the profit is returned toJamsostek by the Ministry of Finance to support specialworker programs and in 2001 this included funding forworkers’ hospitals. Legislation is being prepared to alterthe status of Jamsostek from a Persero to a publictrust managed by a tripartite board and the effect ofthis legislation will be to remove the taxation liabilityfrom the profit of the institution. The no profit incomefrom investments is to be returned to members asincreased benefits.The legal status of PT Jamsostek is discussed in moredetail in Chapter 4.
Jamsostek ProgramsJamsostek is responsible for the administration of thefollowing social insurance programs:
• Old Age Jaminan Hari Tua (JHT)Benefit Scheme
• Employment Accident Jaminan KecelakaanBenefit Scheme Kerja (JKK)
• Death Benefits Scheme Jaminan Kematian (JKM)• Health Care Jaminan Pemeliharaan
Benefit Scheme Kesehatan (JPK)The Retirement program is a provident fund based onindividual accounts, providing for a variable rate of benefitbased on the contributions and interest credited to theaccount over the life of the membership. The remainderof the programs are provident funds based on groupaccounts that provide a standard fixed rate of benefitsbased on the legislation, regulations and decisions madeby the board of management.A summary of theJamsostek programs is shown in Figure 4.
Statistical Overview of JamsostekProgramsThere were 97,499 employers registered withJamsostek as at July 2001. Of these, 74,966 were activeand 22,533 were inactive. The estimated potentialnumber of eligible employees i.e. from formal sector7
employers with 10 or more employees or monthly grosspayroll exceeding Rp.1 million is about 27.3 millionformal sector employees8 or active contributors. Thecurrent employee members for the JamsostekProvident Fund, Work Injury and Death Benefitsprograms are shown in the table below9.
The Active membership statistics comprise only thosemembers currently registered and contributing to thefund. The Inactive members’ statistics comprise:• Members now unemployed and with less than five
years of contributions;• Members who have changed employment to an
ineligible employer or self employment and do notexercise their rights to continue to contribute to thefund;
• Unemployed Members who have chosen to retaintheir investment in the fund;
• Members who have discontinued contributions forreasons of employer bankruptcy;
• Members deceased and where family have notclaimed their entitlement; and
• Members who are now contributing throughanother employer and the previous record(s) areinactive.
The Claimants statistics represent the number ofmembers who have claimed their retirement benefitentitlements during the period 1978 to 2000.

1 4
JAM
SOST
EK P
RO
GR
AM
S -
OV
ERV
IEW
PRO
GR
AM
S an
d PA
YM
EN
TS
of B
EN
EFI
TS
Figu
re 5
Jam
sost
ek P
rogr
ams
Ove
rvie
w
Prog
ram
Type
of
Sche
me
Cur
rent
Law
Des
crip
tion
Cov
erag
e
Con
trib
utio
ns
Ben
efit
s
Ret
irem
ent
Prog
ram
Prov
iden
t Fun
d
Prov
iden
t Fu
nd
Ben
efit
s in
Gov
ernm
ent R
egul
atio
n N
o. 1
4/19
93
Prov
ides
for
age
ret
irem
ent
and
for
com
puls
ory
early
retir
emen
t as a
resu
ltof
inva
lidity
or u
nem
ploy
men
t
Com
puls
ory
for
all
wor
kpla
ces
with
at l
east
10
empl
oyee
s or
a m
onth
lypa
yrol
l of R
p. 1
mill
ion
Empl
oyer
– 3
.7%
of g
ross
wag
esEm
ploy
ee –
2%
of g
ross
wag
es
Prov
ides
lum
p su
m o
f co
mbi
ned
cont
ribu
tion
s pl
us
inte
rest
or
perio
dica
l pay
men
ts fo
r the
follo
win
glif
e ev
ents
of t
he m
embe
r:!
At a
ge 5
5 ye
ars,
!To
tal p
erm
anen
t dis
abili
ty,
!B
enef
its to
the s
urvi
ving
spou
se o
rch
ildre
n in
the
eve
nt o
f de
ath
ofm
embe
r bef
ore a
ge 5
5 ye
ars
!W
hen
mem
bers
hip
ceas
es d
ue t
oun
empl
oym
ent a
fter a
t lea
st 5
yea
rsm
embe
rshi
p
Life
Pro
gram
Dea
th B
enef
its S
chem
e
Dea
th
Ben
efit
s pr
ovis
ions
in
Gov
ernm
ent R
egul
atio
n N
o. 1
4/19
93
This
pro
gram
cove
rs lo
ss o
f life
dur
ing
and
with
in t
he w
ork
area
or
due
toill
ness
or n
atur
al c
ause
s
Com
puls
ory
for
all w
orkp
lace
s w
ithat
lea
st 1
0 em
ploy
ees
or a
mon
thly
payr
oll o
f Rp.
1 m
illio
n
Empl
oyer
– 0
.3%
of g
ross
wag
es
Prov
isio
n of
pay
men
ts fo
r:!
Fune
ral e
xpen
ses o
f Rp.
1,0
00,0
00,
!D
eath
allo
wan
ce o
f Rp.
5,0
00,0
00
Acc
iden
t Pr
otec
tion
Empl
oym
ent A
ccid
ent S
chem
e
Empl
oym
ent A
ccid
ent p
rovi
sion
s in
Gov
ernm
ent R
egul
atio
n N
o. 1
4/19
93
This
pro
gram
cov
ers
wor
k re
late
dac
cide
nts
at w
ork
and
incl
udes
trave
lling
to o
r fro
m w
ork
Com
puls
ory
for
all w
orkp
lace
s w
ithat
lea
st 1
0 em
ploy
ees
or a
mon
thly
payr
oll o
f Rp.
1 m
illio
n
Empl
oyer
0.2
4% -
1.7
4% o
f gr
oss
wag
es
The
Acc
iden
t ben
efits
are
:!
Tran
spor
tatio
n co
sts
!C
osts
of
med
ical
exa
min
atio
ns,
med
icin
al tr
eatm
ent a
nd n
ursi
ng!
Reh
abili
tatio
n ex
pens
es!
Mon
etar
y al
low
ance
s fo
r pa
rtial
perm
anen
t in
vali
dity
, to
tal
perm
anen
t in
vali
dity
, lo
ss o
ffu
nctio
ns, a
nd d
eath
allo
wan
ce
Hea
lth C
are
Hea
lth C
are S
chem
e
Hea
lth C
are
prov
isio
ns i
n G
over
nmen
tR
egul
atio
n N
o. 1
4/19
93
The
Hea
lth C
are
prog
ram
pro
vide
s fo
rho
spita
l an
d m
edic
al t
reat
men
t fo
r th
em
embe
r, sp
ouse
and
nat
ural
chi
ldre
n.
Com
puls
ory
for a
ll w
orkp
lace
s with
at le
ast
10 e
mpl
oyee
s or a
mon
thly
pay
roll
of R
p.1
mill
ion.
Exe
mpt
ions
are
allo
wed
for
empl
oyer
s th
at h
ave
prov
ided
sim
ilar
heal
th c
are
serv
ices
for e
mpl
oyee
s.
Empl
oyer
– 3
% (s
ingl
e) o
r 6%
(fam
ily) o
fgr
oss w
ages
The
Hea
lth c
are
bene
fits a
re:
!Pr
imar
y ou
t-pat
ient
car
e!
Subs
eque
nt o
ut-p
atie
nt c
are
!In
-pat
ient
hos
pita
l car
e!
Pre
nata
l, de
liver
y an
d po
st n
atal
car
e!
Dia
gnos
tic s
uppo
rt!
Spec
ial c
are
!Im
med
iate
lif
e sa
ving
em
erge
ncy
serv
ices
!M
axim
um o
f Rp.
6,5
00,0
00
Part II Chapter 3

1 5
Social Security Coverage of theGeneral Population in IndonesiaSocial Security is currently provided to a small minorityof the population with only about 13.5 million workerscovered by the Taspen, Asabri and Jamsostek schemesout of a total workforce of about 98 million people(including job seekers). This means that only about14% of workers are currently covered by mainstreamsocial security schemes. This excludes health insurancewhich has more extensive coverage by means ofgovernment, private and micro schemes. The main itemsof legislation that relates to the non-governmentworkers social security scheme and in particular torights and obligations of contribution to the schemeare shown below.
Health CareThe Jamsostek health care scheme covers workermembers, spouse and the first 3 children only. Article2(4) of Government Regulation No.14 of 1993 providesthat employers with their own private health care
provisions may opt out of the Jamsostek HealthInsurance component of the system if the benefits theyprovide for their employees are ‘superior to the basicHealth Care Package’. This has resulted in someadverse selection with better-paid workers more likelyto be covered by private (or employer-funded) schemeswith the lower-paid, more vulnerable workers coveredby Jamsostek. The risk pool is in consequence muchsmaller and with a lower level of funding than it shouldbe. The year 2002 estimate of the number of personscovered by the Jamsostek scheme was 2.7m persons(of whom 1.3 m were workers). The coverage of thepublic sector health care scheme (Askes) wasestimated to be 13.8m (plus 0.72 m ‘commercial’members). Thus only some 17.22 m people inIndonesia (with a population of 208 m) are covered bythe formal health insurance schemes — leaving 91.8%of the population excluded. Even adding in thosecovered by private health insurance, there areestimated to be 85% of the population excluded.
Part II Chapter 3
1 6
implications of trust fund status and no generalagreement on how to proceed to transform PTJamsostek into a trust fund. Law No. 11 of 1992 onthe establishment of pension funds (dana pensiun) isthe closest in concept (in that it provides for full returnof proceeds from contributions, etc. to be returned tomembers through future benefit and provides forcontrol by a board consisting of representatives ofemployers, members and the bank in which the fund iskept in trust; the board in turn is controlled by theMinistry of Finance).
Similarly, although there is an informal consensus infavour of there being tripartite supervision of the trustfund, no informed, formal consensus has been reachedon the detail. Such important issues such as qualificationand procedures for nomination, appointment androtation or dismissal of trustees, conduct of Boardbusiness (including such issues as quorum), methodsof accountability, etc. are still undecided.
The essential features of social security trust fundsare:
They are Independent from Government;• Income and investments (assets) are held in trust
for the Members;
• Assets are used exclusively for the benefit ofMembers;
• Investment income is generally free of tax andreturned to Members in increased benefits.
While Jamsostek is run as a Persero:• Financial control is by Ministry of Finance/ State-
owned Enterprises and Operational control is byDepnaker;
• Investment is controlled by Finance, although thisshould be in accordance with the InvestmentRegulations (No. 28 of 1996);
• Dividends are paid to the single Shareholder (Govt.);• Profits are taxable.
While the social security scheme continues to be runas a government ‘milch cow’:• There is a Profit motive but little direct motivation
for Depnaker to ensure that contribution income ismaximized. Historically (as shown by a cumulative
10 Prof. Sentanoe Kertonegoro 2002.
CHAPTER 4 STATUS OF JAMSOSTEK
Part II Chapter 4
The private sector social security in Indonesia wasoriginally administered through the social securityfoundation, Yayasan Dana Jaminan Sosial under theMinistry of Manpower. Government Regulation No.34 of 1977 transformed this foundation intoPeperusahaan Umum Astek (Perum Astek for short)with profits shared with government. The present socialsecurity institution administering the scheme for theprivate sector is Perseroan Terbatas Jaminan SosialTenaga Kerja (translated as: limited liability companyfor employees’ social security), abbreviated to PTJamsostek. The status of PT Jamsostek as a Persero,or State-owned limited liability company is requiredunder the ‘Jamsostek Law’ — Law No. 3 of 1992.Under the provisions of Law No.1 of 1995 the Statemust be the majority shareholder of a Persero. In thecase of PT Jamsostek all the shares are State-owned.Ownership used to be vested in the Ministry of Financebut currently Minister of State-owned Enterprises isthe sole shareholder10. However, it is understood thatin practice the supervision is still carried out in theMinistry of Finance. This current status means thatPT Jamsostek must operate to generate a profit for itsshareholder and, like other limited liability companiesoperating on a commercial basis, the profit earned istaxable. In year 2000 Jamsostek paid a dividend to theMinistry of Finance of Rp.110 billion and tax of Rp. 3billion. The daily newspaper, Kompas, reported on 15th
April 2002 that the profit earned by Jamsostek in theyear 2001 was Rp.320.6 billion — an increase of 40%.
In the past the profit orientation of Jamsostek has givenrise to suggestions that the system should be open tocommercial competition and that the monopoly statusof PT Jamsostek should be removed. However, theinternational view and that now widely held in Indonesiais that profit-taking is inappropriate for a social securityscheme and that in the absence of a profit motive,monopoly status is appropriate.
The consensus in favour of changing the status ofJamsostek to that of a trust fund has been formingover a number of years and several attempts havebeen made to draft legislation to amend the JamsostekLaw to effect this change. However, in the absenceof a law (similar to those relating to Persero,Perum,etc.) to regulate the constitution andadministration of trust funds in Indonesia (a so-called‘Trustee Law’), there is no wide understanding of the

1 7
index over the period 1978 to 2000)11 income frominvestment has been 38% below the level of inflationand 63% less than the average market rate, althoughthere is some improvement since. Thus the net resultof the Government’s stewardship of the socialsecurity scheme indicates that less than half of thecontributions due to be paid have been collected withvery little effort to enforce compliance — and therehas been a negative real return on the investment ofthose that have been collected. Meanwhile largesums in dividends and taxation have been channelledaway from direct benefit to the members — directlycounter to the objectives of the principles of socialsecurity.
• There is the possibility of competition (there is alreadya measure of competition for business in the healthcare market) but this is not necessarily ‘healthy’competition;
• There are complex, arcane control mechanisms butthey do not help efficiency or transparency.
The decentralization process has further complicatedthe line of operational control. During the currency ofthe project a number of attempts were made by ILOexperts to establish what measure of policy andoperational control was actually exercised and howeffective this was. But it was not possible, despite manyenquiries and two separate joint meetings withDepnaker and Jamsostek officials, to obtain anyconcrete evidence of policy guidelines. Questionnairesdesigned to inform policy and control lines wereprepared and circulated at the meetings but none wasreturned to the project office. Some changes weremade to the legislation affecting the level and periodof payment of occupational injury benefit in October2001 but, as far as could be established, the changeswere instituted under a Jamsostek (not Depnaker)initiative.
As far as control of compliance is concerned this,according to Article 31 of Law No.3/1992, investigationis carried out by labour inspectors. Inspectors used tobe under the direction of the Department of Manpowerbut since decentralization this responsibility has beendelegated to Provincial Governors through DinasTenaga Kerja. This raises questions about consistencyand, since Provinces will be collecting local taxes, alsothe priority that would be given to collection of socialsecurity contributions. Unless there is rigid control, the
possibility of corruption or collusion between inspectorsand errant employers will arise.
Thus there is a general recognition that the status ofJamsostek should change and even agreement on thegeneral direction of that change but action to effectany change has been uncoordinated and seeminglylacking in real commitment. A number of draft Billsto amend Law No. 3 of 1992 have been prepared butlittle concerted effort has been made at discussion ofthe implications or the detailed provisions and no formal,informed consensus has been reached — even on theconcept. Late in 2001 a draft Bill was submitted bythe Department of Manpower and Transmigration tothe House of Representatives under an ‘InitiativesProcedure’ but the draft appears not to have beencirculated within government or shared with the socialpartners. Although a copy (in Bahasa Indonesia) wasmade available to the ILO after its submission, theproject was not invited to comment on the draft beforeits submission, even though this legislation wasprescribed as Output 1.1 of Immediate Objective 1 ofthe project and the work of drafting the legislation wasActivity 1.1.2.
In an attempt to progress activities and outputs on thelegislation and to stimulate discussion, the project CTAtabled copies of the 1999 ILO drafting proposals, anearly draft by the project national Social SecurityAdviser and the project’s current outline ‘legal draftinginstructions’ at the National Project SteeringCommittee (NPSC) in August 2001. Inconclusivediscussion took place within a special ‘tripartite plus’NPSC meeting in September and workshops were heldwith workers’ and employers’ representatives toexplain the trust fund concept. The project submitteda proposal to the Director General early in Octoberfor a process to achieve a formal consensus togetherwith an indication of the essential provisions forinclusion in amending legislation but this was neverdiscussed nor did it appear to be taken into accountbefore the draft Bill was submitted to the legislature.
The need to change the status of Jamsostek, the trustfund concept and its implications, including the questionof operational control, featured in a workshopprogramme in January, February and March 2002consisting of a national Keynote workshop in Jakartaand regional workshops in Medan (Sumatra); Bandung
11 See ILO Report to the Government on financing and investment of Jamsostek.
Part II Chapter 4

1 8
(West Java); Makassar (Sulawesi); Balikpapan (EastKalimantan); and Surabaya (East Java). A seniorrepresentative of Depnakertrans attended only the finalworkshop and it remains to be seen the extent to whichthe views will be taken into account in future draftingamendments to the Bill.
The ILO’s view is that such an important change tothe institutional base of the social security system aswould be brought about by a change in the status ofJamsostek is a matter of national concern. A broadbased consensus among not only interested governmentdepartments and the social partners but also includingthe broader Civil Society (including employers’ andworkers’ representatives, women’s groups, professionalorganizations and consumers’ and patients’ groups,academia, etc.) in favour of the change and all itsimplications is, therefore, called for. The detailedarrangements for supervision by the tripartite boardand the public accountability process need to havewidespread support if Jamsostek is ever to achievepublic confidence. The process towards achieving sucha consensus, though commenced by project activities,has not yet been supported at a sufficiently senior levelwithin government. While a measure of consultationis said to be provided for within the legislative process,it is unclear how broad this consultation will be or theextent to which international social security experiencewill be taken into account. Further support by theproject, including policy papers, other countries’ socialsecurity legislation and workshop discussion has beenoffered.
The ILO recommended that a process to changethe status of PT Jamsostek should be continued on thefollowing lines12:
• A formal consensus should be reached withinGovernment as to what, in precise terms is intendedby the proposal to change the status of Jamsostek.
• Such a consensus should be reached on the basis ofa clear understanding of the implications. Theconsensus should be based on agreement to a writtenproposal.
• This proposal should be put to the Social Partnersand the wider Civil Society and agreed (or modified)on the basis of negotiation.
• Legislation to amend Law No.3 of 1992 (theJamsostek Law) should be drafted on the basis ofthe agreed proposal and circulated for commentbefore submission to the legislature.
• ‘Drafting Instructions’ for amending Law No.3 tobe undertaken by Depnaker Binawas, Depnaker BiroHukum and the ILO (preferably the Project CTA oranother expert in social security legislation), incollaboration with National Project SteeringCommittee.
• The amending legislation should be limited to theessential provisions to change the status of Jamsostekand clarify the respective responsibilities ofGovernment, the Board of Trustees and theExecutive Body (Jamsostek). But a full ExplanatoryMemorandum, describing the implications and thesupporting detail, should be drafted to accompanythe Bill.
• The need for consequential amendments to otherprincipal laws (particularly Law No.8 of 1981) andfor other processes (such as audits) to achieve theobjective of establishing Jamsostek as a Trust Fundshould be considered as a matter of urgency.
• Subordinate details should be provided for inGovernment Regulations and other secondarylegislation.
• Action to publicize the ‘new’ Jamsostek shouldproceed as soon as an appropriate consensus hasbeen reached with social partners — without waitingfor the amended law to be enacted.
The proposal detailed above is based on thepresumption that:
The term ‘Trust Fund’ in relation to Jamsostekmeans that it would have a legal entity that isindependent from Government but it would beaccountable to Parliament via the Board ofTrustees, through the Minister or President, bymeans of an Annual and other periodic or specialreports. In particular, the reports should beaccompanied by a full annual government auditand an actuarial valuation.
12 A proposal on these lines was sent to Depnaker by the project on 4th October 2001.
Part II Chapter 4

1 9
The Trust Fund would have the following features:
• The Trust Fund should be governed by a tripartiteBoard of Trustees;
• It would consist of a Fund into which should be paid— all social security contributions, interest frominvestments, etc. and out of which should be paid —all benefits and administrative expenses of thescheme;
• Thus all income and investments (assets) would beheld ‘in Trust’ for the Members — investments beingdecided by Trustees on the basis of professionaladvice, according to published Guidelines approvedby the President (to replace and up-date theprovisions in Government Regulation No. 28 of 1996);
• Investment income should be free of tax and returnedto worker Members in increased benefits.
• Assets are to be used exclusively for the benefit ofworker Members.
Trust Fund Jamsostek would be free fromDepartmental control — either by Ministry of Finance,Ministry of State Enterprises or Department ofManpower & Transmigration.It is recommended that Jamsostek (the ExecutiveBody) would be subject to control by:• The President;• The Tripartite Board of Trustees;• The Chief Executive Officer (President Director).
The respective responsibilities might be as follows:
• The President to be responsible (on the advice ofMinisters) for —! Appointing the Board of Trustees from
nominations submitted by Government,Employers’ representatives and Workers’representatives (in accordance with provisionsdetailed in Regulations);
! Appointing the Chief Executive Officer ofJamsostek;
! Appointing Inspectors with authority to enterbusiness premises, require the production of wagesand other records or documents, and interviewworkers — to ensure compliance with the SocialSecurity Law;
! Approving an annual budget for the operations ofJamsostek, including programme costs,administrative costs;
! Approving (by Presidential Decree or otherwise)salary scales and allowances of Jamsostek Staffand the Tripartite Board of Trustees;
! Social security strategy, introduction of newbenefits or extension of coverage (on the adviceof the Board of Trustees and on the basis ofactuarial valuation);
! The legislation and amendments thereto; and! Implementation and good governance.
• The Board of Trustees to be responsible to thePresident for:! The application of the laws and operational issues
(e.g. geographical extension of coverage,registration or compliance exercises);
! Decisions on liability and employee status (e.g.whether or not a contribution is due, has or hasnot been paid, etc.), subject to the right of appealto the Supreme Court.
! Recommending changes in Regulations, inparticular the need for changing entitlementconditions, the level of benefits and contributionson the basis of actuarial advice;
! Adjudication of appeals against quantity or qualityof benefit;
! Annual reports or special reports to Minister/President;
! The performance of Jamsostek (the ExecutiveBody) according to agreed performance targets;and
! An internal audit group established on tripartitegrounds to monitor the internal accounting,assessment of contribution liability, payment ofbenefit, investment and social security inspectionprocesses.
• The Chief Executive Officer (President Director)to be responsible to the Board of Trustees for allday-to-day operations of the Executive Body, inparticular:! Collection of contributions;! Payment of benefit;! Registration of employers and employees;! Regular (annual) notification of contribution
records to employee Members;! Compliance and enforcement of the social security
laws (including preparation of cases forprosecution). This implies that ‘social securityinspectors’ should be employed by and controlledby Jamsostek (and not as at present be labourinspectors with wider duties and under the controlof Depnakertrans or Dinas);
! A decision will need to be taken as to whetherInspectors or other Jamsostek officials couldrepresent the Board of Trustees in Court proceedings.
In the process stage there are a number of issues thatneed to be resolved within Government beforepresenting the proposal to social partners. These issuesare:
• The Legal status of Trust Funds — Whether aseparate law is required stipulating what a trust fund
Part II Chapter 4

2 0
is (similar to the laws on Dana Pensiun, Perumand Persero), or can a ‘Trust Fund’ simply beestablished by describing its function in the amendinglegislation? Professor Sentanoe Ketonegoro, theNational Social Security Adviser, has written a paperin Bahasa Indonesia comparing the different relevantIndonesian legal entities entitled ‘Formation ofJamsostek’s Trust Fund’. This and the Englishtranslation are available in the Project report. Note:A copy of the Malaysian Trustee Act of 1949 hasbeen obtained for reference purposes and isavailableas part of the Project Office papers.However, the ILO’s view is that such a trustee lawis not necessary and the problem could be overcomeby avoiding the expression ‘Trust Fund’ in thelegislation. It is the independent, tripartite supervisionthat is important, not the name.
• Is there a need to wind up PT Jamsostek legallybefore the Trust Fund is established?
• Does Ministry of Finance/Ministry of StateEnterprises agree to transfer the assets of PTJamsostek to the Trust Fund — if so is a formalaudit necessary prior to the transfer?
• What should be the Reporting line upwards from theBoard of Trustees and what should be the frequencyof reporting? (e.g. to Minister/President by annualor special report).
• Trust Fund status implies that there should be noresidual departmental control over Jamsostek (afterthe change), other than via periodic reports from theBoard of Trustees to Minister/President. DoMinistries of Finance, State Enterprises, Manpower,etc. agree to this?
• In particular, do Department of Manpower andTransmigration, Ministry of Justice and MENPANagree that enforcement of the social security lawsshould be undertaken by Jamsostek (not Depnaker)either directly or by seconded inspectors?
• In view of the extent of the span of control necessaryto ensure the good governance of social security andthe development of the programme, considerationmight be given as to whether ‘Social Security’warrants the establishment of a new Cabinet postand a new ministry that are able to focus on theimportant issues that, in the future will go beyondthe present interests of private sector manpower,
health services, etc. In the longer term, once thegeneral shape of the fully restructured social securityscheme is agreed, it would be advisable for thequestion of institutional rationalization to be studied.But in the medium term it is recommended that theexisting institutions should be strengthened andprovisions possibly be harmonized between the publicand private sectors. As with any institutional changethere are vested interests in retaining the status quothat will tend to inhibit the speed of change and eventhe change itself. The creation of a new governmentagency with executive responsibility for thedevelopment of the new social security schemeshould overcome such resistance.
Implications of JAMSOSNAS for‘Trust Fund’ Status of InstitutionsBy the end of the project it was clear that the changeof status of Jamsostek was continuing to meet withresistance, possibly by forces with a vested interest inretaining the status quo. It also emerged, fromdiscussions with the Task Force that the concept ofJAMSOSNAS as a social security umbrella for all theexisting social security institutions might present analternative solution to the problem.
Although the ‘trust fund’ system described above andrecommended for Jamsostek Baru might be used as apossible model for other social security institutions, itmay not be appropriate for the JAMSOSNAS umbrellaitself. This is because there seems no need for aseparate ‘fund’ for JAMSOSNAS while its individualinstitutions remain autonomous. However, it wouldbenefit from a similar form of tripartite management.
The ILO, therefore, recommended that aJAMSOSNAS Board (or Council) be established onsimilar lines proposed for the Jamsostek Board ofTrustees. The role of the Council would be to havetripartite supervision of all the institutions under itsumbrella. This would ensure harmony, equity andeventually facilitate integration. With such broad,tripartite control there would be no need to establishseparate Boards of Trustees in the individual institutionsand no need for the problematical amending legislationto change the status of the Persero’s to Trust Funds.
There would, however, still be the need to achieve tax-free status and to alleviate the payment of dividendsto the Government. But instead of trying to achievethis through amendment of the existing social security
Part II Chapter 4

2 1
laws establishing the Persero’s, it could be done viathe framework JAMSOSNAS law. A relatively simpleprovision on the following lines might achieve this:
“Notwithstanding the provisions of the law [law onPersero’s] requiring the payment of annualdividends to the Government and the levying oftax on the profits, no such dividends or tax shallbecome payable in respect of any social securityinstitution covered by the JAMSOSNAS Law.”
The framework law might indicate:—
• What the objectives of JAMSOSNAS are, whoshould be covered, how the law will be applied and
when it will be introduced. The Law should alsoprovide for a tripartite Council or Board with equalrepresentatives of Govt; Employers; and Workers.The Council would be responsible to the President(or Minister of Social Security) for ALL the schemes— ensuring equity, honesty and transparency, startingwith harmonization and leading to gradually unificationbetween the public and private sectors. In themeantime urgent consideration should be given tointroducing portability of benefit rights for workerstransferring between the public and private sectors.
The effect of a JAMSOSNAS Council is illustrated inthe diagram below.
Figure 6 Possible Form of Jamsosnas Council
POSSIBLE FORM FOR JAMSOSNAS COUNCIL
Part II Chapter 4
2 2
effect on efficiency of its core business ¾ which iscollecting and recording contributions, paying benefitand investing reserve funds.
Should the status of Jamsostek be changed to a trustfund it follows that the payment to the government ofdividends and the taxation of income from investmentwould cease. The investment of all Jamsostek fundsmust be to the benefit of members and directed atmaximizing the funds available for the payment ofbenefit and improvements to the benefit programme.Investments will be under the supervision of the boardof trustees according to the guidelines laid down in therelevant legislation. This legislation, in common withinternationally recognized standards, requires thatinvestments must meet criteria of security, yield andliquidity. It follows that although some worker-orientated projects may benefit some workers, it wouldbe difficult to build hospitals and houses or set uptransport systems throughout Indonesia so that allworkers may benefit. It is doubtful whether the yieldfrom such investments would be high and, moreimportantly, it would be difficult to liquidate such assetsin order to pay benefits when these became due. Itseems likely that such investments would be ultra viresand could lead to the fund experiencing difficulty inmeeting its future commitments.
CHAPTER 5 JAMSOSTEK CORE BUSINESS
Part II Chapter 5
During the ILO/Depnaker workshop programme in2002 participants (mainly workers’ representatives)made a number of suggestions that Jamsostek shoulddo more for workers’ welfare including investing insuch programmes as: hospital building; low costhousing; workers’ banks; subsidized workers’transport; and retail outlets for workers. It is understoodthat some similar investments were made during thecourse of 2001 utilizing money ‘clawed back’ fromthe Ministry of Finance from dividends. There arestrong reasons against such investments continuing intothe future.
In particular, Jamsostek is already having difficulty inmanaging its core business efficiently and sometimesexperiences difficulty in recruiting staff of sufficientlyhigh calibre to process claims, etc. accurately and ontime. The report on Jamsostek Operations and ITSystems describes the operational and systemschanges that are required for the institution to meetthe demands of the change to a social insurance systemand periodic payments. Given that these operationalchanges, the extension of coverage, improvements tothe benefit programme and proper enforcement of thelaw will make heavy demands on human resources,branching out into new, non-social security venturescan only dissipate resources and have a detrimental

2 3
Part II Chapter 6
CHAPTER 6 JAMSOSTEK OPERATIONS & IT SYSTEMS
Summary of Recommendations
Processes and Administration
(i) Registration ProcessThe registration process should be re-engineeredto become the prime function for new membersand be able to perform the following tasks:• Obtain complete information about the member,• Establish the identity of each member by a
standard process of sighting identity documents,• Conduct an index check to determine the
existence of any previous record,• Enter and record the details of the member on
the database,• To ensure that appropriate procedures are
initiated to advise the members of their rightsand obligations of membership to the fund,
• To create any paper files and documentation thatmay be required for legal purposes, and
• Contain appropriate system constraints toprevent the creation of duplicate records.
(ii) Membership FocusThe focus of membership in Jamsostek should beshifted towards the employee so that the employeeis contacted directly and not via the employer forannual information of the members’ record,deficiencies or non payments of contributions, noncompliance, marketing, notification of changes andresponses to member enquiries. All membersshould be aware of their rights and responsibilitiesof membership in Jamsostek programs and theresponsibilities for notification of changes incircumstances such as address, employment,should be with the employees. The focus ofcontribution collections should remain onemployers.
(iii) ComplianceThe legislation and regulations for collection andenforcement of contributions should be amendedto provide Jamsostek with all of the relevantdelegations and authority in order to strengthenthe compliance of membership and contributionsto the fund. This should include amendment toArticle 31 (1) of Act No. 3, 1992 to provideauthority for Jamsostek inspectors to beempowered to enforce social security provisions.
Executive Summary
Introduction
The project for Restructuring of Social Security inIndonesia is a continuation of the long ILO involvementin the social security reform process in Indonesia. TheReview of Operations and Information Systemscomponent of the project was focussed on Jamsostek(PT Jaminan Sosial Tenaga Kerja) with an aim torecommend improvements that should be made toposition Jamsostek as the core agency to facilitatefuture reforms of social security in Indonesia.
The review analysed the existing organization, workprocesses, information systems and current and futurestrategic and operational plans as a basis for therecommendations. Extensive consultation was madewith staff at all levels and with some of the majorexternal stakeholders and users of Jamsostek services.
Over the past year Jamsostek has undertaken a numberof major initiatives aimed at reforming the organization,its service to members and to improve its image in thecommunity. Legislation is being prepared to improveinvestment performance by the creation of a trust fundmanaged by a tripartite board of commissioners thatwill report directly to the People’s Assembly througha Minister. This will provide independence to the boardand remove outside influences from their task ofmaximising investment return to members. Theorganisational structure has been improved tostrengthen monitoring of performance, marketing andservices to members.
The following recommendations are mainly targetedat the Information Systems area because many of thebusiness processes impact directly on the computingenvironment and the summary recommendations arepresented by group order. Full details of theobservations and discussion that have produced theserecommendations are contained in section 8 of thereport.

2 4
Part II Chapter 6
The appeals against enforcement decisions,disability benefits payments and work accidentbenefits may be separated to another agency topromote impartiality.
(iv) Work Injury ReportingThe work injury reporting processes should bealtered to place the responsibility with Jamsostekto screen and report workplace injuries to theDepartment of Manpower and Transmigration(Depnakertrans). The scale of reportable injuriesshould also be altered to those classified as themore serious injuries that may have resulted fromunsafe work practices or environmental factors.The current range of carbonised forms forworkplace injury reporting should be altered toreflect the actual reporting and forms distributionprocess.
(v) Jamsostek MarketingJamsostek should plan for a marketing exerciseto be conducted to promote the changes that areto be made following the legislative changes andthe acceptance of the IT strategic anddevelopment plans. The likely marketing strategymay include the new structural elements such asthe trust fund legislation, new investment practices,focus on employee members, collection ofemployee contact addresses, Integration ofrecords and compliance.
Should the compliance initiatives be successful,Jamsostek may also wish to consider an amnestyfor employers who have not been making thecorrect contributions or who have failed to register.A cut-off date for the amnesty may encourageemployers to correct their contribution rates priorto the commencement of enforcement action.
Data Management Recommendations
(vi) Unique Jamsostek Membership NumberJamsostek should establish a unique employeemembership number as the primary searchelement for membership record management.This number could be the existing employeemember number or a newly created numberingsystem for internal use in Jamsostek. This numberwill facilitate the integration of existing recordsand to prevent the creation of further multiplerecords. In the future this number could beintegrated with the proposed national identitynumber system and migrant workers trackingsystem.
(vii)Record IntegrationThe multiple records should be integrated into asingle record that contains the current and historicaldata about each member. The amount of dataavailable about employee members is limited andto achieve a high degree of integration it will benecessary to conduct a data collection exercise(initially through employers) to obtain the relevantinformation such as previous membership numbers,contact address etc, from employees.
(viii)Data RedundancyThe data architecture should be reviewed in orderto eliminate data redundancy and the inclusion ofadditional essential data fields such as membersaddress. The establishment of a common datarecord containing the fixed person data should beconsidered as an element of data architecture.
(ix) Data ManagementThe inactive records and the claimants’ paidrecords should be separated from the activerecords and archived in the Branch Offices. Thisprocess will improve the data access performanceof the frequently used active records in theBranch Offices and increase the available diskspace.
(x) National IndexA national index of members should be createdfrom the integrated membership records and bemade accessible in all Jamsostek sites. This index,as a minimum requirement, must be able to identifyindividual employee members and employers andthe location of their data records.
Organizational Recommendations
(xi) IT OrganizationThe successful development and maintenance ofIT systems is critical to the operations ofJamsostek and the achievement of its businessgoals. In recognition of the technical nature andto enhance the liaison and decision making processwith the other directors, the management of theIT organization should be at directorate level andseparated from the Finance Directorate.
The distributed IT architecture in Jamsostek hascreated critical processing points in the Branchoffices where all data functions and processingare performed. The source of all data, maintenanceand data integrity is performed by the Database

2 5
Part II Chapter 6
Operators in each Branch Office site. The ITorganization should be reviewed and theemployment conditions for IT staff restructuredto attract capable staff to fill all of the vacanciesand maintain the critical data managementpositions in all sites.
IT development needs to be seen as aninvestment in the future and to fund thedevelopment it may be necessary to borrow fromfuture expenditure. Successful IT developmentswill produce the efficiencies that result in theneed for lower operational staffing numbers thatcan be offset against the increased staffing thatwill be required to manage the increase inmembership and programs. It will also providethe opportunity to deliver a greater range ofservices to members and better control overmembership, resources and managementinformation.
(xii) IT Development and MaintenanceThe staffing of the National IT section shouldbe reviewed to expand the developmentcomponent. The redevelopment of theJamsostek systems will require a dedicatedproject team that is additional to, and separatefrom, the existing maintenance team in the ITsection. The proposed systems re-developmentproject should report to an executive steeringcommittee.
(xiii) IT Standards and ProceduresJamsostek should have documented standardsand procedures for:• IT project methodology and the preferred
support tools,• Development methodology,• Data standards and data management,• Infrastructure development,• Fault reporting and management, and• Documentation maintenance and standards.
(xiv) IT TrainingThe priority of IT training should be directed toestablishing fully trained database administrators,
data operators and relief staff in all Branch,Regional and the National offices.
(xv) Business Re-engineeringA business re-engineering planning workshopshould be conducted to review the businessneeds and the IT architecture in order to developan IT strategic plan and development plan inorder to implement the new processes. The re-engineering workshop should be supported bythe findings of an international study tour thattargets the key organizational and ITarchitectural issues and the completion of aninventory of existing systems and their functions.The business reengineering process should alsoincorporate the recommendations included in thisreport and the other specialist reports from theILO project.
ConclusionJamsostek is in a unique position to become a coreelement of an expanded social security system inIndonesia. It has a functional national network ofoffices that are geared to expansion as membershipnumbers increase. Together with an existing servicedelivery culture and its ability to extend services intothe areas where members live are major strengths.
The major weaknesses in Jamsostek as the main socialsecurity delivery agency is the perception in thecommunity about poor investment performance,inadequate benefits to members, low membershipcompliance and membership focussed on employers.
In order for Jamsostek to expand its membership baseand social security programs, critical reforms need tobe undertaken in the legislation, investments,compliance and changing the focus of membershipfrom employers to employees. The IT systems willneed to undergo major re-engineering to simplifymembership management, eliminate duplicatemembership records, improve data management,strengthen processes, improve security and ensurevalue for money spent on IT.

2 6
Part II Chapter 6
Bab 6 Sistem Operasi Jamsostek DanSistem Teknologi Informasi
Rangkuman Eksekutif
Pendahuluan
Proyek Restrukturisasi Jaminan Sosial di Indonesiamerupakan kelanjutan dari keterlibatan ILO dalamproses reformasi jaminan sosial di Indonesia. Kajianulang terhadap komponen Sistem Operasi dan SistemInformasi proyek ini difokuskan pada Jamsostek (PTJaminan Sosial Tenaga Kerja) dengan tujuanmerekomendasikan perbaikan-perbaikan yangseharusnya dilakukan untuk menempatkan Jamsosteksebagai badan inti untuk memfasilitasi reformasi jaminansosial di Indonesia di masa yang akan datang.
Kajian ulang tersebut menganalisa organisasi yang adasekarang, proses kerja, sistem informasi, rencanastrategis dan operasional yang ada sekarang maupundi masa yang akan datang sebagai dasar berpijak bagirekomendasi-rekomendasi tersebut. Konsultasi secaraekstensif dilakukan dengan staf di semua tingkat dandengan beberapa pihak utama yang berkepentingan diluar Jamsostek serta dengan para pengguna pelayananJamsostek.
Selama tahun lalu Jamsostek telah menjalankansejumlah inisiatif penting yang ditujukan untukperombakan organisasi Jamsostek, pelayanan yangdiberikan kepada anggota serta untuk memperbaiki citraJamsostek di mata masyarakat. Saat ini sedang disusunrancangan undang-undang untuk meningkatkan kinerjainvestasi melalui penciptaan suatu dana wali amanatyang dikelola oleh suatu dewan komisaris tripartit yangakan melapor secara langsung kepada MajelisPermusyawaratan Rakyat melalui seorang Menteri.Hal ini akan memberikan kemandirian kepada dewandan menyingkirkan pengaruh-pengaruh luar dari tugasmereka memaksimalkan pengembalian investasikepada para anggota. Struktur organisasi telahditingkatkan untuk memperkuat pemantauan kinerja,pemasaran dan pelayanan kepada anggota.
Rekomendasi-rekomendasi berikut terutama ditujukanuntuk bidang sistem Informasi karena banyak prosesoperasi Jamsostek berdampak langsung terhadapperhitungan yang dilakukan melalui komputer danrangkuman rekomendasi disajikan menurut urutankelompok. Rincian lengkap mengenai pengamatan dandiskusi yang dilakukan sehingga menghasilkan
rekomendasi-rekomendasi ini dapat dijumpai dalamseksi 8 laporan ini.
Rangkuman Rekomendasi
Proses dan Administrasi
(i) Proses RegistrasiProses registrasi (pendaftaran anggota) harus ditataulang supaya proses ini menjadi fungsi utama bagianggota baru dan supaya melalui proses ini tugas-tugasberikut dapat dilaksanakan:• memperoleh informasi lengkap mengenai anggota;• menetapkan identitas tiap anggota melalui suatu
proses standar yang dilakukan dengan melihat ataumemeriksa dokumen/ surat bukti identitas yangdimiliki anggota;
• melakukan pengecekan indeks untuk mengetahuiapakah sudah ada catatan sebelumnya tentanganggota tersebut;
• memasukkan dan mencatat rincian data anggota kedalam data base;
• memastikan dijalankannya prosedur yang layak untukmemberitahu anggota mengenai apa yang menjadihak dan kewajiban mereka sehubungan dengankeanggotan mereka dalam dana jamsostek;
• membuat arsip dan dokumentasi yang mungkin kelakakan dibutuhkan untuk keperluan hukum; dan
• termasuk didalamnya batasan-batasan sistem untukmencegah terjadinya duplikasi catatan data anggota(records).
(ii) Fokus KeanggotaanFokus keanggotaan dalam Jamsostek hendaknyadigeser dari pengusaha ke pekerja/ pekerja sehinggapekerja dapat secara langsung dihubungi tanpa harusmenghubungi pengusahanya guna memperolehinformasi tahunan tentang catatan anggota, kekurangandalam pembayaran iuran/ tidak dibayarnya iuran,ketidakpatuhan, pemasaran, pemberitahuan tentangperubahan-perubahan dan tanggapan-tanggapanterhadap pertanyaan-pertanyaan yang diajukan.Seluruh anggota Jamsostek hendaknya menyadari apayang menjadi hak dan kewajiban mereka sebagaianggota program Jamsostek serta bertanggung jawabmemberitahu perubahan-perubahan keadaan sepertiperubahan alamat dan pekerjaan. Namun, fokuspengumpulan iuran hendaknya tetap pada pemberipekerja.
(iii)KepatuhanUndang-undang dan peraturan-peraturan yangmengatur pengumpulan iuran dan penegakan kepatuhan

2 7
Part II Chapter 6
dalam pembayaran iuran harus diubah sehinggaJamsostek memperoleh hak mewakili dan wewenangyang relevan untuk memberdayakan kepatuhan dalamkewajiban menjadi anggota Jamsostek dan dalampembayaran iuran ke dana jamsostek. Perubahantersebut hendaknya mencakup perubahan terhadapPasal 31 (1) Undang-Undang No. 3/ 1992 gunamemberikan wewenang kepada tenaga pengawasJamsostek sehingga mereka diberdayakan untukmenegakkan ketentuan-ketentuan jaminan sosial.Banding yang diajukan terhadap keputusan-keputusanpenegakan, pembayaraan santunan cacat dan santunankecelakaan kerja sebaiknya ditangani oleh badan lainguna mencegah terjadinya keberpihakan pada salahsatu pihak.
(iv)Pelaporan Kecelakaan KerjaProses pelaporan kecelakaan kerja harus diubahdengan memberikan tanggung jawab pada Jamsostekuntuk melakukan pemeriksaan terhadap danmelaporkan kecelakaan yang terjadi di tempat kerjake Departemen Tenaga Kerja dan Transmigrasi(Depnakertrans). Skala kecelakaan kerja yang layakdilaporkan juga harus diubah sehingga yang dilaporkanhanyalah kecelakaan kerja yang lebih serius, yangmungkin diakibatkan oleh praktek kerja yang tidakmengindahkan aspek keselamatan kerja atau olehfaktor lingkungan. Formulir-formulir rangkap dengankertas karbon untuk pelaporan kecelakaan ditempatkerja juga harus diubah untuk merefleksikan prosespelaporan dan distribusi formulir secara aktual.
(v) Pemasaran JamsostekJamsosek harus merencanakan upaya pemasaran untukmemperkenalkan dan mempromosikan kepadamasyarakat perubahan-perubahan yang akan dilakukansetelah perubahan (amendemen) terhadap undang-undang selesai dilakukan dan setelah rencana strategisdan rencana pengembangan teknologi informasiditerima. Strategi pemasaran yang mungkin akandilakukan dapat meliputi unsur-unsur baru yang bersifatstruktural seperti upaya mengajak masyarakat untukmengenal dan memahami undang-undang dana waliamanat, praktik-praktik baru dalam melakukaninvestasi, pentingnya pemusatan terhadap pekerja yangmenjadi anggota Jamsostek, pengumpulan alamat-alamat pekerja yang dapat dihubungi, upayamemadukan catatan-catatan data anggota dankepatuhan terhadap ketentuan jamsostek.
Apabila inisiatif-inisiatif kepatuhan ini berhasil,Jamsostek juga perlu mempertimbangkan untukmelakukan pemutihan terhadap para pengusaha yang
belum membayar iuran secara benar atau yang belummendaftar. Dengan ditetapkannya suatu tanggalpemutihan, para pengusaha tersebut mungkin akanterdorong untuk memperbaiki tingkat iuran merekasebelum penegakan undang-undang dilaksanakan.
Rekomendasi-rekomendasi yang berkaitandengan Manajemen Data
(vi) Nomor Keanggotaan Jamsostek yangBersifat UnikJamsostek sebaiknya membuat nomor keanggotaanpekerja yang bersifat unik (artinya, setiap anggotamendapat satu nomor saja yang tidak adakembarannya) dan menggunakan nomor keanggotaantersebut sebagai dasar pencarian utama untuk mencaridata anggota. Nomor tersebut dapat berupa nomorkeanggotaan pekerja yang sudah ada atau, dapat puladiciptakan suatu sistem penomoran baru untukdigunakan secara internal di lingkungan Jamsostek.Nomor ini nantinya akan memudahkan penggabungancatatan-catatan data anggota yang sudah ada sertamencegah pembuatan catatan ganda untuk anggotayang sama. Di masa yang akan datang, nomor ini akandapat digabungkan dengan sistem penomoran identitaspenduduk secara nasional dan sistem penelusuranpekerja migran.
(vii) Penggabungan CatatanCatatan-catatan ganda harus digabungkan menjadisatu catatan yang mengandung data terkini maupundata historis dari masing-masing anggota. Data yangada mengenai setiap anggota/pekerja terbatas danuntuk memperoleh data gabungan yang lengkap, perludilakukan pengumpulan data (mula-mula melaluipengusaha) guna memperoleh informasi yang relevanseperti nomor keanggotaan sebelumnya, alamat yangdapat dihubungi, dan lain-lain dari pekerja yangbersangkutan.
(viii) Data yang BerlebihanRancang bangun data sebaiknya ditinjau ulang untukmenghindari adanya data yang berlebihan(pengulangan) data dan dicantumkannya bidang-bidangtambahan data yang penting seperti alamat anggota.Pembentukan catatan data umum yang meliputi dataanggota yang pasti harus dipertimbangkan sebagaisalah satu unsur dalam rancang bangun data.
(ix) Pengelolaan DataCatatan-catatan data anggota yang sudah tidak aktifdan catatan-catatan data anggota yang hak-hakmanfaatnya telah dibayarkan harus dipisahkan dari

2 8
Part II Chapter 6
catatan-catatan data anggota yang masih aktif dandisimpan sebagai arsip di Kantor-Kantor Cabang.Pemisahan ini mengurangi beban data sehinggakapasitas ruang disket yang tersedia dapatdioptimalkan dan data dari catatan-catatan aktif yangsering digunakan di Kantor-Kantor Cabang dapatdiakses dengan lebih cepat dan lebih baik.
(x) Indeks NasionalSuatu indeks nasional dari seluruh anggota Jamsostekharus dibuat dari catatan-catatan data anggota yangtelah dipadukan dan dibersihkan dari data rangkapnya.Indeks nasional tersebut harus dapat diakses di semuasitus Jamsostek. Indeks ini, sebagai persyaratanminimum, harus dapat mengidentifikasi baik anggota/pekerja maupun pengusaha secara individual sertalokasi di mana data mengenai anggota/pekerja ataupengusaha tersebut tercatat.
Rekomendasi-rekomendasi Keorganisasian
(xi) Organisasi Teknologi InformasiKeberhasilan pengembangan dan pemeliharaan sistemteknologi informasi merupakan hal yang amat pentingbagi keberhasilan operasi Jamsostek dan pencapaiantujuan operasinya. Karena itu, mengingat sifat teknisyang dimiliki seksi teknologi informasi dan untukmeningkatkan hubungan dan proses pengambilankeputusan dengan direktur-direktur lainnya, manajemenyang menangani organisasi teknologi informasi harusmempunyai kedudukan setingkat direktur dandipisahkan dari Direktorat Keuangan.
Rancang bangun teknologi informasi terdistribusi yangterdapat dalam sistem komputerisasi Jamsostek telahmenciptakan titik-titik pengolahan yang amat vital diKantor-Kantor Cabang di mana semua fungsi data danpengolahan dilakukan. Operator pengolahan data disetiap Kantor Cabang bertanggung jawab atas sumberdari semua data, penyimpanan dan integritas data.Organisasi teknologi informasi harus ditinjau kembalidan kondisi-kondisi kerja untuk para staf teknologiinformasi harus ditata kembali supaya staf yangmempunyai kemampuan yang baik tertarik untukmengisi lowongan-lowongan yang ada dan tetap maumemegang jabatan manajemen data yang penting disemua tempat operasi Jamsostek.
Pengembangan teknologi informasi hendaknyadipandang sebagai suatu investasi untuk masa depandan, untuk mendanai pengembangan teknologiinformasi tersebut mungkin perlu dilakukan peminjamandari pengeluaran-pengeluaran untuk masa depan.
Pengembangan teknologi informasi yang berhasil akanmenghasilkan efisiensi. Yang berdampak pada perlunyapengurangan jumlah staf operasional di tingkat yanglebih rendah. Pengurangan ini dapat diimbangi denganpenambahan staf yang akan dibutuhkan untukmenangani bertambahnya anggota dan program.Efisiensi-efisiensi tersebut juga akan memberikankesempatan yang lebih besar untuk memberikanjangkauan pelayanan yang lebih luas kepada anggotadan kendali yang lebih baik terhadap keanggotaan,sumber daya, dan informasi manajemen.
(xii) Pengembangan dan Pemeliharaan TeknologiInformasiSusunan staf seksi teknologi informasi nasionalhendaknya dikaji ulang untuk memperluas komponenpengembangan. Untuk menyusun ulang sistem-sistemJamsostek akan diperlukan suatu tim proyek yangpenuh dedikasi. Tim ini hendaknya merupakantambahan bagi tim pemeliharaan dalam seksi teknologiinformasi, namun merupakan bagian terpisah. Proyekpenyusunan ulang sistem yang diusulkan tersebut harusbertanggung jawab kepada suatu panitia pengaraheksekutif.
(xiii) Standar dan Prosedur Teknologi InformasiSeharusnya Jamsostek membuat standar dan prosedurmengenai:• metodologi proyek teknologi informasi dan sarana
penunjang yang lebih disukai,• metodologi pengembangan;• standar data dan manajemen data;• pengembangan infrastruktur;• proses pelaporan dan manajemen terhadap kesalahan
(fault) yang terjadi, dan• pemeliharaan dan standar dokumentasi.
(xiv) Pelatihan Teknologi InformasiPrioritas pelatihan teknologi informasi harus diarahkanuntuk menghasilkan tenaga-tenaga administratorpangkalan data, operator data dan staf penolong (reliefstaff) yang telah sepenuhnya terlatih untukmenjalankan pekerjaan masing-masing di semua kantorcabang, kantor daerah dan kantor pusat Jamsostek.
(xv) Penataan Ulang Operasi JamsostekSuatu lokakarya yang membahas rencana penataanulang operasi Jamsostek hendaknya diadakan untukmengkaji ulang kebutuhan akan operasi dan rancangbangun teknologi informasi dengan maksud menyusunrencana strategis dan rencana pengembanganteknologi informasi untuk mengimplementasikanproses-proses baru. Lokakarya penataan ulang ini harus
2 9
Part II Chapter 6
didukung oleh temuan-temuan yang didapat dari suatukunjungan studi internasional yang ditujukan untukmempelajari hal-hal penting yang berkaitan denganpengorganisasian dan rancang bangun teknologiinformasi serta penyusunan suatu inventarisasi darisistem-sistem yang ada sekarang beserta fungsimasing-masing. Proses penataan ulang operasiJamsostek ini hendaknya juga menampungrekomendasi-rekomendasi yang dimasukkan dalamlaporan ini maupun dalam laporan-laporan spesialislainnya dari proyek ILO ini.
KesimpulanJamsostek berada dalam posisi unik untuk menjadielemen inti dari perluasan sistem jaminan sosial diIndonesia. Jamsostek memiliki jaringan fungsional yangterdiri dari kantor-kantor Jamsostek di seluruhIndonesia, yang disiapkan untuk menangani perluasankeanggotaan Jamsostek apabila nantinya terjadipeningkatan jumlah anggota. Kekuatan utama lain yangdimiliki Jamsostek saat ini adalah sudah adanya budayauntuk melayani peserta dan kemampuannya untukmemperluas pelayanan ke daerah-daerah tempattinggal anggota.
Kelemahan utama Jamsostek sebagai badan utamapemberi jaminan sosial terletak pada persepsimasyarakat mengenai buruknya kinerja investasi, tidakmemadainya manfaat yang dibayarkan kepada anggota,rendahnya tingkat kepatuhan anggota dan terfokusnyakeanggotaan pada pengusaha.
Supaya Jamsostek dapat memperluas basiskeanggotaannya dan program-program jaminan sosialyang diberikannya, perlu dilakukan reformasi(perombakan) yang menjadi titik balik ataumenyebabkan terjadinya perubahan yang amatmendasar dan menentukan dalam peraturanperundang-undangan, investasi, kepatuhan dan dalammenggeser fokus keanggotaan dari pengusaha kepekerja. Sistem teknologi informasi perlu ditata ulangguna menyederhanakan manajemen keanggotaan,membuang catatan data anggota yang rangkap atauberulang, memperbaiki manajemen data, memperkuatproses, meningkatkan keamanan serta memastikanbahwa biaya yang dikeluarkan untuk melakukanperbaikan teknologi informasi sebanding dengan hasilyang diperoleh.

3 0
Part II Chapter 6
Introduction
Project BackgroundThe ILO has been closely involved in the developmentof social security in Indonesia for many years. RecentILO project reports have recommended the need torestructure the social security system in order to extendthe social security coverage to a larger percentage ofthe population.
A National Steering Committee was established bythe Department of Manpower and Transmigration(Depnakertrans) in September 1999 to work with ILOspecialists. This followed the strategic vision aboutemployees’ social security administration described inthe Guidelines of State policies Year 1999 – 2004.The guidelines provided the aim: To develop a systemof employees social security for all workers toprovide sufficient work protection, security andsafety with management involving government,employers and employees. A National Workshop onRestructuring of Social Security was held in Jakarta inNovember 1999 and a number of recommendationswere made about the future direction of social securityreform in Indonesia.
The key findings of the workshop can be broadlygrouped in the following areas:• Redefining the role of the state and private agencies
and the development of a national social securityreform strategy,
• Improvement of the scope and types of benefitprograms and progressive extension of eligibility tothe various schemes to the wider population, withJamsostek as the core service delivery agency,
• Strengthening the management, accountability,investment performance and service deliverystandards of Jamsostek, and
• Improvement of the compliance measures and publicrelations processes in Jamsostek.
The Information Technology (IT) component to reviewthe operations and systems of Jamsostek is a part ofthe ILO project, Restructuring of the Social Securityin Indonesia that commenced in April 2001. Theimmediate objectives of the ILO project relate to theestablishment of a new institutional structure for thenational social security scheme and for the developmentof a national strategic plan for the restructuring of thesocial security system.
Summary of ActivitiesThe focus of the IT review was on Jamsostek, thestate owned limited liability company that delivers social
security services to employees of private companies.The review of the IT administration and operations ofJamsostek required the close co-operation andinvolvement of a National IT expert counterpart andstaff in the IT Section in Jamsostek. The counterpartsand staff provided valuable support to the consultantin the all phases of the project, their cooperation andeffort, particularly in addition to their considerablenormal daily workloads was greatly appreciated.
The consultant made a detailed analysis of currentoperational processes at the National, Regional andBranch levels in Jamsostek. This analysis wasconducted in conjunction with counterpart staff andincluded personal visits, observation and walkthroughsof the existing processes with staff. The staff and usersneeds and suggestions were taken into account in theanalysis and the subsequent recommendations. Thepriority of effort of the review was a detailed study ofthe current computer systems and strategic plans forthe IT systems. The recommendations for theenhancements to the IT systems and the strategic planwere made in conjunction with the IT Bureau.
Jamsostek Organization
BackgroundIn 1992 Jamsostek was inaugurated by assuming thesocial insurance functions of Astek (formed in 1977)and extending the range of programs provided by Astekfrom retirement and death benefits to include workaccident insurance and health care. In 1993 theJamsostek retirement programs, the range of eligibleemployees was extended from employers with at least100 employees in addition to a monthly gross payrollof Rp. 5 million to employers having at least 10 staffand gross payroll of Rp. 1 million per month.
The limited company status of Jamsostek (Persero)also introduced a taxation liability on company profit(but not on investment earnings) that has served tolimit the growth of investments and subsequent returnto contributors. Some of the profit is returned toJamsostek by the Ministry of Finance to support specialworker programs and in 2001 this included funding forworkers’ hospitals. Legislation is being prepared to alterthe status of Jamsostek from a Persero to a publictrust managed by a tripartite board and the effect ofthis legislation will be to remove the taxation liabilityfrom the profit of the institution. The no profit incomefrom investments is to be returned to members asincreased benefits.

3 1
Part II Chapter 6
Social Security in IndonesiaAn overview of the social security system in Indonesiaincluding the organisation and responsibility of thevarious responsible agencies is discussed in Chapter1. This also describes the core legislation, contributions,benefit programmes, eligibility and entitlements.
Jamsostek ProgramsJamsostek is responsible for the administration of thefollowing social insurance programs:
Retirement Program Jaminan Hari Tua JHT(Old – age Benefit Scheme)Accident Protection Jaminan KecelakaanProgram Kerja JKK(Employment AccidentBenefit Scheme)
13 Source BPS14 Source B. Purwoko, July 200115 Source Jamsostek IT Bureau 13 September 2001
Life Program Jaminan Kematian JKM(Death Benefits Scheme)Health Care Program Jaminan Pemeliharaan(Health Care Benefit Scheme) Kesehatan JPK
The Retirement program is a provident fund based onindividual accounts, providing for a variable rate ofbenefit based on the contributions and interest creditedto the account over the life of the membership.
The remainder of the programs are provident funds basedon group accounts that provide a standard fixed rate ofbenefits based on the legislation, regulations and decisionsmade by the board of management. A summary of theJamsostek programs is shown in Figure 7.
Population, Employment and Poverty
Figure 7 Labour Force Statistics
Item 199913(millions) 200014(millions)
Population aged 15 years and over 141.10 144.03Labour force 94.85 97.32Labour force employed 88.82 89.07
Formal sector 26.65 26.72Informal sector 62.17 62.35
Job seekers 6.03 8.25Jamsostek members 16.42 18.60Additional potential Jamsostek members 10.23 8.12Population below poverty line aged 15 years and over 48.00 48.00Taxpayers (Tax file number holders) 3.00
The formal employment sector represents about 30%of the labour force and this is the current capture groupfor Jamsostek membership. The employer groupsexcluded under current legislation are those employerswith less than 10 employees and a monthly grosspayroll of less than Rp. 1 million. The Additionalpotential Jamsostek members total shown in figure 7may be understated because it has been derived fromthe difference between the Formal labour forcesector and Jamsostek members’ statistics. The totalnumber of Jamsostek members (18.6 million) includesthe multiple records and members already paidretirement benefits.
Statistical Overview of Jamsostek ProgramsThere were 97,499 employers registered withJamsostek as at July 2001. Of these, 74,966 were activeand 22,533 were inactive. The estimated potentialnumber of eligible employers i.e. with 10 or moreemployees or monthly gross payroll exceeding 1 millionRupiah is about 26 million.
The current employee members for the Provident Fund,Work Injury and Death Benefits programs are shownin the table below15.
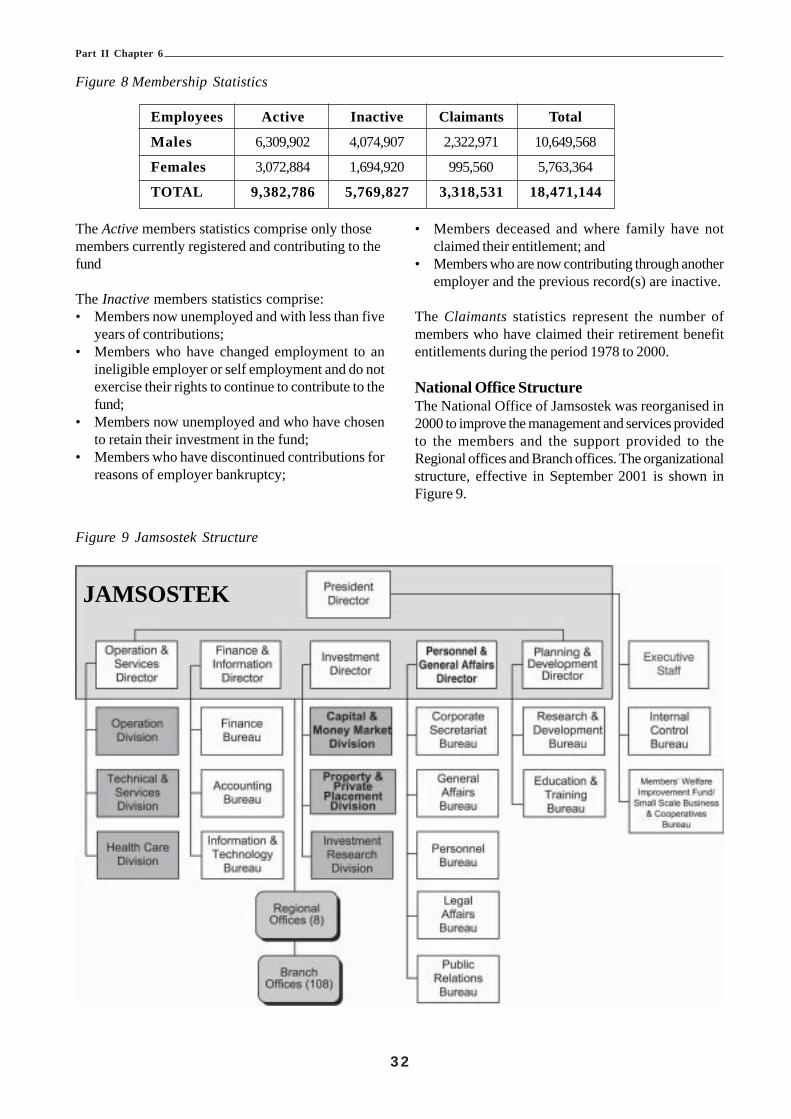
3 2
Part II Chapter 6
Figure 8 Membership Statistics
Employees Active Inactive Claimants Total
Males 6,309,902 4,074,907 2,322,971 10,649,568
Females 3,072,884 1,694,920 995,560 5,763,364
TOTAL 9,382,786 5,769,827 3,318,531 18,471,144
The Active members statistics comprise only thosemembers currently registered and contributing to thefund
The Inactive members statistics comprise:• Members now unemployed and with less than five
years of contributions;• Members who have changed employment to an
ineligible employer or self employment and do notexercise their rights to continue to contribute to thefund;
• Members now unemployed and who have chosento retain their investment in the fund;
• Members who have discontinued contributions forreasons of employer bankruptcy;
• Members deceased and where family have notclaimed their entitlement; and
• Members who are now contributing through anotheremployer and the previous record(s) are inactive.
The Claimants statistics represent the number ofmembers who have claimed their retirement benefitentitlements during the period 1978 to 2000.
National Office StructureThe National Office of Jamsostek was reorganised in2000 to improve the management and services providedto the members and the support provided to theRegional offices and Branch offices. The organizationalstructure, effective in September 2001 is shown inFigure 9.
Figure 9 Jamsostek Structure
JAMSOSTEK

3 3
Part II Chapter 6
National Office Roles and Responsibilities
The role of the divisions in the National office are represented by detailed sub diagrams of the main organizationalstructure.
Figure 10 President Director Figure 11 Operations and Services Directorate
Figure 12 Finance and Information Directorate Figure 13 Investments Directorate

3 4
Part II Chapter 6
Figure 14 Personnel and General Affairs Directorate Figure 15 Planning & Development Directorate
Service Delivery Network
The national service delivery network is based on 108Branch offices located around the country. There areprovisional plans to increase this number to 113
The Regions are numbered one (I) to eight (VIII) fromwest to east and they are located around the majoremployment centres with 4 of the Regional offices and61 Branch offices on the most populous island, Java.New Branch Offices are created from other BranchOffices within the Region based on the total numberof current employees actively contributing to theschemes. The Branch Offices are graded in sizeaccording to the employee membership numbers andthe grades are:
branches in 2002. These Branch offices are responsiblefor customer service, collection of contributions andprocessing and payment of benefits. The Branchoffices are administered by eight (8) Regional Officesand their locations are shown in Figure 16.
Figure 16 Regional Office Locations
• Grade I – more than 150,000 active members,• Grade II – 100, 000 active members, and• Grade III – maximum of 50,000 active members.
The number of branch offices per Regional office variesin accordance with population density and the locationof employment. The entire service delivery networkas at March 2002 is shown in Figure 17.

3 5
Part II Chapter 6
BRA
NC
H O
FFICES
Figure 17 Service Delivery Network
JAMSOSTEK – SERVICE DELIVERY NETWORK
I IV VIIREGION Medan Bandung Balikpapan
(North Sumatra) (West Java) (Kalimantan)1 Medan 1 Bandung I 1 Balikpapan2 Pematang Siantar 2 Bandung II (Planned) 2 Samarinda3 Kisaran 3 Tangerang I 3 Bontang4 Sibolga 4 Tangerang II (Planned) 4 Tarakan5 Sumatera Barat 5 Bogor I 5 Kotabaru6 Bukit Tinggi 6 Bogor II (Planned) 6 Kal-Bar7 Solok 7 Bekasi I 7 Kal-Sel8 Lhokseumawe 8 Bekasi II (Planned) 8 Palangkaraya9 Langsa 9 Sukabumi 9 Sampit10 D. I. Aceh 10 Tasikmalaya 10 Berau11 Meulaboh 11 Purwakarta12 Tanjung Morawa 12 Serang13 Belawan 13 Cirebon
14 Karawang15 Cimahi16 Majalaya17 Balaraja
II V VIIIREGION Palembang Semarang Makasar
(South Sumatra) (Central Java) (Sulawesi, Maluku & Irian Jaya)
1 Palembang 1 Semarang 1 Makasar2 Dumai 2 Surakarta 2 Palopo3 Jambi 3 Yogyakarta 3 Sulawesi Utara4 Lampung 4 Klaten 4 Sulawesi Tengah5 Bengkulu 5 Cilacap 5 Sulawesi Tenggara6 Pangkal Pinang 6 Pekalongan 6 Gorontalo7 Riau 7 Kudus 7 Maluku8 Rengat 8 Magelang 8 Ternate9 Tanjung Pinang 9 Purwokerto 9 Jayapura10 Pulau Batam 10 Tegal 10 Sorong11 Muara Enim 11 Ungaran 11 Timika12 Kota Bumi13 Duri
III VIREGION Jakarta Surabaya
(Pancoran) (East Java, Bali, West & East NT)
1 Salemba 1 Karimunjawa2 Rawamangun 2 Pasuruan3 Grogol 3 Malang4 Tanjung Priok 4 Sidoarjo5 Setiabudi 5 Gresik6 Gambir 6 Jember7 Cilandak 7 Banyuwangi8 Kebon Sirih 8 Madiun9 Pluit 9 Kediri10 Cawang 10 Mojokerto11 Gatot Subroto 11 Bojonegoro12 Pulo Gadung (Planned) 12 Bangkalan13 Kaliberes (Planned) 13 Blitar14 Kebayoran (Planned) 14 Bali
15 Nusa Tenggara Barat16 Nusa Tenggara Timor17 Darmo18 Surabaya Rungkut (Planned)19 Tanjung Perak
BRA
NC
H O
FFICES
BRA
NC
H O
FFICES

3 6
Part II Chapter 6
Regional Office Structure
Each Regional Office is organised in five sections that reflect the structure of the Branch Offices. The organizationis shown in Figure 18.
Figure 18 Regional Office Structure
JAMSOSTEK Regional Office Organization
Regional Office Roles and ResponsibilitiesThe Regional office is responsible to the nationaladministration for:• Promoting the services of Jamsostek within the
region;• Liaison with the local Depnakertrans Regional
Office or its equivalent provincial administrationunder the terms of regional autonomy;
• Coordination and administration of the Jamsostekbranch offices within the region,
• Monitoring branch office performance;• Monitoring membership compliance across the
region;• Financial management of the regional office and
branches, and• Compliance with policy and standards.
Human ResourcesThe HR section is the largest section in the office(about 9 staff) and comprises the management group.It is responsible for:• Employment of staff;• Recruitment;• Promotion;• Training; and• Personal Services.
IT SupportThe regional IT services group are responsible for:• Maintenance of the integrated Regional database;• Production of regional statistics and reports;• Providing network and database support to the
Branch Offices as required; and• Providing IT outputs and support to the regional
office sections.
Membership and MarketingThe Membership and Marketing section is responsiblefor:• Monitoring of membership management in Branch
offices;• Maintenance of regional and branch membership
statistics; and• Resolution of membership disputes that have been
escalated from branch offices.
Financial ServicesThe financial service section is responsible for:• Monitoring employer contributions for the region;• Monitoring benefits payments for the region;• Production of financial performance statistics; and• Reconciliation of the regional contribution and
payments balances.
Internal auditThe internal audit function is carried out by a singleofficer who is responsible for:• Random spot check of membership files;• Responding to complaints or suspicious activity; and• Random post-claim accuracy checks.
Branch Office StructureThe Branch Offices are the main service deliveryoutlets for Jamsostek customers. The primarycustomer focus is on the employers who areresponsible for registration of their employees in theschemes, payment of monthly contributions andrepresenting their employees’ social insurance affairs.The generic branch office structure is shown in Figure19.
Regional OfficeManagement Total Staff = 30
Personel &GeneralAffairs
Department
ITDepartment
Marketing&
MembershipDepartment
FinancialServices
DepartmentInternal
AuditDepartment

3 7
Part II Chapter 6
Figure 19 Branch Office Structure
JAMSOSTEK Branch Office Organization
Branch OfficeManagement
CustomerServiceSection
IT SupportSection
MarketingSection
FinancialServicesSection
HumanResources
Section
Branch Office Role and ResponsibilitiesCustomer ServicesThe customer services section provides the customercontact facilities for members including reception,counter areas and telephone services.
Human ResourcesThe HR section is responsible for:• Employment of staff;• Induction of recruits;• Promotion;• Training; and• Salary and Personal Services.
IT SupportThe branch IT services group are responsible for:• Maintenance of the Branch database;• Management of the local area network;• Management of the server and application services;• Production of branch statistics for the region and
national offices;• Providing IT support to the users as required; and• Providing IT outputs and support to the branch
office sections.
Membership and MarketingThe Membership and Marketing section is responsiblefor:• Monitoring of membership management in the
offices;• Case management of a dedicated group of
employers (between 75 – 100);• Adding new members;• Maintenance of the needs of existing members;• Compliance visits to employer groups members;• Maintenance of the branch membership statistics;• Resolution of membership disputes; and• Escalation of unresolved disputes to the regional
office.
Financial ServicesThe financial service section is responsible for:• Issue of payments to eligible claimants;• Monitoring employer contributions for the branch;• Monitoring benefits payments for the branch;• Production of financial performance statistics; and• Reconciliation of the branch contribution and
payments balances.
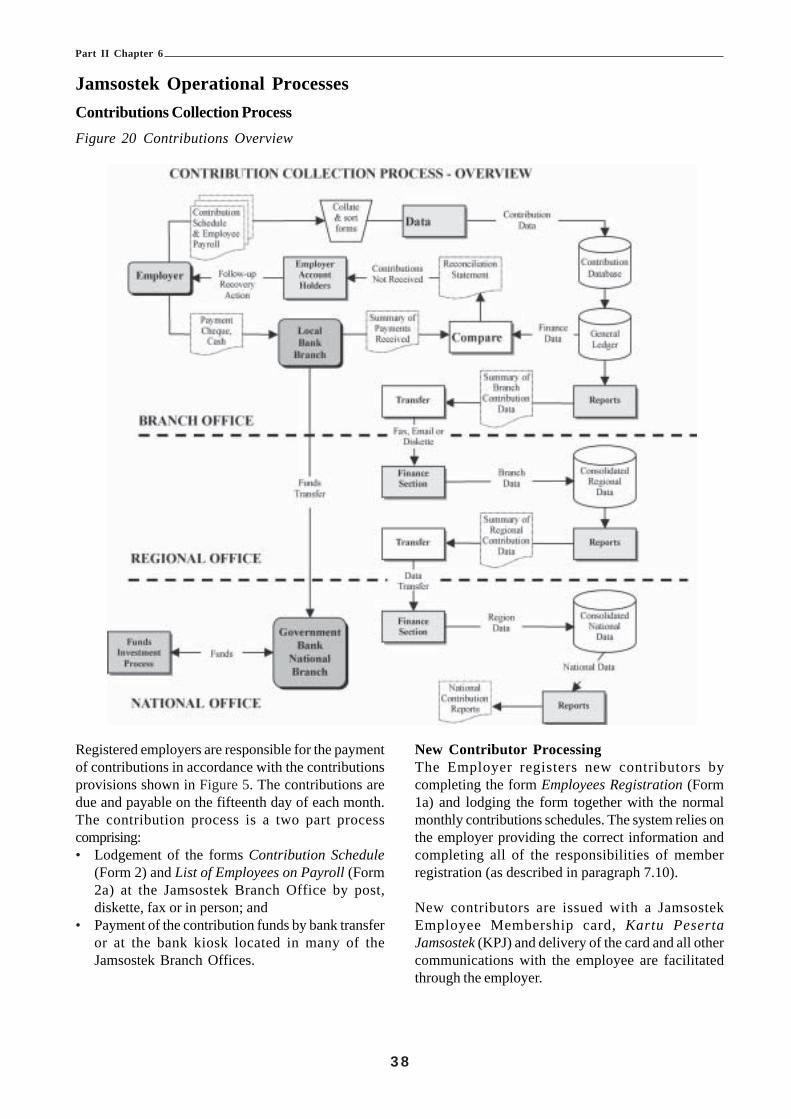
3 8
Part II Chapter 6
Registered employers are responsible for the paymentof contributions in accordance with the contributionsprovisions shown in Figure 5. The contributions aredue and payable on the fifteenth day of each month.The contribution process is a two part processcomprising:• Lodgement of the forms Contribution Schedule
(Form 2) and List of Employees on Payroll (Form2a) at the Jamsostek Branch Office by post,diskette, fax or in person; and
• Payment of the contribution funds by bank transferor at the bank kiosk located in many of theJamsostek Branch Offices.
New Contributor ProcessingThe Employer registers new contributors bycompleting the form Employees Registration (Form1a) and lodging the form together with the normalmonthly contributions schedules. The system relies onthe employer providing the correct information andcompleting all of the responsibilities of memberregistration (as described in paragraph 7.10).
New contributors are issued with a JamsostekEmployee Membership card, Kartu PesertaJamsostek (KPJ) and delivery of the card and all othercommunications with the employee are facilitatedthrough the employer.
Jamsostek Operational ProcessesContributions Collection ProcessFigure 20 Contributions Overview

3 9
Part II Chapter 6
Claims Processing Overviews
Figure 21 Retirement Programs Claim Process
There are seven eligibility criteria for payment ofretirement benefits. Claims for death benefits aremade on the form Application for Payment of DeathBenefits (Form 4). All other retirement program claimsare made by completing the form, Application forPayment of Old Age Benefits (Form 5) and lodgingthe form together with the relevant documentaryevidence (originals) required for the category of claim.The retirement program payment categories and thesupporting documentary requirements are:
(i) Reaches the 56th year (i.e. turns 55):1. Original Jamsostek Member Card (KPJ)2. Personal ID Card, Kartu Tanda Penduduk
(KTP).3. Family Identification Card (Kartu Keluarga).
(ii) Death of Member:1. Original Jamsostek Member card (KPJ).2. Personal ID card for deceased members and
next-of-kin (Ahli Waris).3. Family Identification Card (Kartu Keluarga).4. Authorised letter of authentication of death of
member.
(iii) Total Permanent Invalidity:1. Original Jamsostek Members Card (KPJ).2. Personal ID Card (KTP).3. Family Identification Card (Kartu Keluarga).4. Referral letter from the Medical Officer
supporting the claim for disability.
(iv) Leaving the Republic of Indonesia:1. Original Jamsostek Members Card (KPJ).
2. Personal ID Card (KTP).3. Passport.4. Copy of Visa for Indonesian Labour.5. Statutory declaration of intention to no longer
work in Indonesia (Surat Pernyataan tidakbekerja lagi di Indonesia).
(v) Members now employed in the DefenceForces/Government Employee:1. Original Jamsostek Members Card (KPJ).2. Personal ID Card (KTP).3. Family Identification Card (Kartu Keluarga).4. Letter confirming employment as a
Government Employee or in the DefenceForces (Surat Keputusan PengangkatanSebagai PNS/ABRI).
(vi) Termination of membership as a result ofunemployment (after a period of membershipof no less than five(5) years):1. Original Jamsostek Members Card (KPJ).2. Personal ID Card (KTP).3. Family Identification Card (Kartu Keluarga).4. Letter confirming termination of employment/
PHK from the Company.
(vii)Others (Letter of Agreement from Ministry ofMan Power 117/1986):1. Original Jamsostek Members Card (KPJ).2. Personal ID Card (KTP).3. Family Identification Card (Kartu Keluarga).4. Letter confirming no further involve in the
organization (Tidak Terlibat Organisasi).

4 0
Part II Chapter 6
Work Injury Claim ProcessThe Work Injury process is a three-stage processcomprising two stages of accident/injury reportingfollowed by a claim for payment after assessment andtreatment of the injury. Jamsostek uses prescribedmedical service providers for primary treatment. Theprocedures require that the employer is to notify themedical service providers and Depnakertrans within48 hours of every workplace injury, this is the firststage of work injury reporting. The second stage ofreporting is required within 48 hours after receipt ofthe medical report, recovery, permanent invalidity ordeath of the employee. The compliance with thereporting process is very low and despite the availabilityof coloured, carbonised forms the notification of injuryto Depnakertrans is often not made. The reportingforms have a distribution list for each copy and as aresult of progressive modifications to the form thedistribution addressees on some forms refer to copiesno longer on the form. Low reporting rates may bepartially due to the legislative requirement to report allinjuries no matter how minor they may be and theexcessive time involved in compliance has resulted invery few accident reports being made. Localarrangements with Jamsostek offices to report workinjuries to Depnakertrans have not been entirelysuccessful.
The result of non-reporting is that unsafe workplacesevade inspections and enforcement action by theDepnakertrans labour inspectors. A process thatprovides a balance between internal recording of minorinjuries and external reporting of potentially seriousinjuries should be implemented to encourage reporting.Jamsostek has a role to play in the reporting process(to Depnakertrans) in that it is able to screen theinjuries from the medical officers reports where theinjuries and treatment are described in detail.Jamsostek could forward to Depnakertrans theaccident report forms that relate to specific accidentswhere workplace safety, working conditions and otherserious environmental risks were factors in theaccident.
The forms used in the Work Injury claim process are:Form 3 Employment Accident Report Phase 1 (5
part carbonised form),Form 3a Employment Accident Report Phase 2 (5
part carbonised form),Form 3b Doctors Certificate,Form 3c Doctors Certificate for Employment Related
Diseases, andForm 3d Claim for Work Injury Benefits.
Figure 22 Work Injury Program Claims Process

4 1
Part II Chapter 6
Registration
The employer performs the current process forregistration of members for Retirement, Work Injuryand Life programs. Existing employer members reportnew employees on Form 1a and this results in thecreation of an individual account (retirement only) andthe issue of a membership card. The employerperforms all of the other elements of a registrationprocess for all new members. This is a weakness ofthe current system as there is no guarantee or evidenceto confirm that the employee has been given, orunderstands the rights and obligations of membershipof the Jamsostek insurance programs.
Most of the traditional elements of a registrationsystem are performed as part of the claim process atthe end of the insurance lifecycle and not at the initialstage of membership. This is generally too late forproof of identity and for the date of birth to be verified.Forms used for registration are:Form 1 Employers Registration.Form 1a Employees Registration.Form 1b List of Family Members.Form 1c List of Outgoing Employees.
Payment Processing
Payment processing is based on bank transfer as thepreferred method of payment to members. There arealso provisions for the payment by cheque or cash forurgent cases. The cash payment is usually arrangedby the issue of a cheque that is cashed by the localbank branch, often located as a kiosk within someBranch offices.
Authority for payment is made as part of the claimsprocessing function and approval delegations are basedon the total amount of the payment. Amounts of Rp.1.2 million can be approved by the supervisor and forhigher amounts; the deputy manager and branchmanager are the delegates.
Health Insurance Program
The Jamsostek Health Insurance program is thesmallest program in relation to membership but one ofthe largest programs in terms of work activity andtransactions. The program covers about 1.5 millionmembers including the spouse and the first threechildren of married members. The membership rateis probably less than 10% of the membership in theretirement program and the low membership is theresult of the opt-out provision of the program.
Employees can opt-out of the Jamsostek HealthInsurance Program if they receive health care forman employer based or private health care scheme. Thishas reduced the program effectiveness byconcentrating the number of low-income members andthe health insurance risk. The scheme has a ceilingcontribution salary of Rp. 1,000,000 so that employeeswith higher incomes have their contributions fixed ata maximum of Rp. 30,000 or Rp. 60,000 for marriedmembers. As a result of this, contributions are lowerthan the Indonesian average, fewer services areprovided at a lower standard and member satisfactionis low.
Health care services are outsourced to main providers,generally profit oriented private organizations that subcontract the provision of health care to other localproviders. The end state of the service delivery forJamsostek members is that health care is oftendelivered through the public system at the samestandard as the poorer members of society. Thedifferentiation of service that is expected by membersin many cases is not provided due to the complexcontractual arrangements through the main providers.In Jakarta region the situation has deteriorated to suchan extent that the contract with the main serviceprovider has been cancelled as a result of theunsatisfactory service both to members and to theservice providers. In the interim, health care servicesare being delivered through five of the eleven BranchOffices and the Regional Office is to assume the roleof the main service provider until a new contract isnegotiated.
The service delivery standards are further affectedby the limited automation provided for the healthinsurance system. Health insurance programs are onlypartially integrated into the main Jamsostek InformationSystems application Sistem Informasi PelayananTerpadu (SIPT). Most staff choose not to use thehealth care functions in SIPT and they have replacedthe operations and processing functions by a range oflocally developed applications in Branch offices. Thereis a lack of national standardisation in the health caresystems across the service delivery network. Re-development of the health insurance systems is still inthe conceptual stage but is a lower priority than forthe other components of SIPT.Health care registration comprises the identificationof the member and allocation of the member to theappropriate service providers who are then authorisedto provide health care to the member. The memberservice section in the Branch Office is responsible
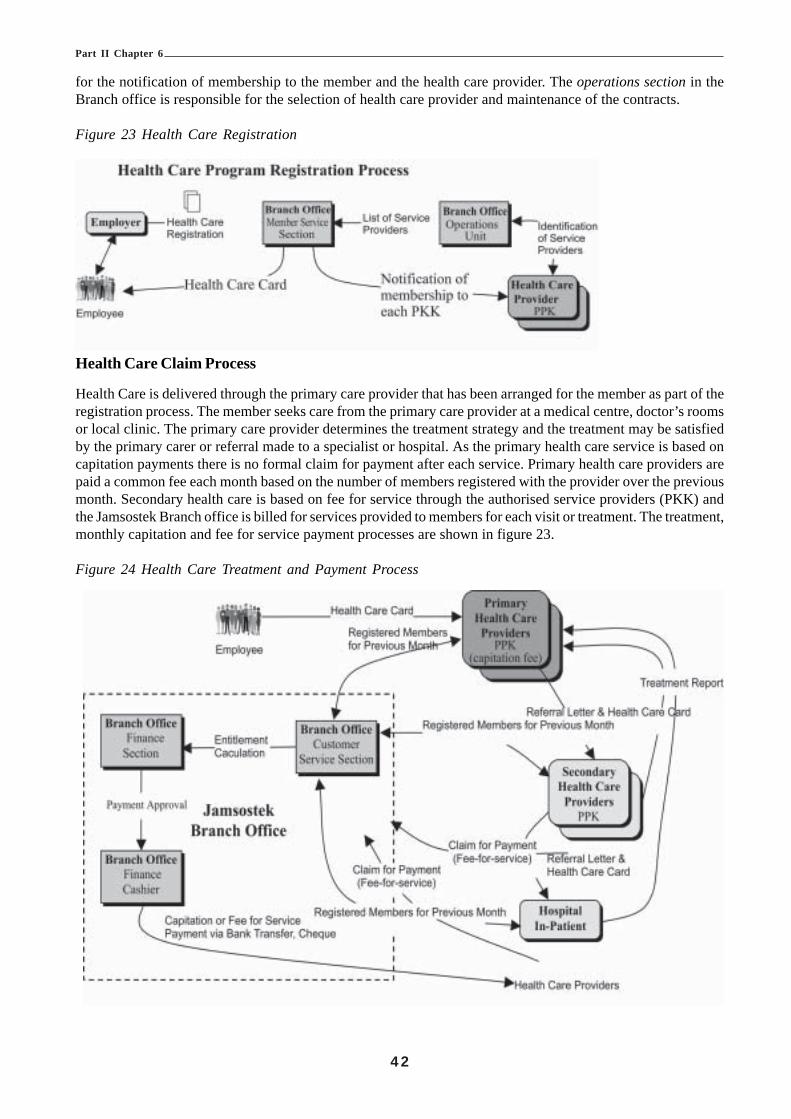
4 2
Part II Chapter 6
for the notification of membership to the member and the health care provider. The operations section in theBranch office is responsible for the selection of health care provider and maintenance of the contracts.
Figure 23 Health Care Registration
Health Care Claim Process
Health Care is delivered through the primary care provider that has been arranged for the member as part of theregistration process. The member seeks care from the primary care provider at a medical centre, doctor’s roomsor local clinic. The primary care provider determines the treatment strategy and the treatment may be satisfiedby the primary carer or referral made to a specialist or hospital. As the primary health care service is based oncapitation payments there is no formal claim for payment after each service. Primary health care providers arepaid a common fee each month based on the number of members registered with the provider over the previousmonth. Secondary health care is based on fee for service through the authorised service providers (PKK) andthe Jamsostek Branch office is billed for services provided to members for each visit or treatment. The treatment,monthly capitation and fee for service payment processes are shown in figure 23.
Figure 24 Health Care Treatment and Payment Process

4 3
Part II Chapter 6
Investment Management
With its current status as a Persero, the financialmanagement in Jamsostek is controlled by thegovernment, through the Minister of Finance as thesole shareholder of the company. In the past,investments have not always maximised the returns tothe members. An example of low returns is theconstruction of Menara Jamsostek, a luxury officetower in Jakarta central business district that hasremained substantially vacant since its construction asa result of the downturns in the world economy.Jamsostek has consistently come under pressure to
invest members’ funds in government enterprises atless than commercial rates.
It is expected that with appropriate supportinglegislation a tripartite trust fund reporting directly tothe People’s Assembly through a minister should beable to maximise the investment return to membersThe current Balance Sheet for Year Ending March 312001 and December 2000 is shown in Figure 25 as anindication of the assets of Jamsostek and a broad viewof the investment performance.
Figure 25 Current Balance Sheet
No. ASSETS 2001 2000
1 CURRENT ASSETSCASH AT BANK 20,926 17,960
Premium Receivable 20,090 19,120Other Income 84,264 110,980Other Receivable 8,452 4,114Other Assets 5,385 5,169
Total Current Assets 139,117 157,3432 INVESTMENTS
Time Deposits 10,346,554 10,004,179Marketable Securities – Shares 593,664 711,228Bonds 1,481,086 1,095,544Land and Buildings 440,267 433,847Other Investments 43,292 44,933
Total Investments 12,904,863 12,289,7313 FIXED ASSETS 114,179 103,3374 OTHER ASSETS 48,923 51,496
TOTAL ASSETS 13,207,082 12,601,907

4 4
Part II Chapter 6
No. LIABILITES AND CAPITAL 2001 20005 CURRENT LIABILITIES
CLAIMS 4,662 27,010Tax 2,550 5,081Accrued Operational Expenses 1,888 4,343Unearned Revenue 761 860Other Liabilities 54,502 76,335
Total Current Liabilities 64,363 113,629
6 LONG TERM LIABILITIES 11,429,708 10,810,014
7 TECHNICAL RESERVES 1,270,907 1,230,588
8 OTHER RESERVES 4 4
9 CAPITALPaid in Capital 62,500 62,500
GENERAL RESERVES 52,054 175,992Retained Earnings 203,564 0Current Net Profit 123,982 209,250
Total Capital 422,100 447,672
TOTAL LIABILITIES AND CAPITAL 13,207,082 12,601,907
An overview of the investment management process is shown in Figure 26.
44
Part II Chapter 6
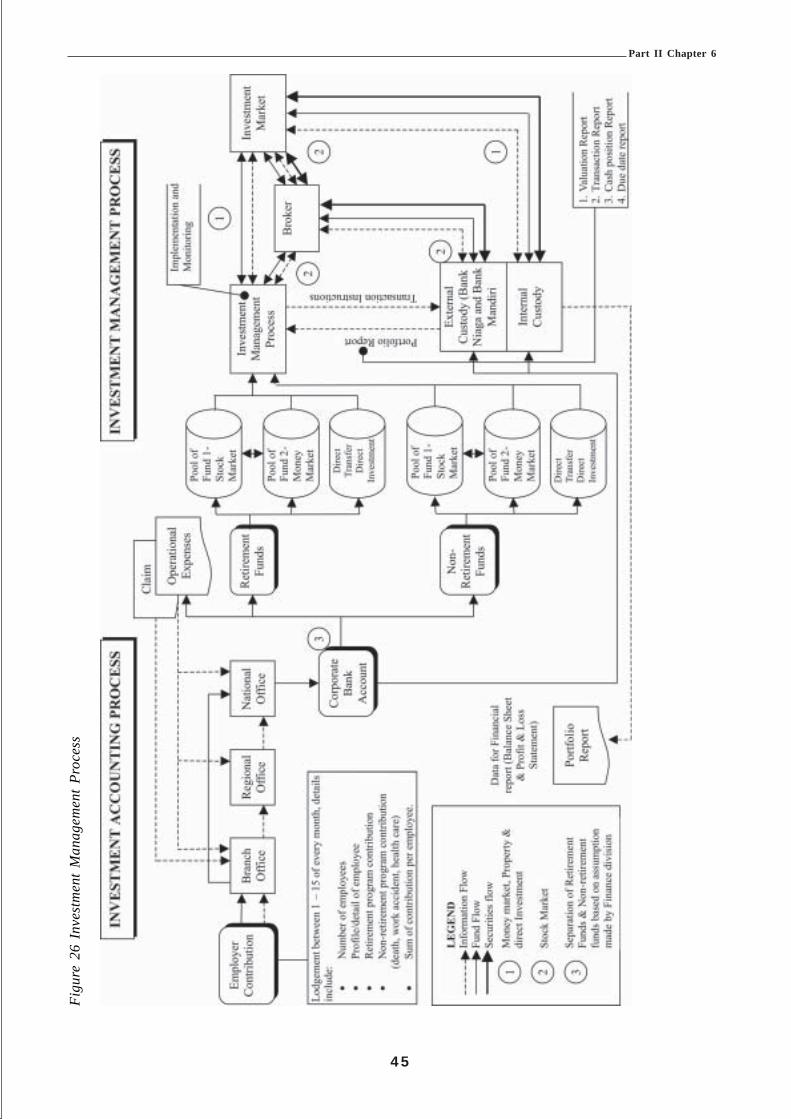
4 5
Part II Chapter 6
Figu
re 2
6 In
vest
men
t M
anag
emen
t Pr
oces
s
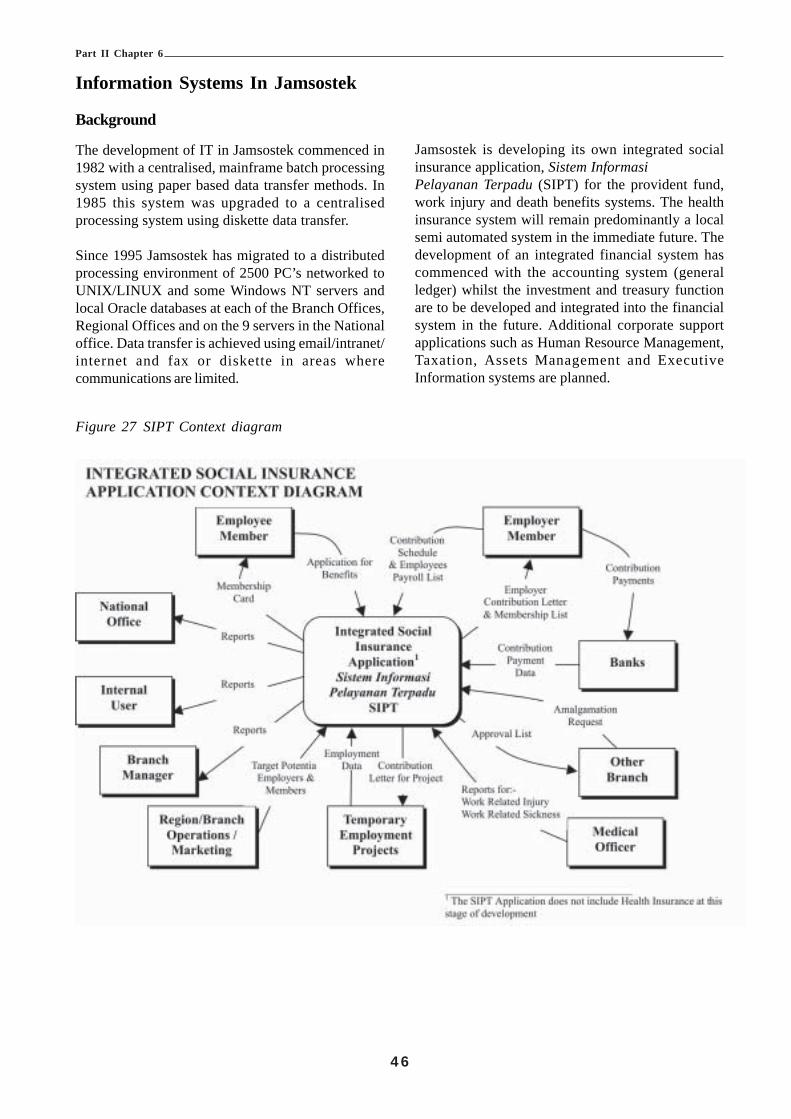
4 6
Part II Chapter 6
Information Systems In Jamsostek
Background
The development of IT in Jamsostek commenced in1982 with a centralised, mainframe batch processingsystem using paper based data transfer methods. In1985 this system was upgraded to a centralisedprocessing system using diskette data transfer.
Since 1995 Jamsostek has migrated to a distributedprocessing environment of 2500 PC’s networked toUNIX/LINUX and some Windows NT servers andlocal Oracle databases at each of the Branch Offices,Regional Offices and on the 9 servers in the Nationaloffice. Data transfer is achieved using email/intranet/internet and fax or diskette in areas wherecommunications are limited.
Jamsostek is developing its own integrated socialinsurance application, Sistem InformasiPelayanan Terpadu (SIPT) for the provident fund,work injury and death benefits systems. The healthinsurance system will remain predominantly a localsemi automated system in the immediate future. Thedevelopment of an integrated financial system hascommenced with the accounting system (generalledger) whilst the investment and treasury functionare to be developed and integrated into the financialsystem in the future. Additional corporate supportapplications such as Human Resource Management,Taxation, Assets Management and ExecutiveInformation systems are planned.
Figure 27 SIPT Context diagram

4 7
Part II Chapter 6
Existing Network - Overview
The existing network is comprised of Local AreaNetworks (LAN’s) in each of the 108 Branch Offices,8 Regional Offices and the National Office. The datacommunications medium between the sites is the PublicSwitched Telephone Network (PSTN) using dial up
SENDER
modems or via the Internet. In remote or isolatedbranch sites where communications is limited, datacommunication is facilitated by Internet, fax or diskette(post or courier). A summary diagram of the existingnetwork is shown in Figure 28.
Figure 28 Existing Communications Summary
Type ofinformation Branch-Office Regional-Office National-Officebeing sentbetween
R E C E I V E RMember data requested, due Local Branch Transaction data, Local Branch Transaction data,
Branch to provident fund withdrawal sent Monthly using Diskette, sent Monthly using Diskette,
Office using Fax-machine. E-Mail, or Printed Out Report E-Mail, or Printed Out Report
Facilities: PSTN Facilities: PSTN, ISP & Facilities: PSTN, ISP &
Courier Service Courier Service
Consolidated Branches
Regional Summary Report, sent monthly
Office using Diskette, E-Mail, or Print-
Out Report Facilities: PSTN,
ISP & Courier Service
NationalOffice
Proposed Network - OverviewPlanning has commenced to increase the capacity ofthe communications network and the first stage of thisexpansion will be the connection of the 8 RegionalOffices to the National Office with a Frame Relayservice. This should provide capacity of up to 1 Mbps.The extension of the network beyond the RegionalOffices to their respective Branch Offices will be partof subsequent phases. Most of the Branch Offices inJabotabek will also be included in the initial
implementation of the Frame Relay services networkto the Regional Offices.
A review of the communications capacity for the entirenetwork had been completed and the proposed linksand capacities between sites are summarised in thefollowing diagram.An overview of the first stage of the proposed networkis shown below.
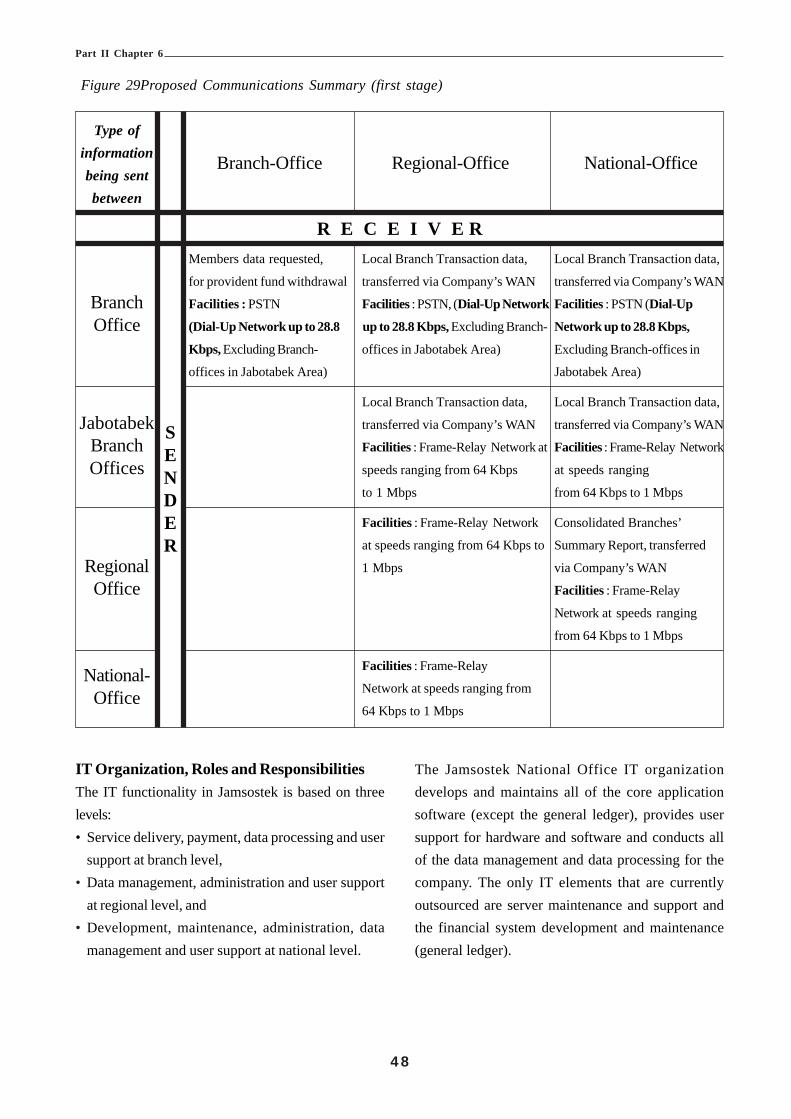
4 8
Part II Chapter 6
Figure 29Proposed Communications Summary (first stage)
Type ofinformation Branch-Office Regional-Office National-Officebeing sentbetween
R E C E I V E RMembers data requested, Local Branch Transaction data, Local Branch Transaction data,
for provident fund withdrawal transferred via Company’s WAN transferred via Company’s WAN
Branch Facilities : PSTN Facilities : PSTN, (Dial-Up Network Facilities : PSTN (Dial-Up
Office (Dial-Up Network up to 28.8 up to 28.8 Kbps, Excluding Branch- Network up to 28.8 Kbps,
Kbps, Excluding Branch- offices in Jabotabek Area) Excluding Branch-offices in
offices in Jabotabek Area) Jabotabek Area)
Local Branch Transaction data, Local Branch Transaction data,
Jabotabek transferred via Company’s WAN transferred via Company’s WAN
Branch Facilities : Frame-Relay Network at Facilities : Frame-Relay Network
Offices speeds ranging from 64 Kbps at speeds ranging
to 1 Mbps from 64 Kbps to 1 Mbps
Facilities : Frame-Relay Network Consolidated Branches’
at speeds ranging from 64 Kbps to Summary Report, transferred
Regional 1 Mbps via Company’s WAN
Office Facilities : Frame-Relay
Network at speeds ranging
from 64 Kbps to 1 Mbps
National- Facilities : Frame-Relay
Office Network at speeds ranging from
64 Kbps to 1 Mbps
SENDER
IT Organization, Roles and ResponsibilitiesThe IT functionality in Jamsostek is based on threelevels:• Service delivery, payment, data processing and user
support at branch level,• Data management, administration and user support
at regional level, and• Development, maintenance, administration, data
management and user support at national level.
The Jamsostek National Office IT organizationdevelops and maintains all of the core applicationsoftware (except the general ledger), provides usersupport for hardware and software and conducts allof the data management and data processing for thecompany. The only IT elements that are currentlyoutsourced are server maintenance and support andthe financial system development and maintenance(general ledger).

4 9
Part II Chapter 6
National Office IT Organization, Roles Responsibilities (Current)The current National IT Department has 19 staff organised in two sections, Systems & Hardware and Data &Applications.
The National IT Manager is responsible to the Director of Finance and Information for the following functions:• Maintenance and development of the existing systems and applications;• Providing user support to the Regional and Branch offices;• Developing new systems and enhancements in accordance with the agreed strategic priorities;• Recruitment and training of staff in the National Office; and• Providing advice to the Director and the Jamsostek executive about IT technical issue; and developments,
constraints and providing recommendations on all aspects of IT in Jamsostek.
Figure 30 Existing IT Organization
National Office IT Organization, Roles Responsibilities (Proposed)
The proposed National IT Department will have 26 staff organised into three sections, Applications Development,Technical Support and Data & Infrastructure.

5 0
Part II Chapter 6
Figure 31 IT Organization (Proposed)
The overall role and responsibilities for the ITDepartment and the Manager remain unchanged. Therole and responsibilities of the restructured sectionsare described below.
(i) Applications Development SectionThis section is responsible to the IT manager for:• Analysis of new and existing business rules and
the development of user requirements andsystem specification;
• Design of new modules or applications forJamsostek;
• Construction, testing and release of new andmodified programs; and
• Maintenance of system documentation.
(ii) Technical Support SectionThis section is responsible to the IT manager for:• Server and desktop operating systems;• Upgrades and implementation of upgrades;• Network monitoring and support;• Fault finding and fault escalation to service
providers; and• User support to Region and Branch offices.
(iii) Data & Infrastructure SectionThis section is responsible to the IT manager for:• Database administration;• Maintenance of data standards across
Jamsostek;• Liaison with Regional Offices and Branch
offices;• Monitoring of Regional and Branch office data
management processes;
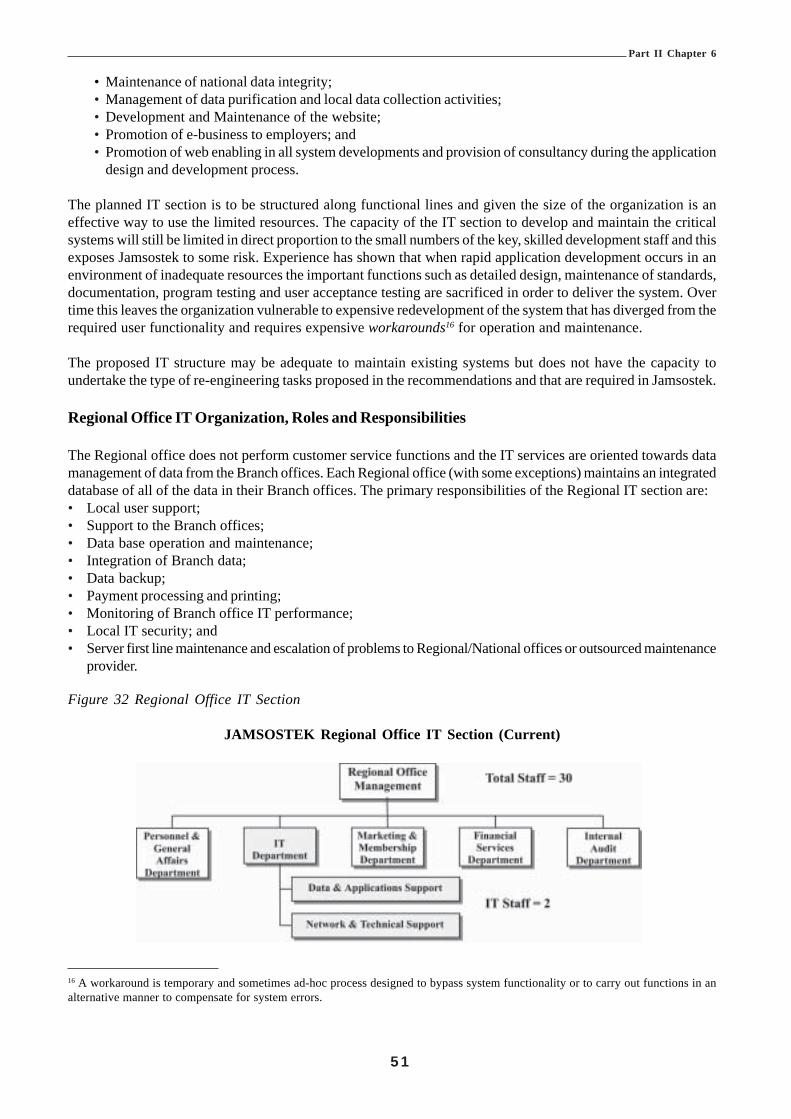
5 1
Part II Chapter 6
• Maintenance of national data integrity;• Management of data purification and local data collection activities;• Development and Maintenance of the website;• Promotion of e-business to employers; and• Promotion of web enabling in all system developments and provision of consultancy during the application
design and development process.
The planned IT section is to be structured along functional lines and given the size of the organization is aneffective way to use the limited resources. The capacity of the IT section to develop and maintain the criticalsystems will still be limited in direct proportion to the small numbers of the key, skilled development staff and thisexposes Jamsostek to some risk. Experience has shown that when rapid application development occurs in anenvironment of inadequate resources the important functions such as detailed design, maintenance of standards,documentation, program testing and user acceptance testing are sacrificed in order to deliver the system. Overtime this leaves the organization vulnerable to expensive redevelopment of the system that has diverged from therequired user functionality and requires expensive workarounds16 for operation and maintenance.
The proposed IT structure may be adequate to maintain existing systems but does not have the capacity toundertake the type of re-engineering tasks proposed in the recommendations and that are required in Jamsostek.
Regional Office IT Organization, Roles and Responsibilities
The Regional office does not perform customer service functions and the IT services are oriented towards datamanagement of data from the Branch offices. Each Regional office (with some exceptions) maintains an integrateddatabase of all of the data in their Branch offices. The primary responsibilities of the Regional IT section are:• Local user support;• Support to the Branch offices;• Data base operation and maintenance;• Integration of Branch data;• Data backup;• Payment processing and printing;• Monitoring of Branch office IT performance;• Local IT security; and• Server first line maintenance and escalation of problems to Regional/National offices or outsourced maintenance
provider.
Figure 32 Regional Office IT Section
JAMSOSTEK Regional Office IT Section (Current)
16 A workaround is temporary and sometimes ad-hoc process designed to bypass system functionality or to carry out functions in analternative manner to compensate for system errors.

5 2
Part II Chapter 6
Branch Office IT Organization
The Branch Office is the source of customer information and the IT section comprises three IT staff with thefollowing responsibilities:• Data entry of information;• Local user support;• Data base operation and maintenance;• Data backup;• Payment processing and printing;• Local IT security; and• Server first line maintenance and escalation of problems to Regional/National offices or outsourced maintenance
provider.
Figure 33 Branch Office IT Organization
JAMSOSTEK Branch Office IT Section (Current)
Software and Applications in Jamsostek
The current core applications in use in Jamsostek are shown in Figure 34.
Figure 34 Software Inventory
Jamsostek – Core IT ApplicationsTitle Program Major Functions Development & Programming National Regional Branch
Maintenance Language Office Office Office
SIPT Operational Membership Registration, Developed by 3rd PartyContribution Payment, Maintained by PL/SQL " "Claimant & Benefit Payment. Jamsostek’s IT Dept
GL-ORA General Operational General Ledger Developed andLedger maintained by 3rd Party PL/SQL " " "
SIJAKA Taxation Taxation Developed andsystem maintained by PL/SQL " " "
Jamsostek’s IT Dept
SDM Personnel Personnel Database, Developed andPersonnel Administration, maintained by PL/SQL " "Payroll System. Jamsostek’s IT Dept
SIAT Fixed Asset Fixed Asset Management Developed andmaintained by PL/SQL "Jamsostek’s IT Dept

5 3
Part II Chapter 6
The core application in Jamsostek is SIPT and is evolving to become a fully integrated Social Insurance Applicationthat will eventually include all programs. At present SIPT provides functionality for Retirement Programs, LifePrograms and Work Injury Programs. Health Insurance remains a series of partially automated locally developedsystems.
The overview diagram of SIPT is shown in Figure 35.
Figure 35 SIPT Overview Diagram

5 4
Part II Chapter 6
HardwareJamsostek completed a major hardware implementation in 1995 when the operating systems were upgraded toUNIX. Since then hardware has been upgraded on a rolling Region-by-Region basis.
Figure 36 Current Data Architecture
The data capacity in the Branches and Regional Officesvaries according to employee membership numbersand some Branch Offices are at up to 87% of capacity,Regional offices at about 60% and National office at80% capacity. Almost half of this data is for inactivemembers, which is only accessed infrequently andmostly at the time of claiming for benefits. It should benoted that not all of the Regional offices are able toconsolidate all of the Branch office data due to lack ofdata storage capacity in their regions and thisfunctionality is expected to become available duringupgrades planned in 2002.
The inactive data also contains records that havealready been paid and are stored with the activeoperational data. The timeliness standard for paymentof retirement claims where the member is inactive andclaims as a result of unemployment is in the seventh
month after claim (Law No. 3 1993, Article 32 Para2). Other payment timeliness standards for inactivemembers are not less than one month.
It should be possible to archive the inactive andcompleted claims and retrieve the records on requestprobably during overnight processing or from localoptical or disk storage.
Data BackupData backup routines are run in all Jamsostek sites.The most frequent backups occur in Branch Officeswhere Grade I offices conduct daily backups and thesmaller offices conduct weekly backups. RegionalOffices and the National Office conduct monthlybackups following the monthly aggregation of datafrom branch offices.
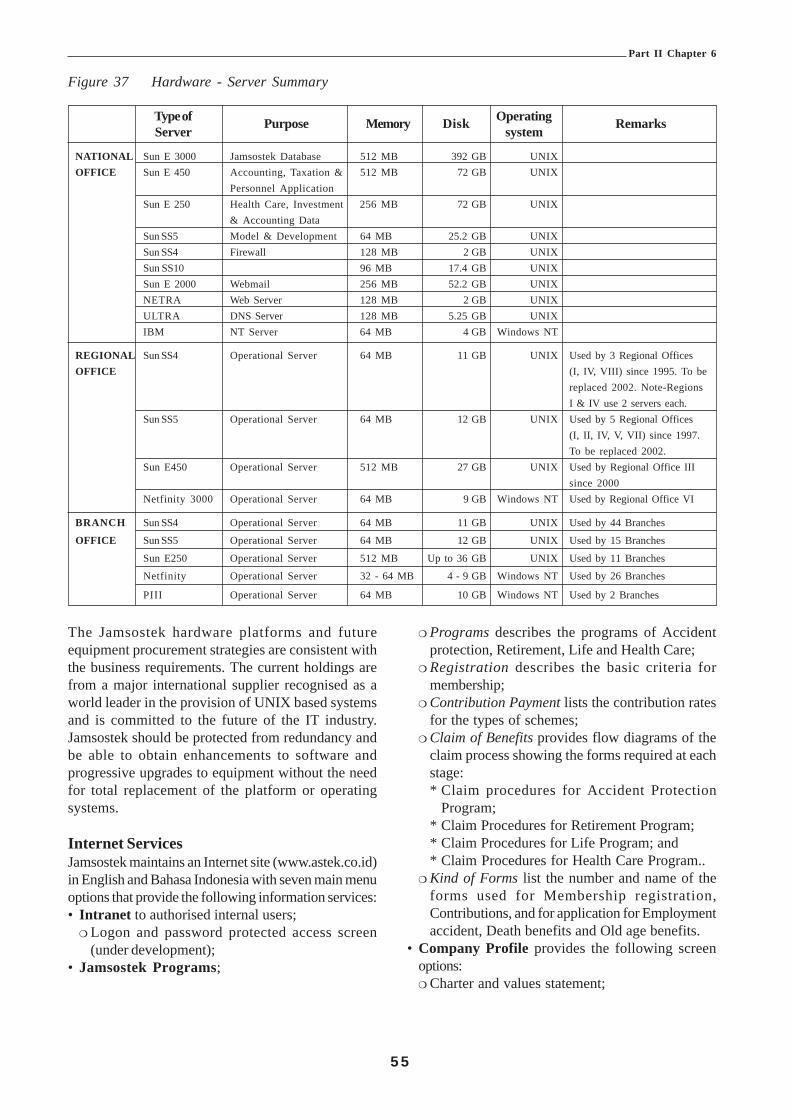
5 5
Part II Chapter 6
Figure 37 Hardware - Server Summary
Type of Purpose Memory Disk Operating RemarksServer system
NATIONAL Sun E 3000 Jamsostek Database 512 MB 392 GB UNIXOFFICE Sun E 450 Accounting, Taxation & 512 MB 72 GB UNIX
Personnel ApplicationSun E 250 Health Care, Investment 256 MB 72 GB UNIX
& Accounting DataSun SS5 Model & Development 64 MB 25.2 GB UNIXSun SS4 Firewall 128 MB 2 GB UNIXSun SS10 96 MB 17.4 GB UNIXSun E 2000 Webmail 256 MB 52.2 GB UNIXNETRA Web Server 128 MB 2 GB UNIXULTRA DNS Server 128 MB 5.25 GB UNIXIBM NT Server 64 MB 4 GB Windows NT
REGIONAL Sun SS4 Operational Server 64 MB 11 GB UNIX Used by 3 Regional OfficesOFFICE (I, IV, VIII) since 1995. To be
replaced 2002. Note-RegionsI & IV use 2 servers each.
Sun SS5 Operational Server 64 MB 12 GB UNIX Used by 5 Regional Offices(I, II, IV, V, VII) since 1997.To be replaced 2002.
Sun E450 Operational Server 512 MB 27 GB UNIX Used by Regional Office IIIsince 2000
Netfinity 3000 Operational Server 64 MB 9 GB Windows NT Used by Regional Office VI
BRANCH Sun SS4 Operational Server 64 MB 11 GB UNIX Used by 44 Branches
OFFICE Sun SS5 Operational Server 64 MB 12 GB UNIX Used by 15 Branches
Sun E250 Operational Server 512 MB Up to 36 GB UNIX Used by 11 Branches
Netfinity Operational Server 32 - 64 MB 4 - 9 GB Windows NT Used by 26 Branches
PIII Operational Server 64 MB 10 GB Windows NT Used by 2 Branches
The Jamsostek hardware platforms and futureequipment procurement strategies are consistent withthe business requirements. The current holdings arefrom a major international supplier recognised as aworld leader in the provision of UNIX based systemsand is committed to the future of the IT industry.Jamsostek should be protected from redundancy andbe able to obtain enhancements to software andprogressive upgrades to equipment without the needfor total replacement of the platform or operatingsystems.
Internet ServicesJamsostek maintains an Internet site (www.astek.co.id)in English and Bahasa Indonesia with seven main menuoptions that provide the following information services:• Intranet to authorised internal users;
! Logon and password protected access screen(under development);
• Jamsostek Programs;
! Programs describes the programs of Accidentprotection, Retirement, Life and Health Care;
! Registration describes the basic criteria formembership;
! Contribution Payment lists the contribution ratesfor the types of schemes;
! Claim of Benefits provides flow diagrams of theclaim process showing the forms required at eachstage:* Claim procedures for Accident Protection
Program;* Claim Procedures for Retirement Program;* Claim Procedures for Life Program; and* Claim Procedures for Health Care Program..
! Kind of Forms list the number and name of theforms used for Membership registration,Contributions, and for application for Employmentaccident, Death benefits and Old age benefits.
• Company Profile provides the following screenoptions:! Charter and values statement;

5 6
Part II Chapter 6
! History of Jamsostek;! Commissioners;! Directors; and! The Balance sheet for the last two quarters.
• Jamsostek Address provides a map of Indonesiashowing the eight Regional Office locations with thefacility to list the Regional and Branch offices, theirrespective physical and email addresses.
• Information provides the following options:! Meaning of the Jamsostek logo;! List of the Chiefs of Division, Bureau and Regional
Offices,! Claim procedures lists the claim options for the
retirement program and the documentary evidencethe must be provided with the claim (a downloadoption is available),
! Statistics provides options for the followingstatistical tables:* Complete program;* JPK Program;* Special Program;* Jamsostek Members by Company;* Jamsostek Members by Age;* Jamsostek Members by Sex;* Jamsostek Members by ILO code; and* New membership entrants (last 3 years).
• Forum page is still under construction;• Webmail provides:
! logon and password protected option; and! option to send email to Jamsostek.
The website is an information website and itsfunctionality has not yet been extended for businesstransactions. In the future Jamsostek would like toextend the website to include contributions reporting.At this time the computerisation of business enterprisesin Indonesia is limited and is not considered to be costeffective at this stage. However provision of aninteractive Internet facility may generate additionaldemand by employers by virtue of the efficiencies thatcan be gained by automating the lodgement processes.
Application Development and Maintenance
The IT development process in Jamsostek is aninformal process and the degree of formality dependsupon the scope and size of the developmentrequirement. Minor enhancements are managed in thesection whilst larger developments use a more formalprocess that involves users in joint application designworkshops.
The drivers for the development process are businesschanges, planned strategic developments, enhancementrequests and user fault reports. Until 2000 enhancementrequests and faults were logged and incorporated intothe maintenance schedule so that like changes couldbe grouped and incorporated into one upgrade.However the logging process has ceased pendingincorporation into new IT standards.
Most development projects use operations and servicesusers or other relevant stakeholders in the businessanalysis process, testing and implementation stages.The normal implementation process is piloting in onebranch office or region followed by full-scaleimplementation.
IT SecurityIT security is delegated to local sites and the currentlevels of security comprise a single logon identity andpassword that allows a user to logon to the LAN andto all of the corporate applications.
The access is managed by the IT support officer inthe Region or Branch and is often delegated to theoffice manager in the absence of the IT support staff.It is common knowledge that in some offices all staffmembers have used a generic password.
An overview assessment of the standard of IT securityis that it is generally low and any standards areinconsistently applied across the network. A singleaccess to all systems exposes Jamsostek to the risk ofinternal and external fraud. It is desirable that onlyusers with delegation to use an application should begiven access to the application. For example only userswith direct responsibility for the Health Care systemshould be allowed to access the system through anapplications access code in addition to the server logonaccess. This can be achieved by obtaining a staff anduser profile that identifies the application requirementsfor each position in the office. The application accesscode would then allow an individual user access to theapplications and products needed for the position. Allother applications and products would be denied to thatuser. This type of two-stage access will give additionalconfidence over internal fraud and unauthorised accessto the server. Additional protection against internalfraud can be obtained by recording on a log file theaccess details for all critical transactions. This log filecan be used to monitor assessor actions and theexistence of a transaction log file is a deterrent againstinternal fraud and misuse of the social securitycomputing application.

5 7
Part II Chapter 6
Whilst it is accepted that security is an individualresponsibility it must be controlled and monitored atthe highest levels in the organization and given theimportance that is required to maintain acceptablestandards.
A typical IT security process used in other largesocial security organizations has been providedseparately to the IT manager in Jamsostek to illustratethe degrees and importance of IT security. Thisdocument contains, standards, descriptions anddefinitions of the security elements.
Project ManagementThe IT project management methods used inJamsostek are informal methods and are structuredalong local lines in the IT Department. The basicelements of an IT project lifecycle of preparation,planning, analysis, design, construction, testing,implementation and post-implementation reviews areunderstood and used in the National office. Howevermost projects are not formally documented in astructured way and a standard Jamsostek projectmethodology does not yet have executiveendorsement. It is also evident that a structuredproject management methodology does not exist inthe rest of the organization.
Observations And Discussion
User Comments and RequirementsDiscussions with Jamsostek users were based onthe operational and IT components and to a lesserdegree on the organizational structure. The commentsfrom users are mentioned throughout this section anddiscussed under the relevant topic.
Jamsostek Performance and ServiceStandardsThe observations made in relation to Jamsostekoverall performance were obtained from a varietyof external and internal users and were not alwaysdirect observations by the users but in many caseswere general impressions obtained over time aboutJamsostek. This section attempts to identify the keyconcerns about Jamsostek that appear to be viewsheld by a number of people in the community. Someof these perceptions about Jamsostek are:• Low level of retirement benefits;• Payments are not indexed;• Low public confidence in the administration; and• Limited access to members.
Provident Fund PerformanceComments from users relating to fund performancewere mainly about the following issues:• Restrictions on the investment portfolios and
strategies available to Jamsostek;• Relatively low returns from investments in Indonesia;• Reduced returns to members as a result of taxation
of Jamsostek as a profit oriented public company;• Investment strategy not open; and• Allegations of government interference in Jamsostek
investments in the past.
Many of these perceptions and complaints are datedby some years and have begun to be addressed by thecurrent administration as reflected in the extensive re-organization of Jamsostek that has been implementedover the past year. Other issues are being addressedby the proposal to amend the legislation to convert theexisting provident fund to a trust fund managed by atripartite board of trustees. This proposal will changethe management status of Jamsostek from a Perseroto a non-profit orientated public company such as aBadan and the removal of the taxation liability shouldincrease the return to members by higher compoundingof interest. It should be noted that as a Persero(government owned limited liability company) that thegovernment has limited it liability to Jamsostek to Rp.62 billion.
Later components of the ILO project for Restructuringof Social Security in Indonesia will provide optionsabout investment strategies for trust funds that willassist in improving the investment returns and minimisethe risk to members. An initial examination of theinvestment process by an ILO actuary has concludedthat the current investment strategy is sound and is inmarked contrast to the investment policy adopted inpast years. The investment guidelines for Jamsostekfunds are described in the following three pieces oflegislation:• Act 11, year 92 Pension Fund;• Regulation 28 year 96 fund investment; and• Clarification of Regulation 28 year 96 Fund
investment.
These acts and regulations provide the basis for soundinvestment of the funds and their content has beenassessed by the actuary as consistent with worldstandards for investment of pension funds.
Access to ServicesThe major types of employee member enquiries madeto Jamsostek offices are about account balances and

5 8
Part II Chapter 6
claim rights. The existence of multiple membershiprecords complicates the enquiry workload. Changingthe focus from employers to employees will also havea significant impact on the current enquiry workload ifemployees make contact direct to Jamsostek and notthrough the employer. The recommended changes todata management will assist in the minimisation of theimpact by the creation of single membership recordsand the National index would allow universal locationof members’ records from any site.
Jamsostek has an extensive national service deliverynetwork that is already among the largest of thegovernment sector agencies in Indonesia. The currentlinear expansion formula ensures that new BranchOffices are created when the membership numbersexceed a prescribed limit. The Branch Offices are nowcentred on the areas of high formal employment. Shouldthe membership eligibility criteria be extended to theinformal sector then Jamsostek would face a significantproperty expansion if the current formula were retained.In addition to this it is estimated that Jamsostek existingmembership is less than half of the eligible employeesand should enforcement of contribution collection besuccessful the membership numbers could almostdouble the current numbers. The property implicationsof this will be substantial and the service deliveryoptions and a property plan should be considered aspart of the business reengineering exercise that couldbe conducted as part of a future project.
Alternatives to the establishment of new offices areavailable and most of these options are technologydriven. Some examples of other options are:• Use of agencies located in smaller sites as part of
provincial administrations, government agencies ornon government agencies;
• Remote visiting services;• Mail processing centres;• Specialised call centres where most business is
transacted over the telephone;• Creation of service delivery shop-fronts in conjunction
with larger processing centres;• Contracting out some services; and• Expansion of Internet functionality.
All of these options would have a large impact on thedevelopment of IT services in Jamsostek andparticularly for the network, hardware acquisition andfuture development of SIPT.
Limited Benefits of the Retirement ProgramsThe structure of the retirement program and thebenefits to members was presented as an inhibitor tomany employees to contribute to the fund. The majorcomments were:• Final benefit payouts are too low, especially for high
income earners;• Restricted to members employed in the formal sector;
and• Lump sum is only a short-term retirement payment.
Other components of the ILO project forRestructuring of Social Security in Indonesia willprovide options about retirement programs,contributions and payment options that will assist inimproving the value of retirement benefits andinsurance coverage of the workforce.
Multiple MembershipJamsostek employs a collective membership process,which means that when an employer registers as acontributor to the funds, the employer and eachemployee are registered as members of the fund. Theissue of a Certificate of Employer Membership (CEM)confirms this membership for employers and employeesare issued with a Jamsostek Member Card KartuPeserta Jamsostek (KPJ). The KPJ is based on theemployers’ registration number and is valid for the lifeof the membership. In addition to the employers’reference number, the KPJ also contains a Jamsostekunique employee number. The card (shown in Figure38) is required to be produced at the time of claimingfor a retirement or other insured benefit.
It should be noted that each time an employee changesemployment a new membership card is issued, alsobased on the registration number of the new employer(provided the employer is an eligible contributor). Thereason for this is that contributions and hencemembership are linked to the employer and theregistration source is at the Jamsostek Branch Office.At this point in time the Branch Offices are not logicallylinked by a network to the Regional Offices or theNational Office, however, Wide Area Networking(WAN) is part of the existing IT Strategic Plan. Thereis the potential to accumulate a number of membershipcards — one for each term of eligible employment,depending upon the frequency of changes inemployment.

5 9
Part II Chapter 6
Figure 38 Jamsostek Employee Membership Card
FRONT
NameDate of Birth Month of IssueJamsostek Employee Membership NumberEmployer Number Branch Employee Number
BACK Signature of Card Holder
Members Signature
1. Please notify your Jamsostek number andJamsostek member’s rights to family ordependents
Members are able to use their card to confirm thevalue of their benefit in the fund by both telephone andattending at a Branch office customer service counter.In the past the bar code was used in conjunction witha bar code reader to automate claim processing,however the bar code is no longer functional. The valuepresented to the member is the amount of contributionplus net interest for that particular employment periodand employer code on the card presented. The interestincluded is only for the last crediting period. The processmust be repeated for each membership card. Thevarious contribution periods are not integrated becausethey will have occurred for different employers andthey may have occurred in different regions or branchjurisdictions. This process has created some confusionfor members and has contributed to the impression bysome members that funds have not accumulated orthat funds have been misappropriated.
Some of the major benefits of having integratedrecords and a unique Jamsostek membership numberare:• Only one membership card need be issued to a
member for life;• Reissue of cards would be virtually restricted to lost
or replacement cards;• Complete member history contained in one data
record;• All of the member data geographically located in
the branch office where the member currently livesand works;
• Inter Branch office liaison reduced;• Data maintenance easier;• More reliable information;• Processing of claims will be much quicker;• Better customer service due to reliability and ease
of access to information,• Database size reduced, leading to faster processing;• More reliable management information about
membership;• Planning decisions improved by more reliable and
accurate information; and• More efficient and cost effective in terms of human
and material resources.
It is a stated goal of Jamsostek to integrate member-ship and contribution records. This is strongly supportedby the review and is a high priority systemenhancement. Integration of membership records isdependent upon:• A unique membership number;• Identification of multiple records;

6 0
Part II Chapter 6
• Only one instance of any customer on the database;and
• National view of data or a national record indexavailable in every Jamsostek office.
Unique Identification NumberA unique numbering system is essential for efficientmanagement of a social security system, particularlyfor general eligibility benefits that are state funded andrequire some form of means testing. The uniquenumber system assists in fraud control, prevention ofmultiple claims, proof of identity, managementinformation, data management, and in maintaining thegeneral integrity of the system. Whilst Jamsostek iscurrently mainly concerned only with social insuranceprograms it is likely to become part of an expandedsocial security system where the importance of theunique number will be paramount.
Existing Personal Identity SystemIndonesia has a personal identification system basedon regional administrative centres and the issue ofidentification cards Kartu Tanda Penduduk (KTP)are controlled locally. The personal identity guidelinesare the responsibility of the Ministry of Home Affairs.The Personal Identity process has its origins in theDutch colonial era where people were registered infour categories:• Pribumi, local Muslim,• Chinese/east Asian• European, and• Local Christian, Madura, Minahasa and Ambon.
This categorization has not been officially replaced.
The numbers issued as part of the KTP are numeric(up to 18 digits) and the first six digits represent thegeographical area, the second six digits represent thedate of birth and the remainder are produced by analgorithm to make the number unique. Computerisationof the process was commenced in 1995 (SIMDUCsystem) but due to lack of funds to maintain the systemsthe process has now reverted to manual in almost allprovinces and the issue of KTP is recorded in ledgersthat are archived in most provincial centres.
The KTP contains the following information about theindividual:• Photograph;• Full name;
• Address;• Village;• City;• Blood Group;• Sex;• Date of birth;• Place of birth;• Marital status;• Employment/profession;• Religion;• Expiry date; and• Name and number of the authorising officer.
Lost or replacement cards and five yearly card renewalis the responsibility of the local administrations. Thelocal administrations have generally devolved the issueand management of the personal identification systemdown to village level. There is also a family identitycard Kartu Keluarga which is controlled at local leveland generally issued at village level. The KartuKeluarga is issued to the head of the family andcontains details about the parents and children in thefamily.
The personal identification number is not unique orconstant because a new local or regional number andidentity card is issued each time a person movespermanently from one administrative area to anotherand when the existing card expires after 5 years. Thesuitability, reliability and integrity of this process as anational identity system are not believed to be veryhigh. It is also common for an individual to have morethan one KTP particularly where a person has movedfrom their locality of birth. The original KTP can beretained and regularly renewed in addition to anotherKTP issued in the new locality.
Whilst a regional numbering process may be suitablefor personal identity it is not a suitable substitute for aunique, sequential social security numbering system.There have been suggestions that Indonesia shouldimplement a new national identification system and thatthe process could take at least three to five years toachieve from decision to implementation17. TheMinistry of Home Affairs wishes to redevelop thepersonal identification system to be a truly national andunique numbering system and has initiated a project toexamine the requirements and options for a nationalidentity system. This project is supported by GTZ anda three-day workshop for stakeholders was held in
17 Asian Development bank – Reform of Pension and Provident Funds Indonesia August 2000.
6 1
Part II Chapter 6
Jakarta in late October 2001 to consider the nationalpolicy formulation for:• Citizens administration programme (KTP);and• Registration of births, deaths and marriage.
This program is intended to result in the improvementof public administration and implementation of a newnational identity and numbering system. Jamsostek staffwill participate in the development program as keystakeholders.
Jamsostek Personal NumberJamsostek already has a personal number that iscreated at the issue of new membership cards at thetime of registration with a new employer. Whilst thisnumber is unique it is only unique to the particularemployee for that particular registration and not to theindividual.
By altering the data emphasis from the employer tothe individual employee, Jamsostek may be able toutilise the existing unique social security numberingsystem with a cross reference to the regionalidentification number and employer code. Such anumber would achieve the following outcomes andcharacteristics:• Jamsostek will have total control over the numbering
system design and structure;• Control of the issue of numbers by Jamsostek
nationally;• Logically sequenced number;• National numbering system;• Structured to contain data for basic identity such as
sex, year of birth etc;• Contain an algorithm to minimise data entry error;• Logical system trap to ensure that only one member
can be issued one number;• Centralised control over deletion of records
(numbers) from the database;• Could be cross referenced against other identification
numbers if they are contained in the Jamsostekdatabase, e.g. regional identification number, taxationnumber etc.;
• Will allow for the establishment of a national indexto provide a national record search function toidentify members, location of data, etc;
• Integral part of the registration process; and• Linked to the proof of identity process.
The Jamsostek employee number could become uniqueto the employee by making it the primary search keyfor the data record and relegating the employer codefor each instance of employment as secondary
references. The system could be refined to create alink between the active employee number and eachemployer code. This could allow display of individualemployee records to be grouped under the employercode.
After the implementation of a single numbering systemthe subsequent employment information, including theemployer number could be included in the record withthe primary search being the Jamsostek number.
Implementation of a unique Jamsostek number is apre-requisite for the integration of the multiplememberships to the funds into a single record that willprovide consolidated, accurate and consistent memberinformation.
In the event that a national identification system isdeveloped in the future, then Jamsostek may be ableto replace its own numbering system with the newsystem if it satisfies the requirements needed by theSocial Security system. Alternatively, Jamsostek couldrecord the new national identification number in thedatabase as a cross-reference and as an additionalitem of secure proof of identity.
Membership Record IntegrationThe issues that have resulted in the need for recordintegration have already been discussed in and theprocess of record integration is a high-risk process thathas the potential to affect the core of Jamsostekoperations and that is, its data holdings.
For this reason the management of a futureMembership Record Integration project should be ofa high order. A dedicated project team should managethe project from start to finish under the direction of ahigh level executive steering committee. Such a projectcould form part of later Technical Assistance projectsfor implementing the recommendations of the presentproject.
In order to achieve successful integration, a range ofenabling projects should be undertaken to maximisethe degree of success and the data integrity of themembership records. The major enabling projects are:• Data purification exercise to identify and correct as
many of the incomplete and corrupt records aspossible;
• Culling of the completed memberships and cancelledmemberships from the active database into aninactive records archive after a prescribed time (e.g.six months after last contribution or payment); and

6 2
Part II Chapter 6
• An operational national social security (orJamsostek) unique identification number system.
There are currently about 9 million active membershiprecords and about the same number of inactivemembership records. The current membership statisticsin Figure 7 suggest that about 30% of the inactiverecords are the result of claims made. Therefore theremaining 70% of inactive records comprise multiplemembership records, members who are nowunemployed or members employed but no longereligible to participate in the scheme and members whohave died but no claim for Death Benefits have beenmade by their dependents. An estimate of the numberof multiple records will enable the size and scope ofan integration exercise to be determined.Part of the data purification exercise could identifythe potential unclaimed death benefits and invite claimsfrom the next of kin of deceased members as ademonstration that Jamsostek has changed from aprofit-oriented scheme to an employee-orientedscheme.
Some issues that should be considered for such amembership record integration project are:• Business case for the project;• Statistical analysis of the number and type of records
to be integrated;• The new data structure;• Data sizing exercise;• Hardware and software estimates;• Impact on the General ledger and finance system;• Need to issue a new employee membership card
using the national social security (Jamsostek)number;
• Project requirements, including specialist IT staff;• Pilot site and testing;• Implementation timing and methodology; and• Cost estimate.
National IndexThe only national view of data that is obtained inJamsostek is in the National Office. This data isreceived monthly from the Branch office by the mostexpedient means available, which is via internet/emailor diskette via post or courier. In the National Officethe financial data and the modified records are
consolidated into their respective databases to producethe latest operations and financial datasets This datais updated monthly and is compared with theconsolidated Region data produced by the RegionalOffices that has also been transmitted to the NationalOffice. The source of the Regional Office data is alsofrom the branch offices. The national statistics andmanagement information is produced from the nationalconsolidated data.
This national view of data is not available in the Branchoffices where all of the customer data is generatedand the Branch Offices are not logically linked to eachother. In the event that a member has relocated andhas a membership record in another Branch thencontact is usually made with the previous branch byemail, telephone or fax. General information orenquiries for members where data is located in anotherBranch Office can only be obtained by direct contactwith the other branch.
A National Index of members should be produced anddistributed to all branches to enable staff in any officeto be able to identify a member and location of theexisting customer data. The index would only need tocontain sufficient data about each member to enablethe identification and location functions. Maintenanceof the index would require the regular addition of newand changed records to the existing copy.
This arrangement could continue until a WAN isavailable when direct access to the single copy orRegion based copies of the national index could besustained. The current Strategic Plan proposes thatthe Jamsostek Regional Offices will all have highcapacity data links to the National office by the end of2001 via Frame Relay connection. This should providethe capacity to transfer data at 1 Mbps (125KBps).The extension of high capacity reliable datacommunications to the Branches will take longer. Thedetails of future expansion to all Branch Offices arenot available.
The typical data elements (sample only) that may becontained in a National Index are shown in Figure 39.The shaded fields indicate data elements that are notcurrently held for employees.

6 3
Part II Chapter 6
Figure 39 National Index Sample Data
No Data Field Size
<CURRENT DATA>1 Current Jamsostek Branch Code 32 Jamsostek ID Number 133 Surname 204 First Names 205 Address line 1 286 Address line 2 287 Town/City 208 Postcode 69 Date of Birth 810 Marital Status 111 Spouse Name 2012 Number of children 213 Current Employer Code Number 1014 Status (Active/Inactive) 115 Total Benefit (current contributions plus interest value) 1016 Membership (Retirement, Health,) 4
Sub-Total 194<HISTORICAL CONTRIBUTION SUMMARY>
1 Previous Employer Code Number (2) 102 Total Benefit Accrued Employer (2) 103 Jamsostek Branch Code Employer (2) 34 Previous Employer Code Number (3) 105 Total Benefit Accrued Employer (3) 106 Jamsostek Branch Code Employer (3) 37 Previous Employer Code Number (4) 108 Total Benefit Accrued Employer (4) 109 Jamsostek Branch Code Employer (4) 3
Sub-Total 69TOTAL 263
Access to this data in any Jamsostek site could allowthe assessor to:• Confirm membership and types of membership;• Identify the member and spouse;• Locate the existing record;• Locate previous records;• Prevent creation of duplicate records;• Answer member enquiries about previous employers;
and• Answer member enquiries about estimated benefits
in the fund.An estimate of the potential size of the National Index,expanded to include previous employment informationcould be derived as follows:
Assumptions(i) data size per record of 300 bytes.(ii) number of records 15 million.(iii) about 9 million contributions made per month.
(iv) 10% variation in data elements on the record otherthan contributions.
Based on the current population and the data recordshown above, the database could be 4.5 GB in size.Regular updates to the data would be relatively smallwhen the changes are taken into account. Branchchanges or transfers are about 3% of active membersper year and the only other regular change is thecurrent fund value field that will change monthly withadditional contributions. Based on the assumptions, thenationwide sum of daily changes would be insignificant,whilst monthly changes could approach 100 MB.
The initial installation of such a database could beconducted by various means and would not createmany problems, however updating such a file, usingdial up modems would be extremely difficult in someremote branch offices. However to download the entire

6 4
Part II Chapter 6
database from the National Office to the Regionaloffice by Frame Relay could be achieved in aroundten hours and regular daily and monthly updates(100MB) to Regional offices would be relatively smalland able to be achieved within minutes. Alternativelythe initial National Index Database could be installedfrom tape and the regular updates in the Regional andBranch offices can be made by the most appropriatemeans such as diskettes, CD-R, tape, etc.
A staged approach to the national index could beachieved by making the Regional office the focal pointin the short term and over time extending updates toall of the Branch offices. The full functionality andregular daily updates could be extended to all branchesas communications capacity permitted. The end statedevelopment of the WAN would allow a national viewof members’ data in all sites across the country.
Use of a national index would allow Jamsostek to takemaximum advantage of the fully distributed processingsystem it currently uses and minimise the system’smajor disadvantage of maintaining data held in othersites as a result of transfers and multiple employment.The benefits of a national index are:• Minimise the incidence of multiple records;• Identification of duplicate records held in different
sites;• Allow a record transfer system to be established so
that records can be integrated into the data of thebranch where the member is resident;
• Index search can become a permanent part of theregistration process;
• Improve data integrity of the database; and• Produce more reliable management information
about members.
The National Index would become the front end ofthe processing cycle for the Record Search functionand a critical element in the registration process andmaintenance of a single record for each member.The National Index can allow the geographical storageand maintenance of data whilst still allowing automaticupdates and processing of the data. The end state ofthe development of a national index (automaticnationwide updates) can only be achieved when theWAN is fully operational. In the interim, the NationalIndex could allow the introduction of the JamsostekMembership Number, integration of records and thenew registration process. Figure 40 shows the operationof the index process within a single site.
Figure 40 The National Index in a single site
The end state of automatic record updates across thecountry is shown in Figure 41. To achieve this end-state each site across the country would need to haveon-line access to a copy of the National Index.Analysis of the national telecommunications capacityindicates that most offices should have the capacity tomaintain a copy of the national index. The remainderof the Branch Offices would need to have a hybridprocess until their communications capacity wasextended.
Figure 41 Inter Branch record updates
NATIONAL OFFICE orREGIONAL OFFICE
This process will be possible in the future when on-line access is available to all sites in Jamsostek. Thegeographical integrity of data can be maintained byautomatic transfer of the records that have had detailssuch as address and locality changed so that they nowreside in the area administered by another Branch.This automatic transfer could be done overnight aspart of the end of day processing in each site. Therecords that have had a change of Branch code canbe transferred to the relevant new Branch. Until suchtime as the communications network is sufficiently
6 5
Part II Chapter 6
established, the record update and transfer processmay have to be manual and subject to a phase delay insome remote branches. However the National Indexcan be operational in all sites and this will support themaintenance of the single membership record and thegeographical integrity of data.
Record Integration and National IndexImplementation Issues
The existing number of members in Jamsostek is9,382,786 active records and 9,088,358 inactive recordsgiving a total of 18,471,144 records.
The inactive group of members is made up of memberswith a range of possible circumstances. Members whoare unemployed and have more than 5 yearsmembership in the fund may elect to claim theirentitlement on becoming unemployed or they may wishto preserve their benefits in the fund until retirement.Many of the inactive records are likely to be frommembers who have changed employment and thecontributions from the employer pertaining to the recordare no longer being made (contributions are employercode dependent). Unemployed members with less than5 years membership are not able to claim any benefitsuntil total contribution membership exceeds 5 years.Other cases may include members who have changedemployment to an ineligible employer or become self-employed and who do not wish to continue to contribute.Such a circumstance normally allows for existingmembers to continue contributing to the fund asexisting members.
Given the limited amount of data held on eachemployee it is difficult to estimate the likely number ofindividual records, However, based on the very broadestimates of inter branch changes of 3% per year andthe number of claims over a ten year period, about35% of the inactive records could be duplicates of anexisting active member. Integration of the records couldrealise about 13 – 14 million actual members insteadof the current 18 million records.
(i) Stage 1The first stage of the integration process wouldneed to involve data purification to ensure thatobligatory fields exist in each record. At least anunderstanding of the integrity of the data shouldbe known. From this can be estimated the likelynumbers that will require manual intervention inthe process of identifying members. It is most likely
that some form of data collection exercise may berequired to assist in the identification of duplicaterecords. This data collection exercise could bestbe undertaken through the employers and it couldbe used to collect the following information aboutactive employee members:• Current address;• Previous employment numbers; or• Photocopy of previous Jamsostek membership
cards.
The additional information about previousemployers and their Jamsostek membershipnumbers would allow for immediate identificationand amalgamation of records. The design of theunique Jamsostek numbering process would needto be done concurrently with the data purificationprocess.
(ii) Stage 2This stage could be the integration process thatshould be preceded by testing and trial of theprocess in a selected site. It is also highly likelythat not all inactive records will be able to beintegrated due the difficulty in contacting inactivemembers and the high number of potential positivematches from similar names and dates of birth.There are very few other data fields on thedatabase that would assist in the separation ofmultiple records.It will not be possible to integrate all records andthere will be a considerable number of records thatwill remain in the inactive database. These recordswill need to be retained until contact is made fromthe members. A standard operating procedurewould need to be implemented for all contacts bymembers whose only record was on the inactiverecords database. This procedure could obtain theadditional relevant data from the member such asresidential address, subsequent employment detailsand any other relevant data that is missing fromthe data set.
(iii)Stage 3Creation of a National Index from the integrateddata and balance of the inactive records that wouldidentify the member and would typically containthe information described in Figure 39.
Interim National IndexThe end state of a fully networked processing systemand national index will take a number of years andwould be dependent on funds available to pay for theimplementation and maintenance of a national real-

6 6
Part II Chapter 6
time data communication network. As an interimmeasure it is possible to use a national index for out ofbranch record searches by using the Internet as shownin Figure 42. This process would involve modificationof the application to search the local database as theprime search and the national index copy (held in thebranch) as the secondary search. In the event of apositive result from the national index the applicationcould then use the Internet to connect to the branch
identified in the national index for the information. Theresponse(s) could be integrated as a browser baseddisplay of the basic contribution history information.The key issues that would need to be addressed arereliability of Internet access in the remote branchesand security of information. Using the Regional Officedatabase as the dial in data source and use ofappropriate hardware and software encryption on theweb servers could address these concerns.
Figure 42 Interim National Index Option
Registration ProcessThe registration process is a key function in themembership lifecycle and should be used to satisfythe following requirements:• Obtain complete information about the member;• Establish the identity of the member through a
standard process of sighting identity documents;• Conduct an index check to determine the existence
of any previous record;• Enter and record the details of the member on the
database;• To ensure that appropriate procedures are initiated
to advise the members of their rights and obligationsof membership to the fund; and
• To create any paper files and documentation thatmay be required for legal purposes.
The Registration process should be automated as muchas possible and a system link should be created whichwill allow only one customer record to exist and forany new membership request, a search of the existingcentral index be made obligatory. Where this is notpossible in an on-line situation, a delayed (preferablyovernight) match should be made to alert for potentialduplication of records.
The main elements of a social security registrationprocess are:• Identification of the contributors - the eligible
employers and their employees;• Determining what data needs to be collected;• Procedures by which the contributors can register;• Communication with the contributors of the
requirement to register and the procedures to beused;

6 7
Part II Chapter 6
• Provision of an effective information and supportservice for customers;
• Collection of the required information from theemployers and employees;
• Checking of the information provided;• Entry of the data into the computer system;• Allocation of employer membership number;• Allocation of employee membership number;• Checking of the computerised data;• Error correction;• Confirmation that details are correct by employers
and employees; and• Issue of Employer and Employee membership cards.
Member Identification (Proof of Identity)Under the current social insurance system, theemployer is responsible for notification of new membersand performs the primary personal identification. Thenew member details are documented on Form 1a,which, when completed provides the followinginformation about each employee for the retirement,life and work injury programs:• Employers code (issued by Jamsostek to each
eligible employer);• Employee code (issued by company);• Name;• Sex;• Date of Birth;• Salary; and• Remarks.
The focal point of the proof of identity process occursat the time of claiming for a benefit, at the end of thecustomer lifecycle rather than at the point of initialregistration. The common documents required toaccompany any claim for benefits are:• Original Jamsostek Member Card;• Copy of Personal Identity Card; and• Copy of the Family Card.
In addition to these documents, the followingdocuments are required for the specific benefits shownbelow:Death Benefits – Authentication Letter of
Death.Permanent Invalidity – Letters of reference from
doctors supporting theclaim.
Leaving Indonesia – Copy of passport, Copy ofIndonesian Labour visa,Letter proclaiming intentionto no longer work inIndonesia.
Members of Armed Letter of confirmations ofForces/Government employment in ArmedEmployees claiming Forces/Government.refund of privatecontributions –
Unemployment – Letter of termination fromthe company.
As a general principle, the identity of customers onthe database should be clearly determined before thedata entry, because once established on the system, itmay be difficult to confirm or deny identity later. Theissue of a Jamsostek membership card JPK may alsosupport the identification of an individual to otherauthorities. The current process of determining proofof identity at the time of claim may be satisfactory forinsurance type programs but for means testedassistance programs, proof of identity is an essentialpre-requisite to registration as a customer to minimisethe opportunity for claim fraud. A birth verificationprocess should be established for all members thatencourage members to obtain and retain suitabledocumentary evidence of birth. Ultimately the improvedcitizens’ administration process will assist thisresponsibility.
It is interesting to note that new members are notrequired to produce or complete any documents ofregistration, nor are they required to sign anyacknowledgments of their rights and responsibilitiesas members of the Jamsostek fund. This places thetotal reliance on the capacity of the employer tocomplete this task.
The proof of identity process for all types of registrationneeds to be strengthened if Jamsostek is to positionitself as a future core social security organization forIndonesia.
The client identity (ID) process is traditionally basedon documentary evidence with the most securedocuments attracting a higher degree of reliability. InIndonesia the availability of documentary evidence isnot universal and may take a number of years beforehigh reliability is achieved. By Jamsostek demandingdocumentary evidence as part of a revised registrationprocess this may increase over time the level ofacceptance of maintaining documents in the community.An ID process should include:• Rating documents in order of reliability and security;• Possibly using a points system to grade the
confidence of the identity, e.g. the 100 points processsimilar to that in use internationally and by banks;

6 8
Part II Chapter 6
• Grading ID on a “proved”, “partial” and“unproven” categories;
• Recording or retaining copies of the evidencesighted; and
• Retention of customer signatures as part of IDprocess.
The ID process should be an integral part of anyrevised registration process.
Data ManagementThe existing data structure is adequate for anemployer centric social insurance system that relieson the employer to satisfy the registration, informationand social security needs of the employees. The dataintegrity is not high and the duplication of records,absence of records, lack of a complete national viewof data and unidentified members is not consistentwith a system that can protect workers social securityentitlements. The following section describes the datasituation and enhancements that should be consideredfor development.
Data ElementsThe data elements contained in the SIPT are generallyconsistent with the overall functions to be performedby the system. However there are some dataelements that should be included in the system tostrengthen the integrity and record managementprocesses and the most critical of these is theEmployee Member Address. Additional dataelements should be considered during a business re-engineering of the Jamsostek system.
(i) Employee Member AddressThe membership in Jamsostek is focused on theemployer who is expected to manage the socialinsurance affairs of the employees. Allcorrespondence and contact with the individualmembers (employees) is via the employer and thisincludes general enquiries about contributions andfund balances. Recent initiatives to move the contactfocus to employees include the involvement of thetrade union representatives in the local workenterprises to monitor member requirements, andwhilst this is an improvement it is still workplacebased and through a third party.
The only address information contained on Jamsostekdata files is the address of the employer.
The address of the employee members should be amandatory field to support the identity and means of
contacting individual members. The only means ofcontacting individual members at present is via theemployer. Once the member record has becomeinactive there is little chance of contacting individualemployees particularly in cases where the employerhas ceased operations. Maintaining address informationcould be the means of tracking changes in theJamsostek Branch and facilitate a transfer of data tothe new Branch. It will also assist in the prevention ofmultiple records on the database. The address fieldwill also provide the opportunity to assist in complianceand education of members by allowing for direct mailouts of specific information, changes in policy,marketing information, fund performance and newsbulletins, requests for information and response toindividual members enquiries. The address collectionexercise could also be used to follow up unclaimedbenefits to improve the image of the new Jamsostek.
Common DataThe data holdings in Jamsostek demonstrate somedegree of redundancy, especially in the area of persondata about describing the member and dependents. Inpart, this is caused by the lack of a unique individualnumber and the person name and date of birth arecommonly repeated across the data files. The othersignificant area of data redundancy is the existence ofmultiple records. The data redundancy would besubstantially reduced by the development of a uniqueJamsostek membership number and integrated recordsystems.
In the future, additional benefits may be added to theJamsostek program responsibility and past experienceshows that in such situations, the expedient solution isto add new application programs to the existing suite.This solution is generally of short-term benefit onlyand can create integration problems for the future andinevitably leads to further duplication of person dataand unnecessary duplication of effort.
A better alternative is that within Jamsostek it shouldbe possible to have a data function that records staticdata about a person (name, sex, date of birth, place ofbirth, client identification, address, etc) and this wouldbecome the core of the common data. Other functionsthat update benefit specific data (economiccircumstances, specific eligibility criteria, date last paid,amount last paid etc) could do so against the clientidentity and in this way any original customer datawould be able to be reconstituted by joining commonperson data with specific benefit data.

6 9
Part II Chapter 6
In the short term a subset of this common data couldbe the national index that would be made available toall offices in Jamsostek.
In an expanded social security environment there islikely to be considerable overlap between customersas shown in the following schematic. A common dataregister which interfaces with the specific data ofthe separate insurances and benefits could minimize:• Record sizes;• Data duplication;• Data handling;• Data administration;• Data transfer; and• Maximize:
• Efficiency;• Storage; and• access speed.
Figure 43 Overlap between Social Securitycustomers
Social Insurance Customers (Potential forJamsostek)
In any complete social security system there is aconsiderable overlap between customers and acommon data record would improve efficiency by onlyonce recording the fixed person data. Futuremanagement of customer service will be more effectiveif one set of customer data exists in Jamsostek. Asthe lifecycle of a customer transitions from one typeof service to another, the single set of data is modifiedand not re-created with each instance of claim orcontact with Jamsostek. In this way customer historyis maintained and:
• Data entry is minimized;• Data management is simplified;• Data integrity is improved; and• Flexibility to add new services increased.
Figure 44 Typical Social Security CustomerLifecycle
This integrated common data record will allow greaterflexibility for future social security initiatives that thegovernment may wish to introduce. In many countriesadditional social security services are paid such as:• Unemployment Benefits;• Child care allowance;• Social Assistance payments;• Short term sickness benefits;• Invalidity benefits;• Survivors benefits;• Dependency allowances (increases in benefits in
respect of dependents);• Graduates allowances; and• Payments to rural workers.
Future additional social security payment programs arelikely to be phased into Jamsostek and the commondata, through linking, could allow groupings to be madesuch as family units which can give the flexibility tomake assessments of need based on family incomesin addition to that of an individual.
Contributions in an Expanded Social SecurityEnvironment
Any expansion of services in Jamsostek is likely toinclude contributory insurance programs such asunemployment insurance. It is essential that Jamsostekmaintain its integrated contributions system. Thisimplies that any future contributory programs willbecome an integral part of the existing contributionsoperational and financial systems.
7 0
Part II Chapter 6
The maintenance of the integrated contributions systemwith appropriate development should be able to providethe following benefits to the organization:• Efficiency in accessing data at all levels from national
summaries to individual contributors;• Audit-ability and accountability;• Cost control;• Performance standards;• Management Information Systems;• Reliability, recovery, integrity;• Agreed Service levels;• Scalability;• Change control;• No duplication of common functions (e.g.
contributions, payments and client registration); and• Security addressed at an architectural level.
Regional Offices Liaison
The Regional Offices visited indicated that they weregenerally able to complete their task in a satisfactorymanner. Data communication between RegionalOffices and Branch offices was generally satisfactoryin the densely populated areas but more difficult andunreliable in the remote parts of the country. Theimplementation of better communications between theNational Office and Regional Offices is due tocommence shortly with the provision of Frame Relaytransfer with a bandwidth of 1 Mbps for all of theRegional Offices and Branch Offices in Jabotabek.Over time this facility will also be extended to theBranch Offices in the remaining parts of the Jamsostekservice delivery network.
The relationship between Depnakertrans andJamsostek at regional level mostly centres on generalpolicy liaison, membership compliance and work injuryentitlement disputes.
Depnakertrans is the government department currentlyresponsible for the operational supervision of Jamsostekand there is an obvious division of legal responsibilitiesand delegation that are contained in the respective lawsand regulations. Jamsostek is required to report to theMinister of Manpower and Transmigration(Depnakertrans) in relation to policy compliance andgeneral performance.
Jamsostek is responsible for the registration ofmembers and collection of contributions fromemployers that is authorised by Article 22 of Act 3,1992 for the executive agency (Jamsostek) to collectcontributions. Whilst these functions are performed in
Jamsostek at branch level, the Regional Office isresponsible for the performance of all of the branchesin its administration. Jamsostek is legally obliged toreject membership applications from employers wherethey demonstrate that they are ineligible to participatein the schemes because of the number of employeesor the total incomes paid to employees. HoweverJamsostek does not have the delegation to investigateemployers suspected of providing incorrect informationabout the numbers of employees or total payroll.Depnakertrans retains this authority.
All disputes between employers and Jamsostek overcontributions, membership and claims for benefits arereferred to Depnakertrans in accordance with theregular liaison processes agreed between theorganizations. The dispute process has been describedas slow and cumbersome with unreliable reporting ofthe outcomes to the initiator in Jamsostek. The localDisputes Committee handles disputes in Depnakertransand the only avenues of appeal are to a higher authoritywithin Depnakertrans.
Compliance and Appeals
The ILO considers that compliance is one of the keyfundamental operations in the administration of a socialsecurity system and together with fraud minimizationare key elements in the equality principle of targetingsocial security payments to those most in need.Compliance was seen as the key to better overallperformance of the fund as higher contribution rateswould result in higher returns to members and serveto spread the risk across a wider group of membersand minimise adverse selection in critical programmes.The ILO is proposing is an inspectorate force withline management at Jamsostek branch and regionallevel with policy direction from Head Office. Fulldetails of the background to compliance and theproposals are discussed in Chapter 7.
Data Entry Management
The key elements in Jamsostek business are its dataholdings, the maintenance of accurate data that reflectsthe needs of the organization and data that is accessiblewhere and when the business requires it. There areinstances where the data holdings do not reflect theactual situation in the organization. The usersprocedures manual System Procedures for JamsostekProgram Integrated Services, describes in detail theprocesses that are to be followed for all workprocesses. In some Branches offices data entry is many
7 1
Part II Chapter 6
months in arrears. This causes considerable disruptionto work practices when the Services section useridentifies that a member record is incomplete and theprocess of resolution involves Operations section staff(responsible for data entry) and IT staff responsiblefor data holding. The arrears situation arises when allkey data entry positions are not filled in the Branchoffices and from inadequate monitoring of workloadin the office.
IT Organization
The IT staffing requirements have been examined indetail and it is evident from the distributed architecture,distributed processing and operating requirements thatthe current staffing establishment in Branch andRegional Offices is barely adequate. The distributedprocessing requires that skilled and capable staff mustbe able at all times to effectively manage theprocessing and maintenance of data systems. ITsupport should also be available at higher levels as anescalation path for critical faults.
It has been estimated that about 25% of the IT positionsremain vacant and that some Branch Offices areoperating without trained IT support staff. This exposesJamsostek to high risk of data failure, corruption ofdata and potential loss of data integrity.
Recruitment and retention of IT staff is an essentialfunction for Jamsostek in order to maintain the criticaltasks in the Branch Offices. It is evident thatemployment conditions are not commensurate with thevalue of the skills to the organization. IT staff in someoffices have transferred to member account positionsin anticipation of future performance bonuses that willprovide greater financial rewards than the IT positions.It is imperative that incentives are provided, ifnecessary, to attract and retain skilled IT staff at alllevels in Jamsostek.
There are two essential data management functionsthat must be performed in Jamsostek if it is to achievethe degree of data integrity and accessibility to be ableto accommodate the potential expansion in itsmembership base. These positions are the DataAdministrator and the Database Administrator and adescription of their roles is shown below. Thesepositions are in addition to the data operators whoperform the routine operations tasks directed by theDatabase Administrators.
Data Administration – Key Functions
The Data Administrator is the manager of theorganization’s data and should be the senior ITexecutive with access to the Jamsostek executive andmanagement board. The ultimate responsibility on howJamsostek will manage and maintain its data now andin the future are the responsibility of the DataAdministrator. There should be one Data administratorin Jamsostek. Typical responsibilities of the dataadministrator are:• Consultancy - Offering consultancy on all aspects
related to an organization’s meta-data, particularlyexpertise in data analysis;
• Corporate awareness – education of theorganization about the importance of data anddisseminating information about what data exists andfor what purpose;
• Corporate requirements – identifying corporaterequirements, particularly building a corporate dataarchitecture which incorporates strategic planning;
• Data analysis – coordinating the use of a standarddata analysis methodology and its use to developbusiness data models;
• Data control – implementing standards for ensuringaccess is controlled and that suitable recoveryprocesses are in place;
• Data definition – implementing standards for thedefinition of data and controlling the medium for therecording and storage of such definitions;
• Data integrity – implementing the standardmechanisms for ensuring the integrity of Jamsostekdata and documenting the rules for ensuring integrity;
• Data dictionary management – promoting the useof a logical data dictionary and standards for itscontrol and monitoring the use and content of thedata dictionary;
• Data privacy – implementing procedures to ensurethat Jamsostek complies with any national dataregulations; and
• Data sharing – encourage the sharing of dataacross applications and to promote the idea that datais independent of applications.
Database Administrators – Key FunctionsThe Database Administrators are the technicaldatabase managers and are responsible for distributeddata sites, their maintenance and operations. Thesepositions are critical in Jamsostek due to the distributeddata and processing architecture. The Branch Officeis the source of all data in Jamsostek and the reliability,accuracy and integrity of this data reflects these

7 2
Part II Chapter 6
parameters in the National data, on which managementdecisions about Jamsostek are made.
The future IT organization for Jamsostek proposes theestablishment of eight (8) Database Administrators inthe National office to support each of the Regions,including the Regional Office and the associatedBranch Offices. The core responsibilities of thedatabase administrator are:• Data archiving – establishing a strategy for culled
or obsolete data;• Data backup and recovery – establish the
procedures for data backup and recovery fromhardware and software failures;
• Data control – establish user groups, assignpasswords, granting access to DBMS facilities,granting access to databases etc;
• Data standards – ensuring that physical data isdocumented in a standard way such that multipleapplications and end users can access the dataeffectively;
• Impact assessment – assessing the impact of anychanges in the use of data held within databasesystems;
• Monitoring data usage and tuning databasesystems – monitoring live running of databasesystems and ensuring the effective performance ofthe systems;
• Physical design – the physical design of andimplementation of databases (national office only);
• Privacy, security and integrity – ensuring that thestrategies laid down by the data administrator forprivacy, security and integrity are adhered to at thephysical level; and
• Training – responsible for the education and trainingof users in the principles and policies of databaseuse and in particular the data operators and ITpersonnel in each of the regions and branches.
IT Practices and Standards
In a mature IT organization the IT standards andprocedures have usually evolved over a long period oftime and the standards have become entrenched inthe IT operations. The IT Strategic plan for this typeof organization does not always provide a detailedsection on practices and standards.
In a developing or relatively young IT organization likeJamsostek the development of IT practices andstandards is an essential part of the IT managementprocess. These practices and standards can bedescribed in the IT strategic plan or as a discreetstrategic document.
Some of the practices and standards, which must bedeveloped in an effective and responsive ITorganization include:• Change management process;• IT Project methodology and the preferred support
tools;• Planning methodology and procedures;• Development methodology including the use of CASE
tools, platform, middleware etc;• User involvement in the IT development cycle;• Data standards;• Data management;• Testing strategy;• Infrastructure development and management;• User support;• Training strategies available and preferred;• Implementation methodology;• Fault reporting and management; and• Documentation maintenance and standards.
General IT Principles
To be able to be considered the natural coreorganization for future social security expansion,Jamsostek will need to strengthen its operations andIT systems so that it can evolve and adapt rapidly to:• Accommodate and facilitate the delivery of new and
changed business services;• Take advantage of new technology that will allow
IT services to be delivered more cost effectively;and
• Minimize the levels of business and technical risk.
The IT Systems architecture should be sufficientlymodular to permit individual components to be changedor added to meet emerging business needs and to takeadvantage of more cost effective technologies.
The architecture should be:• Scalable, which means that as the IT workload
increases, components of the same type as thosealready in the Architecture can be easily added tomeet the rise in demand;
• Flexible, which means that the Architecture will beamenable to change and will not lock the organizationinto any one particular strategy. An example is theability to move functions between servers andworkstations;
• Open, which means that the components of theArchitecture will interact via defined interfaces andstandards, thus achieving a high level of vendorindependence and the ability to rapidly take advantage
7 3
Part II Chapter 6
of new technologies (by having an explicit migrationpath to more advanced technologies);
• Secure, which means that the Architecture will notallow unauthorised access to the organization’s dataand information, and new and existing policies andstandards relating to privacy and security will be ableto remain in force;
• Cost-effective, which means that the Architecturerepresents the best value for money option ofdelivering IT services, at least, the following factorsshould be considered in determining this:! Whole-of-life hardware, software and
communication costs;! The ability to deliver acceptable levels of
availability, performance, flexibility andmanageability; and
! The ability to reuse components in the future;• Manageable, which means that the function of all
components in the Architecture will be bothunderstandable and controllable.
Architecture Characteristics
The Architecture should also provide the followingtransparencies to both end-users and applications:
• Access, which hides the differences in datarepresentation no matter how and where the data isheld;
• Location, which hides the location of the physicaldevices, data and applications from the users thatinteract with them;
• Replication, which hides the effects of providing asingle service using a number of duplicated interfacesor data working in concert;
• Concurrency, which hides the existence ofconcurrent users of services;
• Migration, which hides the effects of servicesmoving from one location to another while clientsare interacting with them; and
• Failure, which hides the effect of partially completedservice requests that fail.
The general IT principles that apply to Jamsostek shouldbe identified and prioritised and used to test that currentand future elements of the architecture or systemsconform to the principles. This can assist IT plannersto ensure that the best possible solutions are found forthe needs of Jamsostek. These principles should alsobe reflected in the IT Strategic Plan.
Hardware Issues
The general performance levels in Branch and RegionalOffices appears to be satisfactory in the current
environment and membership numbers and claim rates.There is no formal measurement of response times orservice standards of the servers and other hardware.Server performance and reliability should be availablefrom the maintenance contractors. The hardwarereplacement program provides for upgrades on acontinual basis in accordance with the annual IT budget.
The ability of the existing architecture to support anexpanded Jamsostek can only be determined when thefuture requirements are engineered and the ITarchitecture exercise has been undertaken.
Amalgamation of multiple membership records andarchiving of the inactive records could see the dataholdings reduce to about 50-60% of Installed capacity.This would allow for significant expansion ofmembership and to improvements of access andprocessing times.
Management Information (MI)
MI in Jamsostek is provided at all levels in theorganization. In Branch Offices data is extracted fromthe local database and exported into spreadsheets(usually MS Excel) and this constitutes a limited amountof MI. There is no Executive Information (EI) abouttimeliness or about the stages of completion of any ofthe major workflows and processes. This is a plannedenhancement to SIPT. The Regional Offices adopt asimilar approach to their MI requirements.
The National Office also produces MI from the nationalintegrated database and this is the only nationalstatistical view of Jamsostek operations. Most of thisstatistical output is available on the Internet site.
A Management Information System is one of the highpriority development plans for SIPT.
MIS and EIS are critical components of Jamsostekoperations and managers at all levels requireinformation about the quantity and quality of workprocessing together with a predictive capacity toextrapolate trends to assist in the development of theservice delivery network and future programs. A futurecomponent of the project will identify key result areasfor administrative performance and client servicetogether with formulation of performance indicators.
Health Insurance
The current legislation allows for exemption from healthinsurance membership for employers that can

7 4
Part II Chapter 6
demonstrate their employees are covered by equivalenthealth care provisions to those offered by Jamsostek.As there are no clear guidelines or evidence available,virtually all statements of exemption by employers areaccepted. Only about one tenth of the employers thatare active in the retirement and disability programsare also members of the health insurance scheme.
For Jamsostek to be an effective competitor in theprovision of health care services and to increase thecompulsory membership above its current 1.5% of thepopulation then a number of improvements to theprogram will be necessary. Some of theseimprovements are:• Increase in membership to minimise risk;• Improvement of services to attract more members;• Removal of the salary limitation on membership
contribution;• Better selection and control of providers;• Automating the health care claims process; and• Repeal of the opt-out clause in the legislation.
Automating the process will have considerableassociated costs and will require development of a newcomputing application. This could not be achievedwithin existing resources without severe restrictionson all other IT development and maintenance withinJamsostek. Additional hardware and significantupgrades would also be necessary to maintain a fullyautomated health care system. An alternative optioncould be to purchase an off the shelf health care systemeither independently or jointly with some of the otherhealth care schemes.
It is also questionable whether there should be anumber of government sponsored health insuranceprograms and that the integration of existingcompulsory insurance schemes into one organizationcould have the following benefits:• More efficient service delivery;• Spread the health risk across a wider range of
members;• Wider range of providers from integration of
agencies;• Economy of scale from a larger membership; and• Common computing application system that will
minimise the current duplication of resources inmaintaining multiple different systems across manyorganizations.
Another component of the ILO project, RestructuringSocial Security in Indonesia, will produce detailedrecommendations for the future of the Jamsostek healthcare program.
Business Re-engineering Exercise
The Jamsostek computing environment and itsenterprise architecture must be strengthened if it is toexpand its membership numbers and potentially extendthe functionality and services to members. Significantsystems re-development is required in the datastructure and data management areas in order toaddress the essential improvements in the keyprograms such as:• Shifting the service focus from employers to
employees;• Elimination of multiple memberships;• Improving contributions compliance; and• Improving service to members.
The elements described below should form the coreelements in any business re-engineering process:
IT Strategic Planning
The current IT Strategic Plan is maintained by the ITmanager and the plan is an informal plan based onendorsement from the Director of Finance and IT. Theplan is essentially a set of priority developments basedaround the current architecture and business rules.These business rules do not take into account thepotential outcomes of the national working party onsocial security reform or any of the majorenhancements identified in the ILO projectRestructuring Social Security in Indonesia.
The current IT strategic priorities are:• Extending the communications network in two stages,
firstly to the Regional offices and Jabotabek Branchoffices and secondly to the remaining Class I BranchOffices;
• Continued development of SIPT;• Hardware replacement of oldest servers throughout
2002; and• Data purification of current member records.
The IT strategic plan should be reviewed to establishthe direction of the future IT development needs inJamsostek and to foster IT development in accordancewith the business needs.
Business Needs
Prior to completion of the IT strategic plan, extensivedetails will be required about the business needs ofJamsostek to enable the IT is to support those needs.The business needs should provide the future detailsabout:

7 5
Part II Chapter 6
• Jamsostek Mission;• Jamsostek Goals;• Business outcomes required;• Service delivery model (based on customer
lifecycle);• Delivery network expansion plans;• Potential for devolution of further services;• Plans for the introduction of new services or benefits;• Service standards to be achieved including the
timeliness, volumes, rates etc;• Management information requirements; and• Growth estimates and future capacity requirements.
The business application development in Jamsostek isnot exclusively driven by the business and much of thedevelopment responsibility is vested in the IT Branch.International experience and future industry predictionssuggest that the biggest changes affecting businesswide applications is the formal shifting in applicationresponsibility from IT to the business. The business orprogram owners are in the position to establish valuefor implementing business-wide applications anddetermine the pace of change in expanding them. Todate, most business-wide applications have beenimplemented with the expectation of integrating keybusiness processes resulting in a more effective andefficient business operation. This direction ensures thatthe business drives IT development in accordance withbusiness priorities and not for IT or equipmentpreferences.
Jamsostek has the opportunity to develop this businessdriven IT environment and the key factor in this is todevelop the business needs so that the IT centre canrespond to developing solutions for those needs.This process of business re-engineering should be abusiness driven process and not technology driven. Thefollowing schematic shows that technology is onlyapplied to assist in the solution once the new orredefined business processes have been identified.
Figure 45 Business Re-engineering
Business Development Workshop
It is essential that further business re-engineeringplanning workshops be conducted for key Jamsostekstaff with an desired outcome to produce a revisedbusiness plan, an IT strategic plan and ITimplementation and development plans.
In order to achieve these goals some of the pre-requisites are to conduct further executive study toursthat can provide the opportunity for senior managersto compare other social security institutions in order tobetter understand the issues now facing Jamsostek.These study tour should be conducted in conjunctionwith study tours for IT technical staff to enable themto identify the options available to Jamsostek for there-design of its current computing environment, datadesign, data management and IT organization.
Other pre-requisites include the completion of a fullinventory of existing systems and their functions,information from other components of the ILO projectRestructuring Social Security in Indonesia and userrequirements. A business needs workshop comprisingjoint users and that addresses the key issues confrontingJamsostek should follow the study tours with theoutcome designed to prepare the organization as thecore social security organization in Indonesia.
The key pre-requisites for Jamsostek to succeed in itsfuture IT development are:• A business plan;• An IT strategic plan either separate from or included
in the business plan;• Executive commitment to the role of IT in the
business process; and• Adequate number of skilled IT resources
commensurate with the IT tasks.
An overview of the recommended IT developmentplanning process for Jamsostek and the initial exercisesthat were undertaken as part of this project is shownin Figure 46.

7 6
Part II Chapter 6
Figure 46 Initial Business Reengineering Plan for Jamsostek
Overview of the First Stage of an IT Development Plan for Jamsostek
7 7
Part II Chapter 6
Conclusion
Social Security Schemes - The Future
There are a number of immediate amendments tolegislation and other recommendations that ultimatelymay be pursued and could substantially change thebusiness rules for Jamsostek and they are:• Amending Law 3 of 1992 to convert Jamsostek from
a Persero to a public social security organization,controlled by a tripartite board charged withadministration of a trust fund;
• Extending over time, the current retirement, deathbenefits, maternity and health care benefits to a largerproportion of the population i.e. from about 32.5%of the formal private sector workforce and 11% ofthe labour force to the entire non military andgovernment work force including the informal sector;
• Introduction of periodical pension payments, inaddition to, or in conjunction with, the lump sumretirement benefits; and
• Additional means tested schemes such asunemployment benefits, social assistance and otherpoverty alleviation programs that could be eithercontributory or non-contributory programs.
In order for Jamsostek to be seen as one of the coreagencies for the future public social security servicedelivery, the operations and IT systems will need to beextended, simplified, become more flexible andresponsive to change. To achieve this, the basic corefunctions and procedures described in therecommendations section should be implemented assoon as possible.

7 8
CHAPTER 7 COMPLIANCE
Compliance was seen as the key to better overallperformance of the fund as higher contribution incomeswould result in higher returns to members and serveto spread the risk across a wider group of membersand minimise adverse selection in critical programmes.
The degree of non-compliance with the existinglegislation and administrative arrangements issignificant, with only about 32.5 % of eligible formalsector employees contributing to the Jamsostekscheme. There is virtually no voluntary complianceamong enterprises excluded from compulsorycompliance under the law and employees of suchenterprises represent about almost 70% of theworkforce. The major barriers to contribution aregeneral ignorance of social security provisions andrequirements, an adverse perspective of Jamsostek anda lack of coordination and commitment to complianceby Depnakertrans and Jamsostek which iscompounded by their limited capacity.
Law No. 3 of 1992 provides for investigation andenforcement of compliance to be undertaken by labourinspectors with rights of entry to business premises, tointerview persons employed there and with powers totake possession of items of evidentiary value. Theselabour inspectors have been part of Depnaker — notunder the control of Jamsostek. The inspectors haveother duties, including:
• Health and safety inspections;• Labour standards;• Wages inspection;• Investigation of industrial disputes.
Since 2001 the responsibility for labour inspectors hasbeen devolved to provinces and undertaken by Dinas.The force of labour inspectors is under complement inmany areas.
The report on enforcement of Law No.3 of 1992 bythe Department of Manpower and Transmigration for200118 shows that labour inspectors carried outenforcement in only 11 of the 30 thirty provinces.Despite widespread non-compliance, only 56employers were prosecuted —47 of these were fromthe Jabar province, indicating the unevenness of theenforcement process under government control.
The report further indicates that:
• In the eleven provinces where the enforcement iscarried out, 12% of the employers are liable but havenot registered;
• Only 46% of employers had been informed of therequirements of Jamsostek;
• Notices were sent to only 40% of employers whohad not complied with the Law; and
• Only 1.3% of these employers who were givennotices of non-compliance were prosecuted in theCourts.
The project considered the issue of enforcement inthe light of international experience and from a numberof viewpoints, including: current practice; the presentscope of work of officers charged with enforcement;the need to improve the line of control; and the futureneeds of Jamsostek in relation to staff resources andmanagement succession.
Current PracticeAs indicated above, the present responsibility forenforcement rests with labour inspectors. As far ascould be established, when non-compliance is suspectedby Jamsostek accounts managers, this is reported tothe labour inspectorate for action. In many cases itseems that an initial estimate is done by Jamsostekaccounts managers of the extent of liability and thatthis estimated sum is the amount that labour inspectorsseek to enforce. Thus the sum enforced may well beless than the actual liability since any demand forpayment will not be based on an actual assessment ofliability from wages records and interviews withworkers. In effect this is condoning non-compliance.In only some cases is there any real investigation bylabour inspectors into possible contravention with thelabour laws. Discussions with Jamsostek suggestedthat only rarely was any feedback provided in responseto reports of non-compliance, despite the arrangementsfor coordination meetings at Regional and Branch/Arealevel between Jamsostek and Depnaker. Apart fromthe Depnaker report referred to above it was notpossible to quantify the number of reports or the resultsof any investigations or validate the thoroughness ofthe investigations.
Discussion with Labour Inspectors in ProvincialAdministrations (Dinas Tenaga Kerja) indicated thatsocial security compliance was only a small part ofthe role of Labour Inspectors. The tools available for
18 See ILO Report on Employment Injury & Death Benefits
Part II Chapter 7

7 9
inspectors to identify cases of non-compliance werelimited and association with other collection agencies(e.g. taxation collectors) was almost non-existent.Dinas is also responsible for the registration of mediumand large businesses and companies and maintains arecord of registered companies in the province. Theprovincial administration through local authorities is alsoresponsible for issuing permits for traders to conductbusiness in the local area. The labour inspection functionfor social security appears to be conducted on a reactiverather than proactive basis. The major inspection triggeris based on employers declaring less than the averageminimum wage as part of the monthly contributionprocess.
Information gained from discussions during the regionalworkshops in February 2002 indicated that sincedecentralization some Provinces had introduced localtaxes that were being collected by Dinas. In theseprovinces the enforcement of Jamsostek contributionswas accorded a lower priority than other collections.Thus the inconsistency indicated for the enforcementprocess under the direct control of Depnaker is likelyto deteriorate further following decentralization. . Itwas also alleged at regional workshops that in someinstances Jamsostek staff were too ready to accept alow payroll figure and level of wages at the minimumwage level without confirmation.
What should happen in a well-run enforcement systemwhenever non-compliance is suspected or reported isthat an inspector should conduct a full inspection —including a careful examination of the wages recordswhich should be reconciled with cash or bank transfersin respect of wages and through interview with workerson the employer’s premises. The resulting assessmentof liability should then be the basis of complianceaction. But in order to carry out such inspections ineach case of non-compliance the complement ofinspectors and their span of work needs to be reviewed.
Reasons for non-ComplianceThe current process comprises the identification of non-compliance in Jamsostek and referral to Depnakertrans,for investigation, decision and appeal. The compliancefunction is performed outside the organization delegatedto collect contributions and to assess benefit claims.In addition, to the multiple handling of compliance casesand complaints, this process can facilitate exploitationof the division between agencies and introduceunnecessary delay. Whilst there should be a divisionof responsibility it is perhaps more appropriate that thedivision should occur between the compliance decision
and the appeal. This would allow the authorised agencyto complete the full range of its responsibilities withregards to collection and compliance and its decisionscould be subject to appeal to a body that is impartialand independent of the original decision makers.
The major forms of non-compliance include:• Failure to register as a contributory employer;• Under reporting the number of employees;• Under declaring or depressing the value of wage
levels and the total payroll; and• Non-payment of contributions (arrears).
There are a number of instances where contributionsare not collected or enforced and a typical example isfor people contracted to an employer as a day workeror for a particular task. Many employers use this typeof employment contract to evade contributions toJamsostek. The existing legislation (Act 3, 1992, TheLaws and Regulations of The Republic of Indonesiaon The Employees Social Security) covers suchworkers contracts and provides the method to be usedfor the calculation of contributions. Close examinationof the existing legislation indicates that most employeesin the formal sector are covered by the legislation andthe membership and contributions to the scheme shouldbe considerably higher than at present.
A summary of the stakeholder comments about non-compliance were:• Penalty for non compliance is not seen to be evenly
applied across the community;• Long delays in identification of avoidance and
consideration of cases;• Collection agency (Jamsostek) has no delegation to
investigate or enforce non compliance;• Disputes are investigated and actioned by another
agency with limited local knowledge of the individualemployers; and
• Compliance process is not coordinated at any level.
Many of these comments relate to the real andperceived performance standards of Jamsostek andthese are discussed in the Chapter on extension ofsocial security coverage in Part IV of this Publication.
Compliance PrinciplesCompliance and fraud minimization are key elementsin the equality principle of targeting social securitypayments to those most in need. It is also central tocompliance and payment only to those with a legalentitlement to social security benefits and services.Compliance is a national, programme-wide
Part II Chapter 7

8 0
responsibility and the current focus in Jamsostek iscompliance to ensure compulsory membership,collection of contributions to the funds and internalfraud. This focus could change in the future, especiallyif means tested or compliance based paymentprogrammes are introduced. The key principles forcompliance and fraud minimisation are:
• Prevention - To have systems and procedures inplace that minimize the risk of understated salaries,incorrect contributions and payments;
• Detection - To detect incorrect contributions andpayments at the earliest possible stage if they dooccur; and
• Deterrence – To deal decisively with cases thatare detected, thus creating a public recognition ofthe risks and penalties involved in attempting todefraud Jamsostek and also to promote voluntarycompliance.
A revised compliance process should have:• A strong local focus;• A prevention strategy that includes an information
strategy, process controls and inter-agency liaison;• The delegation to actively promote compliance,• The ability to react quickly;• A compliance plan coordinated at all levels, national,
regional and local,• Provide local review of decisions; and• Division of responsibility between decision and
appeal.
Extension of social security to the formal sectoremployees is dependent on three key elements:• Marketing and awareness of the legislative
requirements and the benefits of social securityprograms to employers and employers;
• Repeal of elements of regulation 14 of 1993 so thatthe estimated 5 - 10% of employers under the monthlypayroll base of Rp. 1,000,000 and currently exemptedfrom social security contribution would bring themandatory provisions to 100% of the formal sectorworkforce; and
• Effective compliance for social security contributions,this could be improved by transfer of the responsibilityfor compliance to the collections agency, Jamsostek.
Scope of Work of Labour InspectorsAt present labour inspectors are responsible for:—
Jamsostek Social Security Functions including:• Examination of wages records;• Investigating work-related accidents
• Investigating suspect non-compliance (possiblyleading to appearance as a witness in Court); and
Standards Functions including:• Occupational Health & Safety Inspection;• Labour Standards;• Wages;• Industrial Disputes.
In order to achieve an improvement in compliance, asit must be in future if the scheme is to remain viable,the social security inspector will need be the front lineof Jamsostek’s public interface — the main point ofcontact between employers and the institution.Inspectors will need to be directly involved in:
• Registration and registration drives;• Payment of Contributions;• Reconciliation & Checking;• Questions of Liability;• Payment of Benefit;• Questions of Entitlement; and• Work Accidents
These are some of the main areas where the operationof social security schemes directly comes into contactwith the public. While much of this public contact isdealt with by caller counter services, the more difficultcases require the intervention or investigation by aninspector. This means that inspectors must havedetailed knowledge of the social security scheme,including the range of benefits and qualification forentitlement; be conversant with all social securitylegislation, including Regulations on liability and thedifferent insurance classification of different groupsof Members; Rules of Evidence and the state ofprogress of each case the inspector has investigated.The range of knowledge required is broad and a rangeof interpersonal skills is necessary. Thus, while OHSis an important aspect of social protection, with directimplications for benefit outgo from the occupationalinjuries fund, given the staff complement and the needto improve the control of compliance and performanceof inspectorate operations — the Projectrecommends that the standards functions of Labourinspection should be treated as a separate activity anddeserving separate legislation and a separateinspectorate force.
Concern was expressed during the 2002 workshopprogramme that inspectorate work was open to fraudand abuse and that changing the system presented a
Part II Chapter 7

8 1
moral hazard. This concern is fully understood by theILO and it is considered that control certainly needs tobe increased. The decentralization process thattransferred responsibility from central, Depnakercontrol to Dinas through Provincial Governors hastended to make control of abuse less consistent andmore remote than formerly.
Jamsostek and ComplianceThe ILO is proposing an inspectorate force with linemanagement at Jamsostek branch and regional levelwith policy direction from Head Office. The Jamsostekorganization is more broadly distributed throughout thecountry than that of Depnakertrans, with 8 RegionalOffices and 114 Branch offices whereas there are 15Area Offices in the Depnakertrans service deliverynetwork and these concentrate exclusively on controlof the overseas migrant workers program. Inaccordance with devolution under the RegionalAutonomy program, all of the functions of theDepnakertrans local network have been devolved toprovincial government authorities. From January 2001the Regional Governors of the thirty-two (32) provinceshave been responsible for the administration of mostof Depnakertrans (and other national government)policies in their regions and provinces. Governmentministries and departments are subjected to Regionalautonomy whereas government owned limitedcompanies and enterprises such as Jamsostek areexempted from local devolution of facilities andresources and Jamsostek still maintains a nationallydirected and controlled organization.
The Jamsostek Branch offices are located in the maincentres of employment and are continually subject toreview and expansion in accordance with the Branchoffice distribution formula. The justification forincreased responsibility for compliance being placedwith Jamsostek is as follows:
• Branch offices hold current data about employersand employees;
• Jamsostek case managers in each Branch areresponsible for a fixed number of employers;
• Closer access to the employers and workers;• Local knowledge about employment and
contributions activity in the area;• Responsibility for memberships to the funds;• More efficient to handle compliance issues directly;• More incentive to collect contributions through staff
bonus schemes; and• Ability to control the progress of the enforcement
process (e.g. so that current compliance cases canbe followed without prejudice to possibleproceedings).
Should it become responsible for social securitycompliance then Jamsostek would need to implementnew compliance processes, enhance its IT systems,recruit and train social security inspectors and establisha compliance case management process to track andreport on cases started, pending and completed. Therewould need to be a regular audit process, perhaps by atripartite internal audit unit. This audit might routinelyinvolve follow-up inspections to confirm the quality andhonesty of inspections and having the potential toexpose corrupt practices. There may be a need alsoto transfer inspectors from one area to another tominimize the potential for collusion. The developmentof standard operating procedures, performanceindicators and targets and close supervision of workreturns, receipt books and claims for expenses wouldsupplement the control process.
The effectiveness of the enforcement process and itscontrol can also be assisted through a simplifiedcontribution structure (See Chapter 8).
Part II Chapter 7

8 2
Figure 47 Table of Jamsostek Contributions
Employer Worker Total (per cent)
Old age 3.7 2.0 5.7Death 0.3 - 0.3Work injury 0.24 to 1.74 (*) - 0.24 to 1.74Health care 3.0 (single) - 3.0 / 6.0
6.0 (with dependents)
Note (*): The contribution rates of employment accident benefit is set by group of business classification I-V: 0.24%, 0.54%, 0.89%, 1.27%and 1.74%, respectively.
The report on Occupational Injuries and Death Benefits recommends that there should be a unified rate for this benefit branch. There are anumber of reasons for this including the fact that the high occurrence of accidents that occur while commuting to and from work (a risk commonto all employment groups); the fact that in the present system no benefit accrues to the employers who introduce effective safety measures; andno account is taken of the relative benefit to the economy of some high risk occupations (such as oil production or mining) or potential harmto national health from some low risk industries (such as cigarette manufacture). There would certainly be administrative savings from a unifiedcontribution. Since this programme shows an excessive profit of contribution income against benefit outgo it should be possible to unify thecontribution, giving a greater solidarity and pooling of risk with only the lower risk groups suffering an increase in the level of contribution.
CHAPTER 8 JAMSOSTEK CONTRIBUTIONS STRUCTURE
19 ILO Report to the Government on the financing and investment of Jamsostek and social budgeting in Indonesia 2002.20 ILO Report on Jamsostek Health Care Programme. EU Report: Project Preparation Mission in the Area of Social Health Insurance inIndonesia 5th To 28th November 2000.
Part II Chapter 8
The present contributions structure of the Jamsostekprogramme can be seen from the following table inFigure 4719:The breakdown of contribution rates ofJamsostekWhile it is essential that each branch of the socialsecurity scheme should have a measure of discreteaccounting to ensure that contribution income, etc. is
sufficient to meet future benefit liabilities, administrativecosts of each branch, etc. It is considered that thecontributions structure is needlessly complicated andindeed makes the enforcement of compliance moredifficult and costly. It would be more in keeping withsocial insurance principles of shared risk and farsimpler to administer if there were a unified contributionrate applicable to all employers.
The other programme with variable rates is the healthcare programme where there is a difference incontribution payable in respect of the single and themarried worker and between those employers coveredcompulsorily and those who have ‘opted out’ on thebasis that they have better health care protection inplace. A number of reports20 have commented on the‘opt out clause’ indicating that not only is it regulatedineffectively but also that it conflicts with the socialinsurance principle of sharing risk across the whole ofthe workforce. There are also indications that theenforcement of contributions at the correct rate maynot be done other than as a result of a claim in respectof the family of a married worker.
Should the Government decide to introduce a socialinsurance maternity benefit, the principle of shared riskwould indicate that the cost should be borne by a unifiedcontribution across the workforce, irrespective ofwhether the worker is male or female, married orsingle.
Thus, in the interests of risk sharing and simplificationof the enforcement process, consideration should begiven to introducing a unified rate of contribution acrossthe board. The contributions once collected andrecorded would, however, continue to be separatedfor discrete accounting within each element of theprogramme to ensure that benefit outgo and the costof administration for each was matched by thecontribution income, taking account of the differingneeds to accumulate reserve funding.
When the contributions structure is reviewed,consideration should also be given to extending andadvertising the various payment possibilities forcontributions, especially those available to would-bevoluntary members. The availability of voluntarymembership by groups presently excluded (such asself-employed, informal sector workers and migrantworkers needs wider publicity. Such payment systemsshould, in future, take account of new technology suchas internet banking that would enable people tocontribute while working abroad.

8 3
Part II Chapter 9
CHAPTER 9 HUMAN RESOURCES
The human resource requirements of Jamsostek Baruare going to be considerably greater than at present,given the need to extend coverage to groups presentlyexcluded and assuming that there will be a phasedimprovement in the benefit programme. There will needto be a progressive increase in the number of Branchand Regional offices with a requirement for moremanagers. Should there be a new force of inspectorspossibly with a regionalized command structure, thistoo will imply the need for more managerial staff withspecialist compliance experience. Having trained thisnew cadre of inspectors it would be a huge waste ofresources if they were not to be available to meet thehuman resource requirements of the future. Thus it isimperative that this new force of inspectors should beintegrated into the Jamsostek staffing and careerstructure and, in the longer term, to be available to fillmanagement succession needs. It also follows thatJamsostek should recruit, train and control theinspectorate force and that inspectors. These newinspectorate posts should carry appropriate conditionsof service no less attractive than their indoor Jamsostekequivalents.
Through informal discussion with staff at various levelswithin Jamsostek it is clear that, while improvementshave been made over the past two years, there is stillsome way to go to improve the corporate culture ofJamsostek, its staff morale and its level ofperformance.
In particular, there is a need for Jamsostek to developand strengthen its managerial capacity to cover anenlarged membership and established new Regionaland Branch offices where necessary. This creates theopportunity for a change in corporate culture to a moreparticipative system involving staff at all levels tocontribute to new strategies and systems. Such aprocess would benefit from developing shared valuesand the development of a new Mission Statement and
perhaps a new logo that staff can feel ownership of.This process could evolve from a corporate strategicplanning exercise with staff undertaking their ownSWOT (strength weaknesses opportunities and threats)and PEST (political, economic, social and technical)analyses.
It would be helpful for agreed job descriptions for staffat all levels to be drawn up with procedures for reviewof individual staff performance against agreedstandards. Following from this would be provision foran agreed management succession programme witharrangements for a comprehensive technical anddevelopmental training programmes based on a trainingneeds assessment. This might include the establishmentof an appropriate grading structure for Jamsostek staffin Headquarters, Regional and Branch Office locations,including the newly created force of inspectors.
The study of the economically active population couldbe used not only to inform policy decisions on thephasing in of extension of coverage but also to informan assessment of the human resource requirementsand the implications for establishing additional Regionaland Branch offices for Jamsostek.
There will be immediate needs for new staff for theinspectorate and IT and a continual need for new staffas coverage develops geographically and by sector oroccupational group. This need indicates an ongoingrequirement for training that can best be met by an in-house training facility. The ILO is in a position, via afuture (Phase 2) technical assistance project to supportthe establishment of such a facility and withinvolvement in ‘training for trainers’ programmes.
Staff training and improved performance managementshould lead to increased professionalism, enabletechnical performance to be improved, and service tothe public to be measured.

8 4
Part II Chapter 10
CHAPTER 10 JAMSOSTEK FINANCE AND INVESTMENTS
economy is that employment is predominated by a largeinformal sector.
Financial analysis of JamsostekWith respect to the financial aspects of Jamsostek,the following issues have been identified.• Despite its original intension, the scheme does not
cover all private sector workers. The scope is limitedto establishments with more than 10 workers.Workers in small workplaces and in the informalsector are still outside the scope of the scheme.
• The “contract out” clause makes a loophole of thecoverage, giving an incentive for relatively largecompanies to stay out of the scheme. This will alsoresults in limited horizontal income redistribution.
• The compliance of contribution payment stood atsignificantly low level (less than 50%). This willfurther reduce the effective number of contributors.
• There is a problem of contribution evasion by under-declaring contributory wages. A common practiceis to pay contributions on the basis of basic wageexcluding various allowances and bonuses.
• The problems of coverage and evasion appear mostevidently in the health care programme. The coverageof health care is less than 10% of other programmes,and the health care contributions are paid on the basisof the minimum wages.
• The current legal status of Jamsostek as a publiclimited liability enterprise (Persero) entails a legalobstacle against the enforcement of the scheme.Currently Jamsostek has to rely entirely on labourinspectors of the Ministry of Manpower to conductinspections and contribution collections. In addition,the administrative capacity and efficiency ofJamsostek need further improvement.
• As a state-owned enterprise, Jamsostek is run on aprofit-oriented basis. Part of its surplus (i.e.contributions in excess of benefit and administrativeexpenditure) is paid to the Ministry of Finance asdividends and corporate tax. In this relation, it shouldbe noted that Jamsostek adopts accounting practicesapplicable to private insurance companies, whichrequire that substantial technical reserves be keptby Jamsostek. The financial projections suggest thatthe scheme may not face major financial difficultiesbut it could provide insufficient protection for a limitednumber of workers.
• One reason for the continuous surplus is the lowexpenditure on short-term benefits in relation to theircontributions. Our statistical analysis reveals that
Executive Summary
This Chapter is based on the main findings andconclusion of the actuarial and social budget expertteam in the project “Restructuring of the Social Securityin Indonesia (INS/00/M04/NET)”. The scope of thereport covers an assessment of the demographic andeconomic background for the development of socialexpenditure, an actuarial valuation of the Jamsostekscheme to examine its financial sustainability and toidentify weaknesses in its financial structure and areview of the investment policy and financialmanagement. ILO Actuaries also developed a socialbudget model for Indonesia for the national financialplanning and this is presented in Part IV of thisPublication.
Demographic and economic contextThe Indonesian population has been in a transition froma young age-structure with high growth rates to an oldage-structure with relatively low growth. The projectionresults show that this trend will continue. In particular,the projection results show that Indonesia willexperience a rapid population ageing for the next fewdecades. By 2030, the percentage of the populationolder than the current retirement age (55 years) andthe old-age dependency ratio (defined as the populationolder than 55 divided by the population aged 15-54years) is expected to be twice as high as the currentlevel. This will put heavy pressure on the financing ofsocial protection in the long run.
Furthermore, due consideration is required on thefollowing socio-economic issues associated with thefuture demographic changes. Firstly, the increased lifeexpectancy after retirement will necessitate anincrease in the retirement age, possibly from the current55 years of age to 60 years or higher. Secondly, thetrend towards smaller families will reduce the level ofthe family support for the elderly and create the needfor old-age support in the form of social security.
In terms of economic performance, the country hasgrown at rates higher than many other Southeast Asianeconomies except for the crisis period when itexperienced double-digit contraction. The industrialsector led the way in the past economic growth. Inaddition, except for the crisis period, the economy hasbeen stable with single digit inflation and relatively lowunemployment rates. One characteristic of the

8 5
Part II Chapter 10
rates of incidence of employment accident and ratesof utilisation of in-hospital care are significantly lowerthan the experiences of neighbouring countries. Inorder to make the balance of contribution and benefitmore equitable, suitable measures should be takensuch as (i) increasing benefit levels, (ii) relaxing thequalifying conditions or (iii) decreasing thecontribution rates. It should be noted that given thealready high benefits/contributions ratio for healthcare programme, excessive benefit increases mightcause a risk of financial shortage.
• The level of the old-age benefit is not sufficient foradequate economic protection for life afterretirement. The average amount of the old-age lump-sum for the retirees at age 55 is currently only 5months’ contributory salary (note that due to under-declaration the contributory salary represents only apart of actual salary). One reason for the currentlow benefit level is the past unfavourable interestrates (negative real interest rates) attributed tomembers’ balances. However, even though themembers’ individual accounts earn a fair interest forthe future, the estimated benefit level is still 2.5 years’contributory salary. This leads to the conclusion thatthe current contribution rate (5.7%) is set at too lowa level to produce sufficient savings. Further,considerations need to be made on the introductionof periodical payments.
• Since the financial crisis there has been a sharpincrease in the number of withdrawals of the old-age benefit on grounds of unemployment. In the
absence of unemployment insurance in Indonesia,this payment works as its substitute to meetimmediate need of cash for unemployed workers.However, such a premature withdrawal is not anadvantage for the beneficiaries but also it weakensthe old-age protection.
In view of the above problems in the current system,comprehensive reform packages need to be formulatedand presented together with their financial assessment.Special attention should be paid to the considerablepopulation size and regional diversity in Indonesia inplanning the reform process (policy-planning anddecision-making) and the implementation process.
Issues in the investment of the Jamsostek fundAs a result of poor investment performance in the past,the Jamsostek’s provident fund accounts have lost theirreal value substantially. However, under the currentinvestment regulation and improved investmentmanagement, a fair interest is expected for the future.
A possible scope of improvement of the currentinvestment regulations includes a further restriction ofequities and direct participation. To diversify the riskin the domestic market, possibility of foreign investmentinitially with a limited scope should be considered.Further to the investment regulations, organisation ofregular and efficient fund supervisions and the designof the institutional structure that enables effectivemonitoring and inspection are also crucial for ensuringsound fund governance in the long-term.

8 6
Part II Chapter 10
Bab 10 Keuangan Dan InvestasiJamsostek
Rangkuman Eksekutif
Bab ini disusun berdasarkan temuan-temuan utamadan kesimpulan dari tim ahli aktuaria dan anggaransosial dalam proyek “Restrukturisasi Jaminan Sosialdi Indonesia (INS/00/M04/NET).” Ruang lingkuplaporan mencakup penilaian terhadap latar belakangdemografis dan ekonomis bagi pengembanganpengeluaran sosial, penilaian aktuaria terhadap skemaJamsostek untuk memeriksa kesinambungankeuangannya dan untuk mengidentifikasi kelemahan-kelemahan dalam struktur keuangannya serta tinjauanulang terhadap kebijakan investasi dan manajemenkeuangan. Aktuaris ILO juga telah menyusun suatumodel anggaran sosial untuk Indonesia untukperencanaan keuangan nasional dan ini disajikan dalamBagian IV Publikasi ini.
Konteks demografis dan ekonomis
Penduduk Indonesia berada dalam transisi dari strukturpenduduk usia muda dengan tingkat pertumbuhan yangtinggi sampai struktur penduduk usia lanjut dengantingkat pertumbuhan yang relatif rendah.Kecenderungan ini diperkirakan akan terus berlanjutdan dalam beberapa dasawarsa mendatang jumlahpenduduk berusia lanjut di Indonesia akan bertambahdengan cepat. Pada tahun 2030, persentase pendudukyang lebih lanjut usianya dari usia pensiun sekarang(55 tahun) dan rasio ketergantungan usia lanjut (yangdidefinisikan sebagai jumlah penduduk berusia di atas55 tahun dibagi jumlah penduduk berusia 15-45 tahun)diperkirakan akan menjadi dua kali lipat daripadatingkat yang ada sekarang. Hal ini akan memberi bebanyang berat terhadap pendanaan perlindungan sosialuntuk jangka panjang.
Selanjutnya diperlukan pertimbangan yang tepatmengenai isu-isu sosial ekonomi yang berkaitan denganperubahan-perubahan demografis di masa yang akandatang. Pertama, meningkatnya usia harapan hidupsetelah pensiun akan menyebabkan perlunya usiapensiun diperlambat, mungkin dari 55 tahun menjadi60 tahun atau lebih. Kedua, kecenderungan ke arahkeluarga yang lebih kecil akan mengurangi banyaknyabantuan yang dapat diberikan kepada keluarga yangberusia lanjut serta menimbulkan adanya kebutuhanakan bantuan usia lanjut dalam bentuk jaminan sosial.
Dari segi kinerja perekonomian, Indonesia telahmengalami pertumbuhan ekonomi pada tingkat yang
lebih tinggi dari perekonomian dinegara-negara AsiaTenggara lainnya kecuali selama periode krisis moneter(krismon) di mana perekonomian Indonesia mengalamipenyusutan hingga dua digit. Di masa lalu, sektorindustri memimpin pertumbuhan ekonomi. Selain itu,kecuali selama masa krisis, perekonomian Indonesiarelatif stabil dengan inflasi digit tunggal dan tingkatpengangguran yang relatif rendah. Salah satukarakteristik perekonomian Indonesia adalah adanyasektor informal yang besar yang mendominasi lapangankerja.
Analisa keuangan Jamsostek:
Sehubungan dengan aspek keuangan Jamsostek, hal-hal berikut telah diidentifikasi:
• Meskipun Jamsostek aslinya ditujukan untuk seluruhpekerja sektor swasta, pada kenyataannya tidaksemua pekerja sektor swasta menjadi pesertajamsostek. Hingga saat ini, ruang lingkup kepesertaanJamsostek terbatas, yaitu untuk perusahaan yangmempekerjakan sedikit-dikitnya 10 orang tenagakerja. Tenaga kerja yang bekerja di tempat kerja skalakecil dan di sektor informal masih berada di luarlingkup skema jamsostek.
• Klausul “contract-out” [yaitu klausul yangmemungkinkan perusahaan mensubkontrakkanpekerjaan atau memberikan pekerjaan borongankepada perusahaan lain atau pemborong] merupakanjalan keluar bagi perusahaan-perusahaan yang relatifberskala besar untuk tidak masuk dalam cakupandan tetap berada di luar skema Jamsostek. Ini jugamengakibatkan terbatasnya redistribusi pendapatansecara horisontal.
• Kepatuhan dalam membayar iuran masih amatrendah (kurang dari 50%). Hal ini akan lebihmengurangi jumlah orang yang secara efektifmembayar iuran.
• Di samping itu juga terdapat masalah sehubungandengan peserta yang mengelak membayar iuransesuai ketentuan dengan memberitahukan jumlahupah yang lebih rendah daripada jumlah upahsesungguhnya untuk memperkecil jumlah iuranJamsostek yang harus dibayar. Cara yang umumdilakukan adalah membayar iuran berdasarkan upahpokok di luar berbagai tunjangan dan bonus.
• Masalah cakupan dan pengelakan pembayaran iuranpaling nyata terdapat pada program perawatankesehatan. Cakupan perawatan kesehatan ini lebihkecil dari 10% cakupan program-program lain daniurannya dibayar berdasarkan upah minimum.
• Status hukum Jamsostek saat ini adalah perusahaanperseroan terbatas (Persero). Status ini merupakanpenghalang bagi upaya menegakkan ketentuan
8 7
Part II Chapter 10
jamsostek. Untuk melakukan pemeriksaan danpengawasan serta mengumpulkan iuran, dewasa iniJamsostek harus sepenuhnya bergantung padapegawai pengawas ketenagakerjaan DepartemenTenaga Kerja. Lagipula, kemampuan administratifdan efisiensi Jamsostek masih terus perlu diperbaiki.
• Sebagai badan usaha milik negara, Jamsostek dikelolauntuk mencari keuntungan. Bagian dari surplus sisahasil usaha yang diperoleh (yaitu iuran dipotongmanfaat dan biaya administrasi) dibayarkan keDepartemen Keuangan sebagai dividen dan pajakusaha. Dalam kaitan ini hendaknya diperhatikanbahwa Jamsostek menerapkan praktik akuntansiyang diberlakukan pada perusahaan asuransi swasta,yang mengharuskan Jamsostek memiliki cadanganteknis dalam jumlah besar. Dari proyeksi-proyeksikeuangan yang dilakukan diperkirakan bahwa skemaini kemungkinan tidak akan menghadapi kesulitan-kesulitan besar di bidang keuangan tetapiperlindungan yang diberikannya kepada jumlahpekerja mungkin kurang memadai.
• Salah satu alasan mengapa Jamsostek menikmatisurplus sisa hasil usaha terus-menerus adalahrendahnya pengeluaran yang dibayarkan untukmanfaat jangka pendek dibandingkan dengan iuranyang diterima untuk itu. Analisa statistik yang kamilakukan mengungkapkan bahwa tingkat terjadinyakecelakaan kerja dan tingkat penggunaan fasilitasrawat inap di rumah sakit [di Indonesia] jauh lebihrendah daripada di negara-negara tetangga. Supayasaldo antara iuran dan manfaat menjadi lebih merata,langkah-langkah yang sesuai perlu diambil, sepertimisalnya: (i) menaikkan tingkat manfaat, (ii)melonggarkan syarat-syarat untuk memperolehmanfaat atau, (iii) mengurangi tingkat iuran.Hendaknya diperhatikan bahwa, mengingat sudahtingginya rasio antara manfaat dan iuran untukprogram perawatan kesehatan, kenaikan manfaatsecara berlebihan dapat menyebabkan risikokekurangan dana.
• Masalah lainnya berkenaan dengan tidakmencukupinya tingkat jaminan hari tua untukmemberikan perlindungan ekonomi yang memadaiseumur hidup setelah pensiun. Jumlah rata-ratapembayaran sekaligus jaminan hari tua untukpensiunan berusia 55 tahun saat ini hanya lima bulangaji selama mengiur (perhatikan bahwa akibatdiperkecilnya jumlah gaji yang diberitahukan, gajiselama mengiur hanya mewakili sebagian dari gajiyang sesungguhnya). Salah satu alasan di balikrendahnya tingkat manfaat saat ini adalah tidakmenguntungkannya tingkat suku bunga di masa lalu(tingkat suku bunga riil yang negatif) yang dianggapmerupakan akibat dari saldo anggota. Namun,sekalipun rekening pribadi peserta mendapat bunga
yang cukup baik di masa yang akan datang, tingkatmanfaat yang diperkirakan masih 2,5 tahun gajiselama mengiur. Kesimpulannya adalah bahwatingkat iuran pada saat ini (5,7%) ditetapkan terlalurendah untuk dapat menghasilkan tabungan yangmemadai. Selanjutnya, perlu dilakukan pertimbanganuntuk memperkenalkan sistem pembayaran secaraperiodik.
• Sejak terjadinya krisis keuangan, telah terjadikenaikan tajam dalam jumlah penarikan jaminan haritua akibat pengangguran. Karena tidak adanyaasuransi pengangguran di Indonesia, pembayaranjaminan hari tua ini berfungsi sebagai penggantiasuransi pengangguran untuk memenuhi kebutuhanuang tunai yang mendesak bagi pekerja yangmenganggur. Namun, penarikan dini seperti itusebenarnya tidak saja merugikan si penarik itu sendiritetapi juga berdampak kurang baik terhadap programperlindungan hari tua.
Sehubungan dengan masalah-masalah yang dijumpaidalam sistem yang ada sekarang sebagaimana yangtelah disebut di atas, paket-paket reformasi(perombakan) yang komprehensif perlu dirumuskandan disajikan bersama dengan penilaian keuangannya.Dalam merencanakan proses reformasi (perencanaankebijakan dan pembuatan keputusan) serta prosesimplementasinya kita harus memberikan perhatiankhusu pada banyaknya jumlah penduduk di Indonesiaserta keanekaragaman daerahnya.
Beberapa pokok permasalahan dalam investasidana Jamsostek
Akibat buruknya kinerja investasi di masa lalu, rekeningdana jaminan hari tua Jamsostek telah kehilangan nilairiilnya secara substansial. Meskipun demikian, denganperaturan investasi yang sekarang dan perbaikanmanajemen investasi, diharapkan di masa yang akandatang dapat diperoleh bunga yang memadai.
Ruang lingkup untuk kemungkinan perbaikan peraturaninvestasi saat ini mencakup pembatasan lebih lanjutterhadap ekuiti dan partisipasi langsung. Untukmelakukan diversifikasi terhadap risiko di pasardomestik, hendaknya dipertimbangkan kemungkinaninvestasi asing dengan lingkup terbatas pada awalnya.
Selanjutnya terhadap peraturan-peraturan investasi,upaya mengorganisir pengawasan dana secara teraturdan efisien serta rancangan struktur kelembagaan yangmemungkinkan pemantauan dan pengawasan secaraefektif adalah juga penting untuk memastikan tatakelola dana yang sehat untuk jangka panjang.

8 8
Part II Chapter 10
Financial Analysis of JamsostekReview of the current status of Jamsostek :issues and problems
Operations of JamsostekIn the current Indonesian social security system, theGovernment employees and private sector employeesare covered by separate schemes, as shown in Figure48. Historically, the scheme of formal private sectorworkers, called Perum ASTEK, was first implementedin 1978 under the Government regulations Nos. 33 and34 of 1977. The scheme provided old-age, death andwork injury benefits. After the promulgation of theEmployees’ Social Security Act (Law No. 3 of 1992)and the Government regulation on the implementationof the Employees’ Social Security Programme (No.14 of 1993), the scheme was reformed toJAMSOSTEK-PT (Jaminan Sosial Tenaga KerjaPersero). Jamsostek is a public limited liabilitycompany, the Ministry of Finance being the only shareholder, and it is under the supervision of the Ministerof Manpower and Transmigration. From 1992,Jamsostek began providing health care benefits inaddition to the above three benefits.
The current legal status of Jamsostek as a state-ownedenterprise entails a number of unusual features as asocial security institution. Problems associated with thecurrent legal status of Jamsostek are discussed in PartII of this Publication and pointed out by a number ofILO reports.21 Here we focus on financial aspects only.Currently the share capital held by the Ministry ofFinance amounts to Rp. 62.5 billion. Hence, if the legalstatus of Jamsostek changes from a public limitedcompany to a trust fund, this amount will have to beredeemed to the Ministry of Finance. As the schemeis run on a profit-oriented basis, contributions haveconstantly exceeded the benefits in each branch. Theexcess contribution is used in part to constitute thetechnical and catastrophe reserves22 and to pay taxand dividends. In 2000, the Jamsostek fund paid Rp.110 billion of dividends and Rp. 3 billion of corporatetax to the Ministry of Finance.
Figure 48 presents the revenue and expenditure of theJamsostek from 1992 to 2000. The table also presents
the ratio of the benefits to contributions and the reserveratio, which is defined by the reserve at the end of theyear expressed as a multiple of the benefit paymentduring the same year. The benefits/contributions ratioshows stable trends for each branch. The historicalaverage of this ratio is in the range of 40-50% forwork injury, 20-30% for death benefits, 70-80% forhealth care benefits and 10-40% for specialprogrammes. With the exception of health careprogramme, all programmes retain substantial reserveswhich cover more than four years’ current expenditure.These results are attributed to low benefit levels andlow benefit take-up rates. Note that recently theexpenditure on special schemes has been low due to adecrease in casual workers.It should be noted that since Jamsostek is liable toaccounting rules applicable to private insurancecompanies data on the financial performance arepresented in a somewhat different way.23 The incomestatement of Jamsostek records operations of threeshort-term insurance benefits only and the old-agebenefit is treated separately in the balance sheet (thebalance in provident fund is regarded as liability). Notethat the balances of old-age benefits are tax-exempt.
The above analysis does not take into account theadministrative expenses because they are not shownseparately for each programme. The consolidatedaccount shows that the administrative expenses(including salaries of the Jamsostek staff) have rangedbetween 8% and 17% of the total contributions, whichis considered to be excessive. In middle and low-incomecountries in the Asia and Pacific region such as Fiji,Malaysia, Thailand and Vietnam, the administrativeexpenses of social security institutions are less than5% of the contribution income. An Indonesian authorityexplains that Jamsostek is particularly short of skilledstaff in processing the individual accounts of the old-age programme.24 According to his opinion, a lowcontribution rate (5.7% for the old-age) also results ina large share of fixed costs in the total contributions;hence, other things being equal, an increase in thecontribution rate would reduce the relativeadministrative costs.
During the data collection, the project’s expert teamencountered several problems concerning the quality
2 1 See, for example, ILO (1999).2 2 Methods and assumptions of calculating technical and catastrophe reserves are described in the Ministry of Finance Decree No. S.1101/
MK.17/1994 and the Director’s Decision Letter No. KEP/330/0997.2 3 For the details of the account structure, reference should be made to the 1998 annual report of Jamsostek.2 4 It is reported that due to errors in administration a certain amount of old-age reserves are not attributable to members’ individual
accounts.

8 9
Part II Chapter 10
Figure 49 Table of Coverage of Jamsostek, 2000
Covered population (in millions) As a % of employed population
Old-age 18.9 34%Death 18.9 34%Work injury 15.2 27%Health care 1.3 (workers) / 1.4 (dependents) 2.3% / 2.5%Special programme 1.5 2.7%
Note: Estimated number of total employed population is 55.7 million in 2000.
of the base data. It was difficult to establish consistenttime series data, because Jamsostek does not presenttheir key statistics in a standard format. (For differentyears, the statistical reports were published underdifferent names such as, annual report, fact book, orcompany profile.) The data sources are fragmenteddue to segmented administration and lack ofcoordination between departments.25 As a result, someinconsistencies in the base data remain not reconciled.In order to improve the accuracy of the followinganalysis, a substantial improvement is needed in thestatistical reporting system.
This publication provides only some of the sourcestatistics that were used in the study. The full range ofpredictions, statistics, tables and figures are contained
in the Project Report titled Report to the Governmenton the financing and investment of Jamsostek andsocial budgeting in Indonesia.
Coverage and complianceEmployers hiring 10 or more employees, or paying atotal payroll of more than Rp. 1 million per month areunder the statutory coverage of Jamsostek. (Note thatRp. 1 million is equivalent to around US$ 100, or 2 to 3times the minimum salary.) So far 168,000 enterpriseshave been registered in Jamsostek but around 500,000smaller enterprises with less than 10 employees’ andfurther a bulk of informal sector workers remain outsidethe scope of the scheme. The following table in Figure49 shows crude estimates of population registered withJamsostek.
There is a separate special programme for constructionand casual workers, called JAKON. This schemeprovides work injury and death insurances only.Employers pay contributions on the project basis. Theamount of contribution is determined by the localJamsostek branch offices on the basis of the value ofprojects.
Furthermore, the compliance rate stands at asignificantly low level. In July 2001, the old age schemecovered 18.9 million members of which only 9.4 million,or only 49.7 percent, actually paid the contribution inthat month.
Contribution and evasion problemContributions collected from employers and workersare the main income to the Jamsostek fund. Table inFigure 50 below indicates the contribution rates byprogramme.
2 5 For example, health care statistics are kept separately from the other three benefits. As already mentioned, in the accounting statementthe old-age benefit is treated differently from the three insurance benefits.
In addition to the limited scope of coverage, there is aproblem of exemption. Although the coverage iscompulsory for the old age and death benefits, anemployer is allowed to “contract out” to a privateinsurance that provides better benefits. This clauseinevitably results in the evasion of large enterprisesfrom the scheme and thus limits the horizontal incomeredistribution. A crude estimate shows that about 3.7million workers are participating in the old age anddeath schemes but not in the work injury scheme.
The participation of health care is significantly low.When this benefit started in 1992, most state-ownedand some private enterprises had already beenregistered with the Government Employees HealthInsurance (ASKES). In addition, the contracting-outclause applies to this benefit.
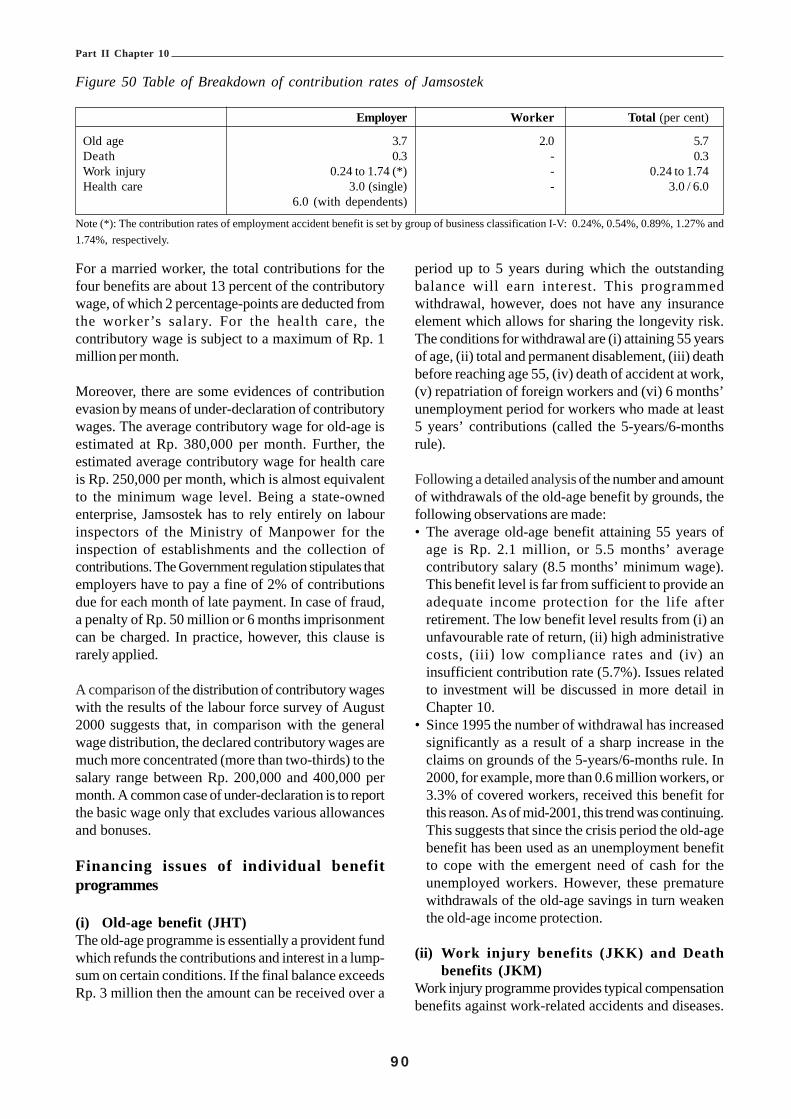
9 0
Part II Chapter 10
Figure 50 Table of Breakdown of contribution rates of Jamsostek
Employer Worker Total (per cent)
Old age 3.7 2.0 5.7Death 0.3 - 0.3Work injury 0.24 to 1.74 (*) - 0.24 to 1.74Health care 3.0 (single) - 3.0 / 6.0
6.0 (with dependents)
Note (*): The contribution rates of employment accident benefit is set by group of business classification I-V: 0.24%, 0.54%, 0.89%, 1.27% and1.74%, respectively.
period up to 5 years during which the outstandingbalance will earn interest. This programmedwithdrawal, however, does not have any insuranceelement which allows for sharing the longevity risk.The conditions for withdrawal are (i) attaining 55 yearsof age, (ii) total and permanent disablement, (iii) deathbefore reaching age 55, (iv) death of accident at work,(v) repatriation of foreign workers and (vi) 6 months’unemployment period for workers who made at least5 years’ contributions (called the 5-years/6-monthsrule).
Following a detailed analysis of the number and amountof withdrawals of the old-age benefit by grounds, thefollowing observations are made:• The average old-age benefit attaining 55 years of
age is Rp. 2.1 million, or 5.5 months’ averagecontributory salary (8.5 months’ minimum wage).This benefit level is far from sufficient to provide anadequate income protection for the life afterretirement. The low benefit level results from (i) anunfavourable rate of return, (ii) high administrativecosts, (iii) low compliance rates and (iv) aninsufficient contribution rate (5.7%). Issues relatedto investment will be discussed in more detail inChapter 10.
• Since 1995 the number of withdrawal has increasedsignificantly as a result of a sharp increase in theclaims on grounds of the 5-years/6-months rule. In2000, for example, more than 0.6 million workers, or3.3% of covered workers, received this benefit forthis reason. As of mid-2001, this trend was continuing.This suggests that since the crisis period the old-agebenefit has been used as an unemployment benefitto cope with the emergent need of cash for theunemployed workers. However, these prematurewithdrawals of the old-age savings in turn weakenthe old-age income protection.
(ii) Work injury benefits (JKK) and Deathbenefits (JKM)
Work injury programme provides typical compensationbenefits against work-related accidents and diseases.
For a married worker, the total contributions for thefour benefits are about 13 percent of the contributorywage, of which 2 percentage-points are deducted fromthe worker’s salary. For the health care, thecontributory wage is subject to a maximum of Rp. 1million per month.
Moreover, there are some evidences of contributionevasion by means of under-declaration of contributorywages. The average contributory wage for old-age isestimated at Rp. 380,000 per month. Further, theestimated average contributory wage for health careis Rp. 250,000 per month, which is almost equivalentto the minimum wage level. Being a state-ownedenterprise, Jamsostek has to rely entirely on labourinspectors of the Ministry of Manpower for theinspection of establishments and the collection ofcontributions. The Government regulation stipulates thatemployers have to pay a fine of 2% of contributionsdue for each month of late payment. In case of fraud,a penalty of Rp. 50 million or 6 months imprisonmentcan be charged. In practice, however, this clause israrely applied.
A comparison of the distribution of contributory wageswith the results of the labour force survey of August2000 suggests that, in comparison with the generalwage distribution, the declared contributory wages aremuch more concentrated (more than two-thirds) to thesalary range between Rp. 200,000 and 400,000 permonth. A common case of under-declaration is to reportthe basic wage only that excludes various allowancesand bonuses.
Financing issues of individual benefitprogrammes
(i) Old-age benefit (JHT)The old-age programme is essentially a provident fundwhich refunds the contributions and interest in a lump-sum on certain conditions. If the final balance exceedsRp. 3 million then the amount can be received over a

9 1
Part II Chapter 10
The analysis undertaken studied the change of thebenefit amounts from 1990 to 2000. Concerning theperformance of work injury programme, breakdowndata were available only for the period 1978-1988. Mainobservations are as follows:• The estimated incidence rate is about 1.3% per active
insured worker, which appears to be significantly low.For comparison, the incidence rate of the Workmen’sCompensation Fund of Thailand is more than 3%per insured worker.
• Medical costs have the largest share in the workinjury benefits (38%), followed by death benefits(33%), temporary disability benefit (14%) andpermanent disability benefit (13%). As aconsequence of employment accidents, 86.5% ofcases recover from illness but 9.5% remainpermanently disabled and 4.0% die.
• By age group, 47% of employment accidentsoccurred to workers of 26-35 years of age, 33% to16-25 years of age, and 15% to 36-45 years of age.Main types of accident include falling on hardsurfaces (46%), falling from height (18%), injury byfalling objects (14%), compressed legs (13%) andso forth. It is also reported that a large number ofwork injury cases occur during the commuting time.
• As from 2002, it is planned to increase the periodicalpayments for the work-related total and permanentdisability from Rp. 50,000 to Rp. 500,000 per month,and to abolish 2 years’ maximum payment period.
Death benefits are cash benefits payable to the familyin the event of non work-related death of an insuredworker. Currently, the benefits consist of a lump-sumcash benefit (Rp. 3 million) and a funeral grant(Rp. 0.6 million). It is planned to change the benefitformula to 6 times the last drawn salary with aminimum guarantee of Rp. 3.6 million. Also planned isthe payment of the funeral grant upon the death of thespouse of an insured worker. Given the sufficientcontribution income to the scheme, the above benefitimprovements are anticipated to be financially feasible.It is estimated that after the implementation of thesemodifications the benefits/contributions ratio willincrease to 60-70% for the both schemes.
(iii) Health care benefits (JPK)The health care benefits cover the medical costs forprimary and secondary out-patient care, in-patienthospital care, and special and emergency care. Table2.7 analyses the utilisation rates, unit costs and averagecosts by benefit category based on experience in 2000,from which the following observations emerge.• Concerning the utilisation of the outpatient care, an
insured person visits hospitals on average 1.9 times
a year (1.7 for primary care by general practitioners,0.09 for primary dental care, 0.1 for secondary careby specialists). For the in-patient care, the averageincidence rate of hospitalisation is 25 cases perthousand and the average admission period is 2.81days per case.
• For comparison, the corresponding health careutilisation rates of the Social Security Office (SSO)in Thailand (covering private sector workers) in 2000are as follows: 2.04 visits of out-patient care, 43hospitalisation cases per thousand, and 4.62 admissiondays per case. Although the utilisation of outpatientcare of Jamsostek is only slightly lower than SSO inThailand, the utilisation of in-patient care is about40% lower in terms of both incidence rate and thelength of stay.
• The resulting average cost in 2000 is Rp. 37,810 perperson per year. Assuming 1.08 dependents for onecontributing worker and the average contributorywage of Rp. 250,000 per month, the requiredcontribution rate (net of administrative expenses) isestimated at 2.62 per cent.
The adequacy of the medical cost rests on furtherdetailed examination of the unit cost. Given the currentprice level of medical services and the currentcontribution rates, a further increase in the utilisationrates of in-patient care, coupled with very lowcontributory base and relatively high administrativecosts, could potentially risk the financial viability of thehealth care programme.
Future development of the Jamsostek fundIn this section, we present the results of long-termactuarial projections of Jamsostek and examine itsfinancial viability.
Methods and assumptionsThe table in Figure 1 (in Annex 3) summarises thedemographic and economic assumptions for theactuarial projections which have been set out inChapter 1. The scheme specific assumptions havebeen taken, where possible, from the scheme statistics.In the absence of reliable data, we have usedexperiences of other countries and adjusted them inorder to ensure the overall consistency withdemographic and macroeconomic assumptions. Thescheme specific assumptions and cost estimationmethods can be summarised as follows.• The development of the covered population is
assumed to follow that of the employed population.In other words, the coverage rates are assumed tobe kept at the current level. In addition, bothcompliance rate and tax income assessment rate areassumed to stay at the current level.

9 2
Part II Chapter 10
• For the old-age benefits, it has been assumed thatthe number of withdrawals on grounds ofunemployment (the so-called 5-years/6-months rule)would decrease as the Indonesian economy isassumed to stabilize in due course. The claim rate of5-years/6-months rule is assumed to decrease to pre-crisis level by 2007. The old-age benefit has beenestimated by simulating year-to-year transition ofeach generation, thus the model captures the effectof ageing population.
• Costs of the work injury and death benefits havebeen estimated by taking into account the respectiveincidence rate (estimated from past experiences andassumed constant for the future) and the unit amount.The unit amounts are assumed to increase in linewith the increase in wage. The effects of theproposed benefit improvements have also been takeninto account.
• The health care costs were estimated separately byoutpatient care and in-patient care. Costs of theoutpatient care have been estimated by taking intoaccount the estimated utilization rate and the unitcost. The utilization rate is assumed to increase fromthe current level of 1.9 visits per year to 2.0 visitsper year by 2011. The unit outpatient cost is assumedto increase in line with the wage increase. Costs ofin-patient care have been estimated by taking intoaccount the incidence rate, the length ofhospitalisation and the unit cost per day. The incidentrate has been estimated from the past experiencesand assumed constant. The length of stay in hospitalsis assumed to increase from 2.9 days per case in2001 to 3.0 days per case by 2011. The unit in-patientcost is assumed to increase in line with the wageincrease.
• It has been assumed that 7.2 per cent of the surpluswill have to be paid for tax and dividends every year,and that the administrative expenses are 8% ofcontributions in 2001 but will gradually decrease to6% by 2011. In the absence of data, very crudeestimates have been made for the specialprogrammes.
Implications of the status quo projectionThe Table in Figure 2 (in Annex 3) summarises theprojected financial operations of the Jamsostek basedon the current legal provision (status quo condition)for the period from 2001 to 2030. Throughout theprojection period the revenue to the Jamsostek fund isexpected to exceed the expenditure. Thus Jamsostekcontinues to be able to pay substantial tax and dividendsto the Ministry of Finance in addition to the benefitsdue. The fund is expected to retain substantial reserves.
Concerning the situation of each programme, thefollowing observations have been made.
Firstly, as shown in the table in Figure 3 (in Annex 3),the total cost of old-age benefit is expected to decreaseinitially due to the assumed decrease of claims on 5-years/6-months rule. Instead, the number of claims ongrounds of attaining retirement age (55 years) isexpected to increase as a result of ageing population.In the long-term, withdrawal due to retirement isexpected to be the largest both in number and amount.
Second, the average amount of old-age lump-sum(attaining age 55) in 2030 is expected to be equivalentto 2.5 years’ average contributory wage (as comparedto only 5 months in 2000). This increase in the benefitlevel is due to improved rates of return on investment,fair attribution of investment income to members’balance and the payment of contributions withoutinterruption. Although the benefit is estimated tobecome more than five times the current level, theresulting level is still insufficient to provide adequateold-age economic protection. Under the defined-contribution scheme, this suggests a systemicinsufficiency of the current contribution rate (5.7%).Countries in the Asia and Pacific region that adoptprovident fund schemes collect contributions based onmuch higher contribution rates.
Third, the short-term benefits show a steadydevelopment except for marginal increase in the costof health care programme. The total contributions areexpected to exceed the total benefits by 40% per cent.As noted earlier, in order to have a more equitableallocation of contributions to benefits, adequatemeasures should be taken, such as (i) increasing benefitlevels, (ii) relaxing the qualifying conditions, or (iii)decreasing the contribution rates of the short-termbenefits. For the short-term benefits, unlike old-agebenefits, these reform measures can be implementedwithout a need of long transition period and thus theirfinancial effects appear immediately.
Sensitivity analysisThe projection results depend on a number ofassumptions. Although the base line assumptions areconsidered to be our best estimates, uncertaintiesassociated with insufficient and inconsistent data,assumptions on future development, and margins oferror in the estimation, may give rise to deviations fromactually realized figures. In order to indicate probablechanges with respect to different macroeconomicvariables, another projection has been made using the

9 3
Part II Chapter 10
low growth economic scenario. The projection resultsunder the low growth economic scenario give loweramounts in nominal terms. However, as most unit costsof short-term benefits are linked with the increase inthe average wage, the relative costs remain unchanged.For the old-age programme, a lower interest rate yieldsless accrued liability but a lower benefit accordingly.The estimation method, which links the developmentof key scheme parameters with macroeconomicvariables, implies that the projection results in therelative terms are robust with respect to changes ineconomic factors.
In the technical consultation, a question was raisedconcerning the effects of an increase in compliancerate and an increase in investment return. Generally, ifrates of compliance or collection are improved, thereis an immediate increase in the contribution incomedue to the extended contributory base. In the long-term, this will result in an increase in the benefitsaccordingly. An improvement in the investment returnwill result in higher old-age benefits if the interest isproperly attributed to members’ individual accounts.
To summarize this section — from the analysis in thissection, the following issues have been identifiedregarding the financial aspects of Jamsostek.• Despite its original intension, the scheme does not
cover all private sector workers. The scope is limitedto establishments with more than 10 workers.Workers in small workplaces and in the informalsector are still outside the scope of the scheme.
• The “contract out” clause makes a loophole of thecoverage, giving an incentive for relatively largecompanies to stay out of the scheme. This will alsoresults in limited horizontal income redistribution.
• The compliance of contribution payment stood atsignificantly low level (less than 50%). This willfurther reduce the effective number of contributors.
• There is a problem of contribution evasion by under-declaring contributory wages. A common practiceis to pay contributions on the basis of basic wageexcluding various allowances and bonuses.
• The problems of coverage and evasion appear mostevidently in the health care programme. The coverageof health care is less than 10% of other programmes,and the health care contributions are paid on the basisof the minimum wages.
• The current legal status of Jamsostek as a publiclimited liability enterprise (Persero) entails a legalobstacle against the enforcement of the scheme.Currently Jamsostek has to rely entirely on labourinspectors of the Department of Manpower to
conduct inspections and contribution collections. Inaddition, the administrative capacity and efficiencyof Jamsostek need further improvement — theseissues are discussed in Part II of this Publication.
• As a state-owned enterprise, Jamsostek is run on aprofit-oriented basis. Part of its surplus (i.e.contributions in excess of benefit and administrativeexpenditure) is paid to the Ministry of Finance asdividends and corporate tax. In this relation, it shouldbe noted that Jamsostek adopts accounting practicesapplicable to private insurance companies, whichrequire that substantial technical reserves be keptby Jamsostek. The financial projections suggest thatthe scheme may not face major financial difficultiesbut it could provide insufficient protection for a limitednumber of workers.
• One reason for the continuous surplus is the lowexpenditure on short-term benefits in relation to theircontributions. Our statistical analysis reveals thatrates of incidence of employment accident and ratesof utilisation of in-hospital care are significantly lowerthan the experiences of neighbouring countries. Inorder to make the balance of contribution and benefitmore equitable, suitable measures should be takensuch as (i) increasing benefit levels, (ii) relaxing thequalifying conditions or (iii) decreasing thecontribution rates. It should be noted that given thealready high benefits/contributions ratio for healthcare programme, excessive benefit increases mightcause a risk of financial shortage.
• The level of the old-age benefit is not sufficient foradequate economic protection for life afterretirement. The average amount of the old-age lump-sum for the retirees at age 55 is currently only 5months’ contributory salary (note that due to under-declaration the contributory salary represents only apart of actual salary). One reason for the currentlow benefit level is the past unfavourable interestrates (negative real interest rates) attributed tomembers’ balances. However, even though themembers’ individual accounts earn a fair interest forthe future, the estimated benefit level is still 2.5 years’contributory salary. This leads to the conclusion thatthe current contribution rate (5.7%) is set at too lowa level to produce sufficient savings. Further,considerations need to be made on the introductionof periodical payments.
• Since the financial crisis there has been a sharpincrease in the number of withdrawals of the old-age benefit on grounds of unemployment. In theabsence of unemployment insurance in Indonesia,this payment works as its substitute to meetimmediate need of cash for unemployed workers.

9 4
Part II Chapter 10
However, such a premature withdrawal is not anadvantage for the beneficiaries but also it weakensthe old-age protection.
In view of the above problems in the current system,comprehensive reform packages need to be formulatedand presented together with their financial assessment.Special attention should be paid to the considerablepopulation size and regional diversity in Indonesia inplanning the reform process (policy-planning anddecision-making) and the implementation process.
Issues in the Investment of theJamsostek Fund
This section focuses on the issues related to theinvestment of the Jamsostek fund, as the project isrequired to review the investment policy andmanagement and to formulate a code of practice oninvestment and financial management. In fact,however, the “Regulation on management and fundinvestment of Jamsostek (No. 28 of 1996)” – hereaftercalled the “investment regulations” – has already beenbrought into effect for several years. These regulations,together with its Clarification promulgated in 1996,provide the legal basis for the management andsupervision of the Jamsostek fund investment. Withthese in view, in this chapter we approach to this issueby reviewing the investment performance in past yearsand identifying possible improvements to the currentinvestment regulations.
Investment performanceIn general, contributions and investment incomeconstitute two major sources of income to a socialsecurity scheme. In particular, for a provident fundscheme such as Jamsostek, the performance of theinvestment is directly related to the benefit level andthus the investment risk is borne entirely by theindividual members. Therefore, the Board is requiredto meet conflicting objectives of securing the safety ofthe funds and achieving an adequate positive real rateof return on investment.
The table in Figure 4 (in Annex 3) compares the ratesof interest credited to the balance of the Jamsostekprovident fund with inflation and the average marketinterest rates. The cumulative index from 1978 to 2000shows that the interest credited was 38% less thaninflation, indicating a negative real rate of return. Theindex was 63% less than that of the average marketinterest rate. These low interest rates directly affectedthe old-age benefit. As noted in the previous chapter,the average old-age lump-sum is currently equivalent
to only 5 months contributory salary. Such a largediscrepancy between the credited interest rate and themarket interest rate was primarily due to the poorgovernance on the fund investment by the Board ofCommissioners and the Board of Directors. Interestrates prior to 1998 were set as follows; 6% per annumfor 1978-1985, 8% per annum for 1986-1990 and 10%per annum for 1991-1997. As the table in Figure 4shows these rates are substantially lower than inflationand the market interest rate.
With the implementation of the investment regulations,the actual invest performance has been taken intoaccount in the determination of the interest rates. Theinterest rates credited on individual balances are 17%in 1998, 16% in 1999 and 12% in 2000. Except for thecrisis year of 1998, these rates not only exceededinflation but also became close to the market rates(the rates are equivalent to the market rate if we takeinto account the fact that investment income for theprovident fund is tax exempt). It should be noted thateven though a fair interest rates will be attributed tomembers’ balances prospectively the effect of pastlow interest rates will persist in the long-term.
Review of the investment regulations
Current investment regulations: portfolioselection and risk diversificationIn August 2001, Jamsostek’s investment amounted toRp. 14.2 trillion, or 1% of GDP of the same year. Weshall review the core requirements of the currentinvestment regulations.
First, the regulations specify the allowed types ofinvestment. Jamsostek can invest its assets in thefollowing types of instruments:(a) time deposit;(b) certificate of Bank Indonesia (SBI);(c-1) shares recorded at the Indonesia stock
exchange;(c-2) bonds;(d) unit trust of Reksadana;(e) direct participation; and,(f) land and building.
Second, the regulations stipulate the maximum valuesof these assets in terms of percentage of the totalinvestment value. Not more than 10% of the totalinvestment value should be kept in any single investmentmedium except for the Certificate of Bank Indonesia(SBI). The maximum limit of each investment as apercentage of the total asset is specified as follows:

9 5
Part II Chapter 10
2 6 This does not mean that Jamsostek is short of professional skill for the investment management. On the contrary, Jamsostek contractedwith investment managers in 2000 (the investment regulations permit to recruit or contract fund managers), but it turned out to be ratherunnecessary given the consultation fees.
Time deposit 70%Stocks (shares) 50%The total of bonds and the unit trust 70%Direct participation 10%Land and building 10%
Third, the investment regulations prohibit the placementof fund in the following categories of investment:(i) derivatives;(ii) trade instruments (goods or foreign currencies);(iii) overseas investment;(iv) direct participation in insurance companies;(v) companies owned by the members of the Board
of Commissioners and their family.
The table in Figure5 (in Annex 3) presents the evolutionof the reserve of Jamsostek and its composition; and,Table 3.3 shows the return for each investmentinstrument. The following observations can be made:• Historically, time deposit and deposit certificate
(including the certificate of Bank Indonesia) havedominated the share in the asset composition.Jamsostek held substantial amount of the certificateof Bank Indonesia from 1991 to 1998, but it holdsnone, as it cannot purchase new certificate due toits limited supply.
• Even after the implementation of the investmentregulations in 1996, the percentage of time depositand deposit certificate exceeded the required levelof 70% from 1998 to 2000, as a defensive measureagainst the financial crisis. During these years, theJamsostek requested the authorisations by theMinistry of Finance for the exceptional practice. In2001, as a result of a substantial shift from timedeposit to bonds, the percentage of time deposit hasreduced to less than 70%.
• The percentage of stocks was stable at 5% from1978 to 1987; however, it increased to more than20% in 1990 and 1991 then decreased to the previouslevel. In 2001, a slight increase is observed.
• Real estate has produced the lowest return oninvestment. The percentage of the real estateincreased sharply from 1.0% in 1996 to 5.9% in 1997.Currently, the real estate accounts for 3.6% of thetotal asset.
• Concerning the direct participation, detailedinformation on the projects and their managementand monitoring was not entirely clear. The return onthis investment is low but it currently represents only0.2% of the total asset.
Observations on the current investmentregulationsOne may argue that imposing quantitative restrictionson the investment opportunities may inhibit portfoliodiversification and expose the fund to a higher portfoliorisk therefore such restrictions should be replaced bya more flexible Prudent Man Rule. Yet, in the particularcase of Indonesia, regulations with quantitativerestrictions are considered to be still meaningful. Underthe current state of development of the capital market,a set of explicit rules is much easier to apply ratherthan the approach that requires extensive professionaljudgements.26 The following observations are thereforemade within the existing regulatory framework.
In view of the safety requirement, it is appropriate thattime deposits and bonds (the principal is secured andinterest is predetermined) dominate a large portion ofportfolio. However, the current maximum limit forstocks and shares (50%) appears to be too high.(Historically, however, stocks and shares neverexceeded 25%). Direct participation shows a low yieldand apparently high risk, though the details are notentirely clear. It is suggested that allocation to the directparticipation should be further restricted and abolishedultimately.Investment in risky instruments should be avoided asthe safety is the foremost important requirement forthe social security schemes. In the present situation, itseems premature for Jamsostek to purchase assetswith uncertain risks such as derivatives and trade. Inorder to keep the neutrality of financial governanceand to prevent any source of additional corruption,investment in the family business of the Board membersshould be strictly forbidden.
Further consideration, however, seems worthwhile onthe restriction of foreign investment. The Government’spolicy to restrict the fund investment in the domesticcapital market is understandable, provided that thesesavings are invested productively and contribute toeconomic growth. On the other hand, the investmentportfolio needs to be diversified to minimize the portfoliorisk. The capital market in Indonesia at the currentlevel of development can provide only limitedopportunities for diversification. Given the weaknessof Rupiah which is subject to further devaluation, thescheme is more likely to have exchange rate profitthan is exposed to exchange rate risks. In view of these

9 6
Part II Chapter 10
advantages, measures should be sought to pave theway for foreign investment. The assets should meetthe safety criteria and the amount should be initiallybounded by a relatively low maximum limit (forinstance up to 10%).
In addition to the concerns on safety and yield, theliquidity requirement has become an increasinglyimportant issue. In 1998 and 1999, due to a sharpincrease in the withdrawal of the provident fund ongrounds of unemployment, the expenditure exceededthe contribution income; therefore, part of investmentincome or asset had to be liquidated to cover the partof expenditure in excess of the contribution income.In 2000, contributions exceeded the expenditure butthe margin became narrower to 18 per cent. Thefinancial manager should take into consideration theliquidity requirement in view of the future developmentof expenditure and contribution.
Issues in institutional organization and fundsupervisionFurther to the investment regulations on portfolio,equally important questions are how to organizeefficient fund supervisions and how to design theinstitutional structure that enables effective monitoringand inspection.
Neutrality, transparency and accountability are crucialelements for achieving the sound fund governance.Only by efficient monitoring and supervision of theinvestment management, can one ensure the soundfund governance in the long run. The internal andexternal audits will serve as important tools for thispurpose. Disclosure of key information on the fundoperations is important not only because it is aprerequisite for the auditing but also because it providesan opportunity for a wider surveillance. In this regard,the disclosed information should be made fullyaccessible to all members.
One of the reasons for the investment failure in thepast is that the actual fund management did not alwayssatisfy the basic investment objectives when otherpriorities took precedence over the social securityconcerns. Although it may be impossible to completelyeliminate the political pressure on the management of
investment, a well-designed legal and governancestructure which leads the Board members to adhereto the interest of the members (shareholders) couldpreclude, to a certain extent, potential risks of politicalinfluence. Hence, examination should also be madeon the institutional aspects such as the compositionand selection of members, the length of duty period,obligations during the duty period and possible sanctionsand penalties in case of non-fulfilment of duty.
An additional dimension generally found in theinvestment policy is economic and social utility. It isreported that in 2001 the Ministry of Finance reallocatedpart of dividend and tax payments from Jamsostek forthe investment in social projects (such as building lowrent houses and hospitals). It should be noted that theuse of social security funds for activities other thanproviding benefits to the insured workers would beacceptable only if they contribute to the growth of theeconomy (through improved productivity and creationof employment) and, as a result, increase the futuretax base and further to improve the standard of livingof all nationals as these improvements can be regardedas social welfare in broad terms. As a prerequisitecondition for considering the investment of this nature,it is crucial that the investment management shouldmeet the more fundamental criteria of safety, yield andliquidity.
To summarize this section — As a result of poorinvestment performance in the past, the Jamsostek’sprovident fund accounts have lost their real valuesubstantially. However, under the current investmentregulation and improved investment management, afair interest is expected for the future.
A possible scope of improvement of the currentinvestment regulations includes a further restriction ofequities and direct participation. To diversify the riskin the domestic market, possibility of foreign investmentinitially with a limited scope should be considered.
Further to the investment regulations, organisation ofregular and efficient fund supervisions and the designof the institutional structure that enables effectivemonitoring and inspection are also crucial for ensuringsound fund governance in the long-term.

Part III Chapter 11
9 7
Executive Summary
The ILO Report “Pensions Reform in Indonesia”examines the strengths and weaknesses of the JHTprovident fund operated by PT Jaminan SosialTenaga Kerja (Jamsostek), a public limited liabilitycompany with the Indonesian Finance Ministry as thesole shareholder. The provident fund is a compulsorysavings scheme financed, in accordance with definedcontribution principles, by earnings-relatedcontributions from insured persons and their employerstogether with an income from investments. Details ofthe scheme, that aims to provide a lump sum onretirement and other benefits for workers in Indonesianenterprises with 10 or more employees or a monthlywage bill of more than Rp.1 million, are given in Annex 4.
The scheme falls outside the provisions of the ILOSocial Security (Minimum Standards) ConventionNo.102 of 1952, in particular because it does notprovide benefit in the form of a periodic and predictablepayment throughout the period of the contingency anddoes not replace, to the prescribed extent, the loss ofincome on retirement. Within the framework of theILO Project: “Restructuring of the Indonesian SocialSecurity System” INS/00/M04/NET, the Reportexamines the feasibility of converting (partially orwholly) the provident fund into a pension scheme thatwould provide an adequate income on retirement. ThisChapter is based on that Report.
Jamsostek has a network of well appointed local branchoffices and staff who do their best to give theircustomers a good service. But it lacks the necessaryinformation technology to operate a truly national, socialinsurance scheme and its branch organization andfunctions will require reform if it is to increase thelevel of contribution compliance above the current verylow level of around 40%. Given the proposal to changethe status of Jamsostek to that of a trust fund with a
PART IIIBENEFIT PROGRAMME STUDIES
CHAPTER 11. PENSION REFORM IN INDONESIA.
tripartite board acting as trustees for the funds ofcontributors, and with responsibility for operating areformed social insurance scheme, there are goodprospects that the organization will be able to gain thefull confidence of its customers and meet the challengeof introducing and implementing the scheme.
A number of options for replacing or partially replacingthe lump sum provisions of the JHT scheme areexamined, ranging from the most simple — activatingthe provisions already existing for payment ofaccumulated individual balances as periodic pensions.Alternatives of introducing a notional definedcontribution scheme or a mandatory definedcontribution scheme are examined.
Parallel pension systems — with lower paid workerscontributing to a separate scheme or with a minimaland mandatory defined benefit scheme being introducedfor all Indonesian workers with a mandatory defined-contribution scheme for those earning well above thenational average minimum wage — are explored.The option recommended for Indonesia is to convertthe present Jamsostek scheme into a contributory publicdefined-benefit scheme. Such a scheme has manyadvantages provided it is sustainable in the longer term.The Report illustrates the main elements of such ascheme and a possible pension formula for Indonesia.
Longer term strategies for separate pension provisionsfor the informal sector and the self-employed areexamined and consideration given to the scope of otherpension schemes and their relationship with existingschemes including those for public servants and theprivate and employer based schemes.
The report recognizes that any proposal for change inthe present systems may call for administrative changessome of which are examined together with theimplications for the existing institutions.

9 8
Part II Chapter 10
BAGIAN III STUDI PROGRAMMANFAAT
Bab 11 Reformasi Pensiun di Indonesia
Rangkuman Eksekutif
Laporan ILO berjudul “Reformasi Pensiun diIndonesia” menganalisa kekuatan dan kelemahan danaprovident jaminan hari tua yang dioperasikan oleh PTJaminan Sosial Tenaga Kerja (Jamsostek), suatuperusahaan perseroan terbatas dengan DepartemenKeuangan Republik Indonesia sebagai pemegangsaham tunggalnya. Dana provident merupakan skematabungan wajib yang dibiayai, oleh iuran-iuran yangberkaitan dengan pendapatan dari orang-orang yangdiasuransikan dan pengusaha mereka bersama denganpendapatan dari hasil investasi sesuai dengan prinsipiuran pasti. Rincian skema ini, yang bertujuanmemberikan pembayaran sekaligus saat pensiun danmanfaat lainnya kepada pekerja di perusahaan-perusahaan Indonesia yang mempekerjakan sedikit-dikitnya 10 orang pekerja atau membayar upahsekurang-kurangnya Rp1 juta per bulan, diberikandalam Lampiran 4.
Skema ini berada di luar ketentuan Konvensi JaminanSosial ILO (Standar Minimum) No. 102/ 1952,terutama karena skema ini tidak memberikan manfaatdalam bentuk pembayaran secara berkala dalam jumlahyang dapat diperkirakan selama masa yang tidak pastidan tidak menggantikan, hingga tingkat yang telahditetapkan sebelumnya, hilangnya pendapatan saatpensiun. Dalam kerangka proyek ILO: “RestrukturisasiSistem Jaminan Sosial Indonesia” INS/00/M04/NET,Laporan ini menelaah kelayakan mengubah (baiksebagian maupun secara keseluruhan) dana providentmenjadi suatu skema pensiun yang nantinya akanmampu memberikan pendapatan yang mencukupi saatpensiun. Bab ini disusun berdasarkan Laporan tersebut.
Jamsostek memiliki jaringan yang terdiri dari kantor-kantor cabang di tingkat lokal dan staf yangmemberikan pelayanan yang terbaik kepada nasabahmereka, tetapi tidak memiliki teknologi informasi yangdiperlukan untuk mengoperasikan skema asuransisosial yang benar-benar dapat diterapkan secaranasional. Di samping itu, organisasi dan fungsi daricabang-cabang yang dimilikinya perlu direformasi untukmeningkatkan tingkat kepatuhan pembayaran iuran diatas tingkat saat ini yang amat rendah, yang berkisarsekitar 40%. Dengan adanya usulan untuk mengubahstatus Jamsostek menjadi suatu dana wali amanatdengan dewan tripartit yang bertindak sebagai wali
amanat untuk dana-dana yang terkumpul dari iuran-iuran yang dibayarkan dan dengan tanggung jawabuntuk mengoperasikan skema asuransi sosial yangtelah direformasi, Jamsostek mempunyai harapan yangbaik untuk memperoleh kepercayaan penuh dari paranasabahnya dan untuk memenuhi tantanganmemperkenalkan dan mengimplementasikan skematersebut.
Pengkajian terhadap sejumlah pilihan untukmenggantikan atau menggantikan sebagian ketentuanpembayaran sekaligus skema jaminan hari tua telahdilakukan, mulai dari yang paling sederhana –mengaktifkan ketentuan-ketentuan yang sudah adauntuk pembayaran akumulasi saldo-saldo individualsebagai pensiun secara periodik. Alternatif-alternatifuntuk memperkenalkan suatu skema iuran pasti yangbersifat nosional (imajiner) atau skema iuran pasti wajibjuga telah dikaji.
Kemungkinan diterapkannya sistem-sistem pensiunyang bersifat paralel – dimana para pekerja yangmenerima upah rendah mengiur ke suatu skematerpisah atau dengan memperkenalkan suatu skemamanfaat pasti minimal dan wajib kepada seluruh pekerjaIndonesia dengan suatu skema iuran pasti wajib untukmereka yang berpenghasilan di atas upah minimumrata-rata nasional juga dijajaki. Pilihan yangdirekomendasikan/ disarankan untuk Indonesia adalah,mengubah skema Jamsostek yang ada saat ini menjadisuatu skema manfaat pasti publik dengan iuran daripekerja dan pengusaha. Skema seperti itu mempunyaibanyak keunggulan asalkan berkesinambungan untukjangka yang lebih panjang. Laporan ini mengilustrasikanelemen-elemen utama dari skema ini serta memberikanrumusan pensiun yang mungkin cocok untuk Indonesia.
Selain itu telah dipertimbangkan pula strategi-strategijangka lebih panjang untuk ketentuan-ketentuanpensiun terpisah bagi sektor informal dan pekerjamandiri. Kajian juga dilakukan terhadap ruang lingkupyang dimiliki skema-skema pensiun lain sertahubungannya dengan skema-skema jaminan sosial yangada sekarang, termasuk skema-skema jaminan sosialuntuk pegawai negeri dan skema-skema jaminan sosialyang berdasarkan skema untuk pihak swasta danpengusaha.
Laporan ini mengakui bahwa setiap usulan untukmelakukan perubahan terhadap sistem-sistem yang adasekarang akan berdampak pada perubahan-perubahanadministratif, beberapa di antaranya akan dikajibersama dengan implikasi-implikasinya terhadaplembaga-lembaga yang ada sekarang ini.

Part III Chapter 11
9 9
Jamsostek JHT Scheme and the Needfor ChangePT Jamsostek has the legal status of a State-ownedlimited liability company, Persero, which is examinedin Part I of this Publication. The income from theinvestment of contributions has been low for someyears but more recently has improved due to improvedfund management within Jamsostek.
When contributors retire at age 55 they receive a lumpsum representing their total contributions plusinvestment income. Jamsostek has no contact withpensioners after age 55 and has no reliable informationon how they manage after receiving their lump sum.Some are thought to invest the whole sum in a smallbusiness within the informal sector but as the averagepay-out is Rp.2.1 m (around $200), or 8.5 times theaverage monthly minimum wage, any person using thesum as a cash pension would extinguish it within ayear. Such sums do not represent adequate provisionfor old age. However, it is reported by employers thatmany workers continue to work after age 55 in theinformal sector.
A contributor who suffers a work injury can receive areducing percentage of former earnings under the JKKscheme while there are prospects of a return to theemployment field but after about one year will receivea final lump sum payment. Someone who ispermanently disabled following a work accident willreceive an immediate lump sum. Disability pensionsas such are not paid but a recent Presidential decreeprovided for additional monthly payments of Rp.50,000for a period of two years to those who are permanentlydisabled following a work accident and unable to returnto work. For administrative convenience theseadditional monthly payments have now been convertedinto a single lump sum. The methods used to assessthe various degrees of disability arising from workaccident appear to work satisfactorily with a localmedical specialist attached to each Jamsostek branchthat is paid a fee of about Rp.25,000 for eachexamination.
There is little doubt that Jamsostek members are notproperly protected against the contingencies ofpermanent invalidity and death or throughout old age;or that they have similar needs for an adequate systemof long-term income maintenance as public servantsand other groups in the working population who arealready entitled to periodic pensions followingretirement. The Jamsostek JHT scheme of single, lumpsum payments suffers from fundamental defects as amethod of replacing earnings from employment. Its
effectiveness as a scheme of social protection followingretirement has been further eroded by the provisionfor early withdrawal of lump sums because ofunemployment (in the absence of any unemploymentinsurance).
From the views expressed by trade unionrepresentatives and workers in the formal labourmarket that Indonesian workers would welcome theintroduction of an improved social insurance schemethat covered them for the normal risks and offeredthem a monthly pension after retirement. When theappropriate level of contributions was discussed theviews were mixed with some trade unionrepresentatives of the opinion that, if wages wereraised, the workers would be prepared to match thecontributions paid by the employer. Others felt thatuntil the general level of wages was higher, workerswould not be prepared to contribute more than thecurrent 2% of gross wages. Some employerrepresentatives said that while the basic wage in theformal sector was based on the provincial minimumwage, this represented only about 35% of the grosstake home pay as most employers operated significantincentive payment schemes.
Workers in the informal sector felt that contributionsshould be kept to the absolute minimum while theirwages were so near the minimum wage set by eachprovince. (See Annex 5) It was clear that a schemethat would be found acceptable by the formal sectormight well not find favour amongst workers in theinformal sector. Thus it may be necessary, when itbecomes possible to extend social security coverageto the informal sector, to design separate (ifcomplementary) schemes for the formal and informalsectors of the workforce.
There are a number of options for changing the presentsystem of lump sum benefits to provide periodicpensions following the attainment of retirement age.These are discussed in the following sections.
Option of Purchasing AnnuitiesArticle 24 of Government Regulation No.14 of 1993provides for the payment of periodic pensions, albeitfor a maximum period of five years. Jamsostek doesnot, however, presently have the capacity to payperiodic benefits. Also, although there is a system tocredit individual member accounts with an annual rateof interest, this is on an increasing balance. Thereappears to be no provision for crediting interest on areducing balance, although this should not be difficultto design.
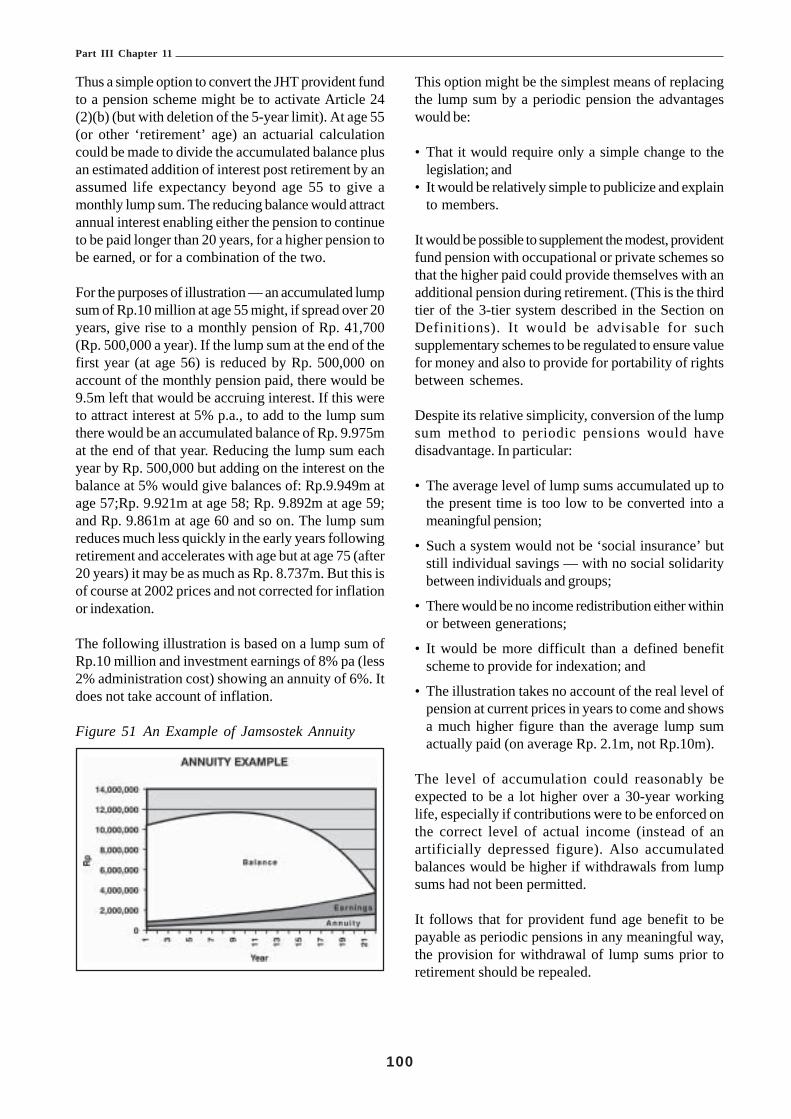
Part III Chapter 11
100
Thus a simple option to convert the JHT provident fundto a pension scheme might be to activate Article 24(2)(b) (but with deletion of the 5-year limit). At age 55(or other ‘retirement’ age) an actuarial calculationcould be made to divide the accumulated balance plusan estimated addition of interest post retirement by anassumed life expectancy beyond age 55 to give amonthly lump sum. The reducing balance would attractannual interest enabling either the pension to continueto be paid longer than 20 years, for a higher pension tobe earned, or for a combination of the two.
For the purposes of illustration — an accumulated lumpsum of Rp.10 million at age 55 might, if spread over 20years, give rise to a monthly pension of Rp. 41,700(Rp. 500,000 a year). If the lump sum at the end of thefirst year (at age 56) is reduced by Rp. 500,000 onaccount of the monthly pension paid, there would be9.5m left that would be accruing interest. If this wereto attract interest at 5% p.a., to add to the lump sumthere would be an accumulated balance of Rp. 9.975mat the end of that year. Reducing the lump sum eachyear by Rp. 500,000 but adding on the interest on thebalance at 5% would give balances of: Rp.9.949m atage 57;Rp. 9.921m at age 58; Rp. 9.892m at age 59;and Rp. 9.861m at age 60 and so on. The lump sumreduces much less quickly in the early years followingretirement and accelerates with age but at age 75 (after20 years) it may be as much as Rp. 8.737m. But this isof course at 2002 prices and not corrected for inflationor indexation.
The following illustration is based on a lump sum ofRp.10 million and investment earnings of 8% pa (less2% administration cost) showing an annuity of 6%. Itdoes not take account of inflation.
Figure 51 An Example of Jamsostek Annuity
This option might be the simplest means of replacingthe lump sum by a periodic pension the advantageswould be:
• That it would require only a simple change to thelegislation; and
• It would be relatively simple to publicize and explainto members.
It would be possible to supplement the modest, providentfund pension with occupational or private schemes sothat the higher paid could provide themselves with anadditional pension during retirement. (This is the thirdtier of the 3-tier system described in the Section onDefinitions). It would be advisable for suchsupplementary schemes to be regulated to ensure valuefor money and also to provide for portability of rightsbetween schemes.
Despite its relative simplicity, conversion of the lumpsum method to periodic pensions would havedisadvantage. In particular:
• The average level of lump sums accumulated up tothe present time is too low to be converted into ameaningful pension;
• Such a system would not be ‘social insurance’ butstill individual savings — with no social solidaritybetween individuals and groups;
• There would be no income redistribution either withinor between generations;
• It would be more difficult than a defined benefitscheme to provide for indexation; and
• The illustration takes no account of the real level ofpension at current prices in years to come and showsa much higher figure than the average lump sumactually paid (on average Rp. 2.1m, not Rp.10m).
The level of accumulation could reasonably beexpected to be a lot higher over a 30-year workinglife, especially if contributions were to be enforced onthe correct level of actual income (instead of anartificially depressed figure). Also accumulatedbalances would be higher if withdrawals from lumpsums had not been permitted.
It follows that for provident fund age benefit to bepayable as periodic pensions in any meaningful way,the provision for withdrawal of lump sums prior toretirement should be repealed.

Part III Chapter 11
101
However, the Actuarial Report27 projects that, giventhe current contribution rate of 5.7%, the averagepayout at age 55 is expected to be equivalent to only2.5 years’ average contributory wage (compared with5 months in year 2000) by the year 2030. This is stilltoo low for a meaningful periodic payment to theaverage contributor.
A simple method for the conversion of the balance inthe individual account is the single-life annuity, whichis paid so long as the retired worker is alive (i.e.payment stops when the retired worker dies). Theamount of monthly pension is determined according tothe principle of equivalence of contributions andpayments in terms of present discounted value. Themonthly pension is calculated by dividing the finalbalance by the annuity factor, i.e. the present value ofone currency unit of annuity.
As an option, one may add a guarantee period duringwhich the payment is secured irrespective of whetherthe retired person is alive or not. For instance, if aretired person who chooses an annuity with a 10-yearguarantee period dies 6 years after retirement,payments equivalent to 4 years annuity (i.e. theremaining guarantee years) will be paid to his/hersurvivors either as a lump-sum or in the form ofpensions.
The annuity factor depends on the assumed mortalityrates, the assumed earnings rate and the length of theguarantee period. The following table indicates theestimated life annuity factors at age 55 by differentearning rates and the guarantee periods.
• Under the standard assumption of 5 % per annumand with no guarantee period, the estimated singlelife annuity factor is 12.6;
• The annuity factor is sensitive to the assumed earningsrate. Roughly, if the earnings rate increases by 2 %-points from the standard assumption, then the annuityfactor decreases by around 10% (i.e. the amount ofpension becomes less); and
• If the guarantee period is longer, then the resultingannuity factor becomes more. Under a 5% earningsrate and a 5 years’ guarantee period, the annuityfactor will increase from 12.6 to 13.3. A 10 years’guarantee period will further increase the annuityfactor to 14.0.
Figure 52 Estimated Actuarial Annuity Factors atAge 55 for Selected Interest Rates &Guarantee Periods
Interest rate \guarantee 0 year 5 years 10 years 15 yearsperiod0% 21.0 22.3 23.9 26.02% 16.7 17.7 18.9 20.34% 13.7 14.5 15.4 16.35% 12.6 13.3 14.0 14.86% 11.6 12.2 12.9 13.58% 10.0 10.5 11.0 11.510% 8.8 9.2 9.6 9.9
Note: ILO calculation.Data source: Mortality rates have been drawn from United Nationsmodel life table (South Asian pattern with life expectancy at birth64.3 years).
With respect to the old-age risk, life pension which isbased on collective financial equivalence generallyadmits the redistribution from those beneficiaries whodie earlier than average to those who live longer thanaverage. Payments stop upon the death of a pensioner,and any unused resources are retained by the schemeand used to cover the costs of other pensioners whosurvive longer. This is how life annuity provides incomesecurity after retirement. In the case of a single-lifepension, the retired worker is the sole beneficiary.However, it appears that the individualistic approachwould not be suitable in Indonesia where a worker’sfamily responsibility extends to a broad range ofrelatives. Imposing certain guarantee period may bean option to allow for extending the categories ofbeneficiaries. It should be noted that the amount ofpension in this case is less than that of a single-lifepension. This is because of the fact that if the degreeof protection is higher the expected cost will be moreaccordingly.
Annuitisation involves another risk of longevityassociated with the decrease in mortality rates overtime. If the life expectancy becomes longer, an annuitycalculated on the basis of short life expectancy nolonger matches the accumulated balance and thusproduces unfunded liability. The liability is to be coveredby the Fund. To avoid such a problem, the annuityfactor should be reviewed on a regular basis to reflectthe current mortality level.
The ILO Report recommended on balance that thisshould not be the favoured option.
27 See Chapters 10 and 18 of this publication
Part III Chapter 11
102
A Notional Defined ContributionScheme
Another type of pension scheme that could replacethe present Jamsostek scheme or be run in conjunctionwith it is generally known as a notional definedcontribution (NDC) scheme. Various forms of thissystem have been introduced in Europe during the lastdecade to replace PAYG defined benefit pensionschemes. NDC schemes have the advantage thatfuture pension liabilities can de determined by actuarialcalculation each year and that contributors can beadvised annually of the points they have earnedtowards a pension at retirement age. In the absenceof the requirement to have paid a minimum number ofcontributions before a partial pension is payablecontributions cannot be lost. Such a scheme isparticularly suited to any later extension of coverageto workers in the informal economy where insuredperiods can be very fragmented. It can be redistributiveby restricting the maximum number of pension pointsthat can be earned in any one year by higher paidworkers. A version of the scheme could provide thata worker who earns the equivalent of the nationalaverage wage would receive one pension point perannum. A worker with earnings at or above the upperearnings level for contributions liability, for example,three times the national average wage, would receivethe maximum-permitted three pension points perannum. Fractions of points would be calculated byreference to total annual earnings and the nationalaverage wage. Pension points can be revalued eachyear in line with any change in average earnings, prices,or a combination of the two, and contributors notifiedin writing of current values. The personal records tobe kept on a central database can be limited to pensionpoints rather than earnings details with contributorsgiven a limited time in which to challenge their pointstotal after the annual letter of notification.
A notional defined contribution scheme could beintroduced for younger workers and a partial reservefund established as a buffer against any significantchange in the system dependency ratio, that is thenumber of workers required to support the pension ofa single pensioner through their contributions.
Like many other countries in Asia and other parts ofthe world Indonesia has a population that is slowly aging(see Annexes 10, 11 and 15 for demographicprojections). However, the projected support ratio maychange significantly in the future for reasons quite
unconnected with the average age of the populationand it would be necessary to make a range of difficultassumptions before any worthwhile projection couldbe made. For example, the August 2000 labour forcesurvey shows that about 33% of Indonesian womenof working age are housewives and outside the activelabour force. Whether this participation rate will changeor how it will change in future years will depend uponseveral factors including the national unemploymentrate, the demand for female labour, the availability ofchild care facilities and changes in social attitudes tofemale employment in the different provinces. Thenumbers of young people taking advantage of furthereducation will almost certainly grow. The productivityof the workforce can also be expected to grow withincreased investment in industry. The lesson for thosedesigning any contributory public scheme is that whileprojections of the system dependency ratio must betaken into account in setting contribution and benefitlevels the whole future can never be seen. Inevitablythe provisions of any scheme will need to be kept underreview and changes made to cater for variations inthe dependency ratio. Furthermore although the NDCsystem provides a mechanism for linking pensionentitlement to average earnings, it does not necessarilyensure that the resources are available to meet thisobligation in full. In fact, the system is open to politicalrisks similar to those which other pension systems havefaced.
These technical considerations represent an obstacleto the introduction of this system at present inIndonesia. In addition, the absence of any redistributiveelement would exclude or severely restrict pensionprotection in respect of surviving dependants andinvalids and would result in new pension awards beingat a low level low pensions being paid for many yearsuntil pension rights had developed.
The administrative requirements associated with sucha scheme would be difficult to meet. In particular, thereis a lack of a reliable national identity number and theuse of common single names in some provinces.Without a national database that could ensure that therecord of contributions paid or points earned would beaccurately maintained throughout each contributor’sworking life the scheme would not be feasible. Underthe present provident fund it is obviously to themember’s advantage to ensure that periods ofmembership are linked and that contributions are paidby employers but linking records and ensuringcompliance are major problems.

Part III Chapter 11
103
28 See Chapter 8
A Mandatory Defined ContributionScheme
Another option might be to modify the old-age benefitpart of the Jamsostek provident fund scheme into amandatory defined contribution scheme in whichcontributions are collected and invested by Jamsostekor transferred for investment by an approved andregulated private pension company of the contributor’schoice.
Contributions to the defined contribution scheme couldbe split equally between employers and employees andcollected as now from employers after legislation hadbeen introduced to change the status of Jamsostek tothat of a trust fund. It would greatly improve theefficiency of contribution collection and compliance ifJamsostek could be given the legal right to appointinspectors with powers of entry and the right toexamine payroll records at employers’ premises. Thepresent arrangements — whereby labour inspectorsemployed by local government act as agents forJamsostek — are patently inappropriate andineffective. The current collection rate of around 40%must be improved dramatically before any reforms arelikely to be productive28.
All the contributions from scheme members could beinvested in a single fund managed by Jamsostek or ina fund of the contributor’s choice chosen from anapproved list of pension companies. Contributions wouldbe collected by Jamsostek and forwarded to the chosencompany within a fixed number of working days asprovided for in pension legislation. Jamsostek wouldbe one of the approved pension companies and allowedto compete on equal terms with others on the approvedlist. Effective supervision and an insistence on goodgovernance would be essential if the confidence ofcontributors is to be retained. But choice forcontributors and competition between pensioncompanies for the custom of contributors should go along way to ensuring good governance. The followingbriefly summarised provisions are examples of the keyelements that might appear in legislation aimed atensuring that contributors receive good service andsatisfactory returns over the longer term oninvestments from their chosen pensions company andfund managers:• Contributors to be able to transfer their savings from
one to another approved pension company after givingJamsostek notice in writing. The transfer to be
carried out within the number of days stipulated inpensions law, for example, one month;
• A Pensions Supervisory Board to be established tooversee the scheme and approve pension companiesand annuity providers before they can acceptcontributions. The Board to publish an annual reportthat discloses the true investment performance ofeach approved Pension Company;
• The maximum charges that approved pensioncompanies can charge contributors to be establishedin the pension law;
• Special benefits are not to be offered by pensioncompanies to persuade contributors to invest withthe company;
• The methods used to value investments to be detailedin law and the valuations carried out monthly;
• At retirement age each scheme member to receivepart of the amount invested as a lump sum while theremainder is to be used to purchase an annuity. Thepurchase of an annuity may be delayed for up tofive years;
• The beneficiary of a deceased contributor to havethe same rights of annuity purchase;
• A contributor to have the right to purchase an annuityfrom an approved list of providers. The providers tooffer a wide choice of annuity types without specialterms related to health, gender, race or similar criteria;
• All annuities sold must increase in value when priceinflation exceeds a percentage specified in the law;
• Each contributor to be issued with a six monthlystatement showing the amount standing to his or herinvestment account;
• The Pensions Supervisory Board to specify theproportion of a pension company’s investments thatmay be invested in a particular category of investment,for example, bonds, bills or other securities issuedby the National Bank; and
• The Pensions Supervisory Board to require eachapproved Pensions Company to contribute to anational pensions guarantee fund to be used to payan annuity where a provider has failed to do so.
The above brief list of outline provisions gives someindication of the complex legislation that is required toensure that the funds of contributors are safeguardedto the best possible extent when invested in anapproved private pensions company. Any legislationwould also need to include the penalties to be imposedon any company failing to comply with therequirements of pension legislation. Investment withany pension company will carry some risk but if ascheme could give contributors a choice of company

Part III Chapter 11
104
and details of investment performance are publishedregularly this should ensure a competitive environmentand satisfactory investment returns and annuity rates.Indonesia is in the process of establishing a nationalfinancial services supervisory body and it would appearthat machinery will soon be in place to allow for theeffective supervision of privately managed funds.
The advantages of such a defined contribution schemewith individual accounts in a private fund of thecontributor’s choice can be summarized as:-
• Investments should grow at a rate above the rate ofinflation;
• With an individual stake in the capital markets aworker should be better motivated; and
• Increased investment in national industry andcommerce could improve job prospects.
Disadvantages can be that:-
• The risk of poor investment performance is carriedby the contributor;
• Inadequate supervision may lead to corrupt practices;• A recession at the time of annuity purchase can lead
to a shortfall in expected income; and• Interest rate changes will affect annuity rates.
On balance it is considered that the disadvantages,particularly the complexity and need for strictregulation, outweigh the advantages, some of whichapply also to partially funded, defined benefit schemes.
A Mixed Pension System
A simple but mandatory mixed system under which aflat rate defined benefit system is supplemented by adefined contribution system could be another optionsuited to the diverse Indonesian labour market. Thiswould recognize that a defined contribution scheme,with the possibility of investment choice, may perhapsbest be mandatory only for workers with an incomeabove a certain level while an underlying definedbenefit scheme, as described in later paragraphs, wouldbe mandatory for all workers. However, workers withearnings below the mandatory threshold could beallowed to volunteer as contributors to the definedcontribution scheme (see Annex 13 for the wage levelsof Jamsostek contributors). Whether two suchschemes could be run in parallel would depend verymuch on the contribution levels applying to theuniversal, defined benefit scheme.
Each worker could pay a contribution of between 2%and 5% of his or her gross wage with a slightly largeremployer contribution. The actual percentages can onlybe determined in the light of actuarial findings and theneed to keep the worker’s contribution as low aspossible in the early years of the scheme. From eachcombined contribution the equivalent of perhaps 5%of the provincial minimum wage would be allocated toa defined benefit scheme. Any balance over and abovethat 5% would be allocated to the worker’s personalJamsostek investment account, or another privatelymanaged fund that the worker had chosen from a listof approved pension providers.
There would need to be an upper wage limit for thismandatory contribution to allow higher paid workersthe opportunity to contribute to a voluntary, third tierpension scheme should they wish to do so.
The pension payable under the defined benefit schemeat pension age to those who had contributed for, say,30 years would be a fixed percentage of the provincialminimum wage. This percentage would probably needto be at a minimum of 60% to provide an acceptablestandard of living together with some family support,but again could only be decided following an actuarialassessment nearer the time the scheme was launched.If a contribution record showed earnings in more thanone province a pro-rata pension based on two or moreminimum wage levels would be payable. Any‘voluntary’ contributions to the defined contributionpension fund would be used to purchase an annuity atpension age or could be paid in part as a lump sum.
Entry to such a scheme would probably need to berestricted to workers below the age of, say 45, with atransitional provision allowing a full or enhanced partialpension under the defined benefit scheme to those whowill be unable to qualify for such a pension beforereaching retirement age. The cost of such a transitionalprovision would be high and possibly higher than thescheme could afford. A subsidy could be provided fromthe government central budget in the interests of socialsolidarity and to ensure the reformed scheme had agood reception from older workers. An option mightbe to use funds from the sale of State enterprises orthe proceeds from a dedicated tax on luxury goods forthe purpose.
A survivor’s pension or lump sum could be payableunder the defined benefit scheme and a survivor’s lumpsum of total contributions plus investment income fromthe defined contribution scheme. Again the decision

Part III Chapter 11
105
on whether a survivor’s pension could be offered toolder workers to supplement the lump sum payable tothose with savings in the existing Jamsostek providentfund would need to be made in the light of actuarialfindings at the time the scheme was launched.
As mentioned earlier it would be an option to allowexisting Jamsostek fund holders to purchase a partialcontribution record in a new scheme. The value ofcontributions to achieve a minimum record giving theright to a partial pension could be fixed at a true valueafter actuarial assessment, or a decision made toreduced the cost to older workers to below the actualvalue with an appropriate government subsidy to coverthe difference.
Operating two different systems in tandem may betoo difficult to ‘sell’ to the working population; it mayalso be considered too divisive and too complicated tomeet the objective of transparency and tooadministratively expensive to be viable in the shortterm.
A Defined Benefit SchemeThe option favoured by the ILO is the conversion ofthe Jamsostek Provident Fund to a partially fundedpublic defined benefit scheme. Such a scheme paysa benefit after a fixed number of years during whichcontributions have been paid. Defined benefit schemescall for a number of choices as to the best option atvarious stages in its design. The first question for policymakers is the extent to which the scheme will beredistributive. The choice is between:
a) A fully flat rate scheme — where all members paythe same contribution and eventually receive apension on a similar basis;
b) A scheme with earnings-related contributions givingrise to a flat-rate pension; or
c) A fully earnings related scheme — where bothcontributions and pensions are related to earnings
A number of factors need to be taken into account:
• Striking the right balance between securing supportfor redistribution and encouraging evasion. InIndonesia, evasion by employers is a major problemand takes the form of non-registration, under-declaration of workers and their earnings and delayin payment;
• Equity and coverage. It should be one of theobjectives of the scheme to extend coverage to asmany workers as possible;
• Encouraging coverage of those who work for smallemployers. The imposition of a heavy social securitycontribution and more effective compliance mayhave economic implications for small employerswhich cause them to go out business or to portraytheir workers as self-employed temporary or familyworkers;
• Affordability; and• Allowing scope for the development of private sector
schemes to provide supplementary pensions.
A fully flat-rate scheme, although the easiest toadminister and to understand, has the disadvantage thatit has a negative redistributive effect: with the lowerincome earner paying a higher proportion of disposableincome towards a pension than those in higher incomegroups.
The combination of earnings related contributions witha flat rate pension clearly redistributes resources fromthe better-paid worker to the less well paid. (SeeAnnexes 6, 7, 8 and 16 for current wage levels).
The fully earnings related system is more neutral in itsredistributive effect, although a measure ofredistribution can be achieved by introducingcontribution or benefit ceilings. Earnings relatedcontributions encourage the employment of low paidworkers but low paid workers may suffer hardship inretirement from low pensions which aredisproportionate to their basic needs
Thus there would be an option to retain earnings relatedcontributions with an upper earnings limit while payinga capped or limited earnings related pension.
On this basis the scheme could operate within astructure of:
Earnings related contribution ceiling - Rp.2 million(figure used as tax threshold);
• Pension ceiling - Rp.1 million (2x average earnings);and
• Minimum pension - 60% of minimum wage. (SeeAnnexes 5 and 6 for minimum wages by provinceand national wage levels.) There would probablyneed to be a rule that restricted a worker’s pensionto a percentage of his or her earnings over a periodprior to the retirement date. The limited evidencegathered on wage rates in the informal sectorsuggests that many full-time workers earn only a
Part III Chapter 11
106
little above the local minimum wage while the dailywage of part-time workers is fixed by reference tothat same minimum wage. A further option on pensionlevels would be to fix a national guaranteed minimumto ensure that those who had worked in the provinceswith the lowest wage levels received a pension atleast at a subsistence rate provided they satisfiedthe contributions qualifying condition.
Each beneficiary would need to satisfy contributionsconditions as a test of membership. The minimumnumber of paid contributions in a year and the numberof years during which contributions must have beenpaid to receive a pension will normally be related tothe pensionable age, currently age 55. The lifeexpectancy of both males and females who reach age55 or 60 is increasing (see Annex 15) and an importantdecision for those designing any reformed Indonesianpensions system is whether to retain age 55 or increasethe retirement age to 60 in stages over a number ofyears. In the absence of reliable information on theaverage length of insurable employment it will bedifficult to arrive at an informed decision on theappropriate contributory period but the chart at Annex8, showing the high preponderance of younger workerscontributing to the Jamsostek provident fund, suggeststhat the average period of insured employment is notover-long. A minimum of 10 years with a maximum of30 years could be appropriate if the retirement age isto remain at 55. With a retirement age of 60 theminimum might be 15 years and the maximum 35 years.Age 60 could be regarded as the retirement age withprovision for early retirement from age 55 with apension reduced in accordance with actuarial principlesfor each month of early retirement. It would beinequitable to pay a retirement pension to someonewho was still working but it would be difficult to policesuch a provision. The choice of age 60 as pension agewould represent a partial solution of this problem.
It would also be necessary to provide graduatedcontribution conditions under which minimum pensionentitlement was dependent on the contributor havingpaid contributions for 180 months (or been creditedwith contributions: see below) This could provideentitlement to a pension of 30 % of his or her averageinsurable earnings with this base supplemented by anadditional 1 % for every additional 12 contributions.On this basis after 35 years of membership a pensionof 50 % of average earnings would be payable. Thosewho do not satisfy the minimum qualifying conditioncould be paid a lump sum representing an approximationof their contributions plus interest.
Such a scheme might be able to afford to pay a smalllump sum on retirement. Other policy questionsassociated with defined benefit schemes are discussedin the following paragraphs.
Dependency increases are paid in some pensionschemes for dependent spouses and children. Whenthe head of the family is aged 55 it will be common inIndonesian families for the household to includedependent children and an option will be to increasepensions by a fixed amount for each dependant. Thisis, however, a major complication for any scheme andin the interests of low administration costs it may beconsidered best to leave the question of additionalfinancial assistance for larger families to better-targeted, anti-poverty programmes.
As outlined in Annex 4 the Jamsostek scheme providesfor a totally and permanently disabled person towithdraw all his or her accumulated pension fundsavings in the form of a lump sum or to receive aperiodic pension over a period of up to five years. Inpractice all claimants request and receive a lump sum.The claimant must submit a medical certificate from afamily doctor certifying the extreme degree of disability.There is no procedure requiring a Jamsostek medicalofficer to confirm the medical assessment of theclaimant’s own doctor. In a reformed scheme payingpensions for life after retirement, and a life disabilitypension to those disabled persons who are unable toreturn to the workforce, the important question of howbest to assess a claimant’s disability will arise. Pensionslaw will need to specify the criteria to be applied byexamining medical officers and could include perhapsone or more degrees of disability ranging frompermanent disability but with the ability to live withoutpermanent help from another person, to permanentdisability requiring constant attendance by anotherperson. Experience in other Asian countries shows thatwithout adequate and efficient well-trained examiningmedical staff employed by or under contract to thesocial insurance institution there is every chance thatthe disability pension scheme will not function asintended and that costs will escalate. There wouldprobably be a need for a minimum qualifying periodfor contributors to the pension scheme before a disabilitypension could be paid. This might be any periodbetween 2 and 5 years.
A survivor’s benefit in the form of a lump sumrepresenting the provident fund balance standing in thename of the deceased is paid to the spouse or anothersurviving relative under the Jamsostek scheme. It would

Part III Chapter 11
107
be normal in a social insurance scheme to find thatsurvivors were paid either a lump sum or a pension. Asurviving spouse of a contributor who had contributedfor a fixed minimum number of years would normallyreceive a lump sum if below an age at which it wouldbe possible to find work and build a contribution recordfor a pension. For an older survivor, below or abovepension age, a survivor’s pension could be based on afixed percentage of what was, or would have been,the pension entitlement of the deceased; for example,60%. If such an older survivor was not entitled to apension, the rules could provide for a lump sum to bepaid at the rate payable to a younger survivor. Anoption would be to increase the rate of survivor benefitsin respect of dependent children. A decision wouldrest on the issues of administrative complication, benefitcosts and whether other programmes catered for thecost of child support. When the survivors include twoor more wives the options will be to pay the one wifenominated earlier by the deceased or to divide thesurvivor’s benefit that would be payable to the eldestwife between all the wives.
Any conversion exercise aimed at providingJamsostek contributors with a monthly retirementpension will face the question of the options to beoffered to existing contributors. (See Annex 9 for theage breakdown of Jamsostek new entrants). Whentransitional provisions are generous they will encouragethe existing scheme members to enter the new schemeand assist in its launch. Special qualifying conditionswould need to be devised and Jamsostek membersinvited to decide within a prescribed period whetheror not to convert their provident fund account, whollyor partially, into months of pensionable employment.One mechanism would be to apply a divisor, equal tothe average monthly contribution paid by the insuredperson in the last year of provident fund membership,to the provident fund balance and thus calculate thenumber of months of pensionable employment whichcould be added. Existing Jamsostek members agedover 50 could be allowed to choose whether to continuewith the present scheme or purchase membership onthis basis. Those who are younger would be obliged tojoin the pension scheme but could opt either to leavetheir provident fund contributions in their account or toconvert these as above. Another option might be tomodify the retirement conditions for those close toretirement at the time of conversion.
In long established social insurance schemes there isusually a provision allowing certain categories of personto be credited with a monthly contribution when
they are in no position to work. Credits, which willmaintain a person’s contribution record, can beawarded for periods of sickness, maternity, andunemployment when those benefits have been claimedand paid. Credits can also be awarded to those whoare at home caring full-time for dependent children oran invalid and to those in full-time education. Many ofthese credits are of great benefit to female workerswho tend to experience more breaks in theiremployment than do their male colleagues. (See Annex7 for the sharp fall in the number of female workersafter age 44 and Annex 9 for the small intake of thisage group in the Jamsostek scheme) Of course, to theextent that crediting is permitted the beneficiaries arebeing subsidized by other contributors. It will be anoption to introduce a limited form of credit provisionthat can perhaps be extended as other benefits areintroduced.
The level of contributions to sustain a scheme on theabove lines will depend, of course, on the options onbenefit levels and particularly on a retirement age. Thusthe current level of contributions to the Jamsostekprovident fund retirement programme of 5.7%(employer 3.7%, employee 2.0 %,) plus the additionof the 0.3% contribution for death benefits could beretained to pay for the new, replacement scheme. Thefunding mechanism would, however, be different sinceinstead of the contributions going into individual(savings) accounts they would fund current pensionson a pay-as-you-go basis, supplemented by interestearned on investing the reserve fund built up by a partial,advance funding system.
A Scheme for the Informal SectorThe informal labour market or economy in Indonesiais not easily defined. Every person employed in aproperly constituted company with 10 or moreemployees is required to contribute to the Jamsosteksocial insurance scheme, as are the employees in asimilar company with a monthly payroll of more thanRp.1 million. As provincial minimum wages in the year2000 ranged from Rp173,000 to Rp350,000 (see Annex5) with most workers earning between Rp.200,000 andRp500,000 (see Annex 13) it is evident that manyemployers with fewer than 10 employees are liable tocontribute to the scheme and could be regarded aswithin the formal sector. It has been estimated thatthere are over 2 million employers in Indonesia ofwhich only 97,000 are registered with Jamsostek. Thelabour force survey of August 2000 shows the activelabour force, urban and rural, (defined as those normallyworking one hour or more in a week) as approximately

Part III Chapter 11
108
90 million as against around 9 million workers withactive Jamsostek files. Of these 90 million workers,aged between 15 and 55, only 40 million were workingmore than 35 hours per week while it has beenestimated that another 40 million have no permanentjob. The ideal for any social insurance scheme is thatit should cover all citizens and that risks should beshared. With the increasing mobility of labour theproblems facing any restricted scheme will alsoincrease. A difficult question for Indonesia is whetherit is possible to construct a scheme that meets theneeds of the informal economy without producingmajor problems for schemes in the formal sector.
The Jamsostek estimate (year 2000) that under existingprovisions 26.7 million formal sector workers shouldbe contributing to the Jamsostek scheme .A very smallsurvey of informal sector workers carried out by theILO project team and from discussions with Jamsostekofficials, Department of Manpower and Transmigrationofficials and with those attending workshops it revealedthat most full-time workers in the informal sector arepaid the local minimum wage plus an occasional bonuslinked to performance. Daily earnings of this groupprobably average at around Rp. 15,000, but it wouldbe necessary to conduct a fairly extensive survey ofthe informal sector labour force in order to obtain morereliable information. Other important questions thatcould be answered by such a survey and which needto be considered by those designing a very basic socialinsurance scheme suited to the needs of the informalsector are:
• How much can these workers afford to contributeeach month?
• How much are they prepared to contribute? and• What risks do they see as a priority for cover?
A small-scale survey of 2000 informal sector workersfrom Jakarta, Bandung and Yogyakarta was conductedas part of the study on extension of coverage and thefindings suggest that at least 50% of the informal sectorworkers surveyed would be unable to make effectivecontributions as they earned between one half and theaverage minimum salary which is recognised as beingbelow the poverty line in most provinces. About 42%of those surveyed indicated that they could pay at leastRp. 20,000 per month and a full breakdown of thepotential monthly contributions was:
• Rp. Less than Rp. 10,000 44.47%;• Rp. 10,000 – 20,000 26.01%;• Rp. 20,000 – 30,000 9.95%;
• Rp 30,000 – 40,000 6.15%; and• More than Rp. 40,000 1.65%.
The desired social security priorities for male andfemale respondents are shown below.
Figure 53 Social Security Priorities for Workersin the Informal Economy
On the basis of the above estimated level of income itis suggested that full-time informal sector workers (thatis those working 35 hours per week or more) might beprepared to contribute a flat rate of Rp. 20,000 permonth to a scheme. The administration costs ofcollecting such a small amount rule out any collectionsystem other than direct payment of the whole amountby the employer. If employers were required, inaddition, to pay Rp. 40,000 for all full-time workersthe resulting fund income should be sufficient to providea small pension after 15 years of fully paid contributions.Employers would face a 10% increase in their wagecosts and evasion could result in a low collection level.An alternative might be to require the same Rp. 20,000plus Rp. 40,000 contribution for all workers who receivemonthly wages at or above the local minimum wage.

Part III Chapter 11
109
This would allow labour inspectors to more easilyidentify employers paying below the minimum wageand avoid any evasion by manipulation of workinghours. An alternative to a national flat rate contributionwould be a provincial flat rate adjusted in line with theprovincial minimum wage. Under this arrangement therate would be reduced significantly in those 11provinces with a minimum wage below Rp. 200,000(see Annex 4).
The above arrangements, with flat rate contributionscollected from a working population with fluctuatingwork patterns, probably rule out the minimumcontribution condition found in traditional defined-benefit schemes. Provision would, therefore, have tobe made for a lump sum payment representing anapproximation of established contributory pensionableemployment to be paid on retirement.
Many informal sector part-time workers will be unablepay contributions from earnings below the monthlyminimum wage for their province. Considerationshould be given to integrating the informal sector andthe self-employed to an extent in a national scheme.This would require an element of redistribution or crosssubsidy which would require analysis to avoid obviousinequity. One option would be to require all employersemploying part-time workers to pay a flat ratecontribution of Rp. 30,000 for each worker, irrespectiveof the number of hours worked. If total hours of workexceeded 35 or monthly wages exceeded the localminimum wage a full combined contribution of Rp.20,000 plus Rp. 40,000 would be payable. There wouldneed to be a lower earnings level below which amonthly contribution was not payable but it would benecessary for employers to list such exempt workerson their monthly returns to Jamsostek for the purposesof compliance control.
An alternative approach would be to develop auniversal, tax-financed pension scheme which did notrely on contribution conditions. This could for exampleprovide for every person who had been resident inIndonesia for 20 years to receive at age 60, a flat ratepension of a prescribed amount based on a percentageof the minimum wage, the subsistence level or averageearnings. A variation could exclude those who receiveda public sector pension. This could provide the firsttier/safety net for a three-tier social security systemand thus be supplemented by a public defined benefitsocial insurance system and by defined contributionarrangements.
A Scheme for the Self-EmployedThe self-employed, who numbered 19.4 million at thetime of the August 2000 Labour Force Survey, will beengaged across both the formal and informal sectorsbut are currently not liable for contributions. Experiencein other Asian countries is that when offered voluntaryparticipation in a social insurance scheme the numberof self-employed volunteers tends to be low. Theproblem of adverse selection arises as a majorconsideration only when a scheme offers incapacityor disability benefits. If the self-employed were offeredparticipation in a retirement scheme, adverse selectionwould not normally present difficulty. An option wouldbe to offer the self-employed voluntary participationin a national scheme with the contribution level set atthe joint employee/employer rate or at a fixed lowerrate of perhaps Rp. 40,000. Due to fluctuations inincome an option would be to invite self-employedworkers to agree a provisional assessment of theirfuture income for the calculation of contributions liabilityand make quarterly collections until actual profits couldbe better assessed, perhaps at the end of eachaccounting year, when an adjustment could be made.Consideration could then be given in the future to theextension of coverage on a compulsory basis to certaincategories of the self-employed such as those whohad employees, those who had an established place ofbusiness, were registered tax payers or were otherwisereadily identifiable.
Pensions AdministrationIf the costs of a pension scheme are seen to be risingthere are several traditional means whereby these canbe controlled. Perhaps the greatest danger for anyscheme is that the income from workers contributionswill fall when pension costs are rising. In Indonesia acurrent priority must be to increase the contributioncollection level well beyond its present level ofapproximately 40%. While 40% compliance is anembarrassing inconvenience in a defined contributionscheme (where those who lose out are the individualcontributors), where the old age provisions are providedby way of a social insurance system (with pooling ofrisk and income redistribution between generations)low compliance can be disastrous and will need to beraised to at least 80% if meaningful benefits are to bepaid. The problem of compliance is fully discussedearlier in this Publication but in the context of thisChapter it must be understood that without anorganization that can ensure the maximum complianceby employers it is unlikely that any pension schemewill provide the workforce with financial security in

Part III Chapter 11
110
old age. It is equally essential for the social securitysystem to establish a national database for the recordingof contribution records or pension points.
The following are the more usual scheme modificationsthat can be made to meet any fall in scheme income:
• Raising the upper earnings limit for contributions.
Scheme income will be increased immediately butwhere pensions are earnings related the change willtend to benefit higher paid workers who are betterable to retain their higher earnings into the later yearsof employment and live longer on average than lowerpaid workers. This regressive effect could be modifiedby calculating pensions on the basis of career earningsor limiting the maximum pension by reference to eitherthe national average wage or the average of theprovincial minimum wages.
• Raising the employee contribution rate.
The danger is that lower paid workers will be worstaffected and may be tempted to move out of the formalsector to avoid payment. (See Annex 12 for oneestimate of the relative size of the formal and informalsectors).
• Raising the employer contribution rate.
This change could reduce the competitiveness of thoseemployers who compete directly with foreignenterprises with lower costs, and could in the longer-term result in the loss of employment opportunities. Itwas stressed by employer representatives at the ILO/Depnakertrans workshops that many small employerswould find it extremely difficult at the present time toincrease their contributions beyond the present levelof 3.7% and that some larger employers in depressedindustries were currently unable to contemplate higherlabour costs.
• Reducing pension rates for higher paid workers.
This could be more acceptable to higher paid workersif they were at the same time contributing to a secondpillar public or private pension scheme.
• Raising the pension age.
This is usually done by giving several years notice andthen phasing the change over a number of years sothat older workers are not forced to change their plans
for retirement. Annex 17 shows the increasing lifeexpectancy of workers who reach retirement age. Thisincrease will have a significant effect on future pensioncosts. Participants at the ILO / Depnakertransprovincial workshops made the point that while manyworkers would prefer to have the right to remain intheir formal sector employment beyond age 55 therewas a feeling that any increase in the pension age wouldbe to the detriment of young people entering the labourmarket who would find their job opportunities reduced.
• Exercising strict controls over disability pensionclaims.
When a scheme provides for a disability pension therewill be the temptation for some workers to see claimsas a way to early retirement. If effective controlmeasures are not in place, the cost of such pensionscan escalate. Experience in other countries shows thatsome employers may attempt to avoid paying higherseverance pay to older workers — by encouragingthem to claim a disability pension.
• Amalgamating public and civil service pensionschemes.
There will be advantages for any pension scheme inextending the number of its contributors and civilservants with above average lengths of insuredemployment will add to the sustainability of any pay-as-you-go scheme. It may be possible to provide civilservants with a separate civil service superannuationscheme and this is discussed below.
• Changing the method of indexation.
Pensions can be indexed by reference to prices orwages, a combination of both or by an amount limitedby statute to what the government decides the economycan afford in a particular year. One method may favourpensioners at a particular time in the economic cyclewhile at another time, for example, when wages arerising faster than the prices used for indexation, thesame method could favour the contributors. If pensionsare calculated by reference to earnings or nationalwage levels it might be seen as appropriate to indexpensions using recent changes in wages. Over a periodof years wage increases usually reflect both pricechanges and increases in productivity.

Part III Chapter 11
111
The Civil Service Pension Scheme Runby PT Taspen.
Tabungan dan Asuransi Pegawai Negeri (PTTASPEN) is a State-owned enterprise or Persero thatruns a form of social insurance scheme for civilservants. The 2001 State budget allocated Rp.40 trilliontowards the cost of current civil service pensions. Thisfigure represents 75% of annual pension expenditurewhile the balance of 25% is met from earnings relatedcontributions of 4.75%. The average monthly pensionis Rp.800,000 representing 80% of final earnings. Theterm “civil servants” includes all 4,020,000 permanentemployees of both central and provincial governmentplus some State-Owned Corporations. Many civilservants pay an additional 3.25% of salary as aninsurance premium that provides them with a lump-sum on retirement of 55% of final month’s salary foreach year of service plus death and survivors benefits.Pensions are indexed in line with salary increases inthe government service. All pension rights are lost if acivil servant leaves the service before the retirementage of 56, or is dismissed for any reason. Afterretirement the pension is withdrawn from thoseconvicted of a criminal offence. A full pension ispayable on loss of employment due to permanentdisability. Survivors receive 60% of the pension due tothe deceased and additions are paid for dependentchildren.
TASPEN pays 1,778,054 pensions and accepts claimsand provides a service to pensioners and contributorsthrough its Head Office, 7 regional offices and 38branch offices. It employs 2,195 staff.
Discussions are continuing in government on how toreform the civil service pension scheme and reducethe government’s financial commitments. The schemesuffers from inadequate contribution levels, belowmarket level investment returns, higher than averageadministrative costs and demographic change that hasincreased the number of pensioners relative to the civilservice complement. A current civil service pensioneris supported in terms of pension contributions by 2.6working civil servants so with pensions based on finalearnings the scheme contribution rate in the absenceof government subsidy would need to be in the regionof 40%, a totally unrealistic level. The civil service isnot reducing in size and it has been suggested thatexisting pensions should be financed entirely from theState budget while current civil servants continue inthe present scheme and all new entrants join a reformedscheme. The reformed scheme would require monthly
contributions from both employer and employee andbe self-financing. If these reforms are adopted thechange would appear to provide the option for civilservants to join a public pension system with a civilservice funded scheme providing a second pension.
When a national social insurance scheme is introducedthat extends into the informal sector it will necessaryto increase the staff complement of the social securityinstitution beyond the current Jamsostek complementand add to the network of branch offices. If the civilservice were to have its own occupational pensionscheme and at the same time be liable for contributionsto the mandatory part of a reformed State pensionscheme there would be an option for Jamsostek totake control of the TASPEN network of branch officesto produce a national network with staff that had abackground of pensions work. This would represent asignificant saving over the costs of establishing newbranch offices and recruiting and training new staff.TASPEN is currently responsible for the servicepensions of ex-servicemen above a certain age. Therewould appear to be an option of transferring allgovernment pension schemes, service and civil, to acentral pensions office if a decision is made to requireall citizens to contribute to a reformed State pensionscheme. The organisation and arrangements for thepayment of military pensions has not formed part ofthis study but it is assumed that further staff savingscould accrue from amalgamation in this area.
Employer Based and FinancialInstitution Pension PlansThere are currently less than 400 employers who useapproved employer pension plans administered bytrustees. This represents only a small percentage ofcompanies making up the formal sector and a minutefraction of the 2 million employers in Indonesia.Financial institutions offer pension plans to the self-employed and to companies without an approvedemployer based scheme. Both types of pension plantend to be defined benefit schemes with pensionentitlement based on the insured person’s final month’ssalary. In the time available to the ILO consultant itwas not possible to examine investment practice orthe performance of private pension companies butanecdotal evidence is that performance is variable. Thegovernment’s current policy is to allow full competitionwith effective supervision of the financial markets. Anoptional provision in a mandatory second tier pensionscheme (see above) is to allow employers to offerworkers who wish to opt-out of the State scheme analternative scheme with an approved pension company
Part III Chapter 11
112
that is prepared to provide a pension at least asbeneficial to the recipient as the government scheme.However, such a provision tends to reduce the size ofthe risk pool, weakening the State scheme (as has beenthe case with the opt-out clause in the Jamsostekmedical care component). Such a provision is not,therefore, recommended for Indonesia.
Approval of these voluntary, third tier schemes maybe subject to the requirement that each pensioncompany limits its charges within the maximum set bygovernment regulation. At present investment fundmanagers are required to invest exclusively in theIndonesian financial markets. Other countries havefound that this restriction, while apparentlyadvantageous for developing the national financialinfrastructure in the short-term might be described asa policy of putting all one’s eggs in one basket as itrenders funds vulnerable to falls in the national stockmarket, changes in the rate of exchange or devaluationof the currency. An option is to allow perhaps a 10%investment in foreign securities with a gradual increaseto a maximum of 40% when pension funds form amajor part of national investment. The local annuitiesmarket is said to be still immature. An option would beto allow approved foreign companies to compete inthis market in order to provide workers with the bestpossible income in retirement.
Preparation for a New PensionSchemeThe view was expressed by several participants atthe ILO / Depnakertrans workshops that both workersand employers were generally ill-informed about theJamsostek pensions and benefits schemes. There hasbeen only limited social dialogue on social securityissues and a general lack of awareness about socialsecurity concepts. When employer and workerrepresentatives were asked how they saw the prioritiesfor reform of the current social insurance scheme theemployers tended to place work-injury and healthinsurance before pensions reform while the tradeunions felt that existing benefits and pensions had equalimportance and that all rates required improvementwith pensions paid monthly for the whole of apensioner’s life. It was a general complaint that thegovernment took a profit from Jamsostek funds andthere was general approval for oversight by a tripartiteboard that was seen as an essential if there is to bemore open and transparent management of Jamsostek.
There is a need to encourage greater involvement ofsenior policy-makers and to educate social partners
on social security principles and options for developingsocial protection. Before the new scheme is launchedit will be essential to prepare a communications strategythat can ensure that employers, contributors andpensioners are aware of the advantages of the schemeand the obligations of the various stakeholders. Such astrategy usually calls for television and radioadvertising, for posters that can be displayed in, forexample, post offices, and for a series of leaflets onthe various benefits and pensions that can be madeavailable to the public in Jamsostek local offices andperhaps local government offices. Such a mediacampaign is envisaged in a possible 2nd Phase technicalassistance project the outline of which has been draftedby the ILO. In addition there will be a need for anemployer’s guide that can be distributed to allparticipating employers. This can explain theresponsibilities of employers and the procedures theyneed to follow. Immediately before a new socialinsurance scheme starts it is usual for the responsiblegovernment agency to arrange local meetings ofemployers, trade unions and other interested parties toexplain the finer points of the scheme and answerquestions about the start-up procedures. Given thepresent poor public perception of Jamsostek; manyworkers are said by their employers to refuse tocontribute to the Jamsostek pension scheme, it will bean option for government to change the name of theorganization to signal the changes introduced by thereformed scheme. This is a common practice in manycountries at the time of social insurance reform.However, at present a potential change is beingsignalled to members by referring to the institution afterthe change of status to a trust fund as Jamsostek Baru(New Jamsostek).
Although this Chapter provides an outline of the apossible pension scheme for Indonesia and latersuggests a possible formula for this, it is clear that thecountry is at a very early stage of planning and a longway from reaching an informed consensus about thedetail of the preferred scheme. Further work needs tobe done to establish the real social insurance aspirationsof the workforce, both formal and informal and themonthly premiums they can afford to contribute to anational scheme. It is also clear that there has beenonly limited social dialogue on social security issues
It is suggested that the first step should be aninformation gathering exercise to solicit views from awide cross section of the workforce. The answers couldvary significantly as between provinces given thedifferent stages of development and could point to the
Part III Chapter 11
113
option of designing a national scheme with slightvariations to meet provincial needs. When a decisionhas been made on the national system it would seempolitic to conduct several pilot exercises to test itsadministration. Such pilots could cover the recordingof all employers in an area, the recording of individualemployees, the establishment and training of a teamof compliance inspectors and the feasibility of localschemes with reduced rates of contribution for the lowpaid and possibly part-time workers. Schemes to meetthe special needs of the self-employed will be anotheroption but it is generally an advantage if the self-employed contribute to a universal scheme coveringas large a part of the workforce as possible. Thesuccessful results from such pilots could then be appliedin larger geographical areas until they were operatingin two or three provinces. Only at that stage, whenoperating systems were seen to work well at a costthat a national system could afford, would it be time toextend the scheme to become a national socialinsurance scheme.
ConclusionsFrom the limited contact made by the ILO Project Teamdirectly with individual workers during the study it wasfound that Indonesian workers say they would like apension scheme that will provide an adequate incomein retirement. The above options for pension schemesgive scope to those designing a future national socialsystem to meet these aspirations of the nationalworkforce. There are a number of key factors thatguide recommendations on an appropriate structurefor a pension system for the private sector in Indonesiaincluding:
• Provident fund balances withdrawn wheneverpossible;
• Short-term perspective of social protection needs;• Low incomes and expectations among workers;• Low participation rate and non-compliance among
both employers and their workers;• Poor public perception of the private social security
system and the institution administering it (PTJamsostek);
• Lack of awareness of social security principles;• Limited administrative capacity — in particular, the
ineffective enforcement procedures and lack ofcapacity to pay periodic benefits;
• Undeveloped private pensions and insurance sector;• Weak capital markets;• Public sector pension schemes are well established
but are underfinanced;
• The public sector scheme does not have portablebenefits and this discourage labour mobility; and
• Restructuring is necessary.
It is evident from the high number of lump sumwithdrawals from the Jamsostek provident fund (seeAnnex 14) that the fund is not being used to providesecurity to its members in old age in that benefit is notbeing provided by way of a periodic pension that isindexed as a protection against inflation. Instead, theprovident fund is acting as a substitute for a basicunemployment benefit scheme in that the vast majorityof the premature withdrawals are by those workerswho have lost employment before reaching retirementage.
Even without the provision to withdraw lump sumsbefore pension age, there is an underlying preferencefor the short-term benefit of a lump sum against thealternative (de jure if not de facto) of a periodicpension over a period of five years.
The low national average income means thatcontribution income is low and there is resistance toany increase that might fund a higher level of benefit.In the wake of an economic crisis employers are alsoreluctant to pay more or increase their labour costs.With the scheme being essentially an individual savingsscheme with a direct relationship between thecontributions paid and the lump sum entitlement,expectations are low.The present coverage of the Jamsostek old age benefitscheme is only around 10% of the workforce. This ispartly due to the legislation not having been extendedto cover the whole of the private sector but also due towidespread non-compliance. This non-complianceincludes employers who should be covered (given thatthey employ 10 or more workers or have a payroll ofRp.1 million a month or more) and also employers whopay contributions in respect of fewer than their totallabour force and on lower than actual wages paid. Lowpay levels tend to discourage workers from complainingto Jamsostek about low deductions from their pay-packets.
The poor public perception of Jamsostek is partly dueto poor service in the past, allegations of corruptionand also to a low rate of return on investments thathas been substantially below market rates and inflation.This has give rise to a negative rate of accumulationover a number of years, although the situation hasimproved. The low esteem has in turn made compliancemore difficult and even to worker-pressure to withdraw

Part III Chapter 11
114
29 Chapter 10 and Report to the Government of the financing and investment of Jamsostek 2002.
from membership. In such an environment of suspiciona ‘take-your-money-and-run’ concept isunderstandable.Social security principles are not widely known inIndonesia and, in particular, the social insuranceprinciple of shared risk. While there may be suspicionof income transference from richer to less well paid, itis hoped that pooling of risk and income transferbetween generations will be more readily accepted.
Jamsostek’s administrative capacity, though limited, canbe improved and the institution has not benefited fromthe policy and operational control being with theDepartment of Manpower and the financial control bythe Ministry of Finance. No national pension schemecan be administered without an effective system forthe collection of workers’ contributions. The presentarrangement with its division of responsibility betweenJamsostek and the Labour Inspectorate shows verypoor returns and needs a major review aimed at thecreation of adequately complemented teams of welltrained inspectors in every area of the country. It wouldbe very difficult to record pension records without amodern computerized system with a national database.Both these reforms will require the investment of capitaland the training of those staff without the necessaryskills. The management of a reformed system will callfor new management skills, methods and techniquesthat can only be acquired after a comprehensiveprogramme of training. New management andfinancial information systems need to be created toprovide managers with reliable statistics and otherinformation. These changes will involve long-termprojects and it cannot be realistically expected that allsystems will be in place for several years. Theimportant and urgent question for Indonesia is howand when to start the process of reform. (See alsorecommendations on compliance and on humanresource development in Part I of this Publication).
There are presently only around 400 employersoperating private or occupational schemes in Indonesia(as mentioned above) and while it would be detrimentalto the development of any planned social insurancepension scheme to permit opting (or contracting) outof the national scheme, there should be provision forproperly regulated, private pension plans to operate ina voluntary, third tier for any employers or individualswho wished to supplement eventual pensionsentitlement for their workers or for themselves bypurchasing additional pension rights. Experience in
many countries indicates that the existence of a nationalpension scheme actually generates interest insupplementary provision as individuals and groups arestimulated to think about proper provision for old age.The same trend applies also to other private insuranceand it would thus be anticipated that the developmentof social health insurance would generate interest insupplementary, private provision. But, in order to leaveroom for this development of the private market, itfollows that the level of contribution to the nationalcompulsory scheme should not be too high.
With advance funding of social insurance schemesaccount needs to be taken of the strength of the capitalmarket available for the investment of social insurancefunds derived from contributions. The actuarial report29
suggests that the capital market in Indonesia is notcapable of providing sufficient investment instrumentsfor risk diversification and that provision might be madefor some investments to be placed overseas.
The terms of reference for the ILO pension study didnot require options to be considered for developmentof the public sector pension schemes. However, thereare believed to be potential funding problems buildingup for these schemes and, in the meantime there maybe advantages in considering the possibleharmonization of the pension provisions in case a futureoption might be to develop a unified national pensionscheme covering the public as well as the privatesector. There would, of course be benefits to such acourse of action, including the portability of pensionentitlement for workers moving between the public andprivate sectors, leading to greater mobility in theworkforce and a greater sense of solidarity. In themeantime provisional arrangements for such portabilityshould be considered.
The above considerations lead to the conclusion thatthe development of a national social insurance pensionscheme for Indonesia should be a phased process overa number of years. This would enable the capacity ofJamsostek to be built up together with a widening ofthe appreciation of the concepts. Thus initially a modest,simple scheme should be devised that covers as manyworkers as possible, costed and promoted to illustratethe impact on social protection and to assess the levelof consensus.
In its Report, the ILO recommended a defined benefitscheme, which would provide a predictable benefit,

Part III Chapter 11
115
taking advantage of pooling principles of socialinsurance and providing reasonable levels of benefit— on retirement, for invalidity or death — within afew years of the schemes inception.
The amount of pension payable in defined benefitschemes is usually related to the length of insuranceand earnings-related pensions are also usually basedadditionally on the average reference earnings. Mostschemes also stipulate a prescribed band width(between a minimum pension and a benefit ‘ceiling’)within which pensions are payable. In Indonesia it istempting to relate this band width to the nationalminimum wage. However, it is understood that theminimum wage is related to a periodic calculation of‘minimum living needs’ Kebutuhan Hidup Minimum(KHM) and that this relationship is under review. Thereasons for this include consideration of the view thata ‘national minimum wage’ should be related to anentry wage — the level of earnings for school leaversor persons entering employment for the first time —not to a living wage for those who have familyresponsibilities as bread-winners. Thus it would bepreferable to use the national average wage as areference point for determining minimum and maximumpensions payable to any particular claimant. However,reference to the ‘minimum wage’ might still benecessary when prescribing the contribution liabilityand reference to KHM might be necessary should anyfuture social assistance scheme be planned that wouldrequire comparison with basic living or subsistencestandards.
The elements of a defined benefit scheme for Indonesiacould, therefore, be:—
• Coverage:
! All workers except those covered by TASPENor ASABRI;
! Possibly also self-employed persons with a placeof business, having employees, or following aprescribed occupation.
Alternatively consideration could be given to includingthe self-employed on a voluntary basis or compulsorilyin a later stage, since enforcement of liability for thisgroup is potentially problematical.
• Contribution liability:
! The current level of contribution (5.7% +0.3%)could be applied initially to pay for the new scheme,
thus all workers with earnings above the minimumwage (and prescribed self-employed persons)would pay earnings-related contributions (onprescribed insurable gross earnings) of 6% (4%for employers & 2% for workers – 6% for self-employed). The contribution rate will be reviewedregularly in order to ensure the long-term financialequilibrium;
! There could be a contribution ceiling of Rp.2m (tobe reviewed in the light of increases in wagesindices over time; and
! Part-time workers and workers earning at orbelow the minimum wage could be covered by aflat-rate contribution of Rp.40,000 (Rp.20,000payable by the worker and Rp.20,000 by theemployer – Rp.40,000 payable by low-paid self-employed persons) with the employer paying anadditional sum of Rp.20,000 for every full-timeworker as a subsidy to the scheme.
• Pension age:
! The recommended age for entitlement to old agepension is 60 years with no retirement condition;or
! Age 55 – 60 years subject to retirement fromemployment with earnings at or above the levelof 60% of the minimum wage (or a lowerpercentage of the national average wage).
• Qualifying conditions:
! Contributions would need to be paid or credited(see Paragraph 9.14) for 180 months (15 years)with at least 120 contributions actually paid;
! 180 months active membership would give rise toa pension of 25% of average insurable earnings;
! Each additional month might give rise to anadditional 1%;
! Minimum pension would be 60% of the minimumwage (or a lower percentage of the nationalaverage wage);
! ‘Average insurable earnings’ would relate toearnings over the period of insured membership,increased by reference to a national averageearnings index. Alternatively the average couldbe based on final 3 years’ earnings;
! A benefit ceiling based on 3 times averageearnings (i.e. currently Rp.1.5m);
! Special qualifying conditions could apply toprovident fund members who decide, within aprescribed period, to convert their provident fundaccounts wholly or partially into months of
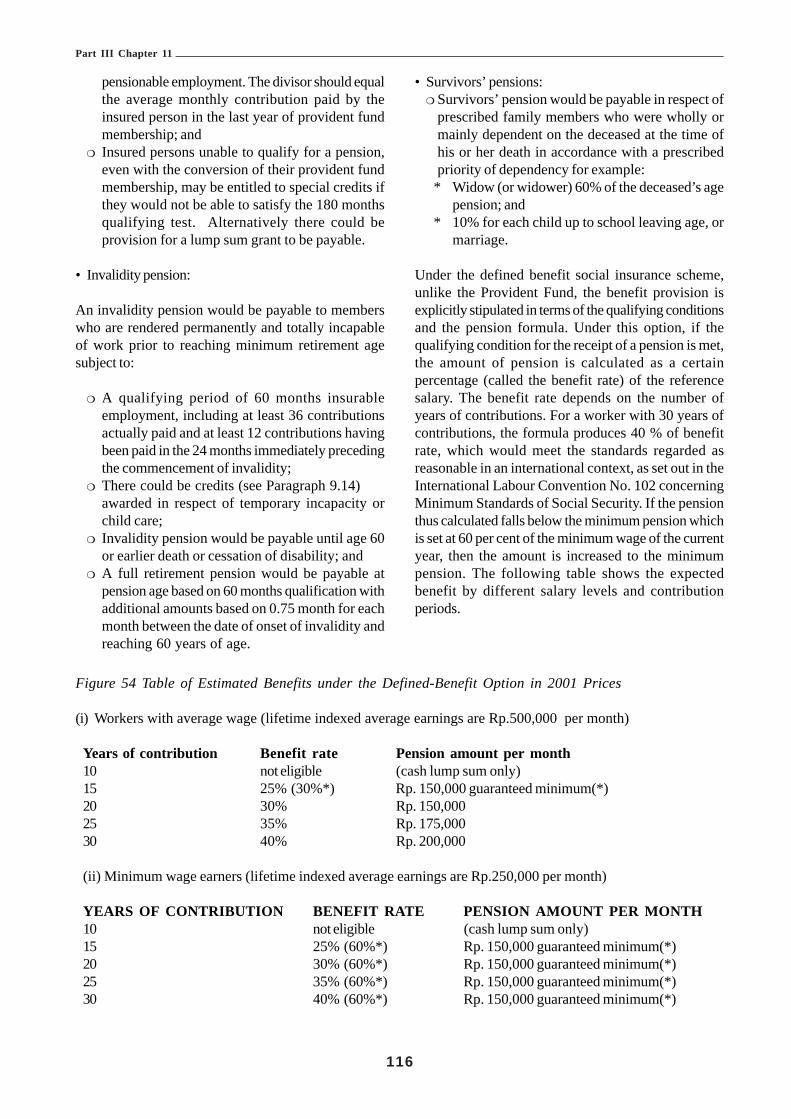
Part III Chapter 11
116
pensionable employment. The divisor should equalthe average monthly contribution paid by theinsured person in the last year of provident fundmembership; and
! Insured persons unable to qualify for a pension,even with the conversion of their provident fundmembership, may be entitled to special credits ifthey would not be able to satisfy the 180 monthsqualifying test. Alternatively there could beprovision for a lump sum grant to be payable.
• Invalidity pension:
An invalidity pension would be payable to memberswho are rendered permanently and totally incapableof work prior to reaching minimum retirement agesubject to:
! A qualifying period of 60 months insurableemployment, including at least 36 contributionsactually paid and at least 12 contributions havingbeen paid in the 24 months immediately precedingthe commencement of invalidity;
! There could be credits (see Paragraph 9.14)awarded in respect of temporary incapacity orchild care;
! Invalidity pension would be payable until age 60or earlier death or cessation of disability; and
! A full retirement pension would be payable atpension age based on 60 months qualification withadditional amounts based on 0.75 month for eachmonth between the date of onset of invalidity andreaching 60 years of age.
• Survivors’ pensions:! Survivors’ pension would be payable in respect of
prescribed family members who were wholly ormainly dependent on the deceased at the time ofhis or her death in accordance with a prescribedpriority of dependency for example:
* Widow (or widower) 60% of the deceased’s agepension; and
* 10% for each child up to school leaving age, ormarriage.
Under the defined benefit social insurance scheme,unlike the Provident Fund, the benefit provision isexplicitly stipulated in terms of the qualifying conditionsand the pension formula. Under this option, if thequalifying condition for the receipt of a pension is met,the amount of pension is calculated as a certainpercentage (called the benefit rate) of the referencesalary. The benefit rate depends on the number ofyears of contributions. For a worker with 30 years ofcontributions, the formula produces 40 % of benefitrate, which would meet the standards regarded asreasonable in an international context, as set out in theInternational Labour Convention No. 102 concerningMinimum Standards of Social Security. If the pensionthus calculated falls below the minimum pension whichis set at 60 per cent of the minimum wage of the currentyear, then the amount is increased to the minimumpension. The following table shows the expectedbenefit by different salary levels and contributionperiods.
Figure 54 Table of Estimated Benefits under the Defined-Benefit Option in 2001 Prices
(i) Workers with average wage (lifetime indexed average earnings are Rp.500,000 per month)
Years of contribution Benefit rate Pension amount per month10 not eligible (cash lump sum only)15 25% (30%*) Rp. 150,000 guaranteed minimum(*)20 30% Rp. 150,00025 35% Rp. 175,00030 40% Rp. 200,000
(ii) Minimum wage earners (lifetime indexed average earnings are Rp.250,000 per month)
YEARS OF CONTRIBUTION BENEFIT RATE PENSION AMOUNT PER MONTH10 not eligible (cash lump sum only)15 25% (60%*) Rp. 150,000 guaranteed minimum(*)20 30% (60%*) Rp. 150,000 guaranteed minimum(*)25 35% (60%*) Rp. 150,000 guaranteed minimum(*)30 40% (60%*) Rp. 150,000 guaranteed minimum(*)

117
Part III Chapter 11
The minimum pension of Rp. 150,000 per month isprovided to workers who have been contributingmembers for 15 or more years. The percentage inbrackets shows the benefit rates of the minimumpension. In the case of average wage earners with 15years contribution period, applying the pension formulawould produce Rp. 125,000, which is lower than theminimum pension. Therefore, the pension is increasedto Rp. 150,000.
Given the low level of the reported contributory salary,the proposed pension formula would not provide anamount significantly higher than the minimum pension.In particular, it is seen that for minimum wage earners,the pension formula always produces lower benefitrates than the minimum pension. Therefore, it isanticipated that a large number of pensioners wouldreceive the minimum pension. Hence, the proposeddesign is de facto similar to a flat-rate pension with asmall increment for long service or high contributions.In the absence of enforcement of inspection of thecontribution base, such a design will invite a disincentiveeffect and may raise a further concern of compliancedeterioration. If the inspection of the contributorysalary remains lax, the most rational behaviour of aworker is to pay contributions for only the qualifyingperiod (10 years) at the minimum wage.
The contribution rate that ensures the long-termfinancial viability of the proposed scheme should bedetermined in an actuarial assessment. In the absenceof reliable data, a full-scale actuarial assessment isdifficult to carry out. Nevertheless, ILO attempted to
make the following crude evaluation based on a steadystate analysis using the total population data. Let usconsider the pay-as-you-go (PAYG) cost rate, whichis defined as the expenditure expressed as apercentage of the total contributory wage. This isregarded as the contribution rate needed for paymentof expenditure in the current year if costs were to befinanced solely from the current contribution income.The PAYG cost rate is further expressed as a productof two factors. The first factor is “the demographicdependency ratio”, defined by the number of pensionersas a percentage of the covered population; and, thesecond factor is “the average replacement ratio”,defined by the average pension as a percentage of theaverage contributory earnings. According to thepopulation projection result (intermediate scenario), thedemographic dependency ratio of the total population(pension age 60 years) is expected to be 29.1% in2030, 47.3% in 2050 and 51.3% in 2070. Taking a 30%of benefit rate as a rough proxy for the averagereplacement ratio and assuming that the cost ofinvalidity and survivors’ pensions are around 20 percentof the old-age pensions cost, the estimated PAYG costrate would be 10.5% in 2030, 17.0% in 2050 and 18.5%in 2070. (These are net rates for benefit payment. Inpractice, administrative expenses should be added.)These preliminary results suggest that the currentcontribution rate of 6% would probably not sufficientfor ensuring the prescribed benefits, although the finalanalysis needs to take into account the level of advancefunding and the development paths of income andexpenditure in the long run.

118
Part III Chapter 12
CHAPTER 12 EMPLOYMENT INJURY & DEATH BENEFITS
Executive Summary
Background
The employment injury benefit scheme was put intoplace by Act No. 2 of January 1951. The original Actwas replaced by the Accident Act, No. 33 of 1974and was gazetted to apply to the whole of Indonesia.The scheme to provide protection for employmentaccidents was based on the principle of individualemployer’s liability. Later, attempts were made toimprove the protection provided through theGovernment Regulation No. 33 of 1977 known as theEmployee’s Social Insurance State Gazette 1977 No.54 and a Supplementary State Gazette No.3112. Thislaw changed the employer’s liability principle andintroduced protection through social insurance. Theadministration of the coverage was assigned to aGovernment agency known as Perum ASTEK(Asuransi Sosial Tenaga Kerja).
These developments over three decades mark attemptsby the Government to review the available protectionwith a view to improving it and make it more relevantto the times and the needs of the workers. At the timeof these changes the Government recognized that themeasures had not provided comprehensive socialsecurity protection to workers and existing schemesdid not meet their needs. The above-mentioned Lawslimited the scope of protection to accidents at workwhile the responsibility to provide this coverage wasplaced on the employer. Employers were required tomake good all the payments due either from their ownresources or through the purchase of an insurancepolicy to cover the liability.
Developments in social security protection advancedwith the introduction of the Employees’ Social SecurityAct No 3 of 1992. The Government established a publiclimited liability company PT Jamsostek (JaminanSosial Tenaga Kerja - Social Security for theWorkforce), to implement the provisions of the Act.
The scope of benefits provided by this Act is: • Employment Accident Benefits (including benefits
for Occupational Diseases;• Old Age;• Death; and• Health Care Benefits.
The provisions of the Act apply to employers with tenor more employees or with a monthly wage bill ofRp1,000,000.00 or more.
An ILO study, TSSI Indonesian Social Security in 1993,noted that “There are several deficiencies with regard toprotection in respect of employment injury andrecommended:
That legislation is enacted to provide for thepayment of benefits by way of a periodic paymentin respect of disablement where the degree ofdisablement is 30% or more and in the case ofdeath;
There is considerable anecdotal evidencesupported by inference from statistics thatemployment accidents are under reported and thatclaims are not being made in respect of entitlement.This requires increased publicity focused on boththe employer and worker to ensure that obligationsand rights are known and it also requiressupporting emphasis by those responsible for theenforcement of the provisions (the labourinspectorate);
It is recommended that priority be given toextending coverage against employment injuryunder the employment injury scheme to allemployees including home workers.”
These recommendations were not implemented. As aresult of this, the protection provided at present is limitedto a small proportion of the labour force while benefitshave become irrelevant to the needs of the injuredemployees and their dependants. The public view isthat Jamsostek is a private company that makes profitsfor the government and they have lost confidence inJamsostek’s ability to provide protection. There is alsomisinformation about coverage, benefits and liabilityunder the Act. There is no transparency in financialadministration and the lack of publicity has erodedemployer and employee confidence in Jamsostek.Jamsostek’s administration over the years hasconcentrated on the financial aspects rather then socialprotection and in its search for profits has extendedcoverage to certain groups charging them high premiumrates for coverage of employment accidents.

Part III Chapter 12
119
The Terms of Reference for the ILO Study of theFeasibility of Improvements of Benefits inrespect of Employment Injury and Death in thepresent project were
• Undertake a financial assessment of the existingscheme and the basis on which contribution ratesare determined;
• Undertake consultations with employers and workersorganisations and Jamsostek staff to determine theexperience in the operation of the scheme;
• Design a revised benefit and contribution structureto address existing weaknesses;
• On the basis of the actuarial analysis conducted aspart of the social budget exercise advise on differentdesign options including whether the scheme shouldbe financed on a uniform rate of contribution or avariable rate with modification;
• Identify and analyse the administrative implicationsof the reform.
Funding profileThe JKK scheme is funded entirely by contributionsfrom employers. Employers pay differential rates ofcontribution according to five occupational groups. Therate of contribution for industries in Group 1 is 0.24%,while the rate for Group 2 is 0.54%, Group 3 is 0.89%,Group 4 is 1.27% and Group 5 is 1.74%. Jamsostekalso covers other groups of workers who areindependent contractors in the construction sector, thetransport sector, harbour workers and migrant workersthrough employment agencies. These groups arecharged different rates of contribution and in the caseof the construction industry it is 1.74% of the value ofthe contract. The method of determining the rate ofcontribution for each group is not clear, although theoccupational groups appear to have been drawn upaccording to an arbitrary assessment of risk. Thecollection system is considered to be unnecessarilycostly to administer and would benefit fromsimplification such as a change to a unified rate ofcontribution.
The JKK scheme statistics show that contributionscollected considerably exceed benefit outgo. The ratioof benefit payments to collections has declined steadilyfrom 53.95% in 1994 to 42.29% in the year 2000. Thisis partially due to the inadequacy of the level of benefitpaid but also to the low level of claims which isconsiderably less than could be expected. This low
incidence of reported accidents and claims is believedto be a combination of low awareness of the availabilityof employment injury benefits and employers’reluctance to report accidents in case their contributionliability is increased.
Consultations with workers and employersA number of employers, in particular those representingoil exploration and exploitation concerns, expresseddissatisfaction with the contribution structure and feltthat there was inadequate recognition of employerswho introduced good health and safety practises ormaintain low accident records by way of reductionin liability or movement to a lower risk group. Notsurprisingly, workers’ representatives considered thatthe level of benefit provision was inadequate.
Proposals for improvementThe ILO Report weighed the advantages of thedifferent contribution systems to support employmentinjury schemes and recommended a unified contributionsystem. A number of recommendations are also madeconcerning possible improvements in the method ofpayment of benefits, especially the introduction ofperiodic payment of benefit throughout the contingencyfor the long-term disabled or for the survivors ofpersons who die as a result of an employment injuryor disease.
Comment was also made in the Report regarding:
• The scope of coverage of occupational diseasesunder the present employment injury scheme beingrestricted, due to the list of diseases not being updatedto reflect the developments in this field.
• The scope of commuting accidents needing to bereviewed with a view to extending it to other work-related journeys.
• Artificial aids or prosthetics being provided only oncewith no provision for replacement or repair.
• The need for extension of coverage to enterprisesemploying one or more employees.
• The need for enhancement of medical care for theinjured and improvement in provision for vocationaland physical rehabilitation.
• The need for the provisions for Death Benefit to bechanged to provide survivor’s pension to the primarydependants of the employee or in their absence thesecondary dependants.

120
Bab 12. Jaminan Kecelakaan KerjaDan Jaminan Kematian
Rangkuman Eksekutif
Latarbelakang
Skema jaminan kecelakaan kerja diperkenalkan melaluiUU No. 2 pada bulan Januari 1951. Undang-undangasli tersebut digantikan oleh UU Kecelakaan No. 33Tahun 1974 dan dimasukkan ke dalam berita negarauntuk diberlakukan di seluruh Indonesia. Skema untukmemberikan perlindungan bagi kecelakaan kerjadidasarkan pada prinsip kewajiban pengusaha secaraperorangan untuk memberikan jaminan kecelakaankerja kepada pekerja. Kemudian dilakukan upaya-upaya untuk memperbaiki perlindungan yang diberikanmelalui Peraturan Pemerintah No. 33 Tahun 1977 yangdikenal dengan Lembar Negara No. 54 Tahun 1977mengenai Asuransi Sosial Tenaga Kerja besertaTambahan Lembar Negara No. 3112. Undang-undangini mengubah prinsip kewajiban pengusaha untukmemberikan jaminan kecelakaan kerja danmemperkenalkan perlindungan kecelakaan kerjamelalui asuransi sosial. Administrasi kepesertaannyadiserahkan kepada suatu instansi pemerintah yangdikenal dengan nama Perum ASTEK (Asuransi SosialTenaga Kerja).
Perkembangan-perkembangan yang berlangsungselama tiga dasawarsa ini menandai upaya pemerintahuntuk meninjau ulang perlindungan yang ada denganmaksud untuk memperbaikinya dan membuatnya lebihrelevan dengan perkembangan jaman dan kebutuhanpekerja. Saat berlangsungnya perubahan-perubahantersebut, Pemerintah mengakui bahwa langkah-langkahyang dilakukan tidak memberikan perlindungan jaminansosial secara meluas kepada pekerja dan skema-skemayang ada sekarang tidak memenuhi kebutuhan mereka.Undang-undang yang disebut di atas membatasi ruanglingkup perlindungan pada kecelakaan di tempat kerjasedangkan tanggung jawab untuk memberikanperlindungan terhadap kecelakaan di tempat kerja inidibebankan kepada pengusaha, yang diwajibkan untukmelakukan semua pembayaran baik dari sumber danamereka sendiri maupun dengan membeli polis asuransiuntuk memenuhi kewajiban memberikan jaminankecelakaan kerja kepada karyawannya.
Perkembangan-perkembangan dalam perlindunganjaminan sosial terus berlanjut dengan diperkenalkannya
UU No. 3 Tahun 1992 mengenai Jaminan Sosial TenagaKerja. Pemerintah membentuk suatu perusahaanperseroan terbatas publik – PT Jamsostek (JaminanSosial Tenaga Kerja) – untuk mengimplementasikanketentuan-ketentuan UU No. 3 Tahun 1992 tersebut.
Ruang lingkup manfaat yang diberikan oleh UU iniadalah:• Jaminan Kecelakaan Kerja (termasuk jaminan untuk
penyakit akibat kerja);• Jaminan Hari Tua;• Jaminan Kematian; dan• Jaminan Pemeliharaan Kesehatan.Ketentuan-ketentuan UU tersebut berlaku untukpengusaha yang mempekerjakan sedikit-dikitnya 10orang atau membayar upah sekurang-kurangnya Rp1juta.
Suatu studi ILO, Jaminan Sosial Indonesia TSSI dalamtahun 1993, menyebutkan bahwa:
“Sehubungan dengan perlindungan terhadapkecelakaan kerja dijumpai adanya beberapakekurangan dan karena itu direkomendasikan:
Supaya diberlakukan undang-undang yangmemberikan pembayaran manfaat secara periodikdalam hal terjadinya cacat bilamana tingkat cacatmencapai 30% atau lebih dan dalam hal terjadinyakematian;
Terdapat banyak bukti anekdot, yang tersirat daridata-data statistik yang ada, bahwa jumlahkecelakaan kerja yang dilaporkan lebih rendahdari jumlah kecelakaan kerja yang sesungguhnyaterjadi dan bahwa tuntutan untuk memperolehjaminan kecelakaan kerja tidak diajukanmeskipun ada hak untuk itu. Karena itu publisitasmengenai jaminan kecelakaan kerja perludigalakkan, dan hendaknya difokuskan padapengusaha dan pekerja guna memastikandisadarinya apa yang menjadi kewajiban dan hakmasing-masing; di mana untuk itu juga diperlukanpenekanan dengan dukungan dari mereka yangbertanggung jawab atas penegakan ketentuan(yaitu inspektorat ketenagakerjaan);
Di samping itu, upaya memperluas cakupankepesertaan skema jaminan kecelakaan kerjauntuk menjangkau semua tenaga kerja, termasukpekerja rumahan, hendaknya diprioritaskan.”

121
Rekomendasi-rekomendasi tersebut di atas tidakdilaksanakan. Akibatnya, perlindungan yang diberikansaat ini terbatas pada proporsi tenaga kerja yang relatifkecil sedangkan manfaat yang disediakan menjadi tidakrelevan dengan kebutuhan pekerja yang mengalamikecelakaan kerja dan tanggungan mereka. Masyarakatumum berpendapat bahwa Jamsostek merupakanperusahaan swasta yang mencari laba untukpemerintah dan masyarakat telah kehilangankepercayaan pada kemampuan Jamsostekmemberikan perlindungan. Di samping itu juga terjadikesalahan informasi mengenai cakupan kepesertaan,manfaat dan kewajiban menurut undang-undang. Tidakada transparansi (keterbukaan) dalam administrasikeuangan dan tidak adanya publisitas menyebabkanterkikisnya kepercayaan pengusaha dan pekerja padaJamsostek. Administrasi Jamsostek selama bertahun-tahun terkonsentrasi lebih pada aspek keuangandaripada perlindungan sosial dan dalam upaya mencarilaba, Jamsostek telah memperluas cakupankepesertaan ke kelompok-kelompok tertentu denganmembebankan tingkat premi yang tinggi untukperlindungan kecelakaan kerja.
Batasan (Terms of Reference) Studi ILO mengenaiKelayakan Perbaikan Manfaat sehubungandengan Kecelakaan Kerja dan Kematian dalamproyek yang sekarang ini adalah:• Melakukan penilaian keuangan terhadap skema yang
ada sekarang dan berdasarkan tingkat iuran yangditetapkan;
• Melakukan konsultasi dengan organisasi pengusahadan pekerja serta staf Jamsostek untuk menetapkanpengalaman dalam pengoperasian skema;
• Merancang struktur manfaat dan iuran yang sudahdiubah untuk memperbaiki kelemahan-kelemahanyang ada sekarang;
• Berdasarkan analisa aktuaria yag dilakukan sebagaibagian dari upaya penyusunan anggaran sosial,memberikan nasihat mengenai berbagai pilihanrancangan, termasuk apakah skema tersebuthendaknya dibiayai berdasarkan suatu tingkat iuranyang seragam atau tingkat yang beragam denganmodifikasi;
• Mengidentifikasi dan menganalisa implikasi-implikasiadministratif dari reformasi (perombakan) yangdilakukan.
Profil pendanaan
Skema JKK didanai seluruhnya dari iuran yangdibayarkan pengusaha. Pengusaha membayar tingkatiuran yang berbeda-berbeda menurut lima kelompok
industri. Tingkat iuran untuk industri yang termasukdalam Kelompok I adalah 0,24%, sedangkan tingkatiuran untuk industri Kelompok 2 adalah 0,54%, untukindustri Kelompok 3 adalah 0,89%, untuk industriKelompok 4 adalah 1,27%, dan untuk industri Kelompok5 adalah 1,74%. Jamsostek juga mencakup kelompokpekerja lain yang merupakan kontraktor independendi sektor konstruksi, sektor transportasi, buruhpelabuhan dan pekerja migran melalui agen penyalurtenaga kerja. Kelompok-kelompok tersebut dipungutiuran yang berbeda-beda nilainya. Untuk industrikonstruksi, tingkat iurannya adalah 1,74% dari nilaikontrak. Metode untuk menetapkan tingkat iuran untukmasing-masing kelompok tidaklah jelas, meskipunkelompok-kelompok industri tersebut tampaknya telahdisusun berdasarkan penilaian risiko secarasembarangan. Sistem pemungutan iuran dinilai tidakperlu terlalu mahal untuk dijalankan dan akanbermanfaat apabila disederhanakan – seperti perubahanke tingkat iuran yang diseragamkan.
Statistik skema JKK menunjukkan bahwa iuran yangterkumpul jauh melebihi pembayaran manfaat. Rasiopembayaran manfaat terhadap iuran yang terkumpulsecara terus menerus mengalami penurunan dari53,95% di tahun 1994 menjadi 42,29% di tahun 2000.Ini sebagian diakibatkan oleh tidak memadainya tingkatmanfaat yang dibayarkan tetapi juga karena rendahnyatingkat tagihan yang diajukan, yang jauh lebih rendahdaripada yang diperkirakan. Rendahnya insidenkecelakaan yang dilaporkan dan tagihan yang diajukandiyakini merupakan kombinasi dari rendahnya kesadaranakan tersedianya jaminan kecelakaan kerja dankeengganan pengusaha untuk melaporkan kecelakaankerja apabila kewajiban mereka membayar iurankecelakaan kerja dinaikkan.
Konsultasi dengan pekerja dan pengusaha
Sejumlah pengusaha, terutama yang mewakiliperusahaan-perusahaan eksplorasi minyak daneksploitasi sumber daya alam, merasa tidak puasdengan struktur iuran yang ada saat ini. Mereka merasabahwa pengusaha yang telah memperkenalkan praktikK3 yang baik atau telah berhasil menekan angkakecelakaan kerja tidak diberi pengakuan yang cukup,misalnya berupa pengurangan kewajiban ataupenempatan ke kategori risiko yang lebih rendah.Karena itu tidaklah mengherankan bahwa wakil-wakilpekerja beranggapan bahwa tingkat manfaat yangdiberikan tidak memadai.
122
Usulan untuk melakukan perbaikan
Laporan ILO ini menimbang keunggulan dari sistem-sistem iuran yang berbeda-beda dalam mendukungskema kecelakaan kerja dan merekomendasikan suatusistem iuran yang seragam. Sejumlah rekomendasijuga diberikan mengenai perbaikan-perbaikan yangmungkin dilakukan dalam metode pembayaranmanfaat, terutama dalam memperkenalkan periodepembayaran manfaat selama masa kontinjensi untukpenderita cacat jangka panjang atau untuk mereka yangditinggalkan oleh orang yang meninggal dunia akibatkecelakaan kerja atau penyakit.
Laporan ini juga memberikan tanggapan tentangperlunya mengkaji ulang:
• Ruang lingkup jenis-jenis penyakit akibat kerja yangditanggung/ dicakup dalam pemberian manfaat —karena daftar penyakit yang tidak mencerminkanpengembangan di bidang ini;
• Ruang lingkup kecelakaan sewaktu berangkat ke danpulang dari tempat kerja — dengan maksud
memperluas ruang lingkup tersebut denganmemasukkan perjalanan-perjalanan lain yangberkaitan dengan pekerjaan;
• Pemberian alat bantu tiruan atau bagian tubuh palsuuntuk menggantikan bagian tubuh asli yang hilang— yang menurut ketentuan yang berlaku saat inihanya diberikan sekali tanpa kemungkinanmendapatkan penggantian atau perbaikan;
• Perluasan cakupan kepesertaan ke semuaperusahaan (yaitu, untuk mengikutsertakanpengusaha yang mempekerjakan pekerja kurang dari10 orang);
• Kebutuhan untuk meningkatkan perawatan medisbagi pekerja yang terluka/ mengalami kecelakaanserta perbaikan ketentuan-ketentuan yang mengaturrehabilitasi keterampilan dan rehabilitasi jasmani; dan
• Kebutuhan untuk mengubah ketentuan-ketentuanyang mengatur Jaminan Kematian supaya pensiunyang menjadi hak pekerja yang meninggal diberikankepada tanggungan primer dari pekerja yangmeninggal tersebut atau, bila tanggungan primer tidakada, kepada tanggungan sekunder.
Part III Chapter 12
123
30 The question of compliance is discussed in Part I of this Publication.
Overview of the Legal Provisions andTheir Implementation
Coverage of Enterprises
The Employees’ Social Security Act 1992 hasprovisions to comprehensively cover all enterprisesirrespective of the fact they are established to makeprofits or not and whether they are state or privatelyowned. Foundations, scientific institutions or otherNGO’s with managing directors also fall within thescope of the Act.
Despite these provisions administratively the Act isenforced only on the private sector and semiGovernment agencies. Employers with 10 or moreemployees or paying a monthly payroll of not less thanRp.1,000,000 (one million) are compulsorily requiredto register with Jamsostek. The dual conditionsimposed have caused some confusion and complicatedenforcement and consequently compliance30. Manyemployers hide behind the first condition andconveniently forget the secondon. Taking intoconsideration the minimum wage in Indonesia (whichranges from Rp.230,000 in the district of Muluku toRp.426,250 in Jakarta), all employers with 3 or moreemployees should be liable for coverage. All otherenterprises with less then the minimum number ofemployees are not covered by the Act and remainunder the old law being liable to pay compensation totheir injured employees. Due to lax enforcement thisgroup of employers and employees has has effectivelybeen excluded from social secutity protection againstthe effects of employment injury and disease for thepast fifty years.
Although there are no legal provisions to cover certainemployees, some small employers have been permittedto register with Jamsostek providing them with theprotection. A number of such employers in theconstruction sector, harbour workers and self employedworkers register voluntarily and once registered theyremain under Jamsostek as there is no option towithdraw.
Since 1987 enterprises in the construction sector havebeen compulsorily required to register with Jamsostekfor employment injury coverage under a programknown as JAKOM. The registration has to becompleted before the start of any construction project
irrespective of the number of employees or the totalmonthly payroll. Employers in this sector are classifiedinto Group 5 and are required to pay the highest rateof contribution that is 1.74%. The contribution ispaid on the total value of the construction project andnot on the wages of the employees hired to completethe project. The mechanism for enforcement of thiscompulsory requirement is exercised through theauthority issuing the contract, which does not permitwork to commence prior to registration. Similarly,protection has been extended to transport workers inMakassar through their association. The associationcollects Rp.1,690 per member per day for coverageof the contingencies of employment injury, death,medical and old age. In addition workers employed atthe harbour are also covered through specialarrangements through their unions and at ratescalculated by Jamsostek. Many other groups are alsobeing considered for coverage through specialarrangements but details of such coverage were notmade available. There seem to be no legal provisionsfor such new instruments of coverage, although theAct permits voluntary membership. The provisions areequivalent to group insurance coverage provided byprivate insurance companies which tends to reinforcethe public view that Jamsostek is a private insurancecompany. This process, if continued, may lead to theproliferation of different micro schemes with varyingprovisions creating a potential harmonization problemand possibly affecting portability. However, the prosand cons of the extension of coverage to excludedgroups is discussed more fully in Part III of thisPublication.
Employees covered
The provisions in the Act provide for coverage of allemployees receiving wages and working with liableemployers. Employees employed under a contract ofservice are covered irrespective of their employmentstatus be it permanent, casual or temporary. Themethod of calculating the wage of the employee thatis monthly, daily, an hourly rate or piece rate is also notmaterial in determining the coverage of employees.Hence, theoretically and as provided in the legislationall workers in the private sector, who are directlyemployed or employed through contractors should beregistered for coverage for employment injury byJamsostek.
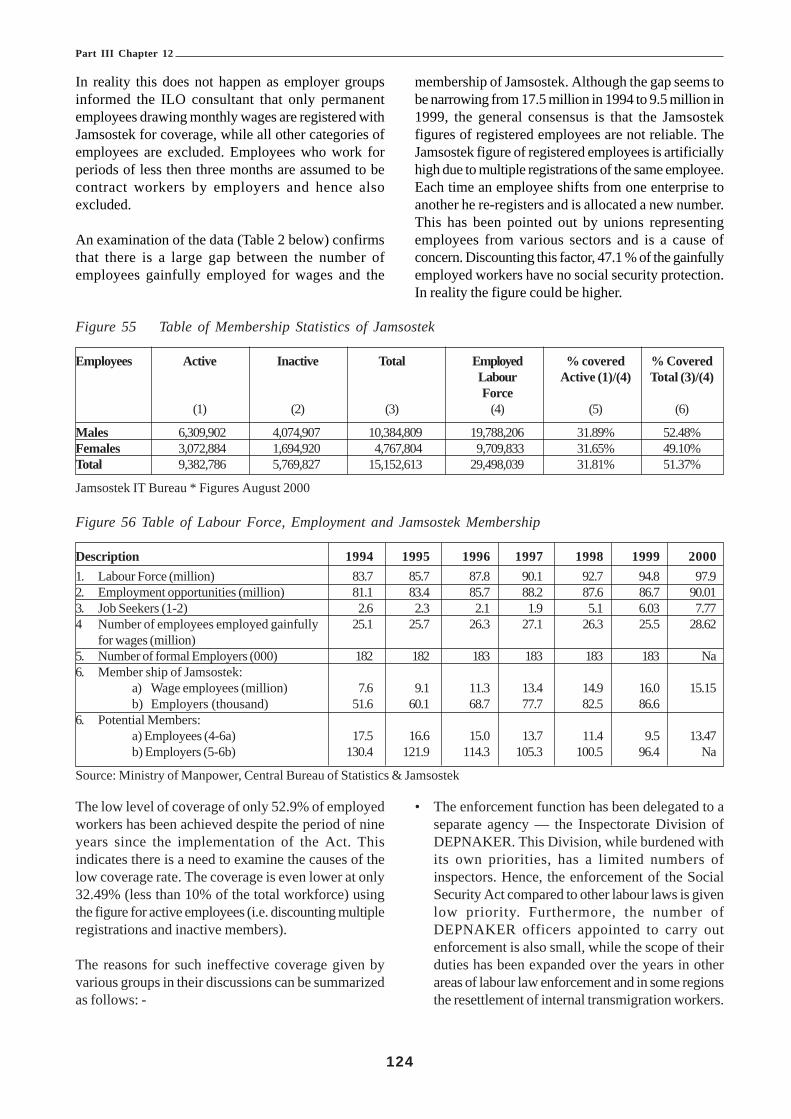
Part III Chapter 12
124
In reality this does not happen as employer groupsinformed the ILO consultant that only permanentemployees drawing monthly wages are registered withJamsostek for coverage, while all other categories ofemployees are excluded. Employees who work forperiods of less then three months are assumed to becontract workers by employers and hence alsoexcluded.
An examination of the data (Table 2 below) confirmsthat there is a large gap between the number ofemployees gainfully employed for wages and the
membership of Jamsostek. Although the gap seems tobe narrowing from 17.5 million in 1994 to 9.5 million in1999, the general consensus is that the Jamsostekfigures of registered employees are not reliable. TheJamsostek figure of registered employees is artificiallyhigh due to multiple registrations of the same employee.Each time an employee shifts from one enterprise toanother he re-registers and is allocated a new number.This has been pointed out by unions representingemployees from various sectors and is a cause ofconcern. Discounting this factor, 47.1 % of the gainfullyemployed workers have no social security protection.In reality the figure could be higher.
Figure 55 Table of Membership Statistics of Jamsostek
Employees Active Inactive Total Employed % covered % CoveredLabour Active (1)/(4) Total (3)/(4)Force
(1) (2) (3) (4) (5) (6)
Males 6,309,902 4,074,907 10,384,809 19,788,206 31.89% 52.48%Females 3,072,884 1,694,920 4,767,804 9,709,833 31.65% 49.10%Total 9,382,786 5,769,827 15,152,613 29,498,039 31.81% 51.37%
Jamsostek IT Bureau * Figures August 2000
Figure 56 Table of Labour Force, Employment and Jamsostek Membership
Description 1994 1995 1996 1997 1998 1999 20001. Labour Force (million) 83.7 85.7 87.8 90.1 92.7 94.8 97.92. Employment opportunities (million) 81.1 83.4 85.7 88.2 87.6 86.7 90.013. Job Seekers (1-2) 2.6 2.3 2.1 1.9 5.1 6.03 7.774 Number of employees employed gainfully 25.1 25.7 26.3 27.1 26.3 25.5 28.62
for wages (million)5. Number of formal Employers (000) 182 182 183 183 183 183 Na6. Member ship of Jamsostek:
a) Wage employees (million) 7.6 9.1 11.3 13.4 14.9 16.0 15.15b) Employers (thousand) 51.6 60.1 68.7 77.7 82.5 86.6
6. Potential Members:a) Employees (4-6a) 17.5 16.6 15.0 13.7 11.4 9.5 13.47b) Employers (5-6b) 130.4 121.9 114.3 105.3 100.5 96.4 Na
Source: Ministry of Manpower, Central Bureau of Statistics & Jamsostek
The low level of coverage of only 52.9% of employedworkers has been achieved despite the period of nineyears since the implementation of the Act. Thisindicates there is a need to examine the causes of thelow coverage rate. The coverage is even lower at only32.49% (less than 10% of the total workforce) usingthe figure for active employees (i.e. discounting multipleregistrations and inactive members).
The reasons for such ineffective coverage given byvarious groups in their discussions can be summarizedas follows: -
• The enforcement function has been delegated to aseparate agency — the Inspectorate Division ofDEPNAKER. This Division, while burdened withits own priorities, has a limited numbers ofinspectors. Hence, the enforcement of the SocialSecurity Act compared to other labour laws is givenlow priority. Furthermore, the number ofDEPNAKER officers appointed to carry outenforcement is also small, while the scope of theirduties has been expanded over the years in otherareas of labour law enforcement and in some regionsthe resettlement of internal transmigration workers.
Part III Chapter 12
125
The Inspectorate being responsible for theenforcement of a host of other laws mentionedabove and their provisions, leave them little or notime to concentrate or pay due attention to theenforcement aspects of the Social Security Act.
· The Report on Enforcement and Compliance bythe Department of Manpower and Transmigrationfor 2001 shows that of the 30 provinces,enforcement was carried out in only 11. Thecompliance level is low with almost two thirds ofthe inspected industries defaulting or not complyingin full. Despite such a wide spread non-compliance,action to prosecute is taken against only a handfulof employers. (See Appendix 1 of the ILO Reporton Employment Injury & Death Benefits fordetails).
The Inspectorate Section of the Department ofManpower and Transmigration’s view is thatJamsostek is not able to provide the promised serviceto its clients, nor clear information on the requirementsof the Act. This has led to many employees defaultingon their contribution payments and refusing to registerwith Jamsostek. The question of compliance and astrategy for improvement are discussed more fully inPart I.
Systems For Fixing Rates OfContribution
Employment injury schemes are normally fundedwholly by employers. Broadly there are available threedifferent systems for fixing the rates of contributionsunder employment injury schemes (so that the costsare shared among the totality of employers), namely:• Uniform rates, independent of risk or industry;• Differential rates, by risks or industry, independent
of the actual experience of the individualestablishment; and
• Merit or experience rating, where the rate isfixed or adjusted individually for each establishmenton the basis of the accident record and safetyconditions in the individual establishment.
Uniform RatesUnder this system no account is taken of the risk orhazards in the establishment or in the industry to whichthe establishment belongs. This system is the simplestto apply in practice. Once the contribution rate is fixed,the assessment of the contribution liability for eachemployer may be calculated in the same way as for
other social security branches. Should there be a needto raise the level of funding for the scheme this can beachieved by simply increasing the percentage ofinsurable wages included in the assessment. It hasalso the advantage that the collection of contributionscan be co-coordinated with the collection ofcontributions for other social security branches as andwhen established so that the overall contributionpayable for the full range of the social securityprogramme can also be unified. The need to employqualified staff also will be less — reducingadministrative costs of the social security institutionand for employers. This lower administrative cost wouldapply whether there was a single or several agenciescollecting social security contributions.
Furthermore, under the uniform rates system there isscope for development of better employer-employeerelations since the employer would help the injuredperson to make and process his claim for employmentinjury benefit from the Fund. This may not be thecase under the merit rating system, since under thatsystem the interest of the employer would run counterto that of the injured person in as much as it would bein the employer’s interest to show a lower incidenceof claims entitling him to a reduction in his contributionsto the scheme.
It may be said that this system does not provide for anequitable distribution of charges among the variousestablishments. This raises the question of principleregarding the extent of collective solidarity in socialsecurity. It should be observed that in other branchesof social security (e.g. sickness and unemployment)there is some variation in the incidence of interruptionof employment between different industries yet,following the principle of collective solidarity and poolingof risk, uniform rates of contribution are applied,irrespective of risk.
It may also be advanced that the system of uniformrates does not contain an incentive for accidentprevention measures. If such measures encouragingaccident prevention and observance of safetyregulations are to be achieved in an active way, theyshould be done through other means such as aneffective enforcement of safety measures, rather thanthrough the system of contributions assessment. Undera unified system, however, the legislation may containprovisions under which the insurance institution canimpose sanctions such as penalties or the ability to claimreimbursement of benefit payment from establishmentsor undertakings, which have infringed the safety rules

Part III Chapter 12
126
or failed to introduce safety measures. But it may bepreferable to contain such provisions in legislationseparate from the laws creating liability forcontributions. Furthermore, it may be argued that theintroduction of uniform rates may impose a slightlyincreased burden on establishments in the light riskindustries — which also may not be uniform amongthe individual institutions in any industry — such asplantations. Against this the counteracting effects ofincreased administrative, inspection and investigationexpenses, and also higher per capita costs of medicalbenefits, which are caused by the very nature of thedistribution of institutions in sparse and far-flung areas,cannot be overlooked.
Differential RatesUnder this system contribution rates are fixed for eachrisk class or classes of industry. The establishmentsare than assigned to the various classes according tothe activity that they carry out or according to whichbranch of industry they belong. No account is takenof the experience of the individual establishment or ofany measures taken for accident prevention. Underthis system each class is usually considered as anautonomous financial unit, and the statistics andaccounting data are compiled separately for each classwhich permits the fixing of the contribution rate andwhich will assure the financial equilibrium of the class.The contribution rates are subject to periodical reviews,say every three or five years.
The application of this system requires morecomplicated administrative machinery. First, statisticaland accounting data must be available by risk class inorder to be able to review and check up on thecontribution rate fixed for each class. Secondly, thissystem requires qualified and experienced staff forclassification of the establishments. Further, it maymore often be difficult to draw a clear-cut line betweenthe different classes. The question of classificationitself would become more difficult with a larger numberof classes. It requires several years to construct scalesof contributions applicable to different classes of risksbased on a country’s own experience.
Merit or Experience RatingUnder this system the rates are fixed or adjustedaccording to the accident experience in the individualestablishment or on the basis of the accident-preventivemeasures taken by the establishment.
This system is usually based on a schedule orclassification of industries by risk, which indicates a
“normal” or “average” rate of contribution for eachclass. The normal rate can then be modified upwardsor downwards within certain limits according to theaccident experience of the individual undertaking and/or according to the safety measures taken or generalsafety conditions prevailing in the establishment. Theapplication of the system of merit or experience ratingis most likely to result in great variations of thecontribution rates between the different categories ofestablishments and, in consequence, more complicatedenforcement procedures.
The merit rating system may be applied to all theestablishments covered or it may be applied only toestablishments over a certain size. The system isapplied to small establishments mainly when the meritrating is made according to prevention measures takenor to safety conditions in the individual establishments.When the rating is made according to experience, theapplication is usually limited to establishments over acertain size, say establishments with over 100employees, where chance variations play a smaller roleand statistical data are more significant.
The administration of a system based on merit orexperience rating requires very elaborate and smoothworking machinery. All establishments have to beclassified individually, all records and statistics have tobe kept individually and highly qualified and specializedpersonnel are required for the assessment of the variousfactors for determining the rates of contribution foreach establishment. Furthermore, decisions onindividual employers’ liability may be a source ofdispute, and sometimes, particularly when the provisionsgoverning the merit rating are not very clear, the fixingof the rate may be somewhat arbitrary. Moreover,when the system is in its early stages and the rulesalso not clear, the personnel responsible for theapplication may also be subject to undue pressure frominterested parties resulting in inequity.
In view of the more complicated administrativemachinery, the merit or experience rating system willgenerally involve higher administrative costs ofoperations such as collection of contributions andenforcement.
Lastly, if this system is stretched to its extreme form,the insurance element (i.e. pooling of risk) woulddisappear and each establishment would in effect payits own accident costs.
The Government of Indonesia has preferred to usethe differential rating system in its modified form for

Part III Chapter 12
127
the contingency of employment injury coverage.Industries are grouped into five categories and the rateof contribution according to each of the categories isas follows: -• Group I 0.24% of monthly wage 19 industries
• Group II 0.54% of monthly wage 29 industries
• Group III 0.89% of monthly wage 99 industries
• Group IV 1.27% of monthly wage 13 industries
• Group V 1.74% of monthly wage 28 industries.
The types of businesses falling within each of theGroups have been listed under the GovernmentRegulation No.14 Year 1993 dated 27 February 1993.It should be noted that:
• The list has not been changed since 1992 despitethe emergence of new industries within the economyin the past eight years (such as the InformationTechnology industry). Manufacture and service ofcomputers and related services have not beenprovided for and are hence notably missing fromthe list;
• There is also ambiguity in the list as products arestated without referring to any process relating totheir manufacture, storage, transport, export ormarketing. The risk of each of the activities isdifferent but there is no provision for this.Furthermore present day companies have operationsthat transcend these boundaries as their businessactivities range across industrial classifications foundwithin the stipulated list;
• There are no legal provisions to determine the basison which each industry would fall within a risk classor the group into which a company should beclassified. No provisions exist providing for changefrom one group class to another in the event thatprograms for improvements in safety have beensuccessful introduced (or refused). Someenterprises have won the annual Golden Award forSafety while others have won the zero accidentawards but their contribution liability remainsunchanged and they continue to pay contributionsaccording to their respective risk group;
• Similarly, the method of determining the rate ofcontribution for each of the Groups is unclear. Therewas no explanation available from Jamsostek onthe formula used to determine the contribution ratefor each of the risk Groups. Apparently, somehistorical data has been used together with privateinsurance formula on risk assessment to determine
the rates of contribution to be charged to ensurethe viability of the fund;
• The procedure is that Jamsostek officers visit anyenterprise submitting a new registration in order todetermine the risk of the industry and subsequentlyinforms the enterprise of the rate to be paid. Thereis no process for appeal against the decision; and
• The main reason for adopting the differential ratesseems to be to influence health and safetyoutcomes. However, there is no evidence thatIndonesia has maximized the beneficial effects ofthe method it has adopted and there has been nochange in the rate of contribution for many years.Jamsostek probably does not have the capacity tolink the incidence of accidents to contribution rates.
The base rate for industries with very low risks hasremained at 0.24% of the monthly wage from 1978 tothe present (2002). Changes to the rates in the othercategories were made in 1993, which led to thereduction of the maximum rate of contribution for highrisk industries in Group 5 from 3.6% to 1.74% of themonthly wage, a 51.7% reduction. It is also clear thatthe average risk category is Group 3, where the largestnumber of products is listed, which could mean thatmost of the employers are contributing at a rate of0.89% of the employee’s monthly wage. It was alsoverbally confirmed that a very small proportion ofemployers pay contributions according to Group 1 &2. It is also noticed that most of the industries listed inGroup 4 and Group 5, with the exception of theconstruction industry, have been improving their safetyrecords. Despite these improvements they continue tocontribute at the higher rates. This has significantlycontributed to the profit margin of the Jamsostek JKKprogramme. A detailed examination of the data, ifavailable, would confirm this view.
Despite the overall reduction of the contribution rates,which was carried out in 1993, this branch ofJamsostek provides the largest profit to theOrganisation. The achieved surpluses or profits do notreflect the true picture of the situation of the numberof industrial injuries at the work place as there isevidence of under reporting of accidents. Also the levelof benefit paid to injured employees is low, asemployers tend to under declare the wages ofemployees further boosting surpluses in theprogramme. Another reason for the surpluses is thatcontractors in the construction sector are charged thehighest rate of contribution based on the total value oftheir contract and not on the wages of the employees.

Part III Chapter 12
128
Table 3 provides the rates of contribution and rates of benefits for the various periods.
Figure 57 Table of Schemes, Contributions and Benefits in Jamsostek
Item 1978-1983 1984-1988 1989-1992 1993-1998 1999 2001
Work accident (%) 0.24-3.6 - - 0.24-1.74 -
Survivors’ plan (%) 0.5 - - 0.3 -
Provident Fund (%0 2.5 - - 5.7 -
Health Care (%) - - - 3.6 -
Promised Interest (%) 6 8 10 10 17
Survivor’s Benefit (Rp) 0.17 mil 0.4 mil 0.7 mil 1.2-2.4 mil. - 3.6 mil
Maximum work Accidenthospitalization costs (Rp) 1.0 mil - 1.5 mil 3.0-4.0 mil - 6.4 mil
Rate of Death Benefit due to work 21.6 times - 28.8 times Times - 42 Timesaccident (Rp) wage wage Wage
Rehabilitation Orthopaedic and Injured - - 140% of - -other devices Employee Cost set by
Rehab. Centre
Source: Bambang Purwoko (1999)
argument that as the incapacity or death resulting froman accident is more important than the cause, thereshould be no distinction in the compensation paid to aninjured worker between work-related accidents andaccidents occurring outside the work environment.While an ‘accident benefit’ would be easier toadminister it would inevitably raise the number of claimsand would need to be an actuarial valuation of theproposals. However, the control of work-relatedaccident claims for the informal sector would be evenmore difficult than for the formal sector and it isrecommended that serious consideration should begiven to widening the scope of accident insurance inthe future.
Should the Government of Indonesia decide to considerconverting the JKK scheme to a broader, accidentinsurance scheme, it would be important to study thepossibility of coordination between such a scheme andthe present ‘travel insurance’ provided by PT JasaRaharja. Although not covered by the terms ofreference of the ILO Project, it is understood that since1964 PT Jasa Raharja has operated a compulsory, thirdparty insurance for road and other travel accidentsunder the supervision of the Ministry of Transport &Communications and Ministry of State-OwnedEnterprises. The main features of the scheme are thatthe victims of travel accidents (whether by Air, Sea,
The ILO Report recommended that considerationshould be given to the introduction of a uniform rate ofcontribution due to the following reasons:• Lower administration costs;• Promotes solidarity amongst the employers.
However, employers who are in Group I and II mayhave to pay a higher rate and consequently incurhigher labour costs. This group of employers wouldoppose the proposal with arguments that they weresubsidizing the employers who were in the higherrisk groups or had no proper safety program in place.It could be argued that the companies in Group IVand Group V are large and over time have establishedbetter safety standards resulting in a lower rate ofaccidents;
• Furthermore, employment injury includes commutingaccidents for all workers and the risk of its occurrenceis uniform irrespective of the industry or the riskGroup; and
• The other benefit is the simplicity of the system andthe ease of implementation. Employers andemployees will understand the system easily.
The Case for Accident Benefit
The investigation of employment injuries, in order toconfirm in cases of doubt that the injury is indeed work-related, is administratively expensive. There is an

Part III Chapter 12
129
Rail or Road, etc.) are covered for limited medicalexpenses, death and disablement (maximum of Rp.10million for death, Rp.5 million for medical). Passengersand pedestrians are covered and also the driver of anyvehicle involved in a traffic accident, provided he orshe has a valid licence to drive. Damage to vehicles isnot, however, included. The insurance is funded by alevy on each public transport ticket sold and from acomponent in the annual registration of motor vehicles.It is further understood that any payment from PT JasaRaharja may be made in addition to any entitlementunder the Jamsostek scheme. The effect of this is thatmedical expenses may be payable within the total ofRp.5 million limit plus the JKK limit of Rp. 6.4 million.It is not clear whether provision exists for effectiverecovery, by Jamsostek or PT Jasa Raharja, of the fullamount paid by way of compensation from anyseparate, private motor vehicle insurance that maycover the accident in question. However, anecdotalevidence suggests that many drivers in Indonesia donot possess legal licences to drive and that many mayalso not have taken out motor vehicle insurance.
Should it be decided to review the concept of accidentinsurance, it may be that some strengthening ofenforcement of private, third party insurance is possible— possibly by making the annual renewal of vehicleregistration dependent upon evidence of suchinsurance. This would need to go hand-in-hand withimproved enforcement (by the Traffic Police) ofvehicular registration.
Many countries also have sickness insurance, inaddition to employment injury or accident insurance.In some the rates of cash benefit are higher for work-related accidents than for ordinary sickness whichcomplicates administration of such benefits forincapacity and introduces the need for investigation ofcases of doubt. The ILO Consultant considers thatthe simplest system to operate is one where anyincapacity for work is compensated, irrespective ofthe cause. However, should such an incapacity benefitbe considered for Indonesia in the future, the planningwould have to take account of the inevitably higherincidence of claims and an actuarial valuation of theprovisions, including the incidence and duration ofmorbidity, would be necessary.
JKK Scheme BenefitsThe following benefits are available to workers injuredat work or suffering from an occupational disease:• The cost of transportation;
• The cost of medical examination, treatment, and/orhospital care;
• The cost of rehabilitation;• Cash allowances which consist of the following:
! Temporary disablement allowance;! Permanent partial disablement allowance;! Permanent total disablement allowance; and! Death allowance.
Entitlement to any of the benefits is dependant on theoccurrence of an ‘Employment Injury’, which is definedas an accident arising out of and in the course ofemployment, including diseases arising out ofemployment and accidents on the way from theresidence to the place of work and back to theresidence via the usual and reasonable route. Basedon this definition an ‘occurrence’ can be separatedinto three categories namely: -• An accident at the work place or otherwise that is
directly related to the nature of the employment. Thisis the most common scope of coverage found in allsocial security schemes:
• An occupational disease arising out of theemployment. Attachment No.22 to the PresidentialDecree lists 31diseases where compensation wouldbe payable. The list is not exhaustive and nor is it inline with accepted international lists. There is alsono time limit given for the emergence of occupationaldiseases, length and level of exposure to the agentsand elements causing the disease; and
• Travel accidents that occur while travelling to workor on the return journey following the usual route.The coverage is limited, as commuting duringauthorized meal breaks for purposes of taking a mealis presently not covered. The area of commutingaccidents should be restricted as provided in thepresent Law and due consideration should be givento many other situations: such as travelling to receivemedical care, and all other travel related to the natureof a person’s work.
Employees who suffer an employment injury, or thedependants of a deceased employee, are paid theirbenefits as a lump sum. However, the elucidationprovided to Act No. 3 states the following: “Basically,payments of these benefits are provided on aperiodic basis, with the intention that the employeesand their families could meet a portion of theirnecessities of life” There is also a statement that theseperiodic benefits could be paid as lump sums. Theoriginal intention was to pay benefits periodically butthis was changed to lump sum payments.

Part III Chapter 12
130
The weaknesses of a lump sum compensation foremployment injury are:
• Lump sum payments have the inherent weaknessthat they do not provide life long guarantees to therecipients of the benefit;
• Injured employees, dependant widows and childrenof employees, normally exhaust the lump sumsreceived within a short period of time;
• The money received is normally spent onconsumption expenditure leaving little or none forthe future needs of the employee or the dependants;
• There is also the danger that the lump sums maynot be utilized for the benefit of seriously injuredpersons as the nature of the disablement mayprevent the management of their own finances;
• In the case of widows the probability of beingcheated by relatives and others cannot bediscounted where the literacy level of the widow islow;
• The normal inclination to consume is compoundedby the fact that the quantum of benefit itself is low.The average lump sum benefit received is low, dueto employers paying Jamsostek contributions on thebasis of wages declared at a lower level than thatactually paid. Since Jamsostek computes the amountof the lump sum on the basis of last wage paid priorto the many injured employees receive benefit lowerthan their legal entitlement. This has contributed tothe benefits being inadequate, especially whereneeded to support the injured worker for a longperiod or in the event of his or her death; and
• Table 4, showing the average amount of injurybenefit paid, illustrates the inadequacy of thecompensation.
Figure 58 Table of Amount of Benefit Expenditure& Number of Cases
Year No. Of Total Amount perCases Expenditure Case
(Rp.Million) (Average)1997 101,414 78,686. 578,7041998 92,177 81,950. 889,0541999 84,168 91,622. 1,088,5632000 99,843 105,158. 1,053,2302001 (June) 54,970 61,156. 1,012,435
Data from Jamsostek August 2001
The cost of transportation reimbursed by Jamsostekfor land or river transportation to hospital is a maximumof Rp.150,000. In the event there is a need to transport
the injured employee by sea the maximum amount ofreimbursement is Rp.300,000 while the rate for airtransport is Rp.400,000. In the event that treatment insevere cases is available only at a hospital distant fromthe site of the accident, these sums may be inadequate.
The maximum medical cost for treatment of aninjured employee reimbursable is Rp. 6,400,000. Thiscost is limited to the payment of medical fees,medicines, surgery, X-rays, and laboratory tests.Treatment may be obtained at community health centresor Public Hospitals in normal ward class. Treatment isprovided for dental and ophthalmic services while theservices of authorized traditional medicine providersare also accepted. The maximum medical benefithas been increased from October 2000 but is stillinsufficient. The administrative provisions are alsorestrictive as Jamsostek has outsourced its medicalcoverage provision to health management organizations(HMO) which control the treatment costs and thehospitals where treatment is to be provided. Employersand employees at workshops and at separate meetingsreported that Jamsostek members received poortreatment and lower priority at hospitals due to thecontrols and as a result of late payments to them byJamsostek.
Rehabilitation Costs are reimbursed for the purchaseof artificial limbs and other devices in accordance withthe cost guidelines set by the Professor Doctor SuharsoRehabilitation Centre Surakarta. The rehabilitation costis only given once and is equivalent to 140% of theguidelines. This benefit is considered to be grosslyinadequate as it is given only once ¾ without provisionfor replacement or repair of artificial limbs or otherprosthetic devices. The guidelines do not take intoconsideration developments in the field of rehabilitation,referring only to basic, functional prosthetic appliances.An additional drawback is that the injured employeehas to pay for the required devices in advance, beforebeing able to claim reimbursement.
Temporary Disablement Benefit is paid to an injuredemployee for a maximum period of 12 months. Thereplacement rate for the first four months is 100% ofthe monthly wage, 75% for the following four monthsand finally 50% for the last four months. On averagean injured employee receives 75% of the last drawnwage. The benefit is paid by the employer and thetotal amount is then claimed from Jamsostek. Thismethod of compensation favours those with minorinjuries by providing full replacement rates, whilepenalizing employees with severe injuries. Such high

Part III Chapter 12
131
replacement rates do not encourage injured employeeswith minor injuries to return to work as soon as theybecome fit, especially during the first four monthsfollowing the accident. There is also a limit to the periodof compensation and any injured employee still in needof medical treatment or recuperation after 12 monthsis denied further compensation. The employer at thisstage can also dismiss the worker in accordance withthe provisions of the Labour Laws.
The lack of a proper system of data collection inJamsostek leads to the inability to determine theaverage number of days of medical leave of injuredemployees. Although reimbursement payments toemployers are based on the number of days of medicaldisablement the data is not captured electronically.Recommendations are made without supportingdetailed data for purposes of analyzing the relativeexperience of the present scheme.
Permanent Disablement Benefit, known as‘Disability Benefit’, is paid for partial and totaldisablement. The percentage of partial and totaldisability is listed in Attachment II of the Act and isused as a guide by the doctor treating the injuredworker and by Jamsostek to determine the loss ofearnings capacity. On 1st October 2001 the Governmentrevised the 1993 formula for calculating lump sums,increasing the number of months wages’ used tocalculate the compensation from 60 to 70 months.Based on the assessment of loss of earnings capacitythe lump sum is calculated by multiplying theassessment with the last drawn wage and multipliedby 70. As the maximum rate of permanent totaldisablement is 70% of seventy months’ wages,effectively an injured employee who is totally disabledreceives 49 months’ wages.
An additional Rp. 1,200,000 is paid for permanent totaldisablement, irrespective of the wage of the injuredemployee. Assuming a minimum wage of Rp. 500,000,the Rp. 1,200,000 additional payment is equivalent to alittle over two and a half months’ wages. Thus thelump sum method of compensation is roughly equivalentto 51.5 months’ wages (just over 4 years) — relativelyshort considering the increasing life expectancy inIndonesia.
Dependants’ Benefit (in respect of employment injury)is paid as a lump sum to the widow(er) or otherrelatives of the deceased employee in the event of anemployment injury. The total amount paid is equivalentto the sum of 60% of 70 months wages and an additional
Rp. 1,200,000. This represents 24 monthly paymentsat a rate of Rp. 50,000 per month. The paymentrepresents three and a half years’ wages for thedependants. This payment is received by widows andwith the life expectancy of females in Indonesia rising,this payment is clearly insufficient to provide protectionfor a significant period, especially where the benefit iscalculated on an artificially low wage.
Funeral Benefit: expenses amounting to Rp.600,000are paid to the relatives of employees and in certaincases to the employer or person who has paid theexpenses of the funeral. The amount given to coverthe expenses seems to be low and there werecomplaints that it does not provide adequately for amodest decent funeral.
Death Benefit SchemeDeath Benefit (in respect of death due to any cause)is also paid as a lump sum to the relatives of a deceasedemployee irrespective of the cause of death. However,the death must occur while the employee is inemployment — so retired or unemployed workers areexcluded. The amount paid is a flat rate sum of Rp.3,000,000. The rate of contribution paid by the employerfor this contingency is 0.3% of the monthly wage. Inaddition a Funeral benefit of Rp. 600,000 is also paidto the family. There are inequalities in the system ofbenefit provision as:• The family of an employee who newly joins the
enterprise is entitled to the benefit without havingcontributed, while the family of an employee forwhom contributions have been paid over a long periodwill not get the benefit if the employee dies afterretirement or while unemployed;
• Contributions are wage based while benefits are flatrate payments. This makes the benefit inadequatefor the families of employees earning high monthlywages; and
• The lump sum of Rp. 3 million does not provide long-term protection. At average minimum wages, thepayment is equivalent to 8.6 months’ wages.
Implementation And Experience OfThe SchemesStatistics provided by Jamsostek for the employmentinjury scheme show that contributions collected exceedbenefits payments and the ratio of benefits to collectionshas declined steadily from 53.95% in 1994 to 42.29%in year 2000. However, the amount paid out hasincreased from Rp.35.482 million to Rp.102,440 million.Details of the experience are given in Table 5.

Part III Chapter 12
132
Figure 59 Table of Employment Injury Contributions and Benefit Data 1994- 2001
Year Cases Contributions Benefits(Rp.) Change Change Change Ratio(Rp.) (Rp.) Cases% Contributions Benefits %
% %1994 64,577 65,771,000,233 35,482,884,188 22.71 5.72 32.90 53.951995 65,949 97,474,918,167 40,485,876,020 2.12 48.20 14.10 41.531996 82,066 112,828,488,833 50,312,692,864 24.44 15.75 24.27 44.591997 95,759 148,306,145,068 71,144,314,315 16.69 31.44 41.40 47.971998 88,595 164,289,413,670 75,120,269,613 -7.48 10.78 5.59 45.721999 82,456 193,141,087,437 87,694,598,285 -6.93 17.56 16.74 45.402000 98,902 242,251,594,478 102,439,839,461 19.95 25.43 16.81 42.29200131 54,447 150,916,481,239 59,639,500,271 - - - 39.52
Jamsostek Technical and Customer Service Division August 2001
The numbers of death and permanent total disablement cases under the scheme were not available. These figuresare given under the old age benefit scheme where the balances of the individual employees have been paid outdue to death or disablement. These figures do not include employees who may have no balances. The figures arelow and do not reflect the real experience of the employment injury scheme.
Figure 60 Table of Number of Cases of Withdrawal
Year Normal Deaths Deaths (Employment Injury) Permanent Total Disablement1994 7,494 625 1501995 6,678 570 971996 8,020 393 691997 12,052 1,893 7451998 12,081 1,563 3511999 10,742 1,376 582000 9,382 1,283 382001 6,982 635 22
The program to cover building contractors for employment injury is known as JAKOM. This program has an evenlower ratio of benefits to contributions. The number of cases of accidents has declined drastically while contributionincome has seen a slower decline leading to excessive profits from this program.
Figure 61 Table of Income and Expenditure – Employment Injury for Construction Industry
Year Cases Contributions Benefits Ratio % % Change % Change % ChangeCases Contributions Benefit
1994 4,600 32,287,722,734 5,054,818,500 15.66 -7.98 15.90 11.571995 4,536 36,756,622,717 5,495,480,339 14.95 -1.40 13.84 8.721996 5,239 49,678,458,869 6,919,557,159 13.93 15.49 35.16 25.911997 5,024 48,924,745,793 7,251,101,404 14.82 -4.09 -1.52 4.791998 3,113 26,516,661,724 5,414,315,996 20.42 -38.04 -45.80 -25.331999 1,712 31,800,745,057 3,927,650,189 12.35 -45.00 19.93 -27.462000 941 32,926,346,778 2,717,851,559 8.25 -45.03 3.54 -30.802001 523 6,211,948,786 1,511,096,163 18.40 - - -
31 2001 Data from January to 9 June only

Part III Chapter 12
133
The experience of the Death Benefit component ofthe program shows a rising trend in the number ofdeath claims, significant rise in contributions receivedand a moderate increase in the benefit payments. Thebenefit to contributions ratio has remained below 30%
resulting in surpluses from the program. The totalnumber of death benefit cases for the period 1994 to2001 was 88,559, while those covered under old ageprotection was 73,411.
Figure 62 Table of Death Benefits by Cases, Contributions and Benefits
Year Cases Contribution Benefit % Change % Change % Change Ratio %Cases Contribution Benefit
1994 6479 28,206,508,884 8,253,200,000 10.28 13.35 28.20 29.261995 7143 43,072,835,124 8,569,000,000 10.25 52.71 3.83 19.891996 7899 48,294,930,957 9,660,471,000 10.58 12.12 12.74 20.001997 9074 62,892,895,815 11,160,019,000 14.88 30.23 15.52 17.741998 10729 69,926,812,097 12,874,407,000 18.24 11.18 15.36 18.411999 17575 82,126,938,369 21,615,300,000 63.81 17.14 67.89 26.322000 16817 102,489,541,402 24,652,336,000 -4.31 24.79 14.05 24.05200132 12843 64,822,517,715 18,991,492,800 - - - 29.30
Recommended Benefit, Contributionand Administration Structure
The ILO Consultant advanced the followingrecommendations:
• The benefit structure of the scheme should bechanged and a more comprehensive package ofbenefits with periodical payments should beintroduced. The method of determining the level ofbenefits and the payment as a lump sum should bechanged to be consistent with social securityprinciples of life long protection to persons covered.
• The concept of employment injury should beextended to provide protection during travel duringauthorized meal beaks as well as other work-relatedtravel.
• Consideration should be given to changing the scopeof the scheme to include ALL accidents, whateverthe cause. The possible coordination with the travelaccident insurance administered by PT Jasa Raharjashould also be considered.
• The list of occupational diseases should be updatedand new and emerging diseases added to the list.Protection against occupational diseases should beextended to cover the employee for a period of sixtymonths (60) after leaving the industry and for a periodexceeding that with medical evidence andcertification.
• The rate of compensation for temporary disablementshould be set at a uniform rate of 80% of the average
wage for the three months immediately precedingthe employment injury. This rate should apply forthe duration of the temporary disablement. Thebenefit should be payable from the fourth day theemployee is certified medically unfit to work. This isin accordance with the ILO Convention requiring awaiting period of three days before thecommencement of payment of temporarydisablement. The employer should be responsible forthe payment of wages during this period. The lowerreimbursement rate encourages the employee toreturn to work early, while a uniform rate is equitableto all employees. The length of temporarydisablement should not be limited. During the periodof disablement the employee should not be entitledto both the salary from the employer and temporarydisablement benefit from Jamsostek.
• Employers should be entitled to dismiss workers onlyafter twelve months following the occurrence if theemployee continues to be medically certified as unfitfor work. The employer should continue to makepayments of full wages to the employee for the firstfour months of this period and be entitled to claimreimbursements of up to the 80% from Jamsostek.After that initial four-month period, the injuredemployee should receive only temporary disablementbenefits from the organization upon production of amedical certificate. This process should continue untilthe date on which the employee is certified fit forwork or is able to claim permanent disablementbenefit.
32 2001 Data from January to 9 June only

Part III Chapter 12
134
• Permanent disablement benefit should be payableon a periodic basis for all cases where the loss ofearnings capacity has been assessed as 20% or more.However, the injured employee could be given anoption to commute one fifth of the periodic pensioninto a lump sum to assist the employee to adjust toreduced income. The remainder of the employee’speriodic pension would be paid for life and continueto be paid to the dependants if the injury results indeath. All other injured employees with assessmentsof below 20% should receive lump sum payments.
• The rate of monthly pension for permanent totaldisablement should be 80% of the average wage forthe three months immediately preceding theemployment injury.
• Lump sums should be computed by multiplying theaverage daily rate of permanent total disablementby the assessment of loss of earning capacity andthe actuarial present value factor. The factor shouldbe calculated actuarially taking account of the ageof the injured employee at the time of the claim; theadjusted life expectancy prevailing; the expected rateof interest; and the rate of return on the fund.
• The method of computing the lump sum paymentfor assessment of loss of earnings capacity of 20%or more should be one fifth multiplied by thepercentage loss of earning capacity multiplied by 80%of the average daily wage in the preceding threemonths (1/5 X % loss of earnings X 80% of AverageWage over 3 months preceding accident X ActuarialFactor). The daily rate to be calculated by dividingthe average monthly wage by 26.
• Dependants’ Benefit should be payable to thewidow or widower and all children. The widow orwidower should receive a pension for life but suchpayments should cease upon death or remarriage.Children should receive benefit up to age 18 yearswith entitlement to benefit ceasing on death ormarriage before that age. The definition of childrenneeds to be broadened to encompass natural, adopted,illegitimate and step children.
• The benefit should be equal to 80% of the averagedaily wage for the three months immediatelypreceding death as a result of an employment injury.The daily rate should be calculated by dividing theaverage monthly wage by 26. The benefit may beshared proportionately between the dependants.E.g.the widow, widows or widower receive threefifths; and the child(ren) two fifths. In the event thewidow or widower dies or remarries the childrenshould receive three fifths of the benefit.
• In the event the deceased does not leave any widow/widower or children the benefit should be paid toother relatives as follows:
! The parents of the employee — benefit for life ata rate of half the average daily rate calculatedabove;
! Grand parents of the deceased employee — inthe event no parent is alive at the time of the death,the rate should be the same as that for parents;
! Brothers and sisters — may all receive benefitsat a rate of three-tenths of the average daily rateup to age 18 or as long as they are not married.The amount to be equally divided amongst them;and
! Any other relative of the deceased employee maybe considered if none of the above listed relativesare entitled to the benefit. The inclusion of such arelative may be subject to the condition that thedeath has caused hardship to the relative and canbe approved only by the Minister responsible forsocial security.
• Funeral Benefit should be paid to the dependantsof the deceased to cover the costs of providing adecent burial. This benefit should be paid as soon aspossible and the present provisions and method ofproviding the benefit should be followed. Themaximum benefit payable needs to be reviewed inline with current costs in each region.
• Medical Benefit in respect of occupational injuriesand diseases should be the responsibility ofJamsostek. An injured employee meeting with anemployment injury should be entitled to medicaltreatment throughout the period he or she is sufferingfrom disablement as a result of the injury or disease.The kind, level and scale of such benefits to bedetermined by the organization after taking intoconsideration the availability of such facilities. Theorganization can make arrangements with the serviceproviders to ensure adequate and comprehensivemedical treatment is provided to the injuredemployee. The scale of the medical treatment to beprovided should ensure easy and quick recoveryminimizing permanent disablement. Such treatmentmay include microsurgery and the use of implants.
• Constant Attendance Allowance Benefit. Aninjured employee who is permanently and totallydisabled should be entitled to a constant attendanceallowance equivalent to 40% of the pension payablewhere he or she requires the constant attendance ofanother person. This allowance should be payableto the claimant for life together with the monthlypension.
• Facilities for Physical and VocationalRehabilitation should be provided to an employeewho suffers from permanent disablement. Theorganization should provide prosthetic or otherappropriate appliances free of charge. The total costs

Part III Chapter 12
135
of such devices to be borne by the organizationtogether with the cost of arrangements for their fitting,repairs and replacement. The appliances should berenewed or repaired, when necessary, free ofcharge. The organization should also makearrangements for physical or vocational rehabilitationof the injured employee. The employee should bereimbursed for any reasonably travelling expensesincurred for the fitting or maintenance of prostheticor other appliances.
Recommended Administrative Changes
The ILO Consultant recommended the followingimprovements to the arrangements for enforcementof the provisions of the Act:
• Employers should be required by Regulations tomaintain a Register of Employees, which will containthe following particulars:! Name of Employee;! Social Security Identification Number;! Date employment Commenced;! Date Employment Ceased;! Basic Wages;! Other Allowances;! Total Wages;! Total Contribution Deducted from employee;! Total Contribution paid; and! Signature of the employee.
• Particulars in the Register need to be updatedmonthly. The Register should be kept for a period offive years from the date of the last entry. TheRegister should be presented for inspection at anytime to a social security or labour inspector. TheRegulations should provide for the enterprise to beresponsible for the accuracy of all the entries.
• Regulations should provide for a separate Registerof Accidents to be maintained and kept in a placeaccessible to all workers. The register should recordall employment injuries that occur to any employeeworking on the premises. The Accident Registershould record the following particulars:! Serial Number;! Name of Injured Employee;! Social Security Identification Number;! Date, Time and Place of the Accident;! Name of Clinic or Hospital that Treated the Injured
employee;! Names of Witnesses;! Type and Location of Injury;! Brief Account of how the accident occurred and
any First Aid treatment given.
• The employer, supervisor or person authorized toadminister First Aid, should make entries into theAccident Register as soon as possible after theaccident and no later than a period of two days. TheRegister should be maintained by the enterprise fora period of five years after the final entry.
• Accident Reporting:! The employer should be required to report all
accidents where there is stoppage of work andwhere entitlement to a temporary disablementpayment is likely to arise. Accidents should bereported using the prescribed forms to Jamsostekwithin 48 hours from the time the employerreceives notice of the accident;
! The present form for reporting accidents needsto be changed and the system presently in placeshould to be reengineered to account of any ofthe above recommendations regarding newresponsibilities for accepting the reported accidentas an employment injury, verifying the facts ofthe case and the wage of the employee;
! In cases requiring payment the process ofcalculating the benefit and then paying the benefitneeds to be established. Some cases may requireinvestigation before being accepted for payment;
! Payment of periodic benefit will require separatedivisions for permanent disability calculation, deathbenefit, and funeral benefit; and
! Normally, the approval of cases for payment shouldbe separated from the actual payment process toprevent fraud.
• Recommendations concerning the organizationalarrangements, spread of responsibility, etc. will needto be made in the light of such changes to the benefitprogramme as are accepted by Government andJamsostek and in the light of further technicalassistance with the development of performanceindicators; quality control; internal audit and othermanagement control systems.
• However, consideration should be given to theestablishment of a Benefits unit at headquarters toapprove all long- term payments and maintain themonthly payments to all permanent disablementemployees, widows, children and other relatives. Alllong-term recipients of benefits may be required tomake periodic and legally binding declarationsregarding their status. Pension payments should becontingent upon such a declaration. The Benefits unitwill need to maintain a system for adjustment ofbenefits on a biannual basis in accordance with anychanges to the cost of living index and after anactuarial evaluation.

Part III Chapter 12
136
• The ILO Consultant also recommended thatconsideration should also be given to theestablishment of a Medical and Rehabilitation Divisionwithin Jamsostek to facilitate adequate medicalcoverage for work-injury cases.
• This Division could be responsible for arrangementsmedical care and for the medical service to beprovided promptly to injured employees; for the supplyof the right prosthetic devices to injured employeeswithin a reasonable time at competitive prices andfor monitoring the supply, repair and replacement ofthe prosthetic and other devices. This Division mightalso be responsible for cooperation with vocationaltraining and rehabilitation institutions to facilitate thereturn of injured workers to productive employmentthus minimizing the drain on the fund. However, therecommendations regarding the administration ofmedical care under the employment injury schemeneed to be consistent with any changes in theJamsostek Health Care Programme (see Chapter16).
Recommendations regarding the collection andrecording of personal and social security data arecontained in the Report on Jamsostek Operations andIT Systems (see Part I of this Publication) but theintroduction of a social security scheme to cover thecontingencies of employment injury and deathnecessitates system to collect data on the relativeexperience of the operations of the scheme. Data hasto be collected on the total number of accidents.Reported accidents at work, commuting or occupationaldiseases. Number of cases approved, paid, size andtype of payment. Cause, agent, location of injury,number of days of temporary disablement, permanentdisablement by lump sum, rate of pension, duration ofpayment.
There appears to be no proper provision for claimantsto appeal against benefit decisions, particularlyregarding the quality or quantity of their benefit. Aproper appeals procedure should be established. Thiscould be a dedicated Tribunal to hear appeals oralternatively the proposed Trust Fund might operateas an appeal body. An appeal body should have accessto legal as well as medical advice. It should beindependent from both Jamsostek and there should beright of appeal from decisions of the body on points oflaw.
There may need to be powers delegated to Jamsostekfor the appointment of Guardians for under agedchildren, subject to the practices in Indonesia.
Death Benefit Scheme
This scheme should be improved and incorporated intothe pension scheme so that long-term periodic benefitscan be paid to the dependants of a deceased pensioner.The rate of this pension could be 70% of the retirementpension that would have been payable.
In the event this benefit is to be independent of thepension scheme some contribution qualificationconditions must be set for entitlement to the benefit.These conditions will help ensure that the scheme isnot abused and would remain viable over a long periodof time. There is already an increase in the claims forthis benefit and there could be a further escalation asawareness of the benefit increases.
The ILO Report recommended the following conditionsbe considered:
• The benefit should be paid in the case of death, whilestill in employment, provided there are twelve or morecontributions paid on behalf of the deceased;
• Dependants of employees who die after leavingemployment but before the retirement age of 55 yearsshould have more than five Consideration should begiven to changing the scope of the scheme to includeALL accidents, whatever the cause. The possiblecoordination with the travel accident insuranceadministered by PT Jasa Raharja should also beconsidered;
• Years of contributions paid on their behalf in the tenyears immediately preceding the date of death orshould have contributed for half the period of timebetween the initial registration of the employee withJamsostek and their death; and
• These recommendations are subject to the adviceof the actuary.
Part III Chapter 13
137
CHAPTER 13 MATERNITY PROTECTION
• Determine the present experience with regard to theeffectiveness and equity in the provision of incomeprotection and health care benefits to workingwomen;
• In consultation with employers and workersorganisations, design the framework of a socialinsurance scheme for maternity benefit under whichdirect responsibility for the payment of maternitybenefits would be transferred to a social insurancefund financed by all employers;
• Formulate alternative proposals for meeting the needsof working women;
• Determine the financial structure for such a scheme;
• Consider the possibility for such schemes to providehealth care to mothers and children during thematernity period; and
• Identify the administrative implications for suchschemes.
The study considered that a maternity benefit schemebased on social insurance principles could be financedby a contribution rate of 0.9% of wages. This assumesno increase in overall costs for maternity protection(on this basis employers would save on the costs offunding their maternity benefit obligations from theirown resources or paying for private insurance coverfor this). However, there would be some sharing ofrisk (between employers with and those without femaleworkers) should the project recommendations forunified rate of contribution be accepted. This estimateof contribution level is subject to verification byactuarial valuation. The calculation also assumes thatthe contribution would also cover the cost of healthcare during pregnancy and confinement — withpotential savings to the rest of the health careprogramme.
The Report recommended that entitlement to cashmaternity benefit should be based on contributionqualifying conditions and that a female employee orthe working male spouse of a female claiming thebenefit should have paid at least three contributions inthe nine months preceding the date of delivery. Otherprovisions concerning the number of children in respectof whom maternity benefit might be payable, the periodof entitlement and the medical qualifications couldremain similar to those covered by the GovernmentRegulation. However, in the interests of addressingthe high incidence of maternal deaths during pregnancyor confinement, the possibility of extending health careto all births (i.e. beyond the present limit of three) isrecommended.
Executive Summary
The position of women in the economy has changed inthe last decade and more women are employed andparticipate in economic sectors, in both formal andinformal employment. The structural changes in theeconomy, which led to the emergence and growth ofthe service and manufacturing sectors, provided womenwith employment opportunities. Globalization, changesin the literacy level of women and the availability ofemployment opportunities have influenced the role ofwomen in society and as social and economic partnersin the home. These trends, which are prominent in mostdeveloping countries, require the attention of policymakers to ensure adequate social security protectionof both women and children.
Indonesia is experiencing the effects of these changes.The number of females in the workforce, which was22.1 million and constituted 35.88% of the employedlabour force in 1985, rose steadily to 36.47% in 1995.This trend has continued and by the year 2000 womenconstituted about 38.3% of the employed labour forcemaking them significant partners in economic and socialdevelopment.
Despite these changes at the macro level, womenconstituted only 32.9 per cent of wage and salaryearners. Women are also at a disadvantage in the labourmarket and on average are employed in less skilledjobs that pay a lower wage. Compared to men theyare disadvantaged both in terms of jobs and wages.However, despite these differences the number offemales as a ratio to males in the country, whichremained steady in the past, is expected to increaseby year 2010.
At a national workshop on ‘Restructuring the SocialSecurity System’ held in Jakarta in November 1999views were expressed that the present system ofmaternity protection needed review in order toovercome evasion by employers of their statutoryobligations to pay cash maternity benefit and to avoiddiscrimination against the employment of femaleworkers. It was considered that cash maternity benefitcould be incorporated into the Jamsostek benefitprogramme — as a social insurance benefit — withoutadding to the existing costs of providing payment duringmaternity required by the employers’ liability underGovernment Regulation No. 21 of 1954.
Following that workshop the ILO undertook a Studyof the Feasibility of Improved Maternity Benefits theterms of reference for which were:

Part III Chapter 12
138
Bab 13 Perlindungan Persalinan
Rangkuman Eksekutif
Posisi perempuan dalam perekonomian telah berubahdalam dasawarsa terakhir dan lebih banyak perempuanyang dipekerjakan dan berpartisipasi dalam sektorekonomi, baik dalam pekerjaan yang bersifat formalmaupun informal. Perubahan-perubahan strukturaldalam perekonomian, yang menyebabkan timbulnyadan tumbuhnya sektor pelayanan dan manufaktur, telahmemberikan kesempatan kerja bagi perempuan.Globalisasi, perubahan-perubahan dalam tingkat melekhuruf bagi perempuan dan tersedianya kesempatankerja telah berpengaruh terhadap peran perempuan dimasyarakat dan peran perempuan sebagai mitra sosialdan ekonomi di rumah. Kecenderungan ini, yangmenonjol di sebagian besar negara berkembang,memerlukan perhatian kebijakan pembuat keputusanuntuk memastikan diberikannya perlindungan jaminansosial yang memadai bagi perempuan dan anak-anak.
Indonesia sedang mengalami dampak dari perubahan-perubahan ini. Pada tahun 1985 terdapat 22,1 jutapekerja perempuan. Jumlah ini merupakan 35,88% dariseluruh tenaga kerja yang dipekerjakan pada tahuntersebut dan persentase ini meningkatkan menjadi36,47% pada tahun 1995. Kecenderungan ini terusberlanjut dan pada tahun 2000, perempuan merupakan38,3% dari tenaga kerja yang dipekerjakan, sehinggamereka menjadi mitra yang penting dalamperkembangan sosial ekonomi.
Meskipun ada perubahan-perubahan seperti ini padatingkat makro, perempuan hanya mewakili 32,9 persendari mereka yang bekerja dan menerima upah ataugaji. Perempuan juga berada dalam posisi tidakdiuntungkan di pasar kerja dan rata-rata dipekerjakandi pekerjaan-pekerjaan yang kurang membutuhkanketerampilan dengan bayaran lebih rendah.Dibandingkan pria, perempuan berada dalam posisiyang tidak diuntungkan baik dari segi pekerjaanmaupun upah. Meskipun ada perbedaan-perbedaantersebut, jumlah perempuan dibanding jumlah laki-lakidi Indonesia, yang dulu selalu tetap, diharapkan akanmeningkat pada tahun 2010.
Dalam lokakarya Restrukturisasi Sistem Jaminan Sosialyang diselenggarakan di Jakarta di bulan November1999 muncul pandangan-pandangan yang menyebutkan
bahwa sistem perlindungan persalinan yang ada saatini perlu ditinjau kembali untuk mengatasi upayapengusaha yang mengelak memenuhi kewajibanmereka membayar manfaat persalinan secara tunaisebagaimana ditetapkan undang-undang serta untukmenghindari diskriminasi terhadap perempuan dalampenerimaan pekerja. Jaminan persalinan yangdibayarkan secara tunai dianggap dapat dimasukkanke dalam program manfaat Jamsostek – sebagai suatumanfaat asuransi sosial – tanpa menambah biaya-biayayang saat ini dikeluarkan untuk memberikanpembayaran semasa persalinan sebagaimana dituntutoleh kewajiban pengusaha menurut PeraturanPemerintah No. 21 Tahun 1954.
Setelah lokakarya tersebut, ILO melakukan suatu studimengenai Kelayakan Perbaikan Jaminan Persalinan,yang batasan studinya adalah sebagai berikut:• Menetapkan pengalaman saat ini yang berkaitan
dengan kefektifan dan ekuiti dalam pemberianperlindungan pendapatan dan manfaat perawatankesehatan bagi perempuan bekerja;
• Berdasarkan konsultasi dengan organisasi pengusahadan pekerja, merancang kerangka kerja untuk skemaasuransi sosial di mana tanggung jawab langsunguntuk pembayaran jaminan persalinan akan ditransferke suatu dana ansuransi sosial yang dibiayai olehsemua pengusaha;
• Merumuskan usulan-usulan pilihan untuk memenuhikebutuhan perempuan bekerja;
• Menetapkan struktur keuangan untuk skema-skemaseperti itu;
• Mempertimbangkan kemungkinan bagi skema-skemaseperti itu untuk memberikan perawatan kesehatankepada ibu dan anak selama masa persalinan; dan
• Mengidentifikasi implikasi-implikasi administratifuntuk skema-skema seperti itu.
Studi tersebut mempertimbangkan bahwa suatu skemamanfaat persalinan yang didasarkan pada prinsip-prinsip asuransi sosial dapat dibiayai oleh suatu iuransebesar 0,9% dari upah. Hal ini mengasumsikan tidakadanya kenaikan dalam biaya keseluruhanperlindungan persalinan (di mana atas dasar inipengusaha akan menghemat biaya mendanai kewajibanmanfaat persalinan mereka dari sumber daya merekasendiri atau membayar perlindungan asuransi swasauntuk ini). Kendati begitu, akan ada suatu pembagianrisiko (antara pengusaha dengan pekerja perempuanmaupun tanpa pekerja perempuan) apabila usulan

Part III Chapter 12
139
penyeragaman tingkat iuran diterima. Perkiraan tingkatiuran ini tunduk pada verifikasi yang dilakukan menurutpenilaian aktuaria. Perhitungan tersebut jugamengasumsikan bahwa iuran tersebut juga mencakupbiaya perawatan kesehatan semasa kehamilan danmenanti persalinan dengan penghematan yang mungkindilakukan untuk program-program perawatankesehatan lain yang ada.
Laporan ini menganjurkan supaya hak atas manfaatpersalinan tunai hendaknya didasarkan padadipenuhinya kriteria iuran dan bahwa seorang pekerjaperempuan atau suami (yang bekerja) dari seorangperempuan yang menuntut agar manfaat tersebut
hendaknya telah membayar sekurang-kurangnya tigaiuran dalam kurun waktu sembilan bulan sebelumtanggal kelahiran. Ketentuan-ketentuan lain mengenaijumlah anak yang dapat dicakup oleh pembayaranjaminan persalinan, periode berlakunya hak untukmemperoleh manfaat persalinan dan kualifikasi medisdapat tetap sama dengan yang ditetapkan olehPeraturan Pemerintah. Meskipun demikian, untukmenanggulangi tingginya angka kematian akibatpersalinan baik selama masa kehamilan maupunkelahiran, perawatan kesehatan sebaiknya diperluasuntuk mencakup seluruh kelahiran (yakni, tidakterbatas pada tiga anak saja).
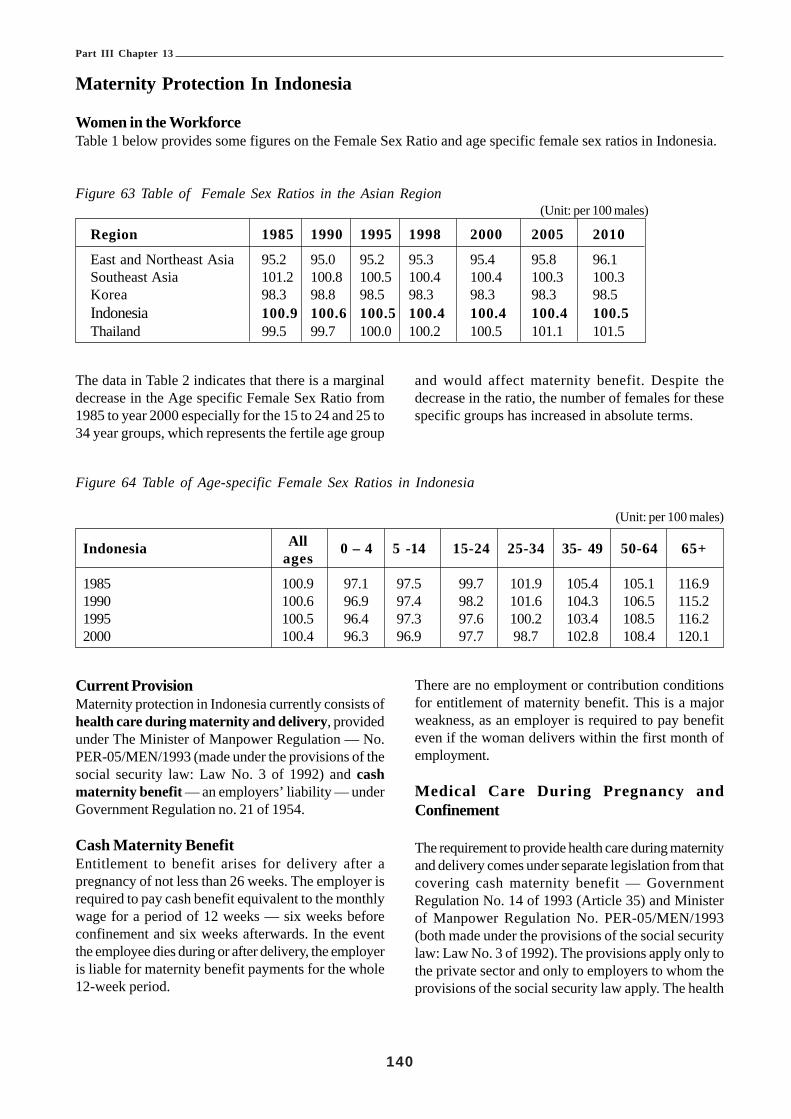
Part III Chapter 13
140
Maternity Protection In Indonesia
Women in the WorkforceTable 1 below provides some figures on the Female Sex Ratio and age specific female sex ratios in Indonesia.
Figure 63 Table of Female Sex Ratios in the Asian Region (Unit: per 100 males)
Region 1985 1990 1995 1998 2000 2005 2010
East and Northeast Asia 95.2 95.0 95.2 95.3 95.4 95.8 96.1Southeast Asia 101.2 100.8 100.5 100.4 100.4 100.3 100.3Korea 98.3 98.8 98.5 98.3 98.3 98.3 98.5Indonesia 100.9 100.6 100.5 100.4 100.4 100.4 100.5Thailand 99.5 99.7 100.0 100.2 100.5 101.1 101.5
The data in Table 2 indicates that there is a marginaldecrease in the Age specific Female Sex Ratio from1985 to year 2000 especially for the 15 to 24 and 25 to34 year groups, which represents the fertile age group
and would affect maternity benefit. Despite thedecrease in the ratio, the number of females for thesespecific groups has increased in absolute terms.
Figure 64 Table of Age-specific Female Sex Ratios in Indonesia
(Unit: per 100 males)
Indonesia All 0 – 4 5 -14 15-24 25-34 35- 49 50-64 65+ages
1985 100.9 97.1 97.5 99.7 101.9 105.4 105.1 116.91990 100.6 96.9 97.4 98.2 101.6 104.3 106.5 115.21995 100.5 96.4 97.3 97.6 100.2 103.4 108.5 116.22000 100.4 96.3 96.9 97.7 98.7 102.8 108.4 120.1
Current ProvisionMaternity protection in Indonesia currently consists ofhealth care during maternity and delivery, providedunder The Minister of Manpower Regulation — No.PER-05/MEN/1993 (made under the provisions of thesocial security law: Law No. 3 of 1992) and cashmaternity benefit — an employers’ liability — underGovernment Regulation no. 21 of 1954.
Cash Maternity BenefitEntitlement to benefit arises for delivery after apregnancy of not less than 26 weeks. The employer isrequired to pay cash benefit equivalent to the monthlywage for a period of 12 weeks — six weeks beforeconfinement and six weeks afterwards. In the eventthe employee dies during or after delivery, the employeris liable for maternity benefit payments for the whole12-week period.
There are no employment or contribution conditionsfor entitlement of maternity benefit. This is a majorweakness, as an employer is required to pay benefiteven if the woman delivers within the first month ofemployment.
Medical Care During Pregnancy andConfinement
The requirement to provide health care during maternityand delivery comes under separate legislation from thatcovering cash maternity benefit — GovernmentRegulation No. 14 of 1993 (Article 35) and Ministerof Manpower Regulation No. PER-05/MEN/1993(both made under the provisions of the social securitylaw: Law No. 3 of 1992). The provisions apply only tothe private sector and only to employers to whom theprovisions of the social security law apply. The health

Part III Chapter 13
141
care programme, of which provision of maternity anddelivery care is part of the package, is administeredby PT Jamsostek. It is funded by contributions payablewholly by the employer of 3% in respect of singleworkers and 6% for married workers.
Under the provisions of Article 2 of GovernmentRegulation No.14 of 1993, employers are coveredcompulsorily by the social security law if they employten employees or more or have a monthly payroll ofnot less than Rp. 1 million. Article 2 also provides thatemployers who provide health care programmes fortheir employees with benefits superior to those of theBasic Health Care Package provided by Regulationsmay opt out of the Jamsostek programme, a provisionthat is not closely regulated. Many employers, coveredby Jamsostek for old age and employment injurybenefits, have opted out of the health care provisions.Employers who are outside the scope of compulsoryJamsostek membership and do not become voluntarymembers must pay for health care from their ownresources or through private insurance.
Under the 1993 Ministerial Regulation the employer isrequired to provide primary medical care to the femaleworker or the spouse of a male worker for the first,second and third child. Jamsostek has determined themaximum cost for delivery to be Rp. 500,000. Femaleemployees have to bear the difference between theactual amount and the maximum amount covered byJamsostek. This difference has risen significantly overthe years — a result of the escalating medical costs.
The minimum period for inpatient care for normaldelivery is three days and a maximum is five days.
A unique provision of the Labour Law of Indonesia isthat female workers, in addition to cash maternitybenefit, are also entitled to two days of paid leave forthe first and second day of their menstrual cycle. Thisprovision could have the effect of saving the employerthe cost of sixteen to eighteen days’ wages during theperiod of pregnancy. However, the provision is inpractice discretionary – many employers allowing onlyone day a month, others no menstrual leave at all. Someemployer groups have expressed the view that suchprovisions in the Labour Laws favoured the femaleworker and resulted in some women working tenmonths in a year and receiving thirteen months’ pay.Annually employers have to provide 12 days of annualleave, up to 24 days of menstrual leave. The paid leave,together with an obligation to pay maternity benefit
should the requirement arise, represents a significantcost to many employers who then choose todiscriminate against women in their hiring policy.
In the event of death during childbirth or due to othercauses the relatives of the female employee are entitledto receive death benefit from Jamsostek. The deathbenefit is equal to Rp. 3,000,000 with an additional Rp.600,000 as funeral benefit.
From discussions the ILO Consultant had with thevarious groups at workshops and individually thereappeared to be differences between the levels ofprotection provided by employers in the differenteconomic sectors. Historically employers in theplantation sector provide better maternity protectionfor their female workers and spouses of male workersthan most others. Female employees in the financialsector generally receive even higher and bettercoverage as their employers provide private insurancecoverage for medical benefits that includes deliverycare. These conclusions about differences in levels ofcover were drawn from comments made by employersand labour union representatives — no adequate orreliable data was available.
Depnaker officials were unable to provide any figureson complaints made by female employees againstemployers who failed to meet their obligations regardingmaternity protection. From the absence of recordedcomplaints, a cursory overview of the presentprovisions would tend to indicate the existing systemworks well without significant problems. This probablyexplains the generally expressed view of employersthat a change in maternity provision was not a priorityand not really necessary. However the views ofwomen’s groups indicate that the present system isfar from satisfactory.
Analysis of the ProgrammeThe number of maternal deaths and the number oflive births in hospitals has been on the increase since1997. Data obtained by the Consultant from theMinistry of Health and other sources are as follows:• The rate of maternal deaths is 450 per hundred
thousand females and is one of the highest rates inthe region (it is understand that this figure has sincebeen reduced);
• The number of maternal deaths per thousand inhospitals is increasing and is a cause of concern;
• The birth rate is estimated to be 22.6 per thousand inthe year 2000 indicating that there is a need for

Part III Chapter 13
142
adequate maternity protection;• The number of females in the work force is
increasing. Statistics of female workers who werepaid wages and have worked in year 2000 was35,032,000 and of these 25,134,000 are between theages of 15 and 44 years. (Table 3);
• However, the number of salaried female workers inAugust 2000 in both the urban and rural sectors was9,709,833. (Table 4);
• The number of maternal deaths in hospitals hasincreased significantly over the years. (Table 5). Asthe data given are only for hospital deaths, wherethe care available is better, the situation could beworst at health care centres and for home deliveriesin the rural sector; and
• There are other complications in the childbearingprocess where prenatal and postnatal care has to begiven consideration. (see Figure 68).
Figure 65 Population 15 Years of Age and over byAge Group and Types of Activity
(in Previous week August 2000)(in millions)
Age Group Working Have Worked Total15 – 19 2.511 .085 2.59620 – 24 4.189 .201 4.39025 – 29 4.707 .159 4.86630 – 34 4.214 .095 4.30935 – 39 4.628 .033 4.66140 – 44 4.050 .262 4.31245 – 49 3.126 .010 3.03650 – 54 2.443 .006 2.44955 – 59 1.729 .008 1.73760 > 2.800 .006 2.806Total 34.399 .633 35.032Badan Pusat Stastik August 2000 / Indonesia StatisticsDepartment
Figure 66 Table of Female Employees Wages: Salaries per Month by Region (August 2000)
Wage/ Salaries per month Urban Rural Total Urban & Rural<100,000 417,355 856,686 1,274,041100,000 – 199,999 1,328,658 1,226,247 2,554905200,000 – 299,999 1,155,274 718,318 1,873,592300,000 – 399,999 948,406 320,086 1,268,492400,000 – 499,999 534,109 174,300 708,409500,000 – 599,999 390,673 85,004 475,677600,000 – 699,999 325,194 126,683 451,876700,000 – 799,999 281,139 131,671 412,810800,000 – 899,999 240,327 101,944 342,271900,000 – 999,999 107,738 31,343 139,0811,000,000 > 195,780 12,899 208,679Total 5,924,653 3,785,180 9,709,833
Badan Pusat Stastik August 2000/ Indonesia Statistics Department
Figure 67 Table of Maternal Deaths and Births in Hospitals in Indonesia year 2001
YEAR TOTAL number of Maternal Deaths Number of Life Births Deaths/ thousand
94 74 18,576 4.096 92 19,210 4.897 632 19,210 7,098 613 63,334 9.799 697 87,028 8.0

Part III Chapter 13
143
Figure 68 Table of Distribution of Patients by Gynaecological Problems in Hospitals during 1999
Gynaecological Problem Total No. Of Cases Deaths Case Fatality RateNo. Of Pregnancies Terminated in Abortions 20,418 168 0.8Difficult Pregnancies 67,327 413 0.6Premature Births 7,256 66 0.9Excessive Bleeding During Birth 6,004 146 2.4Internal Bleeding 1,779 54 3.0Placenta Problems 6,474 70 1.1Pre Eklasima 5,139 54 1.1Total 114,459 976 0.9
Figure 69 Table of Distribution of Patients Re-ceiving Gynaecology Treatment by Age(1999)
Below 14 Years of Age 1,562 1.4%15 to 24 Years of Age 29,424 25.7%25 to 44 Years of Age 57,954 50.6%45 Years and Above 25,514 22.3%TOTAL 114.454 100%
The analysis indicates the need to introduce adequatematernity protection for female workers and spousesof male workers. In particular, there is a need toaddress the following shortcomings in the maternityprotection programme:
• There are several anomalies in the cash maternitybenefit provisions (e.g. a female employee losesentitlement to maternity benefit if she quits or losesher job, while a newly employed female worker orthe spouse of a new male worker would be entitledto benefit within the first month of employment);
• There is no coverage for death during delivery exceptwhere the deceased is in current employment);
• The provisions available are not uniform across theall employment sectors — some groups providingbetter medical coverage then others;
• A major concern is the potential for discriminationagainst the employment of women and the absenceof effective regulation of the provisions. Despite theabsence of registered complaints, anecdotal evidencesuggests that there are many cases where employersdo not meet their statutory obligations regarding thepayment of cash maternity benefit; and
• The medical benefit provided is out-of-date andinadequate.
There are also associated concerns about protectionduring pregnancy and the postnatal period such as the
need to improve Occupational Health & Safetyprovisions for pregnant workers ¾ to safeguard themother and the foetus. These might include regulationsconcerning exposure to hazardous working conditionsand toxic substances, provisions for rest periods duringthe later stages of pregnancy. They might also includeprovision for:
• Child Care and Post-natal Care; and• Breast Feeding Policy (such as time off or provision
for storing breast milk or formula feeds).
RecommendationsIn the view of the ILO Consultant, there is a strongcase for replacing the existing provisions, making cashmaternity benefit available through social insurancefunded by contributions from employers (and possiblya counterpart contribution from all covered workers).Jamsostek could operate such a social insuranceprogramme.
It was not possible during the study to obtain data onthe expenditure by employers on maternity benefitactually paid or the extent to which individual employersmet their liability from their own resources or fromprivate insurance. However, the Consultant estimatedthat a social insurance maternity benefit scheme withall employers sharing the risk (possibly with acounterpart contribution from all covered workers)might be financed by a total contribution of 0.9% ofinsurable wages. This level of contribution would, ofcourse, need to be verified by an actuarial valuation ofthe provisions; the incidence of maternity, etc. andcovered workforce projections. The basis of thisestimate is given below (Table 8 et seq.) and assumesthat the cost of medical care during pregnancy anddelivery would be covered by the scheme. This meansa potential saving to the health care programme andthe opportunity, in due course, to consider equalizing

Part III Chapter 13
144
the present health care component contribution of 3%& 6% to arrive at a unified rate that would be simplerto administer. This possible unified rate would be inline with the social insurance principle of shared risk(in this case the ‘risk’ of providing health care to familymembers being shared between single and marriedworkers).
The main provisions of a possible scheme were outlinedas follows:
• The covered population should be — femaleemployees and spouse of male employees where thewife was working prior to confinement;
• The Maternity Benefit Scheme should provide thefollowing benefits:
! Eligible females might be provided with a cashbenefitequivalent to 100% of the actual averagemonthly wage of the employee in the three monthsimmediately preceding the confinement. Or, in theevent that the actual wage is below the minimummonthly wage for the region or if the employeehas not worked during that period the amountpayable shall be the minimum monthly wage;
! The benefit should be payable for a period of 12weeks (as at present);
! Entitlement to cash benefit might be limited to three(3) children;
! Medical Benefit for pre- and postnatal treatmentwill be provided. Consideration might be given toremoving the 3-child limit in the interests of thesafety of the mother and child. The Consultant,while recognizing the relevance of the ‘3 childlimit’ on controlling the birth rate, considered thatthis might apply only to the cash benefit entitlementnot to medical care;
! Total medical costs for delivery to be borne bythe scheme administered by Jamsostek.Arrangements with the providers of the servicewill be made with agreements on the level, qualityand cost of the service;
! The female employee or the spouse of the maleemployee should be entitled to the benefit if atleast 3 contributions have been made to Jamsostekduring the 9 months preceding the month ofconfinement;
! The spouse of a male worker, where the malehas fulfilled the contribution qualifying condition,should be entitled to medical benefit for theconfinement;
! No cash benefits shall be payable where a womandoes not qualify on the basis of her owncontribution record;
! Consideration might be given to male employeesbeing entitled to three days paternity leave; and
! The employer shall not dismiss a female employeeduring her period of confinement.
It is recommended that the employer should pay thematernity benefit to the claimant and claimreimbursement for the sum paid from Jamsostek. Theemployer should furnish proof of the female employee’sentitlement, delivery after 26 weeks of pregnancy andevidence that the payments have been made to theclaimant.
Any female employee, who is entitled to the benefit,should be able to claim the benefit directly fromJamsostek if she is not employed at the time of herconfinement or if the employer has not paid the benefit.
Non-payment of benefit by an employer shouldconstitute a criminal offence punishable under theprovisions of the social security law.There should be provision in the law for appeals againstdecisions regarding the quality or quantity of benefitpayable under the provisions of the maternity benefitand health care programmes. This should includeprovisions for appeal against refusal of benefit on thegrounds of failure to satisfy the contributionrequirements, employment or medical conditions.
Contributions to finance the maternity benefit schemeshould be payable by all employers, irrespective ofwhether or not they employ women workers. The riskis thus to be shared across the workforce followingthe social insurance principle. The contributions shouldbe payable monthly with other Jamsostek contributions.The level of contribution necessary has been estimatedat 0.9% of the monthly wage of all employees (menand women). The basis of the estimate (to be verifiedby actuarial valuation) is given in Table 8 and the datathat follow the table.

Part III Chapter 13
145
Figure 70 Table of Assumed Average Wage Calculations
Mid point of salary range No. Of Females Males and females Total wages(Rp. Millions)50,000 1,274,041 1,887,943 94,397
150,000 2,554,905 4,657,136 698,570250,000 1,873,592 5,195,761 1,298,940350,000 1,268,492 5,033,598 1,761,759450,000 708,409 3,511,983 1,580,392550,000 475,677 2,080,280 1,144,154650,000 451,876 2,064,076 1,341,649750,000 412,810 1,646,855 1,235,141850,000 342,271 1,375,147 1,168,874950,000 139,081 682,277 648,163
1,050,000 208,679 1,362,983 1,431,132Total 9,709,833 29,498,039 12,403,174
Figure 71 Table of Programme Calculations and Cost Estimates
Calculations and Estimates ResultTotal Number of salaried workers in the economy male and female 29,498,039Total Number of salaried female workers in the economy 9,709,833Total Number of working females in the economy 35,032,000Total Number of working females in fertile group (age 15-44) 25,134,000Birth Rate 2.3 per 1,000 employees. Expected no of births annually 58,808National Average minimum monthly wage Rp.364,148Total for 3 months of payment Cash Benefit for female employees Rp.1,100,000Total average annual cash benefit expenditure Rp.64,685,500,000Assuming medical expenditure is Rp.500,000 per case then the Total is Rp.29,404,000,000Assuming 70 % of the total males in employment are married (19,788,206 X 70% 13,851,744Total number of spouses giving birth (2.3 X (19,788,206 / 1000) X 0.7) 31,859Total medical cost for spouses Rp.15,929,505,800Estimated Cost of the Maternity scheme Rp.110,019,000,000Total wage bill of the salaried employees Rp.12,403,200,000,000Rate of Contribution Required excluding Administration Costs 0.0887%
Other Issues
The Labour Laws require employers to provide twohours time-off to female employees who are breast-feeding. The employer could alternatively provide aplace and other facilities to enable the employee toextract and refrigerate the breast milk. Similarprovisions might be made for storage of formula foodfor bottle-feeding.
The employer is also required to provide child-carecentres to help the female employees. Employers inthe plantation sector fulfil this provision while othersdue to a number of reasons have yet to comply.
Employers have to ensure the health and safety of thefemale worker as well as the foetus. Pregnant
employees should not be exposed to hazardousmaterials or substances and they should be givenproper rest breaks and provided with appropriateseating and working equipment. On the basis ofanecdotal evidence it seems that these requirementsare not always enforced. In the interests of addressingthe worrying number of maternal deaths duringpregnancy it should be possible for provisions to bemade for early notification (by hospitals, doctors ormidwives) to be given to the Occupational Health &Safety division of Depnaker for them to arrange OSHinspections at the expectant mother’s workplace toensure that the relevant provisions are complied with.It should be noted that exposure of male workers tohazardous substances can also adversely affect a futurefoetus.

Part III Chapter 14
146
CHAPTER 14 UNEMPLOYMENT BENEFIT INSURANCE
Executive Summary
Indonesia, like many developing countries, has nounemployment benefit system. A severance paysystem does operate for many formal sector employees,but not for the majority of the working populationemployed in the informal sector. De facto, thewithdrawal of Retirement Savings balances held inJamsostek, Indonesia’s Provident Fund/SocialInsurance Fund also acts unofficially as a means ofcoping with the financial impact of job loss, thoughagain this option is available only to formal sectorJamsostek members, and erodes retirement provisionfor this group. Otherwise there is no formal provisionfor catering for unemployment. Instead people wholose a job or are unable to find paying work rely mainlyon extended family and informal sector activities tomanage.
A feasibility study, undertaken as part of the ILOproject on restructuring the social security system inIndonesia, looked at options for meeting the financialproblems caused by unemployment. It concluded thatit would be possible to introduce a form ofUnemployment Insurance in Indonesia, and to add this
programme to the existing programmes of Jamsostek.At this stage what is feasible is a short-termunemployment benefit for insured workers in theformal sector. A wider coverage or longer-termbenefit is not yet feasible given the structure ofIndonesia’s economy and labour market. For those notable to be covered by any scheme introduced, someform of Social Assistance may be a fall back option.
The study also noted that a number of other issueswould need to be resolved before any unemploymentinsurance benefit can be introduced in Indonesia. Theseinclude decisions on:• The priority of unemployment insurance in relation
to other social security objectives;• What should be the funding source and, if funded by
contributions, who should pay the requiredcontributions:
• The implications for existing severance pay system;and
• The need to upgrade the capability of Jamsostek —the logical carrier for any Unemployment Insuranceprogrammes.
Most of these issues are likely to require furtherdiscussions between the social partners in Indonesia.

Part III Chapter 14
147
Bab 14 Asuransi Jaminan Pengangguran
Rangkuman Eksekutif
Indonesia, sebagaimana negara-negara sedangberkembang lainnya, tidak memiliki sistem yangmemberikan manfaat pengangguran. Sistempembayaran pesangon berlaku bagi banyak pekerjasektor formal, tetapi tidak berlaku untuk mayoritaspenduduk bekerja yang dipekerjakan di sektor informal.Secara de fakto, penarikan saldo tabunganpengangguran yang disimpan di Jamsostek, DanaProvident Jamsostek/ Dana Asuransi Sosial juga secaratidak resmi berfungsi sebagai suatu cara untukmengatasi dampak keuangan yang ditimbulkan olehkehilangan pekerjaan, meskipun sekali lagi, pilihan inihanya tersedia bagi anggota Jamsostek di sektorformal, serta mengikis persediaan uang pensiun yangdimiliki kelompok ini. Jika tidak demikian, ketentuanresmi yang menangani masalah pengangguran. Sebagaigantinya orang yang kehilangan pekerjaan atau tidakdapat memperoleh pekerjaan yang menghasilkanpendapatan bagi mereka, sebagian besarmenggantungkan hidupnya pada keluarga besar danpada kegiatan-kegiatan usaha sektor informal untukmenanggulangi pengangguran.
Suatu studi kelayakan yang dilaksanakan sebagaibagian dari proyek ILO mengenai restrukturisasi sistemjaminan sosial di Indonesia mencoba menganalisapilihan-pilihan yang ada untuk mengatasi masalah-masalah keuangan yang timbul sebagai akibatpengangguran. Studi tersebut menyimpulkan bahwa
bisa saja memperkenalkan Asuransi Pengangguran diIndonesia, dan menambahkan program ini ke program-program Jamsostek yang sudah ada. Pada tahap ini,mungkin dan layak dilakukan adalah manfaatpengangguran jangka pendek untuk para pekerja disektor formal yang sudah diasuransikan. Cakupankepesertaan yang lebih luas atau manfaatpengangguran untuk jangka waktu yang lebih lamabelum memungkinkan mengingat strukturperekonomian dan pasar kerja Indonesia. Suatu bentukAsuransi Sosial dapat menjadi pilihan cadangan bagimereka yang tidak dapat dicakup oleh skema apapunyang diperkenalkan.
Studi tersebut juga mencatat bahwa sejumlah pokokpermasalahan lain perlu dibereskan terlebih dahulusebelum jaminan asuransi pengangguran dapatdiperkenalkan di Indonesia. Pokok-pokok per-masalahan tersebut meliputi keputusan-keputusanmengenai:• Prioritas asuransi pengangguran dalam kaitannya
dengan tujuan-tujuan jaminan sosial lainnya;• Dari mana sumber dananya dan, apabila didanai dari
iuran, siapa yang harus membayarnya;• Implikasi-implikasinya terhadap sistem pembayaran
pesangon yang ada; dan• Adanya kebutuhan untuk meningkatkan kemampuan
Jamsostek – pelaksana logis bagi program-programasuransi pengangguran.
Sebagian besar dari pokok-pokok permasalahantersebut memerlukan diskusi lebih lanjut di antara paramitra sosial di Indonesia.

Part III Chapter 14
148
Employment and Unemployment inIndonesia
Out of a population estimated at just over 200 millionin the year 2000, the estimated labour force inIndonesia was 95.7 million. Open Unemployment was5.8 million, with 89.8 million classified as being inemployment. In 2001 open unemployment movedabove the 6 million mark. However, the majority ofemployed people in Indonesia are in the rural and urbaninformal economy rather than in the formal sector(characterised by regular wage and salary employmentand a clear employer/employee relationship. Mostworkers in the informal economy are self employedfarmers, vendors and small traders, or unpaid familyworkers.
Using a classification which treats all designatedemployers and employees as being in the formal sectorsuggests that Indonesia has about 31.5 million peopleemployed in the formal sector, and 58.3 million in theinformal economy. An alternative classification addsself-employed workers in professional, technical andadministrative categories to the formal sector grouping— but treats wage workers in the agricultural sectoras part of the informal economy. This approachsuggests that Indonesia has about 26.7 million employedformal sector workers and about 62.4 informal sectorworkers. Either classification approach produces asubstantial majority in the informal economy and aminority in the formal sector of the economy.
Of the formal sector workers, somewhat over 9 million(9.4 million in 2001) were active members of theJamsostek Social Insurance/Provident Fund. Another9.1 million names on Jamsostek files included 5.8 millioninactive members and duplicate listings, and 3.3 millionformer members to whom benefits had been paid out(and probably no longer in active employment).
A further complication in the formal sector is thefrequent use of temporary contracts of up to 3 monthsemployment or “outsourcing” of wageworkers. Thesepeople do not have the status of permanent employees(though some contributions to Jamsostek may be paidon their behalf in some industries such as construction)and hence are not entitled to statutory severance payor other redundancy payments from their employers iftheir contracts are not renewed.
Unemployment
The relatively low open unemployment rate of around6% hides a major degree of underemployment inIndonesia, particularly in the informal economy. People
are classified as “employed” if they work at least onehour per week, including those involved in unpaid familylabour. In the year 2000 a full 32 million of the“employed” group worked less that 35 hours per weekand many of these people would in fact take up morework if this were available. Adding this measure ofunderemployment to open unemployment wouldproduce a figure of close to 40% of the labour forcebeing not fully employed or not employed. However,this approach tends to overstate unemployment sincesome of the group working under 35 hours do so fromchoice. Some officials suggested that about 10 millionof the underemployed should be regarded as hiddenunemployed, though the basis of this figure is not clear.The 1999 labour force survey indicated that 12 millionin the group working less than 35 hours did soinvoluntarily. If this figure is used, it would imply thatthe underlying involuntary unemployment rate inIndonesia is about 18 or 19%. Whatever the basis ofthe calculation, it is clear that the official openunemployment rate significantly understates the degreeto which the Indonesian labour force is under-utilised.
Prior to the 1997 crisis, most open unemployment inIndonesia consisted of young people who had leftsecondary schools or tertiary training looking for theirfirst permanent, paid job. Average job search timewas then around 6 months. 82% of the openlyunemployed had never worked. Unemployment rateswere lowest amongst the least educated people becausethey had little option other than to take up the leastskilled and least remunerated work, often as unpaidfamily workers. The somewhat better educated usuallyhad some family resources to fall back on while theylooked for better-paid work.
It may be noted that, with an open unemployment rateof around 6% and unemployment duration of around 6months, about 12% of the labour force would becomeunemployed at some stage during each year. However,this calculation tends to understate the position becausejob losers who move into the informal economy are nolonger counted as unemployed.
Impact of the 1997 Crisis
The 1997 crisis changed the unemployment pattern,with several million people losing jobs in the formalsector. The impact was particularly severe in 1998,when real GDP in Indonesia declined by 13% , andthe proportion of establishments operating below 50%of their capacity rose from 15.1 to 36.3%. In themanufacturing sector in 1998, 2,526 enterprises droppedout of the lists of large and medium scale enterpriseslisted in the Statistics directory, equal to around 12%

Part III Chapter 14
149
of the number of listed enterprises. In the constructionindustry cutbacks were even larger. Even so, most ofthe displaced workers from closed or reduced scaleenterprises did not show up in the open unemploymentstatistics. Part of the reason was that in the absenceof any unemployment benefit, and in many cases alsothe absence of any severance pay, the workers wholost their jobs had to take any option available to supportthemselves and their families. Hence they continuedto be classified in the statistics as “employed.” In theyear 2000 the Labour Force Survey people who wereformerly employed still constituted fewer than 30% ofthose classified as openly unemployed.
Many of the displaced workers moved into othersituations which were not classified as unemployment.Some returned to the agricultural sector as low paidworkers or unpaid family workers, dropped out of thelabour force (particularly women), took lower paid jobsin other parts of the formal sector, or work in theinformal economy in urban areas. The latter categoryincluded many people who became itinerant vendorsor hawkers. Some also sought work abroad, thoughthis effect was soon outweighed by the return ofIndonesian workers from other countries also affectedby the Asian crisis.
The statistical “disappearance” from the unemploymentcounts of most of the workers displaced by the crisisled to widely varying estimates of the “true” size ofthe rise in Unemployment in 1998. The Ministry ofManpower estimated that displaced workers numbered5.2 million in 1998 and estimated the unemploymentrate at 14.8%. BAPPENAS (Planning)) initiallyestimated 3.84 million displaced workers, and theunemployment rate to be 13.6%. The Task Forceestimated 5.42 million displaced workers, leading toan unemployment rate of 10%. None of theseunemployment-rate figures were reached when theactual survey results came out. The official openunemployment rate rose only from 4.7 to 5.4 %between August 1997 and August 1998, moving up to6.4 % in 1999.
However, there was a massive decline in average realwages as price rises deflated the real value of moneywages. General inflation was 78% in 1998, while foodprices rose by 118%. Despite increases in moneyincomes, real wages fell by about one third in 1998.Mean consumption levels fell 24.4% nationally. Thosein urban areas fell by 33.9% and in rural areas by13.4%. The distribution of the consumption cutbackswas skewed, and median consumption fell only 1.5%,with the median urban reduction being 5%. It issomewhat difficult to explain this pattern, but it may
be composed of large consumption cutbacks by thosedirectly affected by the first round effects of the crisis,plus precautionary reductions in discretionary spendingby some other groups.
Per capita daily food consumption fell from 2,019.79calories in 1996 to 1,849.36 in 1999. Proteinconsumption per capita in grams fell from 54.49 to48.67. The national Poverty index which had droppedto just over 11% in 1996 rose to over 24% byDecember 1998, though some changes in definitionscloud comparability of the figures. However theseverity of the change is not in doubt.
Overall, the Indonesian labour market showedremarkable flexibility in adjusting to the crisis. However,the flexibility had a high human cost.
Impact on Women
In Indonesia in the year 2000 women constituted about38.3% of the employed labour force. However, theyconstituted only 32.9% of wage and salary earners,but 74% of the unpaid family workers. Women inIndonesia tend to be disadvantaged in the labour marketand, on average, to occupy less skilled or at least lesswell-paid jobs than men. If employed they are morelikely to be in the informal economy or in small-scalebusinesses in the formal sector where most workersare not Jamsostek members with social insurancecover.
The impact of the 1997 crisis on women was somewhatcomplex. On the one hand women were more likelythan men to be dismissed from jobs in the formal sectoras formal sector workers were laid off, and in the year2000 constituted 42.5% of the openly unemployed. Onthe other hand, the majority of women were in theinformal economy or in small-scale, formal sectoremployment where the employment impact of the crisiswas less severe. This meant that in many householdsthe women members became the breadwinners whenmales in the formal sector lost their jobs. Overall,employment rates amongst men and women changedto about the same degree, total employment for bothgroups rising only 0.3% between 1997 and 2000.
Gender issues in relation to Unemployment Insurancebenefits relate mainly to ensuring that women workersin enterprises are included in the insured workforce,rather than in the uninsured, “outsourced” workforce¾ and obtain unemployment benefit rights. If activelabour market programmes are also set up withUnemployment Benefit Fund financing, the genderissues relate to ensuring that the types of programmes

Part III Chapter 14
150
set up also relate to the needs and re-employmentoptions of women and that women obtain access tosuch programmes in proportion to their representationamongst the unemployed.
For example, pilot small scale loan projects by theOffice of the State Minister for Women’sEmpowerment have indicated that there are significantnumbers of women who have the capacity andmotivation to run small scale businesses successfullyprovided funding and some training can be provided.The loan repayment rate of women who are advancedbusiness credit compares favourably with that of men.
There are also gender issues for women in terms ofmaternity medical costs, maternity leave, and maternityleave benefits. These lie outside the area ofUnemployment Insurance itself, but could beconsidered as part of a “package” restructuring of theIndonesian social security system.
Redundancy Payments and Use ofRetirement Savings
Under Indonesian law permanent employees whosejobs are terminated by their employers are entitled toredundancy payments in the form of Severance Payand Service Pay or Gratuity, with amounts based onthe number of years of employment. Generally underArticles 22 and 23 of the 20 June 2000 Decree, onemonth’s pay accumulates for additional periods ofemployment up to a limit of 17 months total for thetwo elements combined. There are currently someunresolved disputes over the exact legal status of someof these entitlements. As noted, these provisions donot cover short-term, temporary contract workers andthose on 3 months’ probation before becomingpermanent employees.
The Law for Severance Pay provides for one monthof Severance Pay for up to 12 months’ employment,with an additional month for each additional year ofemployment up to a maximum of 5 months of SeverancePay for 4 or more years of employment.Service Pay (Gratuity) accrues after 5 years ofemployment. It is 2 months for 5 but under10 years, 3months for 10 but under15 years, 4 months for 15 butunder 20 years, 5 months for 20 but under 25 years,and 6 months for 25 or more years.
After the crisis there was a variable outcome in termsof actual receipt of redundancy payments. In some ofthe worst affected sectors where enterprises collapsed(e.g. in construction) many workers did not receivetheir theoretical entitlements.
However, many formal sector workers drew on theirretirement savings in Jamsostek, the Social Insuranceand Provident Fund for insured workers in the privatesector. Jamsostek formally covers all workers inenterprises with 10 employees or more, or with a payrollof Rp.1 million a month or more. In theory this shouldmean coverage of the majority of formal sectorworkers. In practice coverage is somewhat more that9 million members, or around 12 % of the employedworkforce. This group is required to contribute to theJamsostek JHT provident fund.
One of the ways for unemployed workers to adjust totheir need for money to fund their expenses is towithdraw Jamsostek Old Age Benefit balances. Thiscan be done once a member has been a Jamsostekprovident fund contributor for five years or more, plusan additional wait period of 6 months, and has becomeunemployed. Total early withdrawal claims prior to theage of 55 because the workers were laid off were241, 760 in 1997, 493,131 in 1998, 610,791 in 1999, and632,055 in the year 2000. In the same yearswithdrawals made because the person had reachedthe age of 55 were only 28, 612, 33,657, 33,650, and34,085 respectively. In effect the JamsostekRetirement Savings scheme is being used mainly forpurposes other than financing individual retirementsavings.
First half year data for 2001 showed that withdrawalsfor Jamsostek were 316,242, or in other words werecontinuing at the high year 2000 rate.
The use of Jamsostek Old Age Benefit Savingsbalances in this way suggests that there is a largefinancial need faced by dismissed workers which isnot adequately met by other existing systems, includingSeverance Pay. The size of the groups makingwithdrawals in relation to Jamsostek active membershipalso suggests that the 5 year limit may not have beenstrictly observed by Jamsostek. It is also possible thatpart of the withdrawal was opportunistic. The highprice inflation rates of recent years and the associatednegative real return on Jamsostek investments mayhave persuaded many workers that Jamsostek OldAge Benefit savings balances are not a goodinvestment. These factors point to the need to achievepositive real net returns on Jamsostek investments ¾though this issue lies largely outside the scope ofunemployment cover as such. However, attitudes toJamsostek do affect workers willingness to sign upfor Jamsostek programmes, which in turn impacts onthe likely coverage of Unemployment Insurance ifJamsostek were to be the administrative carrier of anUnemployment Insurance Fund.

Part III Chapter 14
151
The development of more formal arrangements toaddress income needs during unemployment may allowretirement savings in the Jamsostek Old Age Benefitaccounts to be preserved for their intended purpose.This issue is addressed in the ILO Study on Pensionsand is referred to in an earlier Chapter of thisPublication.
Options for Unemployment CoverIn principle there are a number of different ways bywhich some additional protection could be provided toIndonesian workers who lose their jobs because ofeconomic conditions affecting the firms previouslyemploying them. Before returning to the option ofUnemployment Insurance, it is desirable to commentbriefly on each of these options.
• Expanding redundancy payments to cover short-termworkers;
• Redundancy insurance;• A Central redundancy fund;• Unemployment insurance with private companies;• A Compulsory Savings Scheme;• Social assistance for the unemployed;• Tax-funded unemployment benefits; and• Unemployment Insurance on Social Insurance
principles.
Expanding Redundancy CoverageIndonesia already has a redundancy payment systemin the form of service and severance pay for thosepermanent employees who are discharged fromemployment. It does not cover short-term contractworkers, those legally employed for periods of lessthan 3 months (notably probationers), and some othercategories of “outsourced” workers.
It would be possible to extend the redundancy schemeto short term workers by treating all cumulative periodsof employment with the same employer as periods ofservice for service and severance pay purposes.
However, there are a number of problems with thisapproach: —
• Firstly, employers could get around the severancepay requirement by hiring different workers at theend of short-term contract periods. This would meanthat short- term workers were still uncovered inpractice;
• The second problem is that people with short periodsof employment with any employer, even if they arepermanent employees, would get very little out ofseverance and service pay, even though their income
support needs are the same as those of a workerwith longer periods of employment; and
• Thirdly, as now, if an enterprise collapsed financiallyworkers may get little or nothing in the way ofseverance or service pay. This was a major problemafter the 1997 crisis.
One partly offsetting advantage of lump sumredundancy payment schemes is that the formeremployee has an incentive to seek re-employmentrather than remain passively unemployed.
Redundancy InsuranceA second option is to require all employers to take outredundancy insurance from private insurancecompanies for their employees to ensure that dueseverance and service pay obligations are met.
This is theoretically possible, though the costs of thisto employers are unclear. An employer with manylong-serving staff members is likely to have to payvery high insurance premiums. This would workagainst stability of employment for workers becausewhen the system came in it would be cheaper to forsome employers to seek to replace longer-term staffwith new workers whose insurance premium costswere lower. It would be cheaper to hire new workersfor short periods only.A second problem is that it would be difficult to enforcecompliance, particularly from smaller employers, justas it is difficult to enforce compliance with requirementto pay premiums to Jamsostek. However, the biggestproblem is that staff with short periods of service wouldget very little severance and service pay, as at present.This means that the amount received would beunrelated to their needs or period of unemployment.This is a basic flaw of the existing system.
A Central Redundancy FundA related option would be to set up a CentralRedundancy Fund financed by premiums fromemployers. This could be attached to Jamsostek. Thiswould levy premiums on employers based on the lengthof service of their staff, and pay redundancy whenworkers lost their jobs.
This approach is also possible, but is likely to requiremuch higher average premiums from employers thanwould an unemployment benefit insurance schemebecause it would have to take over liability for pastservice. It would also be more complex to administerbecause it would need a highly differentiated premiumstructure. Calculating premiums would require largeamounts of detailed information from employers about

Part III Chapter 14
152
the length of employment of their staff members inorder for premiums to be set. This would riseadministrative and compliance costs.
Like the private insurance option, it suffers from thedisadvantage that workers with short periods ofemployment would receive little when they lost theirjobs, but those with long service would receive themost even if they immediately became re-employedelsewhere.
Unemployment Insurance with PrivateCompanies
The fourth option is to require unemployment insurancewith private insurance companies for formal sectorworkers. This would mean that employers would haveto take out insurance cover to protect their staff againstperiods of unemployment.
This option is theoretically possible, and improves theposition of workers employed for short periods, andworkers whose employer’s business collapses and isunable to pay severance and service pay. However,private unemployment insurance has many of the sameproblems as redundancy insurance with privatecompanies. It would also mean that employers werepaying contributions both to Jamsostek and to theprivate insurance company, which raises bothadministration and compliance costs.
Risk pooling would be less than with a central fund,and the need for private companies to make profitsand pay taxes would imply a higher premium cost foremployers than with a centralised fund.
Compulsory Savings SchemesA further option would be to require all formal sectorworkers to contribute to individual compulsory savingsschemes. Amounts from these schemes could bewithdrawn when a person became unemployed. Inreality this is virtually what has happened to theJamsostek Old Age Benefit Scheme, with the sideeffect of undermining its primary purpose of providingsavings for Old Age Benefits. However, as a meansof providing Unemployment protection the compulsorysavings approach has serious flaws. There is no riskpooling, so the amount required to be saved by eachindividual involves far higher contribution rates thanwould an unemployment insurance fund. Further,younger workers or those with limited periods ofemployment including many women would not havemuch accumulated in the way of balances to covertheir unemployment risk.
If the Government ever wished to introduce acompulsory savings scheme, this would have to haveother objectives than providing UnemploymentInsurance. The compulsory savings approach couldhave some attractions in a period of booming demandand rising pressure on resources. However, this is notthe current situation in Indonesia.
Social Assistance for the UnemployedA sixth option is not to have any Unemployment Benefitas such, but simply cover the unemployed by any SocialAssistance allocated to other poor people in SocialSafety Net programmes. This is possible, but wouldmean that many formal sector workers continued tohave no unemployment protection which recognisedtheir special situation. This usually involves locationaway from their villages of family origin and residencein higher cost urban areas. Social Assistance to thisgroup would also raise Government Budget costs.Fiscal considerations suggest that it would be preferableif any provision for coverage of the unemployed wasself-funded rather than an extra claim on the normalrevenue base.
However, Social Assistance is a fall back option if noneof the other options proceed. Further, once entitlementto Unemployment Benefit expires, Social Assistancewould be required for some of those unable to obtainemployment. Social Assistance is covered separatelyin the following Chapter of this Publication.
Tax-Funded Unemployment BenefitAnother option is for the cost of UnemploymentBenefits to be met from the Government budget. Thistype of system might involve flat rate unemploymentassistance benefits, perhaps set at the level of theminimum wage in each area, and tax increases to coverthe costs. This is also theoretically feasible. However,the Ministry of Finance has indicated that there is nospare money to fund such a programme, and it couldnot be considered a priority for scarce budget funding.Accordingly, this option is not further considered.
Unemployment Insurance with aCentral FundThe most feasible option (if Unemployment Benefitsare to be introduced) is Unemployment Insuranceoperated from a Central Unemployment InsuranceFund, and funded by standard premiums set as apercentage of insured wages.
This is the option with the simplest structure andpotentially the lowest operational costs. It could be runas a Jamsostek programme, which would mean thatformal sector employers would have to deal only with

Part III Chapter 14
153
the organisation they are already dealing with. Thiswould lower their administration costs and the overallcompliance cost. Once Jamsostek has completed itsproposed computer and information system upgrade,it should be possible to add in an UnemploymentInsurance programme to existing Jamsostek functions.However, Jamsostek would need more staffing andother resources, and the cost of this would need to bebuilt into the contribution levy rate.
A major potential advantage of a separateUnemployment Insurance scheme is that this wouldmake it possible to preserve Old Age Benefit Savingsaccounts in Jamsostek solely for retirement purposes.Ending the practice of using these balances as a sourceof unemployment finance would have two beneficialspin-offs. It would provide more for workers whenthey retired from the labour force. It would also tendto raise the national savings level, providing moredomestic funding for development.
The Feasibility of UnemploymentBenefit in Indonesia
There are a number of conditions which shoulddesirably be met before introduction of anUnemployment Benefit Scheme is considered in anycountry. These include:—
• Need for the Scheme;• Economic Feasibility;• Ability to Administer the Scheme;• The existence of matching services for employment
and training; and• Support from the Social Partners.
These issues will be considered briefly.
Need for a SchemeThere is little doubt that some type of measure to assistthose who become unemployed is necessary. Whilethe Indonesian labour market has showed itself to beremarkably flexible, and the rural extended family stilloperated to a considerable degree in helping thoseaffected by the recent crisis, the overall impact of the1997 crisis on the population was severe, particularlyfor those who lost their jobs. This is indicated inparticular by the decline in food consumption per head.The massive withdrawals of Provident Fund savingsbalances by the unemployed also pointed to an unmetfinancial need.
Over the longer-term perspective, those who becomewageworkers in the urban formal sector (and also manyworkers in the informal economy in urban areas)
gradually lose touch with their rural roots, and extendedfamily ties tend to erode. This means that formalsystems of protection against the consequences ofunemployment become important to workers. Whatthese formal systems should be is a more openquestion.
The existing system of severance and service pay forformal sector workers did not operate well in the crisis.When firms collapsed, no severance pay was available.Further, many workers with short periods of serviceonly received very little, while all the short-term contractworkers were ineligible for any payments. AnUnemployment Benefit would assist workers whobecome unemployed. It would also provide benefitsfor the other social partners by strengthening socialconsensus and reducing employee resistance toeconomic and industrial restructuring.
Economic FeasibilityUnemployment benefits and more particularly, widecoverage unemployment benefit systems generallyoperate only in developed economies where themajority of the employed population is in the formalsector, and there is a substantial “economic surplus”above household consumption needs and basicadministration and development costs. Where such asurplus emerges, contributions or taxes can be leviedto fund unemployment benefits or other social securitypriorities.
On these two criteria Indonesia ranks poorly. Most ofthe labour force is in the informal economy. Per capitaGDP was only US$669 in 1999. In purchasing powerparity terms this was still only US$2,857. This leaveslimited scope to fund social protection measures —Government expenditure priorities for development inthe social area are heavily weighted towardsimprovement of the educational and health servicesavailable to the population. Social protection prioritiesare currently located in “Social Safety Net” provisionsdesigned in principle to help the very poorest.
What this amounts to is a situation where “widecoverage” unemployment benefits are not yeteconomically feasible in Indonesia. It is not possible toenvisage granting entitlement to unemployment benefitsto the majority, informal economy, nor to all the potentialjob seekers in the population. There are also significantlimits on the extent to which even formal sector workerscan be covered in the short run. For the next few yearsall that appears to be economically feasible is thedevelopment of unemployment insurance benefits forinsured workers in the formal sector. On the basis ofJamsostek active membership, this is only around 12%

Part III Chapter 14
154
of the employed labour force, plus possible coveragefor those in the public sector who represent about 4%of the labour force. However, as economic conditionsimprove this proportion could be increased by wideningthe net of mandatory coverage as well as increasingcompliance rates amongst those who are currentlyrequired to be Jamsostek members, but have notenrolled for membership.
Ability to Administer an Unemployment BenefitSystemThe potential administrative capacity to run anunemployment benefit system in Indonesia is mixed.
The Indonesian Social Insurance and Provident Fundfor private sector employees (Jamsostek) is currentlyable to administer several social insurance and savingsprogrammes for over 9 million active members. Withsome extension of capacity, including betterinformation and processing systems, it could addUnemployment Insurance to its existing set ofprogrammes for existing client members and for newcontributors who are prepared to sign up tomembership. However, the extent to which this wouldmuch widen the membership base in the short run isuncertain since Jamsostek is currently unable to drawin all the employers and workers who are legallyrequired to be members. Non-membership, under-reporting of staff numbers, and under-reporting ofwages paid are all existing problems for Jamsostek.
More seriously, Jamsostek currently lacks the abilityto run a large-scale periodic payment system, and thecapacity to verify the actual employment status ofbenefit claimants. Jamsostek does not at present evenhave its own inspectorate. A periodic payment systemcould be set up in the medium term. However, it willbe much more difficult to verify the employment statusof benefit claimants, since a high proportion of the jobsinto which the unemployed might gravitate will be inthe informal economy or in the parts of the formalsector not connected to Jamsostek, and hence notproviding a source of information on re-employment.
What this amounts to is a situation where “longduration” unemployment benefits are notadministratively feasible for the medium term. Anyunemployment insurance benefit at this stage could beshort duration only because of the inability to verifyemployment status for long duration benefit claimants.A possible outcome of this situation is that mostclaimants could receive the benefit for the maximumlegal duration of payment.
Existence of Counterpart ServicesUnemployment Benefit systems operate moreeffectively when there are counterpart services forjob seekers, notably employment services, trainingschemes, and in some cases special employmentschemes. Available data indicates that Indonesia haslimited labour force coverage through its EmploymentCentres, and very limited availability of training placesfor the Unemployed. This means that thesecounterpart services can provide only limited supportto an Unemployment Benefit Scheme.
Employment ServicesIn Indonesia there are a number of EmploymentCentres set up by the Government at which theunemployed can register their status. The 1997Depnaker (Ministry of Manpower) statistics showedthat 1,542,522 people registered, and 492,705employment placements were made. Thereafternumbers in both series declined. Registrations droppedto 1,119,750 by 1999, despite higher unemploymentlevels, and to 865,392 in the first 10 months of 2000.Placements were down to 395,214 by 1999 and 238,861by the first 10 months of 2000. It is not clear howmuch of the declines are due to a reduction in actualregistration rates, and how much to deficiencies inreporting to the central government sinceregionalisation and devolution of the responsibilities toprovinces and districts.
How these registration statistics relate to the numbersof the openly unemployed is less clear. The labourforce survey of the 6,030,000 openly unemployed in1999 identified only 214 thousand or 3.5% of this groupwho had registered with the Unemployment Centres.Assuming an average unemployment duration of 6months, including that of first job seekers, and hence aflow of about 12 million formally unemployed in thecourse of the year, this would still give only 428,000 ofthe openly unemployed who used these centres overthe course of 12 months. This is only 38% of thenumbers reported as using the centres. The differencemay reflect the large numbers of people who are notofficially unemployed but who were looking for formalsector employment and registered their interest withthe centres. This could include many intending schoolleavers and unpaid family workers.
In terms of capacity, on the basis of existing Jamsostekactive members and the “standard” calculationexplained later in this text, the requirement forUnemployment Insurance Fund members to registerwith the Employment Centres in order to claimunemployment benefits would somewhat more thandouble the number of people registering with these

Part III Chapter 14
155
centres. Whether the Employment Centre systemcould cope with this surge without additional resourcesis unclear. Some of the surge could presumably betaken up from existing capacity if registrations returnedto the 1996-1997 level of 1.5 million per year, butcompulsory registration of insured job seekers is likelyto push the annual registration totals to closer to 2.5million registrations per year, unless there was a largedrop in registrations of the non-insured.
TrainingTraining capacity for the Unemployed in Indonesia ison an even more limited scale. There are currently156 training centres in Indonesia, though only 24 areof significant size and most have an annual trainingcapacity of only 600 to 700 per year. There is a verylimited geographical coverage in relation to local labourmarkets, since Indonesia has over 4,000 districts.
In 1997 the centres provided training to 95,709 people,including employed as well as unemployed. This wasequal to around 6% of the registered job seekers butonly 1.6% of the openly unemployed and around 0.5%of the numbers of openly unemployed plus involuntaryshort time workers who were underemployed. Sincethen regionalisation has shifted all but 6 centres out ofthe central government sector, and national on trainingare currently not available. Centrally financed trainingplace availability was estimated at around 25,000places in the year 2001, including that provided by mobileteams. Depnaker officials thought that the trainingcentres were operating at about 40% of capacity, butthat some other training programmes were running inthe private sector. However, the recession hadweakened employer incentives to train. For the publiccentres the policy was to train to meet needs wherejobs were available, not simply to train.
Overall, while there is some spare training capacity inthe existing centres, it is quantitatively small in relationto the size of the pool of unemployed people. Further,liaison problems associated with devolution will bedifficult to deal with in the short term.
Attitudes of the Social Partners andOther Stakeholders
ILO consultation with the range of stakeholdersindicated a range of attitudes towards UnemploymentInsurance which impact on the feasibility of an earlyintroduction of this form of social protection. Discussionwith the various groups probed the issue of the needfor and priority of an unemployment benefit, and anumber of funding options. These were:• Employer Funding;
• Employee Funding;• Shared Cost Funding between employers and
employees; and• Employers pay, but obligations to pay severance pay
reduced.
EmployeesGenerally, employee organisations contacted as partof the ILO project were cautious. Most favouredunemployment insurance benefits in principle.However, with some exceptions most wished employersto pay all or most of the premiums needed, and did notwish to lose existing severance and service payentitlements. They were reluctant to envisage anyfinancial arrangements which resulted in any furtherreduction in net real wages. A number of employeeorganisation representatives indicated that they wishedto have more information on what any scheme wouldinvolve before they expressed a firm view. Detailedpoints which emerged in a number of discussions were:
• Employee organisations were supportive of the ideaof Unemployment Benefits. In the first instance thiscould be payment of benefits for people who losttheir jobs. They also felt that something needed tobe done for low-income people in the informal sector.
• A preference was that Unemployment Benefitsshould be funded by employer levies. TheGovernment should pay for assistance to people inthe informal economy. The counter-comment thatthe real economic incidence of the levies might fallon the real net incomes of workers was alsoacknowledged.
• When asked how much the employees themselveswere prepared to contribute to an UnemploymentBenefit system, the answer was that it would firstbe necessary to know what such a system coulddeliver. The Bali union representative was preparedto accept a 50/50 split of costs between Employersand Workers provided real minimum wages werefirst raised. Other employee groups were notcurrently prepared to go this far, or reserved theirposition.
• There were mixed views about social budgetpriorities. Some felt that the priority was employedpeople in the formal sector who lost their jobs. Thisgroup was seen as needing some form of income-related unemployment compensation. However,some of those present thought that the low-incomeunemployed were the priority.
• The process of developing any system was seen asimportant. The unions wished to be consulted and

Part III Chapter 14
156
involved, and not marginalised as was considered tohave happened in the past.
• Jamsostek was not held in high regard. It wasregarded as slow, unresponsive to workers needs,and wasteful in its administrative spending, includingthe building of lavish buildings.
• Governance of any future Unemployment Insurancescheme was seen as critical. It should not be run ordominated by Government. A tripartite Board wasfavoured.
• The need for policing of Unemployment Benefits toprevent fraud was acknowledged.
EmployersEmployer organisations had a more varied response.Some supported and some opposed the idea. Thosesupporting the idea, particularly a number of the Jakartaemployers, recognised the problem and were, preparedto envisage shared costs for unemployment insurancein the longer run, provided that there was some offsetto severance pay obligations. However, they felt thatexisting economic conditions were unfavourable to anysuch new initiative. Employers generally consideredthat they could not currently afford anything whichraised real production costs and the cost of employinglabour. There was clear opposition to any unilateralincrease in costs faced by employers.
The Jakarta employers were also doubtful of the cost-effectiveness of special employment and retrainingschemes for the unemployed. They noted thatIndonesia lacked sufficient training capacity places,and in any case priority needed to go to training foractual jobs for employed or soon to be employedpeople. Also, labour-intensive unskilled work did notdo much to fit people for more skilled work when theeconomy picked up.
Attitude of NGOs and Community OrganizationsSome NGOs and community organisations also hadreservations about Unemployment Benefits paid forpassive inactivity following job loss. For examplerepresentatives of Muslimat (a large Muslim Women’sorganisation) expressed preference for activeprogrammes for the unemployed, which taught newskills that led to jobs, provided special employment, ordeveloped other options for longer term self support.
A preference for active labour market policies andinitiatives which developed capacity was alsoexpressed by some other NGO representatives.
Government OfficialsOfficials generally were cautious in their views on anUnemployment Benefit or Unemployment Insurance.A number considered it to be not affordable or not apriority for Indonesia’s current stage of development.Some officials in Depnaker (the Department ofManpower) thought that it should be off the policyagenda for the next 10 to 15 years while otherdevelopment priorities were pursued. This group ofofficials considered that any available resources relatedto the Unemployed should go into Active LabourMarket programmes such as retraining, specialemployment, skill development, micro-credit, andassistance in setting up into self-employment.
Some other officials were more attracted to the ideaof individual compulsory savings accounts along thelines of the Singapore and Malaysia schemes, thoughwhether the unemployed could access any part of thesavings balances as a means of income support wasless clear.
The Ministry of Finance indicated that budgetconsiderations meant that there could be no availabletax funding for any scheme. This implies that anyUnemployment Benefit scheme would have to be self-funded from employer or employee contributions. .
Other ResponsesA number of those contacted who favoured anunemployment benefit scheme felt that any schemeshould be funded from Jamsostek surpluses or fromimprovements in administration efficiency or inJamsostek investment performance rather thanincreased premiums. This amounted to a proposal thatexisting levies should be restructured so that part wasre-designated as a contribution for UnemploymentInsurance, without total levies themselves increasing.Others however felt that Jamsostek levies should beused for the purposes they were intended and realbenefits to members improved. The issue is examinedin more detail in a subsequent section.
Overall, consultation responses indicated thatconsiderably more discussion between social partnerswas required before a firm scheme could be broughtforward.
Possible Characteristics of UnemploymentInsurance in Indonesia
Even with agreement of the social partners, it wouldbe very difficult in the short run to introduce more thana very limited form of Unemployment InsuranceBenefit in Indonesia. In part this is because the
Part III Chapter 14
157
predominance of informal economy employment, andalso because the large number of formal sector smallemployers who are not members of Jamsostek makesit difficult to know whether a person has become re-employed or not. In developed economies mostworkers are in the formal sector, and most are coveredby Social Insurance or other forms of Social Securityfor Unemployment. In developed countries withcompulsory social insurance for unemployment, whena formerly unemployed worker takes up another job,the fact can be registered automatically in the databasesof the social insurance fund and the benefit paymentcancelled and overpayments recovered. However, thisis not the case in Indonesia, as many workers who arelaid off would find jobs in areas not providing data toan Unemployment Insurance Fund. Alternativemeasures to verify employment status are likely to becostly and with limited reliability under currentcircumstances.
A second problem is that the only organisation whichhas the potential to operate a National UnemploymentInsurance Fund (Jamsostek) is a number of years awayfrom having the capacity to run a periodic paymentsystem such as a weekly unemployment benefit. Italso lacks its own inspectorate function.
Because of the particular characteristics ofemployment and unemployment in Indonesia, it issuggested that at this stage only a Short TermUnemployment Benefit is feasible. This would meanthat the insured unemployment benefit was time-limitedand payable only for a specified number of weeks.After entitlement ran out those who were stillunemployed would have to access other Social SafetyNet programmes such as Padat Karya (specialemployment schemes).
A Short Term Unemployment Benefit scheme mighthave the following features:
• Entitlement to claim a benefit if a worker is maderedundant would accrue after a worker or theemployer had paid premiums for a specified period,for example one year, or 12 months in the past 24months. Once a benefit had been claimed, theworker or the new employer would have tocontribute again for a further qualifying period beforebecoming eligible for a benefit again.
• Unemployment Benefit would not be payable if aperson voluntarily left a job, or if seasonal workceased on its normal cycle. It would also benecessary to devise rules about whether anyentitlement existed if a worker was dismissed for
misconduct. In most benefit systems specified typesof misconduct disqualify the person from benefitreceipt, subject to appeal rights.
Initial membership of an Unemployment InsuranceFund could be defined as the same group now requiredto be members of Jamsostek. Coverage couldsubsequently be expanded to other groups.
A more restrictive initial membership option would beto start only with the groups classified as permanentemployees. However, this would mean that the groupmost liable to be unemployed — the short-term contractworkers — would not be covered in the first stage ofthe scheme. An option is to include these groups incoverage by allowing premiums paid via severalsuccessive employers to accumulate an entitlement tobenefit.
A decision would also need to be made on whethercivil servants would be included in the coverage of thescheme. Traditionally it has been assumed that civilservants had highly stable employment, and thatprovided they carried out their work properly, they wereat minimal risk of unemployment. Hence, they wouldnot need to be covered by an Unemployment InsuranceScheme. However, the upheavals connected with theabolition of a number of departments, the “sinking lid”policy on numbers, plus the impact of regionalisationand devolution now throw the assumption of long termjob security for civil servants into question. If civilservants were to be included in an UnemploymentInsurance Scheme, then either they or the governmentwould have to pay the premiums to the UnemploymentInsurance Fund.
Form of BenefitOne option for implementing Unemployment Insurancein Indonesia on a fast track basis is to begin with alump sum payment system rather than periodicpayments. This would mean that the UnemploymentBenefit system would initially operate rather like aseverance pay system. Once the UnemploymentInsurance Fund had built up capacity, including capacityto verify employment status, it would be possible toconsider shifting to a periodic payment system suchas a weekly, fortnightly, or monthly unemploymentbenefit. The Fund could also consider developing“second tier” active labour market programmes toassist the Unemployed to find alternative means ofself-support.
One advantage of starting with a lump sumunemployment benefit is that the processingrequirements for claims would be very similar to those

Part III Chapter 14
158
already used for verifying claims for withdrawal ofRetirement Savings balances from Jamsostek. Thevolume of claims could be expected to be larger, but itshould be feasible to handle these once the reforms tothe Jamsostek computer and information systems arein place.
While a lump sum Unemployment Benefit systemshares some of the disadvantages of severance pay inthat the amount of payment is not related to actualneed for support, it is a system which could be set uprelatively quickly for existing Jamsostek clients if thiswere a government priority. It could then be modifiedlater into a periodic payments system when thecapacity to implement such a system had beendeveloped.
Level of Benefit PaidAn option is that the benefit paid to any unemployedworker would be a percentage of the insured wageupon which premiums had been paid. This would giveworkers and unions an incentive to scrutinise theirrecords to ensure that premiums had been paid on theirbehalf, and that employers had declared the full wagepaid to the Unemployment Insurance Fund. The ILOproposal that Jamsostek provide regular informationto employee members would assist in this process. Aside benefit of improved information and scrutiny isthat payment into other Jamsostek programmes couldincrease.
As an example of how an initial lump sumUnemployment Benefit might work, suppose that thebenefit rate was set at 50% of the insured wage. Ifthe benefit were paid in a lump sum to cover 6 weekof benefits, this would be a lump sum equal to 3 weeksnormal pay. If it were to be for 12 weeks, this wouldbe a lump sum equal to 6 weeks normal pay.
Alternative options to the model above are:—
• To pay a flat rate Unemployment Benefit based onthe minimum wage, or possible on the local minimumwage, or a specified percentage of the minimumwage. This option would redistribute income fromthe better paid to the lower paid workers in the eventof unemployment. It would also tend to lower theaverage cost of the scheme and hence the premiumswhich had to be paid. A possible problem is employer/employee collusion to declare only minimum wagessince the amount paid in would not change benefitentitlement. It could also be possible to charge a flatrate contribution for coverage, though this would bearmost heavily on the low-paid;
• To pay supplements to the benefit for the need tosupport a dependent spouse and children. This optionwould mean that the basic benefit would have to beset at a lower percentage of wages to cover costs,or else higher premiums charged. Higher premiumsfor married people are currently applied forJamsostek health insurance;
As noted, it is considered that more discussion betweensocial partners is needed on such issues.
How an Unemployment InsuranceBenefit might be Funded.
In the discussions with social partners, a number ofoptions for funding unemployment benefits wereexplored. These are commented on in more detail:
• Employer payments;• Employee payments;• Payments shared between employers and employees;• Employers paying, but offsetting Unemployment
Insurance entitlement against severance pay; and• Use of Jamsostek surpluses.
Employer Premium FundingOne option is for employers to pay all the premiumcosts of Unemployment Insurance without any changesin existing severance pay obligations. This isadministratively feasible, but raises the cost ofemploying people. It might also lead to furtherpressures for employers to avoid Jamsostek andUnemployment Insurance Fund membership, or not todeclare all their workers, or pay the full salaries.Conversely, Employees would have greater incentiveto press their employers to join the Fund. As noted,employers were strongly opposed to this option.
Employee PaymentsA second option is that employees should pay all thepremiums by deductions from their wages and salaries.This is also administratively feasible. However, it wouldmean some further reduction in real wages in the shortterm, following on from the declines after the 1997crisis. There might also be increased pressure fromsome employees for their employers not to joinJamsostek and the Unemployment Insurance Fund.Employee organisations consulted were stronglyopposed to this option.
Employees and Employers Share PaymentA third option is for employers and employees to sharethe costs of the premium. This could impose equalsacrifice, but could give both an incentive to avoid Fundmembership. However, it is a model which operates in

Part III Chapter 14
159
may countries. This option achieved cautious responsesfrom the social partners which appeared to depend onwhat else was on the table. However, it was clearthat employers did not wish net labour costs to rise,and employees did not wish real net wages to fall. Theoption may be more acceptable in a time of economicbuoyancy accompanied by rising real wages and profits.
Employer Funding with Severance Pay OffsetA fourth option would be for employers to pay thepremiums, but be allowed to reduce any severancepay due by the amount of lump sum unemploymentbenefit payable to the discharged worker. Thus forexample if the lump sum unemployment benefitpayment was equal to five weeks pay, the employerwho had paid all due premiums would be entitled todeduct five weeks payment from any severance paydue to the discharged worker.
For employers the system amounts to a partial pre-payment of severance pay liability. While it raises up-front costs for employers, it means the financial burdenof severance pay is less when their enterprise is indifficulties.
This option also improves the position of workers. Whilethe total amount due to longer-term employees isunchanged, they are certain of getting theUnemployment Benefit lump sum even if the enterpriseemploying them collapses. Shorter-term employees gainfinancial rights which they do not currently have.
For this system to work, there would have to be aspecified minimum number of months of premiumpayments made in respect of each qualifying employeebefore the benefit became payable. If this were notdone, there would be a tendency for some employersto join the Unemployment Insurance Schemeopportunistically just prior to making workersredundant.
As noted some employers expressed interest in thisoption. Employee representatives, however, did notwish to see any erosion of existing severance payrights.
Replacing Severance Pay with Un-employment Benefit
A longer-term option would be to replace SeverancePay entirely with an Employer-funded UnemploymentBenefit for insured workers and employers. Uninsuredemployers could still be left liable to pay SeverancePay. This would act as an incentive to become insured.Service Pay (Gratuity) is not considered in thediscussion which follows.
Replacing Severance Pay with Unemployment Benefitwould involve winners and losers amongst both workersand employers. The workers who would “gain” wouldbe those who received Unemployment Benefit for alonger period than the equivalent of their formerSeverance Pay entitlement. These would be mainlythose with shorter employment duration. Those whowould “lose” would be the workers who found newjobs relatively quickly. However, the payments thenwould be more closely related to need. The paymentreceipt would also be more certain than is currentlythe case with Severance Pay.
Amongst employers those who would gain would bethose with a less stable employment pattern, becausetheir premium payments would be less than previousSeverance Pay obligations. Employers with verystable employment patterns who did not make staffredundant would tend to lose out. It would of coursebe possible to have differential employer premiums,as in the Employment Accident Scheme at present,though this would require a more complexadministration and ILO is recommending considerationof a change to a unified contribution rate.
To replace all of the current 5 months of maximumSeverance Pay with Unemployment Benefit is arelatively major undertaking. A “trade-off” might bean equivalent maximum period of UnemploymentBenefit payment. However, 5 months Severance Paytranslates into about 43 weeks Unemployment Benefitpayment at a rate of benefit payment equal to 50% ofthe insured wage. This is substantially longer benefitduration than is envisaged for the type of Short TermUnemployment Benefit discussed earlier. Accordingly,it may be feasible to replace only part of SeverancePay with Unemployment Insurance benefits in the earlystages of setting up a system. Alternatively, thebalance of the current Severance Pay entitlement couldbe “traded off” against the cost of some other typesof employer-funded social insurance protection, suchas Maternity Benefits for women workers andSickness or Invalidity Benefits.
Employer and employee views on this option followthe responses earlier indicated. Discussion by the socialpartners might need to be set in the context of a muchwider ranging consideration of social protection options.
Use of Jamsostek Surpluses
Another option is to use Jamsostek surpluses to fundan Unemployment Insurance Benefit scheme. If therewere enough profits available, this approach could beimplemented technically by lowering contribution rates

Part III Chapter 14
160
for programmes other than Old Age Benefit, and re-designating the amounts saved as UnemploymentInsurance premiums. This approach would leave totalpremiums paid unchanged.
However, the year 2000 surpluses of Jamsostek wereabout Rp .212,000 million before tax. This is only aboutone third of the amount needed to run anUnemployment Insurance Benefit providing 50%replacement income for 3 months. Hence presentprofits would not be enough to fund an unemploymentbenefit scheme, though they could provide part of thenecessary funds. However, increased efficiency byJamsostek, notably in increasing the proportion of realincomes on which premiums are paid, could raise thecurrent level of surpluses.
It also needs to be recognised that even if theseincreased amounts of surpluses were realised, thereare several competing claims for the use of Jamsosteksurpluses. These include: improving benefits in existingprogrammes (e.g. for long term disability), expandingother programmes (e.g. Sickness Benefit), increasingallocations for Old Age Benefit or Pensions, andupgrading Jamsostek computer systems. The relativepriorities of these claims would need to be decided.
Finally, while Jamsostek currently has surpluses,changed financial conditions could erode this potentialpartial funding source.
Other Financing Options For InformalSector Workers
If workers in the informal economy are also to beprovided with some form of unemployment insurancecover, there would need to be a means of financingthis.
For “informal sector” workers and temporary workerswhose conditions of employment are in reality similarto those of formal sector workers, an option is simplyto deem them to be covered and require theirsponsoring firm to collect and pay contributions on theirbehalf. However, under present circumstancescompliance with this requirement is likely to be aproblem
For “cottage industry” type workers in the informaleconomy, the funding problem is more difficult. Wherethey are subcontractors for a larger firm, an option isto collect a percentage of the contract price, with themain contracting firm being responsible to collect thisamount and pay it to Jamsostek. For other situations,voluntary standard payments linked to standardminimum benefits may be an option.
Jamsostek as a Potential Administratorof Unemployment Insurance
Jamsostek is the only public entity in Indonesiapotentially capable of administering an UnemploymentInsurance Fund. The collection of premiums could beassociated reasonably easily with its current collectionof premiums for Old Age Benefits, Death Benefits,and Employment Accident Benefits. Provided the legalliability for contributions to pay for the different setsof benefits were the same, the premium could simplybe collected along with existing premium collectionsfrom the same group of members. However, to set upa payment system for paying out unemploymentbenefits some changes in Jamsostek computer andinformation systems would be needed. These wouldinclude individual employee identification, a uniquemembership number, and eventually provision for aperiodic payment system and an inspection function.These issues are set out more fully in the ILO Reviewof Operations and Information Technology Systemsof Jamsostek and discussed in Part I of this Publication.
For an initial lump sum payment system the changesrequired would not be so large. Such a system wouldrequire very similar processes to the existing processesused for verifying and paying entitlements to Old AgeBenefits for workers who have been members for fiveyears or more who have been made redundant. Oncurrent processes these require provision of:—
• Original Jamsostek membership card (KPJ);• Personal ID Card (KPT);• Family Identification card (Kartu Keluarga); and• Letter confirming termination of employment /PHK
from the company.
Jamsostek is currently geared up to process over600,000 such applications each year. Addition ofUnemployment Insurance to Jamsostek programmeswould substantially expand this volume, requiring morestaff and resources, but would not involve radicallynew processes. The main additional requirement wouldbe evidence of registration with the EmploymentService offices.
Shifting to a periodic payment system forUnemployment Insurance benefits would require muchlarger changes and, if this were a priority, wouldprobably take several years to set up — including theinitial policy development and legislative phases. Anearly requirement would be an inspection capacity inJamsostek. However, Jamsostek will need to developa periodic payment system in any case if there is to beany future transformation of the Old Age Benefit intoa pension paid on a periodic basis.

Part III Chapter 14
161
Currently Jamsostek has 2,164 permanent staff plusabout 600 “outsourced” or temporary staff. This is arather low ratio to its 9 million plus active members. Inpart this reflects the limited number of programmesJamsostek runs, plus the fact that some functions,which are normally part of a social insurance entity,are currently designated as the responsibility of otheragencies. The notable case is inspection, which hasbeen carried out by Depnaker but has recently beentransferred to the regional administrations.
Jamsostek Cost StructureCurrently Jamsostek offers a standard “package” ofthree or four programmes to employers and their staff.Most members take only the three compulsoryProgrammes (Old Age Benefit, Employment AccidentBenefit, and Death Benefit), while only a minority alsosign up for the Health Benefit programme. Employersand their staff may instead choose health coveragefrom a private health insurance company or providein-house coverage.
In addition to this standard arrangement there arecertain “Special Programmes” which cover short-termcontract workers in industries such as construction.These cover only Employment Accident and DeathBenefits. Unlike the standard programmes theirfunding is not wage-based, but is financed by levies onthe value of the contract. Currently these SpecialProgrammes operate with substantial financialsurpluses.
Dividing the estimated number of active Jamsostekmembers (9,382,786) into the estimated totaladministrative and operating costs of Jamsostek (Rp.232,843 million) produces an estimated averageadministrative cost of Rp. 24,816 per year per activemember. This of course covers 3 and sometimes 4programmes per member.
Isolating the cost of the Old Age Benefit Programmealone is more difficult as Jamsostek does not keep itsaccounts in a form which separately identifies costs.However, a 1997 exercise attempted to build a costallocation model, which produced the followingtentative estimates:—
Figure 72 Table of Jamsostek Programmes as %of Operating Costs
Title Scheme % of CostsJHT Old Age Benefit 86.24JKK Employment Accident 2.98JPK Health 1.64JKM Death Benefit 1.28
The cost allocation to Old Age Benefit seems high,and may be influenced by the increased numbersclaiming an early payout when the Asian Crisis struck.The Health and Employment Accident estimates alsolook low. However, these are the only figures availableat the moment. On this basis the administrative cost ofrunning the Old Age Benefit system would be aboutRp. 21,400 a year per active member.
This figure gives some idea of the possible order ofmagnitude for the cost of running an UnemploymentInsurance Benefit system covering existing Jamsostekmembers, which made only lump sum payments tothose who became unemployed. In practice theincremental costs of collecting premiums should be lessthan the collection cost embodied in this figure, becausesome of the joint costs of collecting premiums wouldnot be repeated. How much this is cannot be estimatedmore closely until a more detailed costing model isdeveloped which separately identifies the cost ofactivities such as premium collection and payment ofclaims. Offsetting this, it is probable that the frequencyof claims for Unemployment Benefit would exceedthe current frequency of claims for withdrawal of OldAge Benefit account balances. Tentatively it isassumed that the median claim rate might be a littlemore than twice as high. This would raise the claimscomponent of administrative costs. In the otherdirection, the potential reduction in claims for earlywithdrawal of Old Age Benefit (or the possible jointdetermination of any such claims) would provide a costsaving on the existing Old Age Benefit programme.
What the administrative cost figure will actually turnout to be cannot be estimated with any real accuracyuntil Jamsostek develops a proper cost allocation systemfor its separate programmes and for the separateactivities, notably premium collection and claimsprocessing within these programmes. For costingpurposes is provisionally assumed that the incrementalcosts of Jamsostek operating a modified lump sumpayment Unemployment Insurance Benefit system isRp.15,000 per member per year. This cost would riseif a periodic payment system were introduced, thoughbenefit payment costs might be reduced. Using theRp.15,000 per member incremental cost and multiplyingthis by the assumed current active membership of9,382,786 Jamsostek members, produces and annualcost figure of approximately Rp.140,000 million. Thisis equivalent to about 0.4 % of the Insured Wage basein Jamsostek. These figures assume year 2000 costlevels and numbers of members. The figures could beexpected to be higher in the future, but revenue wouldalso rise if numbers were larger and wage levels higher.

Part III Chapter 14
162
What would be provided by this figure would bepremium collection, recording of member data, andclaims processing and payment of benefits. Most ofthis work would be integrated with existing Jamsostekprocesses. There would be little resource left to verifythe validity of ongoing claims of unemployed status
Benefit Costs
Cost estimates for benefits depend on what percentageof wages the benefit replaces, and how many weeksthe benefit is payable for. The following calculationsassume:—
• Alternative replacement rates of 50, 60 and 70 % ofinsured wages; and
• Alternative average periods of payment of 5, 10 and15 weeks.
It may be noted than in a properly administered, periodicpayment system the average number of weeks ofbenefit payment would be lower than the maximumnumber of weeks for which it is payable. However, ina lump sum payment system the two would be thesame.
The ratio of average to maximum duration ofunemployment benefits is hard to estimate in Indonesia.General labour force data suggests long averageunemployment durations of around 6 months, whichcould imply that most people would not have movedoff a short duration benefit of say 13 weeks maximumperiod of payment. However, first job seekers heavilyweight the labour force average, and the averageunemployment duration for those formerly employedmay be lower. On the other hand, the existence of anUnemployment Benefit could change job searchbehaviour. It might lead to longer job search periods(and hence longer periods on benefit) as workerslooked for good or average jobs rather than taking thefirst option available.
Benefits and Insured WagesThe estimate of average insured wages has beenderived by taking the revenue for the Death Benefit(calculated at 0.3 % of the insured wage), dividing thisby the number of active members, and then grossingthe average figure up to what the base wage musthave been to produce these revenue numbers. Thiscalculation suggested that the average insured wagein Jamsostek is equal to Rp. 3,650,000 per year, orabout Rp. 70,000 per week. This may be a substantialunderestimate of actual wages in the insured group.Average urban wages in the year 2000 labour forcesurvey were just under Rp. 500,000 per month, and
the skew of Jamsostek membership towards largercompanies suggests that the current membership trueaverage wage may be higher again. However, thelower figure used in these calculations it is what actualcurrent contributions to Jamsostek are based on. Itshould also be noted that even when actual wages arefully declared, these may be only basic wages and maynot include the variety of supplements, fringe benefits,and overtime payments which boost the actual paypacket. However, an insurance system basespayments on insured wages.
On the basis of wages actually declared to Jamsostek,the weekly cost per person of various replacementrates for Unemployment Benefit would be as follows.The average cost figures assume a random distributionof unemployment in relation to wage level as shown inFigure 4.
Figure 73 Average Weekly Cost per Benefit Paid
Replacement Weekly Cost PerAverage Rate Benefit Paid
Percentage (000 rupiah)
50 3560 4270 49
From these figures a matrix of cost per beneficiarycan be derived for 5, 10 and 15 week average durationof payment:—
Figure 74 Cost per Beneficiary per Benefit Pay-ment Paid
Average Cost per Beneficiary of BenefitPayment (000 Rupiah)
Weeks of PaymentReplacement Rate %.
50% 60% 70%
5 175 210 24510 350 420 49015 525 630 735
The next stage requires an estimate to be made ofhow many beneficiaries might claim and receiveUnemployment Benefit in any one-year. Low mediumand high projections have been made. The lowprojections assume 10%, the medium projection 15%,and the high projection 20%.
It should be noted that the Claim Grant Rates are notUnemployment Rates. Unemployment rates at anypoint of time are usually much lower than annual claim
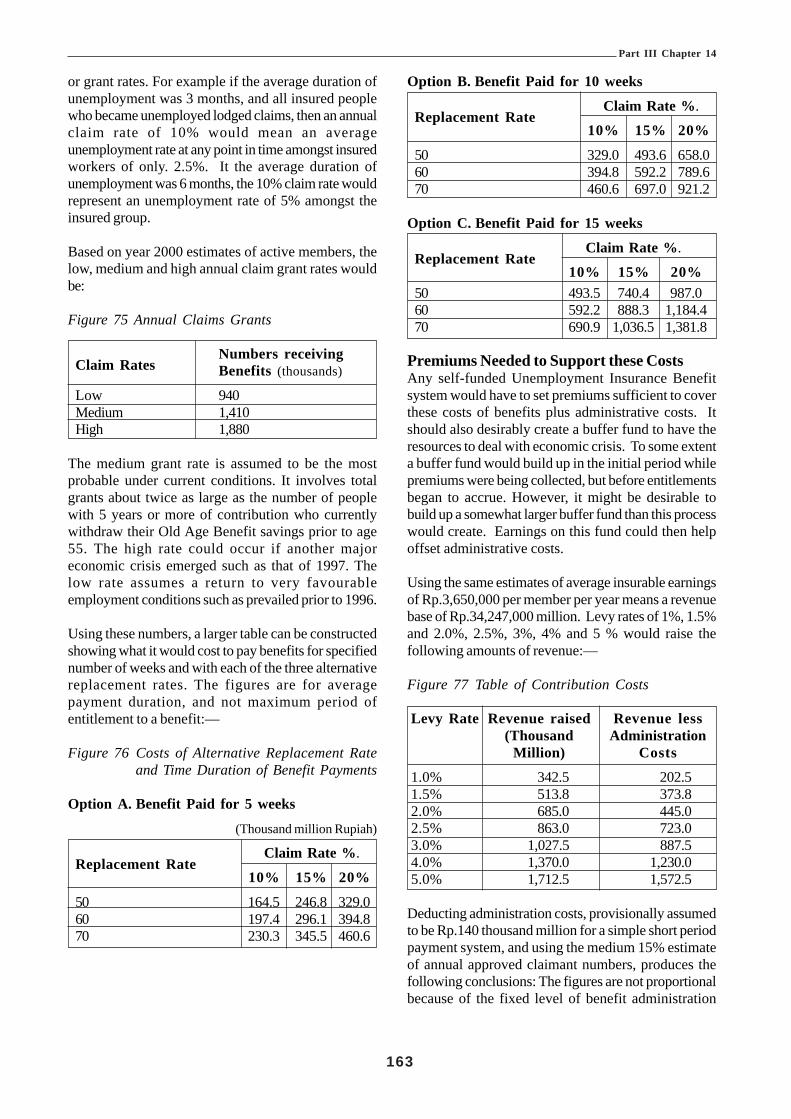
Part III Chapter 14
163
or grant rates. For example if the average duration ofunemployment was 3 months, and all insured peoplewho became unemployed lodged claims, then an annualclaim rate of 10% would mean an averageunemployment rate at any point in time amongst insuredworkers of only. 2.5%. It the average duration ofunemployment was 6 months, the 10% claim rate wouldrepresent an unemployment rate of 5% amongst theinsured group.
Based on year 2000 estimates of active members, thelow, medium and high annual claim grant rates wouldbe:
Figure 75 Annual Claims Grants
Claim RatesNumbers receivingBenefits (thousands)
Low 940Medium 1,410High 1,880
The medium grant rate is assumed to be the mostprobable under current conditions. It involves totalgrants about twice as large as the number of peoplewith 5 years or more of contribution who currentlywithdraw their Old Age Benefit savings prior to age55. The high rate could occur if another majoreconomic crisis emerged such as that of 1997. Thelow rate assumes a return to very favourableemployment conditions such as prevailed prior to 1996.
Using these numbers, a larger table can be constructedshowing what it would cost to pay benefits for specifiednumber of weeks and with each of the three alternativereplacement rates. The figures are for averagepayment duration, and not maximum period ofentitlement to a benefit:—
Figure 76 Costs of Alternative Replacement Rateand Time Duration of Benefit Payments
Option A. Benefit Paid for 5 weeks
(Thousand million Rupiah)
Replacement RateClaim Rate %.
10% 15% 20%
50 164.5 246.8 329.060 197.4 296.1 394.870 230.3 345.5 460.6
Option B. Benefit Paid for 10 weeks
Replacement RateClaim Rate %.
10% 15% 20%
50 329.0 493.6 658.060 394.8 592.2 789.670 460.6 697.0 921.2
Option C. Benefit Paid for 15 weeks
Replacement RateClaim Rate %.
10% 15% 20%50 493.5 740.4 987.060 592.2 888.3 1,184.470 690.9 1,036.5 1,381.8
Premiums Needed to Support these CostsAny self-funded Unemployment Insurance Benefitsystem would have to set premiums sufficient to coverthese costs of benefits plus administrative costs. Itshould also desirably create a buffer fund to have theresources to deal with economic crisis. To some extenta buffer fund would build up in the initial period whilepremiums were being collected, but before entitlementsbegan to accrue. However, it might be desirable tobuild up a somewhat larger buffer fund than this processwould create. Earnings on this fund could then helpoffset administrative costs.
Using the same estimates of average insurable earningsof Rp.3,650,000 per member per year means a revenuebase of Rp.34,247,000 million. Levy rates of 1%, 1.5%and 2.0%, 2.5%, 3%, 4% and 5 % would raise thefollowing amounts of revenue:—
Figure 77 Table of Contribution Costs
Levy Rate Revenue raised Revenue less(Thousand Administration
Million) Costs
1.0% 342.5 202.51.5% 513.8 373.82.0% 685.0 445.02.5% 863.0 723.03.0% 1,027.5 887.54.0% 1,370.0 1,230.05.0% 1,712.5 1,572.5
Deducting administration costs, provisionally assumedto be Rp.140 thousand million for a simple short periodpayment system, and using the medium 15% estimateof annual approved claimant numbers, produces thefollowing conclusions: The figures are not proportionalbecause of the fixed level of benefit administration

Part III Chapter 14
164
costs assumed. These mean that a levy of about 0.4%of insured wages must be collected to finance the costof administration even before any benefits can be paid.Hence, if the Unemployment Insurance Fund operateson a Pay as You Go basis, and a claim rate of 15% isassumed, the following average levels of benefitswould link to alternative premium rates. If the Fundbuilt up a buffer reserve in the early years, earningson the buffer fund could produce slightly betteroutcomes than those listed below:—
PAYG Benefits at specified Contribution Rates:The indicative range of premiums and the benefit levelsthese would support are indicated as follows. In eachcase the premium is expressed as a percentage ofinsured wages.
• A premium rate of 5% would support a benefit of 70% of insured wages for 32 weeks or a benefit of50% of insured wages for 45 weeks;
• A premium rate of 4% would support a benefit setat 70% of insured wages for 25 weeks, or at 50% ofinsured wages for 35 weeks;
• A premium rate of 3% would support anunemployment benefit of 70% of insured wages forabout 18 weeks, or a benefit set at 50% of insuredwages for about 25 weeks;
• A premium rate of 2.0% would support a benefit of70% of insured wages for about 9 weeks or a benefitof 50% of insured wages for about 13 weeks; and.
• A premium of only 1% would support a benefit of70% of insured wages for about 4 weeks, or 50% ofinsured wages for about 6 weeks.
It should be noted that these figures are averages. Aneffectively policed periodic payment system couldreduce benefit average duration while increasing themaximum allowable period on benefit.
A second consideration is the probability that numbersof employers under-declare wages paid for Jamsostekpurposes. To the extent that a more active inspectionpolicy raised average wage declaration rates levyincome might be higher than the figures calculatedhere. Average benefits would also rise, but the financialposition of the Fund (and hence capacity to pay morebenefits) would improve because administrative costswere fixed in the short run.
However, the initial calculations suggest that anUnemployment Benefit Fund would have to set levies
at several percent of insured wages if a worth whileamount of benefit is to be payable. How much abovethis level is a matter of policy choice related to howmuch employers and workers are prepared to pay toimprove protection against unemployment.
A minimalist periodic payment scheme would be onewith a levy rate of around 1.5%; a maximum benefitduration of 13 weeks (ILO Convention 102); and abenefit rate set at 50% of insured earnings. Thiscalculation assumes that average benefit duration isaround 8 weeks rather than the 13 weeks maximum.However, because of the potential margin of error inbenefit uptake rates, it might be better to establish aminimum scheme with a contribution rate of 2% ofinsured wages. This would provide some margin tobuild up a buffer fund, and to subsequently expandgenerosity of cover plus the associated cost of a moreextensive inspection and verification system and/orsome active labour market measures.
A sensible approach may be to set the levy rate at 2%and then review the situation once the UnemploymentInsurance Fund had built up to a level sufficient tocover one year’s payments of benefits and other costs.If it was then decided to keep the scheme at aminimalist level it might be possible to then drop thecontribution rate back to 1.5%. (This might not be thecase if the economy moved into severe recessionagain). Alternatively, additional funds could be spenton Active Labour Market Programmes such as trainingor special employment.
Implementation Strategy
In the final analysis it is the decision of the Governmentof Indonesia and the Social Partners who must decidewhether they want an Unemployment InsuranceBenefit system and if so what level of cost they areprepared to pay to fund it. The calculations abovesuggest that premium rates of at least 2 or 3% ofinsured wages will be needed to provide a worthwhileperiod of social protection for whose who lose theirjobs in the formal sector. A modest minimal schememight cost 1.5% to 2% of wages. The standardcalculations used for illustrative purposes assume a2% contribution rate.
If Government and the Social Partners wish to proceed,then there are some strategic decisions which wouldneed to be made, particularly concerning the type ofsystem which would come in, and the phasing ofcontributions and entitlements. As noted, at this stageof Indonesia’s development only a scheme for insuredformal sector workers seems currently feasible. Othermeasures would be needed to assist other groups:—

Part III Chapter 14
165
• It would be necessary to decide if a periodic paymentsystem would be set up from the beginning, or if aninitial stage of a lump sum only scheme would startthe system off. If it was desired to begin with a fullperiodic payment system, then more start-up timewould be needed to allow systems development totake place, including proper inspection systemattached to the Unemployment Insurance Fund toverify compliance with legislative conditions ofentitlement;
• If it is desired to develop “Active Labour Market”schemes as a second tier to an initial period of passivereceipt of Unemployment Benefit, then thought willneed to be given as to what these schemes are to beand who is to administer and deliver them; and
• It will also be necessary to decide a phasing strategyin relation to the state of the economy and the sizeof the buffer fund which could be built up. If thescheme started in a period of low unemployment itwould be possible to build up a buffer fund quickly,or to phase contribution rates up more gradually.Conversely, if the Unemployment Insurance BenefitScheme started up during an economic crisis it wouldbe necessary to move immediately to full contributionrates and possibly seek start-up assistance from theGovernment.
Alternative PhasingThree alternative implementation strategies could beconsidered depending on the scheme chosen.
• All of the required contribution rate could be imposedfrom the first year. This approach allows an initialbuffer fund to build up, since no benefits are payableuntil after 12 months of contributions have been paid.This approach could be considered if a relativelymodest minimal scheme were to be set up, andpossibly also if employer liability to pay premiumswas “traded off” against some existing liability topay severance pay;
• A second option is a phased implementationtimetable. For example if a contribution rate of 3%were chosen, the rate could go up by 1% each year,reaching the target level in the third year. Benefitentitlements could also be phased in;
• The third option is a staged implementation. Therewould be no fixed timetable, but stages would bebrought in when conditions were favourable, forexample when the economy was expanding andbusiness conditions were good, or when Jamsostekwas geared up to run a periodic payment system.
Implementation and the Economy
There is something of a dilemma in choosing the righteconomic time to bring in an Unemployment InsuranceBenefit Scheme. It can be most easily afforded wheneconomic conditions are buoyant and unemploymentlow. However, the need for a scheme is greatest wheneconomic conditions are bad, and unemployment is high.Unfortunately, these conditions also mean more claimson the scheme, and fewer people paying incontributions. A scheme launched in the middle of arecession such as that of 1997 would have to chargehigher premiums, or receive an initial governmentsubsidy, or face the risk of becoming insolvent.Conversely a scheme launched in good times couldbuild up large buffer funds to deal with future crises.
In the end this is a political choice. However, it issuggested that any scheme launched in the next fewyears should include the objective of holding reservesequal to at least one full year of benefit payments plusadministrative costs. If reserves were more than twiceannual costs for more than two years in a row, thescheme conditions and premiums could be reviewed.Unlike “long tail” schemes such as pensions or disabilitybenefits, there is no good reason to accumulate largereserves in a short term Unemployment InsuranceBenefit Fund. However, the reserves should be largeenough to enable the Fund to withstand recessionshocks such as the 1997 Asian Crisis. It may also benoted that if reserves have been built up to a healthylevel, it would be possible to invest some of this reserveinto small scale business loan schemes to fundunemployed people into their own small businesses.
Premium Level NeededA number of sets of calculations and economicscenarios were calculated for the ILO project. Thecalculations indicated that a contribution rate of about2% of insured wages appears to be of about the rightorder of magnitude for the type of scheme modelledunder existing economic conditions in Indonesia. Thiswas a scheme paying insured workers 50% of theirinsured earnings for up; to 3 months in the event ofunemployment.
Conclusions
There is clearly a need for some form of unemploymentassistance in Indonesia in the longer term.Unemployment is a serious problem which has veryadverse consequences for those who lose their jobs.At the same time the existing redundancy pay systemhas not worked particularly well for many workers.In practice also large-scale early withdrawals of Old
Part III Chapter 14
166
Age Benefit savings by workers who are Jamsostekmembers indicates that the Old Age Benefit schemehas become a kind of de facto unemploymentassistance scheme. This undermines its role as anOld Age Savings scheme, and further undermines thepotential to turn it into a pension scheme.
Of the options, a short- term unemployment benefitfor insured workers seems the most feasible optionfor Indonesia in its present circumstances.
• A wide coverage unemployment assistance schemealso covering uninsured workers appears not feasiblebecause of the high proportion of the workforce inthe informal economy and the huge scale ofunderemployment in the labour force.Unemployment amongst the uninsured group willneed other solutions, including capacity developmentand special employment schemes; and
• At this stage it appears to be feasible to operate onlya short period unemployment benefit scheme. Longduration unemployment benefits appear to beunfeasible for the present because of the limitedability to verify whether a worker who has lost a job
in the insured sector has actually been re-employedor not including employment in the informal economy.
It does appear to be economically feasible to developa short period unemployment benefit. A scheme withup to 3 months benefit duration and a 50% incomereplacement rate could operate for a premium rate ofaround 2% of insured wages. Further, it seems feasiblefor Jamsostek to operate such a scheme provided itsinformation and computer systems are upgraded asrecommended in the separate report on Jamsosteksystems.
However, while a short period UnemploymentInsurance Benefit is economically and administrativelyfeasible; the priority and acceptability of any particularscheme to major stakeholders is unclear. Some groupshave reservations about paying benefits for passiveinactivity. Further, even amongst the groups supportingthe idea, there is still lack of agreement on who shouldpay for it, or at least opposition to anything whichfurther depresses real wages and profits in the presenteconomic conjuncture. Making progress at this stagerequires options to be further worked through to identifyif there is a social consensus on an UnemploymentInsurance Benefit scheme proceeding.
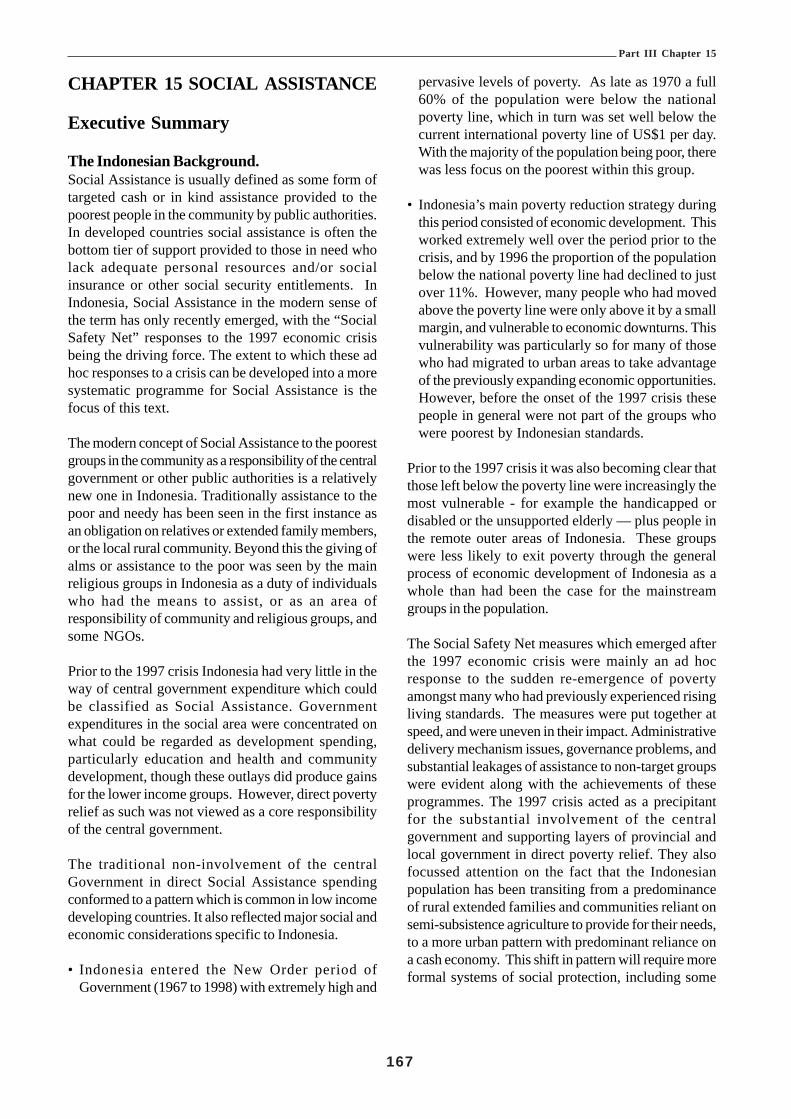
Part III Chapter 15
167
CHAPTER 15 SOCIAL ASSISTANCE
Executive Summary
The Indonesian Background.Social Assistance is usually defined as some form oftargeted cash or in kind assistance provided to thepoorest people in the community by public authorities.In developed countries social assistance is often thebottom tier of support provided to those in need wholack adequate personal resources and/or socialinsurance or other social security entitlements. InIndonesia, Social Assistance in the modern sense ofthe term has only recently emerged, with the “SocialSafety Net” responses to the 1997 economic crisisbeing the driving force. The extent to which these adhoc responses to a crisis can be developed into a moresystematic programme for Social Assistance is thefocus of this text.
The modern concept of Social Assistance to the poorestgroups in the community as a responsibility of the centralgovernment or other public authorities is a relativelynew one in Indonesia. Traditionally assistance to thepoor and needy has been seen in the first instance asan obligation on relatives or extended family members,or the local rural community. Beyond this the giving ofalms or assistance to the poor was seen by the mainreligious groups in Indonesia as a duty of individualswho had the means to assist, or as an area ofresponsibility of community and religious groups, andsome NGOs.
Prior to the 1997 crisis Indonesia had very little in theway of central government expenditure which couldbe classified as Social Assistance. Governmentexpenditures in the social area were concentrated onwhat could be regarded as development spending,particularly education and health and communitydevelopment, though these outlays did produce gainsfor the lower income groups. However, direct povertyrelief as such was not viewed as a core responsibilityof the central government.
The traditional non-involvement of the centralGovernment in direct Social Assistance spendingconformed to a pattern which is common in low incomedeveloping countries. It also reflected major social andeconomic considerations specific to Indonesia.
• Indonesia entered the New Order period ofGovernment (1967 to 1998) with extremely high and
pervasive levels of poverty. As late as 1970 a full60% of the population were below the nationalpoverty line, which in turn was set well below thecurrent international poverty line of US$1 per day.With the majority of the population being poor, therewas less focus on the poorest within this group.
• Indonesia’s main poverty reduction strategy duringthis period consisted of economic development. Thisworked extremely well over the period prior to thecrisis, and by 1996 the proportion of the populationbelow the national poverty line had declined to justover 11%. However, many people who had movedabove the poverty line were only above it by a smallmargin, and vulnerable to economic downturns. Thisvulnerability was particularly so for many of thosewho had migrated to urban areas to take advantageof the previously expanding economic opportunities.However, before the onset of the 1997 crisis thesepeople in general were not part of the groups whowere poorest by Indonesian standards.
Prior to the 1997 crisis it was also becoming clear thatthose left below the poverty line were increasingly themost vulnerable - for example the handicapped ordisabled or the unsupported elderly — plus people inthe remote outer areas of Indonesia. These groupswere less likely to exit poverty through the generalprocess of economic development of Indonesia as awhole than had been the case for the mainstreamgroups in the population.
The Social Safety Net measures which emerged afterthe 1997 economic crisis were mainly an ad hocresponse to the sudden re-emergence of povertyamongst many who had previously experienced risingliving standards. The measures were put together atspeed, and were uneven in their impact. Administrativedelivery mechanism issues, governance problems, andsubstantial leakages of assistance to non-target groupswere evident along with the achievements of theseprogrammes. The 1997 crisis acted as a precipitantfor the substantial involvement of the centralgovernment and supporting layers of provincial andlocal government in direct poverty relief. They alsofocussed attention on the fact that the Indonesianpopulation has been transiting from a predominanceof rural extended families and communities reliant onsemi-subsistence agriculture to provide for their needs,to a more urban pattern with predominant reliance ona cash economy. This shift in pattern will require moreformal systems of social protection, including some

Part III Chapter 15
168
form of Social Assistance. The longer-term issue forSocial Assistance policy is to determine whichapproaches are feasible in Indonesia, will reach theintended target groups, and will result in a sustainedreduction in poverty.
The ILO Report on the feasibility of introducing a SocialAssistance scheme undertaken as part of the Projecton ‘Restructuring the Social security System’ identifieda number of possible strategies for the Government ofIndonesia to adopt is relation the Social Assistance forthe assisting the poorest people. The main optionsidentified were:
• Do nothing and spend no Government funds on SocialAssistance. In effect this means relying wholly onthe traditional Indonesian support from extendedfamily, village, charity, and NGO assistance. It wouldmean phasing out the present Social Safety Netmeasures as the immediate crisis recedes;
• Have no formal scheme, but rely on “ad hoc”measures when particular crises strike, for exampleeconomic crises, refugee problems, or floods;
• Make social assistance the legal responsibility ofProvinces or Districts, but provide no centralgovernment funds;
• Set up a Government of Indonesia Social AssistanceAgency funded by the budget, and with local officesthroughout Indonesia;
• Add Social Assistance to the duties of JAMSOSTEK,the existing Social Insurance/Provident Fund scheme;
• Rely on micro-credit and related schemes;• “Contract” with Provincial and district governments
to deliver assistance, with each layer of Governmentproviding some of the funds; and
• “Contract” with NGOs to deliver social assistance.
Comments on each of these options are given later inthis Chapter.
The ILO Report concluded that it was not currentlyfeasible to set up an Indonesia-wide cash socialassistance scheme. However, it is possible that thisapproach could be considered in some of the moreadvanced provinces or districts of provinces. In thelonger run cash grants and benefits are likely to be arising component of Social Assistance. In the shortterm it is best to concentrate on those things whichhave a reasonable chance of being achieved. Moregenerally, it is probable that local initiatives could comeup with other options which are cost-effective providedthe programmes are operated with good governance.
Overall, it was suggested that core Social Assistancefor the period ahead could include the following:
• Rice subsidy or its equivalent for the poor;• Other food assistance for young children and nursing
mothers in poor families;• Health cards for the poor giving access to free
treatment in public facilities and free or subsidisedmedicines;
• Education scholarships for children for poor families;and
• Cash grants on a periodic payment basis to poorhouseholds where the local capacity to run such asystem exists.
Other options could be developed by agreementbetween the central government as main funder andthe provincial and district authorities as administeringagents and co-funders of any programmes.
The ILO report identified some possible fundingoptions, including a redeployment of part of the OilProducts subsidy; eventual excise taxes on OilProducts; redeployment of the funding for theelectricity subsidy and credit subsidies; some additionaltaxes, notably on tobacco products; and co-contributions from local administrations.

Part III Chapter 15
169
Bab 15 Bantuan Sosial
Rangkuman Eksekutif
Latarbelakang Indonesia
Bantuan sosial biasanya didefinisikan sebagai suatubantuan dalam bentuk tunai maupun dalam bentuk nontunai yang diberikan kepada orang-orang termiskindalam masyarakat oleh pihak b erwenang. Di negara-negara yang sudah maju, bantuan sosial sering kalimerupakan tingkat penunjang terbawah yang diberikankepada mereka yang membutuhkan yang sumberpenghasilan asuransi sosial atau hak atas jaminan sosiallainnya kurang memadai. Di Indonesia, Bantuan Sosialdalam pengertian modern baru dikenal akhir-akhir ini,yakni dengan diperkenalkannya Jaring PengamanSosial sebagai reaksi terhadap krisis ekonomi 1997.Sejauh mana reaksi yang bersifat ad hoc, terhadap krisistersebut dapat dikembangkan menjadi suatu programyang lebih sistematis untuk Bantuan Sosial merupakanfokus naskah ini.
Konsep modern Bantuan Sosial kepada kelompok-kelompok termiskin dalam masyarakat sebagaitanggung jawab pemerintah pusat atau pihakberwenang lainnya relatif masih baru di Indonesia.Secara tradisional, bantuan kepada orang yang miskindan berkekurangan pertama-tama dipandang sebagaikewajiban dari sanak saudara, kerabat atau anggotakeluarga besar yang bersangkutan atau bahkanmasyarakat lokal pedesaan. Di luar itu, pemberiansedekah atau bantuan kepada orang miskin dipandangoleh banyak kelompok agama di Indonesia sebagaikewajiban individu yang mempunyai harta kekayaanuntuk memberikan bantuan atau sebagai bidangtanggung jawab kelompok-kelompok masyarakat danagama, serta beberapa organisasi non pemerintah.
Sebelum krisis tahun 1997, hanya sedikit pemerintahpusat Indonesia yang dapat dikategorikan sebagaiBantuan Sosial. Pengeluaran pemerintah di bidangsosial dikonsentrasikan pada apa yang dapat dianggapsebagai pengeluaran pembangunan, terutama untukpengembangan pendidikan, kesehatan dan masyarakat,walaupun bidang-bidang yang dibiayai tersebutmemberikan keuntungan bagi kelompok-kelompokberpenghasilan rendah. Meskipun demikian, bantuanuntuk meringankan beban kemiskinan secara langsungseperti itu tidak dipandang sebagai tanggung jawab intipemerintah pusat.
Secara tradisional, tidak terlibatnya pemerintah pusatdalam pengeluaran untuk memberikan Bantuan Sosialsecara langsung sesuai dengan pola yang umumdijumpai di negara-negara sedang berkembang yangberpendapatan rendah. Hal tersebut juga mencermin-kan pertimbangan-pertimbangan utama di bidang sosialekonomi yang bersifat khas Indonesia.
• Indonesia memasuki periode Pemerintahan OrdeBaru (1967-1998) dengan tingkat kemiskinan yangamat tinggi dan menyeruak di mana-mana. Padatahun 1970, 60% penduduk Indonesia berada dibawah garis kemiskinan nasional, yang selanjutnyaberada jauh di bawah garis kemiskinan internasionalsaat ini sebesar US$1 per hari. Karena sebagianbesar penduduk Indonesia saat itu tenggelam dalamkemiskinan, maka orang-orang termiskin di antarayang miskin kurang diperhatikan.
• Strategi utama Indonesia dalam menanggulangikemiskinan selama periode ini terdiri daripembangunan ekonomi. Pembangunan ini berjalandengan sangat baik hingga periode sebelum terjadinyakrisis dan pada tahun 1996, proporsi penduduk yangberada di bawah garis kemiskinan nasional telahmenurun hingga mencapai sedikit di atas 11%. Tetapi,penduduk yang bergerak naik di atas garis kemiskinankebanyakan hanya bergeser sedikit di atas garistersebut sehingga mereka masih rentan terhadapkemerosotan ekonomi. Kerentanan ini terutamatercermin pada mereka yang pindah ke daerah-daerah perkotaan untuk memanfaatkan peluang-peluang ekonomi yang sebelumnya sedangberkembang. Tetapi, sebelum terjadinya krisismoneter tahun 1997, orang-orang ini secara umumbukan merupakan bagian dari kelompok yangtermiskin menurut standar Indonesia.
Sebelum terjadinya krisis tahun 1997 juga jelas bahwamereka yang tertinggal di bawah garis kemiskinan kianbanyak dan mereka merupakan orang-orang yangpaling rentan – misalnya orang yang cacat atau orangusia lanjut tanpa dukungan keuangan – ditambah orang-orang yang tinggal di daerah-daerah terpencil diIndonesia. Kecil peluang yang dimiliki kelompok-kelompok ini untuk keluar dari kemiskinan melaluiproses pembangunan ekonomi Indonesia secara umumsebagai suatu keseluruhan dibandingkan kelompok-kelompok utama yang terdapat dalam populasi.
Langkah-langkah yang dilakukan Pemerintah dalambentuk Jaring Pengaman Sosial yang muncul setelah

Part III Chapter 15
170
krisis ekonomi tahun 1997 sebagian besar merupakantanggapan yang bersifat ad hoc terhadap munculnyakembali kemiskinan secara tiba-tiba di antara banyakorang yang dulunya mengalami kenaikan dalam standarhidup mereka. Langkah-langkah tersebut dilaksanakansecara tergesa-gesa dan dampaknya tidak merata.Masalah-masalah administrasi mekanisme penyaluranadministratif jaring pengaman sosial, masalah tatakelola, dan besarnya kebocoran dari bantuan yangdiberikan kepada kelompok-kelompok bukan sasarantampak jelas seiring dengan pencapaian-pencapaianyang diperoleh program ini. Krisis 1997 merupakansuatu titik balik bagi keterlibatan pemerintah pusatbeserta lapisan-lapisan pendukung dari pemerintahprovinsi dan pemerintah lokal secara substansial dalamupaya penanggulangan kemiskinan secara langsung.Mereka juga memusatkan perhatian pada kenyataanbahwa penduduk Indonesia telah dan sedangmengalami transisi dari keluarga besar yang sebagianbesar tinggal pedesaan dan masyarakat-masyarakatyang bergantung pada pertanian semi subsistensi untukmemenuhi kebutuhan mereka ke pola yang lebih bersifatperkotaan dengan ketergantungan yang besar padaperekonomian tunai. Pergeseran pola ini akanmemerlukan sistem-sistem perlindungan sosial yanglebih formal, termasuk beberapa bentuk Bantuan Sosial.Masalah berjangka waktu lebih panjang untukkebijakan Bantuan Sosial adalah untuk menetapkanpendekatan-pendekatan mana yang paling sesuai untukditerapkan di Indonesia yang dapat menjangkaukelompok-kelompok sasaran yang dituju, dan yangdapat menyebabkan berkurangnya kemiskinan secaraberkesinambungan.
Laporan ILO mengenai kelayakan memperkenalkansuatu skema Bantuan Sosial yang dilakukan sebagaibagian dari Proyek mengenai “Restrukturisasi SistemJaminan Sosial,” mengidentifikasi sejumlah strategiuntuk digunakan Pemerintah Indonesia dalamkaitannya dengan Bantuan Sosial untuk membantugolongan masyarakat yang termiskin. Pilihan-pilihanyang telah teridentifikasi adalah:• Tidak melakukan apa-apa, dan tidak menggunakan
uang Pemerintah untuk Bantuan Sosial. Artinya,bergantung sepenuhnya pada bantuan keuangan yangdiberikan oleh keluarga besar yang merupakanbantuan tradisional Indonesia, bantuan desa, dermadan bantuan organisasi non pemerintah. Hal ini berartimengurangi Jaring Pengaman Sosial yang diberikansekarang secara bertahap seiring denganberkurangnya krisis;
• Tidak mempunyai skema formal, tetapi bergantungpada langkah-langkah ad hoc apabila timbul krisistertentu, misalnya, krisis ekonomi, masalah pengungsi,atau banjir;
• Menjadikan bantuan sosial sebagai tanggung jawabprovinsi atau kabupaten, tetapi tanpa dana daripemerintah pusat;
• Membentuk Instansi Bantuan Sosial PemerintahIndonesia yang didanai dari anggaran negara dengankantor lokal di seluruh Indonesia;
• Menambahkan Bantuan Sosial kepada tugas-tugasJAMSOSTEK, skema Asuransi Sosial/ DanaProvident yang ada saat ini;
• Bergantung pada skema kredit mikro dan skema-skema terkait lainnya;
• Menjalin “kontrak” dengan pemerintah provinsi dankabupaten untuk memberikan bantuan, dimana tiaplapis pemerintah memberikan sebagian dana bantuan;dan
• Menjalin “kontrak” dengan organisasi non pemerintahuntuk memberikan bantuan sosial.
Tanggapan mengenai masing-masing cara tersebut diatas dibahas dalam Bab mengenai Bantuan Sosial.Laporan ILO menyimpulkan bahwa saat ini tidaklahdimungkinkan untuk membentuk suatu skema bantuansosial tunai di seluruh Indonesia. Namun, adalahmungkin untuk mempertimbangkan pendekatan ini dibeberapa provinsi atau kabupaten yang sudah lebihberkembang. Untuk jangka yang lebih panjang,pemberian bantuan dan manfaat secara tunaikemungkinan akan menjadi komponen Bantuan Sosialyang semakin meningkat. Untuk jangka pendek, yangterbaik adalah berkonsentrasi pada hal-hal yangmempunyai peluang yang wajar untuk diwujudkan.Secara lebih umum, inisiatif-inisiatif lokal mungkin dapatmemberikan cara-cara lain yang efektif dari segi biayaasalkan program-programnya dijalankan berdasarkantata kelola yang baik (good governance).
Secara keseluruhan disarankan bahwa Bantuan Sosialinti untuk periode selanjutnya dapat mencakup hal-halberikut ini:• Subsidi beras, atau yang setara dengan itu untuk
orang miskin;• Bantuan pangan lainnya untuk anak kecil dan ibu-
ibu menyusui di keluarga-keluarga miskin;• Kartu kesehatan untuk orang miskin yang
memungkinkan pemegangnya untuk mendapatkanperawatan cuma-cuma di fasilitas-fasilitas kesehatanumum dan mendapatkan obat secara cuma-cumaatau dengan subsidi;

Part III Chapter 15
171
• Beasiswa pendidikan untuk anak-anak dari keluargamiskin; dan
• Bantuan uang tunai melalui pembayaran secaraperiodik kepada rumah tangga miskin di mana adakapasitas di tingkat lokal untuk menjalankan sistemseperti ini.
Cara lain dapat dikembangkan berdasarkankesepakatan antara pemerintah pusat sebagai pemberidana utama dan pihak berwenang di tingkat provinsidan kabupaten sebagai instansi pengelola administrasi
sekaligus rekan yang bersama pemerintah pusat jugaikut menjadi penyandang dana dari program-programyang ada.
Laporan ILO ini mengidentifikasi beberapa carapendanaan yang dapat dilakukan, termasukpenggunaan kembali sebagian subsidi hasil minyak;pemungutan cukai penjualan terhadap produk minyak;penggunaan kembali pendanaan untuk subsidi listrikdan subsidi kredit; beberapa pajak tambahan, khususnyapajak atas produk-produk tembakau; dan iuran bersamadari pemerintah daerah.

Part III Chapter 15
172
The 1997 Crisis and the Social SafetyNet
The 1997 economic crisis reversed the previousdowntrend in poverty. By late 1998 over 24 per centof the population were again below the national povertyline. Most Indonesians experienced real income lossesas price inflation outpaced nominal income gains. Somesections of the community did experience real incomegains (for example exporters whose prices were fixedin hard currencies), but most groups experienced realincome declines.
There was a massive decline in average real wagesas price rises deflated the real value of money wages.General inflation was 78% in 1998, while food pricesrose by 118%. Despite increases in money incomes,real wages fell by about one third in 1998. Meanconsumption levels fell 24.4% nationally — those inurban areas by 33.9% and in rural areas by 13.4%.The distribution of the consumption cutbacks wasskewed, and median consumption fell only 1.5%, withthe median urban reduction being 5%. It is difficult toexplain this pattern but it appears to be a combinationof severe consumption cutbacks by those most affectedby the crisis and precautionary cutbacks indiscretionary spending by some other previouslyaffluent groups; with the more traditional rural dwellersand hence the median being less affected. Significantgroups of mainly urban or other non-farm householdsmoved from relative affluence to poverty as a resultof the crisis, and this group affected the mean averagedrop in consumption more than the median.
There are some indications than many households soldor pawned assets to cope with the impact of the crisis.In general urban areas were worse affected by thecrisis than rural areas, though rural Java soonexperienced the flow on effects of the downturn inthe cities. Per capita daily food consumption inIndonesia fell from 2,019.79 calories in 1996 to 1,849.36in 1999. Protein consumption per capita in grams fellfrom 54.49 to 48.67. The national Poverty index whichhad dropped to just over 11% in 1996 rose to over24% in December 1998.
The sudden precipitation of large groups back intopoverty and the worsening of the position of many ofthose already in poverty generated the first majorinvolvement of the Indonesian Government into povertyrelief through Social Assistance measures. Thesemeasures known collectively as the Social Safety Nettook several forms:
• The initiative reaching the largest number of people,even if in small measure, was the rice subsidyprogramme, known technically as the Special MarketOperations programme (OPK). This allowed the targetpoverty households to buy 10 (later 20) kilos of riceper month at a price of Rp. 1,000 per kilo. At the timeaverage market prices were of the order of Rp. 2,500per kilo;• A second set of initiatives involved special
employment creation programmes, (Padat Karya)which were also to be targeted to the poor and thosewho had lost employment;
• A third programme extended scholarships designedto encourage children from poor families to stay onin school, and provided additional grants to schools;
• In the Health sector additional grants were given toHealth centres, and low income people were to begiven Health cards which enabled them to accesssome free health care. An associated nutritionprogramme provided higher quality foods for babiesand their mothers, also in theory targeted to poorhouseholds; and
• Community development grants were also given tosome poor communities, and associated small loans.At a subsequent stage some cash grants were madeunder this programme.
In addition to these programmes, there were also someother poverty relief programmes provided by NGOs,including some food for work programmes.
Part of the cost of the Social Safety Net programmeswas financed by external loans from the World Bankand ADB, particularly in the period from 1998 onwards.This of course accumulated debt, which musteventually be repaid by the Government of Indonesia.It also raises the issue about what domestic sourcesof funds would fund any future Social Assistanceprogrammes once the loan funds run out.
The Size of the Social Safety NetInitiatives
Measuring the size of the Social Safety Net initiativesis somewhat problematic, since the measure dependson what is included in the coverage. A number of themeasures announced as part of the Social Safety Netsuch as additional grants to schools were expansionsof existing activities rather than entirely new activitiesfor the central government. Also, some assistance fromoutside came in kind rather than cash. Irwan, Rahman,Romdiati and Suhaini estimated the size of the outlays
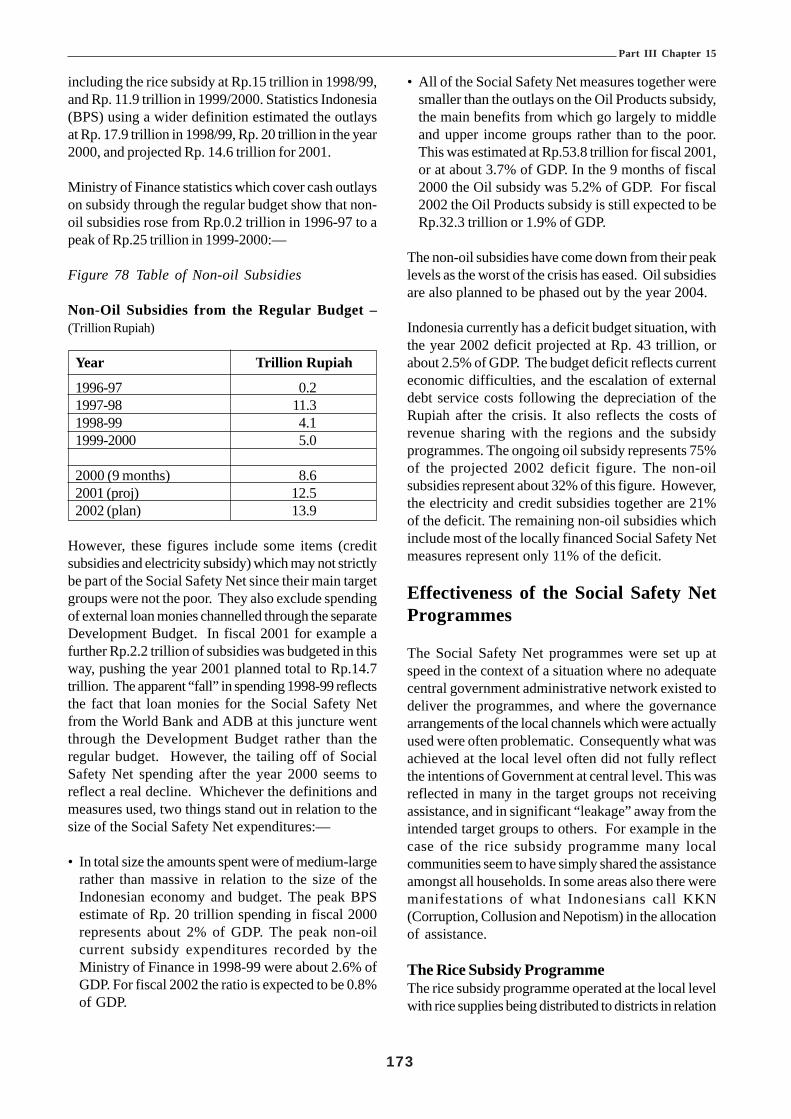
Part III Chapter 15
173
including the rice subsidy at Rp.15 trillion in 1998/99,and Rp. 11.9 trillion in 1999/2000. Statistics Indonesia(BPS) using a wider definition estimated the outlaysat Rp. 17.9 trillion in 1998/99, Rp. 20 trillion in the year2000, and projected Rp. 14.6 trillion for 2001.
Ministry of Finance statistics which cover cash outlayson subsidy through the regular budget show that non-oil subsidies rose from Rp.0.2 trillion in 1996-97 to apeak of Rp.25 trillion in 1999-2000:—
Figure 78 Table of Non-oil Subsidies
Non-Oil Subsidies from the Regular Budget –(Trillion Rupiah)
Year Trillion Rupiah
1996-97 0.21997-98 11.31998-99 4.11999-2000 5.0
2000 (9 months) 8.62001 (proj) 12.52002 (plan) 13.9
However, these figures include some items (creditsubsidies and electricity subsidy) which may not strictlybe part of the Social Safety Net since their main targetgroups were not the poor. They also exclude spendingof external loan monies channelled through the separateDevelopment Budget. In fiscal 2001 for example afurther Rp.2.2 trillion of subsidies was budgeted in thisway, pushing the year 2001 planned total to Rp.14.7trillion. The apparent “fall” in spending 1998-99 reflectsthe fact that loan monies for the Social Safety Netfrom the World Bank and ADB at this juncture wentthrough the Development Budget rather than theregular budget. However, the tailing off of SocialSafety Net spending after the year 2000 seems toreflect a real decline. Whichever the definitions andmeasures used, two things stand out in relation to thesize of the Social Safety Net expenditures:—
• In total size the amounts spent were of medium-largerather than massive in relation to the size of theIndonesian economy and budget. The peak BPSestimate of Rp. 20 trillion spending in fiscal 2000represents about 2% of GDP. The peak non-oilcurrent subsidy expenditures recorded by theMinistry of Finance in 1998-99 were about 2.6% ofGDP. For fiscal 2002 the ratio is expected to be 0.8%of GDP.
• All of the Social Safety Net measures together weresmaller than the outlays on the Oil Products subsidy,the main benefits from which go largely to middleand upper income groups rather than to the poor.This was estimated at Rp.53.8 trillion for fiscal 2001,or at about 3.7% of GDP. In the 9 months of fiscal2000 the Oil subsidy was 5.2% of GDP. For fiscal2002 the Oil Products subsidy is still expected to beRp.32.3 trillion or 1.9% of GDP.
The non-oil subsidies have come down from their peaklevels as the worst of the crisis has eased. Oil subsidiesare also planned to be phased out by the year 2004.
Indonesia currently has a deficit budget situation, withthe year 2002 deficit projected at Rp. 43 trillion, orabout 2.5% of GDP. The budget deficit reflects currenteconomic difficulties, and the escalation of externaldebt service costs following the depreciation of theRupiah after the crisis. It also reflects the costs ofrevenue sharing with the regions and the subsidyprogrammes. The ongoing oil subsidy represents 75%of the projected 2002 deficit figure. The non-oilsubsidies represent about 32% of this figure. However,the electricity and credit subsidies together are 21%of the deficit. The remaining non-oil subsidies whichinclude most of the locally financed Social Safety Netmeasures represent only 11% of the deficit.
Effectiveness of the Social Safety NetProgrammes
The Social Safety Net programmes were set up atspeed in the context of a situation where no adequatecentral government administrative network existed todeliver the programmes, and where the governancearrangements of the local channels which were actuallyused were often problematic. Consequently what wasachieved at the local level often did not fully reflectthe intentions of Government at central level. This wasreflected in many in the target groups not receivingassistance, and in significant “leakage” away from theintended target groups to others. For example in thecase of the rice subsidy programme many localcommunities seem to have simply shared the assistanceamongst all households. In some areas also there weremanifestations of what Indonesians call KKN(Corruption, Collusion and Nepotism) in the allocationof assistance.
The Rice Subsidy ProgrammeThe rice subsidy programme operated at the local levelwith rice supplies being distributed to districts in relation
Part III Chapter 15
174
to the estimated poverty incidence, and in turn beingdistributed to villages or counterpart lower levelsubdivisions of urban areas where actual allocationstook place. The poverty measure initially used wasbased on the Indonesian Family Planning Association(BKKBN) classification of households, with the targetgroup being the lowest of the 4 classifications used byFamily Planning. These “pre-prosperous” (i.e. poor)households were characterised by the absence of oneor more of the following criteria for economicreasons:—
• Ability to eat at least twice per day;• Main floor area not dirt;• Had change of clothing for work and other activities;• Able to seek medical assistance for sick children,
and family planning services for contraceptive users;and
• Able to practice the principles of the family religion.
The evaluation by the SMERU Research Instituteindicated that the rice subsidy programme did reachand assist many poor households. However, there wasa significant degree of “leakage” and miss-targeting.Just over half (52.6%) of the households in the bottom20% of the population in terms of consumption levelsreceived some assistance from the programme.However, three quarters of recipients were “non-poor”households in terms of SMERU consumption criteria,and most of the rice subsidy outlay went to these “nonpoor” groups, or at least to households outside thebottom 20% in terms of consumption standards.
It should be noted that the SMERU analysis showedrelatively poor correlation between the Family Planningclassifications and the lowest 20 per cent of householdsclassified by consumption levels. There were a numberof reasons for this:—
• Some of the households which were asset poor onBKKBN criteria (e.g. because their dwelling had adirt floor) were not in fact the lowest category interms of ability to fund current consumption;
• Some households which had not been poor at thetime the BKKBN lists were drawn up hadsubsequently fallen into poverty because of the crisis;
• Some households which were not in the lowestconsumption group on the SMERU criteria were infact financing their current consumption levels byassets sales or borrowing; and
• Some types of households (e.g. single people) didnot feature in the BKKBN lists. A problem also insome areas was the lack of a local identity card bypoor households, often leading to assistance not being
provided to those households. However, in someareas these households were included.
The poor correlation between the different measuresof poverty, and the small margins between manycategorised as “poor” or “non poor” led to somemodification of allocation guidelines, involvingagreement that people in the second from bottomBKKBN group could also be included in thedistribution. In practice however the distribution wentwider than these two groups while missing manyhouseholds which were actually poor
The rice subsidy programme achieved some of itsobjectives, particularly in helping very large numbersof people during the worst of the crisis, but was poorlytargeted in terms of normal social assistance criteriaof need — with the local distribution mechanism onlypartly responding to central government priorities.
Education Assistance and the ScholarshipsProgrammeA second set of social safety net initiatives took placein the education area with the objective of preventinglarge dropouts from school participation during thecrisis. The families of children going to school inIndonesia are required to pay some fees, and inprevious economic crisis situations withdrawingchildren from school had been one way poor familiescoped with a reduction in income.
The education response took two forms:
• Some additional block grants were made to thepoorest 60 per cent of schools in districts; and
• Scholarships were made available which weresupposed to be targeted on the poorest students whowere at risk of dropping out from school.
The extra block grants seem to have helped the schoolsfaced with escalating costs, though some commentatorshave suggested that the longer run effect was for“normal” funding to be subsequently trimmed.
The major focus of the programme however was onscholarships for poor students. The target was toprovide assistance to 6% of primary students, 17% oflower secondary students, and 10% of upper secondarystudents. At least half were to be girls. Allocation ofscholarships was done through local school committeescomprising the headmaster, a teacher representative,a parent’s association representative, the village head,and a local community association representative.

Part III Chapter 15
175
The SMERU evaluation showed that in practice:
• Only 4% of primary students rather than the target6% received a scholarship grant, while 71% of thegrants went to children from non-poor households.Only 5.8% of children from poor householdsreceived, scholarship grants;
• For lower secondary schools the scholarship grantrate was 8.4% compared with the 17% target. Again71% of grants went to children from non-poorhouseholds, and 12.2% of children from the pooresthouseholds received grants; and
• For upper secondary school students the grant ratewas only 3.7% compared with a target rate of 10%.Again 71% of grants went to children from non-poorhouseholds, and programme coverage amongst poorstudents was only 5.4%.
In some instances students appear not to have receivedthe full amount of the grant.Overall the scholarship programme had some impacton the children of poor households, particularly at thelower secondary school level, but large leakagesoccurred to non-target groups where most of thefunding ended up.
At its worst the school participation rate dropped byonly 1.5% and subsequently recovered. Thescholarship programme played some role in thissatisfactory outcome. However, larger factors mayhave been the strong commitment of parents to thevalue of education (in contrast to reactions during earliereconomic downturns). The UNDP CBS study in 1999also identified the flexibility many schools displayed intrimming school costs or allowing textbooks to beborrowed. Also, because of the long boom whichpreceded the economic crisis, more households hadassets which could be sold or pawned to cover realincome reductions for a period.
Special Employment SchemesThe third main social safety net programme was acollection of special employment schemes run by upto 16 government departments and agencies, andcollectively described as Padat Karya. This was anamalgam of different types of schemes, including someworks schemes which had existed prior to the crisis.These had diverse objectives, including upgrading urbaninfrastructure and increasing participation of womenin productive employment. There was no single set ofprinciples underpinning these schemes, though theywere supposed to hire the poor and those who hadbecome unemployed, and to pay local minimum wages.
The SMERU evaluation for 1998-99 indicated that5.6% of households had at least one member whoparticipated in a Padat Karya programme. For poorhouseholds this was 8.4% and non-poor households4.9%.
The programmes did pick up numbers of the poor andthose who had lost jobs, (though the quantitativemagnitude of households reached was much smallerthan the coverage of the rice subsidy programmes).However, a number of problems emerged in theoperations of many of these programmes. This includedhiring of non-target people, paying wages which werewell above local minimums (and hence attractingpeople out of other employment), and in some casespeople being paid for work which was not actuallydone. The overall value to the community of the workcarried out was not always clear.
Health AssistanceAnother social safety net priority area was health carefor the poor, where there were fears that the economiccrisis would force poor households to abandon modernmedical services, reversing the previous decades ofimproving health status and access to medical care.The response was the JPS-BK programmes for thehealth sector. For some of the programmes the targetingcriteria for access to a health card was also the FamilyPlanning “pre-prosperous” group of households, thoughthis was later made more flexible. Initiatives includedsubsidies for medicines and imported medicalequipment, additional operational support funds forcommunity health centres, free medical and familyplanning services, and supplementary food for pregnantwomen and children under three years old.
In the early stages attempts were also made to set upHealth Maintenance Organisations, but this programmewas subsequently curtailed.
As regards the health cards, the SMERU evaluationshowed that 6.3% of households used their health cardsto obtain free medical services, including 10.3% of thepoor and 5.3% of the non-poor. This suggestedsignificant leakage. The survey also found that somecardholders did not use their cards when obtaininghealth services. The SMERU evaluation did not clarifythe reasons for this in the survey questions andresponses themselves, but indicated that this may havebeen because of the desire to obtain better qualitymedical services than were available from the public

Part III Chapter 15
176
health service providers to whom the cardholders hadaccess.
The special nutrition programme reached 15.9% of allpregnant women and children under three. For thepoor the participation rate was 16.5% and for the non-poor 15.8%. 79% of beneficiaries were non-poor. Ineffect there was virtually no skew in favour of thepoor in this programme. However, significant numbersof people were assisted, and pregnant women are agroup where nutrition risk is higher than average.
Community Development GrantsCommunity development grants aimed at transferringsome savings on the Oil Products subsidy into cashgrants to the poorest families in the poorest villages.The SMERU evaluation in two areas only indicatedthat this programme actually did get grants through topoor people, and had a more transparent selectionprocess that some of the other programmes, possiblybecause of the involvement of NGOs. However, theprogramme did not actually seem to do much for self-reliance or community development. There were alsoproblems over administrative costs and access by peoplewith poor transport access. The conclusion was that“quick fix” programmes of this sort were not adesirable long run way to proceed with communitydevelopment.
Summary on Social Safety NetProgrammes
The combined Social Safety Net programmes had apositive effect on outcomes for the poor and thosemost impacted by the crisis. But most were poorlytargeted with high or very high degrees of leakage tothe non-poor, with many of the poor missing out onallocations. Lack of effective governance andadministrative delivery mechanisms and differencesin local and central perspectives on how funds shouldbe allocated meant that only parts of the originalgovernment objectives of the programmes were met.This is not surprising in view of the speed with whichprogrammes were put in place in response to the crisis.However, it also suggests that much better planningand targeting and better governance mechanisms wouldbe needed for any longer run Social Assistance system.
It should be noted that not all government officialsaccepted the SMERU assessments of the degree ofmiss-targeting and leakages from the Social Safety Netprogrammes. Two arguments were frequently
advanced to defend the ongoing programmes. The firstwas that the degree of targeting had improved sincethe initial SMERU assessments were done. Thesecond was that there were only moderate differencesin economic situation between the official “poor” andtheir “near poor” neighbours. Hence assistanceflowing to the “near poor” groups should not beregarded as leakage or miss-targeting. It is alsosuggested that there are very real limits on the extentto which centrally determined priorities can actuallybe delivered at the local level in Indonesia, and thatobjectives of any Social Assistance programme cannotbe set at too ambitious a level.
Overall, several of the Social Safety Net programmesform a good foundation for a longer term SocialAssistance delivery system. The problems associatedwith them are largely problems of implementation andcontrol rather than in the basic approach adopted. Forexample, Health Cards are an excellent way oftargeting health assistance to the poor. The practicalproblems lie in ensuring that the health services thatthe cards are supposed to provide access to actuallyexist at an adequate level; and also in ensuring that thecards go to the poor and needy rather than to others.
Other Anti Poverty Measures
One other anti-poverty measure taken by the authoritieswas the de facto relaxation of restrictions on urbanarea traders in the informal economy. This led to thegrowth in the numbers of stalls and mobile carts (kakilima) in the urban areas. In some areas pedal cycletaxis re-emerged. The growth in this informal activityhelped to provide employment, but also made pedestrianmovement on congested sidewalks and lanes moredifficult. In Jakarta the problem has seen some movesto enforce regulations against some of these informaleconomy activities.
However, there may be other “pro-poor” options forencouraging such employment in the informal economy.For example there are many boarded up building sitesin Indonesian cities, the result of building projectscancelled or deferred following the 1997 crisis. Tradersin the informal economy could open these up totemporary use while they are not required forconstruction — provided the safety of the traders andtheir customers was not at risk.
More generally, the main anti-poverty stance of theIndonesian government is expected to be economic

Part III Chapter 15
177
development. Within this, priorities are expected to bepromoting economic opportunities for the poor,facilitating empowerment, and enhancing security. Thislast area includes social security. Outside of the formalsector, social security for the poor is seen by Bappenasas:
• Supporting existing schemes in community institutionsand extended family efforts; and
• Providing better mechanisms and schemes to assistthe poor when there is an economic downturn,drought or other natural disaster.
This categorisation indicates that the Social Safety Netis seen largely as temporary and episodic rather thanpermanent. However, the Task Force set up by theIndonesian Government may come up with longer termstrategies which extend the temporary Social SafetyNet concept into a longer term Social assistanceframework to meet the changing needs of Indonesiansociety. Options which might be considered are setout later in this Publication.
Social Safety Nets and SocialAssistance
Social Assistance is assistance in cash or kind targetedto the poor or other groups deemed to be in need ofassistance because of their disadvantaged situation.Targeting involves an assessment of the social andfinancial situation of the groups receiving assistance.
Using this definition, many of the measures includedin the Social Safety Net programme should not beregarded as Social Assistance, even if they have othermerits from a development perspective. For exampleadditional bulk grants to schools and additionalallocations to hospitals are part of education and healthpolicies rather than Social Assistance. Similarly theelectricity and credit subsidies do not seem to haveinvolved the element of targeting on the poor whichcharacterises Social Assistance.
Of the measures included in the Social Safety Netprogrammes (and putting to one side the issue of“leakages”), the following parts of the Social SafetyNet programmes would seem to meet normal criteriaof definitions of Social Assistance:
• Rice Subsidies to the poor;• Additional food for poor pregnant women, babies,
and children;
• Health Cards giving the poor free medical treatmentfrom public facilities;
• Educational Scholarships for student from poorfamilies; and
• Cash grants to poor people.
In addition, Special Employment at minimum wagesfor unemployed people has a Social Assistancedimension, though it is more usually classified as anActive Labour Market Policy. In an Indonesia contextit also has a potential community developmentdimension when the Special Employment schemes areused to develop community infrastructure. The use ofwell-designed Special Employment schemes has aparticular attraction over and above “passive” formsof Social Assistance because it allows those householdswith potential earners to work for their own support,while at the same time providing additional facilities orservices to the community.
There are of course some problems from a widerpoverty reduction strategy in focussing too heavily onSocial Assistance based on need. Firstly, manyelements of traditional Social Assistance do little tobuild capacity for self-support. Hence, it isunderstandable that the Indonesian authorities wouldwish to give major emphasis to those forms of SocialAssistance such as targeted Education and Healthassistance which tend to build long run capacity.Secondly, the quality of the services to which the poorare given free or subsidised access is also important.Hence improving the quality of hospitals, health centresand schools which the poor and others use also has animpact on the poor, even though it cannot be classifiedas Social Assistance.
More generally, Social Assistance is the bottom layeror safety net of an anti-poverty programme. The largercomponents consist of economic development, includingsocial investments in health and education which buildcapacity to be self supporting, plus the expansion ofsocial insurance coverage. As a bottom layer, SocialAssistance can be expected to focus mainly on thosewho lack the long run capacity to be self-supporting,plus those who are temporarily in poverty. The formergroup in particular have problems which cannot beaddressed by capacity building approaches.
Unmet Needs
Before going on to consider what a medium or longerterm Social Assistance policy in Indonesia might cover,

Part III Chapter 15
178
it is useful to consider some of the unmet needs whichmay be growing in scale.
The traditional Indonesian Government response topoverty focuses on expanding economic opportunitiesand, more recently, on providing temporary relief tothose affected by the economic crisis. However, thisapproach presupposes that individuals or at leastfamilies and households can normally solve their ownproblems. This may not be true for some groups inthe population. There are a number of areas whereassistance policy is still to address unmet needs in theIndonesian population:
• One area is the growth in the number of elderlypeople. Life expectancy at birth in Indonesia roseby 24 years between the early 1960s and 1999,climbing from 42 to 66 years. With a time lag, thisrise in survival rates is feeding into the growth in thenumbers and proportion of older people. Traditionallydependent elderly people have been cared for bytheir extended families, with urban migrants oftenreturning to their rural villages of origin. However,with a rising proportion of older people in thepopulation and the long-term urbanisation of muchof the population, the proportion of indigent elderlywithout a rural family to return to can be expectedto rise. The problem is compounded by the tendencyfor those formal sector workers who are JamsostekOld Age Benefit Fund members to withdraw theircontribution balances when they becomeunemployed. This depletes a potential source ofassistance for part of the aging population. In thelonger term specific policies to deal with the problemof indigent elderly will need to be developed. In themedium term, this group may be a large and growingclaimant on any general Social Assistance measuresfor the poor.
• A second group consists of the disabled and othersunable to work because of their physical or mentalimpediments. To the extent that this drags down thetotal capacity for self- support of their household,Social Assistance may be needed. At this stage thereis not even a permanent disability benefit in the formalinsured sector. This may be where the approachshould start.
If a longer term Social Assistance structure is todevelop, these two areas at least will need to beaddressed.
Scale of Funding Needed
A major consideration in estimating the potential costof a more systematic Social Assistance strategy aimedat raising households above the national poverty line isthe numbers of people who would need to be assistedand the average amount that would need to be providedin Social Assistance. This or course will vary with thehousehold composition of the poor, and the varyingamounts of Education and Health assistance, and foodsubsidies or cash grants included in the SocialAssistance “package” received by each povertyhousehold.
As background it may be noted that the rice subsidy at20 kilos provided an income equivalent subsidy equalto about Rp. 30,000 per month to those who receivedthe full allocation.. Temporary grants to occupationalinjury cases for two years have been Rp. 50,000 permonth
Different sources provide different estimates of thecurrent measure of the national poverty line in termsof current monthly Rupiah costs. The ADB JPS usesa figure of Rp. 39,807 per capita per month, while theMinistry of Health uses Rp. 37,220 per month. Thesefigures, of course, are not adjusted for variations inhousehold composition and need, or rural urbandifferences. However, using a rounded up figure ofRp. 40,000 per month implies that a household of 4people would on average need Rp. 160.000 a monthto be just above the national poverty line. This is stillwell below alterative international poverty measureestimates. Currently about 10 million households areregarded as being below the national poverty line andanother large group are “near poor” and might beincluded in a wider social assistance policy, particularlyfor Health and Education assistance.
To estimate what poverty relief for the first group onlywould cost, it is necessary to make some assessmentof the average “poverty gap,” the difference betweenthe actual income of poor households and the minimumtarget income. For example, if the average “povertygap” was Rp. 50,000 per month per household, closingthis gap would cost about Rp. 600,000 per year, orabout Rp.6 trillion per year for 10 million households.
In practice however Social Assistance may have togo to a wider group, particularly for Health andEducation assistance, and part of the assistance to thepoorest groups may be on top of minimum income needestimates to recognise development needs. For

Part III Chapter 15
179
example, if the Social Assistance package cost anaverage of Rp. 100,000 per month for the 10 millionpoorest families, and Rp. 50,000 per month for the next10 million “near poor” families, the total cost would beRp.18 trillion per year. These are relatively substantialamounts of money for a government with fiscal fundingproblems, though part of this cost is already includedin the budget in the form of existing Social Assistancemeasures. Rp. 6 trillion is about 0.4% of GDP, whileRp. 18 trillion is equal to about 1.2% of GDP.
Proposed total allocations for domestically financednon-oil subsidies in fiscal 2002, some of which goes onSocial Assistance, are estimated at Rp. 13.9 trillion.However, the Oil Products subsidy which benefitsmainly middle and upper income groups is projected atRp. 32.3 trillion in fiscal 2002. This suggests that thereis scope for subsidy re-allocations in a pro-poor manner.
For international comparative purposes it should benoted that Rp. 50,000 was equal to about US$5 at 2001exchange rates and Rp. 100,000 was then aboutUS$10.
Characteristics of Effective SocialAssistance Systems
Before considering the extent to which a more formalsocial assistance system is feasible in Indonesia, it ishelpful to consider the features which tend tocharacterise well functioning social assistancesystems. These include:
• A broad social agreement on who should be helpedand in what circumstances;
• Well designed policies which are far as feasible limitassistance to those individuals and households notcapable of supporting themselves from employment— and do not “draw in” people who could supportthemselves from their own efforts;
• A source of funding which is sufficient but not toocostly for the national economy;
• An accurate means of identifying the poor and needyat the local level; and
• An efficient and honest administrative system fordelivering assistance to those defined as eligible.
On these criteria, Indonesia is not particularly wellplaced currently to implement a longer term SocialAssistance system covering the whole nation for thefollowing reasons:
• There appears to be agreement that the people mostaffected by the 1997 economic crisis and the internalrefugee situations should receive at least short termassistance. Beyond this the degree of communitysupport for public funds being used for helping otherpoor people is less clear. Comments at the variousworkshops and in other consultations conductedunder the ILO project indicated somewhat moresupport for “developmental” types of assistance forthe poor (Education, Health, Job Training, and loansto start up small businesses) than for other types ofsocial assistance. However, some of the long termpoor represent categories of people who cannot beassisted by developmental measures alone;
• The particular Social Safety Net policies adoptedafter 1997 were innovative and for the most partpractical and sensible if problems associated withtargeting are put to one side. However, the veryvaried social and economic situations in differentparts of Indonesia may require somewhat differentpolicies. For example, a rice subsidy is of little usein regions where the staple foods are yams ortapioca. Similarly, in urban areas where people donot have their own land or housing, cash assistancemay be more practical than food subsidies;
• Central government has a difficult fiscal situationwhich makes funding ongoing Social Assistancedifficult. Further, the use of external loan funds topay for part of the Social Safety Net measures isnot sustainable in the longer term. Eventually theseloans must be repaid, which then doubles the burden.Options for funding Social Assistance on a longerterm basis include use of money currently allocatedto the Oil Products subsidy; new taxes such as acigarette and tobacco tax; contributions formProvincial and District governments; andcontributions from NGOs and charities;
• Central government has no accurate way ofidentifying the poor at the local level. The governmenthas fairly good information on the incidence ofpoverty in various regions, but this does not extendto knowing sufficient about which individual poorhouseholds need and deserve assistance. Thisrequires local knowledge of the situation,circumstances and capabilities of individuals andhouseholds; and
• Finally, the high degree of “leakage” associated withthe Social Safety Net programmes indicates that an

Part III Chapter 15
180
accurate and efficient delivery mechanism inIndonesia does not currently exist. There is no centralgovernment organisation currently in existence whichcould efficiently deliver social assistance at the locallevel. Accordingly, other options need to beconsidered.
Possible Strategies For Indonesia
There are a number of possible strategies for theGovernment of Indonesia to adopt is relation the SocialAssistance for the assisting the poorest people. Themain options are:
• Do nothing and spend no Government funds on SocialAssistance. In effect this means relying wholly onthe traditional Indonesian support from extendedfamily, village, charity, and NGO assistance. It wouldmean phasing out the present Social Safety Netmeasures as the immediate crisis recedes;
• Have no formal scheme, but rely on “ad hoc”measures when particular crises strike, for exampleeconomic crises, refugee problems, or floods;
• Make social assistance the legal responsibility ofProvinces or Districts, but provide no centralgovernment funds;
• Set up a Government of Indonesia Social AssistanceAgency funded by the budget, and with local officesthroughout Indonesia;
• Add Social Assistance to the duties of JAMSOSTEK,the existing Social Insurance/Provident Fund scheme;
• Rely on micro-credit and related schemes;
• “Contract” with Provincial and district governmentsto deliver assistance, with each layer of Governmentproviding some of the funds; and
• “Contract” with NGOs to deliver social assistance.
Comments on each of these options follow:
Do NothingA simple option is for the Government to do nothing toprovide Social Assistance, and not require Provincesor Districts to do anything either. Instead extendedfamilies, villages, charitable giving and NGOs wouldbe expected to help the poor in the traditional Indonesianmanner. This option may seem tempting in the light of
the difficult fiscal situation, and the many othercompeting demands for funds.
Doing nothing was a realistic option a generation agowhen most Indonesians still lived in villages, and beforethe massive growth of cities and the increasingdependence on the cash economy. The doing nothingoption also recognises that economic development isthe main route out of poverty and low incomes.However, in current circumstances it would mean thatIndonesia did nothing to soften the hardship experiencedby many, either long term, or because of the impact ofthe economic crisis or of other emergency situationssuch as those of internal refugees or flood victims.
It is considered that this option is not realistic in thelight of Indonesia’s current situation. Nor is it realisticfor the longer term. In practice also the Governmentof Indonesia has not found it possible to do nothingwhen crises emerge. At most but not all of the ILOconsultations there was agreement that some form ofpublic social safety net was needed. Only in oneconsultation it was suggested that Social Assistancewould make the poor lazy. For the larger groupssupporting the idea of Social Assistance there was alsoagreement that the “leakages” problems needed to bedealt with. There was less agreement on what the formof assistance should be.
Ad Hoc Measures Only
A second option is to have no formal social assistanceschemes on an ongoing basis, but to introduce ad hocemergency measures whenever a particular crisisstrikes. This approach is perhaps rather close to thecurrent Social Safety Net approach in Indonesia. Thisapproach is possible, but does nothing to help the long-term poor in between the crises affecting other people.
A further problem is that the use of this ad hocapproach on a large-scale basis in the post-1997 “SocialSafety Net” saw major problems of poor targeting andwastage of money. While the Social Safety Netinitiatives did help many poor people, and eased theseverity of the crisis, many poor people missed on help,while large amounts of aid “leaked” to people whowere not supposed to receive assistance.
Continuation of this ad hoc approach with hastymeasures put in place each time a new crisis emergescan be expected to lead to a recurrence of the sameproblems of poor targeting and wastage of assistance.Without any regular system for assessing need and

Part III Chapter 15
181
policing the expenditure of monies, there is little chancethat targeting will get any better.
Make Provinces or Districts ResponsibleA third option is to make Provinces or Districts legallyresponsible for providing Social Assistance to poorpeople, but with no attached central governmentfunding. This approach would require a law whichdefined local social assistance obligations. A decisionwould need to be made as to whether the responsibilitywould be with the Province, or with the District.
This approach is possible, and compatible with thedecentralisation of Government. However, in practiceit would tend to mean that the richer provinces ordistricts might set up their own systems, while thepoorer provinces or districts would do little or nothingfor the poor. Almost inevitably this would lead topressures from the poorer areas for governmentassistance, and pressure from all areas for the centralgovernment to cede further tax bases to the provincesor districts to allow them to fund social assistanceactivities. It is possible that even in rich areas fundsraised by new local taxes may be diverted to otherlocal priorities rather than to social assistance. However,this is a possible road to travel down. It wouldinstitutionalise a lack of any national minimum livingstandard support.
Government of Indonesia Social AssistanceDepartment
A model which is used in some developed countries isto have a Government Social Assistance Departmentwith offices in all districts dealing directly with poorfamilies — assessing their need for assistance andproviding assistance in cash or kind. Of the options,this seems amongst the least realistic for Indonesia atits present state of development. There is no IndonesianGovernment network capable of administering this atpresent and building up such a network would takemany years. It would be extremely expensive to setup offices in over 4,000 districts and sub-districts orproviding mobile teams to cover all villages andlocalities. The approach is incompatible with a shifttowards devolution and decentralisation ofGovernment. Also, the costs of the approach wouldfall solely on the budget of the Government ofIndonesia.Several of the options discussed would require a centralgovernment department which funded or part-fundedprogrammes delivered by others.
Make Jamsostek the Social Assistance Agency
Jamsostek is also not a plausible delivery mechanismfor a Social Assistance scheme. The needs-basedtargeting of Social Assistance is incompatible with thecontributory basis of Jamsostek programmes.Furthermore Jamsostek has only around 100 officesand does not have the administrative capability todeliver targeted programmes at the local level.
Rely on Micro-credit
A sixth option is to rely on micro-credit to help thepoor, with the aim that small development loans wouldmove them into self sufficiency. Government wouldprovide some seed funding, with the funds eventuallybecoming self-sustaining.Micro credit is a useful approach, and can be expectedto help some people. However, micro-credit schemesgo best when they are developed locally from the“bottom up” and are likely to be less successful whenattempted as a government “top down” approach.Without an effective pre-existing network of micro-credit banks through which to channel funds, it is likelythat the same “leakages” which plagued the IndonesianSocial Safety Net measures would also be replicatedin any Government “top down” approach to microcredit.
Two other comments also need to be made. One isthat many long-term poor households whose adultmembers are disabled or elderly or sick may not begood candidates for micro-credit. Secondly, microcredit alone cannot be expected to deal with majoreconomic downturns such as the 1997 Asian crisis.
Overall, micro credit is a supplementary approachwhich can help some poor people exit poverty ratherthan something which can solve all social assistanceneeds.
Contracting with Provincial or DistrictGovernment
A seventh approach is to share responsibility betweenthe Government of Indonesia and Provinces or Districtsthrough a partly devolved “contracting” arrangementinvolving a “shared cost” approach.
This option would mean that central government wouldprovide a framework law, and part of the funding toProvinces or Districts. In turn, to get this funding the

Part III Chapter 15
182
Provinces or Districts would have to provide thebalance of the funding from their own revenues, andmeet government criteria about the targeting of thefunding. A degree of variability in the level and formsof assistance delivery could be negotiated to takeaccount of variations in local conditions. For example,rice subsidies would not be used in areas where yamsor cassava were the staple foods, and cash paymentsmight play a larger part in cities. The amount of centralGovernment assistance could be in proportion to thenumber of poor people in the area. Knowledge aboutvariations in aggregate poverty rates by area is one ofthe issues upon which the Government of Indonesiahas reasonable good statistics which could be used asthe basis for a “sliding scale” of grants to local areas.This approach would mean that poor areas would getmore assistance in relation to the size of their totalpopulation than rich areas. It would also mean that ifrich areas chose to provide a more generous level ofsocial assistance than any national minimum standard,then they would have to pay for the extra out of theirown revenues.
To make this system work it would be necessary tohave regular evaluations and audits to ensure thanfunding was being used for the approved purposes.Government funding could be reduced or withheld inthe event of substantial irregularities occurring.
Contracts with NGOs
A possible variant to using provincial or localgovernments is to contract with NGOs to deliverassistance funded in part or whole by Government inparticular areas or districts. There is a partialprecedent for this in the use of National Family PlanningAgency data in several of the Social Safety Netschemes. The viability of this approach depends onthe existence of effective NGOs in particular areas,and their impartiality and efficiency in deliveringassistance. Because NGOs cannot raise local taxes,the approach might require a higher level of governmentfunding than a “shared cost” approach with localgovernment. Some NGOs could contribute part ofthe resources required.
Administrative Improvements
Apart from the “Do nothing” option, all of the optionswill require improvements in the machinery ofgovernment for delivering social assistance. In this
area as in many other areas of Indonesian publicadministration, the weakness of administrative systems,in some cases aggravated by KKN (corruption,collusion and nepotism) means that good intentionsbacked up by funding are not translated into equivalentlevels of effective action. Weaknesses in governanceability appear to exist in all levels of Government inIndonesia, whether central, provincial, or district.
Some approaches which are likely to help improveGovernance, particularly for devolved programmes,include the following:
• A contractual basis for delivering the programmes,with explicit provision to withhold or reduce allocationsfrom central government if subsequent evaluationsshow that programme targets are not being achieved;
• Co-contribution requirements from subordinate levelsof Government;
• Inclusion of adequate administrative cost funding inthe budgets allocated;
• Training for workers involved;• Wide public dissemination of the criteria upon which
programme eligibility is to be based;• Requirements for consultation with and participation
of local people in the decision making process onprogrammes;
• Involvement of NGOs and community organisationsin vetting the allocation process;
• Public reporting on how the money has been spent,including at each district and local level;
• Inclusion of adequate audit and evaluation provisions;and
• Prompt prosecution and punishment of cases offraud.
It is also suggested that authority to make allocationdecisions and authority to release funds be locatedseparately. Thus for example if funds were held atthe district level in the name of a village or locality, theactual allocations would be made at local level by theduly constituted local allocation authority. The districtlevel would check that these allocations were made interms of the programme criteria before funds werereleased, but could not allocate funds to other purposes.The dual accountabilities would reduce the tendencyfor funds to be diverted to other purposes. There wouldalso need to be an appeal mechanism to a higher levelof government to deal with conflicts between thedifferent authorities.

Part III Chapter 15
183
Feasible Types of Social Assistance
As noted the Social Safety Net measures showed thatseveral types of programmes funded at centralgovernment level can be delivered down to the locallevel in Indonesia, even if the targeting performanceof the schemes has been weak with high leakages.These programmes include the rice subsidy, theeducation and health assistance measures, and somespecial employment arrangements.
It is not considered currently feasible to set up anIndonesia-wide cash social assistance scheme.However, it is possible that this approach could beconsidered in some of the more advanced provincesor districts of provinces. In the longer run cash grantsand benefits are likely to be a rising component of SocialAssistance. In the short term it is best to concentrateon those things which have a reasonable chance ofbeing achieved. More generally, it is probable thatlocal initiatives could come up with other options whichare cost-effective provided the programmes areoperated with good governance.
Some of the criteria for better operation of existingprogrammes are suggested by the evaluation reports.For example special employment schemes should focuson local development priorities and pay no more thanthe local minimum wage. In areas where physicalinfrastructure is adequate, the focus could shift tothings such as revolving funds for small businessdevelopment.
Overall, it is suggested that core Social Assistance forthe period ahead could include the following:
• Rice subsidy or its equivalent for the poor;• Other food assistance for young children and nursing
mothers in poor families;• Health cards for the poor giving access to free
treatment in public facilities and free or subsidisedmedicines;
• Education scholarships for children for poor families;and
• Cash grants on a periodic payment basis to poorhouseholds where the local capacity to run such asystem exists.
In addition, special employment programmes wouldseem to be an important mechanism with a SocialAssistance dimension. These could be programmesmeeting local infrastructure development priorities butconditionally funded at least in part by Central
Government. Wages could be local minimum wages,or in some cases a percentage of these in some areas,or “food for work” programmes. These latter twovariants may have to be considered in provinces wherethe announced minimum wage is not the actualminimum paid in the informal sector but an objectivefor formal sector wages.
It should also be noted that in some parts of Indonesiarice is not the staple food. In these areas either theuse of local staple (e.g. yams), or else a cash grant tothe poor which is the equivalent of the rice subsidy.
Other options could be developed by agreementbetween the central government as main funder andthe provincial and district authorities as administeringagents and co-funders of any programmes.
Funding Sources
Some of the Social Safety Net Programme has beenfunded by loans from International Agencies,particularly in the middle period of peak spending. Thisis not a stable long run basis for funding SocialAssistance. The Government of Indonesia musteventually repay loans. Hence a more sustainablesource of finance needs to be sought, particularly ifSocial Assistance is to be expanded or take a longer-term form. Apart from any grant aid which can beobtained from abroad, this will need to be a domesticrevenue source.
Much of the discussion on domestic funding of SocialSafety Net programmes in Indonesia has focussed onredeployment of at least part of the subsidy nowallocated to petroleum products. In the 2002 draftbudget this was allocated Rp.32.3 trillion, or about 1.9%of estimated GDP. Non-Oil subsidies amounted toRp.13.9 trillion, plus a further Rp.2.2 trillion in theDevelopment budget. When the Oil Products subsidyrate was trimmed, part of the money was reallocatedto social assistance programmes. The objective wasto seek to shield the poorest people from the costimpact of the rise in prices for oil products. Whilereduction or removal of oil product subsidies wouldhave some cost impact on all Indonesians, the mainimpact would fall on middle and upper income groupswho are the major users of these products. TheSMERU Household Consumption study has shown thatthis is true even for Kerosene, with the higher incomegroups being the biggest users.

Part III Chapter 15
184
Redeploying the Oil subsidy money to fund improvedSocial Assistance is clearly an option, although it isrecognised that there are other potential claims on thismoney including deficit reduction. Apart fromredeployment of some part of the Oil Products subsidy,other options for funding additional Social Assistanceinclude:
• Additional taxes on products which are not favourableto health, for example cigarettes and tobacco;
• Redeploying funds from the electricity subsidy(Rp.4.6 trillion) and the credit interest rate subsidies(Rp.4.4 trillion);
• Co-contributions from Regional and DistrictGovernments to cover part of the cost of SocialAssistance programmes in their areas as part of theconditions for receiving central government grants.This would also give them an incentive to containcosts and look for efficiency in the programmes.Contribution formulae could be developed whichrequired the least contribution from the poorestprovinces and the largest co-contributions from therichest provinces; and
• Local contributions from some of the peoplebenefiting from some of the programmes, for exampleHealth Insurance. However, the poorest peoplewould not be able to contribute.
It is understood that current intentions are to targetcentrally provided assistance for social safety netpurposes according to the assessed numbers of poorpeople in each province. This has a strong logic to it.It would also mean that over time as poverty reduced,the amount of real transfers needed for existingprogrammes would reduce. This would free upresources for other objectives. However, whilenational poverty data provides a good basis for fundingallocations to regions, districts, and some lowergeographic levels, it does not solve the second problemof who is to get the assistance at the local level. Thisis the more difficult problem of targeting.
Data for Targeting
Discussion with some officials during the ILO projectproduced the view that there is little data available tocentral government which could assist in more accuratetargeting of Social Assistance to individual households.However, some other people consulted expressed theview that there is actually a very large volume of dataon households collected by a variety of agencies inIndonesia. A problem was that much of this data wasnever shared between agencies.
A further problem is that if administrative data collectedfor other purposes was known to be the basis of SocialAssistance allocations to individual households, therewould be a tendency for the data supplied to becomeless reliable.
Overall, it seems probable that even without officialstatistics local communities have a very good idea asto who is poor and in need of assistance. The moredifficult problem is that local views on who is deservingof assistance and local priorities for spending may bevery different from those of the Central Government.The governance criteria set out earlier are intended tohelp reduce the discrepancies.
Summary
Indonesia is in a social and economic situation whereit can no longer rely solely on traditional relationshipsto deal with problems of poverty and loss of livelihood.At the same time the public authorities have limitedfinancial capacity to provide Social Assistance to thepoor, and lack effective administrative channels toensure accurate targeting of what assistance can beprovided. There also appears to be little socialconsensus on future directions for Social Assistance,though a majority view that something needs to bedone.
Some of the problems now requiring Social Assistanceinterventions can be more effectively resolved byextending the scope and coverage of the contributorySocial Insurance/Provident Fund system run byJamsostek for formal sector workers. However, thiswill resolve only part of the problem at Indonesia’scurrent level of economic development. Nearly twothirds of the employed work force in Indonesia is inthe informal economy and there are some other groups,individuals and households who lack the means tosupport themselves — even in the informal economy.
At a Roundtable meeting on poverty relief at Bappenassponsored by the ILO in November 2002, drafts ofPoverty Reduction Strategy Papers (PRSPs) werepresented in which the importance of social protectionin poverty reduction was stressed. It was furtherasserted (and largely supported) that such socialprotection should be ‘Social Protection for All’, notjust the privileged formal sector workers. This suggeststhat there is a groundswell among policy-makers infavour of social assistance. Certainly this ILO Reporton the feasibility of introducing Social Assistance, andfurther ILO Reports in the project series on the

Part III Chapter 15
185
feasibility of introducing Unemployment BenefitInsurance and Extending Social Security Coverage toExcluded Groups will assist in the formulation ofstrategies for improving the scope of social protectionin Indonesia. However, the realization of the ‘SocialProtection for All’ aim is some way off.
The Social Safety Net measures adopted by theIndonesia authorities after the 1997 crisis wereinnovative and did assist many poor people. However,the weakness of the administrative delivery systemsmeant that there was a high degree of “leakage” ofassistance to people who were not supposed to bereceiving it.
In the long run Indonesia will have to face up to theneed to have some form of ongoing Social Assistancesystem. However, the mechanism by which this systemshould eventually be operated and funded is more opento question.
Given the present trend to decentralisation anddevolution, and also the need for local knowledge aboutfamily and household situations, publicly funded SocialAssistance would seem to require the involvement ofProvincial or District authorities. In order toaccommodate this in some form of national minimumliving standards objectives, an option may be some formof “contracted” programmes between centralGovernment and other levels of Government involvingsharing of programme costs and local delivery ofassistance on the basis of agreed programmes. Theseconsiderations suggest that:
A Social Assistance policy for Indonesia should be abroad framework set at national level within which anumber of options could be developed at the local level.Funding from Central Government would be relatedto the poverty level in each region or district, and ideallywould involve co-contributions from the devolved levelsof government. Ongoing central governmentassistance would be conditional on specifiedprogramme objectives being met. From thisperspective centrally provided funding for SocialAssistance would not be part of devolved fundingallocated as of right to districts and provinces, but“contractual” funding supplied in order to meet agreedSocial Assistance needs;
At this stage of its development feasible corecomponents of a Social Assistance strategy should bethose parts of the Social Safety Net programme whichhave been workable in practice. These include Riceand Food subsidies for the poor, Health Cards andEducation scholarships for poor families and specialemployment on local development projects at minimumwages. To this can be added some wider possibilitiesof the more advanced local areas using more directcash assistance benefits to those unable to supportthemselves;
Feasible funding options include a redeployment of partof the Oil Products subsidy; eventual excise taxes onOil Products; redeployment of the funding for theelectricity subsidy and credit subsidies; some additionaltaxes, notably on tobacco products; and co-contributions from local administrations.

Part III Chapter 16
186
CHAPTER 16 JAMSOSTEK HEALTH CARE PROGRAMME
in that the benefits are provided in kind (instead ofcash) using managed care techniques; dependants arecovered and membership is optional.
Although health insurance is part of the Jamsostekbenefit package, this has only been partiallyimplemented and exclusion (via the so-called ‘opt-out’clause of Article 2 (4) of Government Regulation No.14of 1993 made under the social security law: Law No.3of 1992) has been permitted for those insuredelsewhere such as with ASKES or where the employerhas provided alternative arrangements. The numberof people covered by the Jamsostek health careprogram is only 2.7 million (including 1.3 millionworkers) out of about 100 million potential people whocould be covered by the programme.
The opt-out provision has resulted in adverse selectionto Jamsostek. Higher salaried workers obtain healthcoverage from private health insurance while thosewho are on low salaries choose to join Jamsostek. Theaverage per capita contribution in 2000 was only Rp.5,224 per month; while the closest comparable productfrom the private market cost an employer Rp. 20,500per month. The total contributions received by PTJamsostek for health care in 2000 was only Rp. 155billion ¾ much less than total premiums received byprivate insurance companies. Thus, the Jamsostek lawis considered to benefit private insurance companiesmore than PT Jamsostek and its members.
The current organization of the system produces thefollowing effects:—
• Segmentation and fragmentation of the healthinsurance system. Potentially exacerbated, if notdone well, by recent decentralization to the provinces(24) but mainly to the districts (320);
• Fragmented government policy in social security,health and in social security reform;
• Equity problems, including different contribution ratesand benefit packages;
• Leakage of public subsidies to the non poor;
• Inefficiency issues within each sub-sector;
• Weak and fragmented regulation.
Executive Summary
In practice, Indonesia has a three-tier system, whichis additionally fragmented by the size and geographicalfragmentation of the country, resulting in at least thefollowing sub-systems:
• The Department of Health and the ProvincialAuthorities (after the decentralization law) runningthe health care system for the uninsured, mainly thepoor;
• The social security organizations (ASKES andJamsostek) for the formal sector, civil servants andprivate workers respectively; and
• Private Health insurance organizations (pure privatehealth insurance and general private insurance thatalso provide health insurance) and JPKM. AlsoCommunity funds.
The public health protection programme has developedin a fragmented and piecemeal way over many years,each stage of development having arisen as a result ofindividual attempts to address particular problemsrather than as any coherent attempt at a coordinatedplan. The result is a system that lacks transparency, isadministratively expensive and generally held in lowesteem by the people who use it. At one end of thesystem, people requiring treatment feel that the qualityis poor and the service providers at the other end feelthe victims of late or insufficient payment for theirservices.
Accurate population statistics about the degree ofhealth insurance cover provided by each of the sub-systems is not readily available. Unconfirmed reportssuggest that about 15% of the population is coveredby the combined social security organizations andprivate health insurers. However, preliminarydiscussions and literature review suggest a much lowerlevel, possibly as low as 7%.
Coverage for formal sector workers is provided undera dual system which includes traditional social healthinsurance organizations (Jamsostek and ASKES) andprivate insurance organizations (JPKM and traditionalprivate health insurance) in competition with each other.
Jamsostek covers four programs: health benefits,occupational injury, death benefit, and provident funds.The health program is very different from the others
Part III Chapter 16
187
Given the geographic, cultural and political complexityof Indonesia and the weak institutional capacity presentin the health sector, reforming the health sector will beparticularly difficult. Indonesia has at least 3 possiblemain scenarios for such reform that are understood tobe currently under consideration by the PresidentialTask Force:
• Reforming each sub-sector separately —addressing the main efficiency and equity issueswithin each sub-sector separately while maintainingsystem segmentation;
• The integration of social health insurance —maintaining system segmentation between the poorand informal population and the formal populationbut developing a single, unified system for the formalsector with either:
• An actual single integrated system with a singlepayer or insurance carrier; or Virtual singleintegration through ‘same rules of the game’ forall insurers (premium setting, package, etc.) but withcompetition permitted between insurers, possibly withsome mechanisms in place to compensate for theeventuality of market failure;
• Total system integration — with the formal sectorsubsidizing the premium for the poor and the informalsector, so that they can join any insurer of choice(within the above scenarios). It would mean totalseparation of purchasing and provision and a radicalshift from historic supply-side financing to“portability” of the public subsidy.
The scenarios identified above are very complexpolitically as well as technically and will require verysignificant technical assistance at the policy level. It isconsidered that such technical assistance needs to beinjected at the highest level with multiple actors —including, but not restricted to, the Department ofHealth, Depnaker and Jamsostek.
Probably the most logical way forward would be toplan a phased restructuring of the total system, startingwith the scenario of reforming each sub-sectorseparately. When each sector has been strengthenedand some harmonization has been achieved, then thepossibility of institutional reform or rationalization couldbe considered.
Given the national commitment to develop acomprehensive social security scheme(JAMSOSNAS), it follows that there is a strongprobability that a new network will be required. Oncethe system has been designed embodying the specificnational answers to a number of policy issues, thenwill come the time for the structure appropriate for itsimplementation to be considered. This may call eitherfor new (or different) institutional arrangements, orfor some kind of integration or rationalization of theexisting ones. It is the design of the system thatshould determine the institutional arrangements— not the other way round.
From the system design point of view it will beimportant to take account of advice andrecommendations arising from the technical assistanceprojects being funded by the European Union.

Part III Chapter 16
188
Bab 16 Program JaminanPemeliharaan Kesehatan Jamsostek
Rangkuman Eksekutif
Dalam praktiknya, Indonesia memiliki suatu sistem tigatingkat yang terbagi-bagi sesuai dengan ukuran danpembagian geografis negara dan setidak-tidaknyamenghasilkan sub-sub sistem berikut ini:
• Departemen Kesehatan dan Pemerintah-pemerintahProvinsi (setelah diberlakukannya undang-undangotonomi daerah) menjalankan sistem pemeliharaankesehatan untuk mereka yang tidak diasuransikan,terutama mereka yang tergolong miskin;
• Organisasi-organisasi jaminan sosial (ASKES danJamsostek) untuk sektor formal, pegawai negeri danpekerja sektor swasta; dan
• Organisasi-organisasi asuransi kesehatan swasta(asuransi kesehatan swasta murni dan asuransiswasta umum yang juga memberikan asuransikesehatan) dan JPKM. Juga dana-dana Masyarakat.
Di Indonesia, program perlindungan kesehatanmasyarakat telah berkembang selama bertahun-tahunsecara terpecah-belah (terfragmentasi) dan tambalsulam. Setiap tahap perkembangan program ini lebihmerupakan hasil dari upaya yang dilakukan secarasendiri-sendiri untuk menangani masalah-masalahtertentu daripada upaya koheren [upaya yang terpadusecara logis dan konsisten] yang dilakukanberdasarkan suatu rencana yang telah terkoordinirdengan baik. Akibatnya, sistem yang dihasilkan bersifattidak terbuka, secara administratif mahal dan secaraumum dipandang rendah oleh orang-orang yangmenggunakannya. Sementara itu, mereka yangmemerlukan pelayanan kesehatan merasa bahwalayanan yang mereka dapatkan bermutu rendah. Disisi lain, pemberi jasa merasa diri mereka menjadikorban dari pembayaran yang terlambat atau tidakmencukupi atas pelayanan yang mereka berikan.
Statistik penduduk yang akurat mengenai sampai sejauhmana perlindungan asuransi kesehatan yang diberikanoleh tiap-tiap subsistem masih belum tersedia. Laporan-laporan yang belum pasti kebenarannya menyebutkansekitar 15% penduduk mendapat perlindungan darikombinasi antara organisasi-organisasi jaminan sosialdan penjamin asuransi kesehatan swasta. Meskipundemikian, diskusi-diskusi awal dan kajian pustakamenyebutkan bahwa tingkat perlindungan kesehatanyang diberikan mungkin jauh lebih rendah, yakni sekitar7%.
Perlindungan untuk pekerja sektor formal diberikanmelalui sistem rangkap dua yang meliputi organisasi-organisasi tradisional asuransi kesehatan sosial(Jamsostek dan ASKES) dan organisasi-organisasiasuransi swasta (JPKM dan asuransi kesehatan swastatradisional) yang saling bersaing satu sama lain.
Jamsostek mencakup empat program: (1) programjaminan perawatan kesehatan, (2) program jaminankecelakaan kerja, (3) program jaminan kematian, dan(4) program jaminan hari tua (provident funds).Program jaminan pemeliharaan kesehatan Jamsosteksangat berbeda dari program-program jaminan yanglain dalam pengertian bahwa manfaat tidak diberikandalam bentuk tunai tetapi dalam bentuk non-tunaimenggunakan teknik-teknik perawatan yang diawasi;di mana tanggungan ikut ditanggung dan keanggotaanbersifat opsional.
Meskipun asuransi kesehatan merupakan bagian daripaket manfaat Jamsostek, hal ini baru dijalankansebagian. Pengecualian untuk tidak mengambilprogram jaminan pemeliharaan kesehatan Jamsostek(melalui klausul opt-out atau pilihan untuk tidak ikutserta dalam Pasal 2 (4) Peraturan Pemerintah No. 14/1993 yang dibuat berdasarkan Undang-Undangjamsostek No. 3/ 1992) diijinkan bagi mereka yangtelah diasuransikan di tempat lain, seperti denganASKES, atau apabila pengusaha telah memberikanjaminan pemeliharaan kesehatan alternatif. Jumlahorang yang saat ini ditanggung oleh program jaminanpemeliharaan kesehatan Jamsostek hanyalah 2,7 jutaorang (termasuk di antaranya 1,3 juta pekerja) darisekitar 100 juta orang yang semestinya dapat dicakupoleh program tersebut.
Ketentuan opt-out atau pilihan untuk tidak ikut sertaini, yang membolehkan pengusaha keluar darikepesertaan program asuransi jaminan pemeliharaankesehatan Jamsostek apabila mereka dapatmemberikan jaminan kesehatan yang ‘lebih besardaripada paket pemeliharaan kesehatan dasar’yang diberikan Jamsostek, telah mengakibatkanterjadinya pemilihan yang berbeda untuk mengikutiprogram jaminan pemeliharaan kesehatan Jamsostek,di mana pekerja-pekerja yang berpenghasilan tinggimengikuti jaminan pemeliharaan kesehatan dariasuransi kesehatan swasta sedangkan mereka yangberpenghasilan rendah memilih untuk bergabungdengan Jamsostek. Iuran rata-rata perorang pada tahun2000 hanyalah Rp5.224 per bulan; sedangkan untukmemperoleh produk terdekat yang dapat dibandingkandengan JPKM dari bursa swasta, pengusaha harus
Part III Chapter 16
189
mengeluarkan Rp20.500 per bulan. Total iuran yangditerima PT Jamsostek dari program JPKM pada tahun2000 hanyalah Rp155 milyar – jauh di bawah total premiyang diterima perusahaan-perusahaan asuransi swasta.Dengan demikian, undang-undang Jamsostek dinilailebih menguntungkan perusahaan-perusahan asuransiswasta daripada PT Jamsostek dan para pesertaJamsostek sendiri.
Pengorganisasian sistem jaminan pemeliharaankesehatan dewasa ini menghasilkan dampak-dampakberikut:
• Segmentasi dan fragmentasi sistem asuransikesehatan. Kalau tidak ditangani dengan baik,segmentasi dan fragmentasi ini akan berdampak lebihburuk dengan diberlakukannya desentralisasiterhadap 24 provinsi, terutama terhadap 320kabupaten.
• Kebijakan pemerintah yang terfragmentasi di bidangjaminan sosial, kesehatan dan reformasi jaminansosial;
• Masalah pemerataan (equity), termasuk tingkat-tingkat iuran dan paket manfaat yang berbeda-beda;
• Bocornya subsidi rakyat kepada orang yang tidakmiskin;
• Masalah-masalah yang berhubungan dengan tidakadanya efisiensi di masing-masing subsektor;
• Peraturan yang lemah dan terfragmentasi.
Mengingat kompleksitas geografis, budaya dan politikIndonesia serta lemahnya kapasitas kelembagaansektor kesehatan, upaya mereformasi sektor kesehatanpada saat ini tidaklah mudah. Indonesia mempunyaisekurang-kurangnya 3 skenario utama untukmelakukan reformasi sektor kesehatan, yang diketahuisaat ini sedang dipertimbangkan oleh Kelompok KerjaKepresidenan:
• Mereformasi masing-masing subsektor secaraterpisah – mengatasi masalah-masalah efisiensi danpemerataan di tiap-tiap subsektor secara terpisahsambil tetap mempertahankan segmentasi sistem;
• Integrasi asuransi kesehatan sosial –mempertahankan segmentasi sistem antarapenduduk miskin dan informal di satu sisi danpenduduk formal di sisi lain tetapi mengembangkansuatu sistem tunggal dan seragam untuk sektorformal dengan:
• Sistem terpadu tunggal yang sebenarnya dengansatu pembayar tunggal (single payer) atau badanpenyelenggara asuransi tunggal (insurance carrier);atau keterpaduan tunggal secara virtual denganmenerapkan ‘aturan main yang sama’ untuk seluruh
penjamin asuransi (penetapan premi, paket asuransi,dll.) tetapi dengan memperbolehkan adanyapersaingan antar penjamin asuransi, dan mungkindengan beberapa mekanisme pemberian kompensasiguna mengantisipasi kemungkinan terjadinyakegagalan pasar;
• Keterpaduan sistem secara total – dengan sektorformal memberikan subsidi kepada orang miskin dansektor informal, sehingga mereka dapat mengikutiprogram asuransi dari penjamin asuransi yangmereka pilih sendiri (dalam lingkup skenario di atas).Ini berarti pemisahan secara total antara pembeliandan penyediaan [perawatan kesehatan] dan jugaberarti pergeseran secara radikal dari pembiayaanpada sisi historis penawaran ke ‘portabilitas’(kemudahan untuk dipindah-pindah atau dialihkan)dari subsidi masyarakat.
Skenario-skenario yang diidentifikasi di atas secarapolitis maupun tehnis sangat kompleks dan akanmemerlukan bantuan teknis yang sangat berarti padatingkat kebijakan. Bantuan teknis seperti itu dianggapperlu diberikan di tingkat tertinggi dengan pelaku ganda– termasuk, tetapi tidak terbatas pada, DepartemenKesehatan, Depnaker, dan Jamsostek.
Mungkin, cara paling logis ke depan adalahmerencanakan restrukturisasi sistem total secarabertahap, mulai dari skenario mereformasi masing-masing subsektor secara terpisah. Bila tiap sektor telahdiberdayakan dan penyelarasan telah tercapai, makakemungkinan untuk melakukan reformasi kelembagaanatau rasionalisasi dapat dipertimbangkan.
Mengingat komitmen nasional untuk mengembangkansuatu skema jaminan sosial yang komprehensif(JAMSOSNAS), ada kemungkinan kuat dibutuhkannyasuatu jaringan baru. Begitu sistem tersebut dirancangdengan memasukkan jawaban-jawaban secaranasional yang bersifat spesifik atas sejumlah isukebijakan, maka akan tiba saatnya untukmempertimbangkan struktur yang tepat untukimplementasinya. Ini akan memerlukan pengaturankelembagaan yang baru (atau yang berbeda), atausejenis keterpaduan atau rasionalisasi dari yang sudahada sekarang. Rancangan sistemlah yang hendak-nya menentukan pengaturan kelembagaannya,bukan sebaliknya.
Dari sudut pandang rancangan sistem, akan pentinguntuk mempertimbangkan nasihat dan rekomendasiyang timbul dari proyek-proyek bantuan teknis yangsaat ini sedang didanai oleh Uni Eropa.

Part III Chapter 16
190
Current Health Care Policy AndDelivery
Indonesia is currently at the crossover betweencentralized and decentralized government and betweenstrong state controls to market driven businesses. Inthe health sector, reforms are being undertaken toaccommodate global changes and to respond to thelocal demand in various levels of government. TheMinistry of Health (MOH) has a vision of ‘HealthyIndonesia 2010’ by prioritizing four main elements ofhealth sector development: healthy paradigm,professionalism, decentralization, and development ofmanaged health insurance.33 This vision sets healthylife for all Indonesians by the year 2010. In line withthe concept of improving professionalism anddecentralization, privatization of health care financingand services is being undertaken. 35% of shares of astate owned company dealing with pharmaceuticalproduction and distribution (PT Kimia Farma) wererecently sold in the stock market to increase thecompany equity and to stimulate quicker response tomarket changes. Several public hospitals are to beprivatized to form Perjan. The pros and cons of thisprivatization process of public hospitals continue to behot issues in health sector reform as, while improvingquality of health services, privatization of
pharmaceutical companies and public hospitals is likelyto increase health care costs. However, this rise ofhealth care costs may affect access to necessary healthservices by the poor and nearly poor population.
As in many other developing countries Indonesia isexperiencing the double burden of the continuingproblem of infectious disease while social andeconomic development during the last 30 years haschanged people’s health behaviour and eating habitsgiving rise to increasing incidence of chronic disease.Cardiovascular diseases have been the number onecause of death since 1992 (see Table 1)34. But manypublic and private general hospitals are not yet readyto respond to the increasing chronic diseases. Thereare few hospitals that can provide adequatecardiovascular services in the country. According toone cardiac surgeon, every year Indonesia spends aboutUS$ 120 million for cardiac treatment overseas. Manypublic hospitals in districts must concentrate theirservices to fight prevalent infectious diseases whilepublic and private hospitals in urban areas must alsoprovide expensive equipment to provide services forthe growing chronic diseases as the population is ageingrapidly. To respond to the epidemiological changes,health insurers and health care providers must changethe way they do business to anticipate higher costs ofmedical care.
33 Healthy Indonesia 2010. MOH, Jakarta, Oktober 199934 MOH. Health Profile 2000. MOH, Jakarta 200035 Asiaweek, August 31, 2001: 13
Figure 79 Table of Five Leading Causes of Death from Series of Household Health Survey
Rank 1980 1986 1992 19951 Respiratory infection Diarrhoea Cardiovascular Cardiovascular2 Diarrhoea Tuberculosis Tuberculosis Respiratory infection3 Cardiovascular Diphtheria, measles Respiratory infection Tuberculosis4 Tuberculosis Tetanus Diarrhoea Other infection5 Tetanus Malaria Other infection Others
The impetus for changes also comes from the recentcurrency crisis that was followed by economic crisisin Indonesia. Among other Asian countries, Indonesiasuffered and continues to suffer the worst. TheIndonesian currency (Rupiah) plunged from aboutUS$1:Rp. 2,500 in June 1997 to $1:Rp. 13,500 inJanuary 1998 (at the lowest point). In the past year inresponse to current political change, the currency hasbeen relatively stable, floating at around $1:Rp. 9,000— still less than one third of its pre-July 1997 value. In
early 1998, the government reacted to the growingburden of debt —both in the public and private sector,totalling around US $ 150 billion, a little less than thegross domestic product in the year 2001 estimated atUS$ 153 billion35— by selling state owned companiesto domestic and international investors.
Outside the health sector, privatisation of state ownedcompanies is proceeding much faster than privatisationof the health sector. Following the financial crisis of

Part III Chapter 16
191
1997, while the Indonesian currency continued toplunge, there have been many political, social, andeconomical changes throughout the country. After July1997, the cost of living suddenly rose four timescompared to the beginning of 1997, while Indonesianincome per capita fell to only one third of the incomein the preceding year. This condition has driven muchsocial unrest in Jakarta and other parts of Indonesia.At the same time, devolution of political powers fromthe central government to local governments wasunavoidable in all parts of the country, acceleratingsocial and economical change. Despite the recentpolitical instability, flow of foreign capital is increasing.The public confidence in the market in Indonesia isstabilizing slowly. The country’s economic growth hasbeen rising steadily from –15% in 1998 to about 4% inthe year 200136. The annual income per capita thathad been around US $ 1,200 at current values (it wasestimated at about US$ 3,200 using purchasing powerparity) then declined to around US $ 618 in 1998.It isnow about US$ 69237.
Health Care Financing
Health care financing for the public sector comesthrough the Department of Health (Depkes), theProvincial health care budget, the District health budget,other sector allocations, military health services, publichealth insurance corporations, and foreign aid andloans. Private sector health care financing comes fromout-of-pocket payments from individuals andhouseholds, reimbursement by corporations/employers,third party payments through private insurancecompanies, and direct health services provision by largefirms. It is difficult to determine how much the privatesector spends on health care each year, since there isno regular survey on this issue. However, recentstudies indicate that the private sector role in healthcare financing is much greater than the public sector.During the last ten years, public sector financingaccounted for about 30-40% of total health expenditurewhile private sector contributed about 60-70%,according to most cited sources38.
Figure 80 Table of Health Care Financing in Selected Countries in Asia, 199739
• Countries • Per capita health • Per capita • Total expenditure • Public expenditureexpenditure at exchange expenditure on health on health as % of GDP as % of total health
rate (US$) in international $ expenditure• India • 23 • 84 • 5.2 • 13.0• Indonesia • 18 • 56 • 1.7 • 36.8• Malaysia • 110 • 202 • 2.4 • 57.6• Philippines • 40 • 100 • 3.4 • 48.5• Thailand • 133 • 327 • 5.7 • 33.0• Vietnam • 17 • 65 • 4.8 • 20.0
World Health Organization (WHO) 2000 report (seeabove) shows that Indonesia spent only US$ 18 percapita on health in 1997 while countries such as Indiaand the Philippines spent more. In US dollars, Indonesiaeven spent less for health (US$ 56) than Vietnam (US$65) which has a much lower GDP per capita thanIndonesia. Even after the 1997 economic crisis theGNP per capita of Indonesia is currently about US$692 while the GNP per capita of Vietnam is US$ 382.40
Indonesia only spent 1.7% of its GDP for health whileIndia and Thailand spent 5.2% and 5.7% of GDPrespectively.41 As can be seen on Table 2 above,
36 ibid37 Asiaweek, August 24, 2001: 5538 WHO Report 2000, Geneva 2000.39 Source: WHO Report 200040 Asia Week, 200141 World Health Report 2000. WHO, Geneva, 2000
Indonesia lags behind its neighbours in health carefinancing. This low health care financing reflects lackof serious attention by the government, the privatesector, and the community at large. Low coverage ofsocial security or social health insurance schemes maybe a factor in low health care financing.
In most European countries, the public sector spendsmuch more on health than the private sector becauseof strong social security or social health insurancesystems. Among developed countries in the world,only in the United States (US) does the public sector

Part III Chapter 16
192
contribute less than 50% of total health careexpenditure. Health care financing in Indonesia isdominated by the private sector, including householdcontributions of between 60-70% of the totalexpenditure on health. Using the public share of totalhealth expenditure, Roemer (1993)42 classifiedIndonesian health care system and the US health caresystem as entrepreneurial health care systems.These entrepreneurial systems are very regressive interms of the burden of health care financing to thepopulation. The high infant mortality and maternalmortality rate in Indonesia may be attributed to thisregressive system. Thailand and the Philippines havebeen in the other quadrant where public share on healthexpenditure is greater than the private sector43.
The possible reasons for low public health financing inIndonesia include:
• The Indonesian Government does not havesufficient resources to invest adequately in healthcare. In 1998, the Indonesian Government investedless than US $ 4 per capita per year through Central,Provincial, and District health care budgets for wideranges of health programs and services. A significantproportion of these funds came from foreignassistance or loans. Foreign assistance is neededbecause the Government is unable to finance fromdomestic sources its total health care budget, includingthe budget for health programs and services:
• The Indonesian government places low priorityin investing on health. While the government spentonly US$ 4 per capita in 1998, it received taxes fromtobacco sales of about US$ 5 per capita. If thegovernment placed a high priority in investing onhealth, it would return all money received fromtobacco taxes in recognition of the fact that tobacco
destroys people’s health. In the year 2001, thegovernment set a target of Rp. 20 trillion-revenuefrom tobacco taxes, about four times greater thanthe government spent for health. If the revenue fromtobacco taxes were be used to finance healthprograms and services, there will be more moneyfor health.
The second reason seems more realistic than the first.
The government allocation for health is believed to beone of the lowest in the world. In the last fifteen years,it has never been above four percent of the total budget(see Figure-1).44 Although private sector contributionsfor health services have been and continue to be abouttwice as much as the government’s share, the roles ofthe government in the provision of health servicesremain large. This is due to the central governmenttightly controlling the price of health services in healthcentres and public hospitals — aimed at assuringaffordable health services to patients with low-income.For example, at public health centres people gettreatment for as low as US$ 0.10, including three-daysupplies of medicines.
However, from 2001 the low cost of treatment at publichospitals and health centres changed. Many healthcentres and public hospitals now under full control oflocal governments will be transformed into swadana(autonomous) facilities and it will be more likely thatthe local government will approve higher prices. Ifprices of health services in public hospitals and publichealth centres rise, then the financial risks to the lowand middle-income group will increase. Withoutsignificant health insurance coverage or financialassistance for the poor, the access to health serviceswill be jeopardized.
42 Roemer, . Health System of the World, Oxford University Press, New York, 1993.43 WHO Report, 19994 4 Malik, R et. Al. Evaluasi Pembiayaan Kesehatan, and Bureau of Planning Data., Jakarta 1997
Figure 81 Government Allocation of Health Services as Percent of Total Government Expenditures

Part III Chapter 16
193
Currently about 84-85%% of the population does nothave health insurance.45 About seven percent of thoseinsured are covered through Askes; a state ownedcompany that administers compulsory health insurancefor civil servants, retired civil servants and the military,and their dependents. Jamsostek covers about 1.3%of the population (instead of the potential 40-50% ofthe population if the Jamsostek law were to beimplemented consistently). The remainder are coveredby other private health insurance schemes, includingcoverage by JPKM bapels (the Indonesian version ofhealth maintenance organizations). In the ten years to1998, the health insurance coverage as a proportion oftotal population remained relatively stable. In 1990 datapublished by the World Bank gave the proportion ofthe population with health insurance as 13%.46 Theproportion of the population with health insurance nowis only about 15-16%. The number of people withhealth insurance has increased by 9 million in the lastdecade, excluding military personnel and their families.Most of the growth of health insurance coverageoccurred in the last two years. After 1998 wheneconomic crisis was at its worst in Indonesia, thegrowth of health insurance coverage increased sharply.The HMO products sold by PT Askes have reachedone million people at present while the number of peopleinsured by other insurance companies in 1999 was 3.98million.47
It is estimated that private health insurance companiesnow cover more than five million people, twice thenumber of people covered by the Jamsostek healthinsurance programme. Private health insuranceincludes schemes for profit and non-for profit. Thelack of information about this sector is striking. Thereare at least three types of private health insuranceschemes, all extremely weakly regulated by differentgovernment entities, so much so that there are problemsin consumer protection (one large international JPKMwent broke recently). The types of schemes are:
• The traditional indemnity health insurance beingprovided mostly by international insurancecompanies. The law only allows the life insurancecompanies to provide health insurance coverage but,in practice, it is being provided even by othercompanies. The companies providing healthinsurance are doing so under the Life Insurancebusiness and they are regulated as such by theMinistry of Finance, mostly with no separation
4 5 Thabrany, H and Pujianto. Asuransi Kesehatan dan Akses Pelayanan Kesehatan. Majalah Kedokteran Indonesia, 50(6), Juni 2000. 282-289
46 World Development Report 1993: Investing in Health. Oxford University Press, New York, 1993.47 Djaelani F. Perkembangan dan Peluang Asuransi Kesehatan. Seminar Nasional Asuransi Kesehatan, Jakarta 23-24 Oktober 2000
between the life insurance part of the business andthe health insurance one;
• The JPKM, HMO type of private insurance, mostlyoffered by national companies, for profit or non-for-profit, created on an ad-hoc for this purpose andlicensed and theoretically regulated by Depkes. Theregulatory framework is also extremely weak; and
• Community and cooperative arrangements to providelimited health benefits.
JPKM and community schemes are allowed to do riskrating, in practice to match the package to thecontribution and to have short-term contracts whichvary yearly. Most private health insurance companiesfocus on offering group insurance within whichcommunity rating or risk rating (for different sub-groups) is used for setting the premiums. However,although in principle it might look like community rating,they are increasingly doing individual risk rating as theydifferentiate the benefit package even within a group.This practice (resulting from the lack of regulation)might potentially result in very negative practices andabuse by insurers and employers’ toward the low-income workers within a group. Regulation is almostabsent and the existing one is weak and not enforced.Private Health Insurance is operating under twodifferent frameworks. One, law 23, for JPKM, whichis regulated by the corresponding unit of theDepartment of Health, including a financial guaranteewhich is in practice small (indexed to the reportedmembership), no solvency margin or technical reservesregulation, no effective benefit package or consumer-scheme contract regulation. In turn, other private healthinsurance (mainly international companies or largenational insurance groups) are operating under law 3,which allows the provision of “health programs” underthe Life Insurance section of such law. Therefore, allfinancial guarantees and solvency margins andtechnical reserves regulations are referred genericallyto the life insurance product and within it, implicitly forhealth insurance. No specific regulation for healthinsurance exists.
The Indonesian policy on health services allows public-private partnership both in financing and delivery ofhealth services. However, it is not clear what portionthe public sector must be responsible for and whatportion the private sector could be responsible for.

Part III Chapter 16
194
Currently this issue is being debated within the healthsector, especially after the implementation ofdecentralization of health services. In general, thereare discussions that money from the government budgetshould be used to pay for the provision “public goods”such as environmental sanitation and immunization.However, the detailed services to be the responsibilityof the government and local governments are not yetlisted. There is a general consensus that financing ofcurative care and other individual care that areconsidered “private goods” will be the responsibilityof the community, except for the poor that will befinanced by the government. It is still not clear whowill bear the cost of personal health care for themarginal people who cannot afford to meet their healthcare needs but who are not qualified for assistance. Itis also not clear to what extent; the government willprovide assistance to the poor in meeting their healthneeds. In the past, the assistance covered only basichealth care; whereas secondary and tertiary care (forwhich the poor and the marginally non poor cannotafford to pay) were not covered. The need for healthinsurance will, therefore, increase in the near future.
In the delivery of health services, the trend is that thegovernment will place more reliance on the privatesector. Currently, public hospitals are being privatizedor transformed into autonomous entities. This couldbe in the form of for-profit state or local governmententerprises (BUMN or BUMD). Many health centresare also being transformed from the local governmentfacilities into autonomous health care facilities, knownas swadana. Much of this transformation is aimed atmaking financial management and the responsivenessof management to local demands more flexible. As ageneral trend, user fees may increase significantlywhile social protection for those who may not be ableto afford the services is not yet established. One seriousconcern over this transformation is that the financialaccess by the poor or nearly poor people might bejeopardized. Some public health programs currentlyinstalled, such as immunization, family planning, anderadication of communicable diseases, may fail toachieve significant coverage. As a consequence, theremay be rising prevalence of communicable diseases.
Micro Financing Schemes
As discussed in the previous sections, the governmentcontributes about 2 - 3.6% of the total governmentexpenditure for health annually, the lowest among
ASEAN countries. To supplement this low publicspending on health, the Ministry of Health introduceda concept of micro financing scheme called dana sehator village health fund in the 1970’s. At that time, it waspredicted that the government funding for health woulddiminish because of a significant reduction in oilrevenues. Many health care financing advocatessuggested that the government domination of fundingfor health care was not good for the future of the healthsystem in Indonesia. Therefore, money fromhouseholds was to be mobilized to meet growing needsof health services of the community.
Households have been also spending a relatively lowpercentage of their total expenditure on health —ranging from 2 - 4% of total household expenditure.This low health expenditure from household sourcesrepresents low ability to pay for health services wherenationally 50% of households spend 80% of householdincome on food. In such households there is, therefore,little money left to purchase other services and goodssuch as health care and education. This low householdhealth expenditure may be related to low prices chargedby health centres and hospitals. The utilization datashows that visits to health centres account for abouthalf of the total health care visits in most regions in thecountry. In the majority of the districts/municipalities,people get access to health centres for only aboutRp.1,000 (US$ 0.10) per visit. This is one reason whyefforts to mobilize resources from the communitythrough micro financing schemes, such as health cardor health fund (dana sehat) have been unsuccessful—there being no incentive to households to contribute tohealth funds when the cost of health centre services isso low.
Studies by Thabrany and Pujianto from the NationalSocio-economic survey in 1998 found that only 1.87%of the population were holding health cards or weremembers of health funds. There was no significantimprovement in the access to inpatient care amongthe health cardholders or health fund members, butthere was about 47% better access to health centreservices among the members compared to those whowere uninsured. This was due to most micro financingschemes covering only outpatient care in healthcentres. This coverage of health-centre only serviceswas useless because the cost of health centres visitswas affordable by all layers of the population.Therefore, the benefits of health funds were notconsidered meaningful. Studies by Silitupen48, Iriani49,
48 Sillitupen, valens. Evaluasi Perkembangan Dana Sehat di NTT. Tesis, FKMUI, 199849 Iriani, R. Faktor-faktor yang berhubungan dengan kesinambungan Dana Sehat di Kabupaten Bogor. Tesis, FKMUI, 1999

Part III Chapter 16
195
and Asnah50 indicated that very few households paidcontributions for more than two consecutive years.Drop out rates from the first to the second year ofhealth fund membership were between 60-90%. It isnot surprising that since the introduction of this schemein the 1970’s, there was very little progress. Duringthe beginning of the financial crisis in 1998, when thegovernment introduced a social safety net program inthe health sector by providing financial assistance toabout 18 million poor families (at a cost of Rp. 180billion in 1998); the dana sehat schemes halted51.During the crisis poor families were covered by thesocial safety net program that was fully funded by thegovernment. Having financial assistance, the poorfamilies did not feel the need to contribute to danasehat. The target of dana sehat scheme was mostlypoor families from whom the fund collectedcontributions. This targeting was in contradiction tothe general principle of contributions by those who couldafford to pay to provide social assistance for the poor.
The failure of dana sehat to expand and to developinto a more sustainable schemes was considered to bedue to:
• Benefits provided were far from the members’needs. Most dana sehat provide health benefits inhealth centres and some small financial assistancewhere a member is hospitalized. Even a large scaledana sehat sponsored by the provincial governmentof West Java could not develop into a reasonableand sustainable scheme;
• Contributions are set based on community consensusand normally very low. Normally dana sehat collectcontributions door-to-door at a predetermined amountranging from Rp. 100 – Rp. 1.000 per household permonth. The amount of contribution is normallydetermined by general consensus. There is noactuarial calculation;
• The target memberships were the poor communities.While the membership was voluntary, likecommercial health insurance schemes, the maintarget groups for membership were the poor whodeserve free care. The poor rarely have moneyavailable to contribute regularly. The amount offinance available was, therefore, too small to be ableto negotiate an acceptable level of health care; and
• All dana sehat are managed on a volunteer basisby those people or heads of neighbourhoods orvillages who had no knowledge about healthinsurance schemes. In some cases, the money wasthe subject of corruption by the management.
The social safety net program at inception consistedof three different programs of financial assistancesto ensure access to necessary health services forthe poor:
• The first program targeted high-risk pregnant womenby channelling money (Rp. 10,000 per poorhousehold) directly to a village midwife. This moneycould be used by the midwife to refer high-riskpregnant mothers to a health centre or hospital. Themoney could also be used to pay for drugs, services,or transportation costs. This program increasedaccess to hospital services for quite severe casessuch as bleeding and complicated delivery;52
• The second program was the promotion of JPKM(community health maintenance scheme adoptedfrom the concept of HMO in the U.S.). Rp.10,000per poor family was given to companies, cooperatives,or foundations to establish a sustainable ‘pre-bapel’(provisional bapel) in a district. The pre-bapel couldretain 8% of the money for administration andpreparations for full (licensed) bapel status. Theprogram provided the objective that, after two years,the pre-bapel could expand its membership by sellingJPKM/HMO product to non-poor families.Immediately, 354 pre-bapels were created — themajority by civil servants, pensioners or cooperativesof civil servants within district health offices with noprior experience of managing such schemes. Afterone year, under heavy criticism, this program wasterminated. Evaluation of the pre-bapel program inEast Java and in South Jakarta revealed that therewas no real prospect of pre-bapels achieving fullHMO status (Ekowati53 2000; Azwar 200154);
• The third program was the assistance for healthcentre services through special block grants ofRp.10,000 per poor family to all health centres. Thehealth centre could use the money to buy drugs, tosupplement essential drugs supplied by thegovernment;
50 Asnah. Faktor-faktor yang berhubungan dengan kesinambungan Dana Sehat di Lampung Barat, Tesis, FKMUI, 200151 Azwar, R. Evaluasi program JPKM-JPSBK di Jakarta Selatan, Tesis, FKMUI, 200152 Hasan, F. Evaluasi Program JPSBK terhadap Kehamilan Risiko Tinggi., Thesis December 2000.53 Ekowati. Faktor-faktor yang berhubungan dengan kemandirian pra bapel JPKM-JPSBK di Jawa Timur., Tesis, FKMUI, 200054 Azwar. Faktor-faktor yang mempengaruhi utilisasi JPKM JPSBK di Jakarta Selatan. Tesis, FKMUI, Depok 2001.

Part III Chapter 16
196
• In addition, hospitals got some help through thedisbursement of financial assistance for theoperational costs of providing inpatient care for thepoor. The latest programs had mixed results inimproving access by the poor. However, those in themarginally poor group (who did not qualify for theassistance, but were unable to pay for expensivemedical care in hospitals — such as self employed,part-time workers, seasonal workers, and farmers)remained in a difficult situation in meeting their medicalneeds. Evaluation of this program showed that morethan 90% of the beneficiaries who were eligible,satisfied the means test. While the remainder of theprogram was received by those who actually couldafford to pay part of the care (Khumaedi, 200)55;and
• Further evaluation of the safety-net program is givenin the report entitled ‘Klaten Re-visited’, sponsoredby the ILO under the Project ‘Restructuring theSocial Security System’. This report is reproducedin Part III of this Publication.
Access To Primary Care
Primary health care in Indonesia is delivered throughpublic health centres and private clinics or doctors insolo practices. For 85% of the population who do nothave health insurance, access to primary health carevaries according to their economic status, individualpreference, and availability of transportation to thefacilities. Local governments normally set user fees atvery low levels that all people can afford. After theRegional Autonomy Law has been implemented, localgovernments will tend to raise user fees in order torecover the costs of providing basic health servicesthat were traditionally funded by the centralgovernment. User fees have been between Rp.500and Rp.2,000 per visit, including three days ofmedication. The quality of services at public healthcentres, and sub-health centres is considered very poorresulting in the majority of people who are the betteroff declining to use health centre services. Instead,they go to private doctors. These are the same doctorswho provide services in the morning at health centres,having private practice in the evening to supplementtheir low income from government. This is one reasonwhy policy makers are considering increasing user feesso that the facilities will have adequate funds tomaintain certain level of quality. The trade-off is thatthe poor or marginally poor may be excluded.
Because user fees in health centres have been verylow (less than the price of a bottle of drinking water),almost all people can afford to pay for the services.Often the problem is not in the price of service, but inthe transportation costs. In rural areas, only one healthcentre or sub-health centre is available for severalvillages or even for one sub-district. The travel coststo health centres can be the same or ten times morethan the user fees set by local governments. Numerousstudies have reported that access to health centres isgood only for those living within one to two kilometresfrom the centre. While for hospitals, access is goodfor those living within ten kilometres from the hospital.Beyond that, many people have geographical barriersto health centre and hospital access. Formal sectorworkers who normally live in urban areas may not havegeographical barriers to the services. To overcomegeographical barriers, the government provides mobilehealth centres visiting remote villages at least once aweek. The availability of public health centres(stationary, mobile, and sub-health centres) and lowuser fees make access to primary health services quitegood for all levels of the community. The better off,who demand better services, may visit a private doctorin the afternoon. The chart below (Figure-2) depictsthe relatively equitable access to primary health carefor all groups of the population (Thabrany 2001)56.
Figure-2 shows that the number of primary care visitsper thousand of the population by ten income deciles,from the poorest ten percent to the richest ten percentof the population, did not differ significantly. In otherwords, there has been equitable access to primaryhealth care in Indonesia. There are some differences,however, 15 visits per thousand people between thepoorest ten percent and the richest ten percent of thepopulation (Figure 3). The poorest ten percent onaverage had 358 visits per 1,000 people per monthwhile the richest ten percent had 373 visits per 1,000people. There were minor differences in primary healthcare visits between the insured and the uninsured.These minor differences were due to low health centrefees, good distribution of health centres, sub healthcentres, nurses, general practitioners, and mobile healthcentres. If we examine visit rates to private doctorservices, the differences were quite high. However,those who had low access to private doctor serviceshad options to visit public health services with almostno barriers. This equitable access may diminish if localgovernments transform public health centres intoswadana facilities and raise user fees.
55 Khumaedi. Evaluasi program JPSBK di RSU Tangerang. Thesis, FKMUI, Depok 20005 6 Thabrany, H. Hospital and Health Insurance. Paper presented at Hospital Seminar and exhibition center, University of Indonesia,
August 27-29, 2001.
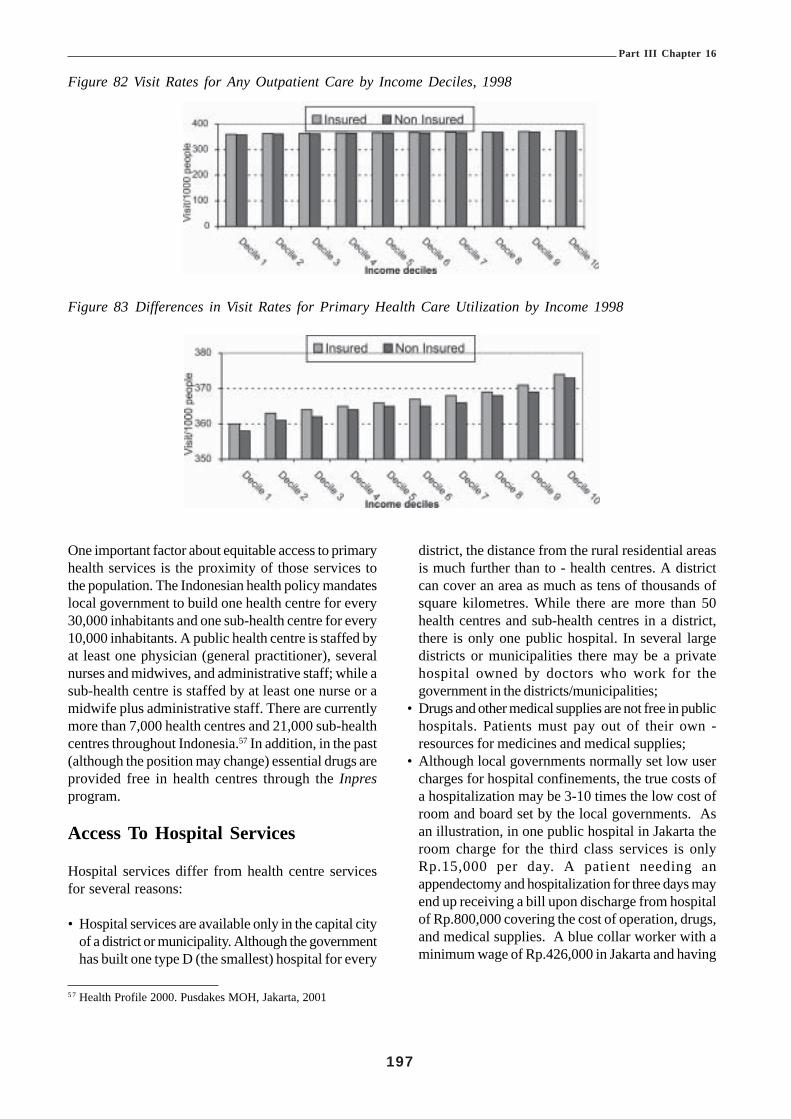
Part III Chapter 16
197
Figure 82 Visit Rates for Any Outpatient Care by Income Deciles, 1998
Figure 83 Differences in Visit Rates for Primary Health Care Utilization by Income 1998
One important factor about equitable access to primaryhealth services is the proximity of those services tothe population. The Indonesian health policy mandateslocal government to build one health centre for every30,000 inhabitants and one sub-health centre for every10,000 inhabitants. A public health centre is staffed byat least one physician (general practitioner), severalnurses and midwives, and administrative staff; while asub-health centre is staffed by at least one nurse or amidwife plus administrative staff. There are currentlymore than 7,000 health centres and 21,000 sub-healthcentres throughout Indonesia.57 In addition, in the past(although the position may change) essential drugs areprovided free in health centres through the Inpresprogram.
Access To Hospital Services
Hospital services differ from health centre servicesfor several reasons:
• Hospital services are available only in the capital cityof a district or municipality. Although the governmenthas built one type D (the smallest) hospital for every
district, the distance from the rural residential areasis much further than to - health centres. A districtcan cover an area as much as tens of thousands ofsquare kilometres. While there are more than 50health centres and sub-health centres in a district,there is only one public hospital. In several largedistricts or municipalities there may be a privatehospital owned by doctors who work for thegovernment in the districts/municipalities;
• Drugs and other medical supplies are not free in publichospitals. Patients must pay out of their own -resources for medicines and medical supplies;
• Although local governments normally set low usercharges for hospital confinements, the true costs ofa hospitalization may be 3-10 times the low cost ofroom and board set by the local governments. Asan illustration, in one public hospital in Jakarta theroom charge for the third class services is onlyRp.15,000 per day. A patient needing anappendectomy and hospitalization for three days mayend up receiving a bill upon discharge from hospitalof Rp.800,000 covering the cost of operation, drugs,and medical supplies. A blue collar worker with aminimum wage of Rp.426,000 in Jakarta and having
5 7 Health Profile 2000. Pusdakes MOH, Jakarta, 2001

Part III Chapter 16
198
5 8 Trisnantoro, et al. Evaluasi RS Pasar Rebo dalam era desentralisasi, PPEK UGM, Yogyakarte, 2000.5 9 Thabrany, H. Perbaikan Askes Pegawai Pemda DKI. Unpublished. Jakarta 200160 Thabrany, et.al. Comprehensive Review of JPK in Indonesia. Yayasan Pengembangan Kesehatan Masyarakat Indonesia, Jakarta 2000
group. On the other hand, the poorest 10% of thepopulation had only about one-fifth of the hospitaloccupation of richest 10%, both for the insured andnon-insured. The gap between inpatient days for theinsured poor and the rich - remain high because thebenefits are inadequate. According to many studies,insured civil servants ought to pay up to 80% of thehospital costs and drugs (Trisnantoro et al. 200058;Thabrany 200159).
Additional analysis can be conducted by examining thehousehold financial burden to pay for hospitalization.In this analysis, researchers examined how much ahousehold had to pay for an admission of a householdmember to any hospital. Researchers calculatedaverage amounts of money for such hospitalisation andaverage total household expenditure in one month foreach income decile. The study found (Figure-5) thatthe poorest 10% of the population had to spend 230%(2.3 times) of monthly total household expenditure forone inpatient care. Despite high subsidies given bythe government to public hospitals, most low incomeindividuals could not get access to inpatient carebecause of the costs of medical procedures andexpensive, unsubsidised drugs.60 Figures 4 and 5indicate the correlation of low inpatient days by thosein lower income levels and the high price a householdhad to pay to a hospital. This financial burden willcontinue or even worsen while there are no significantpolicy changes to solve the problems.
no insurance, must spend about two months salaryfor such an appendectomy at a public hospital. Thecost of intensive care or going to a private hospitalwould be devastating to a blue-collar worker’sresources. They may even have to pay a depositprior to admission; and
• The quality of services varies widely. Hospitalservices are designed to provide special/secondaryor even tertiary care. In theory, type D hospitalsprovide four specialists; a surgeon, a gynaecologist,a paediatrician, and an internist. In reality, thoseservices may not be available to communities at alltimes. At a type B hospital in Jakarta, third classpatients do not get treatment from specialists. Manyspecialists in that hospital are unwilling to visit thepatients because there is no additional fee besidethe specialists’ monthly income. Specialists who visitpatients admitted in second class or first class,however, get financial incentives for each visit.
As a result of these problems, there is great inequity inaccess to hospital services, even at public hospitals.The barriers can be geographical, cultural, and financial.Financial barriers remain the largest factor. Figures 4and 5 suggest that there were, and continue to be, largegaps between the poor and the wealthy in access tohospital inpatient care, even at public hospitals(Thabrany, 2001). The richest 10% of the populationhad more than 400 hospital days per 1,000 people.Members of Askes and Jamsostek (insured group) had500 hospital days — higher than those of non-insured
Figure 84 Hospital Inpatient Days per 1000 People by Income Groups and Insurance Status, 1998.

Part III Chapter 16
199
Figure 85 Average Financial Burden of Households (times household monthly expenditure)(for one admission by income deciles)
Quality of Health Services
The quality of health services in Indonesia is difficultto measure because of lack of set standards, for bothclinical and administrative services. Although there areclinical standard guidelines developed by the IndonesianMedical Association, these guidelines providestandards for only about 200 medical conditions/procedures and these are not widely accepted,especially by specialists. Administration of healthservices in health centres and hospitals varies betweeninstitutions. Very few hospitals use computerizedsystems for medical records or appointments, even inJakarta. The physical appearances of public hospitalsand health centres are generally not attractive topatients from middle and upper classes, although it isargued that public health centres and public hospitalsare provided for the people in the lower incomebracket. Private clinics and private hospitals arecompeting to attract patients from middle and highincomes resulting in better physical appearance andamenity services being offered.
The market for health services remains quite small,except for large cities like Jakarta, with little incentiveor need for competition for providers to improveservices. One measure of service quality is usersatisfaction. But there is no user satisfaction surveyconducted in public health or public hospital servicesat national level. There is also an absence of a nationalsurvey on consumer satisfaction of private providers.
In general policy makers admit that the quality ofservices in Indonesia, especially by public providers, isnot good enough. The fact that many patients frommiddle and high-income groups use private providersrather than public, or go to Singapore or Australia fortreatment is an indication of the poor quality of healthservices in Indonesia. Despite facility-wide surveys(Warnida61 and Neneng62) showing that 80 - 90% ofpatients were satisfied with services by public providers,many health analysts are sceptical of these resultswhich differ from their own observations.Accreditation of hospitals is not yet considered a reliablemeasurement of quality of services, since the emphasisin the accreditation process is on structural measuressuch as whether or not there are guidelines foremergency care or medical records.
The measurement of user satisfaction also lackscredibility because the majority of users are peoplefrom low educated and low-income groups. Themeasurement of user/customer satisfaction itself isproblematical due to the subjectivity of themeasurement. This measurement is considered reliableonly for high-income or highly educated users in largecities where there is the availability of choice and whereusers are able to compare the services of otherproviders. In villages and districts where most peopleoften have no choice of health centre or district hospital,no knowledge of how the services should be providedand no opportunity of comparison, measurement of usersatisfaction is unreliable.
6 1 Warnida, Faktor-faktor yang mempengaruhi kepuasan pasien di Paviliun Kartika, RSPAD, Skripsi FKMUI, 20016 2 Neneng. Kepuasan pasien Askes dan Non Askes terhadap rawat jalan di RSU Bekasi, Tesis, FKMUI, 2000

Part III Chapter 16
200
One of the more objective measures is to examinehow people choose medical care when they haveoptions. The assumption is that those who have a betteroption that they can afford would choose theirperception of the best quality of service. On the basisof this assumption, an examination of utilization datafrom the Susenas of 1998 and 1999 shows that, evenfor those who were covered by health insurance underAskes, there were people who chose health carefacilities outside the network of public providers thattheir entitlement covered. This means that manypeople prefer to utilize health care on the basis ofservice quality rather than cost. The proportion ofinsured civil servants who utilized outpatient care fromprivate providers for which they had to pay the fullcost accounted for about half of the total visits.63 Thisimplies that those people perceived that the servicesprovided in public health care facilities were notacceptable, preferring to pay for better services out oftheir own resources. In general, people perceived thatboth outpatient and inpatient services in public facilitiesdo not meet their expectations. Therefore, any attemptto expand social health insurance using predominantlypublic health care providers will face significantresistance from prospective members. The JPKJamsostek scheme, which often uses public healthcentres as gatekeepers, attracts only those in lowerincome groups — thus inhibiting optimal cross subsidyfrom the better off to the worse off.
Efficiency
Efficiency in health services in Indonesia can beevaluated from two different perspectives. The firstperspective is from the allocation standpoint. Untilrecently, government policy focused on assuring thathealth services must be accessible by all citizens. Thusgovernment subsidized health services in public healthcentres and hospitals across the country requireddoctors to provide mandatory services, constructingbuildings, procuring medical and non medicalequipment, and by paying medical staff (includingdoctors, nurses, and midwives) working for the publicproviders. Local governments normally set very lowprices that low-income earners can afford, withouttaking into account the actual cost of each service.Often these low user fees become political issues. Theassumption is that by lowering prices (user charges
are subsidized up to 80% of the true cost) those whoare poor can afford to access health care. Becausethe subsidy goes to the supply side (public providers),the fees for the poor and the better off are the same.This is a regressive payment system, meaning that thepoor must pay a higher percentage of their incomethan the rich in order to the receive services from thepublic health care providers. The supply side subsidieslead to inefficiencies in usage of public money,especially for hospital services, because those whoutilize health services are not necessarily those whoneed subsidies. In fact, data from ten years of thenational socio-economic surveys indicate that those whoare richer are more likely to utilize hospital servicesthan those who are poor. In other words, the subsidieshave been going to the better off and access to healthcare for the poor remains unsatisfactory. From thispoint of view, the low spending on the current healthcare system in Indonesia is biased against the poor.
The second perspective is from the technical aspectof health services delivery. The majority of servicesare delivered through a fee-for-service system leadingto costly medical care. As cited in most healtheconomics literature, this payment system leads tohigher probability of supply-induced demand. Theprobability of the provider prescribing unnecessary carebecomes higher than if the providers are paid on globalbudget or capitation payment system. In a privatehospital in Jakarta for example, the proportion ofdeliveries by Caesarean section is as high as 80% ofthe total birth deliveries. In order to prevent this kindof moral hazard, the Directorate General of MedicalCare of the Ministry of Health issued a maximumstandard for C-sections of 15% in private hospitals. -This level is high by international standards.64 For othermedical services, including prescription drugs,laboratory examinations, and other medical procedures,this payment system also contributes to highinefficiencies. Since about 85% of the population isuninsured and pay medical care out of their ownresources, this payment system will continue withminimal control over wastage, outcomes andinefficiencies. Therefore, efforts to strengthen socialhealth insurance schemes leading to strongerpurchasing power for health services may stimulatesystem efficiency, although health care providers mayresist supporting these efforts.
6 3 Thabrany, H and Pujianto. Analisis utilisasi peserta Askes dari Susenas 98. Pusat Ekonomi Kesehatan, FKMUI, 1999.6 4 Berita IDI, February 2001.

Part III Chapter 16
201
Direction of Health Care Reform
Since the crisis, there have been strong initiatives toreform the health care system in Indonesia. One ofthe more significant reforms is the Healthy Paradigmapproach signed by President Habibie in 1999. Underthis revival of the public health paradigm, the Ministryof Health will take the lead in the healthy public policy,healthy overall development, healthy environment, andshifting the paradigm from mainly curative approachtowards a balance between promotive and preventivehealth care and curative approaches. The Ministry ofHealth set four pillars to achieve Healthy Indonesia2010, a goal to move toward a healthy environment,and universal coverage. The four pillars are: shiftingfrom sick paradigm to health paradigm; preservinghealth rather than curing diseases, professionalism indevelopment of insurance schemes (called JaminanPemeliharaan Kesehatan Masyarakat, JPKM), anddecentralization of health services.65
Healthy Paradigm
Under this paradigm, Depkes assumes responsibilityof guiding the country in a healthy development policyin which all aspects of development must consider theeffects on people’s health. Depkes is responsible formaking policy on healthy environment, healthybehaviour, and for shifting the orientation of healthprograms from curing the sick to maintaining people’shealth. In international public health jargon, thisparadigm is actually not a novel idea. However, fromthe perspective of the Indonesian health care systemthat has been too much oriented toward reactiveapproaches to curing diseases, this paradigm realignsthe vision and mission of Depkes toward a nationalgoal of healthy Indonesia. One of the significant policiesintroduced recently in Jakarta is the requirement tosell only unleaded gasoline to reduce pollution by leadresidues. By eliminating leaded gasoline, thegovernment expects to improve the quality of life byreducing risks associated with lead pollution. Toaccelerate the goal of healthy paradigm, a private, not-for-profit coalition has been set up to promote thehealthy paradigm. By promoting healthy lifestyle, thegovernment expects to reduce the incidence of illnessesin the country and consequently increase the numberof productive days.
Professionalism
Under the professionalism principle, Depkes promotesand encourages the development and improvement inthe quality of service by health professionals such asdoctors, nurses, and midwives. Basic nurse educationthat has been at the level of high school is now beingupgraded to the minimum level of three years educationafter high school. Many universities are now developingbachelor level (four years education after high school)to improve the knowledge and skills to the levelequivalent with nurses in other countries. Medicalspecialist training that for more than three decadeshas been conducted from a university base is now beingtransferred to a hospital base managed by medicalassociations. The Indonesian Medical Association andother Specialty Organizations are now preparing forhospital-base specialist training. This transformationis expected to speed up the production of specialists inIndonesia. Currently about one-fifth of the 45,000doctors in Indonesia are specialists. The shortage anduneven distribution of specialists across the countrycreates inequity in access to modern health care.Without significant efforts to improve skills of healthprofessionals, Indonesia may face serious problems inthe provision of modern health care because the demandfor specialists has been growing much faster than thesupply.
In administration, the government also requires thatmanagers and directors must have certain job-relevantprofessional training. In several provinces, the head ofDinas Kesehatan (District or Provincial Health Office)must be a doctor who has a Masters Degree in PublicHealth. Many hospitals are now headed by a doctorwho holds a Masters Degree in Hospital Administration.Health centre management is also being scrutinized toimprove professionalism in service provision. Forexample, in the past public health centres had to bemanaged by a physician, now a public health graduatewho may not be a medical doctor may become thehead of a public health centre. The public healthgraduate will conduct all managerial and administrativetasks as well as community health programs. Thesekinds of tasks are currently the responsibility of a doctoras Head of Health Centre resulting in the doctor notbeing able to treat all health centre patients and theperformance of managerial and administrative tasksbeing below standard. Under this experimental newleadership the doctor(s) in health centres canconcentrate on caring for and treating patients.
6 5 MOH. Healthy Indonesia 2010, Jakarta 1999.

Part III Chapter 16
202
Privatization/ Autonomous Hospitals and HealthCentres
In line with the professionalism principle, many regionspromoted by the MOH will transform public healthcentres and public hospitals into autonomous bodies.The main goal of this transformation is to give themanagement more flexibility to manage resources suchas revenues and human resources in order to respondquickly to local demands. The transformation toautonomous bodies can be in the form of swadana orstate owned companies. The swadana form isbasically gives the management flexibility to userevenue from user fees according to the facility needs.The status of personnel remains that of civil servants.Under this form, the facilities are exempted from thegovernment accounting system in which all revenuesmust be deposited in the government treasury the sameday the fees are received. The facilities receive anannual budget for investment and operational costs,determined by the local government. Under the currentsystem, the facilities often have chronic supplyproblems that affect quality of services because ofrigid government budgeting and accounting systems.By transforming into swadana facilities thegovernment expects that the quality of services canbe improved and the scope of services can be adjustedto community needs.
The second form of privatization is to transform publichospitals into BUMN or BUMD. Depending on thelevel of privatization, a facility can be transform intoPerjan, Perum, PT Persero, or BUMD. All of theseforms, however, are for-profit organizations that arenot consistent with the mission of public hospitals. ThePresidential Decree No. 40/2001 allows a local publichospital to be transformed into a BUMD, a for-profitentity aimed at improving the local governmentrevenues. Actually, what many health policy makerswant is the flexibility of public health care facilities tomanage revenues and to respond to local needs.However, they were not successful in finding a newlegal entity that is in harmony with visions and missionsof public health care facilities.
The swadana, BUMN, or BUMD forms have onecommon effect on user fees or prices. All of theseforms normally increase user fees to satisfy financialrequirements in managing the facilities. By increasinguser fees, the management expects to provide betterquality of services. However, higher user fees mayjeopardize access to necessary care for the poor ornear poor, especially as a formal mechanism to switch
subsidies from the supply side to demand side of thecost equation¾ such as kartu sehat which has notbeen developed adequately. Management argues thatif a patient attends a swadana facility without adequatemoney, she/he may be exempted from user fees byshowing a village certificate stating that she/he is poor.However, the certificate is not automatically issued toevery poor family. The poor or near poor often decidenot to come to a hospital (after knowing the level offees from neighbours or friends) realizing that theycannot afford the fees. So the problems of accessremain unsolved. There is also evidence that healthcards have been issued to non-poor families.
Decentralization
Decentralization of power and authority has a nationalconsensus. The law of regional autonomy, includingthe health sector, was implemented nationwide inJanuary 2001. While decentralization provides fasterresponse and more appropriate policy in many aspectsof life, there are some disadvantages to decentralizationof health services. Under this law, local governmentsare responsible for providing and financing healthservices in districts/municipalities. One immediateproblem that arises from this decentralization is thatmany local governments perceive that health servicesare mainly consumed with intangible results withoutpolitical leverage for them, therefore financing of healthservices is likely to be accorded low priority. Manylocal governments perceive that hospital services couldbe utilized to generate income. Yet other localgovernments set quite high income from hospitalservices while spending much less on health in theregion. On the other hand some rich districts, such asthe oil rich provinces of Riau and East Kalimantan,are planning to provide health services free of charge.Thus decentralization may result in regional inequitiesin health care.
Mechanisms to cross subsidize poor districts/municipalities have been proposed such as specialallocation funds (dana alokasi khusus), however, thisnotion has not been politically acceptable. Problemsof access to essential health care, especially for thepoor, in decentralized governments have been theconcern of many international and donor agencies suchas the WHO, UNICEF, and the Asian DevelopmentBank (ADB). The National Planning Bureau(Bappenas) is trying to establish a social safety net byproviding special assistance funds for the poor tofacilitate access to essential health services. Until theyear 2002, the ADB has been providing loans for this

Part III Chapter 16
203
social safety net. In addition, in 2001, some Rp.540billion was allocated to finance hospital services,immunization, and essential drugs from the governmentbudget generated from increasing oil prices.Considering the very high number of poor households,this amount of money is very far from adequate.
Jaminan Pemeliharaan Kesehatan Masyarakat(JPKM)
Initially, the concept of JPKM was taken from theconcept of HMO in the United States. The commonfeatures of HMO such as voluntary membership,comprehensive benefits, capitation payment system,community rating premiums, and closed systemdelivery are also found in the concept of JPKM. TheUSAID had been very active in promoting thedevelopment of JPKM in Indonesia, starting from thedevelopment of the concept in the 1980s up to financingthe pilot project in Klaten, Central Java. However, afteralmost 15 years of the promotion of the concept andmore than seven years after the enactment of theHealth Law in 1992 (providing for governmentpromotion and development of JPKM) membershiphas barely reached 100,000 members. Millions ofdollars and billions of Rupiah have been spent onpromoting the growth of JPKM but currently thereare only 21 licensed JPKM bapels (HMOs). Duringthe economic crisis, the MoH spent Rp.180 billion topromote the development of JPKM using social safetynet money in order to establish 354 new pre-bapelsacross the nation. As explained earlier in this Report,none of those pre-bapels was able to becomesustainable or able to cover a significant number ofpeople. This has given some impetus to reform theconcept of JPKM as a means of pooling financialresources using health insurance principles.
Depkes has considered promotion of the JPKMconcept by drafting a law (JPKM Law) aimed atexpansion of JPKM through mandatory membershipof a bapel. By changing membership from voluntaryto compulsory, JPKM is moving to a social healthinsurance concept. The draft also envisagescontributions of 3% of monthly income for singles and6% of income for married people. But contributions
would be payable by the insured person, not theemployer (as is the case with the similar level ofcontribution payable to Jamsostek), which runs counterto the social insurance principle of shared risk.
The concept continues the existence of bapels andpre-bapels, the majority of which by law are for-profitentities that will maximize profits to the stockholders.All people mandated to contribute must choose from anumber of available for-profit bapels as their healthinsurance carrier.66 This is inconsistent with theprinciple of social health insurance of maximizingbenefits to members. The current performance of JPKJamsostek and similar schemes implemented in Chile67
shows that social health insurance by for-profit entitiesleads to adverse selection that benefits investors, ratherthan the people it is designed to protect. It has alsobeen suggested that should the bill be passed someinvestors, or even government officials, may try to usethe proposed JPKM Law to their own businessadvantage within the health insurance industry.
In addition, the proposed JPKM law may require eachof the existing social health insurance schemes (JPKJamsostek and Askes) and all private insurancecompanies to obtain a licence from the MOH to operateas a bapel. The bill will create a huge regulatoryresponsibility for the MOH to license, control, andsupervise bapels — complex tasks that may be beyondtheir current capacity. It is understood that at leasttwo bapels have gone bankrupt, partially due toinadequate regulatory control. The two bapels leftmore than Rp.7 billion in hospital debts while their paidup capital was only Rp.150 million.68 It is alsounderstood that none of the remaining bapels hascapital of more than Rp.500 million, a very low levelof financial solvency to run high risk health insuranceschemes.69
Some parliamentarians have suggested improving andstrengthening the existing social health insuranceorganizations (Askes and Jamsostek) and expandingmembership — rather than developing new privateentities. At the time of writing this Report, it isunderstood that there is no parliamentary agenda fordiscussion of the proposed JPKM law.70 On the otherhand the recommendations of the present project on
6 6 MOH. Draft RUU JPKM, Jakarta, April 20016 7 WHO. WHO Report 2000, Geneva, 20006 8 Personal communication with secretary of the Indonesian Hospital Association.6 9 Thabrany, H; Pujianto; and Mundiharno. Subsidi Silang Antar Bapel dan Antar Kabupaten dalam Pelaksanaan JPKM. PT MJM.
Jakarta, 20017 0 Personal communication with vice chairmen of Commission VII of DPR (House of Representative) responsible for health and social
welfare issues.

Part III Chapter 16
204
‘Restructuring the Social Security System’ forJamsostek to be strengthened and for its membershipbase to be expanded to cover all formal sector workersand progressively to the informal sector, if acceptedand implemented, would actually meet the objectivesof Depkes in a much more efficient and realisticmanner, achieving greater social solidarity and equitythan would be achieved by creating a new law.
Analysis of the Organization of HealthCareThe current organization of the health care systemproduces, inter alia, the following effects:
• Segmentation and fragmentation of the healthinsurance system. Potentially exacerbated, if thesignificant decentralization to the provincial (24) andthe district (320) levels are not well managed;
• Fragmented government policy in social security inhealth and in social security reform;
• Equity problems:
! Formal workers with different contribution ratesand benefit packages based exclusively on whatsector they work for (e.g.: Askes has 2%contribution for public sector workers whileprivate sector workers contribute 3 - 6% forJamsostek.);
! Significant differences in the per-capita publicexpenditures even within the public sector (amongthe regions and districts), resulting from thehistorical allocations of budget. Extremely difficultto correct in the short term given the rigidity ofpublic providers cost structures.
• Public subsidies leaking to the non-poor:
! Users fees and differential utilization of servicesby rich and poor in the public sector;
! Indirect public subsidies to social securityorganizations: to both, Jamsostek and Askesthrough subsidized public sector facility prices;
! Direct public subsidies to JPKMs in the preliminaryimplementation process and indirect subsidies viasubsidized public sector facility prices to all privatehealth insurance including JPKM.
• Inefficiency issues within each sub-sector:
! Low purchasing capacity. There is almost nonexistent in Jamsostek which subcontracts with
“primary providers”, low capacity indemnityinsurance that uses “fee-for-service” and also forJPKMs. Askes seems to be the most developedamong all of the different insurance schemes;
! Public sector provider financing still underhistorical supply side financing (through line itembudgets) — with no separation of purchasing andprovision.
• Weak and fragmented regulation and consumerprotection capacity as well as weak enforcementcapacity: Jamsostek has no right to enforcecompliance, either by employers (this is the role oflabour inspectors from Depnaker/Dinas) or byproviders (it pays “primary providers” on the basisof capitation which in turn sub-contract with specificlocal providers). Multiple regulators for privateinsurance with scarce regulation available and weakenforcement capacity. There is no information onutilization and no monitoring systems. A capitationsystem widely used and implemented in such a wayis potentially susceptible to risk selection behaviourby providers, denial of services and corruption.
The Alternative Scenarios for ReformGiven the geographic, cultural and political complexityof Indonesia and the weak institutional capacity presentin the health sector, reforming the health sector will beparticularly difficult. Indonesia has at least 3 possiblemain scenarios for such reform that are understood tobe currently under consideration by the PresidentialTask Force:
• Reforming each sub-sector separately —addressing the main efficiency and equity issueswithin each sub-sector separately while maintainingsystem segmentation;
• The integration of social health insurance —maintaining system segmentation between the poorand informal population and the formal populationbut developing a single, unified system for the formalsector within either:
! An actual single integrated system with a singlepayer or insurance carrier; or
! Virtual single integration through ‘same rules ofthe game’ for all insurers (premium setting,package, etc.) but with competition permittedbetween insurers, possibly with some mechanismsin place to compensate for the eventuality ofmarket failure;
• Total system integration — with the formal sectorsubsidizing the premium for the poor and the informal
Part III Chapter 16
205
sector, so that they can join any insurer they choose(within the two scenarios shown in the last paragraphi.e. actual single integration or virtual singleintegration). This would mean total separation ofpurchasing and provision and a radical shift from thehistorical supply-side financing to “portability” of thepublic subsidy.
Reforming each sub-sector separately. Thisscenario assumes that Indonesia might wish for somereason (political and technical feasibility and/or policydecision), to retain a three-tier system (with its equityimplications) but improving the functionality withineach of the three. Some of the key aspects are:—
• For the National Health Service (run by theDepartment of Health and district authorities afterdecentralization):
! Shifting from historical supply side financingtowards demand side financing or at least “moneyto follow the patient” within the public sector.Among other effects, it has the potential toempower users when alternative providers areavailable. It most probably requires increasing thelevel of separation of purchasing from provision.The decentralization process provides a goodopportunity to do this;
! Improving the costing and pricing systems in publicfacilities, improving the patient identification system(similar to the Health Card Process) and themanagement (public provider autonomy?) of publicfacilities, all in order to reduce leaking of publicsubsidies to non-poor and to increase efficiency;
! Encourage community organization andparticipation in overseeing public facilities, not asself-contained pooling schemes but as entry pointsto the public system and as a means to improveaccountability and responsiveness.
• For traditional social security
! It is not clear why there is a need for two separatepublic social health insurance agencies usingdifferent rules. The possibility of merging Askesand Jamsostek health insurance components is apossibility;
! There are differential contribution rates for civilservants and private workers — this constitutesan unfair discrimination to non-governmentworkers;
! Separate the health insurance component of both,Askes (but particularly Jamsostek) from their otherprograms and establish them as independent socialhealth insurance schemes;
! Transformations in Askes and Jamsostekgovernance (to be really autonomous from anyparticular vested interested except itsbeneficiaries) and in taxation and governmentfinancial control to ensure autonomy,independence and focus on their user interest only;and
! Significantly improve the strategic purchasingcapacity, currently almost non-existent.
• For private health insurance.
! Amend law No. 3 to allow the private sector toprovide hea lth insurance coverage separatelyfrom life insurance;
! Create a single independent regulator, responsiblefor licensing, regulating, solving controversies andregulating, under ‘same rules’ any form of privatehealth insurance including JPKM, private healthinsurance, community health insurance and anyother private health insurance; and
! The single autonomous regulator should enact clearregulations, mandatory for any form of privatehealth insurance, including minimum requiredcoverage, group insurance, consumer-insurercontracts (pre-existence, exclusions, controversyresolution, and contract comparability), productmarketing, solvency margins, technical reserves,minimum provider availability, etc.
This scenario does not include the elimination of theopt-out provision from Jamsostek. However, it wouldnot be an opt-out provision from Jamsostek but a similarprovision for the new organization created from themerger of Jamsostek-Astek. It also does not includeany specific recommendation regarding the amount ofthe contribution or the maximum salary limit forcontributions as decisions regarding them are a functionof the size and quality of the package that is desiredfor Jamsostek-Astek to cover. However, the minimumcoverage to be regulated for the private sector wouldprobably have to be to indexed to the Jamsostek-Askesbenefit package.
This scenario, particularly in that it does not changethe opt-out provision, does not aim for equalizing allformal workers, much less for equalizing all workersin general. However, it would achieve someequalization among civil servants and formal workersremaining in the new Jamsostek-Astek organization.
Integration of Social Security. This scenario wouldreform separately the National Health Service (forinformal poor workers) and would integrate social

Part III Chapter 16
206
security through a single system. Under this scenarioall formal workers would be covered under the samerules. This could be accomplished under the followingtwo sub-scenarios:
• Single Insurer for all formal workers with additionalvoluntary supplementary health insurance; or
• Single rules of coverage but multiple agents(insurers) to provide coverage under those rules.
For Single Insurers, all formal workers would bemandated to contribute to a single insurer (most likelypublic). The single insurer could be the newly mergedJamsostek-Astek or a completely new public entity.In any case, all recommendations for single rules ofcover shown above would apply.
For supplementary insurance, to be provided by privateinsurance (JPKM, private health insurance companiesand others), all recommendations for Private HealthInsurance (shown above) would apply.
The scenario for Single Insurer shown above de factoeliminates the opt-out provision and leaves privatehealth insurance exclusively as voluntarysupplementary health insurance. It also achieves, atleast in theory (see comments previous section), equalityif the single insurer provides a single package ofbenefits regardless of the contribution of the worker.
Under the Single rules of Cover scenario, all formalworkers, regardless of their income, would be coveredby health insurance under equal conditions and theywould be allowed to choose the insurer among amultiplicity of insurers, including a public insurer. Toavoid traditional health insurance competition failures(due to adverse selection, risk selection, income creamskimming, etc) resulting in risk and incomesegmentation, most probably a basic benefit packageregulation would need to be included in the model aswell as some kind of risk/income equalization fund,similar to the ones existing or being implemented inthe Dutch, German, Chilean and Colombian systems.All recommendations for Private Health Insurance(shown above) would apply.
Total System Integration. This scenario is anexpansion of scenario described in the previousparagraph in which not only formal sector workerswould be covered under a single system and samerules but also informal sector workers and the poor —with public funds being used to subsidize the premiumfor the informal sector and the poor to join either: thesingle insurer sub-scenario, or the choice among all
insurers under the single rules of cover sub-scenario.All comments for that scenario would apply. If ‘singlepackage’ is defined as one of the rules, it probablywould be a very shallow one as it has to be affordableto the state through public financing, unless total cross-subsidization from formal to informal workers is decidedwhich would have very significant incentives for under-contribution and evasion.
The policy debate within government is between thosetwo scenarios (i.e. single insurer or single rules ofcover). Both are very complex technically andpolitically and will require very significant TechnicalAssistance at policy decision level within thegovernment, which are beyond the current capabilitiesof Depnaker and Jamsostek.
Given the current situation in the public health sector,it is very unlikely that any scenario which extends theJamsostek scheme could be considered feasible in themedium term.
Although the single insurer and single rules of coverscenarios are the ones concentrating the discussionwithin the government (as they are rightfully the mostrational alternatives for a country with the cultural,historical and geographic diversity of Indonesia), bothscenarios are fundamentally different and it would notbe surprising if the decision between either of themtakes a long time so that the scenario Reforming eachsub-sector separately becomes the “de-facto”choice. Therefore, future technical assistance shouldbe designed in a way that would be useful for any ofthe 3 scenarios described above, focused on the keystakeholders, but not restricted only to Depnaker,Depkes and Jamsostek.
A detailed analysis of JPK Jamsostek follows in orderto expand on the above scenarios.
JPK Jamsostek (Health InsuranceComponent Of Jamsostek)
Current Conditions and Problems of JPKJamsostek
Legal StructureThe legal basis for the social health insurance program(JPK Jamsostek) is Law No. 3 of 1992; GovernmentRegulation (Peraturan Pemerintah) No.14 of 1993,and the Minister of Manpower Regulation (PeraturanMenteri Tenaga Kerja) No. 05/MEN/1993. Thislegislation also applies to the other three Jamsostek

Part III Chapter 16
207
programs. However, JPK Jamsostek differs from otherJamsostek programs in several ways71:
• The participation in JPK Jamsostek is effectivelyoptional. Where superior health benefits areprovided by an employer (self insured) or throughhealth insurance companies, under Article 2 (4) ofRegulation No.14, there is no liability to participatein the scheme. Because of this provision, the majorityof employers choose to opt out of the Jamsostekscheme and buy health insurance from insurancecompanies or HMO’s;
• Employers are mandated to pay a premium of 3%(for single employees) and 6% (married) with noemployee counterpart contribution;
• The contribution ceiling for this health insurancesince 1993 has been Rp.1,000,000 resulting infreezing low revenues for the medical benefitprogramme;
• The benefits are provided in the form of healthservices through various health care providerscontracted directly or indirectly by Jamsostek, exceptfor limited emergency out of zone care that isreimbursable. Other Jamsostek programs pay cashbenefits to the beneficiaries; and
• The benefits are provided not only to the employeesbut also to family members up to the third child.
Operational Problems
Membership - The Jamsostek health insuranceprogram covers employees and their dependentsincluding up to three children under the age of 21 years.All employers who are not exempted under Article2(4) of Regulation 14/93, regardless of the legal statusof the entities, and who employ 10 or more employeesmust pay health insurance premiums for theiremployees. Employers with fewer than 10 employeesbut with a total payroll of Rp.1 million per month ormore are also required to enrol their employees intoJPK Jamsostek. Given the level of the minimum wage,most employers with two or more employees, includingthose with domestic workers (e.g. a driver and ahousemaid), should be covered. If this law were fullyenforced, health insurance coverage could increase tomore than 100 million people. But, the membershipgrowth of Jamsostek is progressing very slowly (seetable-3), from 199,000 in 1991 to 2.7 million people in2000. The average growth of employers enrolling theiremployees to Jamsostek in the last ten years was 53%
per year, but the number of employees enrolled grewonly by 40% per year and the number of insured(members, including family members) grew even lessat 38% per year. This means that only small employers(average size of 79 employees per employer) areenrolling in JPK Jamsostek while larger employershave been exempted from mandatory membership ofJPK Jamsostek. As a result there is only about 2.5%of the potential coverage by JPK Jamsostek — whilethe vast majority of the eligible workers are still notcovered. Currently, there are about 18.8 millionemployees enrolled in the other three Jamsostekprograms (of those only 9.3 million are activemembers72), but only 1.3 million people enrolled in JPKJamsostek. The total number of people (includingfamily members) covered by this social health insurancein 2000 was only 2.7 million people. The national labourforce survey estimated that 56.2 million workers werefully employed in the year 2000.73 If these workershave an average of only two dependents and only abouttwo-thirds are eligible for Jamsostek, the total numberof people covered by Jamsostek should be about 100million. So there are more than 97 million people thatshould be covered by JPK Jamsostek who are outsidethe present coverage.
Data from commercial insurance companies show thattotal membership of health insurance schemes in the1999 was about 4 million people.74 Health insurancepremiums (excluding personal accident insurance)received by commercial health insurance companiesin 1999 was Rp.279 billion is estimated to reach Rp.1trillion in the current year. At the same period,Jamsostek collected only Rp.155 billion in 2000, muchless than the total health insurance premiums receivedby the private insurance companies. Thus it could beinferred that the Jamsostek law — with the opt-outprovision in place — has benefited commercial healthinsurance companies more than the JPK Jamsostekscheme.
The above comparison clearly indicates that the existingJamsostek law is not consistent with the social healthinsurance principles of shared risk and protection ofemployees on an equitable basis. Employees withhigher incomes get their health benefits from the privatesector while employees with lower incomes receivetheir health benefits from an under-funded JPKJamsostek. This creates an adverse selection situation.
7 1 Jamsostek. Kompilasi Peraturan Jamsostek. PT Jamsostek, 19997 2 Jamsostek web data, 20017 3 ILO. National labor force survey, 20007 4 Djaelani, F. Perkembangan Asuransi Kesehatan di Indonesia. Makalah disajikan pada Seminar Nasional Asuransi Kesehatan, Jakarta,
Oktober 2000
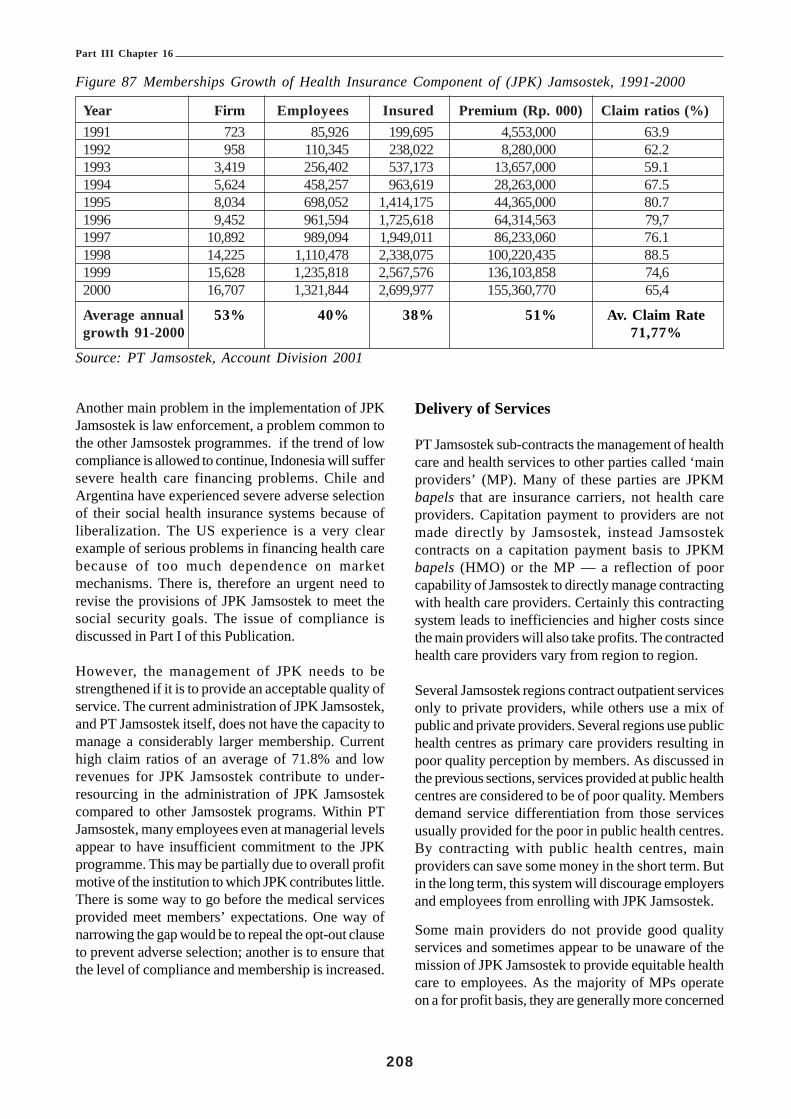
Part III Chapter 16
208
Another main problem in the implementation of JPKJamsostek is law enforcement, a problem common tothe other Jamsostek programmes. if the trend of lowcompliance is allowed to continue, Indonesia will suffersevere health care financing problems. Chile andArgentina have experienced severe adverse selectionof their social health insurance systems because ofliberalization. The US experience is a very clearexample of serious problems in financing health carebecause of too much dependence on marketmechanisms. There is, therefore an urgent need torevise the provisions of JPK Jamsostek to meet thesocial security goals. The issue of compliance isdiscussed in Part I of this Publication.
However, the management of JPK needs to bestrengthened if it is to provide an acceptable quality ofservice. The current administration of JPK Jamsostek,and PT Jamsostek itself, does not have the capacity tomanage a considerably larger membership. Currenthigh claim ratios of an average of 71.8% and lowrevenues for JPK Jamsostek contribute to under-resourcing in the administration of JPK Jamsostekcompared to other Jamsostek programs. Within PTJamsostek, many employees even at managerial levelsappear to have insufficient commitment to the JPKprogramme. This may be partially due to overall profitmotive of the institution to which JPK contributes little.There is some way to go before the medical servicesprovided meet members’ expectations. One way ofnarrowing the gap would be to repeal the opt-out clauseto prevent adverse selection; another is to ensure thatthe level of compliance and membership is increased.
Delivery of Services
PT Jamsostek sub-contracts the management of healthcare and health services to other parties called ‘mainproviders’ (MP). Many of these parties are JPKMbapels that are insurance carriers, not health careproviders. Capitation payment to providers are notmade directly by Jamsostek, instead Jamsostekcontracts on a capitation payment basis to JPKMbapels (HMO) or the MP — a reflection of poorcapability of Jamsostek to directly manage contractingwith health care providers. Certainly this contractingsystem leads to inefficiencies and higher costs sincethe main providers will also take profits. The contractedhealth care providers vary from region to region.
Several Jamsostek regions contract outpatient servicesonly to private providers, while others use a mix ofpublic and private providers. Several regions use publichealth centres as primary care providers resulting inpoor quality perception by members. As discussed inthe previous sections, services provided at public healthcentres are considered to be of poor quality. Membersdemand service differentiation from those servicesusually provided for the poor in public health centres.By contracting with public health centres, mainproviders can save some money in the short term. Butin the long term, this system will discourage employersand employees from enrolling with JPK Jamsostek.
Some main providers do not provide good qualityservices and sometimes appear to be unaware of themission of JPK Jamsostek to provide equitable healthcare to employees. As the majority of MPs operateon a for profit basis, they are generally more concerned
Figure 87 Memberships Growth of Health Insurance Component of (JPK) Jamsostek, 1991-2000
Year Firm Employees Insured Premium (Rp. 000) Claim ratios (%)1991 723 85,926 199,695 4,553,000 63.91992 958 110,345 238,022 8,280,000 62.21993 3,419 256,402 537,173 13,657,000 59.11994 5,624 458,257 963,619 28,263,000 67.51995 8,034 698,052 1,414,175 44,365,000 80.71996 9,452 961,594 1,725,618 64,314,563 79,71997 10,892 989,094 1,949,011 86,233,060 76.11998 14,225 1,110,478 2,338,075 100,220,435 88.51999 15,628 1,235,818 2,567,576 136,103,858 74,62000 16,707 1,321,844 2,699,977 155,360,770 65,4
Average annual 53% 40% 38% 51% Av. Claim Rategrowth 91-2000 71,77%
Source: PT Jamsostek, Account Division 2001

Part III Chapter 16
209
with profit margins than maximizing quantity and qualityof services — which should be the main goals of healthcare in a social security scheme. At present, there isno standard procedure for the selection of MP byRegional Offices of Jamsostek. Many MP’s do nothave service providers of their own. Instead they sub-contract services to other providers leading to higheradministrative expenses. Taking into account 20%administrative costs by PT Jamsostek and additionaladministrative costs by MP’s, the amount of fundinggoing to health care providers is less than 60% of thetotal contribution received. This high administrative costleads to low quality of health care benefits anddissatisfaction of the system by service providers andmembers alike.
This long contracting chain is inefficient and can alsolead to corruption. Indeed there were allegations thatcertain officials in Jamsostek asked for “kick back”money for placing contracts, resulting in less moneyreaching health care providers.
In most social health insurance schemes in othercountries, the administrative costs can be as low as3% (Taiwan) and 5% (Germany). The economy ofscale by pooling in one agency that is responsible forthe administration of health insurance, such as the casein Taiwan, Canada, or even Medicare in the US, canachieve administrative cost efficiency levels of up to4% of premiums. If the number of members is verylarge, contracting out health services managementthrough intermediaries (main providers) may lead tohigher efficiency. For Indonesia where the amount ofpremiums is relatively small, the overall maximum of10% administrative costs would be acceptable ifmembership was high. If this low administrative costcan be achieved, then the benefits received bybeneficiaries will be optimal.
The capitation payment system prescribed byRegulation 14/93 is required to ensure that healthservices are delivered in a cost-effective way. Intheory, all providers must be paid on capitation paymentsystem; however, in practice this is not always possible.Doctors and hospitals are not ready to accept ‘risk-contracting’ by capitation payment because they arenot trained to accept risk and the market for fee-for-services is still dominant. The environment is simplynot supportive for a capitation payment system, exceptfor relatively small number of primary care physicians.
Partial capitation payment to primary health servicesis, however, undertaken in many Jamsostek branches.Capitation payment to primary care providers is easierto manage since the required number of members forprimary care capitation is low.75
Capitation payment to hospitals is used only in thosebranches that have sufficient members (Purwoko andMahmud, 1998).76 Furthermore, the MOH Decree onhospital prices still provides guidelines for user chargesbased on a fee-for-service system. In addition, all localregulations on health centre and hospital prices are ona fee-for-service system. Capitation payment tohospitals is much more difficult to manage, even forprivate hospitals in which prices are not regulated.Many hospitals will not accept capitation payment sincethere is a lack of information on which to base anadequate level of capitation payment. Moreover,capitation payments to hospitals require much largermemberships due to large variations in costs peradmission. Finally, hospital managers are not trainedto assume risks for services provided.
This review of Jamsostek should, therefore, consideroptions for revising the payment systems that areapplicable and accepted by various health careproviders. The proposed revision of Jamsostek shouldaccommodate more flexible payment systems (ratherthan only capitation) that facilitate efficiency in healthcare financing and delivery systems. Prospectivepayment systems other than capitation can stimulateefficiency.
Prospective payment systems must be accompaniedby explicit standards of service. Most providerscontracted by MPs or contracted directly by aJamsostek branch do not have adequate qualitystandards. The MOH and the Indonesian MedicalAssociation do not have the capacity to controlstandards of medical care, simply because acceptablestandards are yet to be developed and implemented.If PT Jamsostek had a larger purchasing power, theabsence of standards developed by the MOH orprofessional associations could be taken over by thepurchaser. However, the number of members is verysmall. In addition, many MPs contracted by PTJamsostek do not have adequate training or skill inmanaging social security or providing services to healthinsurers. The proposed revision must take into account
7 5 Thabrany H. Rasional Pembayaran Kapitasi. Yayasan Penerbit IDI, Jakarta 20007 6 Paper presented at the First National Conference on Health Insurance, Jakarta, November 9-11, 1998.

Part III Chapter 16
210
7 7 A CAR advertisement on Kompas, Saturday 22, 20017 8 Source. Accounting Department, PT Jamsostek.
the need to manage these quality standards in order toattract significant number of members.
Information System
The current information systems in Jamsostek do notsupport changes of membership data (marital status,family size, change of employers, etc.), while thecapitation payment system to providers (MPs) requiresexact numbers of employees and their dependents ona monthly basis. As a result, many members are noton the list for capitation payment but neverthelessdemand health care services. Providers refuse toprovide services, which creates conflict betweenmembers, providers, and Jamsostek. This kind ofconflict reduces the trust of members and employersin Jamsostek. The main cause of this information laghas been the difficulty in updating records due toemployers’ neglect, employees’ poor awareness, andJamsostek poor information management. Lack ofadequate human resources in Jamsostek informationdivision generates more information problems. The ILOReport on Jamsostek Operations and IT Systemsprovides more detail about the shortcomings of thesystems and makes recommendations for improvement(see also Part I of this Publication).
It was reported that hospitals sometimes billedJamsostek/MPs for services rendered for Jamsostekmembers using higher than pre-negotiated prices. Thereare several reasons for these inappropriate claims.Firstly staff at hospitals may be confused about variousprices applicable to different insurance carriers.Currently there are more than 70 companies offeringhealth insurance and contracting services to hospitalsusing unique prices negotiated in advance. Staff athospitals may mistakenly quote prices negotiated withother insurance carriers and bill the prices to Jamsostek.The second possible reason is that hospital staffsdeliberately charge higher than negotiated prices toincrease income, especially when prices of medicalsupplies and drugs are not stable. This practice mayenable providers to balance overall costs where therewould otherwise be a loss. This kind of moral hazardis often reported in health insurance literature. Theinformation system of Jamsostek must be designed toenable managers to identify moral hazards from healthcare providers and possibly by members. The existinginformation system is not designed to provide thesewarnings.
Other Operational Problems
Many employers complained that Jamsostek was notresponsive enough to their concerns about notices ofpayment received; issuing ID cards, poor services, andhandling of other complaints about the JPK program.This is partially due to the low level of resources withinthe program. Clearly the human resource deployment,including provision for training in managed caretechniques, would need to match increases inmembership. Failure to address this problem willinevitably result in further dissatisfaction with theservice and resistance to compliance.
Other Problems in the Implementation of JPKJamsostek
The contribution ceiling (Rp. 1 million) set almost eightyears ago without adjustment is detrimental to JPKJamsostek’s financial viability and is in urgent need ofreview. Under this ceiling, employers contribute amaximum of only Rp. 60,000 (married employees) orRp. 30,000 (single) per month. If the ratio betweenemployees and total members is 3 (on average twodependents for each employee) then the contributionis only Rp. 10,000 – 20,000 per person per month. Acommercial health insurance product sold by PT AJCentral Asia Raya costs Rp. 125,000 per person permonth for inpatient coverage only,77 much higher thancontributions for JPK Jamsostek despite itscomprehensive coverage. Many employers allocatemoney for health benefits above Rp. 60,000 peremployee. As a result companies that on average payhigh salary have more incentive to opt out of the PTJamsostek scheme in order to obtain health insurancefrom private insurance companies (that provide betterservice).
The average premium received by Jamsostek permember in 2000 was only Rp. 5,224.78 In contrast oneof the cheapest premiums sold by a national insurancecompany was Rp. 50,000 per member per month. PTAskes markets the comparable products for Rp. 20,500per month or four times the JPK Jamsostek averagecontribution. Of course, the commercial insurancecompanies must provide better services (or perceivedto be better) as required by the Ministerial DecreeNo. 01/1998. The claim ratios of commercial insurancecompanies have been about 60% and below current

Part III Chapter 16
211
delivery of JPK services, the amount of money goingto health care providers from Jamsostek may also reach60% of the total contribution received. This comparisonindicates that an employer may be in a better positionto buy health insurance from the private sector in orderto receive better services.
The minimum benefits dictated by the law cover limitedcomprehensive health services. Access to outpatientcare and specialist services, including hospitalizationrequires referral by gatekeepers, health centres orprivate doctors. However, inpatient services are limitedto 60 days, including a maximum of 20 days in anintensive care unit. The level of inpatient care is limitedto second-class rooms in designated public hospitalsor third-class rooms in designated private hospitals.Considering the more limited choice of hospitalscompared with a traditional health insurance productfrom the private sector, employers and employees willprefer the product from the private sector.
Haemodialysis, cancer treatment, cardiac surgery,congenital diseases, alcoholism, drug abuses, organtransplants and all services provided by non-contractedproviders are not covered (Supriyono, 1998)79. Drugsare covered if doctors prescribe them from a specialformula developed by PT Jamsostek. Because someexpensive medical care is not covered, manyemployees and employers consider that the benefitsprovided by JPK Jamsostek are not sufficient ormeaningful. The proposed revision of Jamsostek musttake into account to change the benefit levels.
Relevance
The Declaration of Human Rights, the ILO Conventionand the Indonesian Constitution clearly acknowledgethat employees and their dependents are entitled tohealth care under social security. The WHOemphasizes that health care is a fundamental humanright that enables people to work, study, and improvethe quality of life. Countries all over the world arestriving to provide universal coverage of healthinsurance to be able to produce goods and serviceswithout worrying about unaffordable health care. Thebasic principle of equitable health care adopted by alldeveloped and newly developed countries is that every-body should get health services according to his/hermedical needs and independent of his/her ability topay.80 It is under this principle that social security
covers medical care and maternity benefits, eitherintegrated with other social security programs ormanaged independently as social health insuranceprograms for workers.
In Indonesia, the financial burden of ordinaryhouseholds in obtaining necessary health services isvery high. A family may go bankrupt if a member ofthe family needs inpatient care. Data from Susenasconsistently shows that families may have to spend atleast the total of all monthly family income in order topay for a single inpatient care of one household member.This means that if a family with no insurance or otherfinancial support will be in financial deficit if requiredto pay for inpatient care for one family member.Therefore, risk-pooling and sharing among all otherworkers, employers, and the government is necessaryto ensure that no one should suffer from severesickness and financial distress at the same time. If agroup of workers is allowed to choose not to share bypurchasing health insurance to meet their uniquedemands, then other groups may demand the sameprivilege. Eventually no group will wish to share withothers and therefore many families will continue tobear high financial burden and suffer from anunexpected illness.
In neighbouring countries such as in Thailand, thePhilippines, Taiwan, and South Korea all employersand employees must join the social health insurancescheme without exception. In the Askes program, allcivil servants become members of Askes thus avoidingadverse selection. The JPK Jamsostek opt-outprovision is inconsistent with the goal of social securityand it does not facilitate the achievement of theobjectives of the Declaration of Human Rights. Theright of choice of insurers is not applicable for the socialsecurity system because it raises costs and loses thebenefits of economy of scale. Arguments that PTJamsostek should not monopolize the social securitysystem are also not appropriate because in the absenceof profit there is no need for competition and Anti-Trust laws should not apply to the government or forsocial programs. The anti-trust law is applicable forbusinesses based on voluntary contractual relationships.
Effectiveness
The current JPK Jamsostek scheme uses managedcare techniques as the means of controlling utilizationand costs through the ‘gatekeeper’ system, referralrequirements, and limiting availability of drugs to
7 9 Paper presented at the First National Conference on Health Insurance, Jakarta, November 9-11, 1998.8 0 Equity.

Part III Chapter 16
212
essential drug lists. These kinds of procedures certainlykeep costs of health services relatively low. However,the number of members in JPK Jamsostek has beentoo small to have significant leverage at the regionalor national level. On the other hand, private healthinsurance companies offering traditional indemnity orreimbursement systems may stimulate inefficiencies.When health care providers are reimbursed on a fee-for-service basis, the incentive to prescribe moremedical procedures and unnecessary drugs becomesgreater. The provision of unnecessary medicaltechnologies and procedures is growing because ofthis payment system. Often sophisticated medicaltechnologies require more diagnostic techniqueswithout offering more effective treatment — with verysmall marginal benefits to the patient.81 The morepeople covered by this commercial insurance system,the more likely overall health care costs will increase.In the end, all members must bear the costs. Becausein the near future it is unlikely that all people will becovered by health insurance, the uninsured will sufferthe most due to the domino effects of ineffective andinefficient systems. Costs to non-insured will beaffected if providers charge the same rates for insuredand non-insured individuals.
The biggest obstacle to the development andimplementation of standard procedures for medicalcare is lack of financial incentive to providers to followthe standards. Fragmented and small groups workingand negotiating independently certainly do not haveleverage to implement standard procedures. Therefore,liberalization of JPK Jamsostek by allowing membersto choose and change insurer over time will createfurther disincentives for effective health care. If JPKJamsostek and Askes were combined into one largepool, then there would be market power to push medicalproviders to follow higher standards. To be effective,however, the level of payment to providers must bereasonable. Moreover, contributions the pool mustcover the real cost of providing both medical andadministrative services. It follows that there must bevigorous enforcement to ensure that the level of wagesdeclared by employers cannot be artificially low in orderto reduce contributions. Such practices will adverselyaffect the financial viability of the scheme.
However, despite the case for a merger of institutions,such decisions can only be taken when the overalldesign of the future social security scheme has beenagreed. It is the design of the system that shoulddetermine the institutional structure and not the otherway around.
Financial Performance
Before the current JPK Jamsostek was conditionallymandated, between 1985 and 1991, there was a pilotproject on health insurance for private employees.Since then, PT Jamsostek (originally PT Astek) hasbeen consistently managing health insurance usingmanaged care techniques to control costs. Themembership of JPK, however, is not fully mandatoryresulting in a very low enrolment rates during the last10 years compared with the enrolment of the otherthree programs. Since 1991, the growth of firms joiningJamsostek has steadily increased at the rate on averageat 38% annually. The number of insured employeesand their dependants has also increased on average24% annually (see Table 3).
The premium increase in the last ten years has beenslightly faster (51%) than the increase of the numberof insured (38%). The premium for JPK in 1991 wasRp. 4.5 billion for 199,000 insured giving the averageof Rp.22,800 per capita per year; while total premiumfor the year 2000 was Rp.155 billion for almost 2.7million members (insured) resulting in Rp.57,542 percapita per year. However, compared with the priceindex, the growth of premiums has not matched theincrease in health care costs. The price index in 1993was 100, adjusting the index for the year 2000 to 311,thus in order to maintain sufficient financing for healthbenefits, the premiums should have increased fromRp.4.4 billion in 1991 to Rp.213 billion in the year 2000.This calculation results in shortfall of Rp.58 billionneeded to maintain quality of services at the1993 level;assuming that the distribution of health risk in 2000remains the same as in 1993. This analysis suggeststhat the quality of services provided by JPK Jamsostekhas not been improving.
In practice, PT Jamsostek has not been losing moneybecause until recently it was unable to separateadministrative costs for running JPK Jamsostek fromother programs. In addition, the management of JPKJamsostek is pushing for more control over utilizationto ensure that the revenue of JPK Jamsostek isadequate to purchase the required health benefits.
Utilization of Health Services
It could be argued that the imbalance in growth of percapita premiums in the last ten years may be offsetby lower utilization of health services. Data from JPKDivision show that utilization rates of outpatient andinpatient services have been relatively stable. The table
8 1 HIAA. Fundamental of Health Insurance, part A. HIAA, Washington, D.C., 1997.

Part III Chapter 16
213
below shows the stability of outpatient and admissionrates per 1,000 members from 1992-2000. The use ofmanaged care techniques such as gatekeeper andreferral systems to control utilization and costs showssignificant success. One could then question whetherthe quality of services could have been maintained atthe 1993 level (when JPK was introduced) if the realper capita contribution decreased over time. Theadmission rates have been quite low (average 2.2admissions per 1000 members) compared to theadmission rates of insured civil servants and privatelyinsured individuals that are about 6 - 6.5 per thousandmembers.
Unfortunately no quality data are available at this time.JPK Jamsostek has been working with the IndonesianCollege of Family Physicians to improve the quality ofservices provided by primary care physicians servingJamsostek members. However, the relatively smallnumber of members does not provide adequateleverage to assure that the quality of services formembers of JPK Jamsostek was acceptable by higherincome employees. The relatively low wage index (theaverage per employee contribution compared withminimum wages) indicates that higher incomeemployees are not joining JPK Jamsostek.
Figure 88 Table of Utilization Rates per 1,000Members of JPK Jamsostek 1992-2000
Year Outpatient Outpatient Admissionvisit rate referral rate rate
(per 1000) (000) (000)1992 163.8 6.8 2.11993 156.1 5.8 2.11994 117.5 7.2 1.81995 146.1 7.4 3.51996 142.9 11.8 2.71997 146.9 9.57 2.11998 133.3 7.3 2.41999 125.0 20.4? 0.7?2000 147.5 8.9 2.2
Average 142.1 9.5 2.292-2000
Summary of JPK Jamsostek Problems
The following paragraphs summarize the currentproblems of JPK Jamsostek.
The contribution ceiling of Rp.1 million discouragesemployers paying higher salaries than Rp.1 million permonth from enrolling in PT Jamsostek. Employers
paying a lower salary enrol their employees but oftenreport lower levels of salary than they actually payresulting in only lower-paid employees enrolling inJamsostek. Consequently, Jamsostek cannot afford topay higher capitation or per diem rates to providers.These low reimbursement levels produce low qualityof services that in the end will discourage employersfrom joining Jamsostek.
Only employers are liable to pay premiums whileemployees have no obligation to pay premiums. Theabsence of a counterpart contribution (fromemployees) limits the sense of ownership of thescheme so essential to effective social security.
The scope of benefits is much lower than benefitsprovided for civil servants who have lower premiumrates. The lower economic status of employeesenrolled in Jamsostek may result in their having severefinancial problems in meeting their families’ medicalneeds. For example, no coverage is provided for anemployee having a child with a congenital disease andthe employee cannot afford to pay medical bills fromhis/her low salary. A civil servant with a child having asimilar medical condition is covered by PT Askes.
The Jamsostek law does not provide health carecoverage to retirees (when employees’ medical needsare likely to be increasing while their income isdecreasing). The Jamsostek scheme creates a doublefinancial burden that is not in line with the concept ofsocial security and is in contrast with the protectionpreviously provided (when they were activeemployees). Their civil servant counterparts, on theother hand, continue to receive health coverage untilthey die. Even the survivors of civil service retireescontinue to receive health insurance benefits.
Although PT Jamsostek is a state owned company, itseeks profit instead of maximizing services.Transformation into a Trust Fund is under activeconsideration but has yet to be achieved despite theinputs from the ILO project.
The optional nature of the program places PTJamsostek in a difficult situation to enforcemembership. The income from low participation in JPKis relatively small. The claim ratios of this social healthinsurance programme are much higher than the otherthree programs. It is, therefore unable to compete withthe other programmes on the basis of profit.

Part III Chapter 16
214
8 2 Irawan, PB; Ahmed, I; and Islam, I. Labour Market Dynamics in Indonesia. ILO Jakartta, 2000
Staff of PT Jamsostek generally has less experienceand training to equip them to undertake the system ofmanaged social health insurance compared tomanagers and employees of PT Askes. PT Askesspecializes in health insurance using managed caretechniques supported by an adequate number ofmanagers who have educational and relevant technicalbackgrounds in health insurance.
The nature of employment in the private sector is verydifferent from employment in the public sector (civilservants). The turn over rate and change of employersis higher in the private sector; as a result membershipmanagement in JPK Jamsostek is very dynamic andmore complex. Portability of coverage in JPKJamsostek is currently not guaranteed. This becomesvery hard for employees and their dependents whenthey are temporarily out of work and may notimmediately qualify for benefit on re-employment.
Setting premiums proportional to salary has manyadvantages for inter-income level subsidies; howeverthe low ceiling (Rp.1 million) and low level ofcompliance create serious problems to the viability ofthe scheme. The growth of premium levels is lowerthan the growth of health services costs and PTJamsostek will not keep up with increasing costs forlong period of time. This imbalance of premiums andcosts pose very significant threats to JPK Jamsostek.
JPK Jamsostek does not cover maternity care for thedelivery of the fourth or subsequent child, regardlessof the medical condition. For those who have pathologicdeliveries, the costs of treatment may be prohibitive tomost workers. Certainly this limitation is not consistentwith the right for health care security of workers.
Lack of continuity of coverage for those who areundergoing treatment for chronic or serious diseasesand have to leave employment, those who aretemporarily out of work and those retiring is a weaknessin the system. The absence of unemployment benefitand retirement pensions creates an added problem thatneeds to be addressed urgently. The penalty for a company (Rp.50 million, set in 1993)for non-compliance now seems very low and representsno real deterrence to violating the Jamsostek law.
Possible Design of Health Insurance forIndonesia
Indonesia is a very large country with 210 million peoplescattered over about 7,000 islands. The labour force isestimated to be about 98 million people comprised of36.2% in wage and salaried employment, 51.9% self-employed, 3.4% employers, and 8.5% familyworkers.82 The self-employed people are farmers,individual retailers, and self-employed professionals.With only one-third of labour force in formal sectoremployment it is not easy to mobilize financial resourcesto finance health care for the entire population. Inaddition, income per capita of Indonesians is relativelylow (US$ 692 at official exchange rates) resulting invery low disposable income for health insurancecontributions. The Indonesian per capita incomeadjusted for purchasing power parity, is estimated atabout US$ 2,600 — far below Thailand and Malaysia.The low per capita income significantly affectshousehold expenditure in Indonesia. The NationalSocio-Economic Surveys indicated that between 50-70% of household expenditure between 1995 and 2000was on food. The minimum wage (in Jakarta at thetime of the ILO study) was Rp. 426,000 or about US$47.34 per month leaving the worker little residual moneyafter buying food.
A social security system relies on contributions fromemployees and employers (or an individual contributionfrom self-employed persons). It is clear that socialsecurity systems must start from formal sectorswithout diluting the risk pool by allowing opt-outprovisions. This allows all workers to share the risk ofill health — that tends to be higher among low-incomeworkers. Outside the formal sector, there are problemsin determining and collecting social securitycontributions from those who work temporarily, areself-employed, or seasonal workers. These peoplework without employment contracts and are paid dailyor weekly by ‘employers’. The problems of extensionof coverage to these (and other excluded groups) arediscussed in a separate Report and in Part III of thisPublication).
People with low income may be entitled to free orvery low cost medical care provided by the governmentin public health centres or public hospitals on production

Part III Chapter 16
215
of a health card. Although the quality of services inpublic health centres or third-class public hospitals isnot high, quality may be of less concern to low-incomegroups.
For those with low incomes but receiving more than abasic level of income there might still be capacity forthem to pay an earnings-related contribution. Evenpensioners might be required to contribute in a futurehealth care system.
The implementation of this system may be decentralizedto respond to local demands and Expansion ofmembership into non-salaried workers can be done inlater stages.
The proposed new health care programme must takeinto account the general framework or the design of anew social security system. Figure-89 depicts how thenational social health insurance system might work inthe future.
The main features of the design are as follows:
• Formal or salaried workers can be classified into lowto high income levels. For all salaried workers, andpensioners in the private sector regardless of theirincome level, it will be mandatory to join the socialsecurity system. The premium of 3% (which willneed further actuarial study and calculation) can bededucted from employees’ salaries and additional 3%would be payable by the employers. There shouldbe no different levels of contribution for singles andmarried employees to simplify administration and tostrengthen the social solidarity principle. Within thenext ten years the compulsory scheme needs to beextended to all employers, regardless of the legalstatus or number of employees. The contributionswill be collected by the social security organizationthat administers long-term and cash benefit programsalong with contribution for other programs. The socialsecurity organization then will transfer a sumequivalent to the total health component contributionsto the compulsory health insurance scheme.
• Those who are not satisfied with the compulsoryscheme may purchase supplementary healthinsurance from private insurance companies. Butthey should not be allowed to opt out of thecompulsory health insurance scheme. These peoplemay have better services covered by their private
health insurance schemes or pay out the differencethemselves. Their entitlement to benefits from thecompulsory scheme can be coordinated with a privatehealth insurance scheme.
• Self-employed professionals such as physicians,lawyers, brokers, agents, etc. should also be in thecompulsory scheme. The contributions may be basedon the mean reported taxable income in a region andpaid directly by the professionals on a monthly basisalong with the payment of income tax. A deadlinefor inclusion of this group can be considered as aseparate phase of implementation. The levels ofcontributions need further actuarial calculation.
• In Figure 88, the income curve of salaried and self-employed professionals (solid line) moves to the right(there will be more people belonging to this group)as time goes by and the economy of the country isimproves. This means that the membership of thecompulsory scheme automatically expands as formalemployment increases.
• On the other hand, the income curve for non-salariedworkers (dotted line) will not move because this linealso represents total population, reducing the numberof people in this group.
• The low-income group (the poor and marginally poor)in the non-salaried workers (under the solid horizontalline at the right) might be provided with financialassistance from the government and or othercharitable organizations. The financial assistancefrom the government would need to be subject to ameans test. The money for this assistance could beallocated from oil subsidies. This group can be dividedinto two sub groups:
! The very poor could receive financial assistancefor outpatient and inpatient care from publicproviders. These people could be coveredimmediately as a continuation of the existing socialsafety net programs that will terminate in 2002;and
! The low income group who are not classified as‘poor’ by the means test (i.e. the marginally poor)who still cannot afford to pay expensive medicalcare should be provided with financial assistancefor inpatient care and surgical procedures. Thisgroup should be able to afford to pay for out-patient

Part III Chapter 16
216
Figure 89 Possible Design of Social Health Insurance Scheme in Indonesia
care, at least by public providers. This group couldbe covered next and should be covered completelyby 2012.
• Those who are not in the low-income group of non-salaried workers may pay health care out-of-pocketto public or private providers depending on theirincome or they may voluntarily join the compulsoryscheme or purchase individual health insurance fromprivate health insurance companies. Once this group
enters formal sector employment they should beobliged automatically to join the compulsory scheme.
• If the national tax system improves significantlyallowing income of the later group to be identifiedand either monthly or annual contributions to beregularly collected , then they will be required to jointhe compulsory scheme. They may still purchasesupplementary health insurance from the market ifthey perceive that the quality of services providedby the compulsory scheme is not meeting theirdemands.
The above design could be implemented in stages sincethe current system covers only relatively few eligibleworkers for several reasons discussed in the previoussections.
The revised compulsory health insurance schemeshould focus (firstly) on those who are not currentlycovered either by Jamsostek, private health insurance,or health benefits provided by enterprises. Gradually,over the next five to ten years those who are not inthe system but who are currently covered undervarious schemes will be included in the system. Thiswill enable private schemes to make the adjustments
required to shift the emphasis to supplementaryinsurance coverage. This expansion will beaccomplished by consistent, quality health cover at lesscost to employers and employees. It is expected thatthose who are currently under various private healthinsurance systems will voluntarily join the compulsoryscheme when they realize that they are able to getadequate benefits for lower contributions. The stagescould be implemented according to the followingagenda (Table 5), although this will need to be flexibleto take account of progress and experience:

Part III Chapter 16
217
8 3 Gani, A. et.al.. Laporan Mobilisasi Sumber Dana Proyek Kesehatan IV. FKMUI-LDUI, Depok 1998.
Figure 90 Agenda for Universal Coverage in the Proposed Compulsory Health Insurance Scheme (in Indonesia)
Year Stage People covered Scheme2003-2010 I Formal (waged) employers of >= 10 employees, Social health insurance
self employed professional, and pensioners in theprivate sector are mandated to enrol in thecompulsory health insurance schemes
2003-2012 II Small employers (< 10 employees) and self- Semi social health insuranceemployed can unroll the compulsory schemevoluntarily.
2003-2012 Ia The poor and the marginal poor of informal Social assistanceFree health care by(non-waged) are covered gradually starting from public providers or from charitablethe very poor one. Self-employed in upper income organizations or from private healthlevels may join the compulsory scheme voluntarily insuranceor purchase private health insurance
2007-2013 III Small employers (< 10 employees) and self Social health insuranceemployed in low income are mandated to enrol inthe compulsory system
2012-2020 IV All groups must be covered by the compulsory Social health insurance and socialhealth insurance scheme assistance for the very poor
• NB. The dates are for illustration only.
Health Benefits to be Covered and theRelated Contributions
The compulsory health insurance scheme cannot beseparated from the existing health care delivery system.In general, health care delivery can be divided intotwo groups: public and private providers. Public healthcare delivery is considered to provide poor healthservices in terms of amenities and the physicalappearance of the facilities. The public providers areheavily subsidized, ranging from 70 - 80% of the totalinvestment and operation costs.83 The provision ofhealth services by public providers aims at keepingessential health services affordable for all people. Inpractice, most high-income people do not use healthservices from public providers except those servicesoffered in the private wings offered by some publicproviders. Public hospitals may offer private outpatientservices in the afternoon and offer first class or VIPclass inpatient services for those who demand betterservices in separate rooms of the hospitals.
On the other hand, private health care providers mustprovide a (real or perceived) better quality of servicesto be able to attract significant number of users. Undercurrent Regulations, private hospitals are required to
provide 25% of beds for the poor to supplementinadequate public facilities. Although in practice, manyprivate hospitals do not comply with this regulation. Inexchange, private hospitals may receive assistancefrom the government in the form of buildingconstruction, medical equipment, or cash money. Butin general, the services for the poor are still relativelymore costly than the cost of services in third classpublic hospitals. Because of the asymmetricinformation of health services, people tend to judgethat the more expensive the health service the betterthe quality. Therefore, higher income groups whodemand better quality of services tend to use privateproviders or private wings of public hospitals whenthey have the option to do so.
One of the important elements of a compulsory healthinsurance scheme for it to be sustainable and attractiveto all groups is the acceptability and meaningfulnessof the benefits. Since optimal cross subsidy — fromthe rich to the poor — can be made possible by thecompulsory health insurance scheme, the benefits ofthe compulsory health insurance scheme must beacceptable by those in upper income bracket. The lowerincome brackets would normally be happy to receivebetter quality of services than they normally get from

Part III Chapter 16
218
the public providers. Therefore, the benefits of thecompulsory health insurance scheme must be offeredfrom private providers or private services in thefacilities of public providers. To be efficient and in orderto prevent moral hazards, the benefits must be providedin kind, not in cash. The compulsory scheme shouldnot provide benefits from public health centres or thirdclass public hospitals, except in the areas where aprivate provider is not available. Inpatient care mustbe provided at least at second-class public hospitals orthe equivalent level from private providers.
The actuarial calculation of contributions to sustainnecessary revenue must be based on the costs ofproviding the above levels of care. It is better to setcontributions at the same level for singles and marriedworkers for simplicity of administration and foroptimum cross subsidy. Employers will not thendiscriminate in the selection of their employees basedon marital status. Updating members’ data for thecollection of contributions and in providing services dueto change in marital status will become unnecessary,saving time and cost of administration. Employers andemployees ought to share contributions on a 50:50 basisfor the system to be more equitable. The contributionsmust also take into account the financial requirementsto provide services for pensioners. The actuarialcalculation should be conducted at an early date andthe level of contributions must be adjusted periodicallyto reflect increasing costs of health care.
The level of contributions should be a matter forsecondary Regulation (not primary legislation) andmade on the recommendation of the Board of Trusteesaccording to actuarial advice. The possibility of regionalvariations may be considered.
Options for Non-Salaried Workers
Non-salaried workers currently represent the majorityof the labour force in Indonesia. Together with theirdependents, they represent more than half of thepopulation. Their income varies from very low (belowminimum wage) to very high that is equivalent to thatof top executive levels. Seasonal workers, such ascarpenters, part time drivers, and the unemployed maybe completely without disposable income to pay forhealth services or even to buy clothes or pay to educatetheir children. Street vendors who sell cigarettes, lightfoods, newspapers, etc. may have income equivalentor below minimum wages and they may be consideredpoor or nearly poor people. Some merchants who maybe helped by family members such as small restaurant
owners, used-car sellers, or self-employedprofessionals may have income of Rp.10 million ormore per month, above the average salaries of middlemanagers in national companies. The latter types ofnon-salaried workers have the ability to pay sizeablecontributions, but because they are unorganized,collecting contributions from them is difficult. Thefollowing options (not mutually exclusive) arepossible:—
Public Assistance Programs
The non-salaried poor or the unemployed poor havealmost nothing to contribute to the scheme. However,they may suffer from an illness or an accident withoutwarning — the same as people in other groups. Thesepoor people should be entitled to free health care fromthe government or from a charitable organization. Thegovernment (not a charitable organization) must be thelast resort for them. Therefore, public health centresand public hospitals must continue to provide healthservices with very low user charges by providingsubsidized facilities. This type of subsidy often doesnot reach the right target as is seen currently in servicedelivery in public hospitals. But this method of subsidyis the easiest to organize. Central and localgovernments must share in the provision of suchsubsidies. Third class care in public hospitals must beprovided uniquely for such poor people, while second-class hospital inpatient care should be provided formembers of the compulsory health insurance schemes.
One of difficulties of reaching the poor is that theyoften do not seek medical care in a public hospitalfearing unavoidably high cost of medical services.Therefore, other alternative options must be developed.As a temporary solution, before the poor can becovered by the compulsory health insurance scheme,central and local government might share costs,channelled through a third party organization, to coverhealth care for the poor. This could be done in adecentralized system in which a district or provincialgovernment contracts with a third party in the areasuch as a bapel, to identify the poor and provide themwith Health Cards. By holding a Health Card the poorwould be entitled to free health care at public healthcentres and or public hospitals, depending on the typeof eligibility. The government needs to develop a meanstest to determine the eligibility criteria for those whowill receive Health Cards in order to minimize the abuseof scarce resources. There might be two differentcards. The very poor could receive a card givingentitlement to free health services at both public health

Part III Chapter 16
219
centres and public hospitals. The marginally poor couldreceive another type of card entitling them to inpatientcare, including medicines, in public hospitals with a smallco-payment for each hospital admission.
The services provided for these beneficiaries shouldnot be limited to low cost health services. However,the government may limit the use of medicines toessential drugs and or generic drugs only. In addition,the services may be limited to third class inpatientservices in public hospitals and in private hospitals thatare willing to join the programs at predetermined fees.The local government would set fees to health centresor hospitals that would be reimbursed by the contractedthird party. Public hospitals must accept the feeswithout charging the cardholders additional costs whileprivate hospitals may voluntarily join the program forthe same fees.
The cost of this public assistance program could betaken from transferring money for gasoline subsidiesto health and education subsidies, by graduallyincreasing gasoline prices. In the year 2000 thegovernment spent Rp.55 trillions to subsidize gasoline,more than ten times the government expenditure onhealth nationwide,. More of the gasoline subsidies,were consumed by those better off with cars and othermotorized vehicles than by the poor. In the year 2002,the government plans to spend Rp. 53 trillions for thesame subsidy, while the estimated cost of providingfree health care for all is about Rp. 30 trillions. Thecost of public assistance to health care for the poor isestimated at about Rp. 4 - 6 trillion a year.
By 2004, the government should consider totallytransferring all gasoline subsidies to subsidies for healthcare and education. By that time, the coverage for thepoor and near poor people may be expanded as thecapacity of local governments and third parties tomanage such scheme will improve. From early 2002until late 2003, the compulsory health insurance schemeand central and local governments can prepare humanresources, administrative, and logistical standardprocedures to implement this public assistanceprograms. Advocating and convincing policy-makersto establish such public assistance programs must bedone intensively during this period and they must beconvinced that such public assistance programs willreduce potential social unrest and will reduce socialand economic uncertainties that hinder the economicdevelopment of the country.
Charity Care
There are always people willing to provide charity carefor the poor or near poor for their religious practice orfor their personal satisfaction. Currently thousands ofreligious and social organizations are providing somekind of charity care at various levels. It must beremembered that there is no guarantee that this charitycare will be sustainable and adequate to cover thehealth needs of the poor and near poor. The numberof poor people may reach more than 50 milliondepending on the level of income used in the meanstest. Although there is no guarantee for sustainability,we should continue to encourage these grass rootsmovements to fill gaps in the public assistanceprogrammes.
Religious hospitals and public hospitals are currentlyproviding this kind of care, even though their capacityis limited. Data published by the MOH shows thatbetween one and three percent of the total number ofpatients hospitalized was exempted from user fees.84
Of course private hospitals may provide charity careup to the level that the care does not harm the cashflow of the hospitals. Organizations such as RotaryClub, Muhammadiyah, Catholic societies etc., oftensponsor free health services for the poor and freesurgical services for certain illnesses. Special clubssuch as Heart Club and Diabetic Club also providesome help for those who suffer from these diseasesbut cannot afford to pay for the necessary medicalcare. Before all people are covered and the healthneeds of the poor adequately catered for, charity carewill be an essential for those who need medical carebut are unable to pay.
Micro Financing SchemesMicro financing schemes have been implemented sincethe 1970’s all over the country. Normally the schemesare very small (covering tens to hundreds ofhouseholds) and do not have adequate leverage toreduce financial burden of the households enrolled inthe schemes. The schemes generally cover one orseveral villages and are organized by volunteers. Oftenthe schemes worked well during a particular leadershipof Camat (head of a Sub District) or Bupati (mayor)but when the leader left, the schemes also halted.Benefits provided are normally out patient care inpublic health centres or small financial assistance forinpatient care such as Rp.50,000 per admission.Contributions are determined by consensus (usually
8 4 MOH. Health Profile, Jakarta, Pusdakes Depkes, 2000

Part III Chapter 16
220
very small amounts of money), not by actuarialcalculation. Therefore, no micro financing scheme hasbeen able to grow into a large scale financing schemethat is sustainable, efficient, and beneficial to themembers.
However, before the compulsory health insurancescheme covers the whole population, well-managedmicro financing schemes should be encouraged to servethe community. These kinds of schemes are providingsome lessons in risk sharing among the members.Religious organizations and local governments oftenhelp or sponsor communities to establish such micro-financing schemes. Their sponsorship should not, inany way, be discouraged. But all stakeholders must beinformed that in the future they will join a much largerhealth insurance scheme that is much better moreefficient. They must prepare to join the compulsoryhealth insurance schemes when there is the mechanismto collect sufficient contributions in an efficient andsustainable way. Any effort to transform those micro-financing schemes into a large size and sustainablescheme before the compulsory health insurancescheme performs satisfactorily will meet resistancefrom members. In the meantime the compulsory healthinsurance scheme must focus on the formal sector untilnon-salaried workers see that it is beneficial for them.
As discussed in the Health Care Financing section,there is no evidence that micro financing schemes cangrow significantly. Investing time and money into thedevelopment of micro financing schemes to becomelarger schemes is too expensive. Experience in theUS in the early 20th century also shows that similarschemes were unable to grow because of lack ofcapital and data on which to base premiumcalculations.85 It is much more efficient and effectiveto concentrate efforts into developing large reliablecompulsory health insurance schemes.
Cooperative or Trade AssociationsIn addition to micro financing schemes, cooperativesand trade associations often organize health funds fortheir members. The scope and effectiveness of thesefunds has not been systematically evaluated. In theorythese funds may help members to cover some healthcare costs for their family members. Members of thesegroups could potentially join the compulsory healthinsurance scheme sooner than members of microfinancing schemes. Many farmers, fishermen, and
small industries receive their income from cooperativesor trade associations through which they sell theirproducts. Contributions can be deducted frompayments made periodically by the cooperatives tomembers. The number of people belonging to thisgroup could be as many as 50 million. However, thereare many cases where members of cooperatives ortrade associations are also members of salariedworkers’ unions. Many civil servants establishcooperatives in their offices to raise money tosupplement their income. Many civil servants andprivate employees may have spouses working asfarmers, entrepreneurs or have small businesses andestablish cooperatives or trade associations. Therefore,establishing several schemes based on the source ofhousehold income groups may end up with duplicationof membership and produce more administrativeproblems. This complication is especially more complexwhen the contribution levels and the benefits aredifferent from one scheme to another. It would behelpful to study the informal sector schemes and todevelop guidelines for the establishment of microschemes.
For simplicity and equity, a compulsory health insurancescheme at least for one region, is much more efficientand simple to administer. Members of cooperatives ortrade associations, whose household members are notemployees, may join the compulsory scheme voluntarily.As with micro financing schemes, members of thesegroups must be informed that ultimately they will jointhe compulsory health insurance scheme. Membersof cooperatives that deal with selling products or cropson a routine basis may be encouraged to join thecompulsory scheme as soon as the scheme is inoperation. An actuarial study needs to be conductedto calculate levels of contributions and the method ofcollection from these groups. The health benefits mustbe provided at the same level and scope as for salariedworkers.
The problems of extension of coverage are furtherdiscussed in Part III of this Publication and the ILOreport on Extension of Coverage to Excluded Groups.
Purchase Private Health InsuranceAnother option for individual non-salaried workers isto purchase health insurance from private healthinsurance companies. Currently more than 60 privateinsurance companies offer health insurance, mostly for
8 5 HIAA. Group Life and Health Insurance, part A. HIAA Education Program, Washington DC, 1994

Part III Chapter 16
221
hospital and surgical coverage on indemnity orreimbursement basis.86 Looking at the high premiumrates offered by private insurance companies, thesetypes of cover may only be available to those in highincome groups. Salaried workers may purchase privatehealth insurance as a supplement for their compulsoryhealth insurance coverage. Non-salaried workers, whodo not join the compulsory health insurance scheme,may rely on private health insurance as the only coveravailable to them. When the government tax collectionsystem is reliable non-salaried workers will be requiredto join the compulsory scheme in their region.However, it should be noted that private medicalinsurance is not available from national carriers forpeople over the age of 65 years, although internationalmedical insurance is available at very high cost.
In the long term, there will be very few people whowill rely only on private health insurance. Those in thetop five percent of the population may depend moreon private health insurance coverage than on thecompulsory health insurance scheme. However, forthe optimum social solidarity it is better that those whoare very rich should also contribute to the compulsoryhealth insurance scheme — whether or not they chooseto use their entitlements to the benefits provided bythe scheme or prefer to rely solely on a private healthinsurance scheme.
Recommendation for the Revision ofJpk Jamsostek
General Recommendation for the Revision ofJamsostek Law
After careful examinations of the existing JPKJamsostek and its performance within PT Jamsostek,several changes are recommended:
1. Repeal the opt-out clause from Regulation No. 14of 1993 to assure a larger pool and to reduceadverse selection. Employers/employees who wishto receive better quality benefits may purchasevoluntary, supplementary health insurance fromthe private sector. Coordination of benefit shouldbe undertaken by both administrator and the privateinsurer so that the beneficiaries should not deal withtwo separate entities and encounter administrativeconstraints when receiving benefits from twosources (the social security scheme and the private
insurers). For example, the compulsory scheme paysthe hospital bill for inpatient care in a second-classroom costing Rp.2 million. An employee whopurchased supplemental health insurance ishospitalized in first class room in a private hospitalwhich costs Rp.3 million. Then the supplementaryhealth insurance scheme pays the hospital only thedifference (Rp.1 million). The phasing out of theopt-out clause should be done gradually by allowingexisting private options to continue for five years.Employers should be able to enter into thecompulsory scheme anytime they want to.However, employers that are not in contract withany private scheme at present must join thecompulsory scheme. Thus the revised Jamsosteklaw should allow entry (opt-in) but not exit (opt-out). This gradual transition should permit thecompulsory scheme to improve services to the levelthat is acceptable by current employers/employeesand for the private market to continue to grow.Removal of the opt-out provision will allow a largepool to develop (as many as 100 million peoplenationwide within the next five years) and theaccumulation of at least Rp.15 trillions (2001 value)per year for health care. This amount of moneywould provide purchasing power for the compulsoryhealth insurance scheme to negotiate prices andquality of health services with health care providers.Thus the compulsory scheme could push the healthcare delivery system into a more efficient and moreeffective system than the current financing anddelivery system.
2. For the next five years, the social security systemshould continue to expand with phased extensionof coverage to smaller employers (with less than10 employees). Consideration should also be givento covering pensioners. Self-employed in prescribedoccupations should be brought into the scheme inline with their membership of the proposedretirement pension scheme. Voluntary membershipshould be considered for others. But the capacityof Jamsostek to manage a larger membership needsto progress ahead of the expansion of themembership base otherwise extending compulsorymembership to all employers within the next fiveyears will not be feasible due to the low capacity ofthe current system. Initially, emphasis could befocused on all employers of 10 or more employeeswith aggressive enforcement procedures to ensurethat the law is complied with. The expansion of
8 6 Thabrany. Asuransi Kesehatan Indonesia. Pusat Ekonomi Kesehatan FKMUI, Depok 2001

Part III Chapter 16
222
compulsory insurance to non-salaried workers maybe introduced based on a proper study of the sector,perhaps in five to ten years’ time, when theperformance and the capacity of the enhancedcompulsory health insurance scheme is widelyaccepted.
3. Coverage for dependants should be expandedwithout limit on the number of children. But theplan should provide incentive to employees to takeadvantage of family planning services or requirecost sharing for the third child and beyond.
4. The revised social security system should coverhealth benefits for retired employees and theirdependents on a contribution basis. Premiums forretired employees should be collected from wagesduring employment or contributions taken frompension payments. In case of those with no pensionpayments at the beginning of the compulsory system,a community rate may be applied. A specialactuarial study must be conducted for this retiredpopulation. Benefits provided may commence withhospital services that become a large financialburden and may create economic hardship to theretired people. Later when the financial conditionof the compulsory scheme permits, the expansionof benefits to out patient care can be introduced.
5. The premium level must be recalculated by actuarialstudy to meet the real cost of health services anddevelopment of the compulsory scheme. The levelof contributions is estimated at 6% of monthlysalaries shared fifty-fifty by employers andemployees. The higher contributions are justifiablebecause the scheme will provide for a larger scopeof health services and better quality of services.The contributions for singles and married should bethe same. Local or central governments shouldpay 50% contributions for civil servants at a ratethat will be calculated later, perhaps about 3% forboth singles and married employees — the samearrangements as for private employees. Civilservants and civil service pensioners and militarypersonnel might pay a counterpart contribution of3% of their salaries or pension.
6. The new scheme should utilize private health careproviders for out patient and mixed public/privateproviders for inpatient care. To maintain costs atan acceptable level, the new scheme must utilizesecond-class inpatient care and only use thegovernment subsidized third class inpatient care only
for the uninsured. By differentiating services,members would feel different from ordinary poorcitizens who use third class and subsidized care.Without this arrangement, there will be difficulty inattracting higher income employees to the schemeso that even if the law is enforced, the low level ofsatisfaction of the members could make the schemeunpopular.
Separation of Health Insurance Coverage fromOther Social Security Programs andEstablishing a New Trust Fund (JaminanKesehatan, Jamkes)
This scenario above is further examined as follows:
Because of the differences in managing health benefitsfrom social security cash benefits, consideration needsto be given in the longer term as to whether the healthinsurance component of the social security systemshould be managed separately. Such separation mustensure: that there are economies of scale, a sufficientlylarge risk pool, and maintenance of solidarity principles.
There are a number of options that would facilitatemore equitable and stronger bargaining powersbetween the social security scheme and health careproviders. One option is to combine the program forcivil servants (currently administered by PT Askes)with the private employee program (currently JPKJamsostek). This would create a combined pool ofmembers from both present schemes and facilitate theadministration of health benefits in a decentralizedsystem at regional level — at the level of one province,several provinces, or several districts. However, thesize of the pool should take account of the need tocover high cost medical care. Small pools would notbe sustainable. Actuarial studies to calculate the optimalmembership size and the contribution level must beperformed later. The new organization should be atripartite Trust Fund (not PT Persero) without profitmotive (on the lines envisaged for ‘Jamsostek Baru’).The possibility of separate Trust Funds for each regionmight be considered provided consistency across thecountry could be assured.
At regional level, a new Trust Fund might be establishedby combining branches of PT Askes and PTJamsostek in each region. Current assets and humanresources from both programmes must be transferredinto the new entities. The new Trust Funds might becalled ‘Jamkes (Jaminan Kesehatan) Jakarta’,‘Jamkes Jabar’ (for West Java), ‘Jamkes Sulsel’
Part III Chapter 16
223
(South Sulawesi), etc. Each regional Jamkes mightoperate independently from others or the NationalJamkes. At the national level, there should be a nationalpool managed by a Trust Fund responsible for coverageof catastrophic illnesses, local disasters or inter-regionreferrals. This national pool will be discussed thefollowing section.
Justification
Managing social health insurance and delivery ofservices at the same time, requires special skills andexpertise that are very different from managing cashbenefits in provident or pension funds. Managing suchfinancial and health service delivery requires extensiveinformation systems and processes to ensure that thereis sufficient funding to pay benefits as the prices ofhealth services, drugs, medical supplies, and otherrelated health services increase. Special regulationsthat are flexible and adaptable to regional differencesin provider availability, income level, health needs, andothers factors pertinent to delivery of health servicesare required.
Decentralization of management and risk poolingprovides flexibility to reflect differences in prices,service availability, and utilization of services bydifferent characteristics of members in various regions.One national pool can create inequality in utilizationbetween those who live in metropolitan areas and thosewho live in small towns in distant areas. Therefore, ifall employees (public and private) were in large pools,then decentralized management and risk-pools inregions (such as for every 10 million population) arefeasible. This decentralized management would bemore responsive to the local demands while maintainingadequate risk sharing (social solidarity) across incomegroups. There might be 10-15 regional Trust Funds forsocial health insurance scheme throughout the country.A national Trust Fund (Jaminan Kesehatan Nasional,Jamkesnas) would need to be established to take
responsibility for catastrophic illnesses funded by, forexample 10% of premium.The main goal of the implementation of social securityis redistribution of income/financial burden among themembers/population. Combining both civil servants andprivate employees into not for profit organizations(Trust Funds) would optimize the benefits to themembers and distribute financial burden for health careamong members in more equitable way, unifyingmedical benefit between the public and private sectors.Such a system would create stronger solidarity amongemployers and employees from different employmentfields and regions, improving Nation Building.
Disadvantages
There are, however, disadvantages to employees andemployers of this pooling of contributions from civilservants, private employees and non-salaried workers.The disadvantages include:
• The absence of choice of insurance carrier may leadto dissatisfaction of members. However, it shouldbe realized that choice of providers is more importantthan choice of insurance carriers. Insurance carriersare just payers with little effect on the treatmentoutcomes.
• Combining PT Askes and PT Jamsostek into a newTrust Fund could be affected by previousperformance and perception of low quality of servicesof the existing JPK Jamsostek and Askes.
• Current use of public health centres and publichospitals for Askes and Jamsostek members maygenerate distrust among those who are currentlyunder private health insurance schemes. Toovercome these problems, for the first five yearsthe new scheme must concentrate on those who arenot covered by any scheme. Gradually thecompulsory health insurance scheme must improvequality of services while proving that the schemecould provide quality services.

Part IV Chapter 17
224
PART IV OTHER STUDIES
CHAPTER 17 EXTENSION OF COVERAGE TO EXCLUDED GROUPS
Executive Summary
Introduction
The project Restructuring of Social Security inIndonesia is a continuation of the long ILO involvementin the social security reform process in Indonesia.Recent ILO project reports have recommended theneed to restructure the social security system in orderto extend the social security coverage to a largerpercentage of the population.
The International Labour Conference of 200287
confirmed the commitment to making decent work areality for all workers and employers and the GoverningBody of the International Labour Organisation invitedthe International Labour Conference to address theissue of the informal economy. The commitment todecent work is anchored in the Declaration ofPhiladelphia’s affirmation of the right of everyone toconditions of freedom and dignity, of economic securityand equal opportunity. The ILC sought to address themultitude of workers and enterprises who are oftennot recognized and protected under legal and regulatoryframeworks and who are characterized by a highdegree of vulnerability and poverty, and to redress thesedecent work deficits.
The promotion of decent work for all workers, womenand men, irrespective of where they work, requires abroad strategy: realizing fundamental principles andrights at work; creating greater and better employmentand income opportunities; extending socialprotection; and promoting social dialogue. Thesedimensions of decent work reinforce each other andcomprise an integrated poverty reduction strategy. Thechallenge of reducing decent work deficits is greatestwhere work is performed outside the scope orapplication of the legal and institutional frameworks.In the world today, a majority of people work in theinformal economy because most are unable to find otherjobs or start businesses in the formal economy.
The progressive extension of social security eligibilityis also one of the key elements in Indonesia’s nationalstrategy for poverty reduction which aims to enhancesocial security for the poorest by improving core socialsafety nets and accelerating development in remoteareas. The initial finding from the National Task Forcefor Social Security reform has supported this generalreform strategy.
This study into the progressive extension of socialsecurity eligibility to the wider population examined theoptions for extension of eligibility to the excluded formalsector workers, and examined the needs of workersin the informal economy and overseas migrant workers.The informal economy by its nature is difficult toquantify and the lack of a standard definition andcategorization of workers and their distribution hasresulted in a limited availability of statistical data relatingto workers in the informal economy.
The study also aimed to identify categories of workersin the informal economy, to define their status inIndonesia and their priority social security needs andconsidered the feasibility of providing them with basicsocial security eligibility.
Summary of Recommendations
Extension of Social Security to Remaining FormalSector Workers
To increase Jamsostek membership from the current32.5% of potential formal sector employees to at least80%, the following initiatives would be required:• Extend compulsory coverage to all formal sector
enterprises by repealing the sections of Regulation 3of 1993 that restricts coverage to enterprises with10 or more employees or a monthly payroll of morethan Rp.1,000,000;
• Review the definitions in the Act No. 2 of 1992 toreinforce the provisions for employer/employeerelationship as the basis for compulsory contributions;
87 Source - Resolution concerning decent work and the informal economy - The General Conference of the International Labour Organization,meeting in its 90th Session, 2002,

Part IV Chapter 17
225
• Improve benefits to members by changing the statusof Jamsostek from a Persero and removing itsliability for tax;
• Improve the image of Jamsostek by changing itsstatus to a trust fund managed by a tripartite boardthereby limiting the degree of direct governmentcontrol over investment of funds;
• Increase community awareness of social security,the features of Jamsostek Baru and the obligationsof all employers by a targeted marketing strategy;
• Increase contribution compliance by transferring theauthority for enforcement from Depnakertrans toJamsostek and the establishment, training andimplementation of a national compliance strategy;and
• Improve Jamsostek efficiency by implementing therecommendations about operations and IT shown inthe report Review of Operations and InformationTechnology in Jamsostek.
Feasibility of Extending Social Security toWorkers in the Informal Economy
There is a demonstrated strong demand for basic socialsecurity services but an almost non-existent supply.Almost half of the people said that they wouldcontribute to a suitable social security scheme and thelevel of these contributions may be able to provide forthe priority social security needs of informal economyworkers.
From the comparative international studies, local trialsand from the survey findings, the extension of socialsecurity to the informal sector in Indonesia is feasibleand the task for the social security agency is to satisfythe supply side of the equation with a viable schemethat is flexible, affordable and sustainable. This mayrequire reviewing the social budget in Indonesia witha view to better targeting of government funds toprovide the basis for a contributions subsidy to supporta voluntary social security scheme for workers in theinformal economy and the poor.
Principles for Extension of Coverage to theInformal Economy
Based on the International and Indonesian experiencesand from the results of the surveys undertaken as partof this study the following principles are recommendedfor the development of strategies for extension of socialsecurity to the informal sector.• Self-help groups supported by the social security
agency (Jamsostek) and by private companies shouldbe the core of the system;
• Groups should have external local facilitators linkedto the social security agency, selected NGO’s andsupported by local administrations and other localpartners; and
• The self-funded insurance programs provided bygovernment (Jamsostek) and private companiesshould be flexible. Subsidies from all levels ofgovernment should be provided to encourageparticipation by contributors.
Develop Models for Provision of Social Securityto Workers in the Informal Economy.
To develop a viable social security scheme, it will benecessary to establish model systems that providemeaningful benefits, affordable contributions and aresustainable. Implementation of such schemes is likelyto be progressive and will take into account the widevariety of occupations, organizations and geographicaldistribution of the workers. The following prerequisitesare recommended as a first step in the process ofdeveloping social security models for Indonesianinformal sector workers.• Identify the program partner agencies. preferably a
combination of government and private companies;• Identify the responsible executive agency of the
programme, (at least initially, consideration shouldbe given to Jamsostek assuming this role as theworkers’ social security provider);
• Select the fund and risk carrier(s) for the schemeand which agencies will be involved;
• Develop the programmes that will be availableincluding the benefits, services, contributions andmanagement fees. The programmes must haveflexible mix and match options with a range ofcontribution rates and benefits to satisfy the needsand capacity of different groups and include at leastinjury, health, death, retirement and other voluntarysavings schemes;
• Develop administrative and service delivery modelsfor the programmes concentrating on group schemesbut also providing options for self-employedcontributors. The models should include managementinformation requirements to allow close monitoringand ongoing risk assessment of the schemes;
• Conduct a small-scale test of the suitability of theprograms; and
• Define user requirements, analysis and design of anIT system with sufficient data that can be integratedinto the Jamsostek IT system. (A temporary systemto be developed in Jamsostek has been costed atabout US$ 1000 – 1500).
• Design and develop the implementation andmarketing strategy.

Part IV Chapter 17
226
Initiate the Proposals for a Funded Pilot Program
There are a number of complex issues involved inextending social security to informal sector workersand without government assistance, including someform of financial and administrative support, thesuccess of any scheme would be doubtful. The schemewould need to attract and continue to attract sufficientnumbers of voluntary contributors to be sustainable.Initial findings of this study have suggested that up to50% of informal sector workers may contribute to asuitable scheme. It is recommended that a large-scalearea based pilot scheme be conducted as the precursorto full-scale implementation of the scheme across thecountry.
The pilot programme would need to incorporate theelements of the previous recommendation and be ableto identify and develop the most suitable program andadministrative models for future implementation. Theoutcomes of the pilot would be to develop associationsof informal sector workers based on trust, meaningfulsocial security programmes and an administrationcapable of collecting contributions and payment ofbenefits that can be replicated across the country.
A successful large-scale pilot scheme, promoted aspart of the social security reforms and supported byinternational agencies, would improve the understandingof social security in local communities, highlight thecommunity needs and stimulate the extension of social
security coverage in Indonesia. A partially subsidisedscheme would demonstrate government commitmentto social security reform and greatly improve theenrolment rates, spread the risk and ensure a higherprobability of long-term success and sustainability.
Extension of Social Security to Overseas MigrantWorkers
It is evident from this and other studies that there is aneed and demand for improved social protection formigrant workers. In this context, the following issuesshould be addressed:• Improve the quality of insurance provided to workers
by introducing a broker such as Jamsostek to monitorthe scheme and also to be given the opportunity toprovide insurance for migrant workers in competitionwith the private agencies;
• Review the decision to exclude migrant workers fromthe Jamsostek scheme and to include migrant workersin that scheme or in a programme modified to reflecttheir needs; and
• Develop a partnership model with the key agents inthe process (APJATI, Depnakertrans and Jamsostek)to provide social security cover to migrant workersbased on the modified needs of the migrant workers.Incorporating the employment agencies as employerson the Jamsostek IT system could also provide muchof the management information that is not currentlyavailable to Depnakertrans.
Part IV Chapter 17
227
BAGIAN IV STUDI-STUDI LAIN
Bab 17 Perluasan Cakupan Kepeser-taan ke Kelompok-Kelompokyang Belum Diikutsertakan
Rangkuman Eksekutif
Pendahuluan
Proyek Restrukturisasi Jaminan Sosial di Indonesiamerupakan kelanjutan dari keterlibatan ILO sejak lamadalam proses reformasi (perombakan) jaminan sosialdi Indonesia. Laporan-laporan proyek ILO terbaru telahmerekomendasikan kebutuhan untuk merestrukturisasisistem jaminan sosial untuk memperluas cakupankepesertaan jaminan sosial ke persentase populasi yanglebih besar.
Konferensi Perburuhan Internasional tahun 200287
mengkonfirmasikan komitmen untuk menjadikanpekerjaan yang layak menjadi suatu realita bagi semuapekerja dan pengusaha dan Badan PengurusOrganisasi Perburuhan Internasional mengundangKonferensi Perburuhan Internasional untuk membahasmasalah perekonomian informal. Komitmen terhadappekerjaan yang layak terpateri dalam penegasanDeklarasi Philadelphia terhadap hak setiap orang ataskondisi-kondisi yang bebas dan bermartabat, kepastianekonomi dan kesetaraan kesempatan. KonferensiPerburuhan Internasional berupaya menangani masalahyang dihadapi oleh begitu banyak pekerja danperusahaan yang sering kali tidak mendapat pengakuanmaupun perlindungan dalam kerangka hukum danperaturan dan yang ditandai dengan tingginya tingkatkerentanan dan kemiskinan, serta berupaya untukmengatasi kurangnya pekerjaan yang layak ini.
Upaya mempromosikan pekerjaan yang layak untuksemua pekerja, baik pekerja laki-laki maupunperempuan, tanpa mempedulikan di mana merekabekerja, memerlukan suatu strategi yang luas:menyadari prinsip-prinsip dan hak-hak mendasar ditempat kerja; menciptakan peluang kerja dan peluangpendapatan yang lebih besar dan lebih baik;memperluas perlindungan sosial; dan mempromosikandialog sosial. Dimensi-dimensi dari pekerjaan yanglayak ini saling menunjang satu sama lain danmembentuk suatu strategi terpadu mengenai upayamengurangi kemiskinan. Tantangan untuk mengatasi
kekurangan akan adanya pekerjaan yang layakmerupakan sangat berarti apabila pekerjaan tersebutdilakukan di luar ruang lingkup atau penerapankerangka hukum dan kerangka kelembagaan. Di duniasaat ini, mayoritas penduduk mencari nafkah dalamperekonomian informal karena sebagian besar tidakberhasil mendapatkan pekerjaan lain atau memulaiusaha dalam perekonomian formal.
Perluasan secara bertahap dari kondisi yang memenuhisyarat untuk mendapatkan jaminan sosial jugamerupakan salah satu unsur penting dalam strateginasional Indonesia dalam hal pengurangan kemiskinanyang bertujuan untuk meningkatkan jaminan sosial bagimasyarakat termiskin dengan memperbaiki jaringpengaman sosial inti dan mempercepat pembangunandi daerah-daerah terpencil. Temuan awal dariKelompok Kerja Nasional untuk reformasi JaminanSosial mendukung strategi umum perombakan ini.
Studi mengenai perluasan secara bertahap darieligibilitas [kondisi memenuhi syarat untukmendapatkan] jaminan sosial ke populasi yang lebihluas dilakukan dengan menganalisa pilihan yang adauntuk memperluas eligibilitas ke pekerja sektor formalyang masih belum menjadi peserta Jamsostek, sertamenelaah kebutuhan pekerja dalam perekonomianinformal dan pekerja migran yang bekerja di luar negeri.Berdasarkan sifatnya, perekonomian informal sulitdiukur. Tidak adanya definisi dan pengelompokkanpekerja dan distribusi pekerja dalam perekonomian initelah mengakibatkan terbatasnya data statistik yangada mengenai pekerja dalam perekonomian informal.
Studi ini juga ditujukan untuk mengidentifikasi kategori-kategori pekerja dalam perekonomian informal,mendefinisikan status mereka di Indonesia sertaprioritas kebutuhan jaminan sosialnya danmempertimbangkan layak tidaknya memberi merekajaminan sosial dasar.
Rangkuman
Perluasan Jaminan Sosial ke Sisa Pekerja SektorFormal
Supaya keanggotaan Jamsostek, yang saat ini terdiridari 32.5% dari pekerja sektor formal yang berpotensimenjadi peserta, meningkat menjadi sekurang-kurangnya 80%, akan diperlukan prakarsa-prakarsaberikut:
8 7 Sumber – Resolusi mengenai pekerjaan yang layak dan perekonomian informal – Konferensi Umum Organisasi KetenagakerjaanInternasional, mengadakan pertemuan dalam Sidangnya yang ke 90, 2002.

Part IV Chapter 17
228
• Perluas cakupan kepesertaan ke seluruh perusahaansektor formal dengan mencabut pasal-pasal dalamPeraturan No. 3/ 1993 yang membatasi cakupankepesertaan ke perusahaan-perusahaan dengan 10atau lebih pekerja atau yang membayar upah lebihdari Rp1 juta;
• Kaji ulang definisi-definsi yang terdapat dalamUndang-Undang No. 2/ 1992 untuk mempertajamketentuan-ketentuan hubungan antara pengusaha danpekerja sebagai dasar dalam menentukan iuran wajib;
• Tingkatkan manfaat bagi anggota dengan mengubahstatus persero Jamsostek dan menghapus kewajibanJamsostek untuk membayar pajak;
• Tingkatkan citra Jamsostek dengan mengubahstatusnya menjadi suatu dana wali amanat yangdikelola oleh suatu dewan tripartit sehingga dengandemikian membatasi tingkat kendali langsungpemerintah atas investasi dana;
• Tingkatkan kesadaran masyarakat akan jaminansosial, ciri-ciri Jamsostek Baru dan kewajiban semuapengusaha melalui suatu strategi pemasaran yangditargetkan;
• Tingkatkan kepatuhan membayar iuran denganmengalihkan otoritas (wewenang) untuk melakukanpenegakan dari Depnakertrans ke Jamsostek dandengan pembentukan, pelatihan dan implementasi darisuatu strategi pematuhan nasional; dan
• Tingkatkan efisiensi Jamsostek denganmengimplementasikan rekomendasi-rekomendasimengenai operasi dan teknologi informasi yangditunjukkan dalam laporan Kajian Ulang terhadapOperasi dan Teknologi Informasi dalam Jamsostek(Review of Operations and InformationTechnology in Jamsostek).
Kelayakan untuk Memperluas Jaminan Sosial kePekerja-pekerja dibidang Ekonomi Informal
Meskipun jelas-jelas terdapat permintaan yang kuatakan pelayanan dasar jaminan sosial, penawaran untukitu hampir tidak ada. Hampir separuh orang yangditanya mengatakan bahwa mereka bersediamembayar iuran ke suatu skema jaminan sosial yangsesuai dan tingkat iuran tersebut dapat memungkinkandiprioritaskannya kebutuhan jaminan sosial parapekerja perekonomian informal.
Dari studi-studi banding di tingkat internasional,percobaan-percobaan yang dilakukan di tingkat lokaldan dari temuan-temuan hasil survei, perluasan jaminansosial ke sektor informal di Indonesia mungkin untukdilakukan dan tugas lembaga jaminan sosial adalahuntuk memuaskan sisi penawaran dari persamaan yangada (equation) dengan suatu skema layak yang bersifat
fleksibel, terjangkau dan berkesinambungan. Untuk iniperlu diadakan kajian ulang terhadap anggaran sosialdi Indonesia dengan maksud menetapkan sasaran yanglebih baik bagi dana-dana pemerintah untukmemberikan dasar bagi subsidi iuran guna mendukungskema jaminan sosial sukarela untuk pekerja dalamperekonomian informal dan untuk orang miskin.
Prinsip-prinsip Perluasan Cakupan Kepesertaanke Perekonomian Informal
Berdasarkan pengalaman internasional danpengalaman Indonesia dan dari hasil survei yangdilakukan sebagai bagian dari studi ini, prinsip-prinsipberikut direkomendasikan untuk pengembanganstrategi bagi perluasan jaminan sosial ke sektor informal:• kelompok-kelompok swadaya masyarakat yang
didukung oleh lembaga jaminan sosial (Jamsostek)dan perusahaan-perusahaan swasta hendaknyamenjadi inti sistem;
• Kelompok-kelompok hendaknya mempunyaifasilitator-fasilitator local yang bersifat eksternal yangterkait dengan lembaga jaminan sosial, organisasi-organisasi non pemerintah yang terpilih, dan didukungoleh pemerintah daerah dan mitra-mitra lokal lainnya;dan
• Program-program asuransi yang swadana, yangdisediakan oleh pemerintah (Jamsostek) danperusahaan-perusahaan swasta hendaknya bersifatfleksibel. Hendaknya pemerintah dari semua tingkatmemberikan subsidi untuk mendorong partisipasi daripembayar iuran.
Mengembangkan Model untuk MemberikanJaminan Sosial kepada Para Pekerja dalamPerekonomian Informal
Untuk menyusun suatu skema jaminan sosial yanglayak, perlu dibentuk sistem-sistem percontohan yangmemberikan manfaat yang berarti, iuran yangterjangkau serta berkesinambungan. Implementasi dariskema-skema seperti itu cenderung bersifat progresifdan mempertimbangkan beraneka ragam pekerjaan,organisasi dan distribusi geografis pekerja. Prasyarat-prasyarat berikut direkomendasikan sebagai langkahpertama dalam proses pengembangan percontohanjaminan sosial bagi pekerja sektor informal Indonesia:
• Mengidentifikasi badan-badan atau lembaga mitraprogram, yang sebaiknya merupakan kombinasi daripemerintah dan perusahaan-perusahaan swasta;
• Mengidentifikasi lembaga eksekutif yangbertanggung jawab atas program (sekurang-kurangnya, pada awalnya, pertimbangan hendaknya

Part IV Chapter 17
229
diberikan kepada Jamsostek, yang berperan sebagaipenyedia jaminan sosial bagi pekerja);
• Memilih dana dan pembawa risiko (risk carriers)untuk skema tersebut serta lembaga mana yang akandilibatkan;
• Menyusun program-program yang akan diadakan,termasuk manfaat, pelayanan, iuran dan biayamanajemen. Program-program tersebut harusmempunyai pilihan dimana program yang satu bisadigabungkan dengan program yang lain secarafleksibel dengan jajaran tingkat iuran dan manfaatuntuk memenuhi kebutuhan dan kapasitas berbagaikelompok yang berbeda dan meliputi setidaknyaskema kecelakaan kerja, pemeliharaan kesehatan,kematian, pensiun dan skema-skema tabungansukarela lainnya.
• Menyusun percontohan administratif dan pemberianpelayanan untuk program-program yang dikonsen-trasikan pada skema-skema kelompok tetapi jugamemberikan pilihan bagi para pembayar iuran yangbekerja sebagai pekerja mandiri. Model-modeltersebut hendaknya meliputi syarat-syarat informasimanajemen untuk memungkinkan pemantauansecara ketat dan penilaian terhadap risiko skemayang berlangsung;
• Melakukan tes skala kecil terhadap kecocokanprogram-program tersebut; dan
• Mendefinisikan syarat-syarat pemakai, analisis danrancangan dari suatu sistem teknologi informasidengan data-data yang memadai yang dapatdiintegrasikan ke dalam sistem teknologi informasiJamsostek. (Suatu sistem sementara yang akandikembangkan dalam Jamsostek dianggarkan sekitarUS$1000-1500).
• Merancang dan mengembangkan strategi penerapandan pemasaran.
Memprakarsai Usulan untuk Suatu ProgramPercontohan yang Didanai
Ada sejumlah masalah yang rumit dalam upayaperluasan jaminan sosial ke pekerja sektor informal.Tanpa adanya bantuan pemerintah, termasuk tanpaadanya suatu bentuk dukungan keuangan danadministratif, skema apa pun yang dijalankan diragukankeberhasilannya. Supaya dapat berkesinambungan,suatu skema perlu menarik dan dapat terus menarikpengiur sukarela dalam jumlah yang mencukupi.Temuan-temuan awal studi ini menyebutkan bahwahingga 50% pekerja sektor informal dapat membayariuran ke suatu skema jaminan sosial yang sesuai.Disarankan supaya suatu skema percontohan yangdidasarkan pada daerah berskala besar dilakukansebagai ancang-ancang bagi implementasi skematersebut dalam skala penuh di seluruh Indonesia.
Program percontohan perlu memasukkan unsur-unsurdari rekomendasi terdahulu dan dapat mengidentifikasidan mengembangkan program serta model-modeladministratif yang paling sesuai untuk diterapkan dimasa yang akan datang. Hasil dari proyek percontohantersebut akan digunakan untuk mengembangkanasosiasi-asosiasi pekerja sektor informal yangdidasarkan pada kepercayaan, program-programjaminan sosial yang berarti dan suatu administrasi yangsanggup mengumpulkan iuran dan pembayaranmanfaat yang dapat ditiru di seluruh Indonesia.
Suatu skema percontohan skala besar yang berhasil,dikembangkan sebagai bagian dari reformasi jaminansosial dan didukung oleh badan-badan internasional,akan meningkatkan pemahaman terhadap jaminansosial dalam masyarakat lokal, menyoroti kebutuhanmasyarakat dan mendorong perluasan cakupankepesertaan jaminan sosial di Indonesia. Suatu skemayang disubsidi sebagian akan mendemonstrasikankomitmen pemerintah terhadap reformasi jaminan sosialdan akan sangat meningkatkan angka pendaftaran,mendistribusikan risiko dan memastikan peluangkeberhasilan dan kesinambungan yang lebih besar.
Perluasan Jaminan Sosial ke Pekerja Migranyang Bekerja di Luar Negeri
Dari studi ini dan studi-studi lainnya jelas terlihat adanyakebutuhan dan permintaan akan perbaikan perlindungansosial bagi pekerja migran. Dalam konteks ini, pokok-pokok persoalan berikut ini hendaknya dibicarakan:• Meningkatkan mutu asuransi yang diberikan kepada
pekerja dengan memperkenalkan broker (perantara)seperti Jamsostek untuk memonitor skema dan jugasupaya diberi kesempatan untuk memberikanasuransi bagi pekerja migran dalam persaingandengan badan-badan swasta;
• Mengkaji ulang keputusan untuk tidak memasukkanpekerja migran dalam skema Jamsostek sertamemasukkan pekerja migran ke dalam skematersebut atau dalam suatu program yang dimodifikasiuntuk mencerminkan kebutuhan mereka; dan
• Mengembangkan suatu model kemitraan denganagen-agen kunci (APJATI, Depnakertrans danJamsostek) dalam proses memberikan perlindunganjaminan sosial kepada pekerja migran berdasarkankebutuhan-kebutuhan pekerja migran yang telahdimodifikasi. Memasukkan badan-badan penempatantenaga kerja sebagai pengusaha pada sistemteknologi informasi Jamsostek juga dapatmemberikan banyak informasi manajemen yang saatini masih belum tersedia bagi Depnakertrans.

Part IV Chapter 17
230
General Overview of the Issues forExtension of Coverage
Social Security Coverage in Indonesia
Indonesia has a population of some 210 million peopleof whom about 95 million were classified in the year2000 as being in the labour force. The majority of thesewere classified as being in the “informal” economy.Alternative definitions of what constitutes formal sectorand the informal economy exist. However, using theformal classifications of employment status used in thelabour force survey, about 35% of the employed labourforce of 90 million can be regarded as employees oremployers, with the other 65% being in various formsof self employment or irregular and mixed activity.These range from peasant farming to a wide varietyof trades and casual activity, with large numbers ofunpaid family workers. In urban areas the informalsector includes many street vendors and people seekingremuneration from casual activity.
There were also around 8 million people classified asformally unemployed. This latter figure excludes thelarge numbers in the informal sector who would takeup wage employment if they could find jobs. In additionabout 1.5 million Indonesia migrant workers areestimated to be officially employed abroad, notably inMalaysia and the Middle East, particularly SaudiArabia. The true totals of those employed abroad maybe higher than this because of large numbers ofundocumented and technically illegal workers alsounderstood to be employed abroad.
Social Security coverage in Indonesia is currentlyconfined to a minority of employee groups in the formalsector of the economy. These comprise members ofJamsostek, the private sector employee SocialInsurance and Provident Fund scheme, plus membersof the counterpart Government Employees and ArmedForces Social Insurance schemes.
Jamsostek is funded by contributions from employersand employees, and provides four programmes:
• Old Age Benefit (A lump sum retirement benefit);• Occupational Injury Insurance;• Death Benefit;• Health Insurance.The Jamsostek provision for Old Age is (in practice)only a lump sum benefit — unlike the Governmentemployee and military schemes which provide pensions.
The Jamsostek health care package covers workermembers, spouse and the first 3 children only. Article2(4) of Government Regulation No.14 of 1993 providesthat employers with their own private health careprovisions may opt out of the Jamsostek HealthInsurance component of the system if the benefits theyprovide for their employees are ‘superior to the basicHealth Care Package’. This has resulted in someadverse selection with better-paid workers more likelyto be covered by private (or employer-funded)packages with the lower-paid, more vulnerable workerscovered by Jamsostek. The risk pool is in consequencemuch smaller than it should be and with a lower levelof funding than it should have. The year 2002 estimateof the number of persons covered by Jamsostekpackage was 2.7m persons (of whom 1.3 m wereworkers). The coverage of the public sector healthcare scheme (Askes) was estimated to be 13.8m (plus0.72m ‘commercial’ members). Thus only some 17.22mpeople in Indonesia (with a population of 210 m) arecovered by the formal health insurance schemes —leaving 91.8% of the population excluded. Even addingin those covered by private health insurance, there areestimated to be 85% of the population excluded.
Membership of Social Insurance Funds (IncomeReplacement Schemes)
Current Jamsostek active membership is understoodto be around 9 million, though different estimates existbecause of doubts about the extent to which the 18million names recorded in the system include duplicateaccounts and people who have moved out ofemployment. The 18 million aggregate also includespeople who have formally retired or drawn benefitsfor other reasons. The Jamsostek system currentlyrelies heavily on employer records, but these are oftenincomplete when workers change employers or exitemployment. In addition the Government and ArmedForces schemes have somewhat over 4 millionmembers. In total perhaps 13 million employed peoplein Indonesia have some form of active contributorysocial insurance cover. This is about 14% of the labourforce and about 45% of the number of employeesincluding those in the Government and Armed Forces.However, in the private sector Jamsostek membershipis perhaps 35% of the total of private sector employees.
Actual membership of Jamsostek is drawn mainly fromlarge and medium scale enterprises. While the LabourForce Survey recorded over 2 million employers in theyear 2000, only just over 97,000 were Jamsostekmembers, or less than 5% of the total. It is clear from

Part IV Chapter 17
231
the statistics and also from field visits that most smallemployers do not enrol their staff in Jamsostek — eventhough legally liable to do so.
Legally, private sector employers are required to enroltheir staff in Jamsostek if they have 10 or more staffor a monthly payroll of Rp. 1 million or more.However, since minimum wages in many provincesexceed 400 thousand Rupiah a month, most employerswith more than 2 or 3 staff are legally supposed to beJamsostek members. In practice this legal requirementis widely ignored, and Jamsostek lacks the capacity toenforce it.
Reasons for non-compliance with Jamsostekregistration
Consultations and discussion with employers andemployees yielded a variety of reasons why peopledid not join Jamsostek:
• Jamsostek contributions were a cost to employersand a reduction in net wages for employees. Manyfelt that they could not afford this, or had bettercurrent uses for the money;
• Some considered that Jamsostek programmes werenot a good economic deal, with benefits being lessthan proportional to the scale of contributions;
• Jamsostek was not regarded as providing a very goodclient service — offices were few, particularly inthe more remote areas, and response times slow;
• Jamsostek was seen as having invested members’assets unwisely;
• The large share of profits going to the Governmentin taxes and dividends was also seen as shrinkingthe scale of benefits that could be provided tomembers;
• Some people were not aware of the details of whatJamsostek provided, and others thought thatmembership was now voluntary.
To this list should be added the lack of inspection andenforcement capacity in Jamsostek. This is currentlythe responsibility of the labour inspectors in theDepartment of Manpower (Depnaker) and in theprovincial administrations. These people also havemany other duties.
Exclusions from Social Security Coverage
In summary six groups in the labour force or populationand their dependents currently lack coverage by formalsocial security arrangements. Some of these will access
the limited forms of Social Assistance provided underthe emergency Social Safety Net Programme whichwas put in place after the 1997 crisis. However, thisis commented on in the separate paper on SocialAssistance. The six groups excluded from formalsocial security coverage are:
• Employees who are legally required to be membersof Jamsostek, but are not currently enrolled;
• Employees not currently required to be members ofJamsostek;
• People in the informal sector;• The Unemployed;• Migrant workers temporarily abroad; and• Households without adult earners.
Comments on possible strategies for covering thesegroups follow.
Illegal non-compliers
The main strategies for increasing the rate ofcompliance with legal requirements for Jamsostekmembership are dealt with in detail in the separatereports on Jamsostek covered elsewhere in the project.These include:
• Turning Jamsostek from a Government profit makingbody (Persero) into a Trust Fund with arepresentative tripartite Board, thereby formallyproviding that member funds are to be used only formembers;
• Improving the Jamsostek information systems toprovide better client information and help facilitatebetter client service;
• Developing a client service culture and an expandednetwork of offices; and
• Allowing Jamsostek to appoint its own inspectors toimprove compliance.
Expanding the Legal Requirement to JoinJamsostek
Once Jamsostek has improved its administrativecapabilities; it should be possible to initiate a processof progressively expanding the legal requirement forformal sector employees to be enrolled in Jamsostek.This could include the following steps:
• Progressively lowering the size limit from 10 toperhaps 5 employees, and ultimately to cover allformals sector employees. There are, however,advantages from the enforcement point of view in

Part IV Chapter 17
232
including all employers in the next phase of extension,bringing in the whole of rest of the formal sector at astroke;
• Using regulations to define various forms of“contracted” and casual employment as being subjectto Jamsostek membership requirements.
The path of progressive expansion of coverage tosmaller and smaller enterprises is one used elsewherein the world. Expanding the definitions of dependentemployment is already possible under the Jamsosteklaw and its interpretation, but has not been widelyimplemented in practice.
However, enterprises in the construction sector havebeen compulsorily required to register since 1987. Butthe coverage is only for employment injury under aprogram known as JAKOM. Registration must takeplace before the start of a contract irrespective of thenumber of employees or the wages paid. The employerpays the highest rate of the variable rate of contributionfor occupational injury coverage — that is 1.74% ofthe total value of his contract.
Similarly, protection has been extended to transportworkers in Makassar through their association. Theassociation collects a flat-rate (Rp.1,690 per memberper day) for coverage of the contingencies ofemployment injury, death, medical and old age.
Workers employed at the harbour are also coveredthrough special arrangements through their unions andat rates calculated by Jamsostek. Other groups arealso being considered for coverage through specialarrangements, including: Jakarta Port delivery drivers;public service vehicle drivers; Ojeg (motor cycle taxi)drivers and fishermen.
While this gradual extension of coverage is to bewelcomed for the protection it provides, there appearsto be no legal provision for such new instruments ofcoverage (other than that implied by the elucidation ofArticle 2 paragraph 3 of Government Regulation No.14 of 1993 which permits voluntary membership).These arrangements can be compared with provisionin group insurance coverage provided by privateinsurance companies and while on the one hand theyindicate possible ways of extending coverage toinformal groups by organizing them into associationsor cooperatives and obtaining group (rather thanindividual) coverage, on the other they tend further tofragment social security coverage and are likely to leadto the proliferation of schemes within schemes — each
with separately negotiated contribution rates and levelsand ranges of benefit. There is thus an urgent need tostudy the arrangements and to draw up guidelines ormodel agreements to facilitate their eventualamalgamation with the mainstream of Jamsostekcoverage. Such a study needs to take account of anypossibility that there is an identifiable ‘employer’ whois controlling the manner or method of the servicesrendered by the worker. If such an ‘employer’ existsor such an entity could be treated as existing under amodification to the law, the employment could betreated as ‘formal’ and subject to the normal provisionsof the scheme. Other persons could be treated as ‘self-employed’ and decisions may be taken regarding thescope of coverage for this group. Only the truly informalwill then require separate, special treatment but evenwith the truly informal there should be some consistencyof treatment.
The Informal Economy
Covering the informal economy is a more difficult issuebecause of its enormous variety. Workers in theinformal economy range from urban street people withno assets seeking casual earnings from “minding”parked cars or directing traffic turns, to small traderswith handcarts or street stalls, to farmers, traders andcraftspeople with property and premises andequipment, and to unpaid family workers in farms andsmall businesses. In parts of Indonesia there are stillpeople who are hunter-gatherers or slash and burnshifting cultivators. All these very different situationsare currently classified as being in the “informal” sector.
At the stage of drafting this chapter of the report therewas insufficient information to determine whatapproaches are likely to be the most successful witheach of these groups. Basic information which will berequired to determine this includes:
• The financial capacity of various informal sectorgroups to contribute to social insurance type schemesof social security;
• Priority needs of each of the groups for various typesof cover;
• The mechanisms by which this is best achieved,including individual membership group membership,occupation-specific levies, or other forms of funding;and
• The extent to which these needs and options can beincorporated in existing or revised Jamsostekprogrammes.

Part IV Chapter 17
233
These informal economy groups were included in afurther study on extending social security coveragebelow.
Apart from contributory Social Insurance or relatedschemes, some of these groups may be eligible forSocial Assistance in areas such as Health.
The Unemployed
Proposals to extend Unemployment Insurance to coverinsured people in the formal sector who becomeunemployed are included in a separate Report (Part 4of the project series) and discussed in Part III of thisPublication.
For the unemployed who are not recent employees ofthe formal sector, (i.e. mostly school leavers andhousewives seeking employment) there is currently littlethat can be suggested. Some options in the socialassistance sector (e.g. special employment at lowwages) may offer some options. Social Assistance mayalso offer some health cover. Coverage of otherearners in the household through social insurance mayalso assist.
Migrant Workers
Indonesian migrant workers abroad lack domestic socialinsurance and are predominantly not covered or notadequately covered by social security in their countriesof employment. Coverage for migrant workers abroadis a specialist area where coverage needs to be definedand ensured in reciprocal or other agreements coveringmigrant workers between Indonesia and the hostcountries.
Households without Adult Earners
There is a minority of households in Indonesia whichlack active adults capable of undertaking employment.These include some of the elderly, those where theadult members are physically or mentally disabled, andsome sole parent situations. To the extent that there isno larger extended family or other group able to provideassistance, these people may subsist by begging.
In the long run this group will need to be supported bysocial assistance. This is commented on in the separatereport on Social Assistance (Part 5 of the project series)and further discussed in Part III of this Publication.
Extending the Coverage of Social Security
While some of the paths to extending social securitycoverage in Indonesia are clear, and involve actionswhich can be progressively implemented, in other areasoptions and possibilities are less clear. A scopingexercise was undertaken in the early stages of theproject in May and June 2001 in order to identify theoptions for the study on extending coverage andliterature research to identify the range of informationavailable and the extent of the stakeholders. Thescoping exercise also involved a number of visits tolocations that employed workers not covered by existingprovisions including a range of workers in the informaleconomy, including occupations in the fishing, garmentand food processing industries.
The study identified the groups not currently coveredby social security, including in particular non-coverageby Jamsostek and other social insurance schemes, andproposed a strategy for extending coverage to thesegroups. It also distinguished the situation of threedistinct groups, and identified the appropriateapproaches for incorporating these groups into socialsecurity coverage, notably:—
• Workers in formal sector employment who are legallyrequired to be members of Jamsostek, but are notcurrently in membership;
• Workers in the formal sector who are not membersof Jamsostek or other formal social insuranceschemes, and are not currently required by law tobe members, including groups which can be coveredby broader definition of employment;
• Workers in the informal economy; and• Overseas Migrant Workers.
The study comprised three distinct phases:—
• Phase 1 used existing statistical sources includingthe Social and Economic Surveys, the RandCorporation Indonesian Family Life Studies, andJamsostek and other statistical information to identifythe size and composition of each of these groups,and in particular their apparent financial capacity tocontribute to social insurance type schemes. It alsoexamined selected international experiences withextension of cover and local projects onempowerment and self-help schemes for the poorand in the informal sector;
• Phase II identified the extent and reasons for non-coverage of workers in the formal sector by

Part IV Chapter 17
234
Jamsostek, and the feasible options for extendingcoverage of Jamsostek by increasing compliance ofthose legally required to be Jamsostek members, andthose in the formal sector who might be brought intocoverage by extensions to the present law; and
• Phase III involved surveys of people employed inthe informal sectors of the economy to identify:! Their priority needs in terms of social security
cover;! The extent to which they have capacity to fund
membership of contributory schemes, eitherindividually or in terms of joint coverage ofidentifiable groups;
! Alternative options for funding social securitycoverage for these groups, including groupschemes of various types; and
! The extent to which these options can be fittedwithin Jamsostek or other social insuranceprogrammes.
The project extension to the end of 2002 granted bythe Netherlands Government enabled completion ofthe survey of the economically active population in anarea of Jakarta and another in Bandung, West Java.Considerable enquiry was made of people working inthe informal economy regarding their social protectionneeds and ability to contribute. In a later phase, thestudy focused on informal sector workers in thehandicrafts industry in and around Yogyakarta inCentral Java. The objective was to explore contractuallinks between the various levels of activity — the craftmaking, distribution, retailing, etc. to establish whatcontrol was exercised in quality, quantity and mannerand method of working — with a view to identifyingpossible sources of capital to tap for a social securitycontribution and also to consider broadening thedefinition of ‘employer’ to enable handicraft workersto be ‘treated’ as employed persons within the meaningof the legislation and so bring them under a similarlevel of protection as formal sector workers.
Clear priorities were expressed within the informaleconomy that health care was of paramountimportance, followed by accident insurance. Since mostpeople in the informal economy would be unable toafford the full Jamsostek contribution giving access tothe full range of benefits, the possibility of provisionfor partial cover being made for the sector is beingconsidered. The alternative of micro insurance forindividual groups is thought to suffer from too small arisk pool unless there is re-insurance via the mainscheme funded through cross subsidy. But the law willneed to be changed to enable this to be done, as withthe exception of the ‘opt out’ clause in the provision of
healthcare, it does not permit less than thecomprehensive range to be provided. The difficulty ofconfirming that any accident to an informal sectorworker in respect of which benefit may be claimed is‘work-related’ adds support to the view expressedelsewhere in this project report that broadening thescope of employment injury to include all accidentsshould be considered.
Some of the other relevant findings from the surveyinclude the salary of informal sector workers whichranged between about one half and four times theaverage minimum salary, most were self employed andthe 40% of self employed respondents employed a totalof over 4000 employees suggesting that the employer/employee relationship requirements of the socialsecurity law would provide for these workers to becovered by Jamsostek. Other important findingssuggested that about 60% of respondents believed thatindividuals should be responsible for their social securitycontributions and 42% indicated that they would beprepared to contribute to a suitable scheme.
The findings concluded that extension of coverage tothe informal sector if feasible and should be based onthe self-help groups and cooperatives that aresupported by a combination of existing NGO’s andsuitably trained field officers from the social securityagency. The programs must be tailored to the needsof the relevant groups and will vary from place toplace. The principles of any extended scheme to theinformal sector and overseas migrant workers shouldbe flexible, affordable and sustainable and based onan extended pilot programme in e few sites with aview to extending the successful model to other partsof the country. Full details of the findings andrecommendations are contained in the report Studyon the Extension of Coverage to Excluded Groups(Part 10 of the project series).
Introduction
Project Background
The ILO has been closely involved in the developmentof social security in Indonesia for many years. RecentILO project reports have recommended the need torestructure the social security system in order to extendthe social security coverage to a larger percentage ofthe population.
A National Steering Committee was established bythe Department of Manpower and Transmigration(Depnakertrans) in September 1999 to work with ILOspecialists. This followed the strategic vision about

Part IV Chapter 17
235
employees’ social security administration described inthe Guidelines of State policies Year 1999 – 2004. Theguidelines provided the aim: To develop a system ofemployees social security for all workers to providesufficient work protection, security and safety withmanagement involving government, employers andemployees. A National Workshop on Restructuring ofSocial Security was held in Jakarta in November 1999and a number of recommendations were made aboutthe future direction of social security reform inIndonesia.
The key findings of the workshop can be broadlygrouped as identifying the need for:• Redefining the role of the state and private agencies
and the development of a national social securityreform strategy;
• Improving the scope and type of benefit programmesand progressive extension of eligibility to thevarious schemes to the wider population, withJamsostek as one of the core service deliveryagencies;
• Strengthening the management, accountability,investment performance and service deliverystandards of Jamsostek; and
• Improving compliance measures and public relationsprocesses in Jamsostek.
The progressive extension of social security coverageis also one of the key elements in Indonesia’s nationalstrategy for poverty reduction, which aims to• Promote opportunities for the poor:
! Achieving rapid, sustainable growth,! Strengthening local governance,! Providing effective core public services like health
and education, and! Building community infrastructure.
• Empower the poor:! Strengthening community organization,! Promoting sustainable rural development, and! Revitalizing small and medium sized enterprises.
• Enhance access to social security for the poorest:! Improving core social safety nets, and! Accelerating development in remote areas
This report addresses the options for extending socialsecurity coverage to workers in Indonesia who areexcluded from existing schemes. The study focusedon the three main excluded groups; persons who workfor small employers and who are thus currentlyexcluded from Jamsostek, informal sector workers and
overseas migrant workers. This report complementsthe other reports and feasibility studies produced inthe project Restructuring of Social Security inIndonesia, particularly the review of operations ofJamsostek.
Summary of Activities
The study aimed to identify categories of workers inthe informal economy, to define their status inIndonesia, to identify their priority social security needsand to assess the feasibility of providing them withbasic social security provision.
The study also reviewed the capacity of Jamsostek,as the likely agency to be responsible for extendingeligibility to all formal sector workers and to informalsector workers. The study of the informal economyand the administration and operations of Jamsostekrequired the close co-operation and involvement of aNational Economist/statistician counterpart, staff inJamsostek and research assistants to undertake a small-scale survey. The counterparts and staff providedvaluable support to the consultant in the all phases ofthe project, their cooperation and effort, particularly inaddition to their considerable normal daily workloadswas greatly appreciated.
The consultant made a detailed analysis of the dataobtained from research of previous studies into theinformal economy, local data obtained from recentstatistics and the survey results and from previousstudies into the operations of Jamsostek. This analysiswas conducted in conjunction with counterpart staffand included personal visits, observation and discussionwith selected informal sector workers. The staff andstakeholder needs and suggestions were taken intoaccount in the analysis and the subsequentrecommendations. The priority was a detailed studyof the informal economy and through surveys ofinformal sector workers. The recommendations for theextension of social security eligibility were made inconjunction with the key stakeholder agencies.
The Incidence of Poverty in Indonesia88
Introduction
Poverty has become one of the critical problems ineconomic and social development in Indonesian. The
88 This section was prepared by Dr. Carunia Mulya Firdausy, Senior Economist at National Centre for Economic Research–IndonesianInstitute of Sciences and edited by the author.

Part IV Chapter 17
236
reason for the recent growth in the number of the poorwas due substantially to the economic crisis thatoccurred in mid 1997 which resulted in a contractionof the economy, so much so that in 1998 the economicgrowth was 14 percent lower than the previous year.As a result of the economic slowdown, large numbersof workers were laid-off, particularly in the labour-intensive construction and manufacturing sectors andthe modern services sectors all of which are mostlylocated in urban areas. Some of these unemployedworkers had to return to rural areas, while others choseto remain in the cities. Many laid-off workers wereforced to find self-employment in the informal economy,both in urban and rural areas, in order to ensure theirlivelihood.
Female workers have been equally affected by thelayoffs and as they represent a third of employment inthe formal sector, they are likely to account for at least30 per cent of the total displacement in the formalsector. Nevertheless, many home workers andcontractors who supplied inputs to formal sectorenterprises experienced reduced demand and asubsequent reduction in hours worked and incomeearned. Though they may not be actively looking foralternative work and thus not included in the jobseekersstatistics, they form an important, though difficult toquantify, component of hidden unemployment andunderemployment. The Department of Manpower andTransmigration estimates that the number ofunemployed and underemployed workers in 2002 isalmost one-third of the total workforce89.
The Central Bureau of Statistics (BPS, 2001) calculatedthat in the year 2000, the poor represented about 23.4per cent of the total population of 206 million people.Of these, about 32 million (66.7 %) lived in rural areas,while the remaining 16 million (32.3 %) lived in urbanareas. Using The World Bank poverty line per capitadaily income of one US dollar, the number of the pooris much larger than the estimate made by BPS. TheWorld Bank estimated the number of the poor in theyear 2000 to be about 54 per cent of the total population,more than double the official estimate. Though thereare varying estimates of the impact of the economiccrisis on the incidence of poverty, there is no doubtthat absolute poverty has increased significantly andthat economic distress was widespread among a largenumber of economically vulnerable people. Hence, oneof the prominent achievements of the Soeharto
administration, namely the sharp reduction in absolutepoverty during its 32-year rule, was reversed as a resultof the severe economic crisis.
This section aims at providing background informationon the incidence of poverty in Indonesia. Thisinformation will demonstrate the requirement to supportthe poor through the expansion of social securityprograms in Indonesia. However, to understand thefull extent of the incidence of poverty, it is important toprovide background information on the presenteconomic conditions and Indonesia’s efforts atrecovery.
Present Economic Conditions and Indonesia’sRecovery Efforts
Although by mid-2002 macroeconomic stability hadbeen achieved with a lower rate of inflation, and withthe Rupiah strengthening to below Rp. 9,000 to theUS dollar, the growth in 2002 was only about 5 percent. The strengthening of the Rupiah did notautomatically lead to an improvement in the economicfundamentals. Many economists have argued thateconomic recovery programs such as bankrestructuring, corporate debt restructuring, and theattempt to increase investment and exports have beenvery slow.
In the case of bank restructuring, for instance, it hasbeen reported that the Indonesian Bank RestructuringAgency (IBRA) whose main task is to sell assets, hasnot achieved much success. The reason for this isbecause of the political debate about the appropriatevalue of assets to be sold. This debate has arisenbecause the actual market value of IBRA’s assets hasturned out to be much lower than the book value atwhich these assets were acquired. This has arousedpolitical controversy, since the Parliament has decreedthat the assets sales should recover at least 70 percent of the value at which an asset was transferred toIBRA. A fire sale of these assets would only benefitforeign investors who would subsequently own a largershare of Indonesia’s economy. Knowledgeable marketanalysts, however, have stated that a realistic ratewould only amount to t 30-40 per cent90, perhaps evenless. Another estimate has indicated that instead ofthe Rp. 660 trillion book value of assets controlled byIBRA, the fair value of these assets was only aboutRp. 168 trillion91, which represents only about 26 percent of the book value.
89 This is assumed to include the 8 million formal jobseekers and about 25 million unpaid workers in family businesses.90 ICG, 200191 Takii, 2002

Part IV Chapter 17
237
The much lower actual value of these assets can bepartly attributed to poor market conditions caused bynegative perceptions by foreign investors of Indonesia’spoor investment climate and partly because of fraudby the original owners, who were responsible for theinflated value of assets before being handed over toIBRA. Despite this, both the government and theparliament have been very reluctant to accept this lowerfigure because it means that the government will neverbe able to recoup the huge total costs of the bankbailouts provided in 1997/1998. Without a speedyresolution of this problem, IBRA will not be able todispose of the large numbers of its remaining assetsby the time its term expires in February 2004.Experience has indicated that holding on to idle assetswill only lead to further erosion in the prices of theassets. Moreover, selling idle assets to foreigninvestors, specifically banks, would not only yield muchneeded revenues for the government, but also benefitfrom a healthy restructuring of these banks by bringingin much needed skills and modern managementpractices. A comprehensive restructuring of thebanking system is crucial to the revival of the financialsector of the economy.
In terms of foreign direct investment (FDI), there hasbeen a substantial decline of 59 per cent in approvedFDI during the first five months of 2002 whencompared to the same period in 2001. During the firstfive months of 2001, the Capital InvestmentCoordinating Board (BKPM) had approved 566 newFDI projects amounting to US$ 1.674 billion92.Approved domestic investment during the first fivemonths of 2002 also declined by 30 percent comparedto the same period in 2001.
Several steps have been introduced to make Indonesiaa more attractive proposition for foreign investment,including further simplifications of the investmentlicensing procedures, allowing foreign investors to fullyown holding companies and further reductions in thenumber of activities closed to FDI as listed in theNegative Investment List. New fiscal incentives havebeen introduced for new investors planning to investin pioneer industries in the regions outside of Java andfor new investors employing at least 2000 workers atthe start of commercial production of their plants.However, the results of these measures have notachieved the planned investment targets. Foreigninvestors claim that Indonesia’s investment climate isnot very conducive. In addition, foreign and domesticinvestors claim that there is:
• A lack of legal certainty and proper law enforcement,• Increased levels of labour disputes,• General violence,• Increased crime and the lack of physical safety,• Problems with corrupt taxation and immigration
officials, and• Uncertainty caused by the introduction of regional
autonomy and disputes with local governments.
It has been suggested that to promote more FDI, theIndonesian government should make a more determinedeffort to act on the above views of investors,particularly in regard to the lack of legal certainty, thewide prevalence of labour conflicts, the lack of safety,and the pervasive corruption which adds to the cost ofdoing business in Indonesia.
Other attempts to develop small and medium scaleenterprises (SME’s) have also been introduced,although this is not a new policy. The recent concernabout SME’s can be reflected in various directpromotion policies and special programs to encouragetheir growth. The major direct assistance programsfor SME’s have included special credit programs,including subsidized credit, non-financial businessdevelopment services programs, particularly industrialextension services and training, and reservation ofselected sectors or sub sectors to small enterprises93.However, even after many years of implementationof these direct government assistance programs,including both subsidized and unsubsidised creditprograms, and technical assistance programs, they havenot achieved much success or cost effectiveness indeveloping economically viable SME’s. The continuedineffectiveness of government credit programs inreaching SME’s is, for instance, reflected by researchconducted by the Asia Foundation in 1998 which foundthat of the total credit extended to SME’s by portfolioonly about 17 per cent of the SME’s used the formalbanking system to obtain credit.
Similarly, the various non-financial businessdevelopment services programs, particularly thetechnical assistance programs such as the SmallIndustries Development (BIPIK) program have notbeen effective either in raising the technical capabilitiesof SME’s because they suffered from poor design ordeficient implementation94. Past experience withsupply driven business development services deliveredby government agencies has indicated that theseservices, often provided on a cost free basis, have notbeen effective in meeting the needs of the SME’s.
92 Kompas daily, 28 June 200293 ADB, 2000; Thee Kian Wie, 200294 Thee Kian Wie, 2002; Firdausy, 2002
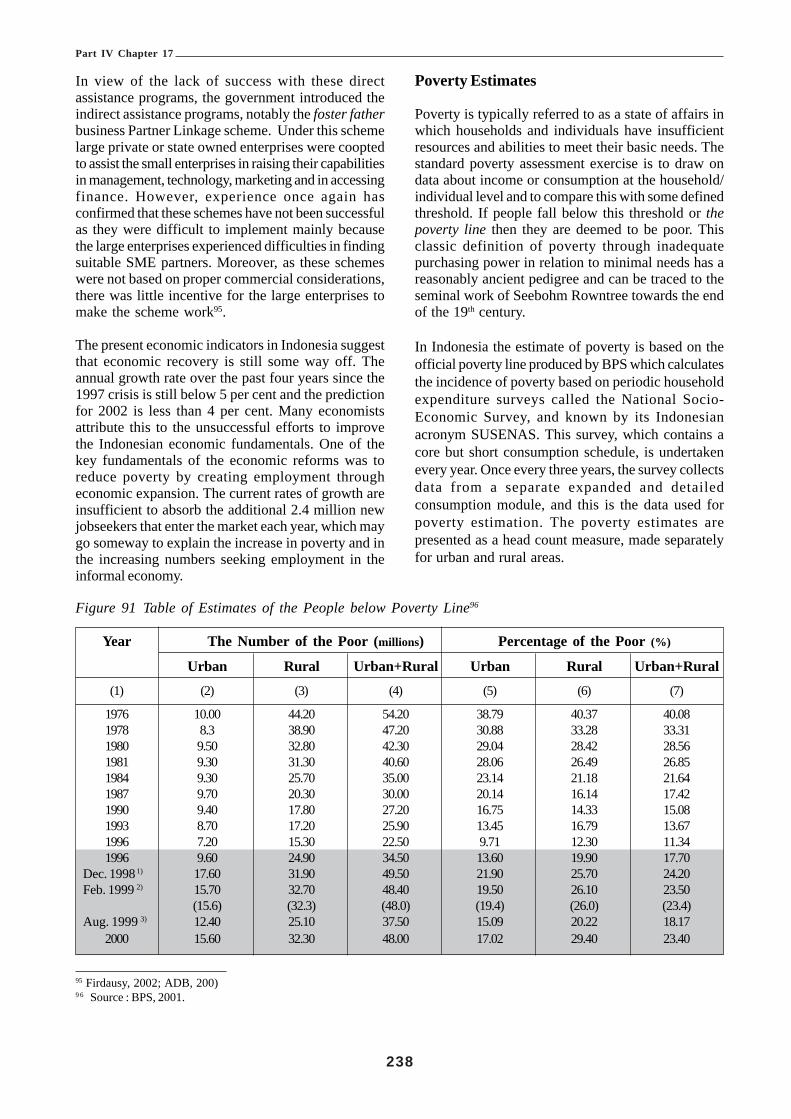
Part IV Chapter 17
238
In view of the lack of success with these directassistance programs, the government introduced theindirect assistance programs, notably the foster fatherbusiness Partner Linkage scheme. Under this schemelarge private or state owned enterprises were cooptedto assist the small enterprises in raising their capabilitiesin management, technology, marketing and in accessingfinance. However, experience once again hasconfirmed that these schemes have not been successfulas they were difficult to implement mainly becausethe large enterprises experienced difficulties in findingsuitable SME partners. Moreover, as these schemeswere not based on proper commercial considerations,there was little incentive for the large enterprises tomake the scheme work95.
The present economic indicators in Indonesia suggestthat economic recovery is still some way off. Theannual growth rate over the past four years since the1997 crisis is still below 5 per cent and the predictionfor 2002 is less than 4 per cent. Many economistsattribute this to the unsuccessful efforts to improvethe Indonesian economic fundamentals. One of thekey fundamentals of the economic reforms was toreduce poverty by creating employment througheconomic expansion. The current rates of growth areinsufficient to absorb the additional 2.4 million newjobseekers that enter the market each year, which maygo someway to explain the increase in poverty and inthe increasing numbers seeking employment in theinformal economy.
Poverty Estimates
Poverty is typically referred to as a state of affairs inwhich households and individuals have insufficientresources and abilities to meet their basic needs. Thestandard poverty assessment exercise is to draw ondata about income or consumption at the household/individual level and to compare this with some definedthreshold. If people fall below this threshold or thepoverty line then they are deemed to be poor. Thisclassic definition of poverty through inadequatepurchasing power in relation to minimal needs has areasonably ancient pedigree and can be traced to theseminal work of Seebohm Rowntree towards the endof the 19th century.
In Indonesia the estimate of poverty is based on theofficial poverty line produced by BPS which calculatesthe incidence of poverty based on periodic householdexpenditure surveys called the National Socio-Economic Survey, and known by its Indonesianacronym SUSENAS. This survey, which contains acore but short consumption schedule, is undertakenevery year. Once every three years, the survey collectsdata from a separate expanded and detailedconsumption module, and this is the data used forpoverty estimation. The poverty estimates arepresented as a head count measure, made separatelyfor urban and rural areas.
95 Firdausy, 2002; ADB, 200)9 6 Source : BPS, 2001.
Figure 91 Table of Estimates of the People below Poverty Line96
Year The Number of the Poor (millions) Percentage of the Poor (%)
Urban Rural Urban+Rural Urban Rural Urban+Rural(1) (2) (3) (4) (5) (6) (7)
1976 10.00 44.20 54.20 38.79 40.37 40.081978 8.3 38.90 47.20 30.88 33.28 33.311980 9.50 32.80 42.30 29.04 28.42 28.561981 9.30 31.30 40.60 28.06 26.49 26.851984 9.30 25.70 35.00 23.14 21.18 21.641987 9.70 20.30 30.00 20.14 16.14 17.421990 9.40 17.80 27.20 16.75 14.33 15.081993 8.70 17.20 25.90 13.45 16.79 13.671996 7.20 15.30 22.50 9.71 12.30 11.341996 9.60 24.90 34.50 13.60 19.90 17.70
Dec. 1998 1) 17.60 31.90 49.50 21.90 25.70 24.20Feb. 1999 2) 15.70 32.70 48.40 19.50 26.10 23.50 (15.6) (32.3) (48.0) (19.4) (26.0) (23.4)Aug. 1999 3) 12.40 25.10 37.50 15.09 20.22 18.17
2000 15.60 32.30 48.00 17.02 29.40 23.40

Part IV Chapter 17
239
Note : Figure in the block used consumption pattern in 19981) Based on Susenas Data December 19982) Based on Susenas Data February 19993) Based on Mini Susenas August 1999
It was estimated by BPS that the number of the poorin 2000 was about 48 million people or 23.4 per cent ofthe total population compared to 1996 when theestimates were 22.5 million or 11.3 per cent of thetotal population living below the poverty line. The bulkof poor people live in rural areas, which is not surprisingsince Indonesia is still a predominantly rural country.The number of the poor people in rural areas in theyear 2000 was about 32.3 million while in urban areasit was about 15.6 million people. The increase in theurban poor in 2000 is mainly as a result of the continuingrural to urban shift in the population and to the massiveemployment layoffs in 1998 in urban areas due to the
economic crisis. Detailed estimate of the incidence ofpoverty from 1976 to 2000 is shown in Figure 1.
It should be noted that the above estimation of thepoor population is taken from the National Social-Economic Survey (SUSENAS) data and the estimationis based on a Rupiah value equivalent calorie intake of2100 per capita per day; plus the Rupiah value of abundle of non-food items considered as basic non-foodrequirements. Therefore, those who are not able toattain that level of expenditure for food and non-fooditems are counted as poor while others are regardedas non-poor. Figure 2 shows the poverty line based onthe level of expenditure per capita per month that wasused to estimate the incidence of poverty from 1976to 2000.
Figure 92 Table of The Official BPS Poverty Line (in Rupiah).97
YearUrban Poverty Income Level Rural Poverty Income Level
Food Non TotalFood
Non TotalFood (Rp/month) Food (Rp/month)
(1) (2) (3) (4) (5) (6) (7)
1976 - - 4,522 - - 2,8491978 - - 4,969 - - 2,9811980 - - 6,831 - - 4,4491981 - - 9,777 - - 5,8771984 - - 13,731 - - 7,7461987 - - 17,381 - - 10,2941990 17,520 3,094 20,614 12,617 678 13,2951993 23,303 4,602 27,905 15,576 2,668 18,244
199698 29,681 8,565 38,246 23,197 4,216 27,4131996 30,455 11,577 42,003 23,844 7,522 31,366
Dec. 1998 1) 71,058 25,901 96,959 56,745 16,035 72,780Feb. 1999 2) 70,959 21,450 92,409 59,822 14,450 74,272Aug. 1999 3) 64,396 25,449 89,845 52,319 17,101 69,420
2000 86,345 35,876 122,221 65,525 22,510 88,035
Note : Figure in the block used consumption pattern in 19981) Based on Susenas Data December 19982) Based on Susenas Data February 19993) Based on Mini Susenas August 1999
97 Source : BPS, 2001.9 8 Dotted line and shaded area indicates the pre and post economic crisis periods
It has been argued that the official poverty estimatesshown above are quite low compared to the standardsin neighbouring countries (e.g. Malaysia andPhilippines). Using internationally comparable povertycut-off lines of US$ 1.00 in urban areas and US$ 0.80in rural areas that are used in Malaysia and the
Philippines, it is evident that the number of poor peoplein Indonesia is much higher than the official povertyestimates. In 1999 the ILO estimated that the numberof the poor in 1996 using the above internationalstandard was 57 per cent for the country as a wholeand 66.4 per cent in the year 1999 (Figure 3 and Figure

Part IV Chapter 17
240
4). These Figures should be viewed in conjunction with the footnotes which explain how the exchange rateaffects the US$ estimates. Using this international standard suggests that more than half of the Indonesianpopulation could be considered poor even at the peak of Indonesia economic growth period in 1996, the periodbefore the 1997 economic crisis.Figure 93 Table of Estimates of the Incidence of Poverty, 1996-1999.99
Percentage Poor Population Total PopulationIndonesia Urban Rural Indonesia Urban % Rural % Indonesia Urban Rural
Pre Crisis (1996)Official (US$ 0.45/day) 1) 11.34 9.71 12.30 22.50 7.20 32 15.30 68 198.40 74.20 124.40Based on US$ 0.87/day 2) 57.35 42.91 65.90 113.80 31.80 28 82.00 72 198.40 74.20 124.40Poverty Trends1984 (official) 21.64 23.14 21.18 35.00 9.30 27 25.70 73 161.70 40.20 121.301996 (official) 11.34 9.71 12.30 22.50 7.20 32 15.30 68 198.40 74.20 124.401998 (estimates) 3) 48.34 39.31 53.20 98.80 28.10 28 70.70 72 204.40 71.50 132.901999 (estimates) 4) 66.42 56.60 71.71 137.80 41.10 30 96.70 70 207.50 72.60 134.90
Notes :1) Official 1996 urban/rural poverty line of Rp.38,246 & Rp.27,413/capita/month divided by prevailing exchange rate of Rp.2,300/US$
gives US$ 0.55 and US$ 0.40, or weighed average of US$ 0.45/capita/day.2) Based on urban/rural poverty line of US$ 1 and US$ 0.80, or weighed average of US$ 0.87/capita/day.3) Poverty Line (PL) 1998: 1996 PL x 16.6% x 80% (inflation rates in 1997 and 1998).4) Poverty Line (PL) 1999: 1998 PL x 25% (inflation rate in 1999).
Figure 94 Numbers Below the Poverty Line 1984 - 1999
9 9 Source ILO 1999
The incidence of poverty varies between provinces inIndonesia. In the year 1999, BPS estimated that inabout 19 of the 32 provinces more than 20 per cent oftheir total population lived in poverty. Among theseprovinces, the province of Papua (previously namedIrian Jaya) had the highest incidence of poverty (47.5 %)
followed by East Nusatenggara, East Timor, Maluku,Lampung, West Kalimantan, Central Java, East Java,Southeast Sulawesi, Central Sulawesi and SouthSumatra (Figure 4). These data suggest that theincidence of poverty is higher in the eastern part ofthe country than the western part.

Part IV Chapter 17
241
Figure 95 Table on the Proportion of Population below the BPS Poverty Line by Province100
Province Urban Poverty Rural Poverty Total PovertyPer cent Rank101 Per cent Rank Percent Rank
DKI Jakarta 6.59 1 - - 6.59 1Bali 9.80 3 9.89 1 9.85 2Riau 11.43 4 14.98 2 13.65 3Aceh 13.76 6 17.38 5 16.47 4West Sumatra 17.43 12 16.48 3 16.75 5Central Kalimantan 7.16 2 20.41 6 16.83 6North Sumatra 17.50 13 16.64 4 17.03 7East Kalimantan 12.65 5 22.83 9 17.65 8North Sulawesi 14.23 7 24.60 13 21.61 9West Java 20.96 17 22.32 8 21.67 10South Sulawesi 20.50 16 22.20 7 21.68 11South Kalimantan 16.37 11 25.03 15 22.33 12Yogyakarta 20.13 15 27.68 18 22.62 13Bengkulu 20.02 14 24.55 12 23.23 14West Nusatenggara 25.94 23 23.42 10 23.93 15Jambi 23.27 21 24.63 14 24.24 16South Sumatra 24.77 22 24.27 11 24.42 17Central Sulawesi 21.69 20 25.87 16 24.78 18Southeast Sulawesi 14.28 8 28.34 20 25.50 19East Java 21.55 19 28.80 19 26.24 20Central Java 26.06 24 27.52 17 27.01 21West Kalimantan 14.43 10 34.25 22 29.72 22Lampung 21.14 18 32.92 21 30.77 23Maluku 28.52 25 41.50 23 37.88 24East Timor 39.35 27 44.07 24 43.56 25East Nusatenggara 30.43 26 47.15 25 44.95 26Papua 14.31 9 59.30 26 47.53 27
INDONESIA 19.98 25.85 23.55102
100 Source : M. Pradhan, et al., June 2000, p.14.101 Lowest ranking is the poorest.102 Weighted average
It was found that all sectors experienced a uniformincrease in the incidence of poverty between 1996 and1999. This implies that there was no single sector thatwas spared from the negative impact of crisis. Despitehaving only 0.06% of the total poor, the finance,insurance and leasing sector had the highest increasein the incidence of poverty which more than quadrupledfrom 1.2 to 5.2 per cent. This probably reflects thefinancial nature of the origin of the crisis in which this
sector was the hardest hit. Furthermore, the agriculturesector has consistently had the highest incidence ofpoverty as well as the highest contribution to the totalnumber of poor people during 1996 and 1999 (Table6). Therefore, it can be seen that agricultural sectorhas the largest number of poor people, even though itsshare of the national poverty has declined markedlyfrom 68.5 per cent in February 1996 to 58.4 per centin February 1999.

Part IV Chapter 17
242
Figure 96 Table on the Incidence of Poverty by Main Sector of Occupation (%)103
Employment Sector
February 1996 February 1999
Poverty incidence in Contribution Poverty incidence Contributioneach employment to total poor in each employment to total poor
sector (%) (%) sector (%) (%)
Agriculture 26.29 68.54 39.69 58.38• Trade, Hotel & Restaurant 7.96 8.10 17.63 11.13Manufacturing industry 10.69 5.71 22.92 7.71Civil, social & private services 5.73 5.72 13.13 7.36Transport and communication 8.85 3.32 24.02 5.58Construction 14.04 5.42 28.97 5.52Receiving/transfer 6.58 1.86 15.57 2.65Mining and Quarrying 15.34 1.01 29.81 1.00Others 13.29 0.10 32.00 0.27Finance, insurance and Leasing 1.24 0.06 5.23 0.23Electricity, Gas, Water 6.10 0.16 14.48 0.17
TOTAL 100 100
103 Source : M. Pradhan et. al.,June 2000, p. 20.104 Source : M. Pradhan, et. al., 2000, p. 21.
The incidence of poverty has a high correlation witheducational attainment. Those who can achieve ahigher level of education will have greater opportunitiesto get better jobs, and hence improve the welfare oftheir families. Based on educational attainment, theproportion of the poor with completed tertiaryeducation was only 0.41 per cent in 1996 and itincreased to 1.98 per cent in 1999. Whereas the total
number of the poor with only primary school education(completed and uncompleted primary school), showeda higher proportion in poverty. However in 1999 thosepeople with higher levels of education experienced anincrease in the incidence of poverty. This once againconfirms that the crisis affected more of the highlyskilled employment sector and people with highereducational levels than the unskilled sector and thosewith lower educational levels. (Fig. 7).
Figure 97 Table of Poverty Profile by Education Level of Household Head (%)104
February 1996 February 1999Education Levels of Head of Poverty Percentage of Poverty Percentage of
Household incidence total poor incidence total poor% % % %
Not Completed primary and illiterate 31.23 27.67 47.51 19.84Not completed primary but literate 21.63 36.09 36.68 31.82Completed Primary 15.03 30.15 29.66 35.34Completed Junior Secondary 7.04 4.80 16.85 7.61Completed Senior Secondary 2.44 2.19 8.59 5.05Completed Tertiary 0.41 0.11 1.98 0.34

Part IV Chapter 17
243
Concluding RemarksOverall, and perhaps surprisingly, there has, during thelast three decades, been significant economic growthin Indonesia and a steady decline in the incidence ofpoverty. While the estimates of the exact extent ofpoverty reduction have differed according to the useof specific poverty line concepts by the variousagencies and scholars, all estimates have yielded thesame finding, namely, that the incidence of absolutepoverty in Indonesia had indeed declined from the late1960’s through to the mid 1990’s. In fact, in acomparative study on the performance of a number ofdeveloping countries in alleviating poverty, the WorldBank concluded that during the period 1970-1987Indonesia had been the most successful among thedeveloping countries in reducing poverty.
However, with the severe contraction of the economyin late 1997, the related loss of jobs in the formal sectorand the subsequent movement to lower incomeactivities in the informal sector, hyperinflation andreduction in purchasing power have resulted in asignificant increase in the number of people below theofficial poverty line, in urban and rural areas.
With substantial financial assistance from the WorldBank, the Asian Development Bank, the UnitedNations Development Programme (UNDP) andindividual donor countries, the Indonesian governmenttook various measures to protect the poor from theworst effects of the crisis. The most notable initiativewas the introduction of Social Safety Net (SSN)Programmes, including temporary labour intensivepublic work programs in urban and rural areas, andpreserving the availability of key social services,including health and education. In addition, thegovernment has also responded to demands to protectthe poor from the adverse effects of rising prices byproviding price subsidies for basic foods, petroleumproducts, electricity and transport. Whilst these socialsafety net measures had some success in the shortterm as emergency measures to alleviate poverty ofthe people, they were unsuccessful in placing theIndonesian economy on a sounder footing. Inadequatetargeting and misadministration resulted in a significantamount of SSN funds intended for the poor being leakedto those in least need of support. Many of thesesubsidies such as those for fuel and rice remain in placeto the detriment of the economy and government budgetand some of these measures benefit the non-poor(petrol subsidy) and are inhibiting the development ofa targeted social assistance program for the poor bydiverting scarce government revenues to the non-poor.
Social Security in Indonesia
IntroductionAn overview of the social security system in Indonesiaincluding the organisation and responsibility of thevarious responsible agencies is discussed in Chapter1. This also describes s the core legislation,contributions, benefit programmes, eligibility andentitlements. Additional issues that are relevant toextension of social security coverage are discussed inthis section
Social Security Coverage of the GeneralPopulation in IndonesiaSocial Security is currently provided to a small minorityof the population with only about 13.5 million workerscovered by the Taspen, Asabri and Jamsostek schemesout of a total workforce of about 98 million people(including job seekers). This means that only about14% of workers are currently covered by mainstreamsocial security schemes. This excludes health insurancewhich has more extensive coverage by means ofgovernment, private and micro schemes. The main itemsof legislation that relates to the non-governmentworkers social security scheme and in particular torights and obligations of contribution to the schemeare shown below.
Health CareThe Jamsostek health care scheme covers workermembers, spouse and the first 3 children only. Article2(4) of Government Regulation No.14 of 1993 providesthat employers with their own private health careprovisions may opt out of the Jamsostek HealthInsurance component of the system if the benefits theyprovide for their employees are ‘superior to the basicHealth Care Package’. This has resulted in someadverse selection with better-paid workers more likelyto be covered by private (or employer-funded) schemeswith the lower-paid, more vulnerable workers coveredby Jamsostek. The risk pool is in consequence muchsmaller and with a lower level of funding than it shouldbe. The year 2002 estimate of the number of personscovered by the Jamsostek scheme was 2.7m persons(of whom 1.3 m were workers). The coverage of thepublic sector health care scheme (Askes) wasestimated to be 13.8m (plus 0.72 m ‘commercial’members). Thus only some 17.22 m people inIndonesia (with a population of 208 m) are covered bythe formal health insurance schemes — leaving 91.8%of the population excluded. Even adding in thosecovered by private health insurance, there areestimated to be 85% of the population excluded.

Part IV Chapter 17
244
Legislative FrameworkAct Number 3, Year 1992 on The Employees’ SocialSecurity.Article 1 of this act defined an employee as anyoneable to perform work including contract workers. Thedefinition of Employers in Article 1 provides forindividuals, associations, self-employed persons,managers of an enterprise and foreign persons,associations or representatives of foreign enterprisesin Indonesia. Article 3 (1) of this act conferred therights of social security to every employee and Article4 (2) made contributions mandatory, subject to furthergovernment regulations. The remaining articles of thisact defined the programs, contributions, benefits andoperation of the employees’ social security scheme.The definition of employer was further extended inArticle 2 which states that social undertakings andother establishments not in the form of an enterpriseshall be treated as an enterprise if such an undertakinghas manager(s) employing other persons as an
enterprise employs employees i.e. an employer-employee relationship.
Act 2, 1992 does not restrict the definition of anemployer to the formal employment sector i.e. toenterprises that are legal entities. The exact terminologyis “Any person, association, or legal entitymanaging….” This implies that any employer-employee relationship would in effect come under thejurisdiction of this act and not just legal entities. Itappears as though the current interpretation of the acthas restricted membership to formal sector enterprisesand statistics used to determine the contribution rateand compliance are based on the formal sectorenterprises that are legal entities. When Jamsostekstates a compliance figure of 40% it represents thepercentage of the formal sector and not the populationof eligible contributors. The actual contributioncompliance with the act is probably only about 15%105.
Figure 98 Enterprises by Employment Sector
Enterprises Number of Enterprises by Employee group size106
1 2-4 5-9 10-14 15-19 20+ Total
Enterprises with Legal Entity 14,027 65,130 62,034 27,138 14,324 56,755 239,408Enterprises without Legal Entity 10,017,217 6,209,313 481,650 67,123 27,060 8,615 16,810,978
Total Enterprises 10,031,245 6,274,441 543,680 94,257 41,380 65,370 17,050,386
105 Authors estimate based on about 60million workers in employee-employer relationships.106 Source data – Economic census 1996, Profile of establishments with legal entity. Whilst the absolute numbers may be dated and subjected
to the economic crisis of 1997, it is expected that the current relativities between enterprises would be similar.107 Authors estimate from Figure 13 and including the formal sector estimate of 190,000 and the informal sector employers with greater
than 5-9 employees.
The number of eligible employers (97,499) quoted byJamsostek is the approximate number of employershaving a legal entity (formal sector) with 10 or moreemployees (see figure 13 above). This ignores the totalpayroll of Rp. 1 million which, if included wouldprobably introduce all of the employers with 5-7employees and most of the group with 2-4 employees.Annex 13 contains a table showing the average salaryfor contributions by age group. Under the currentadministrative arrangements at least 190,000 employersshould be making compulsory contribution to theJamsostek schemes. However the real potential underthe existing legislation (i.e. all employers regardless oflegal status) is at least 500,000 employers107.
Regulation Number 14, Year 1993 on theImplementation of the Employees’ Social SecurityProgramme.This Regulation reduced the obligation of employersto register their employees in the social securityscheme only to those employers with 10 or moreemployees and a monthly payroll of not less than Rp.1 million. The elucidation section of the Laws andRegulation manual indicates that the intent was toprovide social security coverage to all employees butimplementation was to be progressive and the firstcompulsory stage was the 10 employees or Rp. 1million rule. However it did not remove the provisionfor voluntary membership to the scheme for allemployees. The regulation also introduced the opt-outclause on health insurance for those employers whoprovided equivalent private insurance for theiremployees.

Part IV Chapter 17
245
In accordance with the existing legislation all workersare entitled to be voluntary members of the Jamsostekscheme but this option is rarely exercised. Jamsostekhas considered the recruitment of voluntary contributors(including informal sector workers) but at this stagethis is confined to a model based on the existingprograms and contributions calculated on the nationalaverage contribution salary. It is unlikely that membersof the informal sector would be prepared, themselves,to contribute up to 13.2% of the national averagemonthly salary when formal sector employees onlycontribute 2% of their wages (the remaining 11.2% iscontributed by the employer).
Act No. 7 of 1981 Obligatory Report of EnterprisesThis act requires all enterprises to register with theDirectorate of Labour Inspection in Depnakertrans.Under the decentralisation arrangements,thisresponsibility now rests with the Disnaker or districtoffices of Depnaker that are under the control o pProvincial administrations.
Piece Rate and Contract workers.
One of the major areas of non-compliance with regardto Act No. 3 of 1992 is due to employers declaring ethat workers employed in their enterprises are piece-rate (day to day basis) or are contractors and as suchare not insurable under the social security scheme.Although this is common practice, it is not consistentwith the legislation: the definition of Employee in theact is “Employee means any person able to performwork whether under contract of employment or notto produce services or goods to meet the needs ofsociety”. Furthermore, although there are numerousreferences in the Act and in the Regulation about piece-rate and contract workers that make it clear that theintention of the legislation is for them to be included inthe Jamsostek scheme. Relevant examples are:• Article 8 of the act deals with Employment
Accident Insurance and in the elucidation it states“Contractor who is not an employer isconsidered to be working for the employer whocontracts the job”.
• Elucidation of Article 4 clarifies the meaning of anemployee as anyone “working in employment asan individual or an enterprises and who receiveswages, including daily, casual, and contractualworkers……”
• Article 1 of Regulation No. 14, 1993 in paragraph 3defines how the income for daily workers,contractual, piece rate and seasonal workers areto be calculated.
It is thus evident that there is a statutory obligation onemployers to enrol their casual, piece rate and contractworkers. It is also evident that without an effectivecompliance regime the common practice of excludingthese workers will continue.
Other Legislative Considerations
There are other legislative provisions that relate toliability for social security contributions that should beexamined. An example is social security contributionsfor employees of Diplomatic Missions that arecontained in the Vienna Convention on DiplomaticRelations, 1961. Article 33. This convention providesfor local staff that are employed by diplomatic missionsincluding agencies such as the United Nations missionsand projects are subject to the local laws on socialsecurity contribution. This convention would also applyto all of the international missions in Indonesia. Whilemost Diplomatic Missions provide some social securityprotection for their regular, national employees duringthe term of their contracts, employees on short termcontracts may benefit from only minimal, short termcover or no cover at all - leaving such workersvulnerable when their contracts end or even while theyare actually still employed. A more in-depth study ofcompliance with conventions such as this one shouldbe included as part of any extension of social securitycoverage.
The Employment Sectors in Indonesia
In the context of social protection, it is perhaps usefulin Indonesia to divide employment into three categories– those who work in registered formal sectorenterprises with a legal entity, those who work in theinformal and unregulated economy and those whowork in agriculture. . In this study, the focus is primarilyon those who work in the urban informal sector.
BPS Statistics for the year 2000 shows the followingdistribution of workers by sector and industry.

Part IV Chapter 17
246
Figure 99 Workers by Sector and Industry 2000
Main Industry
Formal Sector Enterprises with Informal Sector Enterprises Totallegal entity without legal entity Population
Workers % of Main % of Workers % of Main % of > 15 whoIndustry Work Industry Work worked
type Force type Force
Agriculture, Forestry, 8,001,712 19.67109 8.91 32,675,001 80.33 36.37 40,676,713Hunting and Fishery108
Non Agricultural Sector110
Mining & Quarrying; Electricity 3,418,314 85.04 3.8 601,478 14.96 0.67 4,019,792Gas & Water Supply;ConstructionManufacturing Industry 5,350,315 45.96 5.96 6,291,441 54.04 7.00 11,641,756Wholesale & Retail Trade; 2,753,363 14.89 3.06 15,735,642 85.11 17.52 18,489,005Restaurants andAccommodation ServicesTransport, Storage & 2,272,374 49.9 2.53 2,281,481 50.1 2.54 4,553,855CommunicationFinancial Institutions; 7,701,961 73.66 8.57 2,754,648 26.34 3.07 10,456,609Real Estate, Rental Services &Other Services
Total Non Agricultural Sector 21,496,327 43.73 23.93 27,664,690 56.27 30.79 49,161,017
TOTAL (all sectors) 29,498,039 32.83 60,339,691 67.17 89,837,730
108 These Agricultural sector figure for formal workers has been derived from BPS Catalogue 3404, Labourers/Employees situation inIndonesia August 2000 Table 13.5 which shows the total number of employees and the tables shown in the other footnotes in this table.The informal workers figure is the remainder of the agricultural sector.
109 This derived figure is slightly higher than other estimates which place the % of formal agricultural workers at about 15 -16%.Agricultural workers statistics are at best, estimates due to difficulty in census.
110 The total employment figures are from the BPS website tables dated 18 September 2002 for Population 15 yrs and over who workedby main industry 1997, 2001 and the table represents the entire workforce less unemployed. The informal sector tables are from BPSwebsite SME Statistics Table 3 Number of Employees of establishments without legal entity by industry. The formal sector figures arederived from the informal sector total.
111 Definition from - BPS 1996 Economic Census, Profile of Establishments With Legal Entity
The Formal Employment SectorThe formal sector represents the more administrativelyvisible part of the economy and society, namely thepublic and private corporate sector and comprisesenterprises and the professional self-employed thathave been accorded legal status and are regarded aslegal entities. 5.1.2 This legal status is accorded throughregistration by professional associations, Ministry ofManpower and the Ministry of Trade and Industry etal. As legal entities the enterprises are subject to labourlaws administered by Ministry of Manpower and tothe ILO conventions that have been accepted byIndonesia. The formal sector comprises about 2 millionemployers (including self-employed) and 29.5 millionemployees or 32.83% of the total workforce.
The employment sectors in Indonesia are measuredby the Busan Pusat Statistik (BPS), the National
Statistics Bureau in a National Economic Censusconducted every 10 years and modified annually bystatistical returns from employers and targeted surveysof selected sectors of the economy. The basis for theclassification of enterprises is the Legal Entity,described as:- Legal status of a company/unit ofeconomic activity based on the legal documentissued by a solicitor when the company wasestablished. Legal status could take the form ofPN/Perum/PT/Persero/Perusahaan Daerah (PD),PT/NV, CV, Firma, Koperasi and Yayasan(Foundation)111. The 1996 Economic Census alsoconsiders companies having other types of the followinglegal documents as having legal status: SIPD (forquarrying of C class), Diparda, Governor/Bupati/Mayor permit (for restaurant/food stall,accommodation services/hotel, recreation services,entertainment and cultural services, Ritsblaad/Staatblad

Part IV Chapter 17
247
and Governor/Bupati Decision (for financial services).Definitions and descriptions of these various legalentities are contained in the glossary.
The Informal EconomyIn Indonesia the informal economy could be morecorrectly titled the urban informal economy as (BPS)usually separates it from the other traditional elementin the informal economy, the agricultural sector. Theurban informal sector comprises those individuals andemployers who have not been accorded legal statusbut who have commenced their operations oftenwithout the sanction or knowledge of the localauthorities (e.g. cottage workers). Many enterprisesin the informal economy may be registered with localauthorities and finance regulators such as the Ministryof Finance or the taxation office but have not beenaccorded legal status under the definition of legal entityby BPS.
It was believed that growth in Indonesia’s industrialsector would trickle down to the traditional sectors ofthe economy. Instead, urban industrialisation has tendedto widen structural inequalities between the handful ofleading sectors and the rest of the economy. With theILO concluding in the 1970’s that the informal economywas both efficient and profitable, there emerged theview that it should be promoted as a strategy to tacklestructural inequalities and to meet the basic needs ofthe poor. Continuing rural-urban migration and theeconomic recession in the early 1980’s and again inthe late 1990’s reaffirmed the importance of theinformal economy in terms of work and incomegeneration.
While the formal economy has a tendency to producejobless growth, the informal economy continues toabsorb the bulk of the estimated 2.4 million job seekerswho annually enter the labour market. These jobs are
created with little capital and without any subsidy fromthe State. These informal enterprises often rely onindigenous resources, including re-cycled materials, andproduce predominantly for local markets. Theentrepreneurs mobilise their own financial resourcesvia family networks, savings clubs and rotating creditsystems. Accommodation for newcomers is providedand training given on the job. Many workers in theinformal economy also maintain strong ties with theirplaces of origin and often foster plans to return. Urbanto rural remittances, particularly on Java, occur on avery large scale and for many village households thiscapital flow has even become the major source ofhousehold income.
There is a tendency to associate such informal sectoractivities with poverty. While it is true that manyworkers in this sector are poor, it cannot be assumedthat earnings are necessarily lower than formal sectorwages. Anecdotal studies suggest that incomes arenot always lower than in the formal economy and thecase study of Ojek drivers conducted as part of thisstudy confirmed that they can earn from 2 to 3 timesthe average national wage. The findings from the small-scale survey conducted as part of this study showedthat 58% of those surveyed earned less than theaverage of Rp. 400,000 per month and that 17%earned over Rp. 800,000 which is twice the nationalmonthly average.
Apart from generating work and income for a largeproportion of the urban population -60%, of totalemployment, the informal economy is also a majorsupplier and distributor of basic services and needssuch as water, food, clothes and shelter. In urban areasthe self-built housing sector meets a substantial amountof housing needs. Without the informal sector themajority of the urban population would have difficultysurviving in the city.

Part IV Chapter 17
248
Figure 100 Table of Comparison between Formal and Informal Economy
FORMAL ECONOMY
Description• Employee of large firms and in many cases multinational
firms• Covered by labour laws and regulations• Generally capital intensive enterprises with relatively few
workers, mechanised, often use expensive raw materials• A guaranteed standard in the final product• Employment conditions mostly regular hours & low
wages• Fixed prices• Employment mostly in factories• Government and multinationals help to establish and
maintain operations• Legal entities registered with appropriate government
and local agencies• Employs predominantly males
Type of employment• Typically manufacturing sector employment, both local
and in multinational industries, mining, oil• Government employment such as the police, military and
civil service• Service sector in offices, hotels, sales and administration• Self-employed professionals in medicine, law, accounting
Advantages• Generally have access to unions and staff associations• Less susceptible to corruption and standover tactics• Uses some skilled and many unskilled workers• Access to compulsory social security• Provides permanent jobs and regular wages• Produces goods (like cars and food) for the emerging
middle classes so that profits may remain within thecountry
• Waste materials provide raw materials for the informaleconomy
INFORMAL ECONOMY
Description• Self-employed• Small scale/family enterprise• Little capital involved• Labour intensive with use of very few tools.• Using cheap or recycled waste materials• Often a low standard in quality of goods• Irregular hours and uncertain wages• Prices rarely fixed and so negotiable (bartering)• Jobs often done in the home (cottage industry) or on the
streets• Little or no government assistance• Often outside the law (illegal)• Employ mostly females and children
Type of employment• Distributive-street peddlers and small stalls• Local transport• Small scale manufacturing such as wood, metals, textiles,
carving etc• Services, selling food, clothes and fruit• Small scale industries such as food processing, tailoring
and furniture repairs etc
Advantages• Employs many unskilled workers• Jobs may provide some training and skills which might
lead to better jobs in the future• Any profit will be used within the city or remitted to the
rural areas• Uses local and waste materials–the products will be for
local use by informal sector, the lower paid people
Disadvantages• Often not protected by local labour laws and regulations• Little access to loans or grants• Generally no access to unions or associations• Subject to corruption and coercion by unscrupulous
authorities and individuals
The key definition of informal employment in Indonesiais the same as in about 21 other countries, that ofunregistered enterprises or enterprises without legalstatus. The composition of the informal sector inIndonesia has been categorised into the following
industry groupings by the National Statistics Bureau(BPS) in its statistical tables titled Small Scale andMicro Establishments, which it believes equatesroughly to the urban informal employment sector:

Part IV Chapter 17
249
Figure 101 Industry Groupings in the Informal Economy
Urban Informal Sector Agricultural SectorMining & Quarrying, Electricity, Gas, Water Supply & Construction Animal HusbandryManufacturing Industry Food CropsWholesale & Retail Trade, Restaurants & Accommodation Services HorticultureTransport, Storage & Communication FishingFinancial Institution, Real Estate, Rental & Other Services Forestry
Figure 102 Composition of Employment in Indonesia in 2000112
Employment Category Males Females Total(Millions) (Millions) (Millions)
Formal SectorEmployers 1.608 0.424 2.032Employees 19.788 9.710 29.498
Sub total Formal 21.396 10.134 31.531Informal SectorOwn Account Workers 13.222 6.279 19.501Self Employed with assistance 16.128 4.592 20.720Unpaid workers 4.692 13.393 18.085
Sub Total Informal 34.042 24.264 58.306Total Employment 55.439 34.398 89.836
112 Source. Labour Force Situation in Indonesia August 2000. Tables 13.3, 13.4 and 13.5
Government Stakeholders in the InformalEconomyThe government has long recognised the significanceof the informal sector and its importance to theeconomy, employment and the self-sufficiency of aconsiderable proportion of the population. There are anumber of government agencies that have programmesdirected at the informal economy and theseprogrammes range from policy development to fieldcontact with workers and groups of workers. The
following schematic displays the complexity andnumber of agencies that relate to the informal economy.It should be noted that this represents the view of thenational ministries and most of these have provincialand local elements that are involved with the provincialgovernment programmes that complement the nationalprogrammes. Some of the agencies that werecontacted during this study were responsible fordeveloping the informal economy and a summary ofsome of their activities is set out below.
Figure 103 Government Stakeholders in the Informal Economy

Part IV Chapter 17
250
Ministry of Cooperatives and Small and MediumEnterprises
The study discussed the role of the Ministry (C&SME)at provincial and local level in Bandung and Yogyakartaand their role was to support and promote thedevelopment of work cooperatives in the region. InWest Java there are about 7 million single entityproduction centres and some of these have beenencouraged to develop into about 16,000 cooperatives,60% of which are from the informal economy. In thepast, the role of C&SME was to sponsor cooperativesand to provide capital, support and training to thecooperatives. The promotion of cooperatives is basedon the following principles:• Individuals with similar activity;• Same needs such as sales, marketing and customers;• Similar products; and• Easiest cooperatives to form are those based on
geography and needs.
The role of the ministry at regional level (DinasKoperasi) has now changed from involvement ininternal cooperative development into a support andmonitoring role and the close relationship withcooperatives is confined to the local (district) level.The role of the District offices is to promote SME’sand to assist in the development of cooperatives,provide training and education for SME’s and toarrange for revolving funds and financial assistancefor cooperatives and SME’s. In many provinces theDinas Industry and Trade has been integrated withDinas Koperasi.
The identification and cataloguing of cooperatives byC&SME has the potential to be of assistance in anyinformal sector social security scheme. Theidentification and location of cooperatives is an essentialfirst step in the process of marketing and ultimatelycoordinating the collection of contributions andassistance in the administration of any scheme.
Ministry of Industry and Trade
The role of this ministry at the national level is toimprove the quality and output of informal economyenterprises, but it appears that this in not translatedinto local programmes. Like many other ministries, thelocal control and priorities are exercised by the regionaladministrations and vary widely across the country.The Dinas regional offices visited indicated that theycurrently have no active programs to assist the informal
economy enterprises. However, they will supportenterprises that request assistance in the areas ofmanagement training, extension of services, formationof groups, and building relations with other marketstakeholders. At this point in time there is very littleinteraction between the ministry and informal sectorenterprises, but this may not be representative of all ofthe provinces in Indonesia.
Ministry of Manpower and Transmigration
The Dinas Tenagakerja offices (Ministry ofManpower regional level) that were visited as part ofthe study did not have any specific programs targetedat the informal sector although they were aware ofthe importance of the informal economy in theemployment of people and alleviation of poverty. Theirmain social security focus is on the maintenance andextension of formal sector participation in theJamsostek scheme, of which they receive numerouscomplaints about the service delivery and in particularthe local health services. The Dinas has assistedinformal sector workers in the past through specialfunded programmes such as health assistance for foodvendors and accommodation for migrant workers.There are no special programmes currently operatingdue to lack of funding. The Dinas suggested that futuresocial security programs for informal sector workersshould include stakeholders from the InformalProfessional Group (Paguyuban) and the provincialMarket Office (Dinas Pasar).
Private Sector Involvement in InformalEconomy
This study identified a number of institutions and NGO’sthat have been closely associated with the informalsector and some of the agencies included:• Islamic micro foundation;• Bumiputra and Bumiasa (insurance companies);• Trade Unions;• Bina Swadaya (Self Reliance Development
Foundation);• Many hundreds of other NGO’s like Binadaya
Nusaindah and Assuransi Jiwa; and• International donor organizations.
An overview of the organization and operations of BinaSwadaya has been included in the box on page 62 asan example of the roles and capacity of NGO’s thatwork extensively with workers in the informaleconomy.
Part IV Chapter 17
251
Relevant Trials and Pilot Studies inIndonesia
Social Protection of Home workers in IndonesiaThis was an ILO-Danida sponsored project supportedby Bina Swadaya NGO to introduce the concept ofsocial protection to women home workers. The trialswere initially conducted in villages in East Java overthe period 1988 – 1996. Until this time most NGO’sconcentrated almost exclusively on employment andincome promotion schemes for informal sectorworkers. The project objectives were to:• Raise the NGO’s awareness of social protection for
home workers as a development goal together withemployment promotion;
• Assist women home workers to identify their needsand to enable them to obtain better working conditions;and
• Enable women to advocate for social protection.
The project, through Bina Swadaya, developed a newsocial protection oriented training programme basedon the successful action project undertaken by a localNGO (Yayasan Pengembengan Pedesaan or YPP) inthe villages of Gondang and Sidoarjo in East Java. Thecompleted training program and manual containedmodules on social protection concepts, design ofprograms, implementation based on the development,maintenance and management of self-help groups. Thistraining programme was then administered to 162 NGOstaff from 137 organizations in 15 provinces inIndonesia.
The project reported on four major programmes itconducted for home workers in Jelambar Baru in EastJakarta, Batik workers of Bayat in Yogyakarta, SunterAgung in North Jakarta and Godang in East Java. Theimmediate objectives of these projects were to:• Create self-help groups;• Raise awareness of household income management,
health and the law,• Improve work skills;• Develop group ability to manage their own social
security; and• Develop networks between the group and local health
facilities.
Constraints and barriers identified by the projects thathad to be overcome included the unwillingness to repayloans, individualism, live-for-the-day attitude, irregularityof incomes, lack of organization and work skills, lackof creativity and financial constraints.
The project found that the labour issues and socialprotection were closely linked and successful incomegeneration improved the affordability of contributions.Most of the social protection developed as part of thesetrials, however, was through local cooperative schemesmostly within the group. They lacked the cover forrisk and there was limited capacity to create poolingof funds. The projects achieved varying degrees ofsuccess and in all cases the increased awarenessenabled worker and their groups to negotiate improvedworking conditions, better salaries and to be able toutilize existing facilities, laws and local resources.Access to loans, health care and cover for injury anddeath were improved but limited to the capacity withinthe group. A larger risk pool is required if benefits areto be improved and contributions to be affordable.Sustainability was improved by maintenance of thegroups and regular visits by facilitators. Thesustainability could have been further improved bysubsidization of some of the social insurancecontributions.
Trade Union Support for Informal Sector Workers
This project was essentially an education programtargeted at senior trade union officials, workers’educators and informal sector workers. The projectwas conducted over a three-year period from 1998 to2001. The immediate objectives of the project wereto:• Strengthen the capacity of trade unions to incorporate
informal sector workers;• Enable informal economy workers to establish links
with formal sector institutions; and• Enable informal economy workers to be able to exert
more influence on national policy to provide accessto services such as workers training, education andtrade union medical and legal services.
The project conducted a number of activities over theperiod including case studies, workshops, seminars fortrainers, developed training materials, conducted studycircles and distributed campaign materials.
The project was successful in raising the awarenessof the issues and an initial increase in trade unionrecruitment although this surge of new membershipdoes not appear to have been sustained. Some successhas been obtained in obtaining private insurance coverfor informal sector members through trade unionnegotiated policies with private insurance companies.Establishing permanent links with social securityschemes, training institutions and health insurance

Part IV Chapter 17
252
schemes has been more difficult. Most unions suffersimilar constraints to government organizations whenservicing the informal sector in that they do not haveresources to reach out to individuals and experiencedifficulty in marketing the role of unions, collection ofunion dues and maintaining contact with members.
Discussions with some union federations has confirmedthat most do not have well developed informal sectornetworks and would be unable to assist in the collectionof contributions for any social security scheme.However unions are keen to support any initiativesand are potential partners in the strengthening of localself-help groups.
Klaten Trial for Health Insurance113
A summary of the experiences of the field trial of theintegrated healthcare strategy conducted in Klaten,Central Java during the period 1994-98 has beenincluded to demonstrate the lessons that may beapplicable to this study on extending social securitycoverage to the informal sector. It should be notedthat health insurance for the informal sector was onlya small component of the Klaten trial that also covereddelivery of health services and only the findings relevantto this study will be presented here.
One of the few innovations attempted in the Klatenproject was to establish a members’ cooperativesimilar to that of small business health insurancepurchasing cooperatives in other countries. Primarylevel cooperatives (farmers, craftsman, vendors, etc.)would join a dedicated secondary level cooperative forthe purpose of purchasing health insurance. Byproviding a large, pre-enrolled group and a single pointof premium collection, the cooperative could negotiatelower premium rates and stimulate competition for theirmembers. There is a strong cooperative movement inIndonesia estimated at over 86 million people (includingfamily members).
The Health Insurance Members Cooperative createdas part of the trial continues to function more than 4years after external assistance ended. Much of theinitial membership was reportedly lost subsequent tothe end of the project apparently due to the economic
conditions. Recent reports indicate that they are slowlyre-expanding their membership and have establisheda new branch office in central Java.
Market research in Klaten was conducted in 1996 aspart of the social marketing effort and consumers weresurveyed concerning their views and some of theircomments were:• In general, the majority of respondents preferred
private healthcare services to public despite theincreased costs. Long queues and poor service werethe most numerous complaints about the publicsystem;
• The majority of both Askes and Jamsostek memberwere not familiar with the details of the benefits oftheir schemes or even what percentage of theirwages was deducted;
• Contributions were regarded as just another tax;• Few of the dropouts from JPKM left due to
dissatisfaction but rather to misinformation andadministrative failures; and
• Almost all respondents expressed a willingness torejoin though some with the proviso that the schemeneeded to be more professionally managed.
Worldwide experience indicates that enrolment of theinformal sector in compulsory healthcare financingschemes is very difficult. Based on the complianceproblems of Jamsostek with large formal sectoremployers, the prospect of exacting compliance ofcompulsory contributions from the informal sector isvery small. In Klaten, enrolment of the informalsector on an individual or family basis resulted inthe failure of the government sponsored healthinsurance program DS-JPKM.
Organization of the informal sector through theformation of health benefits cooperatives or otherorganizations can provide the economies of scalenecessary to provide affordable coverage.
Insufficient and inconsistent enforcement is a systemicproblem in Indonesia and by no means limited to thehealth sector. Without effective enforcement ofregulations, healthy competition and growth cannot berealized.
113 The trial was part of a seven year assistance program on health care reform sponsored by USAID and supported by the govt ofIndonesia through Ministry of Health, World Bank and ADB. Full details of the trial are available in a study titled Health Sector Financeand Klaten Health Care Trial Revisited; produced as part of this project, the ILO Project INS/00/M04/NET, Reform of Social Securityin Indonesia
Part IV Chapter 17
253
Ministry of Social AffairsThe Ministry of Social Affairs is promoting socialinsurance for informal sector workers who are notcovered by Jamsostek schemes. This program had itsorigins in a trial that was conducted in 7 provincesduring the period 1996 –1999 by the then Ministry ofSocial Welfare, which was disbanded in 1999 underthe reforms of the previous administration. The newMinistry of Social Affairs was established under thecurrent administration in 2001. Unfortunately thedetails of the trial and outcomes are not available anda final report was not completed before the originalMinistry was disbanded.
The trial was commissioned to provide revolving microfinance to self-help groups of informal sector workersthat were created in the selected provinces. Insuranceagainst loss of income as a result of injury andaccidental death was also provided as part of the trial.The NGO Yayasan Budi was appointed in conjunctionwith local organizations to establish, train and managethe groups and to collect contributions and repaymentof the loans. The service was targeted at rural workersand fishermen who were not eligible for Jamsostekmembership.
The Ministry plans to commence a new schemeASKESOS (Assuransi Kesejahteraan Sosial), avoluntary savings scheme that will operate in 15Provinces over a 3 year savings and insurance period.The process will involve collection of contributions fromthe groups by the NGO field officers and these will bedeposited in a Bank BRI account. Members will beable to receive payments in the event of injury(maximum once per year) and in the event of death ofthe member. The expected claim rate is about 10% oftotal membership each year. The national governmentis expected to provide guarantees to the insurancecompanies for the performance of the fund.
A separate trial is also to be conducted in theKarawang Regency in East Jakarta to provide socialinsurance through private insurance companies(Binadayan Nusindah and Assuransi Jiwa). Theprocess will feature a photograph identity card for eachmember that will be used to make claims against thepolicy. This trial is expected to commence sometimein 2003.
The local offices of Social Affairs (Dinas) that werevisited were unable to assist in any social securityprogram for informal sector at this stage. With the re-establishment of the Dinas only one year ago, the
support to the informal sector is restricted to trainingand education on request.
International Experience in Extending SocialSecurity to the Informal Sector
There have been a number of international trials andprojects aimed at extending the existing formal socialsecurity systems into the informal economy and in thisstudy some of the outcomes of those trials wereexamined for relevance to the situation in Indonesia.A summary of the schemes that were considered isshown in the table in Annex 27.
In most developing countries about 10 - 20% of theworkforce is covered by formal social securityprograms, another 30 – 40 % live below the povertyline and the remaining 40 – 60% above the povertyline but not contributing (or entitled) to social securityschemes. In Indonesia about 13.2% of workers arecontributors and 37.5% live below the poverty line.
The selected studies in Annex 27 show that theschemes are targeted at either the poor (SocialAssistance) and the informal economy workers (SocialInsurance) and that great emphasis is placed ondeveloping self-help groups as the basis for theorganisational models for these schemes. It can alsobe seen that in most schemes the government has asupporting role in terms of promotion, guarantor of somefunds and contributor of subsidies in other cases. Inalmost all of these schemes international input has beenprovided for policy design, governance and in somecases to provide direct subsidies to promote andmaintain the schemes. The other major stakeholdersare various NGO’s, cooperatives, trade unions andprivate insurers.
Additional research on the selected studies and otherprograms in India, China, Benin and Tanzania showsthat typical characteristics of social protection programsfor workers in the informal economy are as follows:• All of the programs are voluntary and it is very difficult
to administer compulsory membership to theschemes;
• Benefits and contributions are tailored to the needsof the individual groups who decide on their priorities;
• Programmes are flexible and offer a range of benefitsoptions with contributions that reflect the affordabilityrange of the target groups;
• Aggregation of groups is essential to achieve acritical mass to minimise risk, maximise efficiencyin collection of contributions and payment of benefits;

Part IV Chapter 17
254
• In most cases some form of re-insurance or poolingof funds is essential if the schemes are to be coveredfor unforeseen risks and be sustainable in the longterm;
• In some instances governments have accepted theirresponsibility for social security by providingcontribution subsidies for some elements of insuranceand in guaranteeing the funds against high risk (e.g.natural disasters etc);
• Most schemes relied on some form of partnershipwith private insurers or banks to provide the rangeof services; and
• Service delivery was usually provided by specialagencies focused on the particular scheme or byNGO’s supervised by a government agency.
Findings and Options
Introduction
This study into progressive extension of social securityeligibility to the wider population examined the optionsfor extension of eligibility to the excluded formal sectorworkers, the needs of workers in the informal economyand the needs of overseas migrant workers. Theinformal economy by its nature is difficult to quantifyand categorize and there is a limited availability ofstatistical data about workers. The study aimed atcategorizing workers in the informal economyaccording to their status and their social protectionneeds and examining the feasibility of providing themwith relevant social security benefits. The three maincategories for extension of social security eligibilityconsidered in this study were:• Formal sector workers within the scope of existing
laws and regulations but in practice excluded by non-compliance
• The urban informal sector, and• Overseas Migrant Workers.
Given the limited time for the study and the variednature and geographical distribution of the agriculturalsector of the economy it was decided to focus primarilyon the urban informal sector. It should be noted,however, that there is scope to consider elements ofthe agricultural sector in future programmes especiallyfor those workers included in cooperatives and groupschemes that show potential for consolidated groupcontributions and claims for benefits.
Extending Coverage of Formal SectorThe original purpose of Regulation 14 of 1993 seemsto have been to limit the pool of eligible employers toallow the Jamsostek organisation to develop its capacityto administer and enforce a manageable base ofcontributors. This process of progressive expansionof coverage to smaller and smaller enterprises is usedelsewhere in the world. However in Indonesia, overtime and with inflation and salary increases the totalpayroll limitation of Rp. 1,000,000 has lost itseffectiveness, so much so that it is now technicallyand legally compulsory for about 90 - 95% ofemployers to make contributions. Now that Jamsostekis well established and has had almost 10 years ofoperation as a Persero, exclusion for only about 5 -10% of the employers no longer has any significance.It is therefore appropriate to repeal the regulation, sinceit is only a source of confusion amongst employersand employees. Furthermore, it also encourages theunderstatement by employers of the total payroll toevade contribution liability, to the disadvantage of manymembers of the workforce.
The State Guidelines for 1999 – 2003 and the NationalDevelopment Programme both envisage the extensionof compulsory social security contributions toJamsostek to all enterprises in Indonesia. The onlylegislative change necessary to achieve this extensionwould be the repeal of those provisions in Regulation14 of 1993 that restrict compulsory contributions toenterprises by staff size and total payroll.
Figure 104 Distribution of Formal Sector Enterprises
ElementFormal Sector Enterprises and Number of Employees114
1 2-4 5-9 10-14 15-19 20+ Total
Number of Enterprises 14,027 65,130 62,034 27,138 14,324 56,755 239,408% of total 5.86% 27.20% 25.91% 11.34% 5.98% 23.71% 100.00%
114 Source data – Economic census 1996, Profile of establishments with legal entity. Whilst the absolute numbers may be dated and subjectedto the economic crisis of 1997, it is expected that the current relativities between enterprises would be similar.

Part IV Chapter 17
255
Compulsory membership of the social security schemefor all formal sector employees would simplifyadministration, compliance and marketing of thescheme and an acceptable contribution compliance rateof better than 80% could potentially increase thecoverage of employees from about 13.5% to about30% of the total workforce.
The findings from the surveys and from generalobservations show that in addition to a continuingimage problem for Jamsostek, there is a widespreadlack of understanding amongst employers andemployees about social security in general and thecontribution requirements to Jamsostek in particular.
Extending Coverage within the ExistingLegislation
As discussed in Section 4 of this Chapter, the existinglegislation and regulations requires all employers insidethe 10 employees and Rp. 1,000,000 rule to contributeto Jamsostek. There is no distinction between formalor informal employment sectors. Many of theseenterprises may be cooperatives or associations thatemploy staff and these are clearly covered under thedefinition of an employer and are liable to contributeto the scheme.
The potential coverage of Jamsostek is considerableand it can be seen from the table in Figure 19 thatenforcing the existing legislation could cause about 75%of the workforce to be covered.
Non Compliance with Existing Legislation
The degree of non-compliance with the existinglegislation and administrative arrangements issignificant, with only about 32.5 % of eligible formalsector employees contributing to the scheme. Thereis virtually no voluntary compliance among enterprisesexcluded under the law and employees of suchenterprises represent about almost 70% of theworkforce. The major barriers to contribution aregeneral ignorance of social security provisions andrequirements,, an adverse perspective of Jamsostekand a lack of commitment to compliance byDepnakertrans and Jamsostek, compounded by limitedcapacity.
Jamsostek Performance and Service Standards
The observations made in relation to Jamsostek’s overallperformance were obtained from discussions withemployers, employees, unions and staff about thereasons why people did not wish to contribute toJamsostek schemes. These views have been supportedby the survey of workers undertaken as part of thisstudy. Some of these perceptions about Jamsostek are:• Some people considered that Jamsostek benefits are
too low given the amount of contributions they paid;• Cost of the programmes are too high and represent
a significant reduction in wages (about 80% ofemployers choose to opt out of the health insuranceprogramme),
• Payments are not indexed and lose their relative valueover time;
• The share of profits (dividend) paid to the governmentwas seen to diminish the amount of benefit that shouldbe paid to the contributors,115
• Low public confidence in the administration;• Perception that government influences investment
decisions and that in the past unwise decision oninvestment have been made, further reducing returnsto contributors;116
• The level of knowledge about Jamsostek and itsservices among employers and employees is low andsome employers believe that contribution is voluntary;
• Jamsostek is not seen as always providing very goodcustomer service with limited access across thecountry, particularly in remote areas and slowresponses to enquiries and payment of claims; and
• Restrictions on the investment portfolios andstrategies available to Jamsostek that are confinedto Indonesia and are dependent on the financial stateand lower investment returns in the local economy.
Many of these perceptions and complaints are beingaddressed by the current administration as reflectedin the extensive re-organization of Jamsostek that hasbeen implemented over the past year. Other issuesare being addressed by the proposal to amend thelegislation to convert the existing provident fund to atrust fund managed by a tripartite board of trustees.This proposal will change the management status ofJamsostek from a Persero to a non-profit orientatedpublic company such as a Badan and the removal ofthe dividend (taxation) liability should increase the return
115 The dividend payment to the government (as the sole shareholder in Jamsostek) is only made in respect to the Work Injury, Death andHealth Insurance programs. The Retirement provident fund (by far the largest program) is exempt from tax or dividends.
116 Actual investments returns are reasonable given the requirement to invest only in Indonesia, but the returns are generally not muchbetter than the inflation rate.
Part IV Chapter 17
256
to members by higher compounding of interest. Thisproposal was presented to the Parliament in early 2002and is still under consideration.
Compliance Process
The ILO considers that compliance is one of the keyfundamental operations in the administration of a socialsecurity system and together with fraud minimizationare key elements in the equality principle of targetingsocial security payments to those most in need.Compliance was seen as the key to better overallperformance of the fund as higher contribution rateswould result in higher returns to members and serveto spread the risk across a wider group of membersand minimise adverse selection in critical programmes.It is most unlikely that extension of social securitycoverage can be achieved without a significantimprovement in the performance of the complianceprogramme in Jamnsostek/Depnakertrnas. The ILOis proposing is an inspectorate force with linemanagement at Jamsostek branch and regional levelwith policy direction from Head Office. Full details ofthe background to compliance and the proposals arediscussed in Chapter 1.
RECOMMENDATION
Extension of Social Security to Remaining FormalSector Workers
To increase Jamsostek membership from the current32.5% of potential formal sector employees to at least80%, the following initiatives would be required:• Extend compulsory coverage to all formal sector
enterprises by repealing the sections of Regulation 3of 1993 that restricts coverage to enterprises with10 or more employees or a monthly payroll of morethan Rp.1,000,000;
• Review the definitions in the Act No. 2 of 1992 toreinforce the provisions for employer/employeerelationship as the basis for compulsory contributions;
• Improve benefits to members by changing the statusof Jamsostek from a Persero and removing itsliability for tax;
• Improve the image of Jamsostek by changing itsstatus to a trust fund managed by a tripartite boardthereby limiting the degree of direct governmentcontrol over investment of funds;
• Increase community awareness of social security,the features of Jamsostek Baru and the obligationsof all employers by a targeted marketing strategy;
• Increase contribution compliance by transferring theauthority for enforcement from Depnakertrans toJamsostek and the establishment, training andimplementation of a national compliance strategy;and
• Improve Jamsostek efficiency by implementing therecommendations about operations and IT shown inparagraph 6.10.7 and in the report Review ofOperations and Information Technology inJamsostek.
Informal Sector Findings
IntroductionThis part of the study relating to the informal economywas based on the assumptions that any extension ofsocial security would have to be piloted andimplemented in phases by areas or provinces. Thisstudy was focussed on areas and employment sectorsthat offered the potential to be easily identified,manageable, close to administrative centres,occupations that earn more regular incomes anddemonstrated a need for social security.
Methodology of the Informal Sector StudyThis study into the informal employment sector is oneof many studies aimed at improving the understandingof what is a highly complex series of interrelationshipswhere individual entrepreneurships override the normallegal constraints and the protective mechanisms offormal employment. This study attempted to confinethe scope to the social security issues by supplementingthe quantitative measures available from statistics andother studies with a small-scale geographical surveyto improve the qualitative understanding of the socialsecurity needs of selected elements of this vastemployment sector. The surveys also aimed tosupplement the available background data describedin sections 3 and 4 of this report.
The SurveyThe surveys were conducted to obtain primaryindicators of social security needs but also to provideinformation that may support the establishment of afuture pilot study that could assist in the design andtesting of a social security program to meet the needsof informal sector workers. The surveys concentratedon the two major components of the urban informalemployment sector as described by BPS and thesectors chosen were the manufacturing industry andthe wholesale and retail trade, restaurants &accommodation services industries. The surveys wereconducted in three geographical areas that had heavy

Part IV Chapter 17
257
concentrations of urban informal sector workers fromthe two major categories that were considered to havepotential for future participation in a social securityscheme. A total of 2000 people were surveyed in EastJakarta (700), Bandung (500) and Yogyakarta (800).The scope of the surveys was to obtain informationfrom selected informal sector workers about personaldetails, education, employment, social security needs,priorities and their capacity and desire to contribute toa social security scheme. The surveys also providedinformation about social security as it may apply inIndonesia i.e. social insurance for selected life events,as it was anticipated that many people would havelittle understanding of the concept. The choice ofemployment category and location was based onproximity to major cities, earnings capacity, high lifestylerisk and potential to create groups of workers withsimilar work and life interests. The potential toadminister and monitor a future pilot scheme and asubsequent social security program was also a keyconsideration.
Survey Results
The survey data collection form was constructed in 5parts; personal details, education, employment, incomedetails, social security needs, priorities and desire to
contribute. A summaryof the key findings arepresented below and amore complete selectionof tables of findings fromthe surveys arecontained in Annex 28.
(i) Personal Details
The balance between sexes in the survey was biasedtowards males because of the type of industries chosen.Many of the retail, manufacturing, transport, repairersetc were males. The predominant work areas forfemales in batik craft and home workers were lessaccessible to the surveyors.The number of Tertiary educated workers wassignificant and appears to reflect the limited availabilityof skilled jobs and the entrepreneurial nature of theinformal sector around the cities in the sample.
The marital status of the survey sample showed thatabout 70% of the respondents were married and giventhe age profile the finding is probably not surprising.
The average number of dependents for married peoplewas significant at 4.2, and to arrive at that average,the number of dependents in each family ranged from1 or 2 to up to 12 dependents in some families.
The age ranges shown in this chart indicate that 65%of the respondents were between the ages of 20 and40. The numbers of youths employed in these sectorswas relatively small and whilst the reason for this arenot clear it may be related to costs of establishmentfor self employed and skills training for the employ-ees.
(ii) Employment Details
The findings on employment status showed about thothirds self employed and about one third as employees.The chart on membership of cooperatives also confirmsthat in the two employment sectors chosen for the studymembership in cooperatives or other associations wasvery small at 6%.

Part IV Chapter 17
258
During the survey self-employed people were thenasked how many employees worked for them in theirenterprise. This chart shows that the response none(36%) probably represents the individual self-employedand the remaining 64% had more than one employee.Based on these results about 800 of the self-employedrespondents had employees and employed almost 4000employees, a ratio of almost 5:1.
The employment satisfaction level was almost the samefor males and for females at 70% and 74% respec-tively. When the self-employed factor of 65% is takeninto account there are still a significant number of em-ployees who are satisfied with the work they are cur-rently doing.
(iii) Income Details
The income distribution of the sample confirmed thatinformal sector workers are not necessarily the poorestwith over 20% earning more that double the nationalaverage. However, almost half of those surveyedearned less than the national average and over 20%earning less than one half of the national average. Thisgroup and their families would clearly be below theofficial poverty line.
(iv) Social Security Details
The vast majority of those surveyed had no socialsecurity cover. Only 2.3% had Jamsostek cover andabout 12% had other social security cover, mostly forhealth insurance.
It is also evident that females as a group had the leastcover.

Part IV Chapter 17
259
The life events that most respondents desired to be covered for were Health, Work Injury, and Death. Womenrated Health, Work Injury and Death benefits almost equally. The surprising difference for men was that Mater-nity payments rated the highest. It should be noted that respondents were also asked to choose their top prioritycover and this is shown in the charts below
The top priority life event that most respondents selected to be covered for was Health. Males also rated WorkInjury, Age and Death. Women rated Health, Age and to a lesser extent Death benefits as more important thanwork injury insurance. Whilst males rated maternity payments highly as desired cover, this did not translate as apriority for them.

Part IV Chapter 17
260
The issue of who should pay for social security contributions was very surprisingin that almost half respondents indicated that individuals should pay and about25% believed that the employer should pay contributions. It is unclear whetherthis reflects reality or a lack of understanding of what happens in most othercountries.When asked whether they would be prepared to contribute for their ownsocial security schemes the response was very similar to the previous questionabout who should provide for social security.
The response that 42% were prepared to contribute to a social security scheme offers some promise for a futurevoluntary contributions scheme.The responses to this question provide somedirection into the design of a future schemeand indeed to any proposed pilot. It is evidentthat high contributions and benefits that arenot attractive, together with insufficient infor-mation and don’t know represented well over60% of responses. The only other significantresponses were no need for social securityand Need information.
Respondents were asked how much per monthwould they be able to pay for social securitycontributions and 1999 responses werereceived. About 35% were adamant that theycould not contribute and this correlates withthe income levels where 31% earned less than Rp. 200,000 per month or half the average minimum salary and a
further 27% earned Rp. 200,000 – Rp.400,000 per month which is somewherebetween half and the average minimumsalary.It is interesting to note that the averagecontribution to Jamsostek (Employer +Employee) is about Rp. 45,000 per month andfrom this survey about 17.5% of respondentsbelieved they could pay about that amount. Ifwe looked at a contribution of half theaverage Jamsostek contribution (about Rp.20,000 per month), then about 34% of therespondents would be able to comply. Theresults of this survey suggest that a carefullyplanned and administered scheme, over time,could attract a significant number of voluntarycontributors. This of course could be mademore substantial with a contribution subsidy.
RECOMMENDATION
Feasibility of Extending Social Security to Informal Sector WorkersThere is a demonstrated strong demand for basic social security services but an almost non-existent supply.Almost half of the people surveyed would contribute to a suitable social security scheme and the level of thesecontributions may be able to provide for the priority basic social security needs of informal sector workers.
From the comparative international studies, local trials and from the survey findings, the extension of socialsecurity to the informal sector in Indonesia is feasible and the task for the social security agency is to satisfy thesupply side of the equation with a viable scheme that is flexible, affordable, sustainable and well marketed andunderstood. This may require reviewing the social budget in Indonesia with a view to better targeting of governmentfunds towards a contributions subsidy to support a voluntary social security scheme for the informal sector andthe poor.

Part IV Chapter 17
261
CASE STUDY – OJEK DRIVERS
Ojek (Ojeg) is the term used to describe an unofficialprivately operated public transport system based onmotorcycle taxis. The Ojek employment is typical of theinformal economy in that it essentially an occupationwithout legal status that is satisfying a large publicdemand. There are about 1.2 million Ojek drivers inIndonesia. A study of the Ojek industry around the cityof Bandung in West Java produced the followingdescription of the industry which is typical to that inmost other urban areas in Indonesia.
The Ministry of Transport (MOT) has apparently notincluded Ojek as a legitimate form of public transport anddoes not recognize or licence the drivers. Legitimate publictransport services, when registered, are issued with ayellow vehicle registration licence plate whereas in manyinstances Ojek motorcycles are unlicensed vehicles evenby the local police. It is understood that there are concernsabout the training, driving skills, public safety andmotorcycle maintenance standards that make it difficultto regulate the industry. There are also allegations aboutthe ownership of the motorcycles including that Ojekscontribute to the laundering of stolen motorcycles.
The industry is defacto regulated however and the localdistrict police office establishes a number of geographicaloperating zones for Ojek drivers. Permits are issued foreach zone depending upon the size of the zone and thedemand and the police office legitimises these permitswith the office stamp. Permits are issued to the driver andcontain fingerprint and photographic identity. The permitcards have titles similar to “safety competency certificate”but rarely make reference to Ojek permit. Over time thecost of an Ojek permit in the Bandung area has increasedfrom Rp. 250,000 to the current level of Rp. 5,000,000 (aboutUS $550) and this registration fee is payable to the localpolice office. Transfer between zones is unofficial andpermits are often resold to other drivers but the permitsare not reissued and drivers use the permits with differentpersonal particulars to the new owner.
The drivers in each zone appoint a supervisor or managersometimes referred to as the protector and the role of thesupervisor is to represent the interests of the Ojek driversin the zone against police checks, illegal moonlight driversand generally manage their interests. The drivers pay a
daily maintenance fee to the supervisor which is typicallyabout Rp. 2,000 per day. This fee comprises payments ofRp. 500 to the police office, Rp. 500 to the local militaryoffice, a management fee for the supervisor and theremainder is held in trust by the supervisor to supportdrivers suffering illness and the effects of traffic accidents.In the zone investigated by this study it was found thatthe average Ojek driver worked about 25 to 30 days in amonth and earned about Rp. 1,000,000 – 1,500,000 whichis equivalent to 2 to 3 times the average monthly wage forthe area. The income is derived from negotiatingdistanced based fares with customers that range fromabout Rp. 1,000 to Rp. 7,500 per fare.
Ojek driving is a particularly demanding occupationconsidering that the drivers work up to 12 hours per dayand are exposed to the physical and environmentaldangers of congested urban motor vehicle traffic. Theirrisk of injury and death is relatively high with an annualrate of about 12% - 15% of the drivers suffering somedegree of work related accidents and injury. There is nosocial security coverage for the drivers and somevoluntary associations that support Ojek drivers havenegotiated premiums with private insurance companiesfor death and injury cover. These policies provide verylow cover for a small annual premium of about Rp 10,000and the cover provided is significantly lower than thatoffered to formal sector workers by Jamsostek. Thepremiums are usually collected at the time of purchase ofa motorcycle where the premium is included in therepayment schedule for the motorcycle loan, usually over3 years. However, only a very small percentage of thedrivers participate in the schemes.
Despite the attempts at legitimising the industry Ojekdrivers face the uncertainty of regulation, inspection, thetrade in permits, limited security of tenure and are atrelatively high risk of injury. They represent a prioritycategory for social security coverage that has beenidentified by their desire for better protection. Howeverdespite their relatively high incomes their preparednessto contribute to the scheme is minimal and this issupported by the limited surveys into the informal sectoras part of this study where slightly less than 50% ofrespondents were prepared to make voluntarycontributions to a social security scheme.

Part IV Chapter 17
262
Summary of Informal Sector Findings
It is evident from the survey and from discussion withurban informal sector workers that they have a highneed for some form of social protection. The resultsconfirm that health insurance is the highest priorityfollowed by about equal priority between accidentinsurance and death cover. Whilst there is ademonstrated need for retirement benefits it seemsthat the premiums would be unaffordable to mostinformal sector workers unless there was some formof subsidy.
The barriers to development of a suitable program arediscussed in the following section of the report.
Identification of Needs
Unless an employee/employer relationship can beestablished and the employer encouraged to makesocial security contributions on behalf of theemployee(s) it is unlikely that the full range ofJamsostek programs (13.2% of average salary) couldbe afforded by most workers in the informal sector.Whilst it is desirable to provide the full range ofJamsostek services (which barely meets the ILOprotocol 102) it may be better to provide some elementsof social protection than none at all. In addition to thetype of social security cover, the value of the benefitsthat are commensurate with the contribution must alsobe determined. It may be necessary to offer some formof graduated contribution and benefits to accommodatethe variability in the income ranges of informal sectoremployees and their capacity to pay contributions.
Program Development
The first issue in program development is identifyingthe fund that will cover the informal sector workers.The current Jamsostek program has its contributionsand benefits prescribed in legislation and regulationsand these cannot provide the flexibility needed forinformal sector workers. For example, the eligibilitycriteria for the Jamsostek work injury program are for
injuries that occur at work and the disability provisionscover a prescribed list of injuries that are substantiatedby employers and medical reports. It is unlikely that awork injury benefit program would be suitable for manyinformal sector workplaces as the administrativerequirements to determine that injury occurred at workwould be prohibitive. For most informal sector workersthe critical issue is that there has been a loss of capacityto work and hence loss of income and a full 24-hourcover for injury would be more attractive and costeffective to administer.
Given the current legislation and fund structure inJamsostek it would be difficult to include a variableprogram for informal sector workers into the existingfunds. It may be more effective to create a new fundand contribution model for informal sector workers andthis could be achieved through regulations andMinisterial decrees. Alternatively a private lifeinsurance company such as Bumiputra could providethe cover for injury and Health, Injury and Deathindependently or in competition with Jamsostekschemes. A comparison of the Jamsostek andBumiputra programs is difficult to make given that theschemes have been developed using different riskassessments and memberships. However a broadcomparison of Life Insurance is possible and Jamsostekmembers pay a monthly premium of 0.3% of salarywhich on current average earnings is about Rp. 12,000per year. The benefits include a funeral payment ofRp. 1,000,000 and death benefit of Rp. 6,000,000. TheBumiputra policy produced for Ojek drivers requiredan annual premium of Rp. 10,000 and provided for adeath benefit of Rp. 1,000,000 that was doubled foraccidental death.Competitive rates for life insurance and injuryinsurance could be achieved for a scheme that coveredinformal sector workers given an adequate pool ofcontributors and appropriate re-insurance and riskguarantees.
Health insurance and retirement programs are moredifficult for informal sector workers to afford with theJamsostek health program requiring contributions of

Part IV Chapter 17
263
3% of salary for individuals and 6% for families. Theretirement program contributions are 5.7% of salaryand 0.3% for death cover, a total of 12%. Work injuryinsurance contributions require an additional 0.24% to1.74% depending upon industry. For most informalsector workers who generally receive irregular income,the establishment of a gross or net monthly salary isdifficult and unreliable. In its consideration of this issueJamsostek has proposed to use the National AverageSalary as the basis on which to calculate contributionpremiums for informal sector and self-employedworkers. The survey results suggest that there will bevery limited capacity for informal sector workers toafford about Rp. 25,000 per month for health insurancein addition to premiums for other programs. Whereasformal sector workers contribute only 2% of themaximum 12%+ and employers contribute theremainder, informal sector workers without anemployee/employer relationship would be expected tocontribute the full amount which in most cases isunreasonable and unlikely without some form ofsubsidy.
Recently the government has raised the degree ofurgency in development of a new universal healthinsurance program and a series of discussion forumsto support this strategy have been undertaken. It islikely that a major project tasked with designing thenew program and supported by international agencieswill commence in 2003. Some of the initial proposalshave suggested independent provincial based schemesfor each province with a central pooling of a proportionof the contributions for a national contingency pool tosupport provinces in the event of unexpected demandson their funds due to major illnesses, natural disastersetc.
Should this program be substantially delayed theninterim micro health insurance schemes based on groupcontributions would need to be considered for workersin the informal economy. A disadvantage of microinsurance schemes is that they have proven in practiceto have a limited life span of less then 5 years beforethey become insolvent, usually as a result of imprecise
calculation of risk, under investment and inadequatedelivery of services.
Subsidies
The national government budget is currently in deficitand the recent economic downturns will only exacerbatethe situation. Some provincial governments are alsoexperiencing economic difficulties particularly in thepoorer provinces where the income from taxation islow. The initial indications are that the national budgetwould be unable to sustain subsidies for acomprehensive social security program. However, asmall partial subsidy for a single social security programsuch as life insurance could be a catalyst that attractsinformal sector workers into one program and possiblyto other insurance programs. Assuming that there areabout 60,000,000 informal sector workers then a 50%subsidy for an annual life insurance premium of Rp.10,000 would be a maximum of Rp. 300 billion (US $33 million) per year, assuming all workers wereinsured. This is unlikely and in the short term and overa two or three year pilot scheme of 500,000 members(a probably unachievable target) a similar subsidy forsuch a pilot scheme would cost about Rp. 2.5 billion orUS$ 275,000 per year.
Administration
In the case of Jamsostek, the administration costs andefficiencies are based on group collection fromemployers and the average number of employees peremployer is about 124 which results in a monthly costper contribution of about Rp. 66 per month or Rp. 751per year (see Annex 29). The administrative costswould rise substantially if individual employees wereto make contributions direct to Jamsostek as would berequired for most of the self-employed informal sectorworkers. A group contributions model would need tobe developed to maximise efficiency and for there tobe a meaningful amount of contribution residue able tobe invested to contribute directly to the provision ofbenefits.

Part IV Chapter 17
264
There have been many attempts at group developmentin Indonesia and a number of government and privateagencies are devoted to the creation and maintenanceof cooperatives, self-help and economic groups. Inparticular the Ministry of Cooperatives and Small andMedium Enterprises promotes the establishment ofcooperatives and Bina Swadaya, a private foundationis an example of many NGO’s that specialises in theestablishment and maintenance of self-help groups.Other similar NGO’s include Binadaya Nusaindah andAssuransi Jiwa, although full details about theiroperations were not obtained as part of this study. Arecent ILO report has noted that in general,government support to strengthen cooperatives hasoften proven not to be very effective and notsustainable, particularly in the area of business clusterdevelopment. However it does also conclude thatcooperatives and associations tend to operate betterin a less formal ad hoc environment. Self-help groupssupported by trained facilitators are seen as the key tosuccessful implementation of a social insuranceprogram for informal sector workers and their families.The benefits of self-help groups are:• Able to be developed in geographical, economic or
occupational groups in accordance with the bestpractices. (experience from local trials suggestgeographic groupings may offer the best potentialfor sustainability);
• Facilitators and group leaders can assist in themarketing and explanation of social securityprovisions to members of the group;
• Local access to information and assistance aboutcontributions and claims thereby minimising a majorcomplaint about access to services;
• Mutual support by the facilitator and other groupmembers to maintain continuity in the scheme duringtimes of duress and personal difficulty experiencedby individual members, and
• Essential to the efficient collection of contributionsby field officers visiting the groups on at least monthlybasis thus maintaining low administrative cost ofgroup contributions to the agency,
Compulsory vs Voluntary Membership
The rights to universal social security coverage by allmembers of society have been endorsed by thegovernment and people of Indonesia and this issupported by the commitments made in the NationalDevelopment Program, State Guidelines 1999 – 2003,Indonesian Poverty Reduction Strategy and theEmployees’ Social Security legislation etc.
Voluntary membership can only be seen as atransitional strategy to alleviate temporary governmentbudgetary constraints but in the long term thegovernment must accept its responsibility to providefor a minimum social security system for all citizens.Inequities between the personal contributions fromformal sector employees and informal sector workersare huge which creates a sustainability problem forvoluntary schemes, the very schemes that are designedto protect the most vulnerable informal sector andpoorest workers. Voluntary membership carries withit some serious risks of adverse selection, limitationsin the pooling principle, drift of formal sector workersaway from their current schemes into a cheaperinformal scheme and ease of withdrawing from avoluntary scheme.
The dynamics of this proposal is for priority to be placedon compulsory schemes (formal sector, self employedetc.), capacity building in the institutions andencouragement of an informal economy schemethrough self-help and voluntary schemes supported bythe government

Part IV Chapter 17
265
CASE STUDY
FACILITATION of SELF-HELP GROUPS
Bina Swadaya is the largest NGO in Indonesia and one ofthe oldest, being formed from an agricultural workersfoundation in the 1950’s and its role is to enhance theself-reliance of people from lower socio economic sectorsof society based on the principles of solidarity and socialjustice. The mission of Bina Swadaya is to:• Help community in developing human resources,institutions, capital and enterprises,• Support development policies which benefit the poorto achieve a more equitable distribution of welfare, and• Bridge the gap between the poorer members of societyto achieve a fairer society.
To achieve its goals Bina Swadaya focuses on:• Self-help Group Development which involves the
creation of self-help groups across the country aimedat promoting improvement through education,stimulating ability and social leadership,
• Training of self-help group development facilitatorsand management of self-help group coordinators,
• Micro Enterprises Development by promotinginstitutional facilitation to support the creation of microenterprises so that they can become self sufficient andautonomous, and
• Micro Finance Development by facilitating group microcredit loans with regional development banks andsupporting the groups in the repayment of loans.
Bina Swadaya has 21 regional offices throughoutIndonesia that contain about 7 – 10 staff in each officethat currently facilitate and support over 3000 self helpgroups, and each group consists of between 25 – 50members. Assuming an average family size of 5 then thenumber of people under the influence of the groups is
from 400,000 to 750,000. The Bina Swadaya field officersform and train the self-help groups from individuals basedon similar economic purpose, similar occupations and localgeographical areas.
Micro loans are arranged with development banks usuallyfor around Rp. 1,000,000 per member and the groupbecomes the social and financial collateral for the loan. Amemorandum of understanding between all members ofthe group, the facilitator and the lending institutionsupports the group loan. Repayment of the loan isarranged through the group facilitator by at least monthlycollections from the group and is usually achieved by agroup meeting in the local village hall or other suitablevenue. In the case of micro loans a management fee of 0.5to 1.0% is usually sufficient to cover costs and mostgroups pay a development charge of up to 5% ofrepayments to Bina Swadaya. In addition to these feessome groups also contribute to a central pool (sometimesup to 20% of contributions) to provide a kind of groupsecurity cover to group members who were unable tomake repayments due to unforeseen circumstances.
A typical training program comprises a train the trainerconcept to train the facilitators and this is conductedover a 3-day period in Jakarta. The trainers then go to thefield and train the group leaders and conduct grouptraining in the field with ongoing support and trainingprovided by the group facilitator. Initial feedback suggeststhat Bina Swadaya could assist in the promotion andsupport of a social security program for the informal sectoremployees in the existing groups and then by thedevelopment of future group schemes. Field officers haveassessed that there is an urgent need for formal creditrisk insurance, education savings programs, retirementincomes as well as the immediate needs of health, injuryand life insurance amongst the existing self-help groups.
RECOMMENDATIONPrinciples for Extension of Coverage to theInformal EconomyBased on the International and Indonesian experiencesand from the results of the surveys undertaken as partof this study the following principles are recommendedfor the development of strategies for extension of socialsecurity to the informal sector.• Self-help groups should be the core of the social
security and insurance models,
• Groups should have external local facilitators fromthe social security agency and selected NGO’s andbe supported by local administrations and other localpartners,
• Flexible self-funded insurance programs provided bygovernment and private companies should be thecore of the system,
• Subsidies from all levels of government should be amatter of priority to encourage contributors and tooffset the high contribution to personal income ratiosthat are a feature of informal sector schemes,

Part IV Chapter 17
266
A Potential Social Insurance ModelAn overview of a potential interim social insurancemodel that could be tested and extended across theinformal economy in Indonesia shown in figure 20
below. This model is based on the self-help groupprinciple that has been successfully used for microfinancing.
Figure 105 A Social Insurance Model based on Self-help Groups
In the formal sector, the traditional methods ofextending social security programs has been to usetripartite cooperation between government, employersand trade unions. Clearly this process could not beeffective in the informal economy in Indonesia untilthere is substantial trade union involvement in theinformal economy. To date most attempts in extendingunion membership to the informal economy have beenunsuccessful. It is evident that some experimentationis required to identify suitable programmes,administrative models, appropriate partnerships and theeffectiveness of various models. In the past top downgovernment administered models have achieved littlepenetration into the informal economy and experiencedlow sustainability. This suggests that more emphasisshould be placed on the development of bottom upmodels that will drive the design of programmes andservices to the workers in the informal economy. Thesemodels could make use of some of the existing
cooperatives and self-help groups that are alreadyestablished and steps could be taken to extend thosegroups and to develop new groups based on the mostsuccessful methods currently in use.
RECOMMENDATIONDevelop Models for Provision of Social Securityto Informal Sector WorkersIn order that a viable social security scheme could bedeveloped for informal sector workers it will benecessary to develop models that provide meaningfulbenefits, affordable contributions and are sustainable.Implementation of such schemes is likely to beprogressive and take into account the wide variety ofoccupations, organizations and geographical distributionof the workers. The following prerequisites arerecommended as a first step in the process ofdeveloping social security models for Indonesianinformal sector workers.

Part IV Chapter 17
267
• Identify the executive agencies, preferably acombination of government and private companies.
• Select the fund and risk carrier(s) for the schemeand which agencies will be involved,
• Develop the programs that will be available includingthe benefits, services, contributions and managementfees (including risk assessments). The programs musthave flexible mix and match options with a range ofcontribution rates and benefits to satisfy the needsand capacity of different groups and include at leastinjury, health, death, retirement and other voluntarysavings schemes,
• Develop administrative and service delivery modelsfor the programs concentrating on group schemesbut also providing options for individual and self-employed contributors. The models should includemanagement information requirements to allow closemonitoring and ongoing risk assessment of theschemes,
• Conduct a small-scale test of the suitability of theprograms.
• Define user requirements, analysis and design of anIT system with sufficient data that can be integratedinto the Jamsostek IT system in the future. (Atemporary system to be developed in Jamsostek hasbeen costed at about US$ 1000 – 1500).
• Design and develop the implementation andmarketing strategy.
• Develop a training strategy and training programmeand delivery methods.
A Future Pilot ProjectIn conjunction with the other reforms of social securityin Indonesia it would be highly desirable to conduct alarge-scale pilot project to extend social securityopportunities to the informal economy. Worldwideexperience has shown that informal sector workerswill participate in voluntary schemes if there are realbenefits to them and the contributions are affordable.The most successful schemes are group insuranceschemes that are:
• Area based and to a lesser degree occupation based;
• Able to provide mutual support for members;
• Have identified group leaders; and
• Externally supported by trained facilitators.
Local government resources and facilities couldsupport these area group schemes and concentration
of effort could be directed at the selected area.Extension of successful schemes to other areas wouldthen be easier than for piecemeal-distributed models.
The process of conducting a pilot scheme shouldconsider the following key points:
• Identify the priority social security needs of informaleconomy workers in particular target areas;
• Develop a flexible programme for the informal sectorthat could allow a mix of options for cover toaccommodate individual needs and capacity to paypremiums,
• Develop the administrative arrangements forestablishment of the fund, collection of contributionsand settlement of claims;
• Determine the role of the key stakeholders in nationaland provincial governments, NGO’s and the servicedelivery agency;
• The potential for subsidies to be provided tocontributors to assist in the promotion of the schemesand to support their short term sustainability;
• Establish appropriate options for pooling of funds,re-insurance and guarantees against extremesituations;
• Improve knowledge and capabilities of localresources in implementing social security system; and
• The length of the trial and the future of the schemeafter the trial period.
The pilot scheme could assess the suitability andeffectiveness of:• The programmes and schemes for segments of the
informal sector such as urban, rural and foroccupational groupings;
• Administrative processes and costs;
• Group dynamics such as group building, managementand sustainability,
• Training of group leaders and group facilitators;
• Providers of services, local government, Jamsostek,NGO’s and private companies;
• Impact of fully self-funded and subsidised schemes;and
• Most appropriate models for extension to other areas.
An overview diagram of how a pilot scheme may beorganized is shown in Figure 21.

Part IV Chapter 17
268
Figure 106 A Possible Organization for a Social Security Pilot
117 Material about Migrant workers program sourced from ILO (Jakarta office) report A Review of migrant Workers management andoptions for Further Development assistance to The Program. November 2001 by the same author of this report.
RECOMMENDATIONInitiate the Proposals for a Funded Pilot ProgramThere are a number of complex issues involved inextending social security to the informal sectoremployees and without government assistance bymeans of a contribution subsidy the success of anyscheme will depend very much on being able to attractsufficient numbers of voluntary contributors. Initialfindings of this study have suggested that up to 50%of informal sector worker may contribute to a suitablescheme. It is recommended that a large-scale areabased pilot scheme be conducted as the pre-cursor tofull-scale implementation of the scheme across thecountry.
The pilot programme would need to incorporate theelements of the previous recommendation and be ableto identify the most suitable program and administrativemodels for future implementation. The outcomes ofthe pilot would be to develop associations of informalsector workers based on trust, meaningful social
security programmes and an administration capableof collecting contributions and payment of benefits thatcan be replicated across the country.
A successful large-scale pilot scheme promoted as partof the social security reforms and supported byinternational agencies would improve the understandingof social security in local communities, highlight thecommunity needs and stimulate the extension of socialsecurity coverage in Indonesia. A partially subsidisedscheme would demonstrate government commitmentto social security reform and greatly improve theenrolment rates, spread the risk and ensure a higherprobability of long-term success and sustainability.
Overseas Migrant Workers117
The migrant worker programme is supported by mostsections of Indonesian society as it promises to reduceunemployment, improve inflow of foreign currency andprovide increased wealth for individual migrantworkers. Large-scale migration of workers from

Part IV Chapter 17
269
Indonesia began in the late 1980’s and has grownsignificantly to an unofficial estimate of about 1.4 millionmigrants currently working overseas on both legal andillegal contracts.
Summary of Problems in the Migrant WorkersProgramThe problems associated with the Overseas MigrantWorkers have been well documented by a number ofresearchers and the problems more recently identifiedduring the ILO review in August 2001118 are:• Violation of basic human rights of workers;• Physical and sexual abuse of female workers;• Recruitment fraud and malpractices;• No social security membership whilst working
overseas;• Clandestine migration and forced return of workers
without official documentation;• Low wages and poor working conditions;• Imprisonment of some workers for serious crimes
in foreign countries,• Graft and corruption in the public service;
• Victimization by hustlers immediately upon return;and
• Consequences of family disruption caused bymigration.
Most of these problems are not unique to Indonesiaand are common to most countries that promote highrates of migration of low and semi-skilled workers
Statistical Overview of Migrant WorkersProgramsThe statistics shown in this report relate to theplacement of official or legal migrant workerssponsored through Depnakertrans by the registeredrecruitment agencies for overseas employment,(JPTKI - Perusahaan Jasa Tenaga Kerja). Theextent and distribution of unofficial, illegal orindependently recruited migrant workers is not knownbut estimates of a total of 1.4 million Indonesian migrantworkers re often used.
118 Summary of problems identified by M.Abela, ILO August 2001
Figure 107 Table - Destination of Migrant Workers by Region
Destination 1997 1998 1999
Males Females Total Males Females Total Males Females TotalAsia-Pacific 216,538 158,799 375,317 53,560 129,014 182,574 104,164 163,639 267,803America 736 0 736 2,446 2 2,448 3,505 14 3,519Europe 576 1 577 1,201 13 1,214 1,604 57 1,661Middle East & Africa 8,775 117,572 126,347 14,686 179,251 193,937 16,683 149,606 166,289
TOTAL 226,625 276,352 558,862 71,893 308,280 380,173 125,956 313,316 439,272
The above table confirms that the majority of migrantworkers are female and that the most populardestination countries are Malaysia and Saudi Arabia.Trends suggest that the proportion of female workersis increasing to all destination countries.
Social Security for Migrant WorkersIn the past Jamsostek was involved in the MigrantWorkers program by insuring members along the samelines as formal sector employees in Indonesia.Jamsostek ceased to provide cover to migrant workersfollowing concerns that it was in a monopoly situationand that workers would be better served in a
competitive insurance market. There are now 22authorised insurers for migrant workers providing forwork injury and contract employment insurance. Thishas proved to be a more expensive programme thatprovides no guarantees for workers and there arenumerous allegations that workers are unable to obtainlegitimate claims from these insurers. It has beensuggested that the typical process generally requireslitigation against the company to obtain payment. Thiswould clearly be beyond the financial capacity of mostmigrant workers particularly in cases of early breachof contract or non-payment of wages.
Part IV Chapter 17
270
There is a clear need to determine the situation forinsurance for migrant workers, the degree of coverageand the commitment to payment of claims.Improvement could be facilitated by makingcompulsory the requirement that Jamsostek provideinsurance cover for migrant workers or be the brokerfor obtaining insurance for migrant workers. MinisterialDecree could facilitate this. In this way PTJKIagencies could be established as nominal employerson the Jamsostek IT system and all contracted workers(by the PTJKI) will be shown as employees. Apartfrom providing guaranteed insurance cover for workersthe data records and appropriate statistics can be madeavailable at national and local level through Jamsostek.The workers would have a choice of insuring with anyof the existing 22 approved insurance companies orwith Jamsostek, however Jamsostek, as the broker,could ensure that all insurance policies comply withthe minimum standards and monitor the satisfaction ofclaims by migrant workers.
In the absence of any government promotion of socialsecurity programs for migrant workers the privateagencies (APJATI) are becoming increasingly involvedin offering services to migrant workers. It is understoodthat in conjunction with local banks APJATI intends toarrange loans to migrant workers to purchase land orhousing so that money earned overseas in put to someuse. A major concern is that many migrant workersdispose of their earnings unwisely and this is the reasonfor requests for further overseas work. The housingproposal is an effort to maximise the benefits toindividuals of their overseas employment.
The social insurance situation for migrant workers andthe potential role for Jamsostek should be re-examinedin the light of significant improvements in theperformance and management of Jamsostek. Theoptions for retirement insurance, voluntary saving etcare not currently provided to migrant workers. Bycontrast in the Philippines the Overseas MigrantWorkers Fund provides social insurance to overseasworkers from a trust fund managed by a tripartiteboard. This fund, in addition to social insurance,provides an overseas banking facility, credit facilitiesand small business loans. The funds and investmentearnings remain in trust solely for the purpose ofsupporting migrant workers. A feature of this fund isthat it maintains its own fiscal inspectors to ensurecompliance of contributions and services.
In addition to social insurance, some of the otherbenefits that Jamsostek may be able to offer the migrantworkers program are:• The opportunity for access to a nationally directed,
distributed service delivery network (Jamsostek hashigh capacity communications within Jabotabek andto West and East Java where the bulk of the migrantworkers originate from119);
• Capacity to provide social security to migrant workersby incorporating them into the Jamsostek programs;
• The insurance broker for migrant workers insurance;• If insurance broker status is provided then basic
statistics about PJTKI and workers contracted bythem would be available through Jamsostek, a servicethat at the moment is unreliable and in some instancesnon existent for the responsible Ministry,Depnakertrans;
• Access for migrant workers to the 114 Jamsostekbranch offices and 8 Regional Office outletsthroughout Indonesia;
• Potential Information distribution/access points forthe Migrant workers program, in addition to the 419offices of PJTKI, 15 offices of Depnakertransoffices at ports of departure (BP2TKI) and 32Provincial Labour offices (Kandis); and
• All Jamsostek sites have Internet access and thepossibility exists for the creation of an internetterminal for some use (full, restricted or scheduled)as a resource point or kiosk for local administrationsto support migrant workers (with information, email,printing leaflets etc).
This list is indicative only and serves to promote theneed to explore the symbiotic relationship withJamsostek now that the Depnakertrans network hasmostly been devolved to provincial administrations. Thiswould not absolve Depnakertrans of the need toincorporate the provincial administrations into theprogram but would serve to strengthen the relationshipby providing additional access of IT services to localadministrations. The management of Jamsostek wouldneed to be closely consulted about the feasibility andits capacity to accept any part of the migrant workersprogram.
The migrant workers program appears to besubstantially driven by the private agencies which areheavily involved in all phases of the migrant workerprocess including recruitment, training, employmentoverseas and resettlement. Provision of social security
119 Seapat Working Paper 7, Hugo and Bohning July 2000
Part IV Chapter 17
271
eligibility for migrant workers is more complex thanfor domestic workers as it is often difficult to negotiatewith international employers and governments. Theprivate recruitment agencies would be key elementsin any process that required collections of social securitycontributions for migrant workers and would need tobe incorporated into the work contracts. In many caseswork injury cover is provided as part of theemployment contract or is included in the insurancepackages currently provided by the registered insurers.
RECOMMENDATIONExtension of Social Security to Overseas MigrantWorkersIt is evident from this and other studies that there is aneed and demand for social security for migrantworkers and that the current insurance programs arenot providing adequate protection. To improve thewelfare of migrant workers the following issues shouldbe addressed:• Improve the quality of insurance provided to workers
by introducing a broker such as Jamsostek to monitorthe scheme and also to be given the opportunity toprovide insurance for migrant workers in competitionwith the private agencies.
• Review the decision to exclude migrant workers fromthe Jamsostek scheme with a view to include migrantworkers in the existing scheme or a program modifiedto reflect the needs of migrant workers,
• Develop a partnership model with the key agents inthe process (APJATI, Depnakertrans and Jamsostek)to provide social security cover to migrant workersbased on the modified needs of the migrant workers.Including the employment agencies as employers onJamsostek IT system could also provide much ofthe management information not currently availableto Depnakertrans.
Social Security Institutions for Extension ofSocial Security CoverageThe main national institutions capable of delivering anexpanded social security programs are Jamsostek(workers scheme), Taspen (public sector workers),Asabri (military scheme) and private insurancecompanies. Of these institutions Jamsostek has thelegislative authority for private sector workers, has anational network in all major provinces and is the largestinstitution. The private insurance companies would alsobe in a position to administer private insurance schemesusing their existing group schemes that have beendeveloped on a group risk basis. Whilst extension ofsocial security coverage is welcome it is also desirablethat the number of schemes is kept small and the overall
system does not become fragmented with aproliferation of schemes that will become difficult tocontrol. Smaller schemes may be less profitable, havehigher administrative overheads, provide lowerbenefits, increased risk of insolvency and may in thelonger term jeopardise the development of a futuregovernment subsidised system.
An ideal social security system should maximise theperformance of existing institutions within the boundsof current legislation by treating all employer/employeerelationships as formal sector workers and subject tocompulsory social security contributions. This couldallow the creation of special cases for the remainderof truly informal sector workers. The existing publicsector and military schemes should remain independentuntil it is possible to provide for a standardised socialsecurity scheme that provides a basic benefit for allworkers and for portability between schemes. In theshort term it is most likely that Jamsostek couldcoordinate a social security scheme for informal sectorworkers jointly with private insurance companies bydelivering flexible policies to group schemes throughlocal facilitators.
Capacity for Jamsostek to Extend MembershipThe Branch Offices are the main service deliveryoutlets for Jamsostek customers. The primarycustomer focus is on the employers who are responsiblefor registration of their employees in the schemes,payment of monthly contributions and representing theiremployees’ social insurance affairs. The servicedelivery concept is based on group collections ofcontributions and this has shaped the organisationalstructure. Previous reports in this project haverecommended that the focus should be changed moretowards the individual member in terms of access toservices, information, marketing and privacy. Theability to have direct contact with members, withoutusing the employer as a broker is considered essentialin the longer term. A cost estimate has not been madeto undertake this change in focus but it is expected ata minimum that IT systems will have to be upgradedas well as changes to staffing and property models.The upgrade of IT systems, data collection and dataentry of the additional data has been broadly estimatedto cost between US$ 1.5 - $2.0 million.
It is not proposed that the employer group collectionmethods be changed as they have proven to beefficient; however additional collection methods needto be devised if smaller enterprises and self-employedworkers are included in the membership of Jamsostek.

Part IV Chapter 17
272
This may include the user of field officers employedby Jamsostek, as paid agents or NGO’s paid acommission for servicing informal sector groups.
Service Delivery NetworkThe national service delivery network is based on 108Branch offices located around the country. There are
provisional plans to increase this number to 114branches by the end of 2002. These Branch officesare responsible for customer service, collection ofcontributions and processing and payment of benefits.The Branch offices are administered by eight (8)Regional Offices and their locations are shown in Figure23.
Figure 108 Regional Office Locations
The Regions are numbered one (I) to eight (VIII) fromwest to east and they are located around the majoremployment centres with 4 of the Regional offices and61 Branch offices on the most populous island, Java.
New Branch Offices are created from other BranchOffices within the Region based on the total numberof current employees actively contributing to theschemes. The Branch Offices are graded in sizeaccording to the employee membership numbers andthe grades are:• Grade I – more than 150,000 active members;• Grade II – 100, 000 active members; and• Grade III – maximum of 50,000 active members.
The number of branch offices per Regional office variesin accordance with population density and the locationof employment.
Jamsostek Operating CostsThe purpose of this section is to obtain a broad indicatorof the administration costs of Jamsostek and the impactthat the integration of additional small contributors maymake on the efficiency of the organisation. It is also todetermine whether it will be cost effective to collectpotentially small contributions from informal economyworkers and whether the balance of the contribution
will be sufficient to provide useful social security coverfor the contributor. This section is not an exhaustivedetailed analysis but an indicative overview.
There is no data available about the individual costs ofprocessing transactions or the range and work valueof the key transactions in Jamsostek, although theadministration costs for the whole organisation areavailable for the year ended March 2001 (year 2000)and are provided as Table 14 in Annex 22 to thispublication.
Dividing the estimated number of active Jamsostekmembers (9,382,786) into the estimated totaladministrative and operating costs of Jamsostek (Rp.232,843 million) produces an estimated averageadministrative cost of Rp. 24,816 per year peractive member. This of course covers 3 and sometimes4 programs per member.
Isolating the cost of any of the individual programs ismore difficult as Jamsostek does not keep its accountsin a form that separately identifies costs. However, in1997 Jamsostek conducted an exercise in an attemptto build a cost allocation model, which produced thefollowing tentative estimates.

Part IV Chapter 17
273
Figure 109 Jamsostek Program Cost estimate1997
Program Scheme % of CostsJHT Old Age Benefit 86.24%JKK Employment Accident 2.98%JPK Health 1.64%JKM Death Benefit 1.28%
Cost of Collecting ContributionsA gross figure for the cost of administration percontribution can be produced using the grossadministration costs (Table 14 in Annex 22) and grosscontribution receipts (Table 15 in Annex 22)120 andprovides the following gross estimate of Administrationcosts as a % of Contributions collected:
(Jamsostek Annual Administrative Costs)
(Total Actual Annual (Total Actual Annualemployer contributions + Aged program employer
less Aged program) contributions)
(232,843,021,994)
(553,100,592,106) + (1,929,718,764,933)= 9.45 % of Total
Contributions
It should be noted that in publication of accounts,Jamsostek does not include Aged program contributionsas receipts because they are exempt from the dividendto the government (tax) and are held in trust (albeitinvested) and belong to the individuals that have madethe contributions. The contributions for the otherinsurance programs (Work Injury, Death and Health)are included in the company financial statements andform part of the income for purposes of the dividend.This exclusion of the Age Retirement program presentsthe image of a very inefficient operation and thepublished figure for operating costs againstcontributions for year 2000 was 40.63%. For thisversion of the measure to be meaningful, the resourcesdedicated to the largest program, the operation of theAge Retirement program, should be taken into account.The tentative estimate that the Age Retirementprogram represents 86.24% of the Jamsostek workload
suggests that the published figure could be reduced by86.24%, which would reflect the cost of the otherinsurance programs. i.e. administration costs againstcontributions for:• JKK, JKM and JPK = 5.79% of contributions; and• All programs (JHT, JKK, JKM and JPK) = 9.45%
of contributions.
Administration Costs as a Ratio of the InvestmentPortfolioAnother typical indicator of costs and used to comparethe efficiency of retirement funds and often to set theirmanagement fees is administration cost as apercentage of total funds invested. The estimationfor Jamsostek in year 2000 was:
(Jamsostek Annual Administrative Costs)(Total Funds Invested as per the investment portfolio)
(232,843,021,994)(12,289,731,000,000)
= 1.89 % of Investment Portfolio
Based on these broad estimates it would be costeffective to collect smaller contributions from informalsector workers if the group size was maintained closeto the existing average (124 employers per employergroup121). This could be achieved by deputising a keyindividual or agency as the group leader and to be paidon commission or fee for service on a part-time basisto collect and deposit monthly contributions on behalfof individual contributors.
Administration Cost of Key TransactionsAnnex 29 attempts to show what the Minimum costsper customer or transaction would be if the collectionof contributions was 100% of the active members ofJamsostek. In reality this is probably not achievableand a more realistic international standard is 85% ofcontributions collected each month. The potentialadministrative cost per transaction of collectingcontributions and processing Age Retirement claimsas calculated in Annex 29 are summarized in Figure25.122
120 The contributions for the Old Age program are obtained separately to the item in this Annex.121 See Annex 5 for calculations122 It should be noted that the work value of the Health Insurance scheme and Work Injury Insurance schemes are not treated separately
for the purposes of this exercise. The health insurance fund is relatively small compared to the retirement fund and much of theprocessing is outsourced to intermediaries. Refinement of these estimates into a more accurate model that includes costing for otherprograms would assist in the planning of future expansion in Jamsostek.

Part IV Chapter 17
274
Figure 110 Summary of Estimated TransactionCosts in Jamsostek
Estimated Key Monthly YearlyTransaction Costs (Rp) (Rp)
Employer contributions(12 contributions per year) 7,768 93,219
Payment of Retirement 66,505claims (each claim)
Individual Employee 63 751Contribution cost(based on average of 124employees per employer)
Cost Estimates and the Expansion of JamsostekThese cost estimates may provide some indication onhow Jamsostek will be able to manage an expandedcustomer base and the feasibility of extendingcontribution options to the remainder of the formalsector and ultimately to the informal sector. The costestimates do not take into account:• Economies of scale that may be achieved by
increasing the ratio of the larger class I branch officesto the smaller class II and III offices;
• Efficiency improvements by introducing cost basedresource monitoring and management information;
• Improvements in productivity based on anorganization wide best practice environment;
• Cost reductions in management by promotingdevolution of support tasks to Branch offices; and
• Additional automation of processes by enhancementsto IT systems.
The improvements need to be offset against additionalresources that will be required to:• Implement a new compliance program to enforce
existing and new regulations on contributions; thiswill involve additional staffing, training,accommodation, IT programs and transport;
• Service a potentially lower employer/employeecontribution ratio to accommodate smallerworkplaces, self employed workers and informalsector workers;
• Provide additional resources to shift focus fromemployers to individual members, especially formarketing, promotion and claims;
• Expand property requirements, and• Upgrade IT systems to accommodate a more
individual service including the dispatch of individualannual statements, compliance, new registration
system and possible additional categories ofmembership for self employed and informal sectorworkers.
Improvements to JamsostekA number of recommendations about improvementsto Jamsostek were made in the ILO report titledRestructuring Social Security in Indonesia –Review of operations and Information Technologyin Jamsostek, November 2001. These improvementsare considered critical to the future of Jamsostek asone of the key social agencies and without theseimprovements expansion of the membership base willbe difficult to achieve and remain less efficient. Asummary of these improvements is as follows:
Process and Administrative improvements• The membership process needs to be enhanced to
involve individual members in their social securityinvestment;
• Compliance process should be the responsibility ofJamsostek with amendments to legislation requiredto allow social security inspectors to be managed byJamsostek in order to improve compliance from thecurrent 32.5% to a more acceptable internationaltarget of more than 80%;
• Provident fund performance to improve the returnson investment and lower the relative administrationcost to make the fund more attractive to membersby increasing the long term benefits to members;
• Improvement of the benefits provided to membersand to introduce new social security benefits in themedium term such as unemployment insurance,maternity benefits, regular pensions in lieu of lumpsum payments, accident insurance and possible socialassistance in the long term;
• Improved access to services by distributing accessto remote areas by the use of part-time services,authorised agents, telephone services and furtherdevolution of branch offices;
• Reviewing the business needs to improve targetingof services and needs to customer groups in thecurrently excluded employment sectors; and
• Developing a more effective marketing program tobetter inform the potential members about Jamsosteksocial security services, eligibility, benefits andprocedures.
Technology Improvements• Development and implementation of a unique
numbering system for social security customers to

Part IV Chapter 17
275
minimise the risks of duplicate claims, redundant dataand provide more accurate advice to members;
• Integration of the duplicate records that have beencreated by the multiple records that are producedwhen members change employers or branch offices;
• Development and implementation of a national indexto enhance the record search process, transfersbetween branches, support the minimisation ofduplicate records and obtain a national view ofcustomer records; and
• Develop a new integrated registration process thatuses additional data about individuals, includes astringent proof of identity process and providescustomers with their rights and obligations ofmembership.
Jamsostek has a developed organization that is centrallymanaged, distributed throughout the country and has aflexible expansion model that could be graduallyextended to include additional contributors. In order todo this the suggested improvements would need to besubstantially completed before any expansion occurred.

Part IV Chapter 18
276
CHAPTER 18 THE SOCIAL BUDGETIn terms of economic performance, the country hasgrown at rates higher than many other Southeast Asianeconomies except for the crisis period when itexperienced double-digit contraction. The industrialsector led the way in the past economic growth. Inaddition, except for the crisis period, the economy hasbeen stable with single digit inflation and relatively lowunemployment rates. One characteristic of theeconomy is that employment is predominated by a largeinformal sector.
Analysis of the aggregate social insuranceexpenditureCurrently, the cost of social insurance in Indonesia is1.5% of GDP with 95% spent on old-age benefits.This is explained by a limited coverage and low benefitlevels. This also does not deviate from the commontrends in Southeast Asia except for Singapore. It shouldbe mentioned, however, that there is an increasingpension debt represented by the deficits in the old-agebenefit schemes for civil servants and retirees in theTASPEN programme. Furthermore, considering theslowing down of the population growth and theextension of life expectancy, a rapid rise in the old-agedependency ratio is inevitable. This would impose anincreasing pressure for current contributors as well asfor government budget in the future. Finally, if theeconomy cannot attain the assumed growth rate ofthe economy of 5%, the relative cost of the socialinsurance system will increasingly become heavy forthe Indonesian economy.
The analysis made in the report has demonstrated thefeasibility and usefulness of the social budgeting as atool for the national planning. In addition, it is also hopedthat this would initiate further effort towards buildingmore comprehensive and reliable database requiredfor a full-scale social budgeting exercise.
Executive Summary
This Chapter presents the main findings and conclusionof the actuarial and social budget expert team in theproject “Restructuring of the Social Security inIndonesia (INS/00/M04/NET)”. The scope of thereport covers an assessment of the demographic andeconomic background for the development of socialexpenditure and a development of a social budgetmodel for Indonesia for the national financial planning.An actuarial valuation of the Jamsostek scheme,examining its financial sustainability and identifyingweaknesses in its financial structure and reviewing theinvestment policy and financial management are thesubject of Chapter 10 in Part II of this Publication.
Demographic and economic contextThe Indonesian population has been in a transition froma young age-structure with high growth rates to an oldage-structure with relatively low growth. The projectionresults show that this trend will continue. In particular,the projection results show that Indonesia willexperience a rapid population ageing for the next fewdecades. By 2030, the percentage of the populationolder than the current retirement age (55 years) andthe old-age dependency ratio (defined as the populationolder than 55 divided by the population aged 15-54years) is expected to be twice as high as the currentlevel. This will put heavy pressure on the financing ofsocial protection in the long run.
Furthermore, due consideration is required on thefollowing socio-economic issues associated with thefuture demographic changes. Firstly, the increased lifeexpectancy after retirement will necessitate anincrease in the retirement age, possibly from the current55 years of age to 60 years or higher. Secondly, thetrend towards smaller families will reduce the level ofthe family support for the elderly and create the needfor old-age support in the form of social security.

Part IV Chapter 18
277
Bab 18 Anggaran Sosial
Rangkuman Eksekutif
Bab ini menyajikan temuan-temuan utama dankesimpulan dari tim ahli aktuaria dan anggaran sosialdalam proyek “Restrukturisasi Jaminan Sosial diIndonesia (INS/00/M04/NET).” Ruang lingkup laporanini meliputi penilaian terhadap latar belakangdemografis dan ekonomi bagi pengembanganpengeluaran sosial dan pengembangan suatu modelanggaran sosial bagi Indonesia bagi perencanaankeuangan nasional. Suatu penilaian aktuaria mengenaiskema Jamsostek, yang menganalisa kesinambungankeuangan dan mengidentifikasi kelemahan-kelemahandalam struktur keuangannya serta mengkaji ulangkebijakan investasi dan manajemen keuanganmerupakan pokok persoalan dari Bab 10 Bagian IIPublikasi ini.
Konteks demografi dan ekonomi
Penduduk Indonesia berada dalam transisi dari strukturpenduduk usia muda dengan tingkat pertumbuhan yangtinggi ke struktur penduduk usia lanjut dengan tingkatpertumbuhan yang relatif rendah. Hasil proyeksi(perkiraan) menunjukkan bahwa kecenderungan iniakan terus berlanjut dan Indonesia diperkirakan akanmengalami pertumbuhan penduduk usia lanjut secaracepat dalam beberapa dasawarsa mendatang. Padatahun 2030, persentase penduduk yang lebih tua dariusia pensiun sekarang (55 tahun) dan rasioketergantungan usia tua (yang didefinisikan sebagaijumlah penduduk berusia di atas 55 tahun dibagi jumlahpenduduk berusia 15-45 tahun) diperkirakan akanmenjadi dua kali lebih tinggi daripada tingkat yang adasekarang. Hal ini akan memberi tekanan yang beratterhadap pembiayaan perlindungan sosial untuk jangkapanjang.
Selanjutnya diperlukan pertimbangan yang tepatmengenai isu-isu sosial ekonomi yang berkaitan denganperubahan-perubahan demografi di masa yang akandatang: Pertama, meningkatnya usia harapan hidupsetelah pensiun akan menyebabkan perlunya usiapensiun diperlambat, mungkin dari 55 tahun menjadi60 tahun atau lebih. Kedua, kecenderungan ke arahkeluarga yang lebih kecil akan mengurangi tingkatdukungan keluarga kepada mereka yang berusia lanjutserta menciptakan kebutuhan akan bantuan usia tuadalam bentuk jaminan sosial.
Dari segi kinerja perekonomian, Indonesia telahmengalami pertumbuhan ekonomi pada tingkat yanglebih tinggi daripada perekonomian-perekonomian AsiaTenggara lainnya kecuali selama periode krisis moneter(krismon) di mana perekonomian Indonesia mengalamipenyusutan hingga dua digit. Di masa lalu, sektorindustri memimpin pertumbuhan ekonomi. Selain itu,kecuali selama masa krisis, perekonomian Indonesiarelatif stabil dengan inflasi digit tunggal dan tingkatpengangguran yang relatif rendah. Salah satukarakteristik perekonomian Indonesia adalah adanyasektor informal yang besar yang mendominasi lapangankerja.
Analisa pengeluaran untuk asuransi sosial secarakeseluruhan
Saat ini, biaya asuransi sosial di Indonesia adalah 1,5%dari Produk Domestik Bruto di mana 95%-nyadigunakan untuk membayar jaminan hari tua. Hal inidiketahui dari terbatasnya cakupan dan tingkat manfaat,jaminan sosial yang rendah. Ini juga tidak menyimpangdari kecenderungan umum yang ada di Asia Tenggara,kecuali Singapura. Namun, perlu disebutkan adanyakenaikan utang uang pensiun sebagaimana terlihat darikekurangan yang terjadi dalam skema jaminan hari tuauntuk pegawai negeri dan pensiunan dalam programTASPEN. Selain itu, dengan mempertimbangkanmelambatnya pertumbuhan penduduk dan meningkat-nya usia harapan hidup, kenaikan secara cepat dalamrasio ketergantungan usia tua agaknya tidak dapatdihindari. Hal ini tidak saja akan memberikan tekananyang semakin berat bagi peserta program yang saatini masih membayar iuran tetapi juga membebanianggaran pemerintah di masa mendatang. Akhirnya,apabila perekonomian tidak dapat mencapai/mewujud-kan asumsi tingkat pertumbuhan ekonomi sebesar 5%,biaya relatif dari sistem asuransi sosial tersebut akanmenjadi semakin berat bagi perekonomian Indonesia.
Analisa yang disusun dalam laporan ini telahmendemonstrasikan kelayakan dan kegunaan penyu-sunan anggaran sosial sebagai alat bagi perencanaannasional. Di samping itu, diharapkan juga bahwa halini akan memprakarsai upaya-upaya lanjutan ke arahpengembangan database yang lebih komprehensif dandapat dipercaya, yang dibutuhkan untuk suatu upayapenyusunan anggaran sosial berskala penuh.

Part IV Chapter 18
278
The Demographic And Socio-Economic Context
Any financial analyses of social security system needto reflect the legal, demographic and socio-economiccontext in which it operates. This chapter provides ananalysis of the demographic and socio-economicenvironment of Indonesia and sets out scenarios forthe future development.
Demographic context
Historical trends
(i) Population growth and ageingIn 2000, the Indonesian population was estimated at208 million, growing at a rate of 1.4% per year, assummarised in the table in Figure 110 Due to decliningfertility and mortality, the growth rate of the population
Figure 111 Table of Main Demographic Indicators of Indonesia, 1970-2000
Year 1970 1980 1990 1995 2000
Population (in thousands)Total population 120,208 146,935 178,298 193,915 208,000(E)
Age structure(a) Below 15 42% 40% 36% 33% 29%(b) From 15 to 54 50% 52% 55% 57% 60%( c) 55 and over 8% 8% 9% 10% 11%Dependency ratio ( c)/(b) 15.9% 15.7% 17.0% 17.9% 18.2%
Period 1970-1979 1980-1989 1990-1995 1995-2000
Average annual rate of growth (%) 2.3 2.0 1.6 1.4Total fertility rate(per woman, average of 5 years) 5.61(1970/74) 4.06(1980/84) 2.80 2.55(E)Life expectancy at birth (years) 4.68(1975/79) 3.33(1985/89)
Both sexes combined 49.2 56.2 62.6 65.1Males 48.0 54.5 61.0 63.3Females 50.5 58.0 64.5 67.0
Infant mortality rate (per 1,000 live births) 126 89 59 48Note: Excluding East Timor.Source: BPS Census, UN “World Population Prospects, the 2000 revision”.
(ii) FertilityThe total fertility rate (TFR) has declined from 5.6children per woman in 1970 to the current level ofaround 2.5. Recent statistics show a substantialdecrease in the age-specific fertility rates at 40years and above. This decrease is ascribed to the
changes in reproductive behaviour as more peopleuse the family planning programme. The familyplanning programme, promoted by the NationalFamily Planning Coordinating Board (BKKBN)since the 1970s, legitimised the concept of fertilitycontrol, making contraceptive methods available
shows a decreasing trend. The change in populationsize is accompanied by changes in age structure (seethe transition of population pyramids shown in Annex11 The percentage of the population younger than 15years of age has been decreasing considerably.Accordingly, the population older than the normalretirement age (55 years) has been increasing steadily.The dependency ratio, defined as the population aged55 and older as a percentage of working age population(age 15-54), increased from 15.9% in 1970 to 18.6%in 2000.
In the long run, these demographic changes areexpected to have a wide range of socio-economicimplications such as change in family structure,population ageing, urbanisation, education, structure ofdiseases and feminisation of labour. The recenteconomic crisis has caused considerable damages tothe general standard of living. The share of thepopulation living under the poverty line has increasedsharply from 11% in 1997 to 21% in 1999.

Part IV Chapter 18
279
for women in need and introduced the small familynorm. Some demographers argue that as a resultof the recent financial crisis the fertility rates wouldincrease because of the reduced use ofcontraceptive methods, although there has beenno empirical evidence so far.
(iii)MortalityLife expectancy at birth is estimated at 64.3 yearsfor men and 67.2 years for women in 2000. Therehas been a significant reduction in infant mortalityfrom 126 per thousand births in 1970-74 to 48 in1995-99. (It is reported that there are cases offailure to register deaths in rural areas. This maylead to an underestimation of mortality.)
According to the statistics of the Ministry of PublicHealth, the number of HIV/AIDS cases is very small(only 2,950 cases have been registered as of June2002). However, Government reports estimate that120,000 Indonesians have been infected by HIV/AIDS,out of which 43,000 are intravenous drug users. UnitedNations Programme on HIV/AIDS (UNAIDS) statesthat drug injection (needle sharing) is a major route ofinfection in Indonesia. It is estimated that 9,000 womenhave been infected sexually by intravenous drug users.
(iv)MigrationNet international migration has been marginal andno significant change is recognised. In respect ofinternal migration, there have been movementsfrom rural provinces to more developed areas. Theprogramme of transmigration (or resettlement ofinternal migration) had caused a large counter flowof population from high-density areas to low densityareas. This programme is currently suspended.
Population projectionPopulation projections provide the general frameworkfor the development of the labour force and thepopulation to be covered by social security systems.In Indonesia, several institutions undertake populationprojections, including the Central Bureau of Statistics(BPS) and the Demographic Institute of the Universityof Indonesia, as well as the United Nations. For thepurpose of this study, an updated projection for theperiod 1995-2050 has been established using thestandard ILO population projection model with the latestavailable information. Particular attention has been paid
to the effects of the economic crisis, which began in1997.
(i) Base dataThe year 1995 has been selected as the base yearof the projection. Most of the base data have beentaken from the intercensal survey in 1995. Thesedata are supplemented by preliminary results ofthe last census in 2000 to take into account theeffects of the economic crisis where possible.
It should be noted that there remain someinconsistencies among the data even though weconsulted the most reliable sources. This is, to acertain extent, inevitable in view of the country’shighly heterogeneous ethical, cultural andgeographical composition. In this respect a suitabledisaggregation of data would be necessary for theefficient administration of a social security scheme.
(ii) Assumptions of the population projection:intermediate scenarioThe population in the base year was determinedon the basis of the 1995 inter-censal survey withthe following two modifications. First the populationin East-Timor has been excluded, and second, thepopulation of the age group “75 and over” has beendivided into further age groups.
The Table in Figure 112 summarises the keyassumptions for the population projection under theintermediate scenario. The total fertility rate (TFR) in1995 is estimated to be 2.55 children per woman. Adeclining trend in fertility is assumed for the future.The TFR is assumed to decrease until it attains itsultimate level of 2.1 children per woman by 2010. Inview of the stability of the childbearing schedule in thepast period, the intermediate childbearing pattern hasbeen chosen. The sex ratio for the newborn (i.e. ratioof boys to girls) is estimated to be 1.037.
As no official mortality rates are available, these rateshave been drawn from the United Nations’ model lifetables. The “South Asian” regional pattern has beenselected. The reduction in mortality rate is expectedto continue but at a more moderate pace. In view ofthe statistics of the past period, no net internationalmigration has been assumed for the whole period ofprojection.

Part IV Chapter 18
280
Figure 112 Table of Key Assumptions of the Population Projection (intermediate scenario), 1995-2050
Year 1995 2000 2010 2020 2030 2040 2050
Total fertility rate 2.55 2.3 2.1 2.1 2.1 2.1 2.1
Life expectancyMalesAt age 0 62.3 64.3 67.8 69.8 71.6 73.2 74.2At age 55 20.0 20.5 21.6 22.3 22.9 23.6 24.0At age 60 16.3 16.8 17.7 18.3 18.9 19.4 19.8At age 65 13.1 13.4 14.2 14.6 15.1 15.6 15.9FemalesAt age 0 65.2 67.2 70.7 73.1 75.1 76.7 78.0At age 55 21.6 22.3 23.5 24.5 25.3 25.5 25.9At age 60 17.7 18.3 19.4 20.2 21.0 21.2 21.6At age 65 14.2 14.7 15.6 16.3 17.0 17.1 17.5
(iii) Results of the intermediate projection
The table in Figure 113 summarises the results of the intermediate projection.
Figure 113 Table of Key Results of the Population Projection (intermediate scenario), 2000-2050
Year 2000 2010 2020 2030 2040 2050
Population (In thousands) 208,866 237,422 261,543 281,290 296,075 304,341Annual growth rate 1.4% 1.2% 0.8% 0.6% 0.4% 0.2%Age structure(a) Below 15 29% 25% 23% 21% 20% 19%(b) From 15 to 54 60% 61% 59% 57% 52% 51%( c) 55 and over 11% 14% 18% 22% 28% 30%Dependency ratio ( c)/(b) 18.2% 22.6% 30.9% 39.2% 52.8% 58.7%
Due largely to the continuous decline in fertility, thepopulation growth is estimated to slow down furtherbut the total population is expected to exceed 300 millionby 2050. As shown in Figure 1.1, a rapid populationageing is anticipated. The percentage of the populationolder than 55 years of age is expected to double by2030 and become three times the current level by 2050.Accordingly, the dependency ratio is estimated toincrease rapidly from 18.2% in 2000, to 30.9% by 2020and to 52.8% by 2040. In terms of the reciprocal ofthe dependency ratio, namely the number of workingpersons per one retired, the figures decrease from 5.5in 2000, to 3.2 in 2020 and to 1.9 in 2040. Such a rapidpopulation ageing raises concerns on the increasingcost of social protection in the future.
(iv)Sensitivity analysisIn order to show the degree of confidence of theintermediate projection results, projections have beenmade under two alternative scenarios, namely the rapidageing and the slow ageing scenarios. Under the rapid
ageing scenario, the TFR is assumed to decreasefurther until it reaches 1.8 children per woman in 2020and after. In addition, a faster reduction in the mortalityrate has been assumed. Under the slow ageingscenario, both the fertility and mortality levels areassumed to remain at the 1995 level.
In a comparison of the assumptions and results ofprojections under these scenarios we observe that evenif the declining trends of fertility and mortality arestabilised at the current level a considerable populationageing is unavoidable. If, on the contrary, suchdemographic changes take place at a more acceleratedpace, the long-term effect on the population ageing iseven more significant.
In addition, our results were compared with UnitedNations population prospects (2000 revision). Theresults of UN projection are more or less similar tothose of our intermediate projection.

Part IV Chapter 18
281
Figure 115 GDP by Sector 1983 – 2000
Macroeconomic and labour market overview
Overview of past performance
(i) Gross domestic productIndonesia has been growing consistently – itsgrowth rate is less than the Newly IndustrializedEconomies but high by the ASEAN standard. Asshown in the table in Figure 114, in the 1980s thereal GDP has been growing at more than 5% andposted even higher growth (7% to 9%) in the lastdecade except for the period of the financial crisis.The industrial sector led the way in terms of growththroughout the recent history posting even double-digit growth in the 1990s. It is observed that themajor feature of Indonesia’s economic trend is highgrowth and rapid industrialization (EIU 2000, Fane1999). Agriculture showed slower growth rates ofless than 5%. However, it showed resiliency duringthe crisis when it posted a positive grow as industryand services contracted substantially.
Figure 114 Table of Growth rates of real GDP,1983-2000
1983-1987 1990-1995 1995-2000
Total 5.4 9.2 0.7Agriculture 3.5 3.3 1.5Industry 5.6 12.6 1.5Services 6.4 8.9 -0.4
The structure of the economy has been changing withdependence on agriculture declining and the share ofindustry rising. As shown in Figure 114 the share ofagriculture in real GDP has declined from 23% in 1983to 17% in 2000. Industry, on the other hand, accountsfor an increasing proportion from 40% in 1983 to 43%in 2000. Finally, the share of services also increasedfrom 37% in 1983 to 40% in 2000. A standout in theindustrial sector is manufacturing which steadilyincreased its share from 13% in 1983 to 26% in 2000,faster than other branches in the industrial sector. Therise in manufacturing was seen as the country’sresponse to the declining oil price since early 1980s insearch for alternative exports (EIU 2000).
(ii) Labour productivityAs in many countries, output per worker is highest inthe industrial sector, followed by the services sector.As the table in Figure 116 shows, the labour productivitygrowth turns out to be also high in the last decade.Output per worker grew as high as 8% before thecrisis and went down significantly during the crisisperiod.
Figure 116 Table of Growth Rates of the LabourProductivity, 1989-2000
1989-1994 1996-2000
Total 6.0 -2.6Agriculture 4.7 -1.7Industry 0.8 -1.3Services 2.9 -3.0

Part IV Chapter 18
282
(iii) EmploymentAs the table in Figure 117 indicates, the growth intotal employment in the 1990s went from a low of0.7% in the middle of the crisis in 1998 to as highas 3.3%. Leading the growth is the industrialsector, as it also posted the highest output growthrate except the crisis period where it experienceddouble-digit contraction in employment.Employment in the agriculture sector recorded amuch slower growth reflective of its slower growthin output although it worked as the absorber ofunemployed during the crisis period by growingalmost 10% as other sectors experienced deepcuts in their employment. Again, except for thecrisis period, the employment growth in themanufacturing stands out for the industrial sector.This was brought about by the emphasis on labour-intensive manufactured exports as oil pricesdeclined in early 1980s (Radelet 1999). The servicesector employment contributed modest growthrates.
123 The 1971 census puts the employment share of the agriculture sector at 64.8% and the 1980 census puts this share at 55.9% (Korns,1987).
Figure 117 Table of Growth Rates of Employment,1987-2000
Sector 1987-1990 1990-1994 1996-2000Total 2.7 2.2 1.8Agriculture 3.3 -2.5 2.9Industry 26.9 12.0 0.6Services -3.4 6.4 1.1
While the distribution of employment by sector isexpected to follow the development in the sectoralcomposition of output, the change in composition ismuch more modest. Figure 118 illustrates this. Theagricultural sector employed 55% in 1990123 while in2000 the sector still accounts for 45% of employment.The industrial sector accounted for 14% of employmentin 1990 and increased its share to 17% in 2000.Substantial proportion of employment in industry sectoris in manufacturing. The service sector contributed31% in employment in 1990 and the proportionincreased to 37% in 2000. The overall movement ofworkers follows the anticipated way, i.e., shifting fromthe agricultural sector to the industrial and servicessectors.
Figure 118 Employment by Sector 1990 - 2000
(iv) Labour supplyLabour supply is determined by the working agepopulation and the labour force participation rate.The development of the working age populationreflects the declining growth of the totalpopulation as described earlier. The growth rate
of population of 15 years and above is 2.5%between 1995 and 2000. Labour forceparticipation is usually different by sex, with menmostly in the labour force and women having theoption of being employed or working at home.This pattern is observed in Indonesia except that

Part IV Chapter 18
283
the labour force participation of women is slightly lower than other Southeast Asian countries, e.g. Thailandand Vietnam, and a little higher than the Philippines.There is an increasing trend in the overall labour force participation from 57% in 1986 to 60% in 2000.124 Interms of sex, as Figure 119 shows, the participation rate of women is about two-thirds of that of men. Thereis no discernible trend of closing this gender gap in the labour force participation.
Figure 119 Labour Force Participation Rates by Sex, 1986 – 2000
124 The recorded labour force participation rate in the 1971 census is 51 and 50% in the 1980 census (Korns 1987).
In respect of age distribution, as shown in Figure 120,the inverse-U pattern is evident as in other countrieswith younger and older ages exhibiting lowerparticipation rates than the middle age group. Twoobservations emerge from the data. First, the labourforce participation rates are declining at for young
workers at age groups 10-14 and 15-19. This is due tothe rising enrolment rates of higher education. Second,there is a slight indication that older workers at 55 yearsand above are participating more in the labour force.This pattern is more pronounced in the case of femaleworkers.
Figure 120 Labour Force Participation Rates by Age Group 1986 – 2000

Part IV Chapter 18
284
(v) UnemploymentThe labour force survey defines the openunemployment as those looking for jobs but couldnot find one.125 Figure 121 shows the age-specific
125There is a critical view to this method of measuring unemployment which results in significantly low unemployment rates (Ahmed andDhanahi 1999). We however do not pursue this issue in this report.
open unemployment rates. For young workersbelow 35 years of age, the unemployment ratesare particularly high and they are in an increasingtrend. In terms of sex, women have higherunemployment rates than men.
Figure 121 Open Unemployment Rates by Age Group 1986 - 2000
(vi) Prices, interest rates, exchange rate andwages
Prices in Indonesia have been relatively stable exceptduring the turmoil caused by the financial crisis.Inflation rate has been at double digit levels in the 1970sand early 1980s but was kept at single digit levels startingin the middle of 1980s until the crisis struck whereinflation went as high as 59% in 1998 (Some detaileddata are shown in Annex 3 of this publication andcomplete data is available in the project report). Thisaberration was largely driven by the collapse of theRupiah, breakdown in production, rapid growth inmoney supply to keep banks liquid (EIU 2000). Relativeprice stability returned when macroeconomic stabilitywas achieved.
Interest rates have been slightly higher than inflationfor the most part of the preceding decade signallingpositive real interest rate, except for the crisis period.As a result of the deregulation on the lending and depositrates in the 1980s, greater movements in the interestrate followed. The decadal average rate is 15% forthe savings while it is 17% for time deposit. Consideringan average inflation rate of about 9%, this means thatreal interest rate is in the range of 6% to 8%.
The exchange rate, as in many developing countries,is one of the key determinants of prices. The exchangerate had been stable for most of the 1990s except forthe crisis period where it recorded more than 200%depreciation. There were also some significantfluctuations that happened in the late 1980s.
The Statistical Bureau (BPS) regularly reports averagewages by different types of job, sex and locations. Onecan observe that although in the pre-crisis period thereal wage has been prevented from declining, duringthe crisis the wild fluctuation in prices has cutsubstantially the value of the real wage to even belowthe 1994-levels. It is, however, difficult to estimate ameasure of average wage from these skill-specificwage data.
An alternative way is to approximate the average wagerate by the national average wage. The nationalaverage wage is calculated by dividing the share oflabour in output, estimated from the primary distributionof income, by the total number of employed workers.Basic source of data for computing the primary incomedistribution is the input-output table that Indonesianstatistical agencies prepare every five years. The latestavailable data show that the share of labour is 31.1%

Part IV Chapter 18
285
in 1990 and 42.3% in 1995. We find that averagenational increased by 25% in nominal terms during theperiod 1990-1995.126
Scenarios for the futureIn view of the analysis of the past performance, weset out two scenarios – the base line scenario and thelow growth scenario – regarding the futuredevelopment of the Indonesian economy. For eachscenario, the macroeconomic consistency has beenensured. It should be noted that these scenarios have
been devised to serve as a basis of the projections ofsocial security expenditure; they are not necessarilythe ILO’s forecasts of the Indonesian economy.
The table in Figure 122 summarises the keyassumptions under the both scenarios. It is assumedthat the economy will be able to regain the growthperformance of the pre-crisis period by 2005. The basescenario assumes that the economy will grow at 5.5%until 2014 and it slows down at 5%. The low growthscenario, on the other hand, assumes that the economywill keep 4% growth after 2003 onwards.
126 The input-output table for 2000 is still under preparation.
Figure 122 Table of Key Economic Assumptions, 2001-2030
2001 2005 2010 2015 2020 2030Base scenarioGrowth rates (%)GDP 3.0 5.5 5.5 5.0 5.0 5.0Productivity 1.7 3.0 3.0 2.8 2.8 2.8Employment 1.4 2.5 2.5 1.2 1.0 0.7Unemployment rate (%) 7.1 7.9 4.9 3.0 3.0 3.0
Low growth scenarioGrowth rates (%)GDP 3.0 4.0 4.0 4.0 4.0 4.0Productivity 1.9 2.5 2.5 2.5 2.5 2.5Employment 1.1 1.5 1.5 1.5 1.5 1.5Unemployment rate (%) 7.3 10.2 11.6 11.0 9.3 3.6
Under the base scenario, the labour productivityelasticity of growth is assumed to be 0.55 throughoutthe projection period. The resulting labour productivitygrowth is 1.7% in the immediate term before rising to3.0% by 2005 as the economy regains a substantialpart of its past growth performance then slows downto 2.8% starting 2015. In the low growth scenario, theassumed labour productivity elasticity of growth is0.625 throughout the period, thus yielding 2.5% labourproductivity growth.Given the assumptions on the future growth of outputand labour productivity, employment population isgenerated. In the base scenario the employment willgrow by 2.5% starting 2005 and will slow down to 1%in the longer term. In the low growth scenario,employment grows constantly at 1.5%. Since there isno firm trend in the labour participation rate, bothscenarios assume that the age-sex labour forceparticipation rates are maintained at the 2000-level.
As a result of the estimated employment and labourforce, the unemployment for the future is obtained.As Figure 122 indicates, in the base scenario
unemployment is estimated to increase to 7.9% in 2005then decrease to 3.0% in 2030. In the low growthscenario, unemployment rate exceeds 10% starting2005 and remains at double-digit levels until 2018. Itthen gradually stabilizes to 3.6% by the end of theprojection period.
The average inflation rate of the last decade excludingthe crisis years 1997-1999 is 8.6% per annum. Inflationrate is assumed to start at 8.6% but will be stabilizedto 5% per annum by 2013. The real wage is assumedto grow at the same rate as the productivity growth,hence by taking into account the inflation the nominalwage increase is obtained. Under these assumptions,in the base case scenario the labour income share inGDP will decrease from 42% in 2000 to about 35%by 2030. In the low growth scenario, the labour sharein output stays almost the same as the current level.As the average real interest rate in the past decadeappeared to be too high in view of the investmentperformance of Jamsostek, it is assumed to be 4.5%per annum for the base line scenario and 3.5% perannum for the low growth scenario.
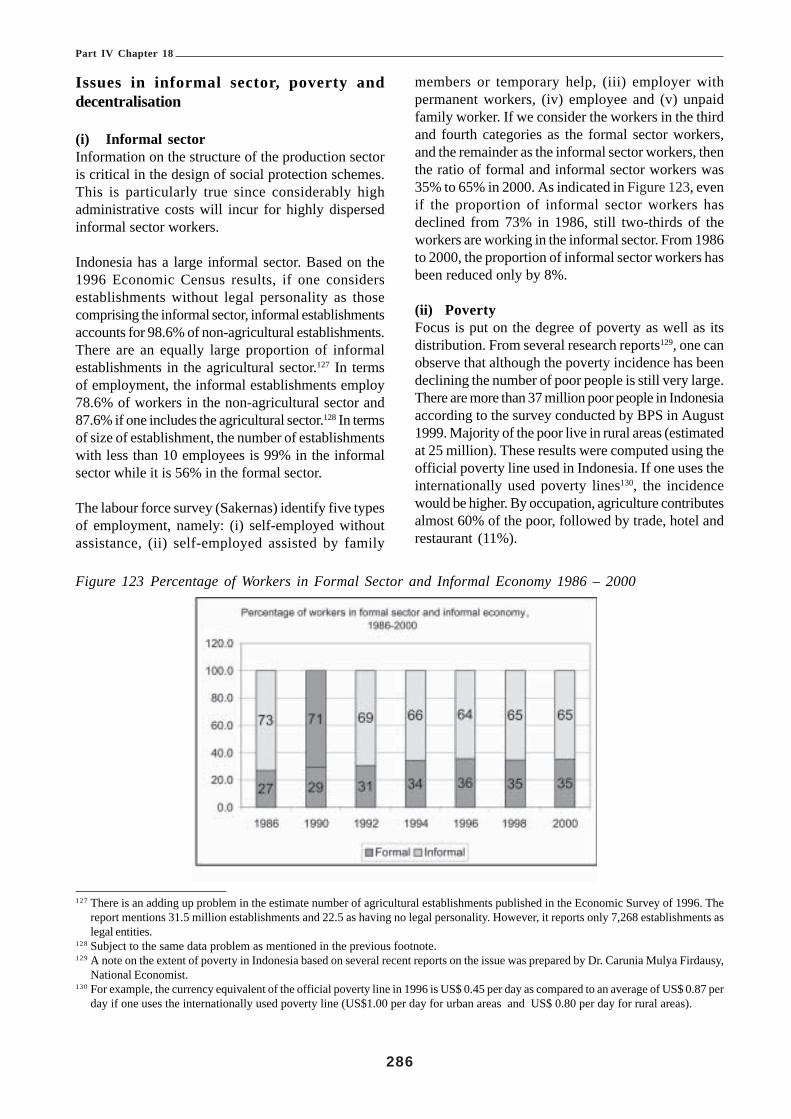
Part IV Chapter 18
286
Issues in informal sector, poverty anddecentralisation
(i) Informal sectorInformation on the structure of the production sectoris critical in the design of social protection schemes.This is particularly true since considerably highadministrative costs will incur for highly dispersedinformal sector workers.
Indonesia has a large informal sector. Based on the1996 Economic Census results, if one considersestablishments without legal personality as thosecomprising the informal sector, informal establishmentsaccounts for 98.6% of non-agricultural establishments.There are an equally large proportion of informalestablishments in the agricultural sector.127 In termsof employment, the informal establishments employ78.6% of workers in the non-agricultural sector and87.6% if one includes the agricultural sector.128 In termsof size of establishment, the number of establishmentswith less than 10 employees is 99% in the informalsector while it is 56% in the formal sector.
The labour force survey (Sakernas) identify five typesof employment, namely: (i) self-employed withoutassistance, (ii) self-employed assisted by family
members or temporary help, (iii) employer withpermanent workers, (iv) employee and (v) unpaidfamily worker. If we consider the workers in the thirdand fourth categories as the formal sector workers,and the remainder as the informal sector workers, thenthe ratio of formal and informal sector workers was35% to 65% in 2000. As indicated in Figure 123, evenif the proportion of informal sector workers hasdeclined from 73% in 1986, still two-thirds of theworkers are working in the informal sector. From 1986to 2000, the proportion of informal sector workers hasbeen reduced only by 8%.
(ii) PovertyFocus is put on the degree of poverty as well as itsdistribution. From several research reports129, one canobserve that although the poverty incidence has beendeclining the number of poor people is still very large.There are more than 37 million poor people in Indonesiaaccording to the survey conducted by BPS in August1999. Majority of the poor live in rural areas (estimatedat 25 million). These results were computed using theofficial poverty line used in Indonesia. If one uses theinternationally used poverty lines130, the incidencewould be higher. By occupation, agriculture contributesalmost 60% of the poor, followed by trade, hotel andrestaurant (11%).
127 There is an adding up problem in the estimate number of agricultural establishments published in the Economic Survey of 1996. Thereport mentions 31.5 million establishments and 22.5 as having no legal personality. However, it reports only 7,268 establishments aslegal entities.
128 Subject to the same data problem as mentioned in the previous footnote.129 A note on the extent of poverty in Indonesia based on several recent reports on the issue was prepared by Dr. Carunia Mulya Firdausy,
National Economist.130 For example, the currency equivalent of the official poverty line in 1996 is US$ 0.45 per day as compared to an average of US$ 0.87 per
day if one uses the internationally used poverty line (US$1.00 per day for urban areas and US$ 0.80 per day for rural areas).
Figure 123 Percentage of Workers in Formal Sector and Informal Economy 1986 – 2000
Part IV Chapter 18
287
(iii) DecentralisationAfter the promulgation of Laws 22 and 25 of 1999,Indonesia started a large scale decentralisationprogramme (regional autonomy), which devolves 40per cent of the central Government spending to lowerlevels of government (currently the transfer to localgovernments accounts for less than 20 per cent of thecentral budget spending). The Laws prescribe theirimplementation by June 2001. In fact, from the 2001budget, the central subsidy to local governments isprovided as a global amount and the local governmentsnow decide how to allocate the subsidies. This changewould have important implications on the administrationof social security schemes, in particular health careand social assistance.
To summarize this section ¾ the Indonesian populationhas been in a transition from a young age-structurewith high growth rates to an old age-structure withrelatively low growth. The projection results show thatthis trend will continue. In particular, the projectionresults show that Indonesia will experience a rapidpopulation ageing for the next few decades. By 2030,the percentage of the population older than the currentretirement age (55 years) and the old-age dependencyratio (defined as the population older than 55 dividedby the population aged 15-54 years) is expected to betwice as high as the current level. This will put heavypressure on the financing of social protection in thelong run.
Furthermore, due consideration is required on thefollowing socio-economic issues associated with thefuture demographic changes. Firstly, the increased lifeexpectancy after retirement will necessitate anincrease in the retirement age, possibly from the current55 years of age to 60 years or higher. Secondly, thetrend towards smaller families will reduce the level ofthe family support for the elderly and create the needfor old-age support in the form of social security.In terms of economic performance, the country hasgrown at rates higher than many other Southeast Asianeconomies except for the crisis period when itexperienced double-digit contraction. The industrialsector led the way in the past economic growth. Inaddition, except for the crisis period, the economy hasbeen stable with single digit inflation and relatively lowunemployment rates. One characteristic of theeconomy is that employment is predominated by a largeinformal sector.
It is always difficult to provide, with adequate degreesof confidence, a mid- to long-term economic scenario.
With this caveat, however, two scenarios – a base case(the most plausible) and a low growth case – havebeen set out here as a basic input to the financialanalysis of the social security expenditure.
Analysis of the Aggregate SocialInsurance Expenditure –
A Preliminary Social Budget Analysis
From a point of view of the national planning of socialsecurity, it is critical to consider the overall socialexpenditure. The purpose of this chapter is to establishthe analytical framework of social budgeting andpresent the results of a tentative estimation of socialexpenditure in Indonesia.
In this section, further to the results of JamsostekFinance and investments shown in Chapter 10, weconsider the financial projections of the other socialsecurity schemes, including the old-age pensionscheme for civil servants (TASPEN), the health carescheme for civil servants and other voluntary membersfrom the private sector (ASKES) and the proposedunemployment insurance scheme. We then analyse theaggregate social insurance expenditure and revenueand their impacts on the national economy.
All projection results in this section have been producedby the Social Budget Model developed by the ILO.The model consists of the demographic, economic, andlabour market modules, as well as various scheme-specific modules for the social security system of acountry. To achieve the overall consistency, the samedemographic and economic assumptions as describedin the first section in this Chapter have been used forthe projections.
Need for social budgetingDepending on the state of development, countriesredistribute between 5 to 30 per cent of GDP throughnational social protection systems. Under the nationalsocial protection systems, the financiers collect taxesor social security contributions and transfer them ascash benefits (e.g. social assistance, sick-pay orpensions) or benefits in kind (e.g. social or healthservices). This redistribution has a profound impacton the income distribution, the level and structure ofproduction, the government budget, the level andallocation of aggregate demand, and in turn on economicand social development itself.
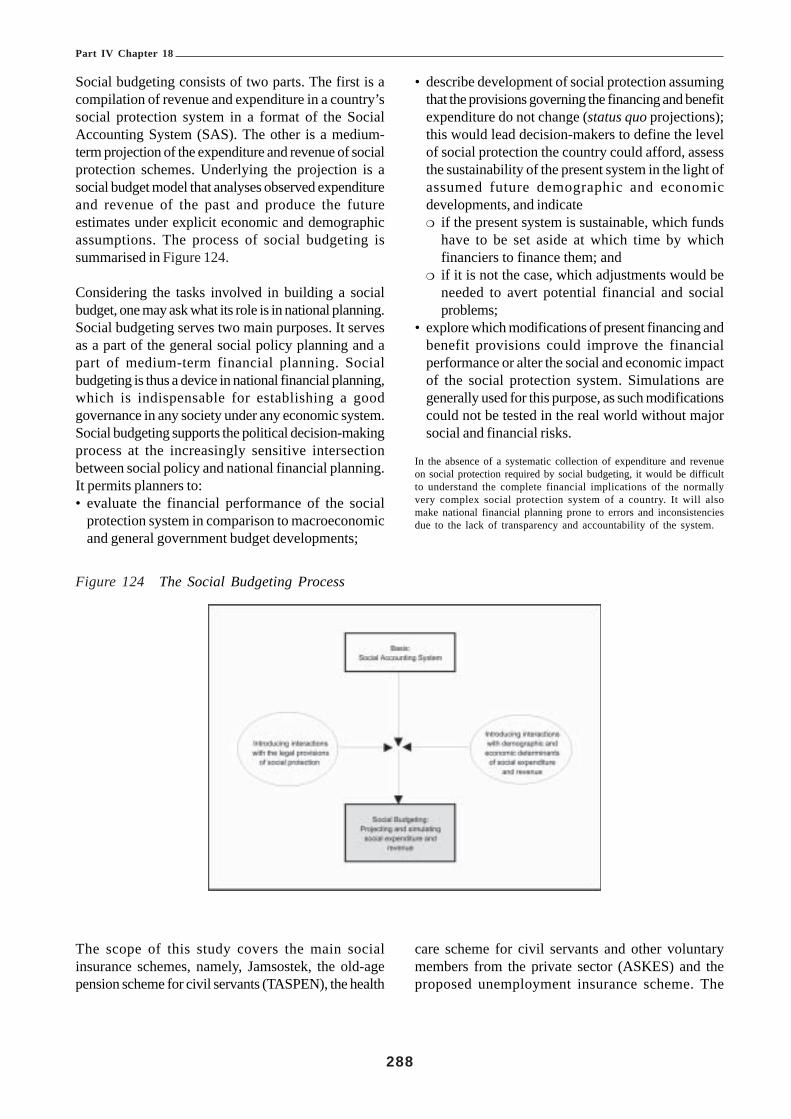
Part IV Chapter 18
288
Social budgeting consists of two parts. The first is acompilation of revenue and expenditure in a country’ssocial protection system in a format of the SocialAccounting System (SAS). The other is a medium-term projection of the expenditure and revenue of socialprotection schemes. Underlying the projection is asocial budget model that analyses observed expenditureand revenue of the past and produce the futureestimates under explicit economic and demographicassumptions. The process of social budgeting issummarised in Figure 124.
Considering the tasks involved in building a socialbudget, one may ask what its role is in national planning.Social budgeting serves two main purposes. It servesas a part of the general social policy planning and apart of medium-term financial planning. Socialbudgeting is thus a device in national financial planning,which is indispensable for establishing a goodgovernance in any society under any economic system.Social budgeting supports the political decision-makingprocess at the increasingly sensitive intersectionbetween social policy and national financial planning.It permits planners to:• evaluate the financial performance of the social
protection system in comparison to macroeconomicand general government budget developments;
• describe development of social protection assumingthat the provisions governing the financing and benefitexpenditure do not change (status quo projections);this would lead decision-makers to define the levelof social protection the country could afford, assessthe sustainability of the present system in the light ofassumed future demographic and economicdevelopments, and indicate! if the present system is sustainable, which funds
have to be set aside at which time by whichfinanciers to finance them; and
! if it is not the case, which adjustments would beneeded to avert potential financial and socialproblems;
• explore which modifications of present financing andbenefit provisions could improve the financialperformance or alter the social and economic impactof the social protection system. Simulations aregenerally used for this purpose, as such modificationscould not be tested in the real world without majorsocial and financial risks.
In the absence of a systematic collection of expenditure and revenueon social protection required by social budgeting, it would be difficultto understand the complete financial implications of the normallyvery complex social protection system of a country. It will alsomake national financial planning prone to errors and inconsistenciesdue to the lack of transparency and accountability of the system.
Figure 124 The Social Budgeting Process
The scope of this study covers the main socialinsurance schemes, namely, Jamsostek, the old-agepension scheme for civil servants (TASPEN), the health
care scheme for civil servants and other voluntarymembers from the private sector (ASKES) and theproposed unemployment insurance scheme. The

Part IV Chapter 18
289
scheme for the military and police personnel (ASABRI)has not been included in the analysis due to theunavailability of data on the military and policepersonnel. Moreover, neither the proposed socialassistance scheme nor maternity benefits scheme hasbeen included. While there is a technical report on socialassistance131 prepared for this project, it focuses onthe design of the programme and the principle of costsharing between the central and provincialgovernments on a non-quantitative basis. Similarly, nostudy has been made yet on the cost estimates of thematernity benefit.
However incomplete and preliminary the social budgetmodel may be, it is believed to be still useful in adecision-making context. To demonstrate theusefulness of the social budgeting, let us consider theeffect of the proposed unemployment benefit and itsimpact on the existing old-age benefit. With theintroduction of the unemployment benefit, the numberof old-age beneficiaries on grounds of unemploymentis expected to be less (in fact, this effect has alreadybeen taken into account in our projection made inChapter 2). Therefore, more workers are expected toreceive their old-age benefits on grounds of attainingthe retirement age 55.
Similarly, different social insurance benefits interact in many ways.If the unemployment benefit is not implemented, the need for socialassistance may arise, or the pressure on early retirement or on invaliditybenefit may increase again; and, if the Government reduces its budgeton health expenditure, expenditure in the health insurance schemesis likely to increase, etc. In order to take into account such substitutioneffects between different schemes – or even general equilibrium effectson other markets, concentration on a single scheme is not enough.Any policy evaluation should be made within the framework of thesocial account encompassing all types of expenditure related to socialprotection.
Financial projections of socialinsurance schemes other thanJamsostek
TASPEN – Insurance and pension programmefor civil servants and retirees
(i) Description of the current schemeTASPEN is a state-owned enterprise assigned byGovernment to manage the Social Insurance Program
for civil servants. The scheme provides lump-sum(insurance) benefits and pensions.
Membership132. Membership in the TASPENprogramme is compulsory for civil servants. In 1995,TASPEN covered about 4 million current membersand 1.5 million retirees (Leechor, 1996). In 1997, therewere 1.646 million retirees and 742.8 thousandreceiving survivors pension (ILO, 1999). Anindependent estimate by the State PersonnelAdministration (BKN) and the Ministry of Financeindicates the number of civil servants and members ofthe Armed Forces and Police at 4.6 million in 1999(Filmer and Lindauer (n.d.)).
Contribution/Funding. Civil servants make monthlycontributions of 8% of their salary, of which 3.25percentage-points are used to finance the lump-sum(insurance) benefits (THT) and the remaining 4.75percentage-points go into the pension fund. TASPENis designated to cover the costs of the lump-sumbenefits and 25% of the pension benefits. Theremaining pensions cost (75%) is paid from theGovernment budget.133 The table in Figure 125 showsthat the contributions from members amounted to Rp.543 billion for lump-sum benefits and Rp. 736 billionfor pensions in 2000. In the same year, the Governmentsubsidy for the pension was Rp. 9,757 billion.
Benefits. There are two types of benefits: (a) thepension benefit, which pays periodical retirementpensions or survivors’ pensions; and (b) the lump-sum(insurance) benefit, which is payable upon death orretirement of an insured worker. The lump-sum benefitis equal to 16.5 months of salary in the event of deathin service or on attainment of retirement age (56 years).The pension amount is calculated as the sum of 2.5%of the final monthly salary for each year of service.On death, before or after retirement, a monthly pensionis paid to the widow or widower (or to the children ifthere is no spouse). In 2000, the total benefit paymentsamounted to Rp. 1 trillion for insurance and Rp. 11.6trillion for pensions.
131 ILO, “Follow up report on social assistance in Indonesia”.132 No membership data or the number of civil servants was available. The number of members was estimated from previous estimates of
the number of civil servants.133 This is the proportion given by Didi Achdijat, Executive Director of Operations/COO, TASPEN. However, ILO (1999) and Leechor
(1996) describe that the cost sharing is 22.5% from contributions and 77.5% from the Government.

Part IV Chapter 18
290
134 No membership data was available so the number of members was estimated from previous estimates of the number of civil servants.Coverage was computed based on the contribution from the financial statements, the estimated average wage and the estimated numberof civil servants.
135 ILO (1999), “Restructuring of the social security system in Indonesia (ILO/TAP/Indonesia/R.20)”.
Figure 125 Table of Taspen Financial Indicators
TASPEN - Financial Indicators
Insurance Pension1998 2000 1998 2000
Total revenues (Billion, Rp.) 1,559.59 1,270.18 6,986.96 11,714.39Contribution - members 520.86 543.30 720.29 736.26Contribution - State 4,166.97 9,757.15Investment income 1,037.19 673.31 2,067.06 1,191.35
Total Expenditures (Billion, Rp.) 1,466.50 1,176.66 5,681.29 11,637.26Benefits 1,210.20 1,049.05 5,620.57 11,536.38
Investments 4,427.23 5,877.61 8,163.93 10,838.48
Source: TASPEN Financial Reports
(ii) Assumptions for the future
Membership. Members are assumed to include allcivil servants as mandated by law. Coverage rate isexpected to rise from the existing 66%134 for insuranceand 62% for pension to 90% by 2010 and stay at thislevel thereafter.
Contribution. As legally mandated contributions areassumed to be 8% of salary, 3.25% for lump-sumbenefits and 4.75% for pensions. This is assumed togrow at the rate of average wage plus the growth ofcivil servants. It is also assumed that the Governmentwill subsidise 75% of the pension benefits.
Benefits. Benefits are assumed to grow at the rateof wage growth and the growth of the beneficiaries.For insurance beneficiaries is assumed to grow at therate of growth of civil servants. For pension this isassumed to growth at the rate of growth of population55 years and above.
Reserves/Investments. The reserves are assumedto be equal to investments in the initial year ofprojection. The reserves will grow by the amount ofsurplus from operations and is expected to earn at therate of interest assumed in the macroeconomicscenario.
Administrative expenses. Administrative expensesare assumed to stay at the current percentage ofcontributions (14%).
(iii) Prospects for the futureUnder these assumptions, despite the heavyGovernment subsidy, the expenditure is expected toexceed the total income by 2003 for the insuranceprogramme and by 2001 for the pension programme.It should be noted that these timings are earlier thanthe estimate made by the ILO135 in 1999, whichpredicted that these would occur by 2006. If nomeasure is taken, reserves will be exhausted by 2009for the insurance programme and 2004 for the pensionprogramme.
ASKES – Health care programme for civilservants and voluntary private organizations
(i) Description of the current schemeASKES is a state-owned corporation providinghealth care to its members based on the concept ofmanaged health care. The mission of ASKES isstated as follows:1. Perform and support Government policies and
programs in the national development, in general,and health development, in particular, as a leading

Part IV Chapter 18
291
sector in “health insurance” which provides“managed health care” comprising of promotive,preventive, curative and rehabilitative care, toachieve optimal health status.
2. Promote public awareness in health insuranceby developing an effective health care andfinance system.
3. Enhance the health status of civil servants,pensioners, veterans, pioneers of nationalindependence and their dependents and alsovoluntary members.
Membership. Membership is compulsory for activecivil servants and pensioners. In 1991, the compulsorymembership was extended to include veterans andpioneers or fighters of national independence. Also in1991, a voluntary membership for employees of statecompanies and private corporations was introduced.In 1999, the total number of members is 14.3 millioncomprising as follows: compulsory member heads ofhousehold is 5.2 million with 8.5 million family members,and 0.6 million voluntary members.
Number of government employees. Filmer andLindauer (n.d.)136, citing an independent estimate ofState Personnel Administration Board (BKN) and theMinistry of Finance, estimated the number of civilservants and those who work for the Armed Forcesand the police at 4.6 million in 1999. EIU (2000)estimated the active members of the Armed Forces at298,000 and the police at 206,000.
Contributions. The contribution rate, by law, is 2%of salary. In 1999, the collection of contributions isnearly 100%. The full contribution collection is usuallythe case for Government employees as theircontributions are deducted from salary.
Benefits. The standard benefits include: (1) Primaryhealth care; (2) Secondary health care; (3) Inpatientcare; (4) Normal and abnormal delivery; (5) Simplelaboratory and X-ray procedure; (6) Pharmaceutical;(7) Supplement: Eye glasses, Dental prosthesis. Astandard plus package includes, in addition to thestandard benefits, special care such as CT Scan andMRI, and extremities prosthesis.
Figure 126 Askes Basic Indicators 1995, 1999
ASKES - Basic Indicators, 1995, 1999
1995 1999
Total Revenues (Billion, Rp.) 336.71 650.07Contribution 292.266 519.169
Total Expenditure (Billion, Rp.) 261.62 532.92Benefits 195.66 427.98
Membership (000) 15,916 14,374Compulsory 15,784 13,719
Heads of households 5,327 5,176Family 10,457 8,543
VoluntaryMembers 132 655
Source: ASKES Annual Reports
(ii) Assumptions for the future
Membership. It is assumed that the contributingmembers include all active civil servants, which by laware compulsory members, and voluntary members. Thedifference between the number of member heads ofhouseholds and the active civil servants is assumed tobe retirees or veterans137 who became compulsorymembers after 1991. In addition to contributingmembers, family dependent members are assumed atthe rate of 1.65138 family members per contributingmember. We assume that these are non-contributingmembers.
Contributions. Contributions are assumed to be atthe statutory rate of 2% of wages. The contributorywage was based on the National Average Wage givenin the economic scenario. The number of contributorsis composed of two groups, namely, (i) compulsoryactive civil servants, and (ii) voluntary head ofhousehold members from other firms. It is assumedthat the State pays the contributions for retirees,veterans and fighters for national independence.Consequently, contributions are assumed to grow atthe rate of the sum of growth average wage plus thegrowth of number of civil servants.
Benefits. Benefit was pegged at the 1999 benefit permember ratio. This amounts to slightly less thanRp.30,000 per year or about 0.56% of average annual
136 Filmer, D. and D. Lindauer (n.d.) “Does Indonesia Have a “Low Pay” Civil Service?” World Bank WPS 2621.137 ILO (1999) “Restructuring of the social security in Indonesia,” reports that by the end of 1998 13.6 million were covered on a
compulsory basis including 4 million civil servants and 1.4 million retirees. This is very close the estimate for 1999 using the formulathat all civil servants are covered and the difference between the recorded compulsory member heads of households less the number ofcivil servants is the estimates for the number of member retirees.
138 This is the ratio of family to heads of family in the 1999 report of ASKES for the compulsory members.

Part IV Chapter 18
292
average wage. This is assumed to grow at the rate ofwage increase and the growth of number of members.
Other expenses. Administrative expenses areassumed to develop in line with the contribution income.
(iii) Prospects for the futureUnder the above assumptions, ASKES is expected tohave a continuous surplus in the future. This is mainlyascribed to the current low benefit level. It is feasibleto substantially increase ASKES’s benefit withoutputting any major financial difficulties. The ILO notedthat the Government subsidizes the public health carefacilities. ASKES was also aware that it pays lowerthan the general tariff for the services it provides to itsmembers.
The proposed unemployment insurance scheme
(i) IntroductionAt present, Indonesia has no unemployment insuranceprogramme. In the framework of the present project,the ILO undertook a feasibility study for introducingan unemployment insurance programme in Indonesia.Several options are presented in the technicalreports139. For the purpose of projection, we havechosen one option, essentially the medium scenario, toillustrate possible impacts of the proposedunemployment insurance programme.
(ii) Assumptions for the futureMembership/Coverage. The programme will initiallycover only the formal private sector workers andemployees with permanent jobs. The scope isessentially the same as Jamsostek. Therefore, it hasbeen assumed that the coverage is approximated bythe covered workers of the old-age programme ofJamsostek.
Contribution. Contribution base will be the estimatedinsured wages which are estimated at 60% of theaverage wage based on the calculation in the technicalreport. We also adopt the recommended contributionrate of 2% in the same study.
Insurable wage. The estimated average insurablewage in Jamsostek is Rp. 3.65 million per year, whichis about 60% of the national average wage. We haveuse this proportion to estimate the insurable wage.
Benefits. The level of unemployment benefit isassumed to be 60% of the insurable wage and 10weeks average duration. Benefits will be paid after 12months of the implementation which is assumed to be2001. We adopt the recommended medium scenarioclaim rate of 15% of active members. Given 10 weeksaverage duration and 15% claim rate, the impliedunemployment among the insured is estimated around2.9%.
Administrative expenses. It is estimated that theincremental administrative cost of a modified lump-sum payment scheme implemented under Jamsostekis Rp. 15,000 per member. We use this figure toestimate the administrative expenses.
Investment in fixed assets. Since this is a newscheme, it has to invest in fixed assets, such as officeequipment etc. We assume that investments in fixassets as a ratio to benefits and administrative cost is15%, 20% and 13%, respectively, for the first threeyears of operations. After the devaluation of the fixassets, the administrative cost is assumed to decreaseto 2.5% and stay at this level for the rest of theprojection period.
Reserves. Reserves are built up from surpluses inthe financial operations.
(iii) Prospects for the futureUnder the above assumptions, the scheme is expectedto pay its benefits and administrative costs and buildup sufficient reserves over years, except for secondand third year of implementation, where there will beexpected shortfall of revenue mainly due to theinvestment in fixed assets, the rest of the simulationyears have positive surpluses. The benefit/contributionratio stays at 0.87. The reserve ratio indicates thateven during the negative surplus years reserves wouldnot be exhausted and the scheme will be able to buildup a reserve level that is more than two years’ benefits.
Analysis of the consolidated social expenditureand revenueMain financing resources of social security benefitscome from the national income. It is therefore importantto assess its feasibility relative to the futureperformance of the economy. To the extent that someof the benefits are funded from government revenues,it is also important to assess its impact on thegovernment budget.
139 ILO, “Report on the feasibility of introducing an unemployment insurance benefit in Indonesia” and “Follow up report on thefeasibility of introducing an unemployment insurance benefit in Indonesia”.

Part IV Chapter 18
293
Total social insurance expenditure and revenuesThe table in Figure 126 summarises the estimated totalsocial security expenditure and revenue (in nominalterms) from year 2000 to 2030. Total expenditure isexpected to grow from Rp. 15 trillion in 2000 to Rp.453 trillion by 2030. Total revenues, on the other hand,will increase from Rp. 17 trillion in 2000 to Rp. 524trillion by 2030. Thus, in aggregate, the revenuesexceed the expenditure. In fact, the overall surplusesincrease from Rp. 3 trillion to Rp. 70 trillion by 2030.However, it should be noted that the pension benefitsfor civil servants (TASPEN) are expected to producecontinuous income shortfall unless it is further coveredby the Government.
In terms of its share to GDP, total expenditure andrevenue are at a relatively low level, not exceeding2%. Total expenditure would rise from 1.14% in 2000to 1.5% by 2030. Total revenues on the other hand
would rise from 1.37% in 2000 to 1.73% in 2030.Surpluses stay at a little over 0.2% of GDP throughoutthe projection years. Benefits would rise from theexisting 1.1% to 1.46% by 2030. Member contributionswould increase from 0.37% in 2000 rising to around0.49% by 2010 then down to 0.45% by 2030. Subsidyfrom general revenues would rise from 0.77% in 2000to 0.92% by 2020. This implies that about one-third ofthe government expenditure on personnel expenditureare salaries and pensions. It should be noted that thisdoes not include the implicit pension deficit of theTASPEN.
In terms of the share to the total amount, benefitsaccounts for around 97% to 98% of the totalexpenditure. Members contribute as much as 35% ofthe total revenue, while the Government contributesmore than 50% of revenue. Any remainder is fundedfrom investment income.
Figure 127 Table of Social Insurance Expenditure and Revenue, 2000-20302000 2005 2010 2015 2020 2025 2030
Levels (Billion, Rp.)Total Expenditure 14,693 28,002 51,784 92,421 160,192 271,625 452,901Benefits 14,191 26,964 50,090 89,782 156,109 265,292 443,110Administrative 502 1,038 1,694 2,639 4,083 6,332 9,791
Total Revenues 17,745 32,417 60,194 107,542 186,492 316,000 523,714Contributions 4,958 11,258 20,860 34,292 55,112 88,131 139,563State subsidy 9,757 16,472 30,894 55,512 96,842 164,346 272,870Invesment Income 3,030 4,687 8,441 17,738 34,538 63,523 111,282
Surplus 3,052.17 4,414.05 8,409.79 15,121.29 26,300.15 44,375.69 70,813.55
As % to GDPTotal Expenditure 1.14% 1.20% 1.24% 1.32% 1.40% 1.46% 1.50%Benefits 1.10% 1.16% 1.20% 1.28% 1.37% 1.43% 1.46%Administrative 0.04% 0.04% 0.04% 0.04% 0.04% 0.03% 0.03%
Total Revenues 1.37% 1.39% 1.44% 1.53% 1.63% 1.70% 1.73%Contributions 0.37% 0.47% 0.49% 0.48% 0.47% 0.46% 0.45%State subsidy 0.77% 0.72% 0.75% 0.80% 0.86% 0.90% 0.92%Invesment Income 0.23% 0.20% 0.20 %0.25% 0.30% 0.34% 0.37%
Surplus 0.24% 0.19% 0.20% 0.22% 0.23% 0.24% 0.23%
As % to TotalsTotal Expenditure 100.00% 100.00% 100.00% 100.00% 100.00% 100.00% 100.00%Benefits 96.58% 96.29% 96.73% 97.14% 97.45% 97.67% 97.84%Administrative 3.42% 3.71% 3.27% 2.86% 2.55% 2.33% 2.16%
Total Revenues 100.00% 100.00% 100.00% 100.00% 100.00% 100.00% 100.00%Contributions 27.94% 34.73% 34.65% 31.89% 29.55% 27.89% 26.65%State subsidy 54.98% 50.81% 51.32% 51.62% 51.93% 52.01% 52.10%Invesment Income 17.08% 14.46% 14.02% 16.49% 18.52% 20.10% 21.25%

Part IV Chapter 18
294
Functional summary of social insurancebenefitsThe table in Figure 128 provides the functional summaryof expenditure on benefits. Benefits from old-ageprograms will be Rp. 13 trillion in 2000 and Rp. 422trillion by 2030. Short-term benefits, including workinjury, death benefits, health, unemployment and specialprograms will be Rp. 742 billion in 2000 rising to Rp.21 trillion by 2030.
As a percentage of GDP, old-age benefits increasefrom 1.04% in 2000 to 1.39% by 2030. The increasein old-age benefits accelerates for the next 15 yearsand shows down thereafter, as shown in Figure 129.This increase in old-age benefit is principally due to
the ageing population. Short-term benefits, on the otherhand, are relatively stable at 0.06% in 2000 and 0.07%by 2030.
In terms of the share to total benefits, old-age benefitsaccount from 92% to 95% of the total benefits whileshort-term benefits account from 5% to 8% of thetotal benefits. Among the short-term benefits,unemployment and health care schemes account forlarge shares. Unemployment, for instance, accountsfrom 2.5% to 3.9% while health care accounts from0.9% to 2.8%. The health care benefit andunemployment benefit, however, are expected todecline over time as shown in Figure 130. Work injury,death and special programmes are expected to stay atthe 2010 level.
Figure 128 Table of Social Insurance Expenditure by Benefit, 2000-2030
2000 2005 2010 2015 2020 2025 2030Levels (Billion, Rp.)
Total 14,191 26,964 50,090 89,782 156,109 265,292 443,110Old-age 13,449 24,711 46,347 83960 147,166 251,471 421,770Short-term benefits 742 2,254 3,744 5,821 8,943 13,821 21,339
Work injury 100 302 576 950 1,558 2,545 4,108Death benefits 25 112 213 352 577 943 1,521Health 615 760 1,007 1,342 1,885 2,765 4,159Unemployment - 1,053 1,895 3,086 4,768 7,310 11,119Special programme 2 27 53 93 155 258 432
As % of GDPTotal 1.0995% 1.1563% 1.1980% 1.2815% 1.3679% 1.4271% 1.4634%
Old-age 1.0420% 1.0596% 1.1085% 1.1984% 1.2895% 1.3528% 1.3929%Short-term benefits 0.0575% 0.0966% 0.0895% 0.0831% 0.0784% 0.0743% 0.0705%
Work injury 0.0078% 0.0129% 0.0138% 0.0136% 0.0137% 0.0137% 0.0136%Death benefits 0.0019% 0.0048% 0.0051% 0.0050% 0.0051% 0.0051% 0.0050%Health 0.0476% 0.0326% 0.0241% 0.0192% 0.0165% 0.0149% 0.0137%Unemployment 0.0452% 0.0453% 0.0440% 0.0418% 0.0393% 0.0367%Special programme 0.0002% 0.0012% 0.0013% 0.0013% 0.0014% 0.0014% 0.0014%
As % to TotalTotal 100.00% 100.00% 100.00% 100.00% 100.00% 100.00% 100.00%
Old-age 94.77% 91.64% 92.53% 93.52% 94.27% 94.77% 95.18%Short-term benefits 5.23% 8.36% 7.47% 6.48%5 .73% 5.21% 4.82%
Work injury 0.71% 1.12% 1.15% 1.06% 1.00% 0.96% 0.93%Death benefits 0.17% 0.41% 0.43% 0.39% 0.37% 0.36% 0.34%Health 4.33% 2.82% 2.01% 1.49% 1.21% 1.04% 0.94%Unemployment 0.00% 3.91% 3.78% 3.44% 3.05% 2.76% 2.51%Special programme 0.02% 0.10% 0.11% 0.10% 0.10% 0.10% 0.10%
Note: Excluding administrative expenses.
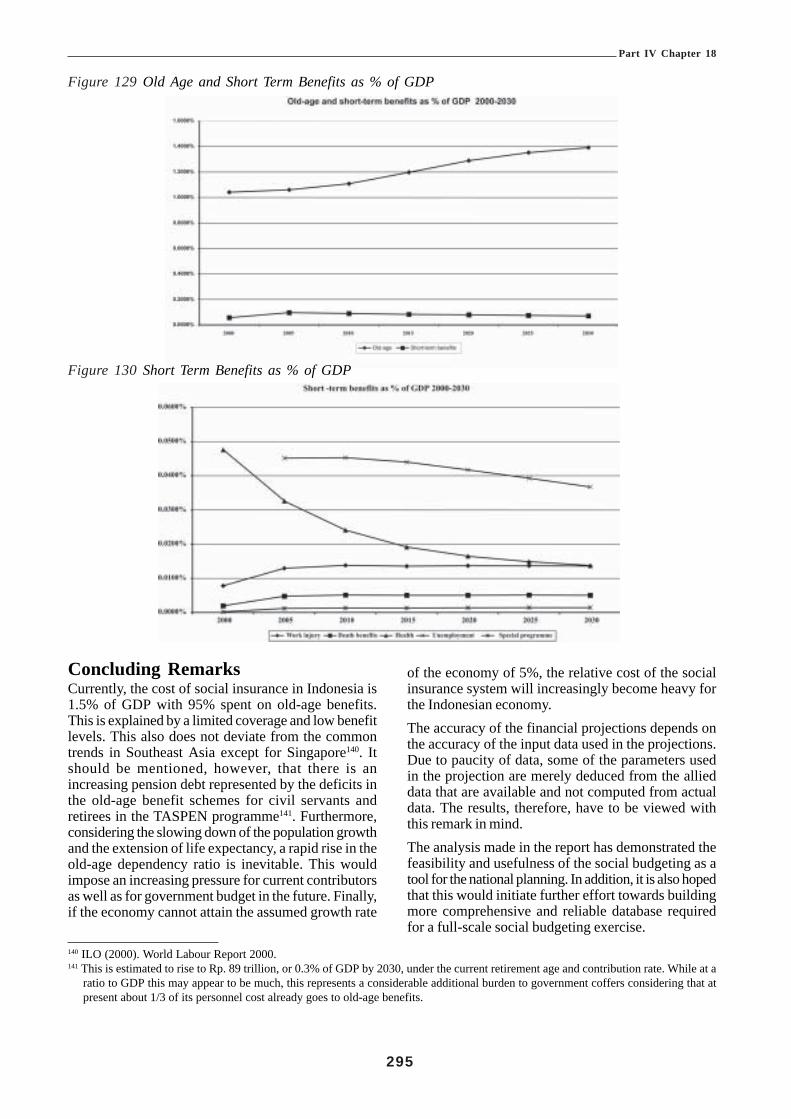
Part IV Chapter 18
295
140 ILO (2000). World Labour Report 2000.141 This is estimated to rise to Rp. 89 trillion, or 0.3% of GDP by 2030, under the current retirement age and contribution rate. While at a
ratio to GDP this may appear to be much, this represents a considerable additional burden to government coffers considering that atpresent about 1/3 of its personnel cost already goes to old-age benefits.
Figure 129 Old Age and Short Term Benefits as % of GDP
Figure 130 Short Term Benefits as % of GDP
Concluding RemarksCurrently, the cost of social insurance in Indonesia is1.5% of GDP with 95% spent on old-age benefits.This is explained by a limited coverage and low benefitlevels. This also does not deviate from the commontrends in Southeast Asia except for Singapore140. Itshould be mentioned, however, that there is anincreasing pension debt represented by the deficits inthe old-age benefit schemes for civil servants andretirees in the TASPEN programme141. Furthermore,considering the slowing down of the population growthand the extension of life expectancy, a rapid rise in theold-age dependency ratio is inevitable. This wouldimpose an increasing pressure for current contributorsas well as for government budget in the future. Finally,if the economy cannot attain the assumed growth rate
of the economy of 5%, the relative cost of the socialinsurance system will increasingly become heavy forthe Indonesian economy.The accuracy of the financial projections depends onthe accuracy of the input data used in the projections.Due to paucity of data, some of the parameters usedin the projection are merely deduced from the allieddata that are available and not computed from actualdata. The results, therefore, have to be viewed withthis remark in mind.The analysis made in the report has demonstrated thefeasibility and usefulness of the social budgeting as atool for the national planning. In addition, it is also hopedthat this would initiate further effort towards buildingmore comprehensive and reliable database requiredfor a full-scale social budgeting exercise.

Part IV Chapter 19
296
CHAPTER 19 KLATEN REVISTED
Executive Summary
During the ILO Project, Experts identified “The HealthSector Finance Project and Klaten Field Trial” aspotentially being a source of data and experience thatwould be of value to several of the studies beingundertaken directly to meet the terms of reference ofthe Project. Accordingly ILO commissioned the report“Klaten Revisited” on which this Chapter is based.
Significant healthcare reform efforts were initiatedfollowing the monetary and oil crises in Indonesiaduring the 1980’s. The pace of reform effortsaccelerated in the early 1990’s. One mechanismutilized by the Indonesian Ministry of Health to developand implement these reforms was a bilateral projectbetween the Ministry and the United States Agencyfor International Development. From this project,termed the Health Sector Finance Project (HSF),major national healthcare strategies emerged such ashospital autonomy (Swadana), Rational Drug Use, andJPKM Managed Care.
During the first five years of project implementation, alack of integration among the healthcare reformstrategies was recognized. Separate testing sitesprecluded integrative efforts during the original HSFproject, therefore, the project agreement was amendedto permit observation of these policies in a singlelocation to identify unanticipated operational problemsand policy conflicts between the reform components.A district in Central Java, Klaten was chosen at thesite. This so-called Integrated Healthcare Reform FieldTrial was extended an additional two years and wascompleted in March of 1999.
The Klaten Field Trial was designed to permit thesimultaneous operation of three healthcare financing
schemes, an autonomous Unit Swadana hospital, andthe pharmaceutical reform strategy in a single district.In addition, regulatory efforts were to be extended tomonitor JPKM programs and enforce the JPKMregulations. In addition, the Swadana concept was tobe expanded to government health centres.
By the end of the Klaten project, all but two of theobjectives had been achieved. Indicators such asimmunization rates, prenatal care, and attendeddeliveries were in the top 1% nationally. Significantimprovements quality of care, cost efficiency, andresource use were achieved. Lessons, sometimespainful, were learned and mistakes not repeated. Ahost of cost effective methodologies for socio-economic analysis, cross subsidy calculations, unit costdetermination, quality of care and health statusmeasurement were developed. A viable approach tohealthcare financing for informal sector was created.Most importantly, major policy issues were identifiedthat have obstructed health sector reform and growthfor the last decade.
Districts throughout Indonesia are now facing thechallenges of decentralization. It is the district thatwill be responsible for the health of their population.One of the major concerns in the decentralization ofhealthcare is the capacity of the district governmentsto carry out this mission. In the years that follow,districts will be dealing with the issues of healthcarefinancing, how to run the district hospital, what to dowith the post contract doctors, and how to improvethe health of their populations. Formidable challengesthese districts will have to face in the near future.
There is one district that has already faced thesechallenges. It may well be that districts now facingdecentralization have much to learn from Klaten andcould benefit by building on the experiences there bothgood and bad.

Part IV Chapter 19
297
Bab 19. Retrospeksi terhadap UjiCoba Klaten
Rangkuman Eksekutif
Selama proyek ILO, Para Tenaga Ahli mengidentifikasi“Proyek Pembiayaan Sektor Kesehatan dan Uji CobaLapangan Klaten” sebagai sumber data danpengalaman yang berharga bagi beberapa studi yangsedang dilakukan secara langsung untuk memenuhibatasan studi (terms of reference) Proyek ini. Sesuaidengan itu, ILO meminta penyusunan laporan “KlatenRevisited” (Retrospeksi terhadap Uji Coba Klaten),yang menjadi dasar Laporan ini.
Upaya-upaya penting untuk mereformasi pemeliharaankesehatan di Indonesia mulai dilakukan setelah adanyakrisis moneter dan minyak pada tahun 1980-an, tetapibarulah pada awal tahun 1990-an, laju upaya reformasidi bidang pemeliharan kesehatan ini mulai bergerakcepat. Suatu mekanisme yang digunakan DepartemenKesehatan Indonesia untuk menyusun danmelaksanakan upaya-upaya reformasi ini adalahberupa suatu proyek bilateral antara DepartemenKesehatan dan United States Agency forInternational Development (Lembaga AmerikaSerikat untuk Pembangunan Internasional). Dariproyek ini, yang disebut Proyek Pembiayaan SektorKesehatan (Health Sector Finance Project atauHSF), lahirlah strategi-strategi utama di bidangpembiayaan perawatan kesehatan di tingkat nasional,seperti misalnya, otonomi rumah sakit (Swadana),pemakaian obat secara rasional, dan JPKM ManagedCare.
Selama lima tahun pertama proyek ini dilaksanakandiakui kurang adanya integrasi antara strategi-strategiperombakan perawatan kesehatan. Tempat-tempatpengujian yang saling terpisah satu sama lain sudahsejak awal tidak memungkinkan dilakukannya upaya-upaya terpadu selama berlangsungnya proyek asli HSF.Karena itu dilakukan perubahan terhadap kesepakatanmengenai proyek ini untuk memungkinkan dilakukannyapengamatan terhadap kebijakan-kebijakan reformasiyang diterapkan dalam satu lokasi tunggal gunamengidentifikasi masalah-masalah operasional yangtidak terantisipasi serta konflik-konflik kebijakan yangterjadi antara komponen-komponen reformasi. Suatukabupaten di Jawa Tengah, yaitu Klaten, telah dipilihsebagai tempat uji coba. Uji Coba Lapangan Terpadudi bidang Reformasi Perawatan Kesehatan ini akhirnyadiperpanjang selama dua tahun dan selesai pada bulanMaret 1999.
Uji Coba Klaten tersebut dirancang untukmemungkinkan dijalankannya tiga skema pembiayaan
perawatan kesehatan secara bersamaan, suatu rumahsakit otonom Unit Swadana, dan strategi reformasi dibidang farmasi dalam satu kabupaten. Selain itu, upaya-upaya penerapan peraturan diperluas guna memonitorprogram-program JPKM sekaligus menegakkanperaturan-peraturan JPKM. Di samping itu, konsepSwadana akan diperluas ke pusat-pusat kesehatanpemerintah.
Pada akhir proyek Klaten, semua tujuan (kecuali duadi antaranya) telah tercapai. Indikator-indikator sepertitingkat imunisasi, perawatan sebelum melahirkan, danproses melahirkan dengan pendampingan (attendeddeliveries) berada dalam peringkat satu persen teratassecara nasional. Perbaikan-perbaikan yang signifikandalam kualitas layanan, efisiensi biaya, dan penggunaansumber daya telah dapat dicapai. Pelajaran-pelajaran,meski kadang-kadang menyakitkan, telah berhasildipelajari dan kesalahan tidak diulang. Sekumpulanmetodologi yang efektif dari segi biaya untuk analisasosial ekonomi, perhitungan subsidi silang, penetapanbiaya unit, kualitas perawatan dan pengukuran statuskesehatan berhasil dikembangkan. Suatu pendekatanyang dapat dijalankan terhadap pembiayaan perawatankesehatan bagi sektor informal berhasil diciptakan. Danyang paling penting, permasalahan kebijakan utamayang menghambat reformasi dan pertumbuhan sektorkesehatan selama dasawarsa terakhir telah berhasildiidentifikasi.
Dengan diberlakukannya undang-undang otonomidaerah, kabupaten-kabupaten di seluruh Indonesia saatini menghadapi tantangan desentralisasi. Artinya,kabupaten-lah yang akan bertanggung jawab ataskesehatan penduduk di wilayah masing-masing. Salahsatu keprihatinan utama dalam desentralisasiperawatan kesehatan adalah kemampuan pemerintahkabupaten untuk melaksanakan misi ini. Di tahun-tahunberikutnya, kabupaten-kabupaten akan menghadapimasalah-masalah pembiayaan perawatan kesehatan,bagaimana menjalankan rumah sakit kabupaten, apayang harus dilakukan dengan para dokter setelah masakontrak mereka habis, dan bagaimana meningkatkankesehatan penduduk di wilayah masing-masing. Adatantangan-tantangan berat yang harus dihadapikabupaten-kabupaten ini dalam waktu dekat.
Namun, ada satu kabupaten yang telah menghadapitantangan-tantangan tersebut. Mungkin, kabupaten-kabupaten yang saat ini sedang menghadapidesentralisasi harus belajar banyak dari Klaten dandapat memetik manfaat dari pengalaman-pengalamanyang dialami Klaten, baik yang baik maupun yangburuk, dan menggunakannya untuk membangun sistempembiayaan perawatan kesehatan di wilayah masing-masing.

Part IV Chapter 19
298
IntroductionEquitable access to basic health services according tothe need and regardless of the ability to pay is a goalshared by most nations. Though it is a commonaspiration, equity in healthcare is difficult to achieve.Over the last three decades, the Government ofIndonesia has put forth significant effort to improveaccess to health services across the archipelago. Amajor healthcare reform effort was mounted in themid-1980’s, which featured numerous strategies toincrease social equity. The National Health Law 23promulgated in 1992 clearly states the right of everyIndonesia to have access to and received neededmedical care.142 Yet, there is evidence that disparitieshave actually increased and equity remains elusive.The current economic crisis, which began in 1997, hasexacerbated this problem and many of the mostvulnerable elements of society are in direcircumstances. Clearly, the healthcare reform effortsover the last 15 years have not delivered the anticipatedresults. Knowing why is critical to any new efforts toimprove the current health system. A clearunderstanding of those aspects of reform thatsucceeded as well as those that failed could proveuseful in guiding the current policy makers into moreproductive paths.
In 1988, the Government of Indonesia, with supportfrom USAID, launched a seven-year project designedto support implementation of seven of the nine majorMOH healthcare reform objectives. Central to thisproject was reform of the healthcare financing systemto achieve greater social equity. This Health SectorFinance project was followed by a four-year,observational field trial of how the reforms actuallyfunctioned and how well they integrated.
The purpose of this brief analysis is to review theexperience of the integrated healthcare reform strategyand, in particular, the field trial of this strategy conductedin Klaten, Central Java during the 1994-98 period todetermine what lessons there may be that areapplicable to the current situation in the health sector.
Essential BackgroundPrior to the 1990’s, Indonesia made significant gainsin most of the standard measures of national healthstatus. The growth rate of the population declined,life expectancy rose. Infant and maternal mortalityrates declined, as did deaths from tuberculosis anddiarrhoeal diseases. The political commitment of the
Indonesian government to provide basic healthcare onan equitable basis for the entire population was manifestduring the late 1970’s and 1980’s by a significantexpansion of facilities including hospitals, health centres,health posts, and regional pharmaceutical depots. Thiseffort was carried out with very limited resources aspublic healthcare spending has never been lavish inIndonesia and has historically been only 0.3% - 0.8%of the GDP. Despite meagre funding, the MOH wasable to provide access to some modern medicalservices even in remote areas. This effort was didhave consequences. Operating and maintaining sucha large, geographically dispersed network of facilitiesand army of personnel absorbed most of the publicfunding for health. This in turn limited the Ministry ofHealth’s flexibility in terms of alternative strategies andleft them vulnerable to any economic down turns and/or budget reductions.
This vulnerability became quite evident with the oil andeconomic crises of 1983 and 1985, which forced thegovernment to institute austerity measures in all sectors.The health sector was among those experiencing theharshest spending cuts. Between 1985 and 88, theMOH budget declined 26% in nominal terms. Withthese limitations, it became clear that the public healthsystem would be extremely difficult to even maintainlet alone expand further to match population growthand healthcare demand in a sustainable fashion unlesssignificant reforms were undertaken. The reformagenda that resulted focused on mobilizing additionalfunds from the public, reducing costs through efficiencymeasures, and increasing equity. The broad goalsdescribed in the fifth five year plan (Repelita V, 1989-1994), included:
• Continuation of the public health service deliveryapproach;
• Mobilization of community resources throughcommunity participation;
• Improvement of the health referral system;• Increased equity and access to care; and• Promotion of rational and appropriate drug use.
Progress towards these goals was to be achievedthrough focusing on six priority areas:
• Basic services;• Resource allocation;• Community participation;
142 National Health Law #23 Articles 4 & 7

Part IV Chapter 19
299
• Decentralization of both public funds and decisionmaking;
• Private health sector; and• Quality of care.
These new priorities emphasized increasing quality ofboth services and manpower, a reform of the financingsystem, and an increased role for the private healthsector. What followed were a series of deregulatoryefforts first in the pharmaceutical sector and later inthe hospital sector that permitted not only domesticprivate investment but also foreign investment. Inaddition, a number of other notable developmentsemerged from this effort including a conceptual basisfor a new healthcare financing system called DUKM.This concept was an amalgam of the systems of anumber of countries but was most marked by its focuson prevention and cost control. Further, the Ministryof Health also initiated a public hospital reform effort,a national generic drug policy, and a Rational DrugUse strategy in the late 1980’s. All of these strategiescombined were to allow the MOH and the publichealthcare system to focus more on public goods,prevention and promotion, and an increased role as aregulator as opposed to a provider of care. Conversely,the private health sector was intended to increasinglyassume the role of the major provider of healthcare.
Thus, Indonesia entered the decade of the 1990’s witha full healthcare reform agenda. A DUKM financingsystem and a cost recovery strategy in the publichospitals were intended to permit the MOH to targetits limited budget on critical national healthcare prioritiesand on the segments of society most vulnerable (poor,young children, etc.) The pharmaceutical policies weredesigned to increase production capacity, reduce overalldrug costs, and increase clinical efficacy in their use.Deregulation of investments in the pharmaceutical andhealth services sector paired with a “zero growth”policy by the MOH were intended to stimulate privatesector growth, financed through the risk pools ofDUKM. The total package of reforms was deemedthe Integrated Healthcare Reform Strategy(“reformasi terpadu”) and in 1988 the prospects forreform and its resultant benefits looked bright.
Health Sector Finance ProjectTo carry out a number of these reforms the GOI wasable to enlist the support of the United States Agency
for International Development (USAID.) Theoverarching goal for USAID was to assist thegovernment in increasing child survival expendituresby 35% relative to the spending level in 1987. In 1988a seven year bilateral agreement was signed, underwhich USAID would provide $17.2 million dollars andthe GOI would provide 25% ($4.3 million) in counterpartfunding to support implementation of several healthcarereforms via the Health Sector Finance Project (HSF.).In turn, USAID awarded a five-year institutionalcontract to the International Science and TechnologyInstitute, Inc. (ISTI) to provide technical assistance,procurement, and management for the project.
The central theme of the project was to mobilizeadditional funds from the public and simultaneouslyreduce the costs of the public system through efficiencyand cost recovery. Hypothetically, the savingsgenerated would be employed in increased spendingon child survival strategies. The project consisted offour main components: hospital autonomy, socialfinancing, rational drug use, and health economics &policy analysis. The project was organized into 4separate technical units as mentioned above with anadministrative Project Implementation Unit (PIU)providing central management of the project. The PIUoperated under the auspices of the MOH PlanningBureau and was charged with the task of providingleadership, administrative support for the technicalunits, and coordination of the implementation of thereform agenda.
Hospital AutonomyIn the late 1980’s, public hospital recurrent costs totalledalmost 35% of the health budget. It was reasonedthat this burden could be lightened by improving theefficiency and quality of the hospitals, engaging in moreintensive cost recovery, and granting the autonomy toretain the funds collected. This strategy was termed“Unit Swadana.”143 The strategy included developingimproved accounting and financial systems,computerized hospital information systems, and facilityupgrading. The cost recovery aspect was designed toincrease hospital income to the extent that the publicbudget allocations could be reduced thereby increasingthe funds available for other areas of public health need.For this to take place, a Presidential Decree wasrequired to grant the public hospitals the right to retainand use the collected tariffs.144 Traditionally, public
143 Swadana (sanskrit) - self supporting144 This decree granted a waiver from the Indische Comptabiliteits Wet (ICW) 1925 - a statute from the Dutch colonial era requiring
remittance of all pubic revenue to the general account.

Part IV Chapter 19
300
healthcare facilities were always viewed as sourcesof income by local governments. Tariffs collected inpublic healthcare facilities were remitted to the generalaccount and used to fund many non-health relatedactivities. Under Swadana, this was to be changed.It was also anticipated that after Swadana wasoperational in public hospitals it would be expanded toinclude the Puskesmas (Community Health Centres)and other facilities.
Pharmaceutical Management and UtilizationAlthough public purchase of drugs represented only asmall faction of the total drug purchases in Indonesia,it generally accounted for a third of the MOHdevelopment budget. Many aspects of thepharmaceutical program of the MOH were fraughtwith inefficiency. The reform termed “Rational DrugUse” (RDU) entailed a comprehensive strategyintended to improve drug supply, distribution andutilization. Aside from rationalization of the nationalformulary, promotion of generic drugs, and developmentof a procurement and distribution managementinformation system, the strategy focused strongly onthe utilization and prescribing practices. It wasestimated that over 40% of the medications dispensedprovided no therapeutic benefit and were essentiallywasted. Both polypharmacy and over utilization ofinjections were common. It was projected thatadherence to standard treatment protocols wouldrender significant savings while actually improving theclinical results.
Social FinancingWhereas Swadana and RDU focused on increasingefficiency and reducing costs, the third component ofthe HSF project called “social financing” was focusednot only on increasing private expenditures forhealthcare but also on developing a system thatincreased access, equity, and improving the quality ofcare received. Unlike the Swadana, RDU, and thepolicy analysis (see below) components, SocialFinancing had no structural Ministry of Healthcounterpart. Mobilization of private funds throughvarious strategies had been under discussion since 1982in Indonesia but other than the principles of DUKMand the experience with two state owned healthinsurance schemes (Perum Husada Bhakti & Astek)and village health funds (Dana Sehat), this componentessentially started with a blank slate.145
Health Economics and Policy Analysis Unit(HEPAU)As the project title implied, the main focus was on thefinancial aspects of the healthcare system. At thetime the capacity to utilize a health economics approachto policy development was virtually non-existent in theMOH. This component of the project was to buildinstitutional capability in health economics and policyanalysis within the MOH planning department. Ahealth economics and policy analysis unit (HEPAU)was established and, over the life of the project, carriedout a research agenda pertaining to the financialaspects of the other health reform strategies. It wasanticipated that, by the end of the project, this unit wouldbe structurally integrated into the MOH and carry onautonomous of donor support.
The reforms to be implemented through these fourcomponents seemed to be complimentary and toaddress the priorities as portrayed in the NationalDevelopment Guidelines (GBHN) and the Nationalfive-year plans. All were seen to support increasedequity, an emphasis on prevention and promotion,quality assurance and service provision through apublic - private mix.
The Results of the HSF Project
Initially, implementation proceeded smoothly and theearly results were as anticipated. By the end of thefive-year institutional contract in 1993, with two yearsremaining in the bilateral agreement, virtually all of theoriginal objectives had been achieved plus someadditional windfall developments of a significant nature.
The Unit Swadana hospital reform had beensuccessfully implemented in five hospitals and hadalready shown evidence of improved efficiency andcost recovery. In addition, the first systematic hospitalaccreditation process was established. Qualityassurance, under the rubric of “TQM”, became anational health priority.The social financing effort hassupported an eclectic study of healthcare financingsystems in other countries. Working closely with thetwo government parastatal insurance schemes, someprivate insurance companies, and the professionalassociations, the DUKM concept evolved into theJPKM managed care strategy. The legal basis forthis strategy was promulgated in the National Health
145 Perum Husada Bhakti - a parastatal health finance scheme with compulsory membership of all civil servants and pensioners. Nowknown as PT Askes. Astek - a parastatal workers security scheme for formal sector labour. Now known as PT Jamsostek.

Part IV Chapter 19
301
Law #23 (1992) and through subsequent ministerialregulations. This legislative basis was furtherstrengthened by the passage of the National WorkersSecurity Law #3, which established a minimum benefitfor formal sector workers implemented with theprinciples of JPKM. National task forces on benefitsdevelopment, prepaid payment systems, QualityAssurance, marketing, and information systems wereestablished. Collaboration with the Indonesian MedicalAssociation resulted in the development of the firstNational Standards of Care for the 100 most frequentdiseases providing an objective measure of the qualityof care.
Under pharmaceutical reform, the major results wereachieved by implementation of the RDU strategypertaining to prescribing. Both polypharmacy andunnecessary injections were reduced and combinedwith the use of generics and the rationalized essentialdrug list it was estimated that potentially $5 milliondollars would be saved annually at the health centrelevel alone. After a period of delay, an improveddistribution and supply information system was alsoimplemented.
The Health Economics and Policy Analysis Unit alsoyielded significant results. Numerous analyses andstudies of an unprecedented nature were carried outregarding epidemiologic transition, total public - privatehealthcare expenditures, unit cost determinations, andhospital and ambulatory care utilization patterns. In1993, the Unit took the lead in the preparation of thesixth national health care plan. Somewhatparadoxically, when the unit was structurally absorbedinto the MOH, it was not placed in the planning bureauas anticipated but into the research bureau(Litbangkes.) Despite this, the increased institutionalcapability continues to be employed in support of theplanning process.
Ironically, the initial project goal of USAID of increasingpublic spending on child survival by 35% wasdemonstrated to have occurred in 1991, before any ofthe project interventions had been implemented.Nonetheless, the HSF project made significantcontributions to reform of the Indonesian health sector,with the achievements exceeding the original purposeof the project.
However, in the second year of the project a disturbingtrend was noticed, namely, that some aspects of thedifferent strategies were developing in ways that werenot synergetic with the other components of the reform
strategy but in some cases, they were actuallyantithetical. It was conjectured that this derived froma lack of coordination and integration between thetechnical units.
The problems identified were numerous. The UnitSwadana component based its improved cost recoverysystem on fee-for-service payments, while the JPKMstrategy called for prepaid capitation combined withrisk profit sharing. In addition, the tariff pricing strategyemployed by the Swadana strategy limited theincreases congruent with the population’s out-of-pocketability to pay to ensure that access to care wasmaintained. Yet, enrolment in either JPKM or evenmore traditional insurance is dependent on the inabilityof the population to afford hospitalization out-of-pocket.The treatment protocols developed in the RDUcomponent did not lend themselves well to use withthe National Standards of Care. The internal QualityAssurance systems of the Swadana hospitals did notinterface with the external QA system adopted by theJPKM organizations. Overall, there seemed, at thatpoint, to be very little integration in the “integrated”healthcare reform strategy. It became apparent thatimproved technical coordination was imperative andcoordination efforts were initiated by all components.
The efforts to increase the technical integration metwith yet another problem. The HSF project reformcomponents (Swadana, JPKM, RDU) were all beingimplemented and field tested in separate locations.Thus, there was little utility in preparing Swadanahospitals to accept capitated payments if there wereno JPKM organizations present to make them. Nointerface between external and internal QualityAssurance systems could be established since the twosystems were not geographically proximate.Theoretically, both JPKM and Swadana would benefitimmensely from the improved clinical results and costsavings of the RDU strategy, however, the degree andmagnitude of this benefit remained unknown.
The mid-term evaluation of the HSF projectdocumented that although each of the components haddemonstrated significant results in separate test sites,there was little evidence concerning how they wouldwork simultaneously in the same geographical area.However, by 1993, these three strategies were alreadynational policy and beginning to expand beyond theirinitial test sites.
JPKM had been deemed a “national priority” by theMinister of Health and seen as the key reform policy

Part IV Chapter 19
302
to stimulate the increasing role of the private healthsector by virtue of its risk pooling effect. In fact, theJPKM strategy was the only reform strategy thatdirectly dealt with the private health sector. It wasalso clear that JPKM was vital to the Swadanastrategy if cost recovery of magnitude to permitsignificant reallocation of funds was to be realized.Conversely, if the subsidies for public healthcareservices were not diminished and tariffs raised, thestimulus necessary for JPKM enrolment growth wouldbe absent. This in turn would impact on private healthsector growth as all economic classes in Indonesiautilize subsidized government services, which reducestheir willingness to pay for private services.
The GOI commitment to the increased growth androle of the private health sector was not only reflectedin their “zero growth” policy but also in a manpowerstrategy termed “Contract Doctors.” Prior to thispolicy, after serving a post-graduate compulsory three-year term of government service, doctors wereautomatically inducted as permanent civil servants.Under the Contract Doctor reform strategy, doctorswould serve a one-time, non-renewable governmentcontract for three years, after which they could entergovernment service if positions were available, or enterthe private sector. Due to the “zero growth” policy,few positions were available. The basic concept ofthe strategy was to establish a significant pool of privatesector physicians in a relatively short time. Theseprivate physicians were to be trained as FamilyDoctors, which would prepare them for participationin the private health sector. The training was to focuson enhancing primary care capabilities and on providingthe knowledge necessary to effectively understand andparticipate in JPKM managed care delivery. Thus,the success of the contract doctor strategy waspredicated on success of the JPKM strategy, which inturn, was predicated on Swadana tariff increases andreallocation of government subsidies. Since by 1993over 6,330 contract doctors were already serving theirterm of service, it was critical that any problems withthe integrated operations of Swadana, JPKM, andRDU be identified and, if possible, remedied.
Based on these pressing considerations and the resultsof the mid-term review, the MOH and USAIDconcluded that an “integrated field trial” of all thesestrategies was required to work out the practicalaspects of implementation. USAID agreed to supportthis effort through the Integrated Health Care ReformField Trial, to be conducted in Klaten District of SouthCentral Java during the last two years of the HSFproject.
The Klaten Integrated Health CareReform Field TrialThe Klaten Field Trial was initially planned to take placeduring the final two years of the HSF seven-yearbilateral project agreement, using the residual HSFfunds. A series of extensions were subsequentlygranted that carried the project through March 1999.
Klaten was chosen as the site primarily due to thepresence of an operating Swadana hospital(Tegalyoso). The process of establishing a Swadanafacility is rather lengthy and relatively costly, thus, itwas thought to be more expedient to select an existingone. Other reasons included a relatively strongeconomy for Central Java, the presence of some formalsector labour and an active Jamsostek program.
The project was carried out under the auspices of aproject steering committee that was comprised ofUSAID, central MOH, and district officials. Thereform elements that were to be observed includedSwadana, Rational Drug Use, JPKM, Askes,Jamsostek, Contract Doctors, Standards of Care, theprivate health sector, and regulatory compliance.
There has been much confusion about the results ofthe field trial in Klaten and even what the project wasintended to do. The most common misconception, thatit was a “pilot test” of healthcare reform policies,perhaps resulted in part from the use of the term “fieldtrial.” At the time the project was implemented, all ofthe major policy components had already been fieldtested in the original HSF project as mentioned above.No new health reform policies were pilot tested duringthe duration of the Klaten project. Further, prior to theKlaten project, they had all been legislated at thenational level and were being implemented in variousareas around the country. In fact, all of the elementsto be observed in Klaten were active in Jakarta duringthe same period as well as in other locations. Thedifference was in the systematic observation and anattempt to remedy, on a local level, problems that werepresumably occurring everywhere.A second common misconception was that the projectwas a field trial of a model of JPKM, which in factwas only one component of many. These and othermisconceptions have proved persistent and evenemerged in the final project evaluation by USAID.According to the original project proposal the purposeof the field trial was to observe the reform policycomponents and their interactions with each other andother aspects of the healthcare system in acircumscribed area for the purpose of:

Part IV Chapter 19
303
• Identifying unanticipated operational problems thatarose from the implementation of the reform policies;
• Identifying areas where additional policy formulationor modification was needed;
• Formulating solutions to the operational problems tothe extent possible;
• Documenting policy and implementation areas thatneeded additional attention;
• Conducting operational research on the practicalityof carrying out cross subsidization via Swadana andJPKM risk based cross subsidy;
• Developing cost effective methodologies to assessand monitoring the health strategies; and
• Exploring potential innovations that could improveperformance.
The Ministry of Health expressed this purpose in termsof specific objectives:
The general objective of this integrated trial is todemonstrate a Model of Integrated Health SectorFinancing Reform at the district level of Klaten.
Specific objectives are to:
• Conduct integrated field trials of comprehensivehealth sector financing reform;
• Develop JPKM cross subsidy and local governmentbudget reallocation system;
• Strengthen Unit Swadana Hospital, hospitalaccreditation and improvement of MIS, facility andpersonnel;
• Incorporate the health centre services into theintegration strategy and study the possibility of a UnitSwadana Strategy for Health Centres in the area;
• Implement Quality Assurance systems for allcomponents of the integrated trial;
• Implement rational, efficient and effective drugmanagement and use in the area; and
• Assess and develop the institutional, organizationaland operational policies and economic analysis ofthe integrated model.146
It appears that USAID concurred with theobservational nature of “field trial.” “The integratedtrial provides an important opportunity to look at thesynergistic effect of all systems developed under theHSF project to date. The result of this field trail willallow the MOH to develop strategic plans for replicationof these integrated systems in the future.”147
Thus, both parties acknowledged that:• The policies to be observed were already in effect;• There was some evidence that these policies did not
integrate well;• That Klaten would be used to identify these problems
and seek solutions; and• Certain types of operational research and
methodology development were needed.
LocationKlaten is a district in South Central Java composed of655 square kilometres with a population (1997) of 1.2million. It is situated between two major cities: Soloand Yogyakarta. Population growth averaged 0.37%per annum.
Although almost 47% of employment was connectedwith agriculture, only a third consisted of independentfarmers. Industry, business, construction andtransportation accounted for 25% and civil service only5.7% of the total labour sector. With 1,818 people persquare kilometre, it is densely populated.
Prior to 1998, the economy of Klaten has been growingat a higher than average rate for Central Java and thepercentage of population deemed impoverished wasless than 11%. At the beginning of the project, the percapita GDP was Rp. 55,974 per month with a rangeof 34,275 to 92,544 between the 26 sub districts. Thehighest average incomes were among those involvedin mercantilism and transportation followed by civilservice and industry. Construction workers, fisherman,and “other” were the lowest income groups.
Structure and Organization of the ProjectThe collaborative agreement between the MOH andUSAID features a number of commitments including:
• Technical assistance in the form of domesticconsultants for hospital, pharmacy and JPKMaspects, a management unit to coordinate the trialand an expatriate expert to integrate the overallimplementation;
• The appointment by the governor of Central Java ofa task force to develop the JPKM Dana Sehat,chaired by the head of the provincial health office;
• Establishment by the Klaten district chief of a district-level task force, with membership to include seniorofficials from the district office, the head of thedistrict health service and the director of TegalyosoHospital in Klaten; and
146 MOH communiqué to USAID, March 1994147 USAID Project Implementation Letter (PIL), July 1994

Part IV Chapter 19
304
• Weekly meetings at the MOH in Jakarta to serve asa forum where MOH officials, consultants andUSAID staff could share and discuss projectdevelopment and implementation.
With the expiration of the institutional contract underthe original HSF project, the financial management waschanged to a pre-financing format under which theMOH would be reimbursed for project expenditures.This was to prove very cumbersome, as it requiredthe MOH to adhere to two different standards ofprocurement and to carry out the tendering process,which previously had been the responsibility of the
PT Askes was providing healthcare benefits to theactive civil servants and both civil services and militarypensioners living in Klaten. The 1995 total membershipwas over 104,000 for Klaten. Askes exclusively usedthe public provider system and it was compulsory forall public providers to treat Askes members.
PT Jamsostek was providing the healthcare benefitportion of their workers security program to over 12,000employees or a total of 26,440 people including familymembers in 1995. Jamsostek contracted exclusivelywith private outpatient providers, however, besides acontract with the private hospital, occasionally permittedpatients to be treated in the public hospital.
Most of the villages had a Dana Sehat program thoughthe extent of participation was unclear and thecontribution rates variable (100-500Rp per month perfamily.)
RS Tegalyoso hospital was considered a “flagship”Swadana as all of the autonomy interventions had beenimplemented there under the HSF project.
One of the objectives of the project to was to exploreways of implementing a program, which offered abasic benefit package (BBP) as per the existingregulations on JPKM.148 This program was notenvisioned as directly competing with either Jamsostek
148 Ministerial Regulations 527 & 571 (1993)
institutional contractor. This did factor in the delay ofmany activities.
Components of the ProjectIn Klaten there were a number of systems andorganizations operating that fell under the umbrella ofthe healthcare reform policies that were to be assessed.This included the two parastatal insurance schemesPT Askes and PT Jamsostek, both a Swadana hospitaland a private hospital (RS Islam), 46 public healthcentres, 36 private clinics, 18 pharmacies, and over146 private practices. In addition, there were 22Contract Doctors some of who were nearingcompletion of their term of compulsory service. (Figure131)
Figure 131 Components of the Klaten IHR

Part IV Chapter 19
305
or Askes who possessed compulsory membership butrather as healthcare financing scheme primarily forthe informal sector and less affluent segments ofsociety. There had been attempts to establish suchprograms prior to the Klaten project; some under theauspices of the HSF project. However, none hadsucceeded due to a myriad of reasons. Theestablishment of such a scheme in Klaten was to departfrom the prior patterns and attempt “something new.”Rational Drug Use which had proved so successfullyin solo field trials was to be implemented universallyand thereby lower treatment cost, improve quality ofservices, and augment the impact of premiumscollected by all financing schemes.
The Indonesian Medical Association had developednational Standards of Care for the most frequentdiseases. However, other than a single study employingthese standards to review hospital records in Jakarta,the standards had not been widely employed. In Klaten,training in these standards was to be conducted andthe impact on treatment and outcomes measured.
The project also took the opportunity to examine thefate of the post Contract Doctors (PCD) to ascertainwhether their deployment in the private health sectorwas effective and to what degree. Further, effort wasto be extended to assist these PCD’s in establishingand managing private clinics.
These constituted the main components of the Klatenfield trial. The interactions between the governmentin the role of the regulator, three health financingschemes, and both public and private providers wereto be observed. In addition, the impact of RDU,Standards of Care, and the PCD on this system wereto be analyzed.
Aside from these main components, there was also anambitious field research agenda. Among thehypotheses to be tested was the practicality ofconducting a:
• Risk based cross subsidy system between healthcarefinancing schemes; and/or
• A budget based cross subsidization process in whichSwadana facilities’ budgetary funds would bereduced based on cost recovery revenues. Theconceptual basis for both of these had been developed,but the practicality and possibility of actuallyimplementing them was unknown.
IHCR Strategy Revisions & ImplementationThe initial year (April 1994 - March 1995) of theIntegrated Healthcare Reform field trial was supportedwith residual funds from the HSF project. This modestsum was used to survey and evaluate the baselineconditions in Klaten, conduct rational drug use andquality assurance training for providers, perform thenecessary analysis and planning for a basic benefitprogram, and establish a district level coordinating bodywhich included the major stakeholders.
By March of 1995, the following progress had beenachieved:• Local, provincial and central health officials had
formulated and accepted a concept document foran integrated healthcare reform trial;
• RDU training was conducted in July and August 1994for district health office officials and Klaten healthcentre doctors and paramedics;
• The district governor had issued a decreed toconvene a working group to develop a basic benefitJPKM program;
• A feasibility study was conducted which confirmedthat development of a basic benefit JPKM schemewas feasible. A formal business plan had beendeveloped and submitted to the local government;
• The basic benefit package design and costing hadbeen completed and approved.
• The district level JPKM “organization” wasestablished and staffed;
• A strategic and tactical plan for system of regulationfor managed care programs and public/privateproviders in compliance with regulatory standardshad been developed;
• Implementation of standards of care and rational druguse and drug management in all of Klaten district;and
• Enrolment of 105,000 workers and dependents underthe civil service health insurance program (Askes)and 26,000 under the compulsory health insuranceprogram for the formal wage sector (Jamsostek), atotal of 11% of the district population.
At this point in time, the MOH requested an additionalone year no-cost extension based on the rationale thatthe preparatory activities had taken 9 months tocomplete and that all of the reform components thatwere to be observed had been in operation for only 3months. This period was too brief to identify any policyand technical issues that might arise from a longerinteraction and, more importantly, the impact on thehealth status of the population.
Part IV Chapter 19
306
The indicators and targets set for this extensionincluded:• An increase in births attended by trained providers
from 37% to 60%;• An increase in prenatal care (4 visits) from 69% to
90%;• An increase in tetanus immunization for pregnant
women from 66% to 80%;• An increase in child immunization from 63% to 80%;• A 35% reduction in outpatient visits for acute self
limiting upper respiratory tract infections;• A 50% reduction in inappropriate injections and
antibiotic use;• A 10% reduction in low birth weight infants;• A 30% reduction in overall drug costs with evidence
of increased therapeutic compliance;• Contracts with at least 30 doctors and 15 facilities
by the basic benefit scheme that were in compliancewith existing regulations;
• Achieve an aggregate enrolment of 16% of thedistrict population in one of the healthcare financingalternatives (Askes, Jamsostek, or the basic benefitscheme);
• Establish a functioning regulatory system to enforcethe existing regulations; and
• Expansion of the number of private sector healthcareproviders by 5 clinics with PCD’s.
It was during this two-year period, that two majorproblems with the integrated healthcare reform strategyemerged, namely, the basic benefit scheme and theregulatory effort.
The organization that was established to operate thebasic benefit plan had born no resemblance to thatdetailed in the business plan. Instead, it was establishedby gubernatorial decree and proceeded in a fashionfar removed from the plan. It fulfilled almost none ofthe JPKM licensure requirements (in fact was neverlicensed), had virtually no capitalization, and wasstaffed with inexperienced people most of them part-time civil servants. It was christened Dana Sehat -JPKM, based on the rationale that the population wasfamiliar with Dana Sehat and therefore it would beeasier to socialize.
Despite the objective of trying a “new” approach, wasevolved was remarkably like previous efforts in otherregions. During 1990-92, a “basic” JPKM effort wasmounted in Karambitan, Bali and in 1992-94 anothersuch effort was attempted in NTT. Both shared similarcharacteristics and results.
• They were largely a government run program, therewas not truly autonomous JPKM organization;
• Both used public facilities with subsidized serviceprices;
• Both paid on a fee-for-service basis;• Only outpatient (puskesmas) care was covered;• They were not adequately capitalized and possessed
no reserves; and• Both attempted to build on Dana Sehat.
Despite attempts to establish a different pattern, bothdevolved back into Dana Sehat’s and slowly fadedfrom the healthcare reform stage. In neither case werethe regulatory requirements to establish a bonafideJPKM organization met.
The Dana Sehat - JPKM of Klaten shared most ofthese same characteristics with the exception ofproviding coverage for inpatient care. This proved tobe one of the many features that led to its undoing.
The business plan was predicated on group enrolmentand adjustment of the premium based on the grouprisk assumed. The DS-JPKM proceeded to enrolindividuals who all paid the initial community premiumrate established in 1994. The members paid on amonthly basis and as per JPKM regulations no waitingperiods or pre-existing condition were imposed. Thepredictable result was massive adverse selection. Themajority of costs were attributable to pregnant womenwho joined long enough to receive coverage for theirdelivery and then discontinued the program. In addition,the district government mandated the premium rateand year-to-year adjustments for medical inflation werenot permitted.
The business plan also called for pre-enrolment of aminimum of 12,000 members to lower the reserverequirements to a manageable level ($27,000.) DS-JPKM began with no pre-enrolment and no reserveswhatsoever. At its height, total enrolment only reached982 members.
The business plan also called for an initial capitalizationof $170,000 including a commercial business loan for$100,000, plus a line of commercial credit for anadditional $40,000. DS-JPKM’s estimatedcapitalization was less than $5,000 and no commercialcredit could be obtained, as it was never establishedas a legal body and the personal bank account of thedirector was used for all transactions.
JPKM regulations require provider payments to be inthe form of capitation with risk profit sharing reserves.DS-JPKM paid on a fee-for-service basis. TheSwadana hospital adamantly refused to contract with

Part IV Chapter 19
307
DS-JPKM for numerous reasons. The hospital directorreferred to the business plan and stated that they wouldcontract with the organization described there but DS-JPKM was not that organization.
There seemed to be no level of discomfort with theradical departure from the business plan and the direwarnings of technical advisors were discounted. Theresult was predictable and by the end of the secondyear, the MOH and the district governmentacknowledged the problem.149
At the beginning of the project, the importance ofregulatory enforcement was affirmed by all parties.Regulatory instruments, an information system, and adetailed regulatory plan developed. The first step wasto assess the existing operations of Askes, Jamsostek,and the DS-JPKM regarding their compliance withthe existing JPKM regulations. Jamsostek cooperatedand the assessment revealed that their health benefitprogram complied with almost all of the regulations.Askes, whose branch office was not located in Klatenbut in a neighbouring district, denied the request ofregulators for the assessment. They declared that a)they were under the regulatory authority of the Ministryof Finance, b) they were not located in Klaten, and c)they were not subject to JPKM regulations. Thecentral MOH offered little in the way of support andthus the issue was dropped. On the issue of DS-JPKMcompliance, there was a discreet silence.
Thus by the end of the second year, Rational DrugUse and quality assurance efforts had beenimplemented throughout the district. The results werephenomenal. Injections dropped by 80%, drug costsby 40%. The pattern of drug prescribing matched thetreatment standards remarkably well. In addition tothe Swadana hospital, the district permitted the firsttrial of Swadana health centres ever attempted inIndonesia. The two health financing schemes Askesand Jamsostek proceeded as usual, but no functionalbasic benefit program was in operation — nor wasthere any active regulation.
The Two -Year IHCR ProjectExtension (Apr 1996 - Mar 1998)
In January 1996 a further two-year extension untilMarch 1998 was granted, with new funding $2.2 million.The rationale was threefold. First, some of theobjectives had not been achieved yet including the
studies on cross subsidization and the implementationof the 5 PCD clinics. Second, the initial results of thequality assurance and RDU effort were promising butthe issue of recidivism would require additional time.Third, the MOH and district were ready to try adifferent approach to the basic benefit package as thecomplex nature of managed care was becomingevident. Some divergence of views of the MOH andUSAID on how this new approach was to be achievedemerged in the proposals as to how the $2.2 million infunding was to be employed. Both parties concurredthat regulation and regulatory enforcement wereimportant. Both agreed a new BBP approach wasneeded. There was also agreement that a majorsocialization campaign on JPKM was needed to bothclarify the benefits and to overcome the negativeexperience to date. But an examination of the originalbudget proposals for the extension illustrates thedifferences. (Figure 132)
Figure 132 Initial Budget Proposals for 1996-98
Component USAID MOH$ $
Regulatory 1,691,811 128,497BBP organization development 6,000 499,804Providers 209,000 551,891Social Marketing 246,500 830,000BBP cash injection 0 30,000Other 46,689 159,809
The MOH still demonstrated a conviction that thegovernment should be the implementer and thatregulation was of secondary concern. It was proposedthat a significant portion of the extension funds beutilized to develop and capitalize a BBP JPKMprogram. The proposed funds for social marketingincluded significant procurement of equipment for theMOH to carry out the social marketing itself. Thefunds for providers included establishment costs forPCD’s. Very little operational research was featured.
An alternative viewpoint was that such a pattern wasnot replicable, as it would call for a commitment ofalmost $200 million from the GOI to develop BBPprograms. It was also clear by this point that JPKMregulation could not be implemented on just a locallevel but had to be supported by strong regulation atthe national level. Both BBP JPKM’s and PCD clinicsshould be financially viable and use commercial creditto be established. Social marketing could be carriedout by a professional marketing firm for a fraction of
149 It is of interest that the following year several commercial JPKM companies were established in Jakarta based on business planssimilar to that provided for Klaten. These companies continue to operate.

Part IV Chapter 19
308
the cost. Operational research was one of the majorjustifications for the project.
A compromise plan was reached and implementationonce again proceeded. There were, however, somefundamental changes in both the way the project wasbeing implemented and in the results anticipated.
USAID engaged the global bureau’s Partnerships forHealth Reform project to provide technical assistanceand Futures Group International’s Social Marketing forChange project to provide the market survey andpromotion expertise.
Most notable, a decision was made to add four targetsor objectives to the already lengthy list. By the end ofproject, there was to be a functioning regulatory system,a licensed basic benefit JPKM program that wassolvent, social marketing of JPKM was to have beencarried out, and the aggregate number of people inKlaten enrolled in one of the programs increased.These were felt to be reasonable targets given theprogress to date and established to give increasedimpetus to the operational problems identified. As theprocess of identifying and solving problems of thisnature was the fundamental purpose of the project,there was little contention.
It was also at this time that the events transpiring inKlaten began to be referred to as “the Klaten Model.”This term was perhaps as an unfortunate choice as“field trial” and led to much subsequent confusion. TheMOH was well aware of the incongruent aspects ofits major reform policies and it viewed Klaten as asort of “test tube” in which solutions could be sought.If solutions to all the problems identified were not found,what improvements there were would be disseminatedacross the country. The unsolved problems could, atleast, be thoroughly documented so that subsequentpolicy and operational efforts could build on theexperience. Nonetheless, the notion of the “Model”persists even in the MOH.
Implementation 1996-99Although all components continued to function, themajor focus during the final years of the Klaten projectwas focused on JPKM and JPKM regulation. Thiswas not merely due to the fact that they had the majoroperational problems identified at that point but evenmore so to the impact this dysfunction had on the othercomponents of the MOH healthcare reform strategy.
During the initial two years of the project training inrational drug use and quality standards had been given
to all public providers and to any private providers thatwished to attend. It was clear that RDU yieldedexcellent results with public providers. However, thevast majority of drugs dispensed in Indonesia are notdispensed through the public system. Further, publicexpenditures for drugs have never exceeded 13% ofthe total during the last decade. Thus, if RDU were torender its maximum effect, it would have to be extendedto the private health sector. The main obstacle to thisderived from the difference in incentives. Unlike publicproviders, private providers had significant pecuniaryincentives to administer injections and to prescribe largeamounts of medication. One solution to this dilemmawas to change the nature of the financial incentiveand the prepaid capitation systems featured in theJPKM regulations provided this. Indeed, overprescribing or injecting patients would result in financiallosses in a capitated system.
Swadana hospitals were collecting revenues and usingthose revenues to improve both their facilities andservices. However, given that the percentage of ahospitalization that could be charged to the patientwithout effecting barriers to access was low,implementation of Swadana in the health centreswould have yielded significantly greater results in termsof total cost recovery for two reasons. First, thepercentage of the real costs of an outpatient visit thata patient can reasonably be expected to pay is muchhigher than that for a hospital stay. Second, the numberof outpatient visits exceeds that of hospitalizations bya factor of 30 to 50. Thus, Swadana hospital strategy,as a single reform policy, was fated to produce minimalcost recovery. The obvious solution was risk poolingwhich is a major advantage of insurance systems.Again, JPKM seemed to be the critical synergetic.
The Contract Doctors strategy was predicated on theirabsorption by the private health sector. Yet the growthof the private health sector was limited by thepopulation’s ability to pay for services out-of-pocket.If this ability to pay could not be increased, there wouldbe insufficient private health sector growth to absorbthe PCD. Again, risk pooling offered the most tangiblesolution.
Efforts to improve the quality of care in Indonesia hadbeen ongoing since the 1980’s, however, despiteenthusiastic participation, the few objectivemeasurements of the quality of care actually receiveddemonstrated little improvement. Quality Assurance(QA) activities were largely viewed as an unrewardingadditional task by most providers and sustainable effortsvery difficult to achieve. The regulations of JPKM

Part IV Chapter 19
309
required utilization of the National Standards of Careas benchmarks and active QA activities to assure thequality of service that members received. Further, theprovider’s remuneration was linked to the degree ofcompliance with those standards.
Thus, the JPKM component of the national healthcarereform strategy was a significant factor in thesuccessful implementation of the other components.
One suggested remedy for the Dana-Sehat JPKMdebacle was for the district to simply tender a contractto major private sector insurance firms who hadinstitutional experience with managed care in othercountries. It was envisioned that by offering a multipleyear contract, the insurance carrier could recover theirinvestment. It offered the further advantages ofleveraging private capital and bringing significantprofessional experience to bear in a relatively shortperiod of time. This same strategy had been employedin other countries with some measure of success;therefore, it seemed like a reasonable approach.
The implementation of this concept did not exactlyadhere to the intended pattern. What transpired wasa proposed joint venture between the districtgovernment and Jasindo, a state owned insurancecompany. Despite the lack of competition and thepossible market restriction that a partnership betweenthe insurance carrier and the regulator might pose, theproposal was pursued for almost six months. The majorobstacle was the need to amend the articles ofincorporation of Jasindo to qualify for a JPKM license.The alternative was to establish a subsidiarycorporation to carry out JPKM activities. Both effortsproved to be greater than Jasindo’s interest in thescheme. The interest waned and vanished.
In November of 1997 and subsequent to Jasindo, asmall group of post contract doctors in Klatenestablished a JPKM scheme largely out of frustration.As with DS-JPKM, the new organization, PT HusadaMandiri Berbhakti (HMB) was thinly capitalized andstaffed with inexperienced people. However, HMBwas established as a private corporation and haddeveloped a business plan, which was followed.Despite somewhat pessimistic predictions, HMBmanaged to enrol some 5,534 members in 1997-98 andexpanded this membership to over 8,740 by the end ofMarch 1999. Their financial reports as of September1998 indicated that they were both solvent and, despitethe economic crisis, realizing a modest profit.
Members CooperativesOne of the major challenges facing any national healthinsurance strategy in Indonesia is the informal sector.The state owned enterprises, Askes and Jamsostek,focus on the civil servants and formal sector. Themajority of licensed JPKM and health insuranceproviders focus on the urban top 10% of the population.Thus, the vast majority (» 70%) of the population isleft out. The reasons for this exclusion and lack ofinterest include the generally lower purchasing powerof the informal sector, the higher administrative costs,and adverse selection risks. The public tax basedsystem in Indonesia provides a solution for this throughthe subsidization of services. However, if the limitedpublic funds were to be targeted at the poor andvulnerable, costs would have to rise for the non-poor.The impact of these increased costs would falldisproportionately on the informal sector unless somemechanism could be devised ameliorate the inequity.
One of the few innovations attempted in the Klatenproject was to establish a “members’ cooperative” toaddress the dilemma of the informal sector. Theconcept was extremely straightforward and similar tothat of small business health insurance purchasingcooperatives in other countries. Primary levelcooperatives (farmers, craftsman, vendors, etc.) wouldjoin a dedicated secondary level cooperative for thepurpose of purchasing health insurance or JPKM. Byproviding a large, pre-enrolled group and a single pointof premium collection, the cooperative could negotiatelower premium rates and stimulate competition for theirmembers. There is a strong cooperative movement inIndonesia and it is estimated to involve over 86 millionpeople. Thus, it was reasoned that if a JPKMmembers’ cooperative worked the potential impactwould be significant.
Koperasi Jasa Kesehatan Husada Mandiri(KJKHM), a secondary level cooperative wasestablished in 1997 in Klaten. No direct financialsupport was received from either the government orthe project. Technical support in terms of organizationaland software development was provided by the projecttechnical assistance team. The cooperative’s mainfunctions were to promote the concept to primary levelcooperatives, enrol their members, collect premiums,and negotiate for services. Quotations were solicitedfrom 7 JPKM organizations of which 5 responded,including the HMB group based in Klaten. A Jakartabased company won the initial contract and operationsbegan. Membership grew rapidly swelling to over11,300 by the end of the project.

Part IV Chapter 19
310
Family DoctorsThe only other innovation attempted during the Klatenproject targeted the PCD’s (post contract doctors.)It was recognized that if these young physicians wereto work in the private health sector they would needtwo things they did not possess: capital andmanagement ability. A national “Family Doctor”strategy had arisen shortly after the Contract Doctorpolicy was established. It was envisioned that thePCD’s would function as family doctors in privateversions of health centres and serve as the primarycare providers for JPKM programs. However, noneof the training afforded these physicians provided theessential, small business management skills necessary.Further, the vast majority of these young family doctorscould not obtain the capital necessary to establish aclinic.
Under the auspices of USAID’s Small and MicroEnterprise project (SME), an assessment was carriedout by Coopers & Lybrand in 1996 to ascertain theprospects of commercial credit for family doctor clinics.The results were such that a special training curriculumwas developed for clinic management. In addition,arrangements were made with Bank Niaga to includefamily doctor clinics in their SME loan guaranteeprogram. The training was rated as highly successfuland the first SME loan was made in November 1997.Unfortunately, the advent of the economic crisis haltedthe SME program as all 5 participating banks fell intoreceivership. However, by the end of the project, 23private clinics, 40 solo practices, and one specialtyhospital had been established in Klaten. Virtually allof them were owned, managed, and/or staff by theparticipants in the clinic management training.
RegulationThe JPKM regulatory strategy during the final extensionof the project focused on development at the nationallevel for reasons previously mentioned. The immediateneeds identified included: a structural location in theMOH, support from the highest levels in the Ministry,and sufficient manpower and material to carry out theirmission.150 A formal regulatory needs analysis wascarried out which indicated that an annual operatingbudget of $350,000, capital expenditures of $191,000,and 86 personnel were needed to carry out the task of
regulating the JPKM sector in 1997.151 Subsequently,a Directorate of JPKM, a sub-directorate within thedirectorate of community services was formallyestablished in the MOH and the necessaryprocurements and training carried out. This unitcontinues to function and has carried out severalenforcement actions to date.
Cross SubsidizationThe concept of cross subsidization is pervasive in theIndonesian health sector. Both public and privatehospitals attempt to cross subsidize 3rd class beds withhigher charges for 2nd class and above. All hospitalsare required to provide a certain percentage of 3rd classbeds for the poor and indigent. Both Askes andJamsostek base their contributions on a percentage ofincome thus effecting a cross subsidy from the moreaffluent to the less affluent. Health insurance by itsvery nature effects a cross subsidy from the healthyto the sick.
There were two additional aspects of cross subsidythat were to be investigated in Klaten. The firstpertained to the JPKM basic benefit strategy. Outsideof the formal sector and government, income is difficultto determine and therefore contributions based on apercentage of income not extremely feasible. Thealternative was to determine a community rate for thebasic benefit where all members would pay the samepremium. One of the inherent difficulties withcommunity rates where there is more than one providerof managed care or insurance is adverse selection. AJPKM program that enrolled only school childrenwould experience much lower costs than a programthat enrolled the elderly. One mechanism to amelioratethis is a risk adjustment pool. Community rated lowrisk groups would contribute the actuarially determineddifference to the pool, while high risk programs wouldreceive distributions. Such a risk based cross subsidyhad been featured in the JPKM strategy since 1989,however, it remain theoretical. In Klaten, an analysiswas carried out to determine the feasibility of such asystem. Demographic data on the members anddependents of Jamsostek and HMB were collectedand analyzed with an actuarial table prepared fromthe 1997 Susenas survey.152 It was found that theprocess was not only feasible but also quite simple as
150 Indonesia: JPKM/Managed Care: The Status of Regulatory Needs and Compliance in Indonesia, P.R. Torrens, PHR project, July 1997.151 JPKM Regulatory Needs Analysis: Preliminary Assessment of Workload, Logistics, and Budgetary Requirements, J. Marzolf PHR
Project, December 1997152 The National Socio-Economic Surveys (Susenas) were first used to construct these tables in 1992. See “Development of JPLKM
Information Systems, K. White, HSF Project 1992

Part IV Chapter 19
311
long as the managed care programs collected andrecorded the dates of birth and sex of both membersand dependents. In terms of results, both Jamsostek,by virtue of its 55-year-old limitation, and HMB, dueto its high proportion of school age children would becontributors under such a system.
The second cross subsidy issue was crucial to one ofthe main goals of healthcare reform that involvedSwadana and JPKM. Both strategies were designedto be implemented in more affluent areas and amongmore affluent groups. The concept is simple. As costrecovery increased in Swadana facilities, budgetarysupport could be lowered and the savings realizedfocused towards the more vulnerable groups and lessaffluent areas of the country. As the economy grewan increasing number of areas would become moreself-sufficient and, as a result, more funds wouldbecome available to focus on the vulnerable populationthat remained. Although Swadana operations hadbeen underway for several years, no reallocations hadever been made. In fact, no mechanism had beenestablished to do so.153 Further, no attempts had beenmade to develop a methodology to calculate whatthese reallocations should be.
In 1998 with the economic crisis in full bloom, the needfor effective allocation of public funds to protect themost vulnerable groups prompted an analysis of thefinancial systems and data of the hospital in Klatenplus two other public hospitals in Jakarta for comparisonpurposes. Despite the improvements to the financialmanagement systems in Swadana hospitals, it wasdiscovered the financial data did not lend itself well tothe identification of operational surpluses and thatfurther improvements were needed. However, apreliminary methodology was developed and appliedto the 3 hospitals. The results were intriguing. In allof the hospitals, there was evidence that, contrary tothe strategy; public funds were being used to subsidizeclasses above third class. Further, budget support hadcontinued to increase in all of the hospitals since theirSwadana operations began. In one of the hospitals,the budget support was rising faster than the costrecovery rate. The tariffs in all three hospitals, whichwere based on the out-of-pocket ability to pay, weretoo low to provide significant reallocation potential.Most distressing was that only 0.8% of the hospitalizedpatients in Klaten were deemed “poor” and exemptedfrom payment.
Implementation SummaryIn March of 1999, the Health Sector Finance projectwas finished, ending a 10-year collaborative healthcarereform effort between the MOH and USAID. Thelast 18 months of the project were marked by thebeginning of the most severe economic crisisexperienced in the last three decades, civil unrest thatresulted in the evacuation of foreign residents, the fallof one government and the emergence of a new one.Despite this, the project was completed on scheduleand all activities carried out. At the time of completion,crisis issues such as the social safety net, essentialdrug supply, and food were so pressing that the finalpresentation of the project results was cancelled andthe documented results never disseminated. Mostcommonly available information on the KlatenIntegrated Healthcare Reform Trial is based onperceptions and commentaries by third parties. It isstill referred to as the “Klaten Model” and the “JPKMfield trial.” The documentation seems to indicate itwas much more. However, the main question remainsto be answered. What does it all mean?
Analysis and the AftermathThe ten year health sector finance project absorbed$16.7 million of the original $17.2 million commitment.MOH counterpart funding totalled more than $5.5million. The major costs were for technical assistancewhile commodities only 4.3% of the total. Almost $3million was spent on studies. (Figure 133)Remarkably, 86% of the expenditures was connectedwith the implementation of the HSF project prior tothe Klaten trial. Twenty nine percent of the local costswere used to supply medical equipment to UNICEFfor crisis response. Thus, the total costs attributableto the Klaten efforts were quite modest and, in thefinal year, total expenditures were less than $250,000.
Figure 133 Table of Project Finance 1988-99
Expenditure Category USDTechnical Assistance 7,283,067Training 1,319,653Commodities 720,545Local Costs 4,482,142Studies 2,869,116Total 16,674,523
In terms of results, most of the objectives of Klatenwere achieved and the targets met or surpassed (Figure
153 Personal communication - Director of Finance, Ministry of Health

Part IV Chapter 19
312
134). Public health measures such as immunization,iron supplementation, prenatal visits, attended births,vitamin A supplementation, and ORT treatment ofdiarrhoea all ranked in the top 1% in the nation. Lowbirth weight infants did not decline but actuallyincreased by 2%, however, there was an 80%reduction in underweight infant less than one year ofage.
Rational drug use had reduced overall drug costs by40% and unnecessary antibiotic prescription andinjections declined by 63% and 75% respectively. Moststriking was that rather than the expected recidivismfrom the RDU strategy over the life of the Klatenproject, further incremental improvements weredemonstrated every year. Similarly, compliance withthe National Standards of Care improved with anoverall compliance of 77% and rates of 98% forprenatal visits, 95% for pneumonia and anaemia.
Cost recovery in the Swadana hospital had increasedby 37% although as a percentage of total funds therevenues declined slightly. Cost recovery in the healthcentres reached 28% of the total by 1998 and the trialof the Swadana health centres was viewed as asuccess.
Also by the end of the project, four healthcare financingschemes were operating in Klaten (Askes, Jamsostek,HMB and KJKHM.)
The two major targets that were not achieved werethe total aggregate enrolment and the existence of afunctioning regulatory system. In the case of theregulatory system, no district level regulation was beingconducted but, as mentioned, it had been successfullyestablished at the national level.
Figure 134 Target Achievement by March 1999
Parameter Initial Target AchievedOperating JPKM schemes 2 3 4Operating JPKM Basic Benefit Scheme 0 1 1Enrolment in schemes 194,561 111,077Rational Drug Use 0 Universal DoneReduction in unnecessary injections and antibiotics 0 50% 75% & 63%Reduction in overall drug costs 0 30% 40.2%Increase in attended births by trained providers 37% 60% 82.2%Prenatal visits 69% 90% 83%Tetanus Toxoid X 2 66% 80% 98%Ferrous sulphate Prenatal 1st month 5% NT 86%Vitamin A supplement < 5 year olds 68% NT 100%Child Immunization 63% 80% 100%Reduction in outpatient visits for viral respiratory infections NA 35% 37%Reduction in low birth weight infants 10% Increased 2%JPKM contracts with doctors and facilities 0 30 & 15 84 & 34Operating JPKM Regulatory System 0 yes noExpansion of private sector health care providers 202 209 268Compliance with Standards of Care NT 77%Reduction in referral rates Puskesmas to Hospital NT 44.9%Cost Recovery in Swadana hospital (billions) 1.9 NT 2.6Cost Recovery in Swadana hospital as % of total 31.8% NT 29.0%JPKM Members Cooperative enrolment 10,000 11,348
The experience with enrolment could be attributed tomany factors. During the period of the trial, Askeslost the military pensioners which reduced their totalmembership. Several large companies closed downin Klaten, which reduced the Jamsostek membership.Efforts to enrol the smaller and medium companieswere put on hold pending extension of the JPKTK
management services from Jakarta. Three years ofeffort in the DS-JPKM and Jasindo yielded no results.The establishment of HMB and KJKHM in the last18 months of the project showed promise but bothschemes were subject to the vicissitudes of theeconomic crisis, which reportedly reduced commercialhealth insurance membership by over half a million

Part IV Chapter 19
313
people and over $115 million in premiums and was amajor factor in the failure of two JPKM schemes.Given this, it is remarkable the schemes increased theirenrolment at all.
Even more notable and perhaps of significance to thecurrent attempts to establish JPKM on a national levelis that during the Klaten field trial, membership in thecompulsory schemes declined while the voluntarymembership increased by a slightly larger number. Ina neighbouring district, Magaten, a universal,compulsory Dana Sehat JPKM had been establishedat the time of the Klaten project and was viewed bymany as the “Model” that should be adopted. However,public demonstrations against the scheme resulted indiscontinuation of its compulsory nature. During thefinal evaluation of the Klaten project a representativefrom the agricultural cooperative voiced strongantipathy for “any more compulsory governmentprograms.” This brings into question the meaning of“compulsory” in the Indonesian health sector and thedegree of acceptance that could be anticipated in thecurrent process of decentralization anddemocratization.
Both HMB and KJKHM continue to operate and haveremained solvent. HMB has expanded its membershipto over 12,000. According to MOH officials and theJPKM Managed Care Association of Indonesia,Husada Mandiri Berbhakti is one of the more robustschemes operating. The JPKM Members Cooperativealso continues to function more than 3 years after allexternal assistance ended. Much of the initialmembership was reportedly lost subsequent to the endof the project due evidently to the economic conditions.Recent reports indicate that they are slowly re-expanding their membership and have established abranch office in Jepara near Semarang, the provincialcapital of Central Java.
Despite this, the question is still, why has enrolment inJPKM schemes remained low, not only in Klaten butnationwide? Some of the answers may be revealedby the experience in Klaten.
Consumer Attitudes and BehavioursMarket research in Klaten was conducted in 1996 byAsia Market Intelligence, ltd. as part of the socialmarketing effort.154 Consumers and providers were
surveyed concerning their views and decision-makingprocesses regarding public and private health servicesas well as JPKM, Askes, and Jamsostek. Among theconsumer groups, subjects naïve of JPKM, drop outs,and current members were interviewed.
In general, the majority of subjects preferred privatehealthcare services over public despite the increasedcosts. Long queues, poor service, and ineffectivetreatment were the most numerous complaints aboutthe public system.
The majority of both Askes and Jamsostek memberwere not familiar with the details of the benefits oftheir schemes or even what percentage of their wageswas deducted. Satisfaction levels were low in bothgroups though lower for Askes. Contributions wereregarded as “just another tax” and a “sunk cost.” Themost common complaints about Askes were the lowquality drugs provided and the discriminatory treatmentthey received by providers. A significant number ofcardholders preferred to pay cash rather than use theircard. Some civil servants have never bothered toreceive the card. When asked about voluntarilyenrolling family members not covered by Askes orJamsostek, the interest was low based on a belief thatthe poor service and discriminatory treatment wouldbe the same or worse.
Public providers were very critical of the Askesprogram and claimed that the low payment rates byAskes and the high utilization rates of its membersresulted in continual losses to the public system. Thehospital director produced evidence of over Rp.200million in losses in 1996 alone.
Conversely, private providers were generally satisfiedwith Jamsostek though felt that the payment could bemore prompt. Both groups were enthusiastic aboutthe potential of JPKM but felt that the DS-JPKM wasquestionable.
Few of the dropouts from JPKM left due todissatisfaction but rather to misinformation andadministrative failures of the scheme or in the case ofnew mothers following delivery. Almost all respondentsexpressed a willingness to rejoin though some with theproviso that the scheme needed to be moreprofessionally managed.
154 Consumer Attitude and Behaviors Regarding the Managed Care (Dana Sehat JPKM) Health System in Klaten, Asia Market Intelligence,SOMARC, November 1996

Part IV Chapter 19
314
Despite the problems with the DS-JPKM, 10-20% ofall consumer groups surveyed had heard of the programand many expressed keen interest in joining. Somehad even enrolled but never received any follow up interms of receiving a card or paying contributions. Manywere doubtful about the organizational strength andthe management but stated a willingness to join if aquality program was available. Yet others expressedscepticism and characterized it as “just a fad” and the“government just trying to achieve a target like in familyplanning.” The largest group were not interested, manystating that it was too expensive and it was cheaper towait until one was sick and just pay the low tariff atthe health centre or hospital. In fact, it is this lastfactor that may constitute the major obstacle to JPKMexpansion.
Obstacles to GrowthFrom the first year of the project, the requisiteconditions to promote enrolment in any of the healthfinancing schemes were clearly articulated: a) raisingthe tariffs in the public facilities to near full cost and b)fairly applying the existing regulations to both thecompulsory and voluntary schemes. Both proved tobe very difficult to achieve despite the overtcommitment of the health authorities.
In 1997, the tariffs for the health centres were finallyraised however; it was only a marginal increase. Thestandard tariff was raised from 300 Rp per visit to 600Rp. By way of comparison, nationwide surveysconducted by the Indonesian Consumer Foundation(YKLI) revealed that health centre tariffs ranged from300 Rp. to 3,900 Rp. However, in addition to thestandard tariff, a list of 113 services and procedureswas issued which would be charged in addition to thestandard tariff. These tariffs ranged from 500 Rp. to15,000 Rp. Despite these additional tariffs, theaverage cost of a health centre visit was only 1,479Rp. Given that the unit cost determinations performedin Klaten revealed that the average cost per out patientvisit was 14,265 Rp., the new standard tariff was onlyslightly more than 4% of the unit cost and the averagecharge per visit only 10% of the real cost. As this islower than most health insurance co-payments, it isnot surprising that little change was seen in either theutilization rates at public facilities or in the enrolmentin the voluntary scheme. Thus although tariffs wereraised as agreed to, the increase was too small toprovide any incentive. The government subsidy systemcontinued to function as a form of social insurance ineverything but name.
There were additional aspects of this new tariff systemthat were contrary to the reform policies. Askesmembers were not subject to the new tariffs, hence,the substantial subsidies to the civil servants continuedwhile they were reduced, albeit, very little for thegeneral population. To some extent, the inequity wasincreased. Further, despite the commitment toimplement Swadana in the health centres 50% of thestandard tariff and 60% of all the revenues from thetariff list were remitted to the district government ratherthan being retained for use at the health centre. Thismeant that the actual cost recovery was less than 5%,a rather insignificant figure.The need for greater increases was repeatedlydiscussed with local government officials who deemedany further increases would not be ‘politicallyacceptable’ at that time. Herein lies the crux of thematter.
The most pivotal issue of the healthcare reform effortinitiated in the 1980’s was to more sharply focus publicfunds at those least able to pay. Indeed, the majorreform policies developed in the 1990’s and observedin Klaten are predicated on this notion. Yet, the politicalwill to effect the tariff increases needed to permit thistargeting seemed to be lacking. As a result the oldparadigm that healthcare reform was to supplantcontinues to run in parallel with the reform paradigm.The result is that neither works well. The opportunityto raise Swadana tariffs and thereby drive JPKMenrolment growth in the pre-crisis period was not taken.Now policy makers contemplating such increases canonly view the public response to the recent fuel subsidydecreases with trepidation.
The loss of central control of regional compliance withhealth policies also changes the circumstances underwhich healthcare reform can be enacted. Policies suchas hospital autonomy, rational drug use, and workforcedeployment have been largely taken out of the centralministry’s control. In this sense, the opportunity toimplement the integrated healthcare reform strategyhas passed. However, a new opportunity has arisenand successful health reform at the regional level maylead to more widespread implementation throughemulation. This is the basis for the numerousdecentralized healthcare systems projects nowunderway. Are any of the lessons learned in the Klatenproject of relevance?
At the time of the final project evaluation, inquiries toofficials in the World Bank and ADB regarding
Part IV Chapter 19
315
replication of the “Klaten Model” indicated that therewas no interest and the opinion was that it was not aworkable model. Yet, examination of the currentdecentralization projects of both organizations revealefforts to develop an integrated health system featuring:hospital & clinic autonomy, a healthcare financingmechanism, rational drug use, strategies for postcontract doctors, standards of care, and so forth.Ironically, it would seem that indeed the “Model”, suchas it was, is being replicated unwittingly or not.Moreover, some of the proposals from the participatingregions replicate mistakes discovered in the Klatentrial. One example is that of resource mobilizationa.k.a. “health insurance.” Several districts have plansto establish pilot financing schemes by decree to beimplemented as regional parastatals. Yet, others arefocusing on increasing hospital tariffs as a way todefray the costs of public health services. There islittle evidence of a stronger regulatory role in theseregions but rather a focus on the government as theprimary mechanism of delivery. There is little in theway of innovation offered in terms of implementingRDU in the private health sector. Plans formanagement training for some of the 10,000 under orunemployed PCD’s and provision of access tocommercial credit have not yet come forth. The majorstrategy to enrol the informal sector in healthcarefinancing schemes is to make it compulsory. One isgiven a strong sense of déjà vu from thesedevelopments.
Conclusions
A comprehensive review of the results of the HSFand Klaten projects in a single document would bedifficult. The results from almost $3 million of studiesand research related technical assistance alone havegenerated over a thousand documents. However, thereare several overarching conclusions that may be drawnfrom this lengthy experience that have implications forthe present and future.
The most critical healthcare reform policy hasnever been implemented.Central to the theme of healthcare reform was toincrease equity. This was to be accomplished bytargeting subsidies. All of the other reform strategies(Swadana, JPKM, RDU, etc.) were designed toprovide the circumstances in which this targeting couldbe done. Yet, for the most part the subsidies remainuntargeted with a substantial portion of them benefitingthe affluent. The lack of this key action not only limited
the impact of the other reform strategies but, in fact,removed much of their raison d’etre. JPKM inparticular is superfluous to the healthcare-financingsituation as long as the inequitable pattern of publicspending is perpetuated.
Compulsory healthcare financing systems inIndonesia have not increased equityThere are three compulsory healthcare financingsystems in Indonesia. The largest is the MOH, whichprovides universal access to basic services subsidizedwith tax and other government revenues. Theministry’s budgetary resources are too limited to providecare to the entire population with the result that thepoor receive very little and the non-poor purchase morewith private funds.
The Askes program in its current form increases theproportion of MOH subsidies received by civil servants.The losses incurred by public providers due the lowpayment rates of Askes constitute a cross subsidy fromthe MOH to the other branches of government. Thereis evidence that exemption from tariffs increasesutilization, thus, the Askes system increases the quantityof public subsidies needed.
The Jamsostek program utilizes less public subsidiesper capita than Askes. However, Jamsostek healthbenefits are limited to formal sector workers underthe age of fifty-five and their dependents. The informalsector, the elderly, and unemployed receive no benefit.Despite the compulsory statutes of the program, themajority of formal sector employers subject to theJamsostek law have evaded enrolment. Equity hasnot been achieved even within the formal sector.
These three systems have increased the inequity ofaccess to healthcare in Indonesia. The most vulnerableelements of the population, which should receivesubstantial benefit from compulsory social insurance,in fact, get less.
The informal economy will require a differentstrategyWorldwide experience indicates that enrolment of theinformal economy in compulsory healthcare financingschemes is very difficult. Based on the complianceproblems of Jamsostek with large formal sector groups,the prospect of exacting compliance from the informalsector is very small. In Klaten, enrolment of theinformal sector on an individual or family basis resultedin the failure of the government sponsored DS-JPKM.

Part IV Chapter 19
316
Organization of the informal sector through theformation of health benefits cooperatives or otherorganizations can provide the economies of scalenecessary to provide affordable coverage.
The current system is not sustainableThe continued meagre public spending on health andzero growth policy paired with the inhibitory effect ofthe subsidy system on private health sector growthhas led to an erosion of the adequacy of the nationalhealthcare system. Other recent reports havedocumented that by most measures of infrastructure,workforce, and services the system has been fallingbehind for the last 10 years. Indonesia does not yethave the healthcare assets needed to service itspopulation. Nor is the government in a financial stateto make the investment needed. Despite the deficits,resources such as the PCD’s remain under utilized.To remedy this trend and reduce inefficient use of whatresources there are, healthcare policies must provideincreased incentives for investment in healthcare.
The conditions necessary for voluntary JPKMgrowth have never been establishedCurrently, JPKM programs compete not only with thethree compulsory systems but also with insurancecompanies and unlicensed substitution products.Requisites for growth include reduction of the MOH’srole as a universal health finance scheme and diligentregulatory enforcement. Although regulatoryenforcement actions have begun several majorinequities exist including the establishment of JPKMorganizations in every district by the MOH itself. Mostof these organizations cannot fulfil the JPKM licensurecriteria and thus constitute “unlicensed substitution”programs. They are allowed to operate with impunity.Askes currently engages not only in its compulsorysocial insurance scheme for civil servants but alsocompetes with licensed JPKM program for thevoluntary market. This is in violation of GovernmentRegulation 73 but no remedial regulatory actions havebeen taken.
The regulations on JPKM were designed not to imposeunreasonable burdens on the JPKM companies but toprotect all of the participating stakeholders includingthe members, providers, and the JPKM companiesthemselves. Exemptions from these regulations do notfacilitate JPKM growth but jeopardize it as in the caseof DS-JPKM in Klaten. Insufficient and inconsistentregulatory enforcement is a ubiquitous problem in
Indonesia and by no means limited to the health sector,however, without effective enforcement of JPKMregulations, healthy competition and growth cannot berealized.
Until the two requisite conditions for JPKM growthhave been established, it cannot be concluded that thevoluntary model of JPKM has failed for it has yet tobe tried.
Implementation of the essential elements of theBasic Benefit can render significant impacts onhealthcare utilization and increase the use ofprevention.Diligent efforts to provide the services detailed in theBasic Benefit Package combined with Rational DrugUse and the Standards of Care reduces healthcarecosts and inefficiency while simultaneously improvingutilization patterns and therapeutic benefit. Given thelow levels of healthcare funding there can be norationale why sustained effort to support theimplementation of these three reform componentsshould not be given. They exist and abundant evidencedemonstrates they work. There is no need to reinventthe wheel.
Rational drug use and the standards of care mustbe extended to the private health sectorAlmost 88% of all healthcare and 90% of drugexpenditures in Indonesia are private expenditures.The private health sector provides over 50% of theambulatory care services and almost 40% of thehospital care. Implementation of Rational Drug Useand the Standards of Care in the private health sectorwould render an impact even greater than that in thepublic sector. The method of implementation will haveto differ from that of the public sector due to differentincentives. Compliance will require a greater regulatoryeffort by the government.
The government must clarify its role as eitherregulator or providerIn Klaten, the government continually acted in the roleof the implementer or provider with a markedambivalence towards its regulatory responsibilities.This is understandable as the MOH was the major,nearly sole, provider of healthcare services fordecades. This is no longer the case. What futuregrowth there may be will be in the private health sector.

Part IV Chapter 19
317
The lack of resources limits the effectiveness andquality of the public services provided. The lack ofregulation allows the private health sector to operatein a fashion that does not contribute to the achievementof the national health priorities. The result is thatneither the public nor the private health sector performswell in terms of benefit to the people. As mentionedpreviously, the private health sector’s major competitoris the public sector. The government cannot be both aplayer and the referee and guarantee a fair competition.
Healthcare reform requires full commitmentCurrently, healthcare policy in Indonesia is very messy.During the 1990’s, new policies were established butthey did not serve as the overarching paradigm butran in parallel with the policies they were designed tosupplant. Many of the paradoxes documented in Klatendemonstrate that partially implemented healthcarereforms may be worse than no reforms at all. Reformcannot be a partial, half way, or sometimes measure.The reform agenda formulated over the past fifteenyears still offers valid approaches to many of the currentchallenges but unless they are carried out fully theywill yield no benefit at all.
Summary
One of the major conclusions of the final assessmentof the Klaten field trial was that is was premature. Infact, it seems it was too late. The operational problems,policy conflicts, and other obstacles encountered inKlaten should have been discovered in the initial 5 yearsof the HSF project and certainly before any of thereform policies were legislated. The key indicator thatshould have been used to measure progress throughoutthe healthcare reform effort should have been thereallocation and targeting of public funds achieved.
As it stands, public spending on healthcare continuesto be inefficient and inequitable. The untargetedsubsidies not only limit the access to medical servicesfor the poor but also inhibit the growth of the healthsector via subsidized competition. Will the regionalgovernments break with tradition and target their publicfunds at those most in need? Perhaps, but they willface the same political pressures as the centralgovernment was subject to and they have greaterproximity, exposure, and accountability to those thatwould be affected by such a decision.
Have the lessons from Klaten been learned?Apparently not but it should perhaps be consideredthat under decentralization, it is the district levelgovernment that will be responsible for the health oftheir residents. One of the major concerns of thoseinvolved in decentralization of healthcare is the capacityof the district governments to carry out this mission.In the years that follow, districts will be dealing withthe issues of healthcare financing, how to run the districthospital, what to do with the post contract doctors,and how to improve the health of their populations.Formidable challenges these districts will have to facein the near future.
There is one district that has already faced thesechallenges. Significant improvements in maternal andchild healthcare delivery, quality of care, cost efficiency,and resource use were achieved. Lessons, sometimespainful, were learned and mistakes not repeated. Ahost of cost effective methodologies for socio-economic analysis, cross subsidy calculations, unit costdetermination, quality of care and health statusmeasurement were developed. A viable approach tohealthcare financing for informal sector was created.It may well be that districts now facing decentralizationhave much to learn from Klaten and could benefit bybuilding on the experiences there both good and bad.Hindsight is often tinged with irony and it may turn outthat Klaten was a Model after all.

Part IV Chapter 20
318
CHAPTER 20 CONCLUSION
The ILO Project: “Restructuring the Social SecurityScheme” should really be regarded as the first step inan ongoing process of reform. The development ofany social security programme is inevitably a long-termprocess taking many years. There is no doubt that theprocess in Indonesia will be no more swift than in othercountries and the ongoing financial problems may evenmean that it takes a good deal longer than most.
This ‘first step’ focused on the private sector socialsecurity scheme administered by PT Jamsostek. Oneaspect of the project — assistance with the change ofstatus of the institution from a profit-orientated limitedcompany into a trust fund — did not fully achieve itsobjectives during the life of the project, despite thefact that the objective has wide support. The changeof status is virtually certain to take place eventually.But whether it does or not, the other outputs of theproject clearly indicate the need to proceed with furtherinstitutional strengthening of Jamsostek so that it canbecome a respected institution administering the socialsecurity scheme with efficiency, transparency andhonesty. There are many facets to this including theneed for:—
• Changes to the operational systems including andespecially the numbering system;
• Re-engineering the IT systems;• Re-orientation of the culture from Employer-centred
to Employee-centred;• Introducing an effective compliance enforcement
system with inspectors employed and controlled byJamsostek;
• Introducing reliable internal audit systems, probablytripartite based to ensure their credibility;
• Changing the management culture based onperformance with improved Human Resourcespolicies to ensure that corporate values are sharedthroughout the institution, that all employees haveproper job descriptions, performance standards andthat their performance is reviewed and appraisedperiodically;
• The new culture is supported by a meaningful trainingprogramme with the establishment of on-goingtraining facilities;
• The membership base is increased so that the wholeof the formal sector is covered — with progressiveextension of coverage to the informal sector;
• That the benefit programme is meaningful andreactive to national priorities.
The feasibility studies have indicated many areas whereimprovements might be made to the benefit programme— some without the need to increase the burden onthe economy. Others, like the possible introduction ofa social assistance scheme, are likely to be longer inreaching the Statute Book. But the reports should beread in the context of providing a basis for GOI todevelop strategic objectives for the development ofthe social security scheme.
In this connection the establishment of the PresidentialTask Force on Social Security Reform has beenespecially timely. The stage has been reached whenlonger term planning of social security needs to becoordinated across the board to obviate theshortcomings of social security development inIndonesia. There is no doubt that in future one part ofthe programme cannot be developed or changed withoutimpacting on the other parts. The interrelated issuesinclude: contribution collection — the establishment ofdual or multiple collection mechanisms are tooadministratively expensive; financing — the level ofcontribution for all the programmes needs to takeaccount of the impact on the economy; and policy —possible changes or enhancements to benefits such ashealth care, unemployment or redundancy and pensionsinteract on the other programmes.
Thus it is recommended that any future social securityproject should work closely with an agency (such asthe Task Force) responsible for coordination of policyacross the whole range of social protection. Individualtechnical Departments should have inputs, of course,on issues such as quality but overall policy developmentneeds to be undertaken at the highest level.
The commitment being given currently to thedevelopment of the national social security scheme(JAMSOSNAS) — with possible implications for afuture comprehensive system with benefit provisionsthat are unified or harmonized between the public andprivate sectors — indicates the need, once the overalldesign of the scheme is known, for consideration to begiven to the most appropriate institutional structure torun it. Such consideration is likely to reveal that thesystem may call either for new (or different)institutional arrangements, or for some kind ofintegration or rationalization of the existing ones. It isworth remembering, even at this early stage that it isthe design of the system that should determine theinstitutional arrangements — not the other way round.In the meantime coordination of technical cooperationprojects and inputs should be aware of the need of the

Part IV Chapter 20
319
‘big picture’ and try to ensure that the development ofindividual parts of the programme, including anyinstitutional changes are not inconsistent with longerterm objectives and do not make future integration morecomplex or difficult.
The ILO team prepared an outline project proposal(SPROUT) indicating possible technical assistanceactivities during a 3-year project. This, 2nd Phaseproject has the principal objective of assisting the TaskForce to develop the concept of a national socialsecurity umbrella. This will entail consensus-formingmeetings and workshops leading to a formal discussiondocument that should be made available to fuel a nationaldebate. It is anticipated that the feasibility studiesundertaken as part of this present project and intendedto assist the Government to formulate a nationalstrategic plan will assist with this development process.Thereafter technical assistance will be needed to draftan enabling Bill.
The project also envisages the need for furtherstrengthening of Jamsostek and bringing to fruition theprocess of changing its status. If successful, the lessonslearned from the process could assist with theinstitutional strengthening of the other social securityinstitutions under the JAMSOSNAS umbrella andJamsostek Baru could represent the model for theothers, since the Task Force are inclined to the beliefthat the ‘Trust Fund’ concept should be adopted forthe new scheme.
Also part of the 2nd Phase are proposals forimplementing benefit programme improvements;extending the scope of coverage to groups presentlyexcluded from the social security programme — inparticular: the rest of the formal sector, migrantworkers, and the informal sector; and for coordinationwith other social security projects (including the EUprojects on developing social health insurance).

Part IV Chapter 20
320
Bab 20 Kesimpulan
Proyek ILO mengenai Restrukturisasi Skema JaminanSosial ini hendaknya benar-benar dianggap sebagailangkah pertama dalam proses reformasi yang saat initengah berlangsung. Bagaimanapun juga, setiappenyusunan/ pengembangan program jaminan sosialselalu merupakan proses jangka panjang yang memakanwaktu bertahun-tahun. Tak diragukan bahwa diIndonesia proses ini pun tidak akan lebih cepat daripadaproses yang berlangsung di negara-negara lain danmasalah keuangan yang hingga kini masih terusdihadapi mungkin bahkan menandakan bahwa prosesini nantinya akan lebih lama daripada sebagian besarproses serupa.
Langkah pertama ini dipusatkan pada skema jaminansosial sektor swasta yang dikelola oleh PT Jamsostek.Salah satu aspek proyek ini — yaitu upaya untukmengubah status lembaga PT Jamsostek dariperusahaan perseroan terbatas yang berorientasi padalaba menjadi suatu dana wali amanat — belum dapatdicapai dalam jangka waktu proyek ini, meskipun tujuanini mendapat dukungan secara luas. Sesungguhnya,perubahan status tersebut pada akhirnya pasti akanterjadi. Tetapi apakah perubahan status tersebutdilakukan atau tidak, keluaran-keluaran lain dari proyekini dengan jelas mengindikasikan adanya kebutuhanuntuk meneruskan upaya-upaya pemberdayaankelembagaan Jamsostek supaya dapat menjadi suatulembaga pengelola skema jaminan sosial yang dihormatidan mempunyai citra yang baik berkat efisiensi,transparansi (keterbukaan) dan kejujuran yangdimilikinya. Hal ini mengandung banyak segi, termasukadanya kebutuhan:
• Untuk mengubah sistem kerja Jamsostek, termasukdan terutama sistem penomoran peserta;
• Untuk menata ulang sistem Teknologi Informasi;• Untuk melakukan orientasi ulang terhadap budaya
administrasi jaminan sosial yang berpusat padapengusaha ke budaya yang berpusat pada pekerja;
• Untuk memperkenalkan suatu sistem penegakankepatuhan yang efektif dengan inspektur-inspekturyang dipekerjakan dan diawasi oleh Jamsostek;
• Untuk memperkenalkan sistem audit internal yangdapat diandalkan, mungkin sebaiknya yang bersifattripartit guna memastikan kredibilitas sistem tersebut;
• Untuk mengubah budaya manajemen yangdidasarkan pada kinerja dengan melakukanperbaikan-perbaikan kebijakan Sumber DayaManusia guna memastikan bahwa nilai-nilai
perusahaan diterima dan dianut di seluruh lingkunganlembaga Jamsostek, bahwa semua pekerjamempunyai uraian kerja dan standar kinerja yangsebagaimana seharusnya, dan bahwa kinerja merekadikaji ulang dan dinilai secara berkala;
• Untuk memastikan bahwa budaya baru tersebutdidukung oleh program pelatihan yang bermakna dandengan pembangunan fasilitas-fasilitas untukpelatihan-pelatihan yang saat ini berlangsung;
• Untuk meningkatkan basis keanggotaan sehinggaseluruh sektor formal dapat diikutsertakan — diikutidengan perluasan cakupan kepesertaan secarabertahap ke sektor informal;
• Untuk memastikan bahwa program manfaat yangada mampu memberikan manfaat yang berarti sertamampu menanggapi prioritas-prioritas nasional
Studi-studi kelayakan yang dilakukan menunjukkanbanyak bidang di mana perbaikan-perbaikan programmanfaat dapat dilakukan — beberapa bahkan dapatdilakukan tanpa perlu membebani perekonomian. Hal-hal lainnya, seperti kemungkinan diperkenalkannyasuatu skema bantuan sosial, tampaknya memerlukanwaktu yang lebih lama untuk dimasukkan dalamundang-undang. Namun, laporan-laporan yangdiberikan hendaknya dibaca dalam konteks yangdimaksudkan untuk memberikan suatu landasan bagiPemerintah Indonesia dalam menyusun tujuan-tujuanstrategis untuk pengembangan skema jaminan sosialtersebut.
Dalam kaitan ini, terasa bahwa pembentukanKelompok Kerja Kepresidenan untuk ReformasiJaminan Sosial amat tepat waktu. Sudah tiba saatnyauntuk mengkoordinasikan perencanaan jaminan sosialuntuk jangka yang lebih panjang dengan seluruh pihakterkait guna mengatasi kekurangan-kekurangan yangada dibidang jaminan sosial di Indonesia. Tak diragukanlagi bahwa di masa yang akan datang tidak akan adabagian program yang dapat dikembangkan atau diubahtanpa mempengaruhi bagian-bagian yang lain. Isu-isuyang saling berkaitan meliputi: pengumpulan iuran —pembentukan mekanisme-mekanisme rangkap dua ataumekanisme berganda secara administrasi terlalu mahal;pembiayaan — tingkat iuran untuk seluruh programperlu mempertimbangkan dampaknya terhadapperekonomian; dan kebijakan — kemungkinan-kemungkinan perubahan atau perbaikan-perbaikanterhadap manfaat seperti jaminan perawatankesehatan, jaminan/ manfaat pengangguran atau PHKdan jaminan pensiun menimbulkan interaksi yangberpengaruh terhadap program-program lain.
Part IV Chapter 20
321
Dengan demikian disarankan bahwa setiap proyekjaminan sosial di masa yang akan datang hendaknyabekerja sama dengan suatu instansi (seperti KelompokKerja Kepresidenan) yang bertanggung jawabmelakukan koordinasi kebijakan terhadap seluruh aspekdan bidang perlindungan sosial. Departemen-departemen teknis individual hendaknya memberikanmasukan mengenai isu-isu seperti kualitas tetapipengembangan kebijakan secara keseluruhan perludilaksanakan pada tingkat yang paling tinggi.
Komitmen yang saat ini tengah diberikan terhadappenyusunan skema jaminan sosial nasional(JAMSOSNAS) — dengan kemungkinan adanyaimplikasi-implikasi bagi suatu sistem yangkomprehensif di masa yang akan datang denganpenyatuan atau penyelarasan pemberian manfaatantara sektor publik dan sektor swasta —mengindikasikan kebutuhan yang timbul, begiturancangan keseluruhan skema diketahui, untukmempertimbangkan struktur kelembagaan yang palingtepat untuk menjalankannya. Pertimbangan seperti itucenderung akan mengungkapkan bahwa sistemtersebut akan membutuhkan pengaturan kelembagaanyang baru (atau yang berbeda) atau bahwa sistemtersebut akan memerlukan semacam integrasi ataurasionalisasi dari sistem yang ada saat ini. Agaknyalayak untuk diingat, bahkan pada tahap awal sepertiini, bahwa rancangan sistemlah yang hendaknyamenentukan pengaturan kelembagaan — bukansebaliknya. Sementara itu, koordinasi antar proyek-proyek dan masukan-masukan kerjasama teknishendaknya menyadari perlunya mengetahui ‘gambarbesar’-nya dan mencoba memastikan bahwapengembangan bagian-bagian individual dari programtersebut, termasuk perubahan-perubahan kelembagaanyang dilakukan, tidak inkonsisten dengan tujuan-tujuanuntuk jangka yang lebih panjang dan tidak membuatintegrasi di masa mendatang menjadi lebih rumit ataulebih sulit.
Suatu garis besar ringkasan proyek telah disiapkan olehtim ILO yang mengindikasikan kemungkinan
dilakukannya kegiatan bantuan teknis berbentuk proyekselama 3 tahun. Proyek tahap kedua ini memiliki tujuanpokok membantu Kelompok Kerja Kepresidenanmengembangkan konsep payung jaminan sosialnasional. Untuk itu akan diperlukan pertemuan-pertemuan untuk membentuk konsensus sertalokakarya-lokakarya yang mengarah pada penyusunansuatu dokumen diskusi resmi yang hendaknya dijadikansebagai pembakar semangat untuk mengadakan suatuperdebatan ditingkat nasional. Studi-studi kelayakanyang dilakukan sebagai bagian dari proyek yangsekarang dan dimaksudkan untuk membantuPemerintah dalam merumuskan suatu rencana strategisnasional diharapkan akan dapat membantu prosespenyusunan payung jaminan sosial nasional. Setelahitu akan dibutuhkan bantuan teknis untuk menyusunrancangan undang-undang untuk terwujudnya payungtersebut.
Proyek ini juga mengantisipasi adanya kebutuhan untukmengupayakan pemberdayaan-pemberdayaan lebihlanjut terhadap Jamsosek dan mewujudkan prosesperubahan statusnya. Apabila berhasil, pelajaran-pelajaran yang dipetik dari proses ini dapat membantupemberdayaan kelembagaan dari institusi-institusijaminan sosial lainnya yang berada di bawah payungJAMSOSNAS; Selain itu, Jamsostek Baru juga dapatmenjadi model bagi yang lain karena Kelompok KerjaKepresidenan cenderung berkeyakinan bahwa konsep‘Dana Wali Amanat’ perlu diterapkan untuk skemabaru tersebut.
Yang juga merupakan bagian dari tahap kedua adalahusulan-usulan untuk menerapkan perbaikan-perbaikanprogram manfaat; memperluas lingkup kepesertaan kekelompok-kelompok yang saat ini masih berada di luarprogram jaminan sosial – terutama, sisa dari sektorformal yang masih belum menjadi peserta Jamsostek,pekerja migran, dan sektor informal; serta untukkoordinasi dengan proyek-proyek jaminan sosial lainnya(termasuk proyek Uni Eropa di bidang pengembanganasuransi kesehatan sosial).
Annexes
322
Annex 1 Jamsostek Service Improvement Summary
IntroductionThis summary has been produced as part of the ILO project for Restructuring the Social Security System inIndonesia.
PurposeThe purpose of this summary is to provide constructive information and recommendations to Jamsostek in orderto support the enhancement of its processes, procedures and effectiveness of its IT systems. The recommendationsin the summary support and in some instances are additional to the key recommendations in the report.
The summary is based on key functions of a typical social security organization describing some of the initiativesthat would support Jamsostek in preparing for the additional responsibilities it may be required to undertake overthe next few years.
This summary supports the findings of the various reports of studies conducted during the course of the project.
The comments are for guidance only and it is recognised that this is not a prescriptive formula for improvement ofJamsostek but serves to list the changes that could have a significant impact on the way Jamsostek does business.
It should be noted that some of the improvements listed in this paper have already commenced or are about tocommence as part of the recently announced Jamsostek strategy titled Jamsostek, A new Beginning.
ConclusionMany of the initiatives described here will require substantial resources to fund the improvements and it is likelythat subsequent projects may be required. It is also evident that without improvements, particularly in the IT areaJamsostek will be unable to expand its membership and program base as the core Social Security agency inIndonesia.

Annexes
323
Ann
ex 1
- J
amso
stek
Ser
vice
Im
prov
emen
t Su
mm
ary
(con
t.)
No.
Cat
egor
yFu
nctio
nD
escr
iptio
nR
emar
ks1 2 3
Org
anis
atio
n
Stra
tegi
c Pla
n
New
and
Rev
ised
Proc
esse
s
Boa
rd o
f Man
agem
ent -
Tru
st F
und
IT O
rgan
isat
ion
Dev
elop
a b
usin
ess s
trate
gic
plan
bas
ed o
nth
e rec
omm
enda
tions
of t
he S
ocia
l Sec
urity
Ref
orm
Tas
k Fo
rce l
ikel
y to
be r
elea
sed
late
in 20
01.
Reg
istra
tion
of M
embe
rs
Form
s Red
esig
n
Dat
a Ent
ry T
imel
ines
s
Doc
umen
t Sto
rage
– D
estru
ctio
n Sc
hedu
les
Legi
slat
ive
chan
ges
to e
stab
lish
trust
fund
and
the
proc
esse
s an
d pr
oced
ures
for t
he o
pera
tion
of th
ebo
ard
of T
rust
ees.
IT s
houl
d be
com
e in
depe
nden
t fro
m F
inan
ce a
ndbe
abl
e to
rel
ate
at D
irec
tor
leve
l w
ith o
ther
dire
ctor
ates
. Thi
s rai
ses I
T to
the
appr
opria
te le
vel
in th
e or
gani
zatio
n co
mm
ensu
rate
with
its
role
inth
e or
gani
satio
n
Plan
shou
ld in
clud
e vi
sion
for J
amso
stek
as p
art o
fth
e so
cial
secu
rity
refo
rm. T
he p
lan
shou
ld in
clud
eth
e fu
ture
dev
elop
men
t pl
ans
for
exte
nsio
n of
cove
rage
, com
plia
nce,
inve
stmen
t man
agem
ent a
ndIT
re-d
evel
opm
ent.
This
pro
cess
sho
uld
be d
esig
ned
for t
he in
duct
ion
of m
embe
rs in
to Ja
mso
stek
pro
gram
s and
des
igne
dto
prov
e ide
ntity
, col
lect
info
rmat
ion,
ensu
re m
embe
run
ders
tand
s rig
hts
and
oblig
atio
ns
Red
esig
n of
pro
cess
es w
ill re
quire
mod
ifica
tions
toin
form
atio
n (d
ata)
colle
ctio
n an
d he
nce f
orm
s
Ther
e ar
e a
num
ber o
f ins
tanc
es w
here
dat
a is
not
ente
red
imm
edia
tely
into
the
syst
em a
nd th
is c
anre
sult
in d
elay
s an
d di
sput
es a
bout
fin
al p
aym
ent
amou
nts.
The p
ract
ice o
f sto
ckpi
ling
retu
rns s
houl
dbe
inve
stig
ated
Mos
t off
ices
hav
e di
ffic
ulty
man
agin
g th
e st
orag
eof
doc
umen
ts a
nd m
aint
aini
ng d
ocum
ent a
rchi
ves.
The
abili
ty to
des
troy
the
pape
r sou
rce
docu
men
tsaf
ter a
n el
apse
d tim
e is
not
ava
ilabl
e. T
he si
tuat
ion
shou
ld b
e re
view
ed t
o al
low
des
truct
ion
of b
ulk
docu
men
ts to
a p
resc
ribed
sch
edul
e an
d pr
oces
s.
•Le
gisl
atio
n re
ferr
ed to
the p
arlia
men
t.•
Doc
umen
tatio
n pr
epar
ed b
y IL
O p
roje
ct,
Jam
sost
ek a
nd D
epna
kertr
ans
•IL
O R
epor
t Rev
iew
of t
he O
pera
tions
and
ITin
Jam
sost
ek
•So
cial
Sec
urit
y R
efor
m T
ask
Forc
ere
com
men
datio
ns d
ue en
d D
ecem
ber 2
001.
•IL
O sp
onso
red
IT R
eeng
inee
ring
wor
ksho
pto
be h
eld
Feb
2002
•W
ill re
quire
mem
bers
to lo
dge f
orm
s·Ve
rific
atio
n of
iden
tity
•M
ay re
quire
inte
rvie
ws
•Pa
rt of
ILO
spo
nsor
ed I
T R
eeng
inee
ring
wor
ksho
p to
be h
eld
Feb
2002
•O
ngoi
ng im
prov
emen
t pro
cess
•A
utom
atio
n of
dat
a en
try c
onsi
dera
tions
.•
Prom
otio
n of
ele
ctro
nic
inpu
ts f
rom
empl
oyer
s.•
Mon
itorin
g da
ta e
ntry
in st
atis
tical
retu
rns.
•C
ost o
f prim
e of
fice
spac
e to
stor
e pa
per i
sno
t eff
ectiv
e.•
Off
-site
stor
age
or a
rchi
ving
is a
n op
tion.
•Po
or s
tora
ge c
an r
ende
r pa
per
docu
men
tsun
usab
le in
som
e ci
rcum
stan
ces.
•O
H &
S is
sues
can
aris
e fr
om d
amp,
pap
erm
ites e
tc.

Annexes
324
Ann
ex 1
- J
amso
stek
Ser
vice
Im
prov
emen
t Su
mm
ary
(con
t.)
No.
Cat
egor
yFu
nctio
nD
escr
iptio
nR
emar
ks
4In
form
ati
on
Tech
nolo
gyR
egis
tratio
n Pr
oces
s
Uni
que M
embe
rshi
p N
umbe
r
Rec
ord
Inte
grat
ion
Dat
a R
edun
danc
y
Dat
a M
anag
emen
t
Secu
rity
Nat
iona
l Ind
ex
IT D
evel
opm
ent a
nd M
aint
enan
ce
IT as
pect
s to
supp
ort t
he o
utco
me o
f the
rede
sign
edpr
oces
s (s
ee 3
abo
ve)
Dev
elop
men
t of
a u
niqu
e se
quen
tial
Jam
sost
ekm
embe
rshi
p nu
mbe
r
Iden
tific
atio
n an
d am
alga
mat
ion
of m
ultip
le re
cord
sfo
r the
sam
e cu
stom
er
Rev
iew
dat
a re
cord
to re
mov
e du
plic
ate
inst
ance
sof
dat
a fie
lds
and
cons
ider
use
of
a Pe
rson
Dat
am
odul
e
Con
side
r arc
hivi
ng c
ompl
eted
reco
rds f
rom
act
ive
data
base
to im
prov
e ef
ficie
ncy.
Arc
hive
s co
uld
beac
cess
ed se
para
tely
or o
ff-li
ne
The
logo
n pr
oces
s to
serv
ers n
eeds
to b
e re
view
edto
incl
ude
secu
re a
cces
s to
appl
icat
ions
as w
ell.
Inve
stig
ate
the
optio
ns f
or d
evel
opm
ent
and
depl
oym
ent o
f a n
atio
nal d
ata
inde
x to
ena
ble
any
mem
ber
reco
rd t
o be
loc
ated
fro
m a
ny s
ite i
nJa
mso
stek
Org
anisa
tion,
task
s and
staf
fing
of D
evel
opm
ent a
ndm
aint
enan
ce te
ams.
Ther
e sh
ould
be
a se
para
te IT
deve
lopm
ent
team
for
dat
abas
e ch
ange
s an
dJa
mso
stek
impr
ovem
ent s
trate
gy.
•Pa
rt of
ILO
spo
nsor
ed I
T R
eeng
inee
ring
wor
ksho
p to
be h
eld
Feb
2002
.
•R
eeng
inee
ring
wor
ksho
p (A
s abo
ve)·
Pre-
requ
isit
e to
al
l ot
her
data
re
-de
velo
pmen
ts
•R
eeng
inee
ring
wor
ksho
p (A
s abo
ve)
•W
ill r
equi
re s
ubst
antia
l da
ta c
olle
ctio
nex
erci
se•
Dev
elop
men
t co
uld
be s
uppo
rted
by
addi
tiona
l ILO
impl
emen
tatio
n pr
ojec
t•
Uni
que
num
ber
and
data
red
esig
n ar
e pr
e-re
quis
ites
•IL
O R
epor
t Rev
iew
of th
e Ope
ratio
ns a
nd IT
in J
amso
stek
·D
evel
opm
ent
coul
d be
supp
orte
d by
addi
tiona
l ILO
impl
emen
tatio
npr
ojec
t
•IL
O R
epor
t Rev
iew
of th
e Ope
ratio
ns a
nd IT
in J
amso
stek
•D
evel
opm
ent
coul
d be
sup
port
ed b
yad
ditio
nal I
LO im
plem
enta
tion
proj
ect
•A
cces
s to
app
licat
ions
sho
uld
be re
stric
ted
to a
ppro
pria
te u
sers
onl
y.•
Secu
rity
and
priv
acy
prog
ram
sho
uld
bepr
omot
ed to
all s
taff
.
•Pl
anni
ng st
age
will
be
at IL
O sp
onso
red
ITR
eeng
inee
ring
wor
ksho
p to
be
held
Feb
2002
.·D
evel
opm
ent c
ould
be
supp
orte
d by
addi
tiona
l ILO
impl
emen
tatio
n pr
ojec
t
•O
rgan
isat
iona
l is
sues
and
tas
ks w
ill b
eco
nsid
ered
at
IL
O
spon
sore
d IT
Reen
gine
erin
g w
orks
hop
to b
e hel
d Fe
b 20
02•
Det
ails
and
com
paris
ons c
an b
e see
n du
ring
Stud
y To
ur F
eb 2
002

Annexes
325
5 6
Frau
d C
ontro
l
Se
rv
ic
eSt
anda
rds
Stan
dard
s an
d Pr
oced
ures
IT T
rain
ing
Bus
ines
s Ree
ngin
eerin
g
Dev
elop
men
t of s
tand
ards
and
ass
essm
ent
of ri
sks o
f fra
ud
Frau
d C
ontro
l Pla
n
Iden
tific
atio
n of
key
serv
ice
stan
dard
s.
Publ
icis
ing
stan
dard
s
Mea
sure
men
t of s
tand
ards
and
Perfo
rman
ce.
Jam
sost
ek N
eeds
to d
evel
op a
gree
d st
anda
rds
for
IT i
nclu
ding
dev
elop
men
t m
etho
dolo
gy, P
roje
ctm
etho
ds, r
elea
se m
anag
emen
t, ch
ange
man
agem
ent
etc,
Trai
ning
of B
ranc
h of
fice
data
base
adm
inis
trato
rsdi
scus
sed
unde
r tra
inin
g Fu
nctio
n. S
tudy
Tou
r for
IT st
aff p
lann
ed fo
r lat
e Feb
200
2
To u
nder
take
a f
ull
revi
ew o
f th
e m
ain
busi
ness
func
tions
per
form
ed i
n Ja
mso
stek
fro
m a
use
rpe
rspe
ctiv
e. In
corp
orat
e pot
entia
l mod
ifica
tions
into
the
revi
ew a
nd c
onsi
dera
tion
This
sho
uld
be b
ased
aro
und
the
prin
cipl
es o
fPr
even
tion,
Det
ectio
n an
d D
eter
renc
e. A
ris
kas
sess
men
t will
assi
st Ja
mso
stek
to d
evel
op a
Frau
dC
ontro
l stra
tegy
.
Seco
nd s
tage
of t
he p
roce
ss to
dev
elop
a n
atio
nal
plan
for
fra
ud c
ontr
ol i
nclu
ding
pro
cedu
res,
orga
niza
tion,
targ
et au
dien
ce fo
r fra
ud co
ntro
l. Th
epl
an s
houl
d be
dev
elop
ed f
or s
taff
at
the
thre
eor
gani
satio
nal
leve
ls i
n Ja
mso
stek
, N
atio
nal,
Reg
iona
l and
Bra
nch.
The s
ervi
ce st
anda
rds s
houl
d id
entif
y tim
elin
ess a
ndqu
alit
y an
d in
itia
l m
easu
rem
ent
of c
urre
ntac
hiev
emen
ts in
each
off
ice
The a
ppro
pria
te st
anda
rds s
houl
d be
pub
lishe
d an
dpr
omul
gate
d in
all
offic
es a
s pa
rt of
Jam
sost
ekcu
stom
er se
rvic
e ch
arte
r
Initi
al m
easu
rem
ent a
nd re
porti
ng m
ay b
e res
trict
edto
man
ual
and
sam
ple
asse
ssm
ent
pend
ing
the
deve
lopm
ent o
f the
Exe
cutiv
e Inf
orm
atio
n sy
stem
.
•IL
O R
epor
t Rev
iew
of th
e Ope
ratio
ns a
nd IT
in J
amso
stek
·D
etai
ls a
nd c
ompa
riso
nsca
n be
seen
dur
ing
Stud
y To
ur F
eb 2
002
asCe
ntre
link A
ustra
lia is
an IS
O 90
00 ap
prov
edso
ftwar
e dev
elop
er.
•St
udy t
our a
ppro
ved t
o visi
t Cen
trelin
k/FA
CSin
Aus
tralia
late
Feb
200
2•
Det
ails
and
com
paris
ons c
an b
e see
n du
ring
Stud
y To
ur F
eb 2
002
•Pl
anni
ng st
age
will
be
at IL
O sp
onso
red
ITRe
engi
neer
ing w
orks
hop t
o be h
eld F
eb 20
02·
Out
com
e to
prep
are a
dra
ft IT
stra
tegi
c pla
nfo
r red
evel
opm
ent o
f Jam
sost
ek IT
•Th
e prin
cipl
es co
uld
form
par
t of a
dditi
onal
ILO
stud
y.•
The
deve
lopm
ent
of s
tand
ards
sho
uld
bepa
rt of
a sa
mpl
ing
and
asse
ssm
ent a
udit
•Fr
aud
cont
rol
plan
can
be
deve
lope
d in
asso
ciat
ion
with
dev
elop
men
t of s
tand
ards
·Th
e Fra
ud co
ntro
l Pla
n an
d pr
inci
ples
coul
dfo
rm p
art o
f add
ition
al IL
O st
udy
•St
anda
rds
sele
cted
sho
uld
be th
ose
criti
cal
to o
pera
tions
, and
a su
bset
of t
he to
tal r
ange
of s
tand
ards
. The
y sh
ould
be
quan
titat
ive
and
qual
itativ
e
•Pu
blic
ised
stand
ards
can
help
impr
ove p
ublic
perc
eptio
n an
d sta
ff co
mm
itmen
t to
sele
ctiv
ese
rvic
e st
anda
rds
•Pr
oces
s co
uld
be s
uppo
rted
by a
dditi
onal
ILO
stu
dy b
ased
on
supp
ort f
rom
ano
ther
soci
al s
ecur
ity a
genc
y
Ann
ex 1
- J
amso
stek
Ser
vice
Im
prov
emen
t Su
mm
ary
(con
t.)
No.
Cat
egor
yFu
nctio
nD
escr
iptio
nR
emar
ks
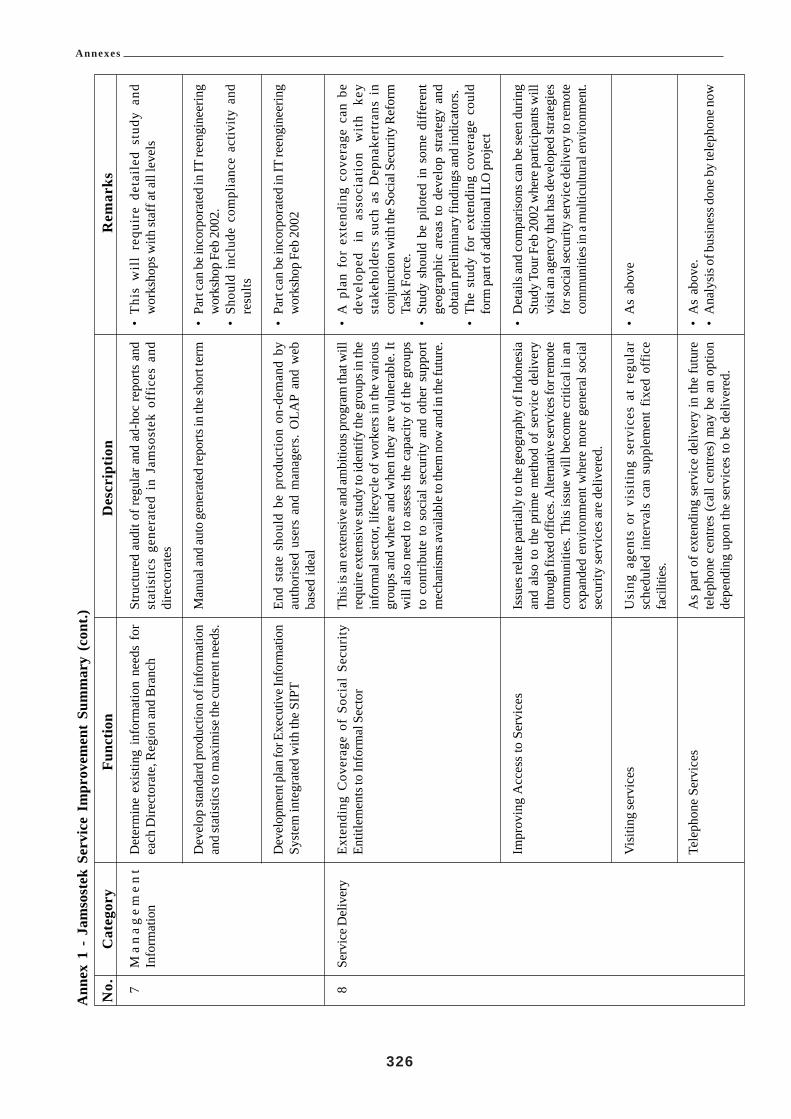
Annexes
326
Ann
ex 1
- J
amso
stek
Ser
vice
Im
prov
emen
t Su
mm
ary
(con
t.)
No.
Cat
egor
yFu
nctio
nD
escr
iptio
nR
emar
ks
7 8
Ma
na
ge
me
nt
Info
rmat
ion
Serv
ice D
eliv
ery
Det
erm
ine
exis
ting
info
rmat
ion
need
s fo
rea
ch D
irect
orat
e, R
egio
n an
d B
ranc
h
Dev
elop
stan
dard
pro
duct
ion
of in
form
atio
nan
d st
atis
tics t
o m
axim
ise t
he cu
rren
t nee
ds.
Dev
elop
men
t pla
n fo
r Exe
cutiv
e Inf
orm
atio
nSy
stem
inte
grat
ed w
ith th
e SI
PT
Exte
ndin
g C
over
age
of S
ocia
l Se
curi
tyEn
title
men
ts to
Info
rmal
Sec
tor
Impr
ovin
g A
cces
s to
Ser
vice
s
Vis
iting
serv
ices
Tele
phon
e Se
rvic
es
Stru
ctur
ed a
udit
of re
gula
r and
ad-
hoc
repo
rts a
ndst
atis
tics
gene
rate
d in
Jam
sost
ek o
ffic
es a
nddi
rect
orat
es
Man
ual a
nd au
to g
ener
ated
repo
rts in
the s
hort
term
End
stat
e sh
ould
be
prod
uctio
n on
-dem
and
byau
thor
ised
use
rs a
nd m
anag
ers.
OLA
P an
d w
ebba
sed
idea
l
This
is an
exte
nsiv
e and
ambi
tious
pro
gram
that
will
requ
ire ex
tens
ive s
tudy
to id
entif
y th
e gro
ups i
n th
ein
form
al se
ctor
, life
cycl
e of
wor
kers
in th
e va
rious
grou
ps a
nd w
here
and
whe
n th
ey a
re v
ulne
rabl
e. It
will
als
o ne
ed to
ass
ess
the
capa
city
of t
he g
roup
sto
con
tribu
te to
soc
ial s
ecur
ity a
nd o
ther
sup
port
mec
hani
sms a
vaila
ble t
o th
em n
ow an
d in
the f
utur
e.
Issu
es re
late
par
tially
to th
e geo
grap
hy o
f Ind
ones
iaan
d al
so to
the
prim
e m
etho
d of
ser
vice
del
iver
yth
roug
h fix
ed o
ffice
s. A
ltern
ativ
e ser
vice
s for
rem
ote
com
mun
ities
. Thi
s iss
ue w
ill b
ecom
e cr
itica
l in
anex
pand
ed e
nviro
nmen
t whe
re m
ore
gene
ral s
ocia
lse
curit
y se
rvic
es a
re d
eliv
ered
.
Usi
ng a
gent
s or
vis
itin
g se
rvic
es a
t re
gula
rsc
hedu
led
inte
rval
s ca
n su
pple
men
t fix
ed o
ffic
efa
cilit
ies.
As
part
of e
xten
ding
ser
vice
del
iver
y in
the
futu
rete
leph
one
cent
res
(cal
l cen
tres)
may
be
an o
ptio
nde
pend
ing
upon
the
serv
ices
to b
e de
liver
ed.
•T
his
wil
l re
quir
e de
tail
ed s
tudy
and
wor
ksho
ps w
ith st
aff a
t all
leve
ls
•Pa
rt ca
n be
inco
rpor
ated
in IT
reen
gine
erin
gw
orks
hop
Feb
2002
.•
Shou
ld i
nclu
de c
ompl
ianc
e ac
tivity
and
resu
lts
•Pa
rt ca
n be
inco
rpor
ated
in IT
reen
gine
erin
gw
orks
hop
Feb
2002
•A
pla
n fo
r ex
tend
ing
cove
rage
can
be
deve
lope
d in
as
soci
atio
n w
ith
key
stak
ehol
ders
suc
h as
Dep
nake
rtra
ns i
nco
njun
ctio
n w
ith th
e Soc
ial S
ecur
ity R
efor
mTa
sk F
orce
.•
Stud
y sh
ould
be
pilo
ted
in s
ome
diff
eren
tge
ogra
phic
are
as t
o de
velo
p st
rate
gy a
ndob
tain
pre
limin
ary
findi
ngs a
nd in
dica
tors
.•
The
stud
y fo
r ex
tend
ing
cove
rage
cou
ldfo
rm p
art o
f add
ition
al IL
O p
roje
ct
•D
etai
ls an
d co
mpa
rison
s can
be s
een
durin
gSt
udy
Tour
Feb
200
2 w
here
par
ticip
ants
will
visi
t an
agen
cy th
at h
as d
evel
oped
stra
tegi
esfo
r soc
ial s
ecur
ity se
rvic
e del
iver
y to
rem
ote
com
mun
ities
in a
mul
ticul
tura
l env
ironm
ent.
•A
s ab
ove
•A
s ab
ove.
•A
naly
sis o
f bus
ines
s don
e by
tele
phon
e now

Annexes
327
Ann
ex 1
- J
amso
stek
Ser
vice
Im
prov
emen
t Su
mm
ary
(con
t.)
No.
Cat
egor
yFu
nctio
nD
escr
iptio
nR
emar
ks
9Po
licy
Initi
ativ
es
e-B
usin
ess
Ben
efit
Paym
ent –
With
draw
al fr
om F
und
on U
nem
ploy
men
t
Mem
bers
hip
Focu
s
Wor
k In
jury
Rep
ortin
g
Polic
y D
evel
opm
ent C
ell
E-bu
sine
ss i
s st
ill n
ot n
orm
al p
ract
ice
in s
ocia
lse
curi
ty s
yste
ms
but
is d
evel
opin
g as
a m
ajor
initi
ativ
e in
mos
t cou
ntrie
s. In
form
atio
n se
rvic
e on
the i
nter
net a
re b
eing
exte
nded
to b
asic
and
in so
me
case
s ad
vanc
ed p
roce
ssin
g
The
Min
iste
rial
Dec
ree
that
allo
ws
unem
ploy
edpe
ople
to w
ithdr
aw th
eir r
etire
men
t sav
ings
afte
r six
mon
ths h
as p
oten
tial t
o in
crea
se p
over
ty in
old
age.
The n
eces
sity
for t
his p
rovi
sion
shou
ld b
e exa
min
ed.
Cha
nge
muc
h of
the
focu
s of
mem
bers
hip
to th
ein
divi
dual
mem
ber.
This
cou
ld in
clud
e rig
hts
and
resp
onsi
bilit
ies,
clai
ms,
notif
icat
ion
of s
tatu
s an
din
com
e.
Rev
iew
of
the
proc
ess
and
in p
artic
ular
the
wor
kpla
ce r
epor
ting
stra
tegy
to
mai
ntai
n in
jury
regi
ster
in e
ach
wor
kpla
ce. R
evie
w th
e re
porti
ngm
etho
ds; i
t may
be m
ore a
ppro
pria
te fo
r Jam
sost
ekto
ref
er t
he i
njur
ies
that
occ
urre
d as
a r
esul
t of
pote
ntia
lly u
nsaf
e wor
kpla
ces.
This
coul
d m
inim
ise
the e
mpl
oyer
from
repo
rting
ALL
inju
ries a
nd b
ette
rta
rget
the
unsa
fe w
orkp
lace
s. St
atis
tical
repo
rting
to D
epna
kertr
ans
of w
orkp
lace
inju
ries
shou
ld b
ere
view
ed.
Esta
blis
h a
polic
y op
tions
cel
l to
dev
elop
and
mai
ntai
n po
licy
sugg
estio
ns an
d th
eir i
mpa
ct o
n th
eor
gani
zatio
n. T
o pr
omot
e ch
ange
s is p
olic
y in
line
with
mem
bers
nee
ds.
•Po
tent
ial
to d
o ad
ditio
nal
busi
ness
by
tele
phon
e•
Nat
iona
l sin
gle
acce
ss n
umbe
r•
Cos
ts sa
ving
s by
volu
me
of c
alls
•A
utom
atio
n an
d vo
ice/
com
putin
g in
tegr
atio
n
•A
s ab
ove.
•D
oubl
e ben
efit
as re
dund
ancy
pro
visio
ns (u
pto
4 m
onth
s sa
lary
) in
som
e ca
ses
may
be
grea
ter t
han
retir
emen
t pay
men
t.•
Inst
ance
s w
here
mem
bers
hav
e be
en r
e-em
ploy
ed w
ithin
6 m
onth
s an
d ar
e st
illen
title
d to
with
draw
thei
r ret
irem
ent s
avin
gs.
•R
equi
res i
nten
sive
mar
ketin
g•
IT re
deve
lopm
ent i
s a p
re-r
equi
site
•R
evie
w o
f pro
cess
•Li
aiso
n w
ith D
epna
kertr
ans a
nd h
ealth
car
epr
ovid
ers
•St
akeh
olde
rs i
nclu
de e
mpl
oyer
s an
dem
ploy
ees
repr
esen
tativ
es•
In c
onju
nctio
n w
ith a
n fu
ture
ILO
Stu
dy o
nW
ork
inju
ry p
rogr
am
•N
atio
nall
y sp
onso
red
focu
s gr
oups
in
Bra
nche
s an
d R
egio
ns to
stim
ulat
e po
licy
need
s of
clie
nts
and
user
s•
Prog
ram
s co
uld
be R
egio
nally
foc
usse
dus
ing
host
regi
ons t
o pr
omot
e a
prog
ram
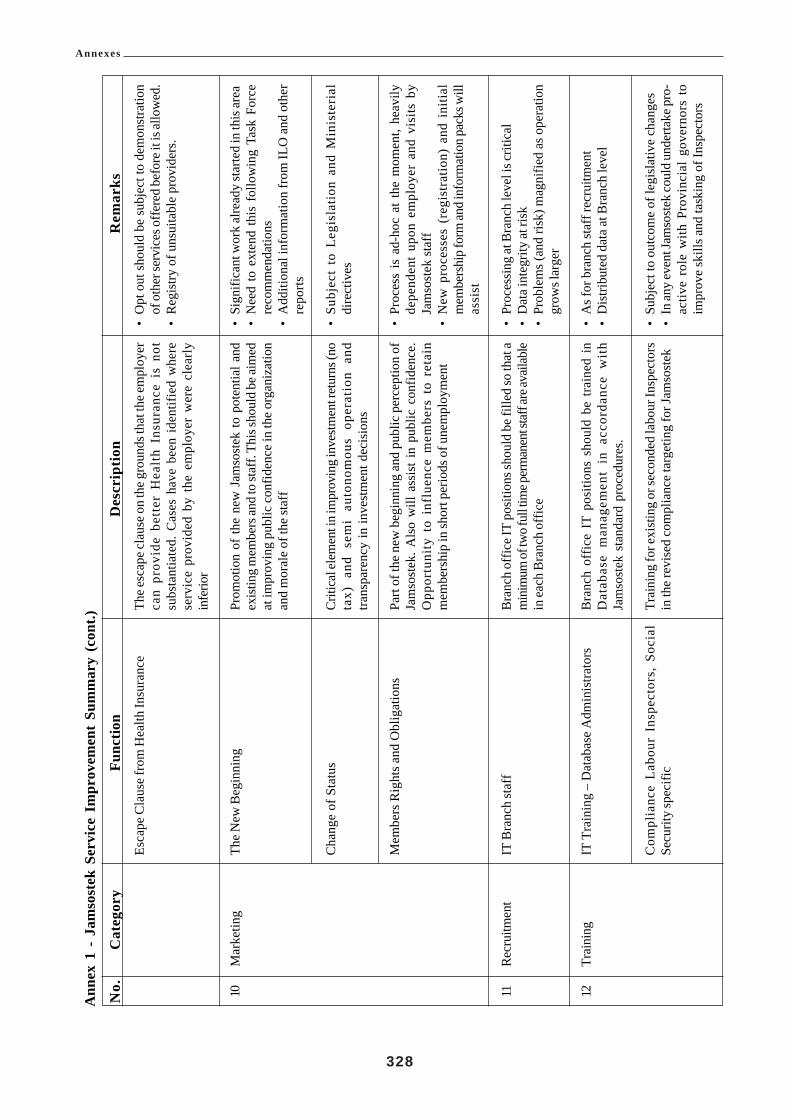
Annexes
328
Ann
ex 1
- J
amso
stek
Ser
vice
Im
prov
emen
t Su
mm
ary
(con
t.)
No.
Cat
egor
yFu
nctio
nD
escr
iptio
nR
emar
ks
10 11 12
Mar
ketin
g
Rec
ruitm
ent
Trai
ning
Esca
pe C
laus
e fro
m H
ealth
Insu
ranc
e
The N
ew B
egin
ning
Cha
nge
of S
tatu
s
Mem
bers
Rig
hts a
nd O
blig
atio
ns
IT B
ranc
h st
aff
IT T
rain
ing
– D
atab
ase
Adm
inis
trato
rs
Com
plia
nce
Labo
ur I
nspe
ctor
s, S
ocia
lSe
curit
y sp
ecifi
c
The e
scap
e cla
use o
n th
e gro
unds
that
the e
mpl
oyer
can
prov
ide
bett
er H
ealt
h In
sura
nce
is n
otsu
bsta
ntia
ted.
Cas
es h
ave
been
ide
ntifi
ed w
here
serv
ice
prov
ided
by
the
empl
oyer
wer
e cl
early
infe
rior
Prom
otio
n of
the
new
Jam
sost
ek to
pot
entia
l and
exist
ing
mem
bers
and
to st
aff.
This
shou
ld b
e aim
edat
impr
ovin
g pu
blic
con
fiden
ce in
the
orga
niza
tion
and
mor
ale
of th
e st
aff
Criti
cal e
lem
ent i
n im
prov
ing
inve
stmen
t ret
urns
(no
tax)
and
sem
i au
tono
mou
s op
erat
ion
and
trans
pare
ncy
in in
vest
men
t dec
isio
ns
Part
of th
e ne
w b
egin
ning
and
pub
lic p
erce
ptio
n of
Jam
sost
ek. A
lso
will
ass
ist i
n pu
blic
con
fiden
ce.
Opp
ortu
nity
to
infl
uenc
e m
embe
rs t
o re
tain
mem
bers
hip
in sh
ort p
erio
ds o
f une
mpl
oym
ent
Bra
nch
offic
e IT
posi
tions
shou
ld b
e fill
ed so
that
am
inim
um of
two f
ull ti
me p
erm
anen
t sta
ff ar
e ava
ilabl
ein
each
Bra
nch
offic
e
Bra
nch
offic
e IT
pos
ition
s sh
ould
be
train
ed i
nD
atab
ase
man
agem
ent
in a
ccor
danc
e w
ith
Jam
sost
ek s
tand
ard
proc
edur
es.
Trai
ning
for e
xist
ing
or se
cond
ed la
bour
Insp
ecto
rsin
the
revi
sed
com
plia
nce
targ
etin
g fo
r Jam
sost
ek
•O
pt o
ut sh
ould
be
subj
ect t
o de
mon
stra
tion
of o
ther
serv
ices
offe
red
befo
re it
is al
low
ed.
•R
egis
try o
f uns
uita
ble
prov
ider
s.
•Si
gnifi
cant
wor
k al
read
y st
arte
d in
this
area
•N
eed
to e
xten
d th
is f
ollo
win
g Ta
sk F
orce
reco
mm
enda
tions
•A
dditi
onal
info
rmat
ion
from
ILO
and
oth
erre
ports
•Su
bjec
t to
Leg
isla
tion
and
Min
iste
rial
dire
ctiv
es
•Pr
oces
s is
ad-
hoc
at t
he m
omen
t, he
avily
depe
nden
t up
on e
mpl
oyer
and
vis
its b
yJa
mso
stek
staf
f•
New
pro
cess
es (
regi
stra
tion)
and
ini
tial
mem
bers
hip
form
and
info
rmat
ion
pack
s will
assi
st
•Pr
oces
sing
at B
ranc
h le
vel i
s crit
ical
•D
ata i
nteg
rity
at ri
sk•
Prob
lem
s (an
d ris
k) m
agni
fied
as o
pera
tion
grow
s lar
ger
•A
s for
bra
nch
staf
f rec
ruitm
ent
•D
istri
bute
d da
ta a
t Bra
nch
leve
l
•Su
bjec
t to
outc
ome
of le
gisl
ativ
e ch
ange
s•
In an
y ev
ent J
amso
stek
coul
d un
derta
ke p
ro-
activ
e ro
le w
ith P
rovi
ncia
l go
vern
ors
toim
prov
e sk
ills a
nd ta
skin
g of
Insp
ecto
rs

Annexes
329
Ann
ex 1
- J
amso
stek
Ser
vice
Im
prov
emen
t Su
mm
ary
(con
t.)
No.
Cat
egor
yFu
nctio
nD
escr
iptio
nR
emar
ks
•C
ompa
riso
ns w
ith o
ther
ins
titut
ions
is
poss
ible
by
way
of s
tudy
tour
s•
Cha
rters
for
sim
ilar
man
agem
ent
boar
dsco
uld
be c
onsi
dere
d e.
g. d
urin
g st
udy
tour
Feb
2002
(Cen
trelin
k op
erat
es u
sing
a bo
ard
of d
irect
ors s
imila
r to
priv
ate c
ompa
nies
)
•W
ell e
stabl
ished
pro
cess
es ar
e ava
ilabl
e for
min
tern
atio
nal s
ocia
l sec
urity
org
anis
atio
ns.
•Sh
ould
be p
art o
f a fu
rther
ILO
pro
ject
.
•W
ell e
stabl
ished
pro
cess
es ar
e ava
ilabl
e for
min
tern
atio
nal s
ocia
l sec
urity
org
anis
atio
ns.
•M
onito
ring
and
cont
rol o
f the
pro
cess
es a
rees
sent
ial e
lem
ents
.•
Trai
ning
com
pone
nt is
leng
thy
•Sh
ould
be p
art o
f a fu
rther
ILO
pro
ject
.
•W
ell e
stabl
ished
pro
cess
es ar
e ava
ilabl
e for
min
tern
atio
nal s
ocia
l sec
urity
org
anis
atio
ns.
•St
aff
deve
lopm
ent
stra
tegy
nee
ds t
o be
deve
lope
d as
a k
ey re
quis
ite.
•M
onito
ring
and
cont
rol o
f the
pro
cess
es a
rees
sent
ial e
lem
ents
.•
Trai
ning
com
pone
nt is
leng
thy
•Sh
ould
be p
art o
f a fu
rther
ILO
pro
ject
Esta
blis
hmen
t of
the
Boa
rd o
f Tr
uste
es a
nd t
hegu
idel
ines
for o
pera
tion
will
nee
d so
me t
rain
ing
for
boar
d m
embe
rs.
Add
ition
al F
amili
aris
atio
n of
Jam
sost
ek O
pera
tions
trai
ning
will
be
requ
ired
for
all n
ew an
d re
plac
emen
t boa
rd m
embe
rs
Thes
e do
cum
ents
sho
uld
be a
vaila
ble
for
all
posi
tions
in Ja
mso
stek
so th
at a
ll st
aff a
re a
war
e of
thei
r dut
ies a
nd th
e dut
ies a
nd ta
sks o
f oth
er st
aff i
nth
e org
anis
atio
n. T
he se
lect
ion
crite
ria d
escr
ibe t
hesk
ills
and
attri
bute
s re
quire
d of
app
lican
ts fo
r the
posi
tions
.Dep
nake
rtran
s has
dev
elop
ed a
cata
logu
eof
all
form
al s
ecto
r em
ploy
men
t po
sitio
ns i
nIn
done
sia
that
con
tain
s ta
sks.
Dir
ecto
rate
of
Occ
upat
iona
l Gui
danc
e an
d an
alys
is m
aint
ain
this
cata
logu
e.
Thes
e pro
cess
es n
eed
to b
e bet
ter d
efin
ed to
enab
leth
ose
task
s to
be p
erfo
rmed
bas
ed o
n th
e pr
inci
ple
set
by t
he g
over
nmen
t an
d th
e B
oard
of
Com
mis
sion
ers.
It is
nor
mal
in m
ost c
ount
ries a
ndpa
rticu
larly
in p
ublic
serv
ice t
hat t
he k
ey p
rinci
ples
are m
erit
sele
ctio
n an
d pr
omot
ion,
equa
l opp
ortu
nity
and
acce
ss to
all
posi
tions
This
is a d
iffic
ult a
rea o
f HR
man
agem
ent a
nd re
quire
sa
stro
ng c
omm
itmen
t fr
om s
enio
r m
anag
ers
tode
term
ine
the
prin
cipl
es a
nd to
show
lead
ersh
ip in
thei
r ex
ecut
ion.
The
rew
ards
fro
m e
ffec
tive
perf
orm
ance
app
rais
al a
re la
rge
but t
here
is a
lso
are
quire
men
t for
org
anis
atio
nal c
ultu
re c
hang
e an
dtr
aini
ng o
f su
perv
isor
s to
del
iver
per
form
ance
feed
back
and
for s
taff
to re
ceiv
e the
feed
back
in th
esp
irit o
f im
prov
emen
t goa
ls.
Trus
t and
Boa
rd M
embe
rs
Job
Stat
emen
ts an
d Se
lect
ion
Crit
eria
Rec
ruitm
ent,
Sele
ctio
n an
d Pr
omot
ion
Perf
orm
ance
appr
aisa
l
Hu
ma
nR
esou
rces
13

Annexes
330
Ann
ex 1
- J
amso
stek
Ser
vice
Im
prov
emen
t Su
mm
ary
(con
t.)
No.
Cat
egor
yFu
nctio
nD
escr
iptio
nR
emar
ks14
Com
plia
nce
Dev
elop
Com
plia
nce S
trate
gy
Exa
min
e In
spec
tion
and
enf
orce
men
top
tions
Opt
ions
sho
uld
be c
onsi
dere
d un
der
exis
ting
proc
edur
es a
nd a
uton
omou
s co
ntro
l of i
nspe
ctor
s.
All
aven
ues
shou
ld b
e ex
plor
ed t
o ex
ploi
t th
eav
aila
ble
reso
urce
s eith
er a
t nat
iona
l or l
ocal
leve
l(s
houl
d th
e pro
posa
ls to
pro
vide
Jam
sost
ek w
ith it
sow
n en
forc
emen
t cap
abili
ty n
ot b
e app
rove
d). T
his
coul
d in
clud
e sec
ondm
ent o
f ins
pect
ors,
iden
tifyi
ngde
dica
ted
insp
ecto
rs f
rom
the
Din
as K
erja
poo
l,N
egot
iatin
g fo
r dire
ct ta
skin
g of
insp
ecto
rs e
tc.
•A
im to
impr
ove c
ompl
ianc
e, m
embe
rshi
p and
prot
ectio
n of
wor
kers
•C
ould
be p
art o
f an
addi
tiona
l ILO
supp
orte
dst
udy
•Su
ppor
t of P
rovi
ncia
l gov
erno
rs•
Poss
ibly
bas
ing
insp
ecto
rs i
n Ja
mso
stek
offic
es fo
r sho
rt pe
riods
•D
irect
task
ing
from
Jam
sost
ek o
ffic
es·
Use
of
com
plem
enta
ry r
esou
rces
and
info
rmat
ion
e.g.
Ta
xati
on,
busi
ness
regi
stra
tion
etc·
Cou
ld
be
part
of
an
addi
tiona
l ILO
sup
porte
d st
udy

Annexes
331
Annex 2 Taxation Collection in Indonesia
This section is included in the IT report as background information about the other major contribution collectionagency in Indonesia, the tax office (Pajak). The taxation system has direct relevance to Jamsostek as bothorganisations have some common customers (companies and individual members) and have common problems incollection of contributions (and taxes). Any future expansion of the social security system to include social assistancemay be reliant on increased taxation revenues to support the scheme.
Taxes are collected in Indonesia from the following areas:• Corporations,• Personal taxpayers, and• Withholdings from SOE’s.
The national tax office also collects land taxes on behalf of provincial administrations for which it levies a 0.9%collection fee. Other taxes include B2B taxes such as VAT, Notary taxes, from immigration etc. A percentage of20% of some taxes are returned to the local provinces from which the taxes are collected and these amountscontribute to the funding of Provincial Governments. Provincial governments have a local tax office in theiradministrations, DINAS Pajak. Some provincial governors have signalled their intentions to create another levelof taxation in their provinces by levying local taxes and this is believed to be consistent with the Regional Autonomylegislation.
By the end of 2001 the tax office will have a network of 18 Regional offices and 173 district offices throughoutIndonesia. The National office (Main office) is located in Jakarta. Each Regional Office administers between 4and 18 District Offices, depending on the number of taxpayers. The largest region is Surabaya. In addition to thegeneral tax offices there are also 55 specialist investigation offices that target businesses and individuals as part ofplanned investigations or by referral from the general tax offices. About 40% of the total workforce of 27,000 taxoffice staff is employed in the specialist investigation centres.
Taxpayers are required to apply for a Taxation Identification Number (TIN) from their local District Office. Thisis a nine-digit number that identifies the taxpayer and their locality.
The annual taxation income threshold for individual taxpayers is comprised of:
Taxpayer allowance 2,880,000 RpSpouse allowance 2,880,000 RpChild 1 allowance 1,440,000 RpChild 2 allowance 1,440,000 RpChild 3 allowance 1,440,000 Rp
Maximum allowable 10,080,000 Rp
The taxable threshold can be split in cases where the spouse is also working.
There are 2.2 million TIN in existence comprising corporate, personal and withholding taxpayers. This totalincludes about 1.6 million personal taxpayers in three categories of filers, stop filers and non-filers.

Annexes
332
The personal tax collection process is shown below:
Figure 1 Taxation collection process
The taxation collection process suffers from similar problems to those experienced by Depnakertrans labourinspectors and despite concerns of low productivity, protection of higher paid employers, the taxation collectionshave increased steadily over the past few years by around 15-20% per year. The key difficulties facing thetaxation office are:• limited data transfer network (only 54 offices on-line),• registration of taxpayers isvoluntary,• lack of cross reference ability to locate employers and taxpayers,• lack of a reliable national identity system, and• transfer of taxpayers between employers and regions.
There is some scope for cooperation between Jamsostek and the tax office to conduct a limited fraud preventiondata matching exercise to identify taxpayers/members and salary levels for employers/taxpayers/members. Thisopportunity is likely to be pursued by both agencies.

Annexes
333
Ann
ex 3
Jam
sost
ek F
inan
cial
Sta
tistic
s
Figu
re 1
Sum
mar
y of
dem
ogra
phic
and
eco
nom
ic a
ssum
ptio
ns, 2
001-
2030
Part
A20
01 –
201
5

Annexes
334
Ann
ex 3
Jam
sost
ek S
tatis
tics
Figu
re 1
Sum
mar
y of
dem
ogra
phic
and
eco
nom
ic a
ssum
ptio
ns, 2
001-
2030
Part
B20
16 –
203
0
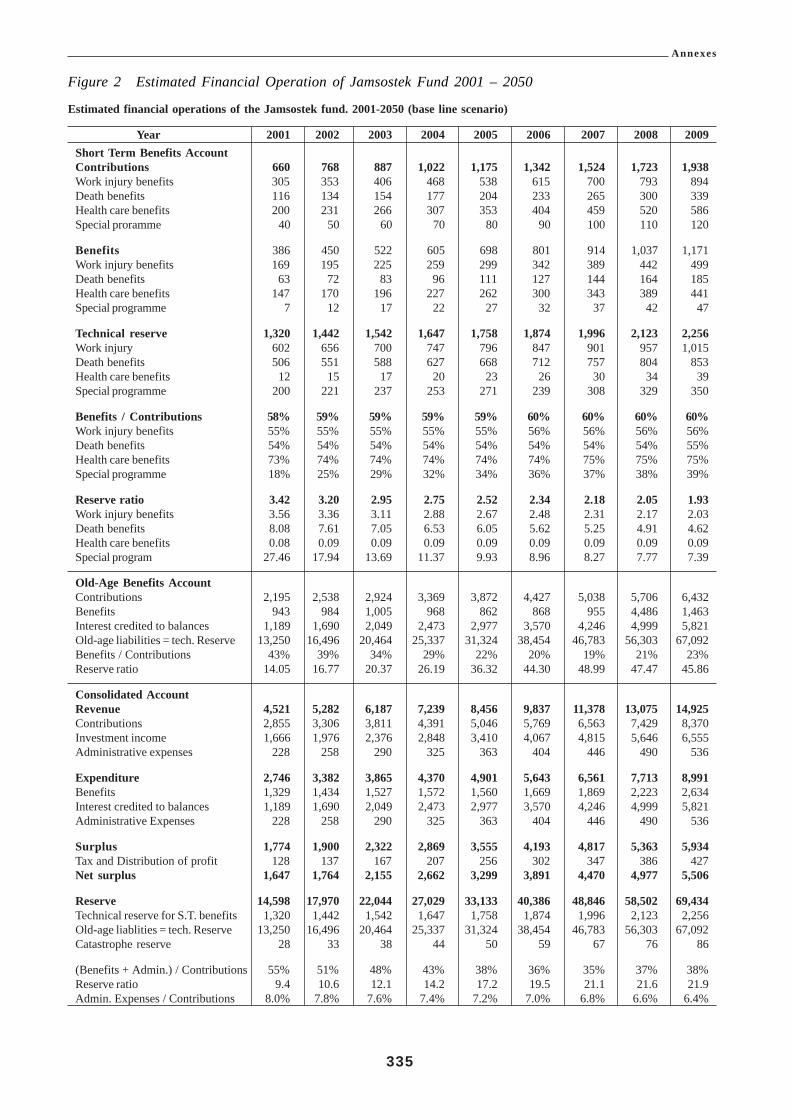
Annexes
335
Estimated financial operations of the Jamsostek fund. 2001-2050 (base line scenario)
Year 2001 2002 2003 2004 2005 2006 2007 2008 2009Short Term Benefits AccountContributions 660 768 887 1,022 1,175 1,342 1,524 1,723 1,938Work injury benefits 305 353 406 468 538 615 700 793 894Death benefits 116 134 154 177 204 233 265 300 339Health care benefits 200 231 266 307 353 404 459 520 586Special proramme 40 50 60 70 80 90 100 110 120
Benefits 386 450 522 605 698 801 914 1,037 1,171Work injury benefits 169 195 225 259 299 342 389 442 499Death benefits 63 72 83 96 111 127 144 164 185Health care benefits 147 170 196 227 262 300 343 389 441Special programme 7 12 17 22 27 32 37 42 47
Technical reserve 1,320 1,442 1,542 1,647 1,758 1,874 1,996 2,123 2,256Work injury 602 656 700 747 796 847 901 957 1,015Death benefits 506 551 588 627 668 712 757 804 853Health care benefits 12 15 17 20 23 26 30 34 39Special programme 200 221 237 253 271 239 308 329 350
Benefits / Contributions 58% 59% 59% 59% 59% 60% 60% 60% 60%Work injury benefits 55% 55% 55% 55% 55% 56% 56% 56% 56%Death benefits 54% 54% 54% 54% 54% 54% 54% 54% 55%Health care benefits 73% 74% 74% 74% 74% 74% 75% 75% 75%Special programme 18% 25% 29% 32% 34% 36% 37% 38% 39%
Reserve ratio 3.42 3.20 2.95 2.75 2.52 2.34 2.18 2.05 1.93Work injury benefits 3.56 3.36 3.11 2.88 2.67 2.48 2.31 2.17 2.03Death benefits 8.08 7.61 7.05 6.53 6.05 5.62 5.25 4.91 4.62Health care benefits 0.08 0.09 0.09 0.09 0.09 0.09 0.09 0.09 0.09Special program 27.46 17.94 13.69 11.37 9.93 8.96 8.27 7.77 7.39
Old-Age Benefits AccountContributions 2,195 2,538 2,924 3,369 3,872 4,427 5,038 5,706 6,432Benefits 943 984 1,005 968 862 868 955 4,486 1,463Interest credited to balances 1,189 1,690 2,049 2,473 2,977 3,570 4,246 4,999 5,821Old-age liabilities = tech. Reserve 13,250 16,496 20,464 25,337 31,324 38,454 46,783 56,303 67,092Benefits / Contributions 43% 39% 34% 29% 22% 20% 19% 21% 23%Reserve ratio 14.05 16.77 20.37 26.19 36.32 44.30 48.99 47.47 45.86
Consolidated AccountRevenue 4,521 5,282 6,187 7,239 8,456 9,837 11,378 13,075 14,925Contributions 2,855 3,306 3,811 4,391 5,046 5,769 6,563 7,429 8,370Investment income 1,666 1,976 2,376 2,848 3,410 4,067 4,815 5,646 6,555Administrative expenses 228 258 290 325 363 404 446 490 536
Expenditure 2,746 3,382 3,865 4,370 4,901 5,643 6,561 7,713 8,991Benefits 1,329 1,434 1,527 1,572 1,560 1,669 1,869 2,223 2,634Interest credited to balances 1,189 1,690 2,049 2,473 2,977 3,570 4,246 4,999 5,821Administrative Expenses 228 258 290 325 363 404 446 490 536
Surplus 1,774 1,900 2,322 2,869 3,555 4,193 4,817 5,363 5,934Tax and Distribution of profit 128 137 167 207 256 302 347 386 427Net surplus 1,647 1,764 2,155 2,662 3,299 3,891 4,470 4,977 5,506
Reserve 14,598 17,970 22,044 27,029 33,133 40,386 48,846 58,502 69,434Technical reserve for S.T. benefits 1,320 1,442 1,542 1,647 1,758 1,874 1,996 2,123 2,256Old-age liablities = tech. Reserve 13,250 16,496 20,464 25,337 31,324 38,454 46,783 56,303 67,092Catastrophe reserve 28 33 38 44 50 59 67 76 86
(Benefits + Admin.) / Contributions 55% 51% 48% 43% 38% 36% 35% 37% 38%Reserve ratio 9.4 10.6 12.1 14.2 17.2 19.5 21.1 21.6 21.9Admin. Expenses / Contributions 8.0% 7.8% 7.6% 7.4% 7.2% 7.0% 6.8% 6.6% 6.4%
Figure 2 Estimated Financial Operation of Jamsostek Fund 2001 – 2050

Annexes
336
( in Rp. Billions)
2010 2015 2020 2025 2030 2035 2040 2045 2050
Short Term Benefits Account2,164 3,336 5,021 7,534 11,183 16,272 23,349 34,020 50,160 Contributions
998 1,532 2,302 3,449 5,109 7,403 10,562 15,316 22,497 Work injury benefits378 580 872 1,306 1,935 2,804 4,001 5,802 8,522 Death benefits654 1,005 1,510 2,262 3,351 4,855 6,928 10,046 14,756 Health care benefits134 219 338 518 787 1,210 1,859 2,855 4,386 Special programme
1,309 2,031 3,068 4,613 6,854 9,971 14,288 20,784 30,602 Benefits557 861 1,299 1,951 2,896 4,202 6,000 8,701 12,779 Work injury benefits206 319 481 723 1,073 1,556 2,222 3,223 4,733 Death benefits493 765 1,155 1,735 2,575 3,736 5,334 7,735 11,361 Health care benefits
5 3 8 6 133 204 310 477 733 1,125 1,729 Special programme
2,394 3,182 4,153 5,313 6,620 7,964 9,128 9,688 8,769 Technical reserve1,075 1,419 1,841 2,336 2,880 3,420 3,857 3,991 3,420 Work injury benefits
903 1,193 1,547 1,962 2,420 2,873 3,241 3,353 2,873 Death benefits4 4 7 0 106 160 238 347 496 717 1,051 Health care benefits
372 499 659 855 1,081 1,323 1,534 1,626 1,425 Special programme
60% 61% 61% 61% 61% 61% 61% 61% 61% Benefits / Contributions56% 56% 56% 57% 57% 57% 57% 57% 57% Work injury benefits55% 55% 55% 55% 55% 56% 56% 56% 56% Death benefits75% 76% 76% 77% 77% 77% 77% 77% 77% Health care benefits39% 39% 39% 39% 39% 39% 39% 39% 39% Special programme
1.83 1.57 1.35 1.15 0.97 0.80 0.64 0.47 0.29 Reserve ratio1.93 1.65 1.42 1.20 0.99 0.81 0.64 0.46 0.27 Work injury benefits4.83 3.74 3.21 2.72 2.26 1.85 1.46 1.04 0.61 Death benefits0.09 0.09 0.09 0.09 0.09 0.09 0.09 0.09 0.09 Health care benefits7.03 5.79 4.95 4.19 3.48 2.77 2.09 1.45 0.85 Special programme
Old-Age Benefits Account7,180 11,028 16,567 24,819 36,772 53,277 76,013 110,232 161,909 Contribution1,789 4,326 8,758 16,644 30,785 52,996 81,051 122,068 181,016 Benefits6,706 12,531 22,714 38,435 61,356 93,127 137,630 201,760 294,400 Interest credited to balances
79,189 159,651 287,726 487,040 779,797 1,192,943 1,768,204 2,593,954 3,785,987 Old-age liabities = tech. Reserve25% 39% 53% 67% 84% 99% 107% 111% 112% Benefits / Contributions
44.27 36.90 32.85 29.26 25.33 22.51 21.82 21.25 20.92 Reserve ratio
Consolidated Account16,879 28,342 46,820 75,141 116,640 174,917 255,596 373,346 546,073 Revenue
9,344 14,364 21,589 32,353 47,955 69,549 99,361 144,252 212,069 Contributions7,536 13,979 25,231 42,788 68,685 105,368 156,235 229,095 334,004 Investment income
10,383 19,750 35,835 61,632 101,873 160,267 238,931 353,267 518,743 Expenditure3,098 6,357 11,826 21,256 37,639 62,967 95,339 142,853 211,618 Benefits6,706 12,531 22,714 38,435 61,356 93,127 137,630 201,760 294,400 Interest credited to balances
579 862 1,295 1,941 2,877 4,173 5,962 8,655 12,724 Administrative expenses
6,496 8,592 10,985 13,509 14,768 14,650 16,666 20,079 27,330 Surplus468 619 791 973 1,063 1,055 1,200 1,446 1,968 Tax and Distribution pf profit
6,028 7,973 10,194 12,536 13,705 13,595 15,466 18,633 25,363 Net surplus
81,681 162,987 292,111 492,701 786,935 1,201,663 1,778,418 2,605,218 3,797,073 Reserve2,394 3,182 4,153 5,313 6,620 7,964 9,128 9,688 8,769 Technical reserve for S.T. benefits
79,189 159,651 287,726 487,040 779,797 1,192,943 1,768,204 2,593,954 3,785,987 Old-age liablities = tech. Reserve9 7 154 231 348 518 756 1,085 1,576 2,318 Catastrophe reserve
39% 50% 61% 72% 84% 97% 102% 105% 106% (Benefit + Admin.) / Contributions22.2 22.6 22.3 21.2 19.4 17.9 17.6 17.2 16.9 Reserve ratio
6.2% 6.0% 6.0% 6.0% 6.0% 6.0% 6.0% 6.0% 6.0% Admin. Ecpenses / Contributions
Annex 3 Figure 2 (continued)
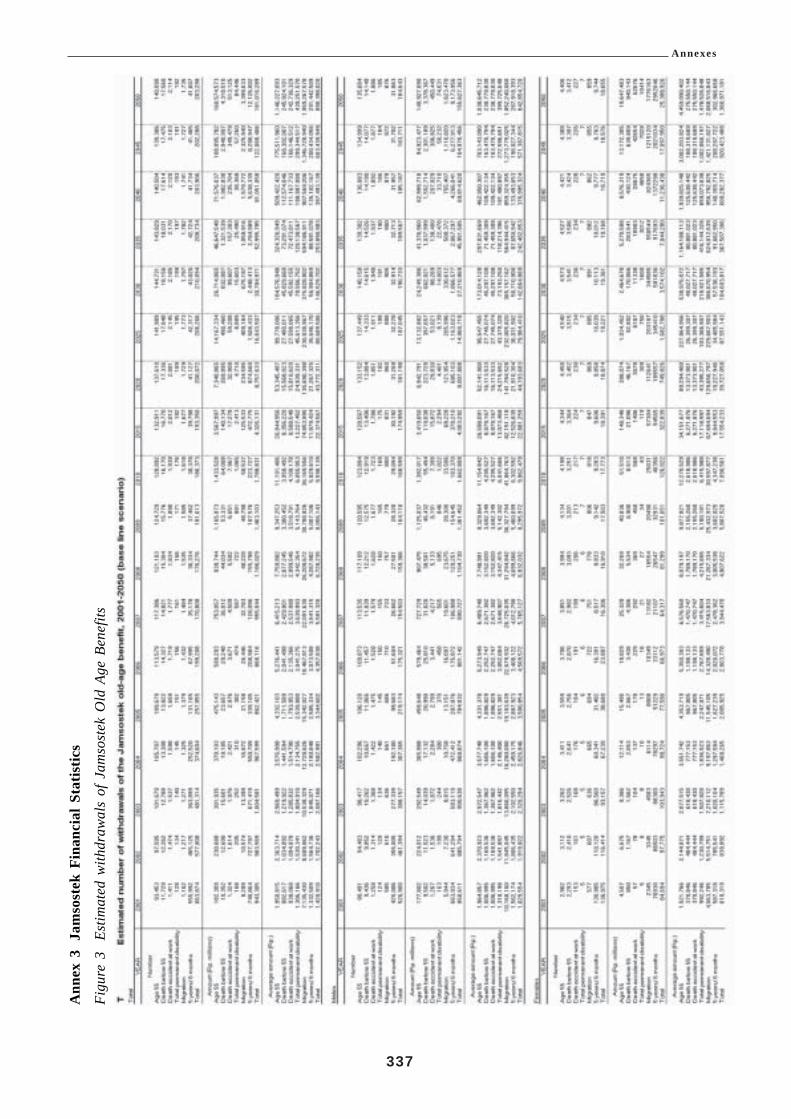
Annexes
337
Ann
ex 3
Jam
sost
ek F
inan
cial
Sta
tistic
s
Figu
re 3
Estim
ated
with
draw
als
of J
amso
stek
Old
Age
Ben
efits
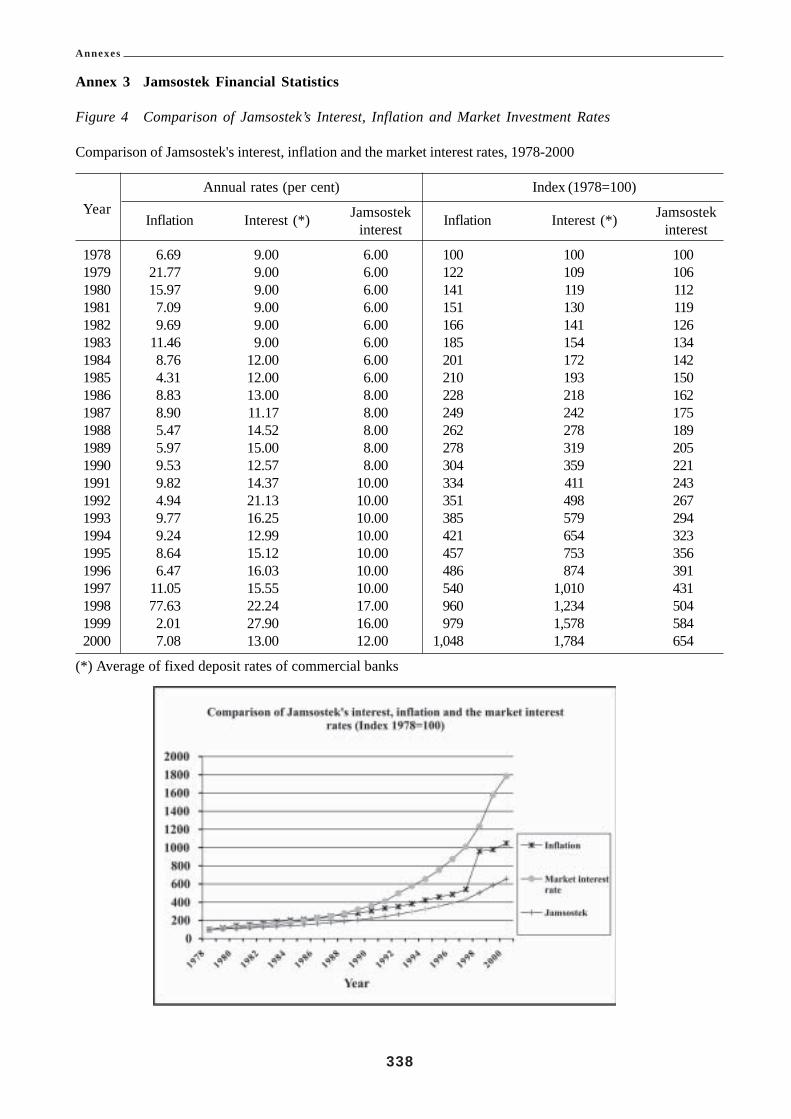
Annexes
338
Annex 3 Jamsostek Financial Statistics
Figure 4 Comparison of Jamsostek’s Interest, Inflation and Market Investment Rates
Comparison of Jamsostek's interest, inflation and the market interest rates, 1978-2000
Annual rates (per cent) Index (1978=100)
Jamsostek JamsostekYearInflation Interest (*) interest Inflation Interest (*) interest
1978 6.69 9.00 6.00 100 100 1001979 21.77 9.00 6.00 122 109 1061980 15.97 9.00 6.00 141 119 1121981 7.09 9.00 6.00 151 130 1191982 9.69 9.00 6.00 166 141 1261983 11.46 9.00 6.00 185 154 1341984 8.76 12.00 6.00 201 172 1421985 4.31 12.00 6.00 210 193 1501986 8.83 13.00 8.00 228 218 1621987 8.90 11.17 8.00 249 242 1751988 5.47 14.52 8.00 262 278 1891989 5.97 15.00 8.00 278 319 2051990 9.53 12.57 8.00 304 359 2211991 9.82 14.37 10.00 334 411 2431992 4.94 21.13 10.00 351 498 2671993 9.77 16.25 10.00 385 579 2941994 9.24 12.99 10.00 421 654 3231995 8.64 15.12 10.00 457 753 3561996 6.47 16.03 10.00 486 874 3911997 11.05 15.55 10.00 540 1,010 4311998 77.63 22.24 17.00 960 1,234 5041999 2.01 27.90 16.00 979 1,578 5842000 7.08 13.00 12.00 1,048 1,784 654
(*) Average of fixed deposit rates of commercial banks

Annexes
339
Annex 3 Jamsostek Financial Statistics
Figure 5 The Reserve of Jamsostek by Investment Instrument
The reserve of Jamsostek by investment instrument, 1978-2001Amount (in Rp. millions)
Time Bonds (bond and Bank Stocks (share Property Equitydeposit and and Certificate of Indonesia and unit trust) (land and (DirectYear
deposit promissory note) (CBI) real estate) participation)Total
certificate1978 2,161 0 0 0 44 0 2,2051979 13,384 0 0 744 744 0 14,8721980 27,209 0 0 1,462 585 0 29,2561981 44,811 0 0 2,409 964 0 48,1841982 77,410 0 0 4,161 1,665 0 83,2361983 119,375 0 0 6,418 2,567 0 128,3601984 161,159 0 0 8,664 3,465 0 173,2881985 181,889 21,914 0 10,957 4,384 0 219,1441986 245,778 29,612 0 14,806 5,923 0 296,1191987 310,728 37,727 0 18,638 5,659 0 372,7521988 409,217 50,32 2 027,103 7,459 0 494,1011989 483,992 92,754 0 65,570 8,457 0 650,7731990 534,000 104,004 0 165,559 9,470 0 813,0331991 204,095 123,110 421,225 203,448 23,521 37,683 1,013,0821992 410,530 193,943 490,175 257,460 30,371 25,587 1,408,0661993 783,069 302,392 472,075 191,350 31,946 60,963 1,841,7951994 1,465,784 258,876 521,475 140,839 33,137 60,914 2,481,0251995 2,002,848 364,522 630,406 198,390 22,172 84,037 3,302,3751996 2,912,214 388,487 637,209 297,009 42,909 83,487 4,361,3151997 4,642,937 407,938 0 383,558 342,855 47,476 5,824,7631998 6,554,510 328,488 73,463 321,523 395,911 42,927 7,716,8231999 8,891,273 355,670 0 584,586 400,868 42,927 10,275,3232000 10,004,179 1,148,052 0 658,720 433,848 44,933 12,289,731August 8,954,772 3,744,515 0 976,807 513,597 31,491 14,221,1822001
Composition
Time Bonds (bond and Bank Stocks (share Property Equitydeposit and and Certificate of Indonesia and unit trust) (land and (DirectYear
deposit promissory note) (CBI) real estate) participation)Total
certificate1978 98.0% 0.0% 0.0% 0.0% 2.0% 0.0% 100.0%1979 90.0% 0.0% 0.0% 5.0% 5.0% 0.0% 100.0%1980 93.0% 0.0% 0.0% 5.0% 2.0% 0.0% 100.0%1981 93.0% 0.0% 0.0% 5.0% 2.0% 0.0% 100.0%1982 93.0% 0.0% 0.0% 5.0% 2.0% 0.0% 100.0%1983 93.0% 0.0% 0.0% 5.0% 2.0% 0.0% 100.0%1984 93.0% 0.0% 0.0% 5.0% 2.0% 0.0% 100.0%1985 83.0% 10.0% 0.0% 5.0% 2.0% 0.0% 100.0%1986 83.0% 10.0% 0.0% 5.0% 2.0% 0.0% 100.0%1987 83.4% 10.1% 0.0% 5.0% 1.5% 0.0% 100.0%1988 82.8% 10.2% 0.0% 5.5% 1.5% 0.0% 100.0%1989 74.4% 14.3% 0.0% 10.1% 1.3% 0.0% 100.0%1990 65.7% 12.8% 0.0% 20.4% 1.2% 0.0% 100.0%1991 20.1% 12.2% 41.6% 20.1% 2.3% 3.7% 100.0%1992 29.2% 13.8% 34.8% 18.3% 2.2% 1.8% 100.0%1993 42.5% 16.4% 25.6% 10.4% 1.7% 3.3% 100.0%19945 9.1% 10.4% 21.0% 5.7% 1.3% 2.5% 100.0%19956 0.6% 11.0% 19.1% 6.0% 0.7% 2.5% 100.0%19966 6.8% 8.9% 14.6% 6.8% 1.0% 1.9% 100.0%19977 9.7% 7.0% 0.0% 6.6% 5.9% 0.8% 100.0%19988 4.9% 4.3% 1.0% 4.2% 5.1% 0.6% 100.0%19998 6.5% 3.5% 0.0% 5.7% 3.9% 0.4% 100.0%20008 1.4% 9.3% 0.0% 5.4% 3.5% 0.4% 100.0%August 63.0% 26.3% 0.0% 6.9% 3.6% 0.2% 100.0%2001

Annexes
340
Annex 4 Jamsostek Retirement Programme - Overview
JAMSOSTEK
Program Retirement Program Life Program
Type of Scheme Provident Fund Death Benefits Scheme
Current Law Provident Fund Benefits in Government Regulation Death Benefits provisions in GovernmentNo. 14/1993 Regulation No. 14/1993
Description Provides an age retirement program and for This program covers loss of life duringcompulsory early retirement as a result of invalidity or and within the work area or due to illnessunemployment or natural causes
Coverage Compulsory for all workplaces with at least 10 Compulsory for all workplaces with atemployees or a monthly payroll of Rp 1 million least 10employees or a monthly payroll of Rp 1 million
Contributions Employer – 3.7% of gross wagesEmployee – 2% Employer – 0.3% of gross wagesof gross wages
Benefits Provides lump sum of combined contributions Provision of payments for:plus interest or periodical payments for the ! funeral expenses of Rp 600,000,following life events of the member: ! death allowance of Rp 3,000,000! At age 55 years,! Total permanent disability,! Benefits to the surviving spouse or children in
the event of death of member before age 55 years! When membership ceases due to unemployment
after at least 5 years membership

Annexes
341
Annex 5 Monthly Minimum Wages by Province, Year 2000
No. Local Province/Region Minimum Wage (Rp)
1 Daerah Istimewa Aceh 265,0002 Sumatera Utara 254,0003 Sumatera Barat 200,0004 Riau Di Luar Batam - Tk. I. Riau 250,7005 Riau Di Luar Batam - Tk. Kepulauan 300,0006 Riau - Batam 350,000 Highest7 Jambi 173,000 Lowest8 Sumatera Selatan - Daratan 190,0009 Sumatera Selatan - Kepulauan 209,00010 Bengkulu 173,000 Lowest11 Lampung 192,00012 DKI Jakarta 286,00013 Jawa Barat – Wilayah I 270,00014 Jawa Barat – Wilayah II 245,00015 Jawa Barat – Wilayah III 230,00016 Jawa Barat – Wilayah IV 225,00017 Jawa Tengah 185,00018 Daerah Istimewa Yogyakarta 194,50019 Jawa Timur - Wilayah I 236,00020 Jawa Timur - Wilayah II 212,00021 Jawa Timur - Wilayah III 208,00022 Jawa Timur - Wilayah IV 202,00023 Bali – Kab. Badung & Kodya Denpasar 214,30024 Bali – Lainnya 190,30025 Nusa Tenggara Barat 180,00026 Nusa Tenggara Timur 184,00027 Kalimantan Barat 228,00028 Kalimantan Tengah 285,00029 Kalimantan Selatan 200,00030 Kalimantan Timur 233,00031 Sulawesi Utara 186,00032 Sulawesi Tengah 203,00033 Sulawesi Selatan 200,00034 Sulawesi Tenggara 210,00035 Maluku 180,00036 Irian Jaya 315,000
Source:- Statistik Upah Triwulanan, Triwulan II Tahun 2000
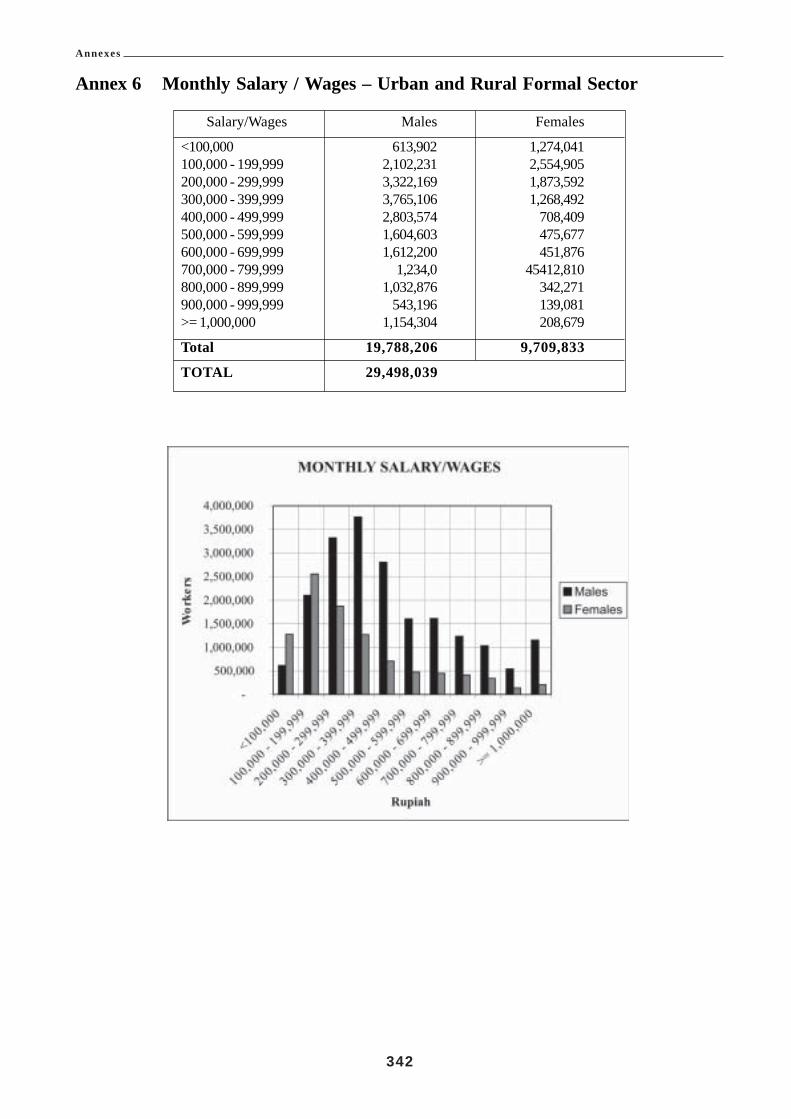
Annexes
342
Annex 6 Monthly Salary / Wages – Urban and Rural Formal Sector
Salary/Wages Males Females
<100,000 613,902 1,274,041100,000 - 199,999 2,102,231 2,554,905200,000 - 299,999 3,322,169 1,873,592300,000 - 399,999 3,765,106 1,268,492400,000 - 499,999 2,803,574 708,409500,000 - 599,999 1,604,603 475,677600,000 - 699,999 1,612,200 451,876700,000 - 799,999 1,234,0 45412,810800,000 - 899,999 1,032,876 342,271900,000 - 999,999 543,196 139,081>= 1,000,000 1,154,304 208,679
Total 19,788,206 9,709,833
TOTAL 29,498,039

Annexes
343
Ann
ex 7
Form
al S
ecto
r –
Fem
ale
Sala
ry E
arne
rs b
y A
ge
Sala
ry15
-19
20 -
24
25 -
29
30 -
34
35 -
39
40 -
44
45 -
49
50 -
54
55 -
59
60+
Tota
l
K.<
100,
000
114,
114
142,
477
169,
562
144,
016
167,
201
118,
594
132,
929
104,
580
56,7
0012
3,86
81,
274,
041
J.10
0,00
0 -
199,
999
426,
029
385,
291
413,
306
257,
058
267,
200
245,
562
187,
789
156,
378
93,7
6012
2,53
22,
554,
905
I.20
0,00
0 -
299,
999
296,
752
480,
118
344,
519
225,
712
210,
957
127,
670
71,4
2555
,674
37,1
6723
,598
1,87
3,59
2H
.300
,000
- 3
99,9
9916
7,73
844
5,74
426
4,70
615
0,90
710
4,77
468
,729
25,4
2113
,519
14,7
0112
,253
1,26
8,49
2G
.400
,000
- 4
99,9
9956
,685
240,
335
169,
994
87,7
1175
,242
36,2
2826
,072
5,84
34,
714
5,58
570
8,40
9F.
500,
000
- 59
9,99
917
,758
84,9
7711
0,99
310
2,07
471
,640
46,6
6428
,052
11,3
822,
137
-47
5,67
7E
.600
,000
- 6
99,9
992,
389
33,5
5664
,377
118,
810
103,
305
58,2
5041
,835
18,2
4711
,107
-45
1,87
6D
.700
,000
- 7
99,9
99-
32,9
5063
,433
67,4
5610
1,19
685
,484
36,0
6814
,638
5,82
35,
762
412,
810
C.8
00,0
00 -
899
,999
329
25,5
7045
,297
36,4
6466
,338
63,2
4457
,331
27,9
1018
,684
1,10
434
2,27
1B
.900
,000
- 9
99,9
992,
098
2,17
914
,139
5,82
018
,668
32,3
2426
,329
26,6
2510
,899
-13
9,08
1A
.>=
1,00
0,00
02,
124
13,9
5657
,741
31,6
3526
,609
32,6
3614
,798
20,4
117,
432
1,33
720
8,67
9
Tota
l1,
086,
016
1,88
7,15
31,
718,
067
1,22
7,66
31,
213,
130
915,
385
648,
049
455,
207
263,
124
296,
039
9,70
9,83
3

Annexes
344
Ann
ex 8
Form
al S
ecto
r –
Mal
e Sa
lary
Ear
ners
by
Age
Sala
ry15
-19
20 -
24
25 -
29
30 -
34
35 -
39
40 -
44
45 -
49
50 -
54
55 -
59
60+
Tota
l
K.<
100,
000
54,8
4396
,962
95,2
3566
,013
79,8
7564
,787
55,11
335
,730
26,8
2938
,515
613,
902
J.10
0,00
0 -
199,
999
262,
969
341,
704
283,
453
273,
148
238,
478
170,
908
169,
082
122,
996
94,5
2514
4,96
82,
102,
231
I.20
0,00
0 -
299,
999
365,
514
644,
950
692,
120
452,
988
349,
702
249,
596
223,
090
125,
735
88,3
411
30,1
333,
322,
169
H.3
00,0
00 -
399
,999
251,
589
701,
587
747,
819
662,
050
496,
386
303,
278
272,
115
149,
604
102,
214
78,4
643,
765,
106
G.4
00,0
00 -
499
,999
110,
342
389,
139
561,
440
539,
992
364,
310
312,
554
233,
048
148,
377
93,8
3950
,533
2,80
3,57
4F.
500,
000
- 59
9,99
926
,171
142,
333
294,
007
342,
374
320,
447
224,
465
114,
665
87,9
6840
,753
11,4
201,
604,
603
E.6
00,0
00 -
699
,999
28,4
2498
,112
246,
266
368,
772
341,
702
227,
486
162,
796
64,0
7550
,012
24,5
551,
612,
200
D.7
00,0
00 -
799
,999
7,44
289
,611
137,
637
229,
658
275,
254
236,
842
149,
040
77,0
8722
,493
8,98
11,
234,
045
C.8
00,0
00 -
899
,999
-40
,167
102,
491
156,
706
226,
927
196,
734
145,
763
123,
406
33,7
956,
887
1,03
2,87
6B
.900
,000
- 9
99,9
991,
323
12,0
4727
,066
60,1
3492
,934
95,8
3912
6,19
387
,961
34,9
294,
770
543,
196
A.>
= 1,
000,
000
1,32
323
,736
130,
980
156,
664
186,
477
187,
132
176,
341
180,
267
97,1
4714
,237
1,15
4,30
4
Tota
l1,
109,
940
2,58
0,34
83,
318,
514
3,30
8,49
92,
972,
492
2,26
9,62
11,
827,
246
1,20
3,20
668
4,87
751
3,46
319
,788
,206
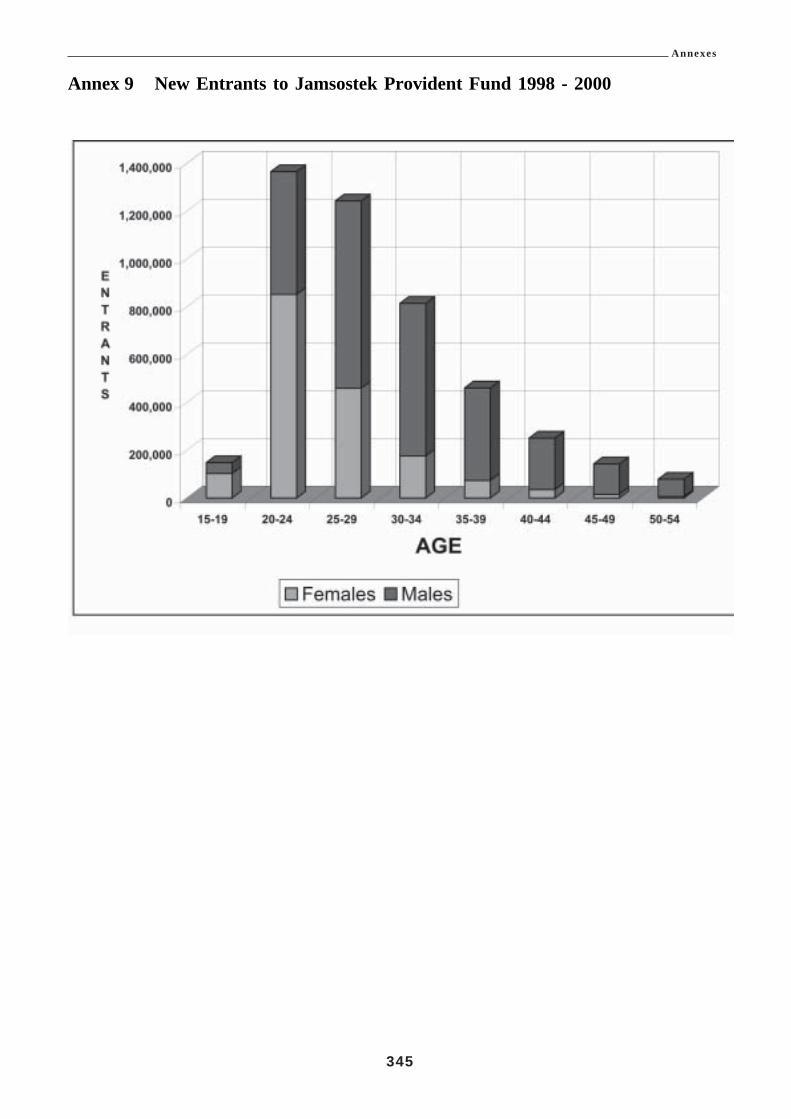
Annexes
345
Annex 9 New Entrants to Jamsostek Provident Fund 1998 - 2000

Annexes
346
Annex 10 Old Age Dependency Ratios
NOTES1. Population estimates from ILO actuary Sept 2001.2. Workers statistics from Labour Force survey August 2000.3. Assumptions made:
(a). workers remain at 66% of population (includesunemployed and those seeking work);
(b). female participation rates at 2000 level; and(c). youth employment rates at 2000 level.

Annexes
347
Annex 11 Population Projections 1998 –2040

Annexes
348
Annex 12 Workforce Composition in Indonesia
Workers Male Female Total
Formal Sector 19,788,206 9,709,833 29,498,039Informal Sector 35,650,857 24,688,834 60,339,691Unemployed 3,340,659 2,472,572 5,813,231 Total 58,779,722 36,871,239 95,650,961
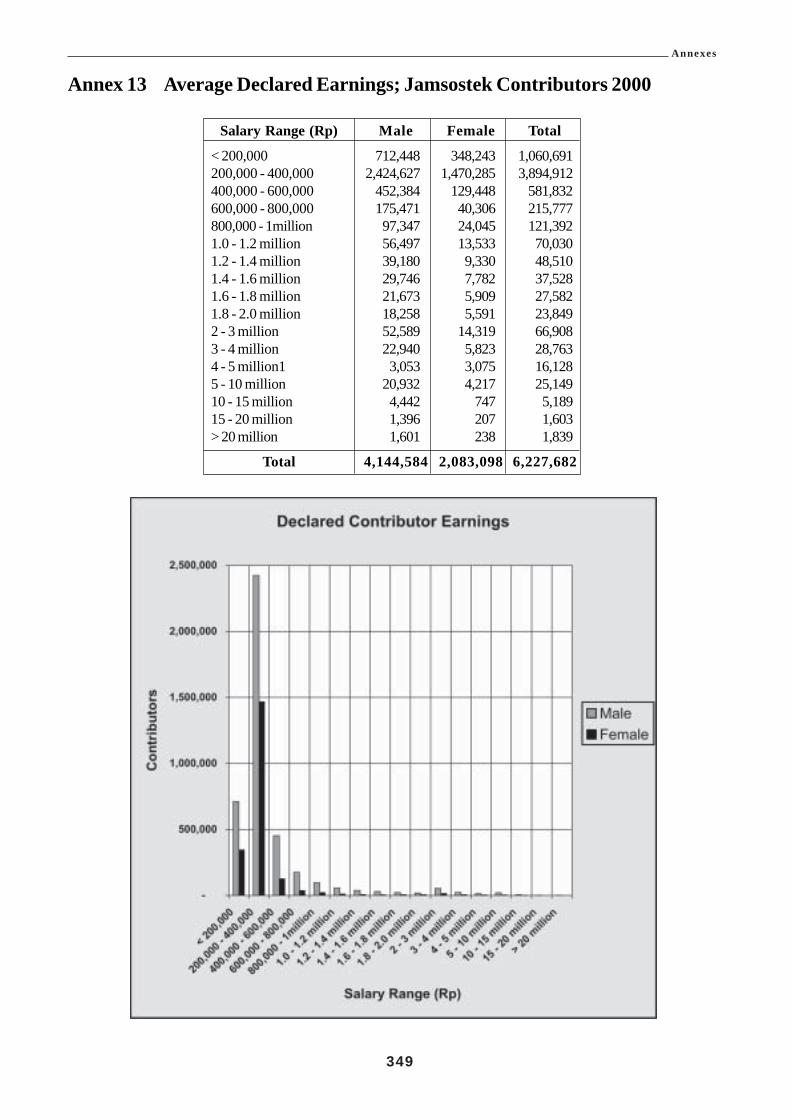
Annexes
349
Annex 13 Average Declared Earnings; Jamsostek Contributors 2000
Salary Range (Rp) Male Female Total
< 200,000 712,448 348,243 1,060,691200,000 - 400,000 2,424,627 1,470,285 3,894,912400,000 - 600,000 452,384 129,448 581,832600,000 - 800,000 175,471 40,306 215,777800,000 - 1million 97,347 24,045 121,3921.0 - 1.2 million 56,497 13,533 70,0301.2 - 1.4 million 39,180 9,330 48,5101.4 - 1.6 million 29,746 7,782 37,5281.6 - 1.8 million 21,673 5,909 27,5821.8 - 2.0 million 18,258 5,591 23,8492 - 3 million 52,589 14,319 66,9083 - 4 million 22,940 5,823 28,7634 - 5 million1 3,053 3,075 16,1285 - 10 million 20,932 4,217 25,14910 - 15 million 4,442 747 5,18915 - 20 million 1,396 207 1,603> 20 million 1,601 238 1,839
Total 4,144,584 2,083,098 6,227,682

Annexes
350
Annex 14 Withdrawals from Jamsostek Provident Fund
Reason for Withdrawal 1998 1999 2000 2001 (6 mths)
Attaining Age 55 33657 33650 34085 19139Leaving the Country 2889 2178 689 577Deceased from Natural Causes 12081 10742 9382 6982Deceased from Work Injury 1563 1376 1283 635Total and Permanent Disability 351 58 38 22Laid off (5years 6 months membership) 493131 610791 632055 316242
TOTAL 545670 660794 679532 343597
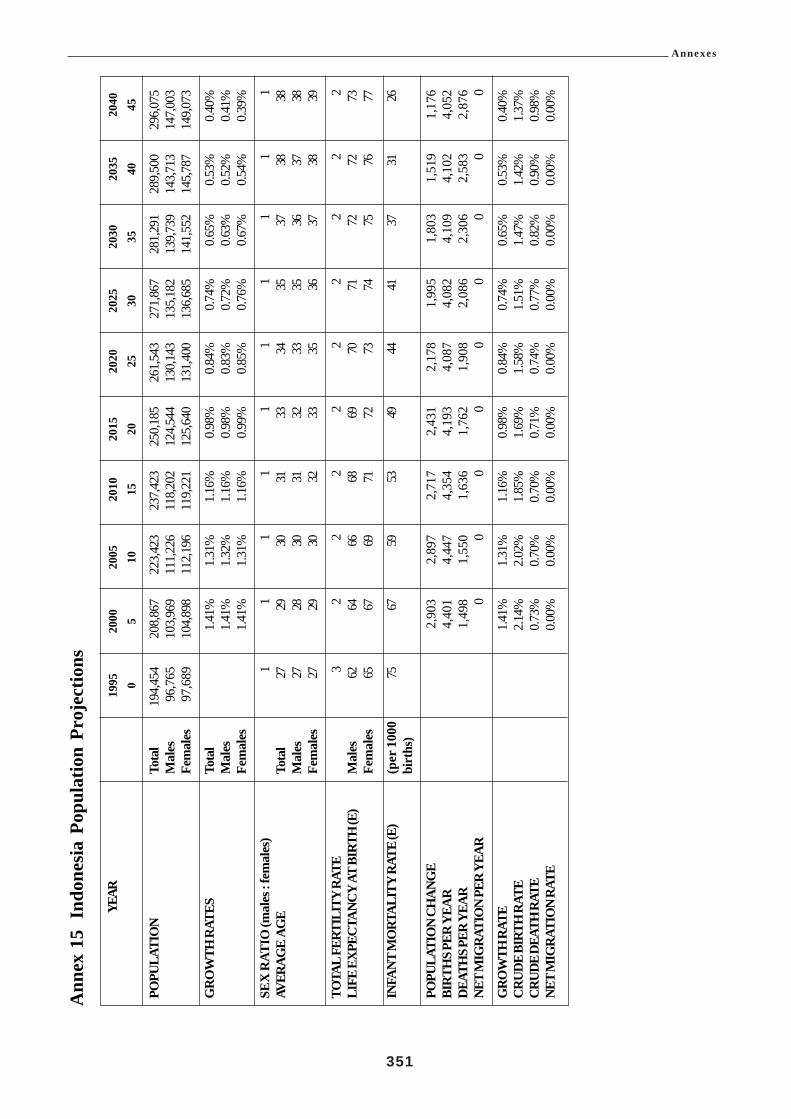
Annexes
351
Ann
ex 1
5In
done
sia
Popu
latio
n Pr
ojec
tions
YEAR
1995
2000
2005
2010
2015
2020
2025
2030
2035
2040
05
1015
2025
3035
4045
POPU
LATI
ON
Tota
l 19
4,45
4 20
8,86
7 22
3,42
3 23
7,42
3 25
0,18
5 26
1,54
3 27
1,86
7 28
1,29
1 28
9,50
0 29
6,07
5M
ales
96,
765
103,
969
111,
226
118,
202
124,
544
130,
143
135,
182
139,
739
143,
713
147,
003
Fem
ales
97,
689
104,
898
112,
196
119,
221
125,
640
131,
400
136,
685
141,
552
145,
787
149,
073
GR
OW
TH R
ATES
Tota
l1.
41%
1.31
%1.
16%
0.98
%0.
84%
0.74
%0.
65%
0.53
%0.
40%
Mal
es1.
41%
1.32
%1.
16%
0.98
%0.
83%
0.72
%0.
63%
0.52
%0.
41%
Fem
ales
1.41
%1.
31%
1.16
%0.
99%
0.85
%0.
76%
0.67
%0.
54%
0.39
%
SEX
RAT
IO (m
ales
: fem
ales
)1
11
11
11
11
1AV
ERAG
E A
GE
Tota
l27
2930
3133
3435
3738
38M
ales
2728
3031
3233
3536
3738
Fem
ales
2729
3032
3335
3637
3839
TOTA
L FE
RTIL
ITY
RATE
32
22
22
22
22
LIFE
EXP
ECTA
NCY
AT B
IRTH
(E)
Mal
es62
6466
6869
7071
7272
73Fe
mal
es65
6769
7172
7374
7576
77
INFA
NT M
ORT
ALIT
Y RA
TE (E
)(p
er 1
000
7567
5953
4944
4137
3126
birt
hs)
POPU
LATI
ON
CHAN
GE
2
,903
2,
897
2,
717
2,
431
2,
178
1,
995
1,
803
1,
519
1
,176
BIR
THS P
ER Y
EAR
4
,401
4,
447
4,
354
4,
193
4,
087
4,
082
4,
109
4,
102
4
,052
DEAT
HS P
ER Y
EAR
1
,498
1,
550
1,
636
1,
762
1,
908
2,
086
2,
306
2,
583
2
,876
NET
MIG
RATI
ON
PER
YEAR
00
00
00
00
0
GRO
WTH
RAT
E1.
41%
1.31
%1.
16%
0.98
%0.
84%
0.74
%0.
65%
0.53
%0.
40%
CRUD
E BI
RTH
RAT
E2.
14%
2.02
%1.
85%
1.69
%1.
58%
1.51
%1.
47%
1.42
%1.
37%
CRUD
E DE
ATH
RAT
E0.
73%
0.70
%0.
70%
0.71
%0.
74%
0.77
%0.
82%
0.90
%0.
98%
NET
MIG
RATI
ON
RATE
0.00
%0.
00%
0.00
%0.
00%
0.00
%0.
00%
0.00
%0.
00%
0.00
%
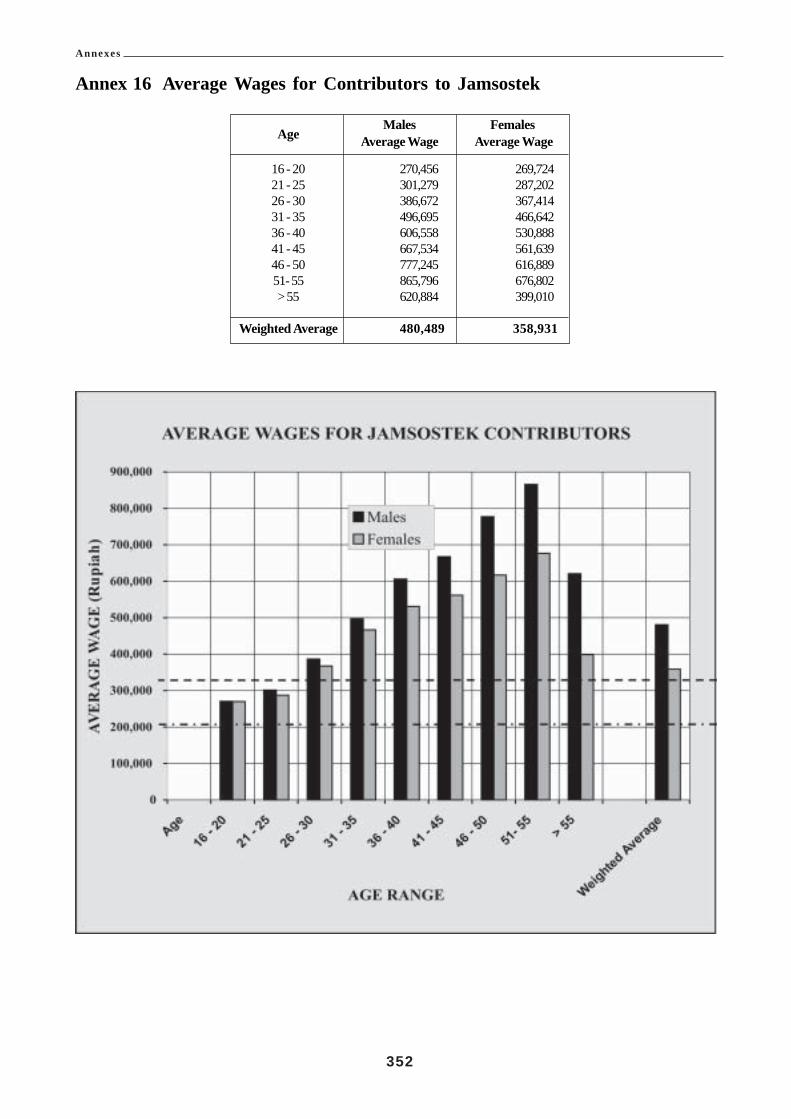
Annexes
352
Annex 16 Average Wages for Contributors to Jamsostek
Males FemalesAge Average Wage Average Wage
16 - 20 270,456 269,72421 - 25 301,279 287,20226 - 30 386,672 367,41431 - 35 496,695 466,64236 - 40 606,558 530,88841 - 45 667,534 561,63946 - 50 777,245 616,88951- 55 865,796 676,802> 55 620,884 399,010
Weighted Average 480,489 358,931

Annexes
353
Annex 17 Life Expectancy

Annexes
354
Annex 18 Groups of Businesses
GROUP TYPES OF BUSINESS
1
1 Tailoring and Ready made clothing2 Hats3 Other clothing Industries (umbrellas, leather belts, coat hangers4 Production of Sails and Blinds made of textile5 Household Articles (sheets, blankets, tarpaulins, curtains and other unwoven articles)6 Export-Import Trade7 Other Wholesale Trades (wholesale agents, distributors, brokers, ect)8 Consumer Cooperative Shops, etc9 Banks and Business Offices10 Insurance Company11 Government Services (Military, Police Government Departments)12 Therapeutic and other Health Services13 Religious Organisations14 Welfare Institutions15 Trade Associations and Workers Organisations16 Autonomous Research Institutes17 Other Public Services, such as Museum, Library, Zoo, Social Organisation18 Barber Shop and Beauty Saloon19 Animal Husbandry
GROUP TYPES OF BUSINESS
2
1. General Agriculture2. Sugar Plantation3. Tobacco Plantation4. Non-Annual Plantation other than tobacco5. Annual Plantation, such as rubber, cocoa, coconut etc6. Tea7. Powdered Coffee8. Sugar9. Cigarettes10. Cigars11. Clove Cigarettes etc12. Other Tobacco Industries13. Paints and Sealing Wax14. Ink and Glue15. Quinine16. Other Transportation Articles Manufacture (dokar, carts, etc)

Annexes
355
17. Operating, Scientific Measuring and Laboratory Testing Tools18. Watch and clock Repairing19. Musical Instruments20. Sports Articles21. Children’s Toys22. Estate Agents (renting flats, land, Houses, garage, etc)23. Communication Service, such as PTT, Radio24. Film Producing and Film Distribution Company25. Cinema26. Theatrical Company, Comedy, Opera, Circus, Band, etc27. Entertainment Service other than Theatre and Cinema28. Laundry, Dyeing Company29. Photography Company
GROUP TYPES OF BUSINESS
3
1. Irrigation Service2. Forestry Management3. Forestry Production4. Charcoal Burning (in the forest)5. Hunting6. Fresh water Fish Breeding7. Sea Fish Breeding8. Fresh water Fish Catching9. Slaughtering10. Meat Butchery and Conserving11. Milk and Butter12. Vegetables and Fruits Conserving13. Fish Conserving14. Rice Hulling15. Flour Milling16. Shelling of Ground Nuts etc17. Bread and Cakes18. Biscuit19. Sugar (Plantation)20. Sweets, Chocolate, etc21. Noodles and Bihun22. Prawn Crackers23. Soya Bean Cake24. Soya Bean Source25. Ice Cream and Lollypops26. Margarine, Cooking Oil and Lard27. Other Food Manufacturing Industries

Annexes
356
28. Alcohol and Spirits29. Alcoholic Drinks30. Winery31. Brewery32. Soda Waters, Fruit Juice and Lemon Factory33. Spinning34. Shoe-lace, Bandage Spinning35. Weaving36. Carpet weaving37. Trico Factory (Underwear, socks and net)38. Rope works (Cable, Dragnet, Hemp, Fibre, etc)39. Other Textile Industries40. Footwear except rubber shoes, plastic sandals and others including plastic goods41. Repair of foot-wear42. Wood chips43. Sawmill44. Wooden cases and boxes45. Production of other wooden articles (Plywood)46. Production of Furniture from Rattan and Bamboo47. Production of Furniture in Wood and other material48. Newsprint and cardboard49. Production of other Articles made of Paper and card board50. Printing, Publishing51. Leather tanning and improving52. Leather Goods (such as trunks, bags and others)53. Rubber remoulding54. Other Articles made of Rubber (vehicle tyres and inner tubes, children’s toys, etc)55. Vulcanizing56. Hydrochloric acid57. Manufacture of Gas/ Carbon Dioxide, etc58. Other Chemical Based industries (colour dyeing materials synthesis, etc59. Turpentine and Resin60. Coconut Oil61. Palm Oil62. Vegetable Based Oil and Fat63. Animal Based Oil and Fat64. Soap65. Medicine/Pharmaceuticals66. Perfumes and Beauty/Cosmetics Aids67. Polishing Materials68. Other Chemicals (drawing crayons, DDT, mosquito repellants, etc69. Coke-oven (gas distribution)70. Construction Material produced from Clay71. Glass and Glass ware

Annexes
357
72. Articles made from Clay and Porcelain73. Cement74. Lime Kilns75. Floor Tiles, Concrete Pipes76. Iron Foundries and Steelworks77. Articles made from Metal (iron bars, rods, plates, pipes, tubes)78. Weighing Scales79. Printing Block and type foundry80. Galvanizing81. Other Metal Articles82. Electrical Machine Manufacture and Repair83. Wooden ship Building and Repair84. Bicycle and Becak repairing85. Photography and repair86. Watch and clock manufacture87. Silver industry88. Precious Metal Articles89. Ice Factory90. Other Industries, such as plastic industry, bird feather industry, tobacco pipes91. Electric and Power Generating Transmission and Distribution92. Production of Gas, Natural Gas and Distribution to households and Factories93. Steam Industry for Power94. Water Company (collection, filtration and distribution)95. Cleaning (garbage and dirt)96. Transportation Services such as Sea and Air Forwarding97. Radio Broadcasting98. Restaurant99. Hotel, Boarding House and Renting of Rooms
GROUP TYPES OF BUSINESS
4
1 Kerosene Derivatives2 Other Articles produced from Kerosene and Coal3 Brick and Roof Tiles4 Engine Manufacture and Repair (motor cars and engine workshops5 Steel Ship Building and Repairing6 Building and Repairing Materials Connected with Railways7 Motor Vehicle and Components Manufacture8 Motor Vehicle Repairing (cars, trucks, and motor cycles)9 Aircraft Manufacture and Repairs10 Railways11 Tram and Bus12 Transport of Passengers by Road except Tram and bus

Annexes
358
13 Goods Storage and Warehousing5
1 Timber Felling, Cutting and Cleaning2. Sea fish Catching3. Other Sea Fish Catching4. Collecting Marine Produce other than Fish5. Sulphuric Acid6. Fertilizers7. Can Factory8. Repairing Houses, Roads, Construction of Canals, Water Pipes, Railway, Bridges and electrical
installations9. Transport of Goods and Passengers by Sea10. Air Cargo and Passenger Transport11. Matches12. Crude Oil and Natural Gas Mining13. Stone Quarrying14. Clay Pits15. Sand Pits16. Lime17. Sulphur18. Diamond and Precious Stones19. Other Mining20. Gold and Silver21. Coal Production22. Iron23. Tin24. Bauxite25. Manganese26. Other Metal Mining27. Plantation Lorries28. Explosive Materials, Fireworks material, Fireworks

Annexes
359
Annex 19 Annual Report, Ministry of Manpower and Transmigration 2001The Enforcement of the provisions of the Jamsostek schemes in eleven (11) Provinces of Indonesia.
This Report contains the results of monitoring and enforcement activities of DEPNEKAR officers in eleven (11)provinces namely, West Java, Central Java, Lampung, Jambi, Bali, NTB, NTT, Sulawesi Utarah, Sulawesi Tengarah,Maluku and Papua (Iran Jaya).155
Monitoring and EnforcementTotal Number of employers and employees in accordance with Act no. 7 of 1981;• Employers: 61,079 Three of the eleven provinces; NTT, Maluku• Employees: 4,560,789 and Papua did not report reliable figures on
the work force
Number of employers liable for Registration under Jamsostek: 33,947Number of employers Registered under Jamsostek: 29,914Total Liable employers not registered: 4,033
Number of Inactive employers: 7,128Number of employees covered: 4,240,583
Number of employees not registered: 32,750 Data from 7 provinces on employees notNumber of employers given direction for compliance: 15,723 registered was not provided
Employers who did not complyEmployers who failed to register: 4,033 A total of 56 employers were prosecutedEmployers understated wages: 1,762 and 47 of them were from the West JavaEmployer registered for not all programs: 3,496 (Jawa Barat) or Jabar province. The DistrictEmployer understated number of employees: 1,388 Courts handed down decisions on 11 cases,
8 of which were in the Jabar province
Total Number of Employers who did not comply 10,679
Notices issued for non-compliance: 4,317
Summary of the Enforcement Activity.Monitoring and enforcement is being carried out in only eleven (11) of the thirty (32) provinces in Indonesia oronly thirty four percent (34%) of the provinces. In the eleven (11) provinces where the enforcement is carried out,of the employers that were obliged to register, twelve percent (12%) had not registered. Only forty six percent(46%) of employers have been informed of the requirements of Jamsostek
The total number of non- compliance cases was 10,679 and the break down is as follows:• Liable employers who had not registered: 4,033 (38%)• Under declared wages: 1,762 (17%)• Did not insure for all the programs: 3,396 (32%)• Did not cover all the employees: 1,388 (13%)
Notices were sent to forty percent (40%) of employers who had not complied with the Law. The number of suchnotices was 4,317.
Only 56 or 1.3% of employers, who were given notices of non-compliance, were prosecuted in the Courts.
155 This explains why the number of employers and employees quoted in the annual report are significantly lower that the BPS andJamsostek numbers.
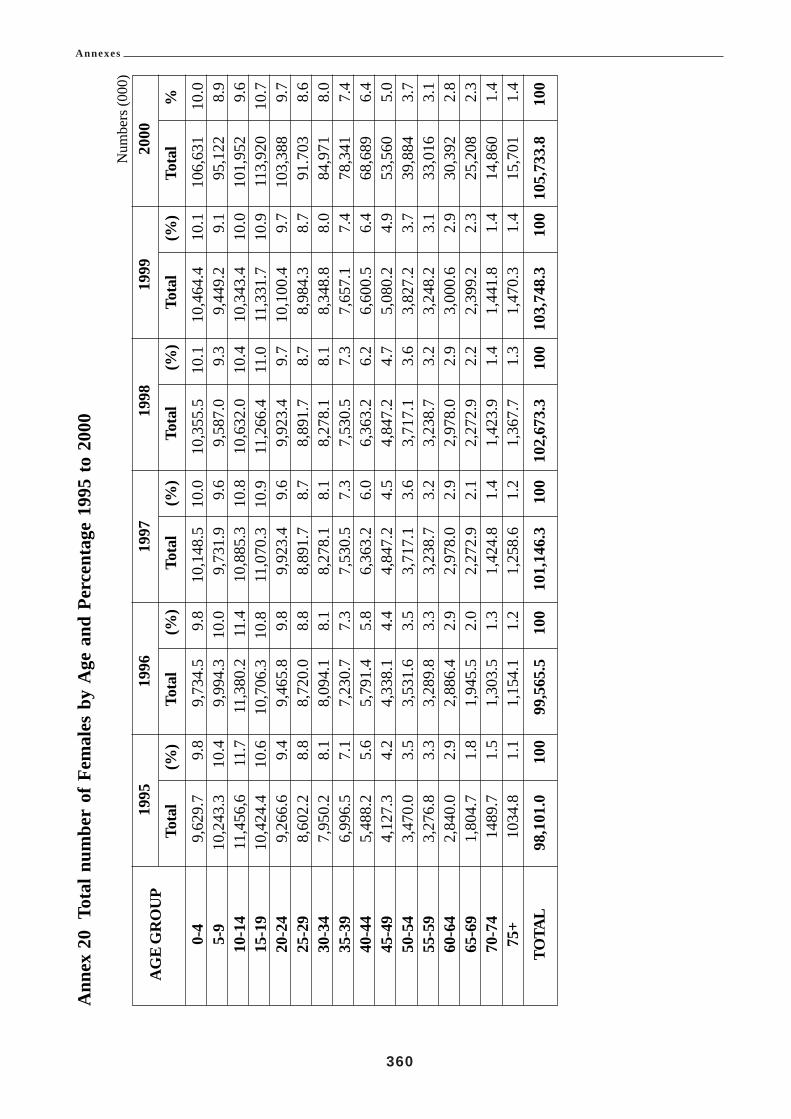
Annexes
360
Ann
ex 2
0To
tal n
umbe
r of
Fem
ales
by
Age
and
Per
cent
age
1995
to
2000
Num
bers
(000
)
AG
E G
RO
UP
1995
1996
1997
1998
1999
2000
Tota
l(%
)To
tal
(%)
Tota
l(%
)To
tal
(%)
Tota
l(%
)To
tal
%
0-4
9,62
9.7
9.8
9,73
4.5
9.8
10,1
48.5
10.0
10,3
55.5
10.1
10,4
64.4
10.1
106,
631
10.0
5-9
10,2
43.3
10.4
9,99
4.3
10.0
9,73
1.9
9.6
9,58
7.0
9.3
9,44
9.2
9.1
95,1
228.
910
-14
11,4
56,6
11.7
11,3
80.2
11.4
10,8
85.3
10.8
10,6
32.0
10.4
10,3
43.4
10.0
101,
952
9.6
15-1
910
,424
.410
.610
,706
.310
.811
,070
.310
.911
,266
.411
.011
,331
.710
.911
3,92
010
.720
-24
9,26
6.6
9.4
9,46
5.8
9.8
9,92
3.4
9.6
9,92
3.4
9.7
10,1
00.4
9.7
103,
388
9.7
25-2
98,
602.
28.
88,
720.
08.
88,
891.
78.
78,
891.
78.
78,
984.
38.
791
.703
8.6
30-3
47,
950.
28.
18,
094.
18.
18,
278.
18.
18,
278.
18.
18,
348.
88.
084
,971
8.0
35-3
96,
996.
57.
17,
230.
77.
37,
530.
57.
37,
530.
57.
37,
657.
17.
478
,341
7.4
40-4
45,
488.
25.
65,
791.
45.
86,
363.
26.
06,
363.
26.
26,
600.
56.
468
,689
6.4
45-4
94,
127.
34.
24,
338.
14.
44,
847.
24.
54,
847.
24.
75,
080.
24.
953
,560
5.0
50-5
43,
470.
03.
53,
531.
63.
53,
717.
13.
63,
717.
13.
63,
827.
23.
739
,884
3.7
55-5
93,
276.
83.
33,
289.
83.
33,
238.
73.
23,
238.
73.
23,
248.
23.
133
,016
3.1
60-6
42,
840.
02.
92,
886.
42.
92,
978.
02.
92,
978.
02.
93,
000.
62.
930
,392
2.8
65-6
91,
804.
71.
81,
945.
52.
02,
272.
92.
12,
272.
92.
22,
399.
22.
325
,208
2.3
70-7
414
89.7
1.5
1,30
3.5
1.3
1,42
4.8
1.4
1,42
3.9
1.4
1,44
1.8
1.4
14,8
601.
475
+10
34.8
1.1
1,15
4.1
1.2
1,25
8.6
1.2
1,36
7.7
1.3
1,47
0.3
1.4
15,7
011.
4
TOTA
L98
,101
.010
099
,565
.510
010
1,14
6.3
100
102,
673.
310
010
3,74
8.3
100
105,
733.
810
0

Annexes
361
Annex 21 Marital Status of Urban Residents Male & Female Above Age 10
NO. PROVINCE NOT MARRIED DIVORCED DIVORCEDMARRIED ALIVE DEAD
1 SUMUT 42.51 52.10 0.84 4.562 SUMBAR 36.86 53.22 2.55 7.373 RIAU 38.01 56.99 0.88 4.124 JAMBI 35.06 58.82 1.61 4.515 SUMSEL 39.07 55.27 1.20 4.466 BENGKULU 36.93 57.22 1.40 4.457 LAMPUNG 37.69 57.85 0.81 3.658 DKI.JAKARTA - - - -9 JABAR 32.63 60.25 2.24 4.89
10 JATENG 31.88 59.94 1.67 6.5111 DI YOGYAKARTA 31.94 59.03 1.60 7.4312 JATIM 27.21 62.42 1.22 8.0813 BALI 30.91 62.16 1.12 5.8114 NTB 35.34 57.33 2.59 4.7515 NTT 41.01 51.85 1.41 5.7316 KALBAR 41.16 52.73 1.08 5.0317 KALTENG 36.27 60.41 0.66 2.6518 KALSEL 33.24 56.95 1.94 7.8619 KALTIM 35.44 58.67 1.71 4.1920 SULUT 36.58 57.25 1.27 4.8921 SULTENG 34.41 58.95 1.76 4.8822 SULSEL 39.33 51.96 2.16 6.5523 SULTRA 42.53 51.53 1.38 4.5624 IRJA 34.47 61.49 0.55 3.50
TOTAL INDONESIA 33.91 58.46 1.77 5.85
Data: Year 2000

Annexes
362
Annex 22 Unemployment Insurance Statistics
Table 1. Structure of GDP in 1999
Sector %
Agriculture, Forestry and Fishing 19.4Mining and Quarrying 9.9Manufacturing 25.8Electricity, Water and Gas 1.2Construction 6.0Trade, Hotels and Restaurants 16.5Transport and Communication 6.0Financial Ownership and Business 6.4Services 8.9
GDP 100.0
Source. “National Income of Indonesia 1996-99”
Table 2. Percentage Growth Rates of Real GDP
Year GDP Growth
1994 7.51995 8.21996 7.81997 4.71998 –13.01999 0.32000 (provisional) 4.5
Source. 1994-1999. IMF Report “Indonesia: Selected Issues” IMF 2000. Year 2000 data estimated by officials..
Table 3. Employment by Industrial Sector in Indonesia in 2000
Industrial Sector Millions
Agriculture, Forestry, Hunting and Fishing 40.676Manufacturing 11.642Construction 3.497Trade, Restaurants and Hotels 18.489Transport, Storage and Communication 4.554Financial and Business services 0.882All other 0.523
Total 89.837
Of which:
Men 55.439
Women 34.399
Source. Labour Force Situation in Indonesia, August 2000. Table 12.5
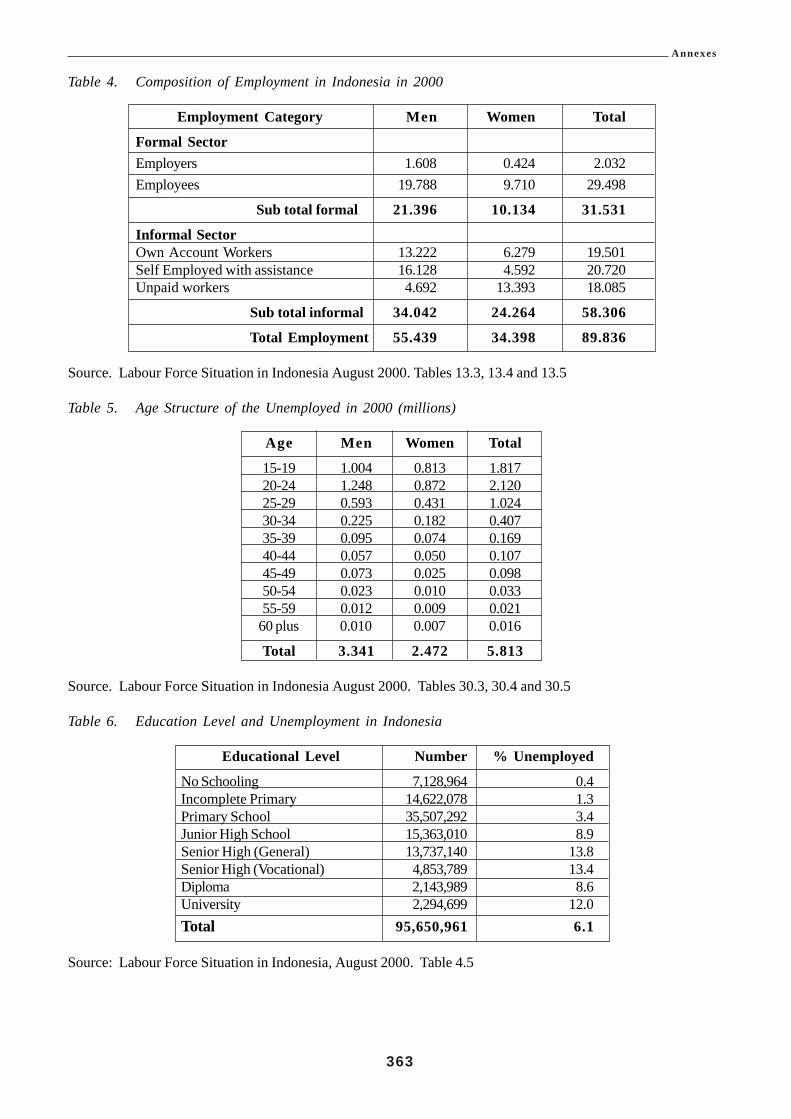
Annexes
363
Table 4. Composition of Employment in Indonesia in 2000
Employment Category Men Women Total
Formal SectorEmployers 1.608 0.424 2.032Employees 19.788 9.710 29.498
Sub total formal 21.396 10.134 31.531
Informal SectorOwn Account Workers 13.222 6.279 19.501Self Employed with assistance 16.128 4.592 20.720Unpaid workers 4.692 13.393 18.085
Sub total informal 34.042 24.264 58.306
Total Employment 55.439 34.398 89.836
Source. Labour Force Situation in Indonesia August 2000. Tables 13.3, 13.4 and 13.5
Table 5. Age Structure of the Unemployed in 2000 (millions)
Age Men Women Total
15-19 1.004 0.813 1.81720-24 1.248 0.872 2.12025-29 0.593 0.431 1.02430-34 0.225 0.182 0.40735-39 0.095 0.074 0.16940-44 0.057 0.050 0.10745-49 0.073 0.025 0.09850-54 0.023 0.010 0.03355-59 0.012 0.009 0.021
60 plus 0.010 0.007 0.016
Total 3.341 2.472 5.813
Source. Labour Force Situation in Indonesia August 2000. Tables 30.3, 30.4 and 30.5
Table 6. Education Level and Unemployment in Indonesia
Educational Level Number % Unemployed
No Schooling 7,128,964 0.4Incomplete Primary 14,622,078 1.3Primary School 35,507,292 3.4Junior High School 15,363,010 8.9Senior High (General) 13,737,140 13.8Senior High (Vocational) 4,853,789 13.4Diploma 2,143,989 8.6University 2,294,699 12.0Total 95,650,961 6.1
Source: Labour Force Situation in Indonesia, August 2000. Table 4.5

Annexes
364
Table 7 Alternative Estimates of Crisis-induced Unemployment in 1998 (Millions of people)
Category Ministry of Bappenas Task ForceManpower (Planning)
Backlog 1997 5.80 5.80 5.80New Entrants 1998 2.70 2.80 1.40Displaced Workers 5.20 3.84 5.41Totals 13.70 12.44 9.29Percentage Rate of Unemployment 14.80 13.60 10.00
Source. ILO “Economic Challenges of the Indonesian Economic Crisis” June 1998.
Table 8 Principal Job search techniques used by the Unemployed.
Job Search Technique 1999 (thousands)Approached businesses to seek work 2,820.7Sought help from family and friends 2842.2Registered with Employment Service 214.0Advertising, etc 150.3
Totals 6,030.3Source: Situasi Tengara Kerja Dan Kesempater Kerua Di Indonesia. December 2000.
Table 9. Medium and Large Manufacturing Enterprises listed by StatisticsYear Number Enterprises New
Delisted Listings
1998 1.004 0.813 1.8171999 1.248 0.872 2.1202000 0.593 0.431 1.024
Source. BPS (Statistics Indonesia).
The statistical discrepancy represents enterprises delisted which were subsequently re-instated. Delisting canoccur either because the enterprise closes, or because it falls below the employment size level used to classify itas a medium or large manufacturing enterprise.
Table 10. The National Poverty Measure in Indonesia
Year Numbers (millions) Below the poverty line % of population below the poverty line1.1 Old Measure1970 70.0 60.01976 54.2 40.11978 47.2 33.31980 42.3 28.61981 40.6 26.91984 35.0 21.61987 30.0 17.41990 27.2 15.11993 25.8 13.71996 22.6 11.41.2 New 1998 basis Measure1996 34.5 17.71998 Dec 49.5 24.21999 Feb 48.4 23.51999 Aug 37.5 18.2
Sources. 1970 to 1996 UNDP 1997 “The Indonesian Economic Transition and the end of Poverty”. After 1997SMERU and Statistics Indonesia.

Annexes
365
Note. The National Poverty Measure is based on an ability to afford an average household food consumption of2100 calories per day per household member, 90 per cent of which are provided from grain, plus a basket of non-food items.
The Indonesian national poverty measure in 1996 equated to the equivalent of US$ 0.55 per day in urban areasand $0.40 in rural areas. An alternative measure of US$ 1.0 in urban areas and US$0.80 in urban areas wouldhave produced a poverty percentage of 57.3 per cent in 1996 compared with the national measure of 11.3 percent.
Table 11. Per capita daily food consumption in Indonesia
Year Calories Protein (grams)1993 1,879.13 n.a.1996 2,019.79 54.491999 1,849.36 48.67
Source.Expenditure for Consumption in Indonesia 1996 and 1999.
Table 12a Withdrawals of Old Age Benefits and Death Benefit Payments (Number of cases)
Withdrawals 1998 1999 2000 2001(first half)Attaining Age of 55 33,657 33,650 34,085 19,139Leaving the Country 2,889 2,178 689 577Decease of Natural Causes 12,081 10,742 9,382 6,982Decease from Work Injury 1,563 1,376 1,283 635Total and Permanent Disability 351 58 38 22Laid Off plus 5 years and 6 months 493,131 610,791 632,055 316,2421.1.1 Totals 543,672 658,796 677,532 343,598
Table 12b Early withdrawals by those laid off with 5 years and 6 months membership
Year Number
1993 11,9101993 8,5121994 7,0641995 171,0571996 258,8271997 241,7601998 493,1311999 610,7912000 632,055
2001 First half 316,242
Source: PT Jamsostek, August 2001 Statistical Report

Annexes
366
Table. 13. Social Security Contributions-per cent of covered wages
A. Private Sector – Jamsostek
Scheme Minimum % Maximum %Work Accident (JKK) 0.24 1.74Old Age (JHT) 5.70 5.70Death (Survivors) (JKM) 0.30 0.30Health (JPK) 3.00 6.00Total 9.24 13.74
Note. Employees pay 2 per cent of the 5.7 per cent contribution rate for the Old Age scheme. The employerpays all of the other charges. Employers may opt out of the Jamsostek Health Care Fund and instead select aprivate insurer. The Jamsostek Health Care premium is 3 per cent for a single employee and 6 per cent for anemployee family.
B. Civil Servants
Scheme Contribution Rate of Employee %Retirement ( PT Taspen) 3.25Pension (PT Taspen) 4.75Health Care (PT Askes) 2.00
C. Armed Forces
Scheme Contribution Rate of Employee %
Retirement (PT Asabri) 3.25Pension (PT Asabri) 4.75Health Care 2.00(Armed Forces Hospital/Askes)
Note. The Government, as employer pays any additional costs of the Civil Servants and Armed Forces schemecosts.

Annexes
367
Table 14. Operating and Administration Costs of Jamsostek
Operating Expenses RpManagement Expenses 5,968,791,509Operational Expenses 46,765,550,810Personnel Expenses
Wages, Salaries and Allowances 71,432,316,712Social Insurance for Employees 9,991,934,148Training 6,503,959,496Recruitment 2,628,669,613Other 671,354,763
Sub Total 91,228,234,732
Administration and General ExpensesOffice Supplies 13,386,495,061Rent 5,883,496,925Lighting, Water, Gas, Telephone 10,896,957,535Maintenance of Buildings 8,700,970,233Tax and Insurance 1,864,916,960Household 5,451,803,130Cost of Data Processing 1,712,288,980Research and Development 2,205,857,226
Stamp Duty 3,437,835,548Others 6,218,194,016
Sub Total 59,758,815,615Expenses Before Depreciation 203,721,392.666
Depreciation 19,243,697,634Allowance for Bad Debts 9,878,031,694
Total Expenses as per Accounts 232.843,021,994
Total Expenses in thousand million rupiah 232.8Plus Staff And Management Bonuses 23.3Total expenses (thousand million rupiahs) 246.2
Notes.1. The staff and management bonuses are allocated from tax-paid profits of Jamsostek2. The Administration and General Expenses do not include 307,929,624210 rupiahs allocated to Technical Reserves
prior to determining profits.

Annexes
368
Table 15 Allocation of Revenues of Jamsostek
Contribution Income Rp.
Employment Accident Benefits 247,288,076,880Death Benefits 102,740,478,356Health Care Benefits 173,095,656,883Special programmes 29,976,380,029
Total Contribution Income 553,100,592,106Subsidiary Operating Income 19,963,798,741
Total Income excluding Investment and Other 573,064,390,849
Investment Income 1,141,045,088,585
Other Income 12,043,783,275
All Income 1,726,153,262,709
Allocated To:Employee BenefitsEmployment Accident 100,236,225,786Death 24,634,739,000Health Care 120,066,723,857Special Program 2,292,632,617
Total Benefits 247,230,321,260
Interest on Old Age Benefit Accounts 725,914,401,757
Technical Reserve Expenses 307,929,624,210
Operating Expenses 203,721,392,666
Depreciation 19,243,697,634
Allowance for Bad Debts 9,878,031,694
Net Income Before Tax 212,235,793,488
Note. Contributions to Old Age Benefit Accounts are not treated as Income of Jamsostek but as the assets ofthe members.

Annexes
369
Table 16 Allocation of Jamsostek Profit Before TaxItem
Rp.
Net Income Before Tax 212,235,793,488Corporate Income Tax 2,984,916,000Net Income after Tax 209,250,877,488
Minority Interest 1,136,261
Net Income 209,249,741,227(In Rp. thousand million) 209.2
Allocation of Profits (Rp. thousand million)
Dividend to Shareholder (Ministry of Finance) 101.7Old Age Accounts 58.0Additional Benefits to members 10.1General Reserves 27.2Employee and Management Bonuses 23.3Small Scale Enterprise Programme 2.0
Total Allocated 203.0
Staff and Management Bonuses
Employees 21.9
Management 1.4
Table 17 Unemployment and Placements by Employment Offices.
Year Unemployment Job vacancies Job PlacementsRegistrations Registered Made
1991 1,324,681 301,553 282,3571992 1,213,018 364,240 327,8521993 1,338,990 381,495 352,6161994 1,228,159 421,189 400,2301995 1,198,281 462,257 398,3001996 1,497,159 629,464 527,2481997 1,542,522 593,153 492,7051998 1,191,745 546,091 471,1601999 1,191,750 475,260 395,214
2000 (10 mths) 865,392 258,861
1.3 Sources 1991-1998 Profil Sumber Daya Manusia Indonesia. Jakarta 20001999-2000 Ministry of Manpower (Depnaker)

Annexes
370
Annex 23 A Draft Short Period Unemployment Benefit Scheme
1. Type of Scheme. Unemployment Insurance Fund of a contributory social insurance type, financed by leviesset on the basis of insured wages.
2. Membership. Compulsory for those groups now required to be members of the Jamsostek Old Age Benefitprogramme. Voluntary for other groups. Membership coverage to be reviewed with the intention of expandingcoverage as economic conditions make this feasible.
3. Levy Contribution rate. 2% of insured wages up to a ceiling of 3 times the average wage of insured Fundmembers. The ceiling would be set annually on the basis of the average of insured wages in the previous year.Levy rate to be reviewable once the Fund has built up sufficiently to cover two years costs.
4. Qualifying period of Contributions 12 months in the previous 24 months.
5. Qualifying event to receive benefit Involuntary loss of insured employment other than for specified list ofemployee misbehaviours which merited dismissal. Would not include normal cessation of seasonal work.
6. Other Qualifying Criteria Willing to workAble to WorkAvailable for employment
7. Wait Period One week from application date or date of cessation of employment, whichever is the later.
8. Benefit Rate 50% of insured wage of member, based on average payments in thelast 12 qualifying months.
9. Other Benefit Entitlement Would retain right to Death Benefit, and Health Insurance (if covered byJamsostek for Health Insurance) during period on Unemployment Insurance Benefit.
10. Maximum Period of Coverage 13 weeks of Unemployment ( 3 months)..
11. Form of Benefit Payment. Initial payment of one month’s lump sum. Subsequent periodic payments of upto total of 2 further one month payment amounts subject to renewed application and evidence of continuedunemployment plus participation in required Active labour Market Programmes and activities specified by theUnemployment Insurance Fund. (Initially this may only be evidence of Job Search activity).
12. Future extension of Active labour Market ProgrammesCould include Job search assistance
Job placementJob skill development
If pursued, these could be contracted out.
13. Administering Agency Jamsostek
14. Form of Unemployment Insurance Fund Trust Fund
15. Management Oversight Tripartite Board representing Employers, Unions and Government. This could bethe same Board as that of Jamsostek.

Annexes
371
Annex 24 Alternative Projections of Unemployment Insurance Outcomes
Projection 1. Low Benefit Duration CasePremium Rate: 2% of insured wageGrant Rate 15% of insured workers per year.Average Benefit Duration: 8 of the 13 weeksAverage Benefit in first year of grants: Rp. 280,000.
Years 1 2 3 4 5 6 7RevenuePremiums 685 788 906 1,042 1,198 1,378 1,584Investment Income ----- 55 83 118 161 212 274
Total Income 685 843 989 1,160 1,359 1,590 1,858CostsAdministration 140 161 185 213 245 282 324Benefits ----- 395 454 522 600 691 794
Total Costs 140 556 639 845 845 973 1,118
Surplus or Deficit 545 287 350 425 514 617 740Year End Funds 545 832 1,182 1,607 2,121 2,738 3,478Accumulated Funds as % of Costs 389 150 185 219 251 281 311including Benefits
Projection II Optimistic Case – Low Benefit Duration and Low Claim RatesPremium Rate: 2% of insured wagesClaim Rate 10% of insured workers per yearAverage Benefit Duration: 8 of the 13 weeksAverage Benefit in first year of Grant Rp. 280,000
Years 1 2 3 4 5 6 7
RevenuePremiums 685 788 906 1,042 1,198 1,378 1,584Investment Income 685 55 96 148 211 287 379Total Income 685 843 1002 1,190 1,409 1,665 1,963CostsAdministration 140 161 185 213 245 282 324Benefits ----- 263 303 348 400 460 524
Total Costs 140 424 488 561 645 742 848
Surplus or Deficit 545 419 514 629 764 923 1,115Year End Funds 545 964 1478 2107 2871 3794 4909Accumulated Funds as % of Costs 389 230 303 376 445 511 579including Benefits

Annexes
372
Projection III Higher Claim Rate, Low Benefit Duration Case
Premium Rate: 2% of insured wagesClaim Rate: 20%Average Benefit Duration 8 of 13 weeksAverage Benefit in first Year of Grant: Rp. 280,000.
Years 1 2 3 4 5 6 7RevenuePremiums 685 788 906 1,042 1,198 1,378 1,584Investment Income ----- 55 70 88 111 137 169
Total Income 685 840 976 1,130 1,309 1,515 1,755CostsAdministration 140 161 185 213 245 282 324Benefits ----- 526 605 696 801 921 1,059
Total Costs 140 687 790 903 1,046 1,203 1,383
Surplus or Deficit 545 153 186 227 263 312 372Year End Funds 545 698 884 1,111 1,374 1,686 2,058Accumulated Funds as % of Costs 389 102 112 123 131 140 144including Benefits
Projection IV Standard Claim rate, Longer Benefit Duration case
Premium Rate: 2% of insured wagesClaim Rate: 15% of inured wage earnersBenefit Duration: 12 of 13 weeksAverage Benefit in first year of grant: Rp. 420,000
Years 1 2 3 4 5 6 7
RevenuePremiums 685 788 906 1,042 1,198 1,378 1,584Investment Income ----- 55 64 75 87 101 117
Total Income 685 843 970 1,117 1,285 1,479 1,701CostsAdministration 140 161 185 213 245 282 324Benefits ----- 592 681 763 901 1,036 1,191
Total Costs 140 753 860 996 1,146 1,318 1,515
Surplus or Deficit 545 90 110 121 138 161 186Year End Funds 545 635 745 886 1,005 1,116 1,352Accumulated Funds as % of Costs 389 84 87 87 88 88 89including Benefits

Annexes
373
Projection V Higher Claim Rate and Longer Benefit Duration
Premium Rate: 2% of insured wagesClaim Rate: 20% of insured wage earnersBenefit Duration: 12 of 13 weeksAverage benefit in first year; Rp. 420,000
Years 1 2 3 4 5 6 7RevenuePremiums 685 788 906 1,042 1,198 1,378 1,584Investment Income ----- 55 44 29 11 15 45
Total Income 685 843 950 1,071 1,209 1,363 1,538CostsAdministration 140 161 185 213 245 282 324Benefits ----- 790 908 1,044 1,201 1,381 1,588
Total Costs 140 951 1,093 1,257 1,446 1,663 1,912
Surplus or Deficit 545 -108 -143 -186 -257 -300 -374Year End Funds 545 437 294 108 -149 -449 -823Accumulated Funds as % of Costs 389 46 27 9 -10 -27 -43including Benefits
Projection VI Standard Claim Rate, Long Benefit Duration
Premium Rate: 2% of insured wagesClaim Rates: Year 2 is 10%. Years 3 onwards is 15%Benefit Duration: 12 of 13 weeksAverage Benefit in first year: Rp. 420,000
Years 1 2 3 4 5 6 7RevenuePremiums 685 788 906 1,042 1,198 1,378 1,584Investment Income ----- 55 83 96 110 126 145
Total Income 685 843 989 1,138 1,308 1,504 1,729CostsAdministration 140 161 185 213 245 282 324Benefits ----- 395 681 783 900 1,036 1,191
Total Costs 140 556 866 996 1,145 1,318 1,515
Surplus or Deficit 545 287 123 142 163 186 214Year End Funds 545 832 955 1,097 1,260 1,446 1,660Accumulated Funds as % of Costs 389 150 110 110 110 110 110including Benefits

Annexes
374
Projection VII Composite Case with 2 year Recession in years 5 and 6
Premium rate: 2% of insured wagesClaim rates; Year 2 is 10%
Years 3, 4, and 7 is 15%Years 5 and 6 is 20%
Benefit Duration: 12 of 13 weeksAverage Benefit in First Year: Rp. 420,000.
Years 1 2 3 4 5 6 7RevenuePremiums 685 788 906 1,042 1,198 1,378 1,584Investment Income ----- 55 83 96 110 96 77
Total Income 685 843 989 1,138 1,308 1,474 1,661CostsAdministration 140 161 185 213 245 282 324Benefits ----- 395 681 783 1201 1,381 1,191
Total Costs 140 556 866 996 1,446 1,663 1,515
Surplus or Deficit 545 287 123 142 -138 -189 146Year End Funds 545 832 955 1,097 959 770 916Accumulated Funds as % of Costs 389 150 110 110 66 46 60including Benefits
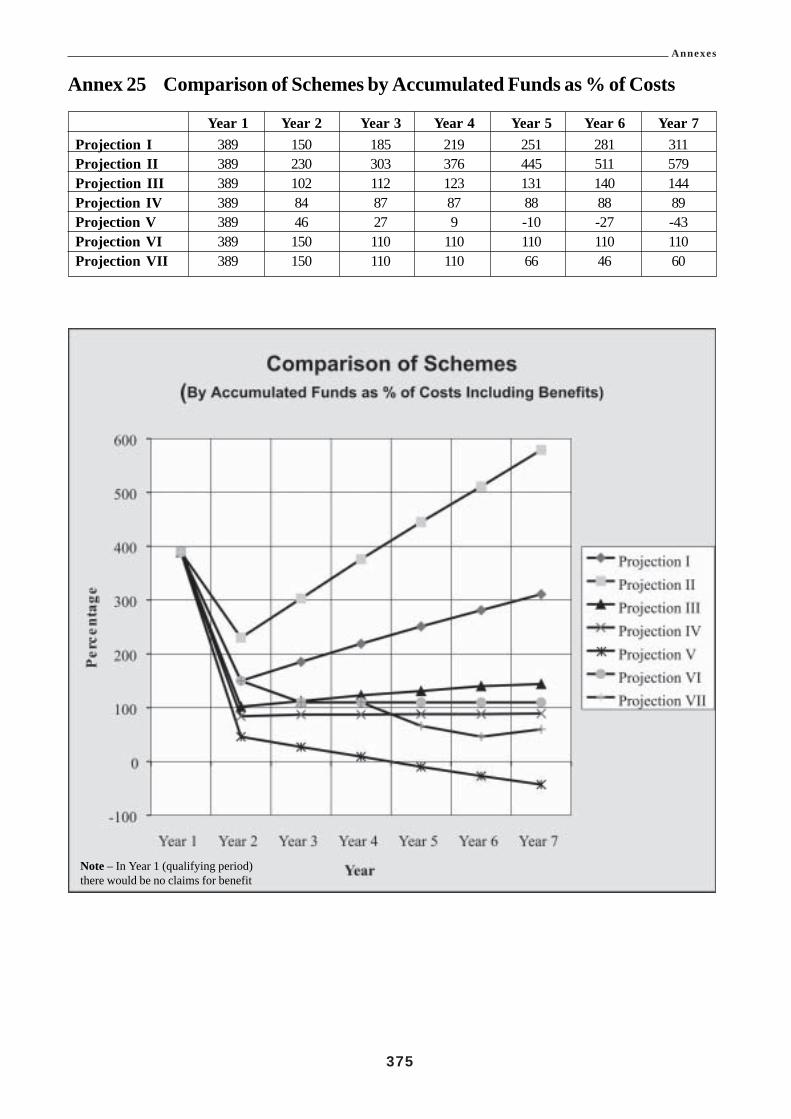
Annexes
375
Annex 25 Comparison of Schemes by Accumulated Funds as % of Costs
Year 1 Year 2 Year 3 Year 4 Year 5 Year 6 Year 7Projection I 389 150 185 219 251 281 311Projection II 389 230 303 376 445 511 579Projection III 389 102 112 123 131 140 144Projection IV 389 84 87 87 88 88 89Projection V 389 46 27 9 -10 -27 -43Projection VI 389 150 110 110 110 110 110Projection VII 389 150 110 110 66 46 60
Note – In Year 1 (qualifying period)there would be no claims for benefit

Annexes
376
Annex 26 Social Assistance Statistics
Table 1. The National Poverty Measure in IndonesiaOld Measure
Year Numbers (millions) % of population belowBelow the poverty line the poverty line
1970 70.0 60.01976 54.2 40.11978 47.2 33.31980 42.3 28.61981 40.6 26.91984 35.0 21.61987 30.0 17.41990 27.2 15.11993 25.8 13.71996 22.6 11.4
New 1998 basis MeasureYear Numbers (millions)
Below the poverty line1996 34.5
1998 Dec 49.51999 Feb 48.4
1999 37.5
Sources. 1970 to 1996 UNDP 1997 “The Indonesian Economic Transition and the end of Poverty”. After 1997SMERU and Statistics Indonesia.Note.The National Poverty Measure is based on an ability to afford an average household food consumption of
2100 calories per day per household member, 90 per cent of which are provided from grain, plus a basket ofnon-food items.
The Indonesian national poverty measure in 1996 equated to the equivalent of US$ 0.55 per day in urban areasand $0.40 in rural areas. An alternative measure of US$ 1.0 in urban areas and US$0.80 in urban areas wouldhave produced a poverty percentage of 57.3 per cent in 1996 compared with the national measure of 11.3 percent.
Table 2. Per capita daily food consumption in IndonesiaYear Calories Protein (grams)1993 1,879.13 n.a.1996 2,019.79 54.491999 1,849.36 48.67
Source. Expenditure for Consumption in Indonesia 1996 and 1999.
Table 3. Medium and Large Manufacturing Enterprises listed by Statistics
Year Number Enterprises Delisted New Listings1998 22,243 2,526 1,6561999 21,412 2,642 1,5512000 22,574 215 1,144
Source. Bappenas (Statistics Indonesia).
The statistical discrepancy represents enterprises delisted which were subsequently re-instated. Delisting canoccur either because the enterprise closes, or because it falls below the employment size level used to classify itas a medium or large manufacturing enterprise.
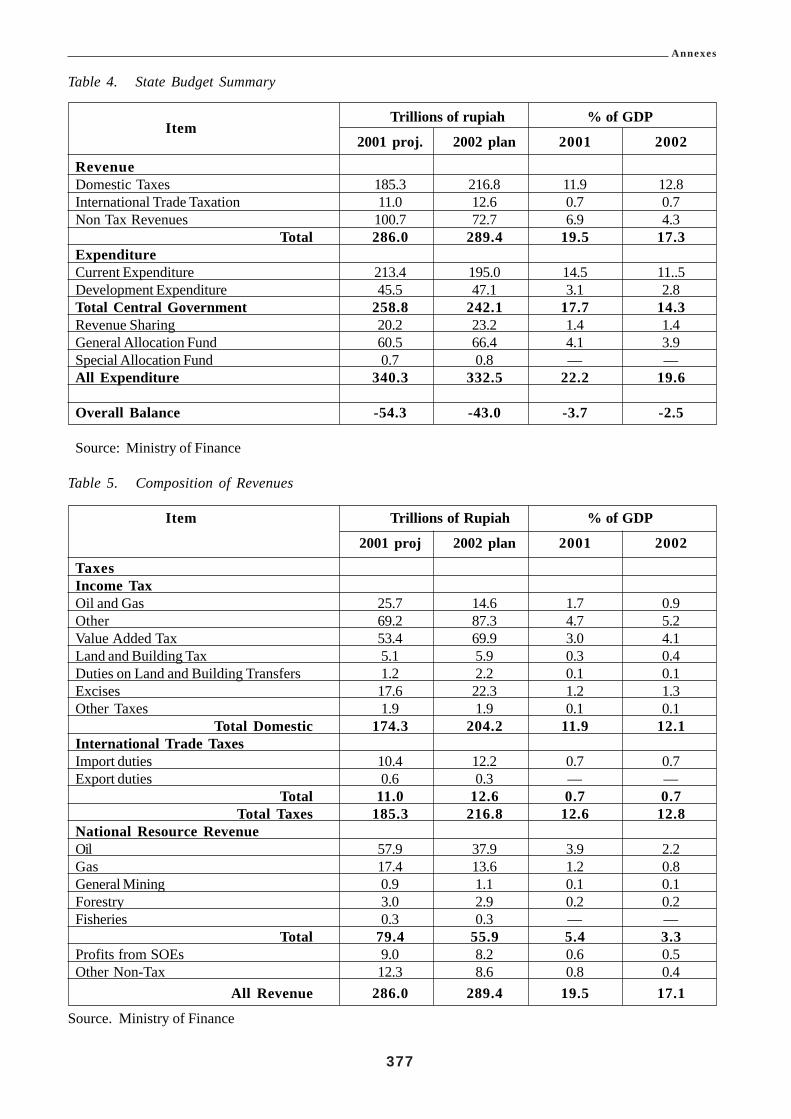
Annexes
377
Table 4. State Budget Summary
ItemTrillions of rupiah % of GDP
2001 proj. 2002 plan 2001 2002
RevenueDomestic Taxes 185.3 216.8 11.9 12.8International Trade Taxation 11.0 12.6 0.7 0.7Non Tax Revenues 100.7 72.7 6.9 4.3
Total 286.0 289.4 19.5 17.3ExpenditureCurrent Expenditure 213.4 195.0 14.5 11..5Development Expenditure 45.5 47.1 3.1 2.8Total Central Government 258.8 242.1 17.7 14.3Revenue Sharing 20.2 23.2 1.4 1.4General Allocation Fund 60.5 66.4 4.1 3.9Special Allocation Fund 0.7 0.8 — —All Expenditure 340.3 332.5 22.2 19.6
Overall Balance -54.3 -43.0 -3.7 -2.5
Source: Ministry of Finance
Table 5. Composition of Revenues
Item Trillions of Rupiah % of GDP
2001 proj 2002 plan 2001 2002
TaxesIncome TaxOil and Gas 25.7 14.6 1.7 0.9Other 69.2 87.3 4.7 5.2Value Added Tax 53.4 69.9 3.0 4.1Land and Building Tax 5.1 5.9 0.3 0.4Duties on Land and Building Transfers 1.2 2.2 0.1 0.1Excises 17.6 22.3 1.2 1.3Other Taxes 1.9 1.9 0.1 0.1
Total Domestic 174.3 204.2 11.9 12.1International Trade TaxesImport duties 10.4 12.2 0.7 0.7Export duties 0.6 0.3 — —
Total 11.0 12.6 0.7 0.7Total Taxes 185.3 216.8 12.6 12.8
National Resource RevenueOil 57.9 37.9 3.9 2.2Gas 17.4 13.6 1.2 0.8General Mining 0.9 1.1 0.1 0.1Forestry 3.0 2.9 0.2 0.2Fisheries 0.3 0.3 — —
Total 79.4 55.9 5.4 3.3Profits from SOEs 9.0 8.2 0.6 0.5Other Non-Tax 12.3 8.6 0.8 0.4
All Revenue 286.0 289.4 19.5 17.1
Source. Ministry of Finance

Annexes
378
Table 6. Indonesian Government Routine Expenditure(Trillions of Rupiah)
Year Personnel Material Regional Interest & Subsidies OtherExpenses Expenses Amort.
1996-97 14.553 8.109 9.358 27.941 1.416 1.7321997-98 17.269 8.999 11.061 31.112 20.413 0.7561998-99 23.216 9.862 13.074 54.581 32.684 2.6691999-2000 32.719 10.765 17.485 42.735 65.916 4.6212000 (9 mths) 29.990 9.047 17.593 53.329 59.725 11.9962001 projected 38.206 9.909 — 89.570 66.269 9.4332002 draft 40.665 11.589 — 86.981 46.239 9.5432002 draft % of spending 20.900 5.900 — 44.600 23.700 4.900
Source; Ministry of Finance
Table 7. Composition of Subsidy Expenditure from Regular Budget(Trillions of Rupiah)
Year Oil Electricity Food Fertiliser Interest Other Total
1996-97 1.416 — — 0.186 — — 1.6021997-98 9.814 — 10.599 0.708 — — 21.1211998-99 28.607 1.930 1.535 — — 0.612 32.6841999-2000 40.923 4.552 18.164 — 2.033 0.244 65.9162000 (9 mths) 51.135 3.928 2.213 — 1.930 0.519 59.7262001 proj 53.774 4.727 2.435 — 4.923 0.400 66.2692002 draft 32.289 4.640 4.696 4.413 0.200 46.234Percentage Allocation2002 % 69.800 10.000 10.200 9.500 0.400 100.000
Source. Ministry of Finance
Table 8. Estimated Composition of Social Safety Net Subsidies in year 2001
Item Trillion Rupiah
From Regular BudgetFood 2.4Electricity 4.7Credit programme 4.9Other including medical 0.4
Sub total 12.5
From Development Budget 2.2
Total 12.5
Of which FoodRegular Budget 2.4Development Budget 0.3
Total 2.7
Source. Ministry of Finance
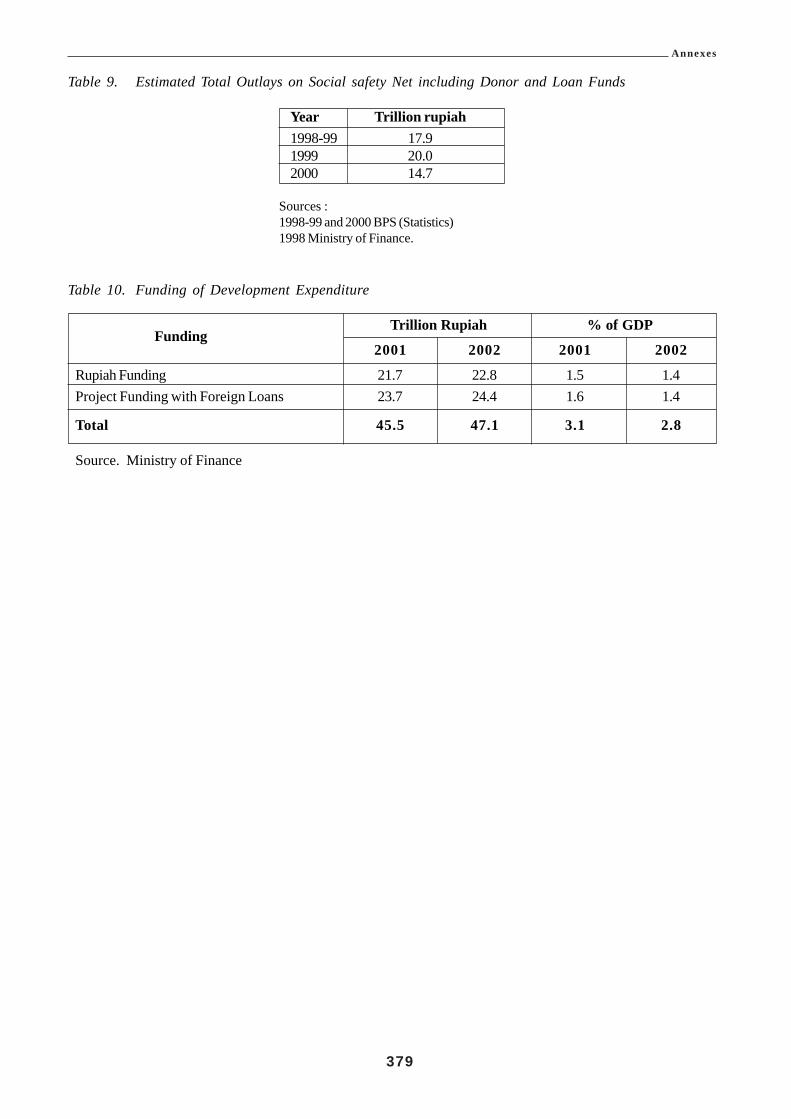
Annexes
379
Table 9. Estimated Total Outlays on Social safety Net including Donor and Loan Funds
Year Trillion rupiah1998-99 17.91999 20.02000 14.7
Sources :1998-99 and 2000 BPS (Statistics)1998 Ministry of Finance.
Table 10. Funding of Development Expenditure
FundingTrillion Rupiah % of GDP
2001 2002 2001 2002
Rupiah Funding 21.7 22.8 1.5 1.4Project Funding with Foreign Loans 23.7 24.4 1.6 1.4
Total 45.5 47.1 3.1 2.8
Source. Ministry of Finance
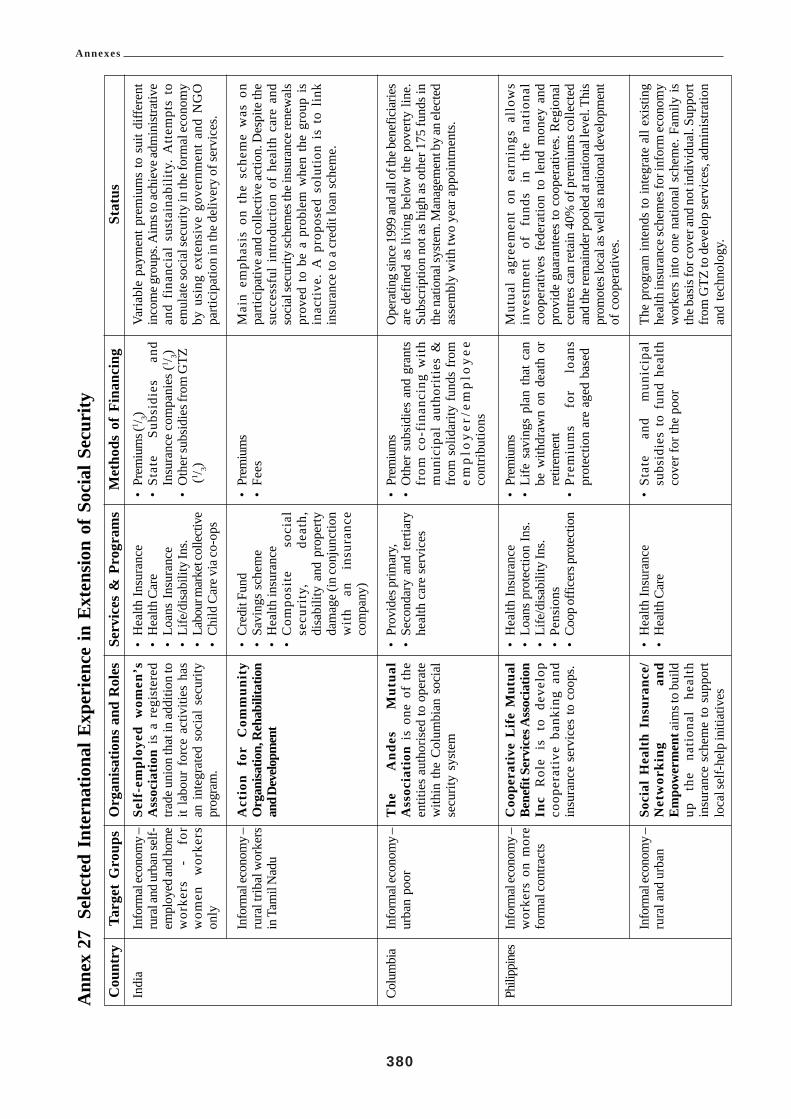
Annexes
380
Ann
ex 2
7Se
lect
ed I
nter
natio
nal E
xper
ienc
e in
Ext
ensio
n of
Soc
ial S
ecur
ityTa
rget
Gro
ups
Info
rmal
econ
omy –
rura
l and
urb
an se
lf-em
ploy
ed an
d hom
ew
orke
rs
- fo
rw
omen
w
orke
rson
ly
Info
rmal
econ
omy –
rura
l trib
al w
orke
rsin
Tam
il N
adu
Info
rmal
econ
omy –
urba
n po
or
Info
rmal
econ
omy –
wor
kers
on
mor
efo
rmal
cont
ract
s
Info
rmal
econ
omy –
rura
l and
urb
an
Org
anis
atio
ns a
nd R
oles
Self
-em
ploy
ed w
omen
’sA
ssoc
iatio
n is
a r
egis
tere
dtra
de u
nion
that
in ad
ditio
n to
it la
bour
for
ce a
ctiv
ities
has
an in
tegr
ated
soc
ial s
ecur
itypr
ogra
m.
Act
ion
for
Com
mun
ity
Org
anisa
tion,
Reh
abili
tatio
nan
d Dev
elopm
ent
The
A
ndes
M
utua
lA
ssoc
iati
on i
s on
e of
the
entit
ies
auth
oris
ed to
ope
rate
with
in th
e C
olum
bian
soc
ial
secu
rity
syst
em
Coo
pera
tive
Lif
e M
utua
lBe
nefit
Ser
vice
s Ass
ocia
tion
Inc
Rol
e is
to
deve
lop
coop
erat
ive
bank
ing
and
insu
ranc
e se
rvic
es to
coo
ps.
Soci
al H
ealt
h In
sura
nce/
Net
wor
king
an
dEm
pow
erm
ent a
ims t
o bu
ildup
th
e na
tion
al
heal
thin
sura
nce
sche
me
to s
uppo
rtlo
cal s
elf-
help
initi
ativ
es
Serv
ices
& P
rogr
ams
•H
ealth
Insu
ranc
e•
Hea
lth C
are
•Lo
ans
Insu
ranc
e•
Life
/disa
bilit
y In
s.•
Labo
ur m
arke
t col
lect
ive
•C
hild
Car
e via
co-o
ps
•C
redi
t Fun
d•
Savi
ngs
sche
me
•H
ealth
insu
ranc
e•
Com
posi
te
soci
alse
curi
ty,
deat
h,di
sabi
lity
and
prop
erty
dam
age (
in co
njun
ctio
nw
ith
an
insu
ranc
eco
mpa
ny)
•Pr
ovid
es p
rimar
y,•
Seco
ndar
y an
d te
rtiar
yhe
alth
car
e se
rvic
es
•H
ealth
Insu
ranc
e•
Loan
s pr
otec
tion
Ins.
•Li
fe/d
isabi
lity
Ins.
•Pe
nsio
ns•
Coop
offi
cers
pro
tect
ion
•H
ealth
Insu
ranc
e•
Hea
lth C
are
Stat
usVa
riabl
e pa
ymen
t pre
miu
ms
to s
uit d
iffer
ent
inco
me g
roup
s. A
ims t
o ac
hiev
e adm
inist
rativ
ean
d fi
nanc
ial
sust
aina
bilit
y. A
ttem
pts
toem
ulat
e soc
ial s
ecur
ity in
the f
orm
al ec
onom
yby
usi
ng e
xten
sive
gov
ernm
ent
and
NG
Opa
rtici
patio
n in
the
deliv
ery
of se
rvic
es.
Mai
n em
phas
is o
n th
e sc
hem
e w
as o
npa
rtici
pativ
e and
colle
ctiv
e act
ion.
Des
pite
the
succ
essf
ul i
ntro
duct
ion
of h
ealth
car
e an
dso
cial
secu
rity
sche
mes
the i
nsur
ance
rene
wal
spr
oved
to
be a
pro
blem
whe
n th
e gr
oup
isin
activ
e. A
pro
pose
d so
lutio
n is
to
link
insu
ranc
e to
a c
redi
t loa
n sc
hem
e.
Ope
ratin
g sin
ce 19
99 an
d all
of th
e ben
efic
iarie
sar
e de
fined
as
livin
g be
low
the
pove
rty li
ne.
Subs
crip
tion
not a
s hig
h as
oth
er 1
75 fu
nds i
nth
e nat
iona
l sys
tem
. Man
agem
ent b
y an
elec
ted
asse
mbl
y w
ith tw
o ye
ar a
ppoi
ntm
ents
.
Mut
ual
agre
emen
t on
ear
ning
s al
low
sin
vest
men
t of
fu
nds
in
the
nati
onal
coop
erat
ives
fed
erat
ion
to l
end
mon
ey a
ndpr
ovid
e gu
aran
tees
to c
oope
rativ
es. R
egio
nal
cent
res c
an re
tain
40%
of p
rem
ium
s col
lect
edan
d th
e rem
aind
er p
oole
d at
nat
iona
l lev
el. T
his
prom
otes
loca
l as w
ell a
s nat
iona
l dev
elop
men
tof
coo
pera
tives
.
The
prog
ram
inte
nds
to in
tegr
ate
all e
xist
ing
heal
th in
sura
nce s
chem
es fo
r inf
orm
econ
omy
wor
kers
into
one
nat
iona
l sch
eme.
Fam
ily is
the b
asis
for c
over
and
not i
ndiv
idua
l. Su
ppor
tfr
om G
TZ to
dev
elop
serv
ices
, adm
inis
tratio
nan
d te
chno
logy
.
Met
hods
of
Fina
ncin
g•
Prem
ium
s (1 / 3)
•St
ate
Subs
idie
s an
dIn
sura
nce
com
pani
es (1 / 3)
•O
ther
subs
idie
s fro
m G
TZ (1 / 3)
•Pr
emiu
ms
•Fe
es
•Pr
emiu
ms
•O
ther
sub
sidi
es a
nd g
rant
sfr
om c
o-fi
nanc
ing
wit
hm
unic
ipal
aut
hori
ties
&fr
om s
olid
arity
fund
s fr
omem
plo
yer
/em
plo
yee
cont
ribut
ions
•Pr
emiu
ms
•Li
fe s
avin
gs p
lan
that
can
be w
ithdr
awn
on d
eath
or
retir
emen
t•
Prem
ium
s fo
r lo
ans
prot
ectio
n ar
e ag
ed b
ased
•St
ate
and
mun
icip
alsu
bsid
ies
to f
und
heal
thco
ver f
or th
e po
or
Cou
ntry
Indi
a
Colu
mbi
a
Phili
ppin
es

Annexes
381
Cou
ntry
Bang
lades
h
Boliv
ia
So
ut
hA
frica
Tanz
ania
Targ
et G
roup
sIn
form
al ec
onom
y –w
orke
rs o
n m
ore
form
al co
ntra
cts
Info
rmal
econ
omy –
rura
l w
orke
rs o
nca
sual
pie
ce-r
ate
labo
ur
Info
rmal
econ
omy –
urba
n po
or a
nd i
nso
me r
ural
area
s
Info
rmal
econ
omy –
rura
l and
urb
an
Info
rmal
econ
omy –
urba
n
Org
anis
atio
ns a
nd R
oles
Ang
ono
Cre
dit
and
Dev
elop
men
t co
oper
ativ
esc
hem
e ta
rget
s sm
all
busi
ness
es
for
loan
prot
ectio
n, m
utua
l su
ppor
tan
d m
edic
al se
rvic
es.
Gra
mee
n K
alya
n is
a n
on-
prof
it co
mpa
ny t
hat
aim
s to
prom
ote
heal
th
and
prev
enta
tive i
llnes
s. It
acts
asa
heal
th c
are
insu
rer &
bas
icpr
ovid
er.
Tom
as K
atar
i Po
lyte
chni
cIn
stit
ute
has
focu
s on
educ
atio
n,
prod
ucti
on,
orga
niza
tion
an
d so
cial
activ
ities
.
Sout
h A
fric
an O
ld-a
gepe
nsio
ns
is
a no
n-co
ntri
buto
ry m
eans
tes
ted
bene
fit
paid
fro
m g
ener
algo
vern
men
t rev
enue
Mut
ual S
ocie
ty f
or H
ealth
Car
e in
the I
nfor
mal
Sec
tor
is
an
insu
ranc
e sc
hem
esp
onso
red
by IL
O. I
t is
self-
fund
ing,
pro
vide
s ch
oice
betw
een
govt
, pr
ivat
epr
ovid
ers &
infr
astru
ctur
e.
Serv
ices
& P
rogr
ams
•C
apita
l lo
ans
to s
mal
lbu
sine
ss•
Loan
re-in
sura
nce
•Li
fe/d
isabi
lity.
•B
asic
med
ical
serv
ices
•Pe
nsio
ns
•H
ealth
Insu
ranc
e•
Loan
s In
sura
nce
•Li
fe/d
isabi
lity I
nsur
ance
•B
asic
Hea
lth C
are
•Pe
riod
ical
pe
nsio
npa
ymen
t
•Pr
imar
y he
alth
care
,•
Seco
ndar
y an
d te
rtiar
yca
re a
t go
vern
men
tce
ntre
s
Stat
usA
lthou
gh th
e sc
hem
e is
sm
all a
nd ta
rget
ed a
tsm
all b
usin
ess i
t is a
via
ble
mic
ro-s
yste
m th
atsu
ppor
ts m
embe
rs w
ith l
oans
for
bus
ines
s,ho
usin
g re
pair
, m
edic
al a
nd e
duca
tion
purp
oses
.
The
sche
mes
are
var
iabl
e an
d ha
ve a
rang
e of
pric
es fo
r eac
h sc
hem
e. C
ost r
ecov
ery
is ab
out
65%
but
inc
reas
ing
wit
h m
embe
rshi
pen
cour
aged
thro
ugh
the
asso
ciat
ed G
ram
een
Ban
k an
d its
mem
bers
.
Due
to it
s int
erna
tiona
l sub
sidi
es it
is n
ot y
et a
sust
aina
ble
mic
ro-i
nsur
ance
sch
eme
and
curr
ent r
ole
is to
exp
and
acce
ss to
hea
lth c
are
serv
ices
. A
ims
to
grad
uall
y ac
hiev
esu
stai
nabi
lity.
All
Sout
h A
fric
an s
ocia
l as
sist
ance
now
adm
inis
tere
d th
roug
h on
e ag
ency
, D
ept
ofW
elfa
re. P
ensi
on is
an
Impo
rtant
pay
men
t to
poor
hou
seho
lds,
alth
ough
leak
age
and
frau
dis
abo
ut 1
0% o
f pay
men
ts. P
aym
ents
in ru
ral
area
s is
out
sour
ced
usin
g se
curit
y fir
m w
ithm
obile
ATM
’s
Car
e op
tions
for
the
var
ious
gro
ups
in t
hesc
hem
e w
ere
capi
tatio
n, c
ase
paym
ent
and
ente
rpri
se c
linic
. C
ontr
ol m
etho
ds w
ere
emph
asise
d and
clea
ranc
e for
med
ical
trea
tmen
tth
at h
ad to
be
obta
ined
from
the
grou
p le
ader
.To
be r
epla
ced
by p
hoto
grap
hed
ID ca
rds.
The
sche
me
has
been
suc
cess
ful &
sus
tain
able
, is
inte
rnal
ly m
anag
ed &
fund
ed. T
he ri
sk h
as b
een
min
imis
ed b
y co
mbi
ning
gro
ups
into
lar
ger
grou
ps e
ach
of a
bout
400
mem
bers
.
Met
hods
of
Fina
ncin
g•
Prem
ium
s•
Fees
•Fe
es•
Subs
idie
s pro
vide
d th
roug
hth
e G
ram
een
Tru
st a
ndpr
ofits
from
the
full
rate
of
serv
ice
fees
for n
on-p
oor
•Pr
emiu
ms
•Su
bsid
ies
from
non
-sta
tede
velo
pmen
t ag
enci
es,
dono
rs a
nd o
ther
s.
•St
ate
Fund
ed fr
om g
ener
alta
xati
on r
even
ues
(non
fund
ed m
anda
te t
o lo
cal
prov
ince
s)
unti
l 19
99gu
aran
teed
by
the
natio
nal
gove
rnm
ent
•C
ontri
butio
n by
mem
bers
atsi
ngle
rate
or f
amily
rate

Annexes
382
Annex 28 Informal Sector Survey – Tables of Results
Figure 1. Survey - Table of Occupations
OccupationJakarta Bandung YogYakarta TOTAL TOTAL
M F M F M F M F M + F
Fashion Production 9 9 0 0 38 34 47 43 90Vehicle workshops 106 1 72 3 7 - 185 4 189Home based food industry 7 6 0 0 2 1 9 7 16Manufacturer 5 1 1 0 51 16 57 17 74Furniture workshop 39 0 9 0 131 13 179 13 192Services 5 0 147 1 12 13 164 14 178Driver 0 0 27 0 1 - 28 0 28Salon 0 0 114 24 - - 114 24 138Restaurant 181 48 0 49 - 2 181 99 280Trader 16 25 4 0 42 57 62 82 144Stationery vendor 21 5 2 1 11 3 34 9 43Building materials vendor 27 9 1 - - 27 10 37Garden plants vendor 29 3 37 0 5 10 71 13 84Small goods vendor 58 22 0 12 1 4 59 38 97Furniture trader 63 2 0 0 29 6 92 8 100Craft, artist 0 0 0 0 210 79 210 79 289Other 0 0 0 0 16 4 16 4 20
Sub-Total 566 131 413 91 556 242 1535 464
Total 697 504 798 1999 1999
Figure 2. Survey - Table of Monthly Incomes
Monthly Income Jakarta Bandung YogYakarta TOTAL TOTAL TOTAL(self)(Rp.) M F M F M F M F M+F %
< 200,000 31 9 104 19 302 157 437 185 622 31.12%200,001 – 400,000 123 37 175 28 142 38 440 103 543 27.16%400,001 – 600,000 120 37 79 21 41 21 240 79 319 15.96%600,001 – 800,000 87 22 32 10 19 6 138 38 176 8.80%> 800,000 205 26 23 13 52 20 280 59 339 16.96%
Sub-Total 566 131 413 91 556 242 1535 464
Total 697 504 798 1999 1999 100%
Figure 3. Survey - Table of Possible Social Security Contributions
If Compulsory, how muchSocial Security contributions Jakarta Bandung YogYakarta TOTAL TOTAL%
could you pay (Rp.)
< 10,000 291 113 483 887 44.37%10,001 – 20,000 215 93 212 520 26.01%20,001 – 30,000 106 67 26 199 9.95%30,001 – 40,000 54 19 50 123 6.15%> 40,000 25 0 14 39 1.95%Could not pay 6 212 13 231 11.56%
Total 697 504 798 1999 100%
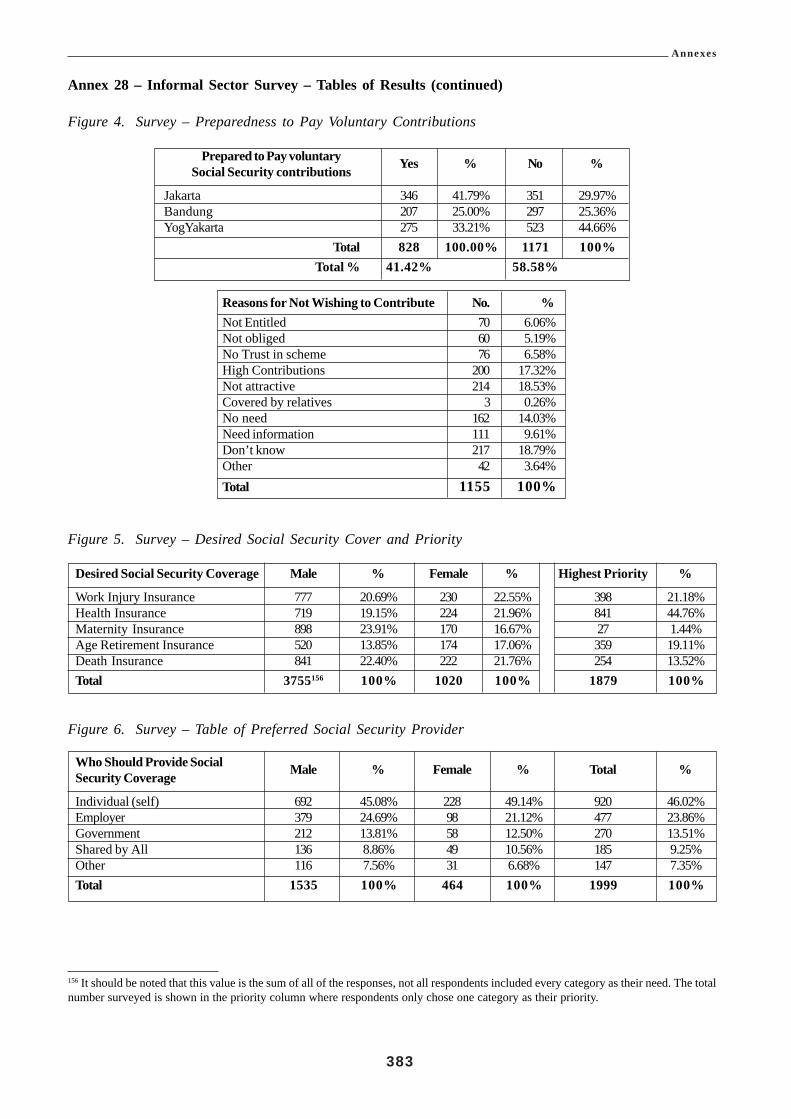
Annexes
383
Annex 28 – Informal Sector Survey – Tables of Results (continued)
Figure 4. Survey – Preparedness to Pay Voluntary Contributions
Prepared to Pay voluntary Yes % No %Social Security contributions
Jakarta 346 41.79% 351 29.97%Bandung 207 25.00% 297 25.36%YogYakarta 275 33.21% 523 44.66%
Total 828 100.00% 1171 100%Total % 41.42% 58.58%
Reasons for Not Wishing to Contribute No. %Not Entitled 70 6.06%Not obliged 60 5.19%No Trust in scheme 76 6.58%High Contributions 200 17.32%Not attractive 214 18.53%Covered by relatives 3 0.26%No need 162 14.03%Need information 111 9.61%Don’t know 217 18.79%Other 42 3.64%Total 1155 100%
Figure 5. Survey – Desired Social Security Cover and Priority
Desired Social Security Coverage Male % Female % Highest Priority %
Work Injury Insurance 777 20.69% 230 22.55% 398 21.18%Health Insurance 719 19.15% 224 21.96% 841 44.76%Maternity Insurance 898 23.91% 170 16.67% 27 1.44%Age Retirement Insurance 520 13.85% 174 17.06% 359 19.11%Death Insurance 841 22.40% 222 21.76% 254 13.52%Total 3755156 100% 1020 100% 1879 100%
Figure 6. Survey – Table of Preferred Social Security Provider
Who Should Provide Social Male % Female % Total %Security Coverage
Individual (self) 692 45.08% 228 49.14% 920 46.02%Employer 379 24.69% 98 21.12% 477 23.86%Government 212 13.81% 58 12.50% 270 13.51%Shared by All 136 8.86% 49 10.56% 185 9.25%Other 116 7.56% 31 6.68% 147 7.35%Total 1535 100% 464 100% 1999 100%
156 It should be noted that this value is the sum of all of the responses, not all respondents included every category as their need. The totalnumber surveyed is shown in the priority column where respondents only chose one category as their priority.

Annexes
384
Annex 28 – Informal Sector Survey – Tables of Results (continued)
Figure 7. Survey – Likely Social Security Provider
Who Will Now Provide forMale % Female % Total %Social Security Needs
Insurance 6 0.39% 1 0.22% 7 0.35%Employer 184 11.99% 48 10.37% 232 11.62%Government 24 1.56% 22 4.75% 46 2.30%Family 837 54.56% 291 62.85% 1128 56.48%Self 256 16.69% 58 12.53% 314 15.72%No one 119 7.76% 20 4.32% 139 6.96%No Answer 108 7.04% 23 4.97% 131 6.56%
Total 1534 100% 463 100% 1997 100%
Figure 8. Survey – Education Profile
Education Profile Male % Female % Total %
None 35 2.28% 20 4.31% 55 2.75%Primary 231 15.05% 84 18.10% 315 15.76%Secondary 525 34.20% 126 27.16% 651 32.57%Tertiary 637 41.50% 188 40.52% 825 41.27%Trade 107 6.97% 46 9.91% 153 7.65%Total 1535 100% 464 100% 1999 100%
Figure 9. Survey – Employment Status
Employment Status Jakarta Bandung YogYakarta TOTAL TOTAL TOTAL
M F M F M F M F M+F %
Employee 12 22 114 18 367 144 493 184 677 33.87%Self Employed 553 108 227 73 186 94 966 275 1241 62.08%No Answer 1 1 72 0 3 4 76 5 81 4.05%
Sub-Total 566 131 413 91 556 242 1535 464
Total 697 504 798 1999 1999 100%
Figure 10. Survey – Table of Membership of Cooperatives or Other Organizations
Member of Jakarta Bandung YogYakarta TOTAL TOTAL TOTALCooperative or other
M F M F M F M FM+F %
Organization
No membership 538 119 342 75 503 202 1383 396 1779 88.99%Member 16 7 19 5 43 28 78 40 118 5.90%No Answer 12 5 52 11 10 12 74 28 102 5.10%
Sub-Total 566 131 413 91 556 242 1535 464Total 697 504 798 1999 1999 100%
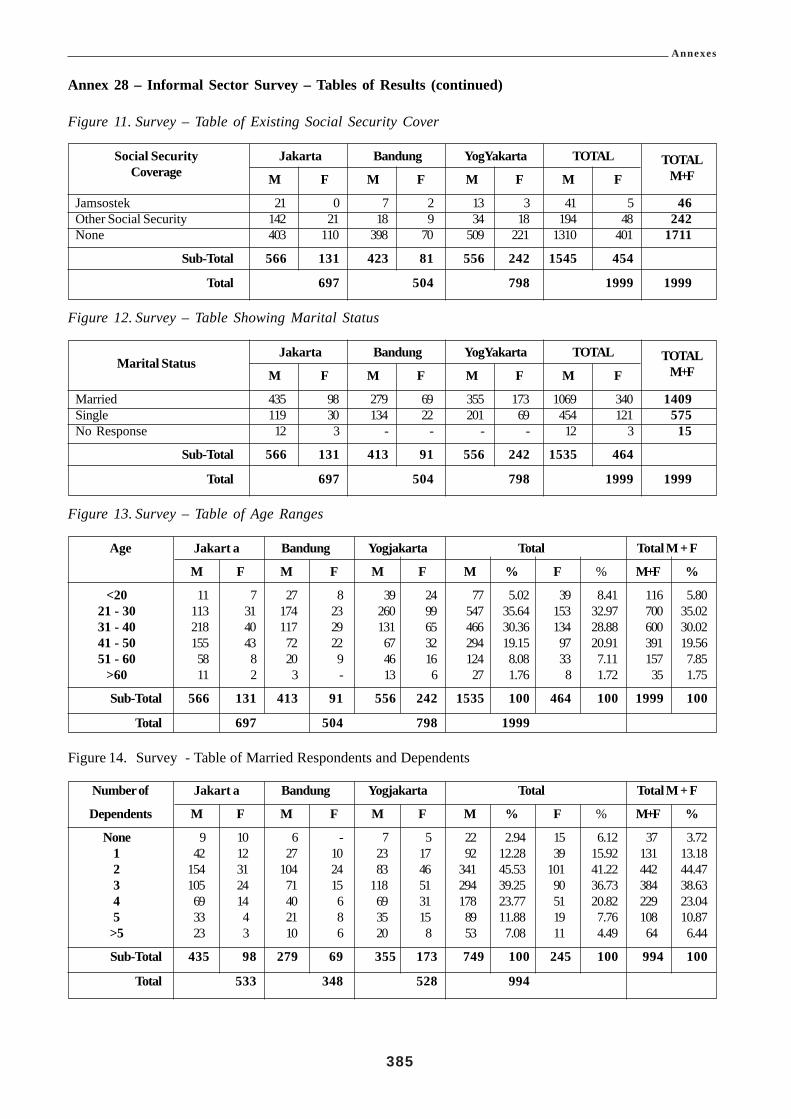
Annexes
385
Annex 28 – Informal Sector Survey – Tables of Results (continued)
Figure 11. Survey – Table of Existing Social Security Cover
Social Security Jakarta Bandung YogYakarta TOTAL TOTALCoverage M F M F M F M F M+F
Jamsostek 21 0 7 2 13 3 41 5 46Other Social Security 142 21 18 9 34 18 194 48 242None 403 110 398 70 509 221 1310 401 1711
Sub-Total 566 131 423 81 556 242 1545 454
Total 697 504 798 1999 1999
Figure 12. Survey – Table Showing Marital Status
Marital StatusJakarta Bandung YogYakarta TOTAL TOTAL
M F M F M F M F M+F
Married 435 98 279 69 355 173 1069 340 1409Single 119 30 134 22 201 69 454 121 575No Response 12 3 - - - - 12 3 15
Sub-Total 566 131 413 91 556 242 1535 464
Total 697 504 798 1999 1999
Figure 13. Survey – Table of Age Ranges
Age Jakart a Bandung Yogjakarta Total Total M + F
M F M F M F M % F % M+F %
<20 11 7 27 8 39 24 77 5.02 39 8.41 116 5.8021 - 30 113 31 174 23 260 99 547 35.64 153 32.97 700 35.0231 - 40 218 40 117 29 131 65 466 30.36 134 28.88 600 30.0241 - 50 155 43 72 22 67 32 294 19.15 97 20.91 391 19.5651 - 60 58 8 20 9 46 16 124 8.08 33 7.11 157 7.85
>60 11 2 3 - 13 6 27 1.76 8 1.72 35 1.75
Sub-Total 566 131 413 91 556 242 1535 100 464 100 1999 100
Total 697 504 798 1999
Figure 14. Survey - Table of Married Respondents and Dependents
Number of Jakart a Bandung Yogjakarta Total Total M + F
Dependents M F M F M F M % F % M+F %
None 9 10 6 - 7 5 22 2.94 15 6.12 37 3.721 42 12 27 10 23 17 92 12.28 39 15.92 131 13.182 154 31 104 24 83 46 341 45.53 101 41.22 442 44.473 105 24 71 15 118 51 294 39.25 90 36.73 384 38.634 69 14 40 6 69 31 178 23.77 51 20.82 229 23.045 33 4 21 8 35 15 89 11.88 19 7.76 108 10.87
>5 23 3 10 6 20 8 53 7.08 11 4.49 64 6.44
Sub-Total 435 98 279 69 355 173 749 100 245 100 994 100
Total 533 348 528 994
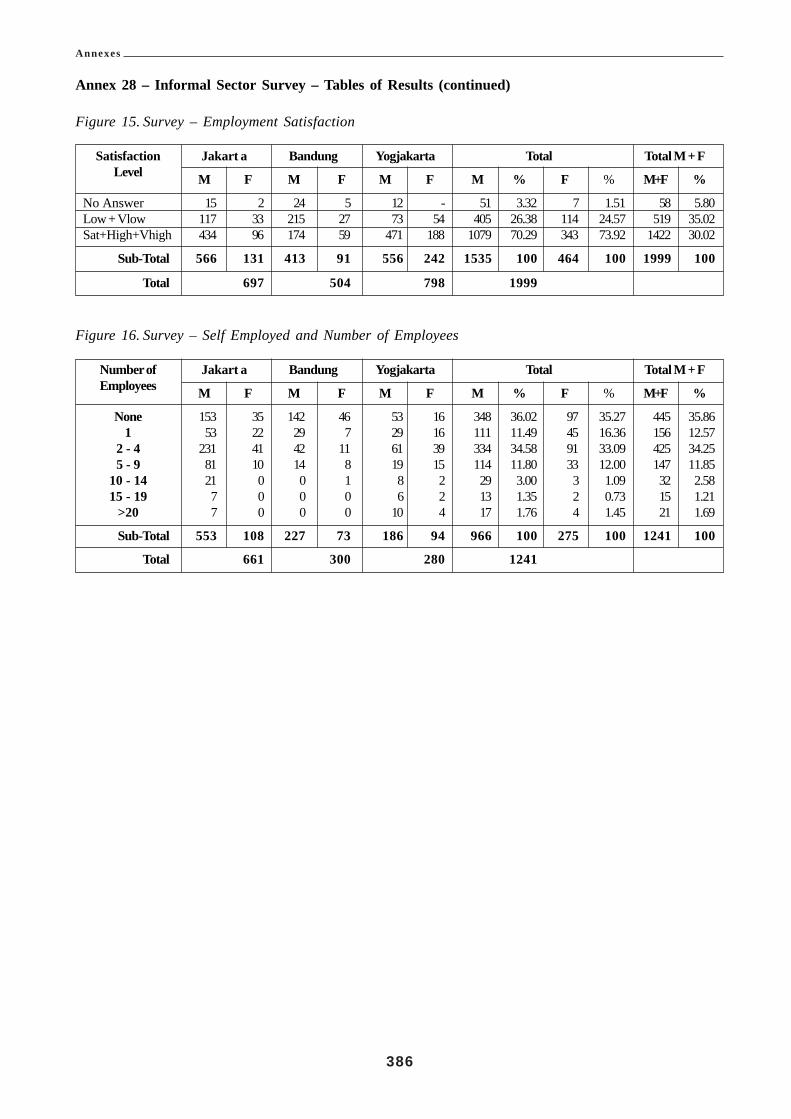
Annexes
386
Annex 28 – Informal Sector Survey – Tables of Results (continued)
Figure 15. Survey – Employment Satisfaction
Satisfaction Jakart a Bandung Yogjakarta Total Total M + F
Level M F M F M F M % F % M+F %
No Answer 15 2 24 5 12 - 51 3.32 7 1.51 58 5.80Low + Vlow 117 33 215 27 73 54 405 26.38 114 24.57 519 35.02Sat+High+Vhigh 434 96 174 59 471 188 1079 70.29 343 73.92 1422 30.02
Sub-Total 566 131 413 91 556 242 1535 100 464 100 1999 100
Total 697 504 798 1999
Figure 16. Survey – Self Employed and Number of Employees
Number of Jakart a Bandung Yogjakarta Total Total M + F
Employees M F M F M F M % F % M+F %
None 153 35 142 46 53 16 348 36.02 97 35.27 445 35.861 53 22 29 7 29 16 111 11.49 45 16.36 156 12.57
2 - 4 231 41 42 11 61 39 334 34.58 91 33.09 425 34.255 - 9 81 10 14 8 19 15 114 11.80 33 12.00 147 11.85
10 - 14 21 0 0 1 8 2 29 3.00 3 1.09 32 2.5815 - 19 7 0 0 0 6 2 13 1.35 2 0.73 15 1.21
>20 7 0 0 0 10 4 17 1.76 4 1.45 21 1.69
Sub-Total 553 108 227 73 186 94 966 100 275 100 1241 100
Total 661 300 280 1241

Annexes
387
Annex 29 Transaction Costs Based on Maximum Contributions
This annex attempts to show what the Minimum costs per customer or transaction would be if the collection ofcontributions was 100% of the active members of Jamsostek. In reality this is probably not achievable and a morerealistic international standard is 85% of contributions collected each month. The number of Active employers in2001 was 74,966 and figure 43 shows the number of claims processed over the past four years. The averagenumber of claims processed per year is about 641,799.
In the absence of a suitable transaction costs it is proposed to calculate a broad estimate based on the two coreclient functions of contribution collections and payment of claims. It is assumed that the all other functions andtransactions in Jamsostek support these core functions.
The transaction cost formula is based on the following elements:• The total administrative costs of Jamsostek,• The number of employers (annualised contribution transactions by the active employers), and• The average number of separations from the aged benefits fund or claims per year.
Figure 1. Number of Withdrawals of Old Age Benefits and Death Benefit Payments
Claims Processed (Withdrawals) 1998 1999 2000 2001(first half)
Attaining Age of 55 33,657 33,650 34,085 19,139Leaving the Country 2,889 2,178 689 577Decease of Natural Causes 12,081 10,742 9,382 6,982Decease from Work Injury 1,563 1,376 1,283 635Total and Permanent Disability 351 58 38 22Laid Off after 5 years and 6 months contribution 493,131 610,791 632,055 316,242
Totals 543,672 658,796 677,532343,598
Full year =687,196
Assuming that a monthly employer contribution and a claim for benefit are of about equal work value then a roughcost per key transaction could be obtained by the following formula:
1.4(Jamsostek Adminitrative Costs)
(Annual employer contribution activity + (Average annual Claims)
(246,200,000,000)= (159,725) Rp per transaction
(74,966 x 12) + (641,799)
The annual transaction cost of 159,725 per year can be apportioned at Rp. 93,219 per year for an employercontribution and Rp. 66,505 for each claim processed. This cost estimate for contributions is based on an averageemployer contribution group size of about:
(9,300,000) active members = (124) employees per active employer
(74,966) active employers

Annexes
388
Annex 29 - Transaction Costs Based on Maximum Contributions (Cont)
Figure 2. Summary of Estimated Transaction Costs in Jamsostek
Estimated Key Transaction Costs Monthly (Rp) Yearly (Rp)
Employer contributions(12 contributions per year) 7,768 93,219Payment of Retirement claims 66,505(each claim)
Individual Employee Contribution cost 63 751(based on average of 124 employees per employee)
The average monthly salary for Jamsostek contributions is Rp. 480,000 for males and Rp. 360,000 for females.The majority of formal sector workers declare < Rp. 400,000 per month157.
Jamsostek Average Monthly contributions for males are:Age Insurance (incl death benefit) Rp. 28,800 (employer pays 2/3)Health Insurance Rp. 14,400 single, Rp. 28,800 married (employer pays all).Work Injury Rp. 1200 – Rp. 8400 depending upon industry. (Employer pays all).
The average JAMSOSTEK contributor pays 2% of average salary for these services and the employer pays theremainder.
Figure 3. Average Member Contributions to Jamsostek
Contributor Male Female
Married Single Single
Average Employee Contribution 9,600 9,600 7,200Average Employer Contribution (incl health Ins and dependingupon industry for Work Injury Ins.) 49,200 – 56,400 34,800 – 42,000 36,400 – 43,600
Total 58,800 – 66,000 44,400 – 51,600 43,600 – 50,800
Total Excluding Health Insurance 30,000 – 37,200 30,000 – 37,200 29,200 – 36,400
The potential administrative cost per employee of collecting contributions (with health insurance) and based onthe above findings is about 1.13% to 1.72% of contributions. This result assumes that all contributions are collectedfrom the 74,699 employers on behalf of about 9.3 million members.
157 Source Jamsostek IT Department August 2001, See Annex 2

389
Bibliography
BIBLIOGRAPHYAuthors
Department Tenaga Kerja R.I.
(Department of Manpower
and Transmigration)
BPS (Statistics Indonesia)
Economics Intelligence Unit
ILO
No
1
2
3
4
5
6
7
8
9
10
11
12
13
14
15
16
17
18
19
20
21
22
23
24
25
26
27
28
29
30
31
32
Title
Profil Ketenagakerjaan Indonesia Tahun 1999. (Manpower profile in Indonesia 1999)
The laws and Regulations of The Republic of Indonesia on The Employees’ Social Security
Human Resource Profile in Indonesia, November 2000Manpower & Employment Situation
in Indonesia 1998 – 1999 (pub. 2000)
Manpower Information Systems Master Plan
Human Resource Profile in Indonesia, November 2000
Labour Force Situation in Indonesia August 2000
1996 Economic Census – Profile of Establishments with Legal Entity
Expenditure for Consumption 1996 and 1999
National Income of Indonesia 1996 to 1999
National income of Indonesia 1997-2000, 2001
Labour Force Situation in Indonesia August 2000 (Provisional).
Poverty Reduction Strategy in Indonesia. 2001
Monthly Statistical Bulletin, Economic Indicators, April 2001
Labour Force Situation in Indonesia August 2000, (2000 National Labour Force Survey)
Labourers/employees situation in Indonesia, August 2000, (2000 National Labour Force
Survey)
Preliminary results of 2000 Census, December 2000
Profile of establishment with legal entity (1996 economic census), 2000
Statistical Year Book of Indonesia 1999
Estimasi Fertilitas Mortalita dan Migrasi – Hasil Survei Penduduk Anatar Sensus 1995
Statistik upah triwulanan (Wage statistics), 2000
Country Profile 2000: Indonesia
Country Report, Country Forecast, May 2001
Social Security for the Excluded Majority – Case studies of developing countries – Edited by
Wouter van Ginneken
Framework For ILO Technical Assistance, Labour Migration From Indonesia, August 2001
by M. Abela
Extension of Social Security Protection to the Self Employed Workers – ILO Study, Malaysia
1999
Decent Work & the Informal Economy (Report VI) – ILC 90th Session 2002
Conclusions Concerning Decent Work in the Informal Economy – ILO 2002
Seapat working paper – Providing Information to outgoing Indonesian Migrant Workers.
Graeme Hugo and W.R. Bohning ILO 2000
Seapat working paper – Protecting Indonesian migrant workers, with special reference to
private agencies and complaints and procedures. Dec 1998 Carmelo Noriel and W.R. Bohning
ILO
International Migration Papers – Emigration Pressures and structural change. Case study
Indonesia. 1997, Deepak Nayyar ILO
Irregular Migration in S.E. Asia: Dynamics, Policies and Protection Jan 2000. Yulfita Raharjo

390
Bibliography
Authors No Title
ISSA
Carunia Mulya Firdausy
33
34
35
36
37
38
39
40
41
42
43
44
45
46
47
48
49
50
51
52
53
54
55
56
57
58
59
Providing material for the development of information to be made available to potential
international labour migrants from Indonesia - The Centre for Population and Manpower
Studies, Indonesian Institute of Sciences. In collaboration with ILO, March 2000
Learning From Experience – A gendered approach to social protection for workers in the
informal economy – Frances Lund and Smita Srinivas.
Review of the migrant Workers Management and Options for further development Assistance
to the Program, Nov 2001 – ILO Jakarta office.
Workers Education Assistance in Strengthening Trade Union support for Workers in the
Informal Sector in Selected ASEAN Countries – CTA Uffe Elbaek July 2001
Financing Micro-Insurance: Perspective and Prospective David M. Dror.
The Indonesian Poverty Reduction Strategy Paper: An ILO perspective. Oct 2002. ILO
Jakarta and Geneva.
Extension of social security protection to the self-employed workers – ILO study Malaysia
1999
Out of The Shadows, Practical Actions for the Social Protection of Homeworkers in Indonesia
– Lucita Lazo ILO 1996
Indonesian Healthcare Reform (1988-99), The Health Sector Finance Project and Klaten Field
Trial Revisited - James R. Marzolf
SME clusters in Indonesia - An analysis of growth dynamics and employment conditions,
ILO Jakarta October 2002
Report to the Government on Social Protection in Indonesia 1993
Restructuring of the Social Security System in Indonesia, December 1999
Economic Challenges of the Indonesian Economic Crisis. June 1998Economic Crisis, Gender,
and Employment in Indonesia August 1999.
Malaysia - Report to the Government on the Employees Pension Scheme and the Social
Security Scheme for the Self-employed 2000
Restructuring of the social security system in Indonesia, December 1999
Report to the Government of Indonesia on the planning and administration of social security
(INS/78/022), 1985
Extension of social security protection project (Pensions planning component) Project findings
and recommendations (INS/86/022), 1989
Actuarial report to the Government of Indonesia on the social security pension scheme (INS/
86/022), 1988
Extension of social security protection project (Health insurance development) : Project
findings and recommendations (INS/86/022(2)), 1990
Technical actuarial note on social security health insurance in Indonesia (INS/86/022), 1990
Report to the Government on social protection in Indonesia, 1993
Restructuring of the social security system in Indonesia (ILO/TAP/Indonesia/R.20), 1999
Employment Challenges of the Indonesian Economic Crisis, ILO Jakarta 1998
Bailey, C. and Scholz, W. (1998), “Economic crisis 1997/1998 and its impact on social
protection”, ILO.
(1998), “Social Security World-wide 1997/98”
Role of the Informal Service sector in urban poverty Alleviation in Indonesia

391
Bibliography
Authors No Title
UDAID
Sentanoe Kertonegoro,
Sentanoe Kertonegoro,
Awaloedin Djamin
Partnership for Economic
Growth & BAPPENAS
UNSFIR
Asian Development Bank
National planning Agency
(Bappenas)
Central Bureau of Statistics
Deuster, P.R
.
Pradhan, M., A. Suryadi, S.
Sumarto and L. Pritchett
World Bank
ADB
60
61
62
63
64
65
66
67
68
69
70
71
72
73
74
75
76
77
78
79
Urban Poverty in Indonesia :Trends, Issues and Policies, Asian Development Review, vol.
12, no. 1, ADB, Manila, 1994
Assessment and Lessons Learned from the Klaten Integrated Health Care Reform Field Trial,
1999
Health Sector Financing Project, Amendment Proposal for 1993-1995, November 1992. Jakarta
Indonesia: Health Sector Financing Project Paper, February 1988. Jakarta
Social Security Profiles in ASEAN Countries
Social Security for the People’s Welfare
Journal of Population Vol5 No. 2 1999
Comparison of Social Security in ASEAN Countries
Social Security Profiles in ASEAN Countries
Social Protection Programs: Components, Priorities, Strategic Choices and Alternatives for
Indonesia. Oct 2002, Stuart Callison and Bambang Widianto.
The Social Implications of the Indonesian Economic Crisis, Perception & Policy
2000. Poverty Assessment of Indonesia, February 14.
Poverty Reduction at Intermediate Level : The Roles of Local Government, Paper Presented
at Seminar on Renewing Poverty Reduction Strategy in Indonesia Bakti Setiawan, 2000.,
August, 2000. Jakarta
National Planning Board (2001), “Report on macroeconomic development up to the first
quarter of year 2001 and economic growth projection for the year 2001”.
Laporan Perekonomian Indonesia 2000 : Angkatan Kerja, Konsumsi dan Kemiskinan Penduduk,
BPS, Jakarta
Survey of Recent Developments, Bulletin of Indonesian 2002, Economic Studies, vol. 38, No.
1, pp. 5-37.
Measurement of Poverty in Indonesia, 1996, 1999 and Beyond, SMERU, Working Paper,
Jakarta, 2000
Indonesia: Accelerating recovery in Uncertain Times, Brief for the Consultative Group on
Indonesia, report No. 20991-IND, October 13, 2000
Indonesia :From Crisis to Opportunity, 21 July 1999.
Reform of Pensions and Provident Funds Indonesia Vol VIII: Pillar 1 Analysis – Flat Benefits
and Earnings Related, August 2000.

392
Bibliography
Authors No Title
Bambang Purwoko
Frances Lund, Smita Srinivas
PT Jamsostek
Satish Mishra
UNDP
IMF
ISSA
The World Bank
Adrian Panggabean, Bambang
Broojonegoro, Martin
Pangabean
United Nations
80
81
82
83
84
85
86
87
88
89
90
91
92
93
94
95
96
97
98
99
100
101
102
Towards a Social Security Reform: The Indonesian Case
Learning from Experience. A gendered approach to social protection for workers in the
informal economy
Systems and Procedures Manual KEP/45/042000
Annual Report 1999 and 2000
Jamsostek Company Profile
The Laws and Regulations of The Republic of Indonesia on the Employees’ Social Security
Jamsostek, A New Beginning
Jamsostek (ed.), “The Laws and Regulations of the Republic of Indonesia on the Employees’
Social Security” (including Law No. 3 of 1992, Government regulation No. 14 of 1993,
Presidential decree No. 22 of 1993, Minister of Manpower regulation PER-05/MEN/1993,
Government regulation No. 36 of 1995)
Regulation on management and fund investment of Jamsostek (No. 28 of 1996)
Pension funds Act (Law 11 of 1992)
Decision of the Minister of Finance on the legalization of the technical reserve of PT Astek
until the year 1992 (S.1101/MK.17/1994)
Decision of Jamsostek on the establishment of technical reserves for the health care programme
(KEP/330/0997)
Factbook, 1996
The Social Implications of the Indonesian Economic Crisis:- Perception and Policy 1999
UNDP Programme 2001
Indonesia Selected Issues. IMF 2000
Fiscal Affairs Department - Indonesia: Blueprint for a Comprehensive Pensions System 21
July 1992
IMF, “Indonesia: Statistical Appendix”, October 2000, IMF Staff Country Report No 00/
133
Pensionable Ages for Men and Women: Implications, Current Situation and Future Directions
Part 2 - Meeting of directors of social security organizations in Asia and the Pacific November
1999.
The Indonesian Pension System - Structure, Policy and Implementation January 1996
The First Steps Towards Recovery June 1998
Notes on Economic & Social Dimensions of Adjustment in Indonesia & Possible U.N. Responses
1998
United Nations, “World Population Prospects (The 2000 Revision)”, 2001.

393
Bibliography
Authors No Title
J. Marzolf
Asia Market Intelligence, Ltd
C.N. Johnson, F.A. Duncan,
Jr., D. Hotchkiss, S. Jacobalis,
J.R. Marzolf, R. Noor, C.
Rice,
Dunlop, David W, et al
Emmet, William R. andWilliam McGreevey
Emrey, Robert, and CharlotteLeighton
Gani, Ascobat, Yaslis Ilyasand M. Fikri
103
104
105
106
107
108
109
110
111
112
113
114
115
116
117
118
119
120
121
122
An Integration Strategy for the HSF Project. A Proposal., International Science & Technology
Institute 1993
JPKM Regulatory Needs Analysis: Preliminary Assessment of Workload, Logistics, and
Budgetary Requirements December 1997
Technical Brief: Global Integration Strategy for the Health Sector Financing Project. November
11, 1991
Determination of the JPKM Basic Benefit Package for the Klaten Integrated Field Trial, July
13, 1994
JPKM Regulation in the Klaten Integrated Field trial: A Tactical Work Plan, August 1, 1994
The Klaten Integrated Field Trial: Implementation Plan for the JPKM Regulatory System.
August 3, 1994
Socio-economic Analysis and Financial projections for the Klaten Field Trial, August 9, 1994
The Klaten Integrated Field Trial (1994-1996): Evaluation of Results and “Lessons Learned”,
April 17, 1996
Risk Profit Sharing Management Techniques, A Brief Overview, April 27, 1996
Inter Regional Cross Subsidization Through MOH Budget Reallocations: A Brief Overview,
June 6, 1996
Risk Based Cross Subsidization: Methods and Management Techniques: A Brief Overview,
June 11, 1996
Transition of Traditional Dana Sehat Schemes into JPKM Purchasing Cooperatives: A
Conceptual Review, August 3, 1996
Perspective: Health Sector Reform in Indonesia: The Klaten Integrated Field Trial 1994-1997,
January 1998
The Klaten Integrated Field Trial: Implementation Plan for the JPKM Regulatory System, J.
Marzolf, August 1994
Consumer Attitude and Behaviors Regarding the Managed Care (Dana Sehat JPKM) Health
System in Klaten: A Qualitative Market Research Report. November 1996. Jakarta
Assessment and Lessons Learned from the Klaten Integrated Healthcare Reform Field Trial
and the Current Economic Crisis and USAID Strategic Planning Options for Health Care
Reform, September 1998
Midterm Evaluation of the Health Sector Financing Project. TvT Associates, Washington,
DC, January 1992 (Draft document; not approved by MOH)
Indonesia: Strengthening the Social Safety Net. USAID PHN Sector Strategy 1998 and 1999.The Futures Group International, March/April 1998.
PHR Trip Report: Indonesia, May 28 - June 7, 1997. Partnerships for Health Reform,August 27, 1996.
The Implementation of Indonesian Health Development (JPKM) Rules) by the JPKMOrganizer - BAPEL, A Study Report. Indonesian Community Health Development Foundationand the Directorate of Community Participation Development, The Ministry of Health, TheRepublic of Indonesia, Jakarta, 1998

394
Bibliography
Authors No TitleInternational Science &Technology Institute Inc
PT Prima Adihusada
Kanach Frances A. AndDennis M. Smyth
Knowles, James, PaulTorrens and James Marzolf
Maher, Sheila and David J.McGuire
Ministry of Health
SOMARC and PHR
Torrens, Paul R
Stuart Callison and BambangWidianto
Sidney Jones
Adioetomo, S. M.
Bulan O. and Rajagukguk W.(2000),
idem. (2000)
Demographic Institute ofUniversity of Indonesia(1990)
Fane, G. (1999)
123
124125
126
127
128
129
130
131
132
133
134
135
136
137
138
139140
141
142
143
144
145
146
147
148
Health Sector Finance Project 1998-93, Final Contract Report., (May 1993)
JPKM Members Purchasing Cooperative: Feasibility Study, April 1998Analysis of Health Status and Risk Factors of Clinical Populations, Klaten Integrated HealthCare Reform Field Trial, 1997-1998. 1998. JakartaSwadana-JPKM Budget-Based Cross Subsidy Potential, Klaten Integrated Health Care ReformField Trial, 1997-1998. 1998. JakartaMeasurement of the Quality & Standards of Health Care, Klaten Integrated Health CareReform Field Trial, 1997-1998. 1998. JakartaJPKM Risk-Based Cross Subsidization (A Practical Demonstration), Klaten Integrated HealthCare Reform Field Trial, 1997-1998. 1998. JakartaJPKM Members Purchasing Cooperative - Feasibility Study, Submitted to the U.S. Agencyfor International Development. April 1998. JakartaJPKM Risk-Based Cross Subsidization (A Practical Demonstration), Klaten Integrated HealthCare Reform Field Trial, 1997-1998. 1998. JakartaRational Drug Use - Experience in the Klaten Integrated Health Care Reform Field Trial,1994-1998. 1998. Jakarta.
Private Health Sector Development and the Use of USAID Credit Mechanisms in Klaten,Central Java. Final Report. March 1996. Jakarta
Indonesia: Development of an Implementation Work Plan for the Klaten Managed CareProject. 1997. Partnership for Health Reform Project. Washington, D.C
Trip Report: Indonesia, July 16 - 26, 1996. SOMARC, The Futures Group International,Washington D.C
Final Report on the Results of an Internal Mid-Term Evaluation of the Health Sector FinancingProject. October 21, 1991. JakartaHealth Maintenance Benefits within the Operation of JPKM Programs. Ministerial RegulationNo. 527/MenKes/Per/VII/1993, The Ministry of Health, The Republic of Indonesia, 1993Ministerial Regulation Concerning Jaminan Pemiliharaan Kesehatan Masyarakat Programs,Number 571/Menkes/Per/VII/1993, July 6, 1993. English Translation by Dr. James R. MarzolflJakarta
Proposal for Follow-up on Indonesia’s Health Financing Pilot in Klaten, (No Date)
Brief Descriptive Summary: Dana Upaya Kesehatan Masyarakat (DUKM). July 27, 1987Indonesia: JPKM/Managed Care: The Status of Regulatory Needs and Compliance in Indonesia,PHR Trip Report: July 4-31, 1997Structure and Function of JPKM Regulatory System
Social Protection Programs: Components, Priorities, Strategic Choices and Alternatives forIndonesia. Oct 2002,
Making Money off Migrants – The Indonesian Exodus to Malaysia. 2000
“The Demographic Dimension of Family Changes in Indonesia”, Journal of Population vol. 5no 1.
“Scientific Report 1: Population Projection of Indonesia in 1995-2025”, Demographic Institute,University of Indonesia.
“Scientific Report 7: The Analysis of income and poverty in Indonesia”, Demographic Institute,University of Indonesia.
“Demographic Transition in Indonesia – a projection into the year 2020”, Population ProjectionSeries No.1.
Indonesia Economic Policies and Performance, 1960-1998