social origins of good ideas - analytic technologies
TRANSCRIPT

Social Origins of Good Ideas
October, 2002
© Ronald S. Burt
University of Chicago and Raytheon CompanyAddress: Graduate School of Business, University of Chicago, Chicago, IL 60637;
(773-702-0848; [email protected]; http://gsb.uchicago.edu/fac/ronald.burt)
Author Note — This is a draft manuscript, portions of which were presented in workshops at the RussellSage Foundation, the Stanford Graduate School of Business and the University of Texas at Dallas. I amgrateful to Christina Hardy for her assistance on the manuscript and to the following colleagues forcomments affecting the final text: William Barnett, James Baron, Jonathan Bendor, Chip Heath, RachelKranton, James Rauch, and Jeffrey Pfeffer.
Social Origins of Good IdeasThis paper is about social structure defining an advantage in creating good ideas,and people reproducing the social structure as they discuss their ideas. Myhypothesis is that people who live in the intersection of social worlds are at higherrisk of having good ideas. Qualifications come immediately to mind, but the gistof the hypothesis is familiar and makes intuitive sense: ways of thinking andbehaving are more homogenous within than between groups, so peopleconnected to otherwise segregated groups are more likely to be familiar withalternative ways of thinking and behaving — which gives them the option ofselecting and synthesizing alternatives. I describe anecdotal and aggregateevidence consistent with the hypothesis, but my purpose in this paper is to studythe hypothesis in finer detail at the level of individual managers, linking ideas withnetwork measures of social capital known to be associated with managerperformance. I use archival and survey data on 673 managers in the supplychain of a large American electronics company in 2001 to show howcompensation, positive performance evaluations, promotions, and good ideaswere disproportionately in the hands of managers rich in the social capital ofbrokering connections across structural holes. Managers whose networks moreoften spanned structural holes were more likely to express their ideas, less likelyto have their ideas dismissed by senior management, and more likely to havetheir ideas evaluated as valuable. Having a good idea is distinct from doingsomething with it. Managers typically discussed their ideas with sociallyconvenient authority, thus reproducing the social structure. Good ideas emergedfrom the intersection of social worlds, but spread in a way that would continuesegregation between the worlds.
There are internal and external factors in the origins of good ideas. Internal factors are
the more immediate: you encounter a good idea and attribute to its source intellectual
ability, a fresh perspective, a productive way of thinking, a creative personality, or
some other quality of the individual that enabled him or her to generate the good idea.
Beyond the individual are external factors, qualities of the social context around the
individual that constitute an advantage in generating good ideas. Some external
factors are renovations of the internal. Age is a personal attribute negatively
associated with creating good ideas in science (e.g., Stephan and Levin, 1992, for

DRAFT MANUSCRIPT — The Social Origins of Good Ideas, Page 2
review), but beyond the internal factors of youthful energy and skills is the social factor
of a new generation less invested in the prevailing paradigm (Kuhn, 1962; bluntly
phrased in Planck's, 1949:33, comment: "a new scientific truth does not triumph by
convincing its opponents and making them see the light, but rather because its
opponents eventually die"). Of course, the external exists in its own right. A
magisterial example is Collins (1998) describing prominent philosophical ideas traced
back to the social structure around the people who proposed the ideas.
This paper is about external factors. It is about social structure defining an
advantage in creating good ideas, and people reproducing the social structure as they
discuss their ideas. The sociological hypothesis argued here could be used to
advantage in distinguishing cognitive structures prone to creativity, however that
argument is for another paper. Here I focus on the social structures in which good
ideas disproportionately occur.
The setting is illustrated in Figure 1. Dots are people or groups. Lines are
relations. The dots and lines are a network sociogram. The sociogram in Figure 1
shows a bridge-and-cluster structure: people sharing a specialization are densely
connected within a cluster, and clusters are integrated across the network by
occasional bridge relations between clusters. I enlarged a segment in Figure 1 to
highlight four clusters: A, B, and C are groups in the usual sense of cohesion indicated
by relations more dense within than beyond the group (density table shows average
relations within and between groups), and D is a cluster defined by structural
equivalence rather than cohesion among its members (density table shows that people
in cluster D have stronger relations with group C than with one another). Whatever the
level of analysis — communities or nations in geographic clusters, people in project
groups, or bits in a cognitive cluster — the bridge-and-cluster structure is found in a
wide variety of circumstances (Watts and Strogatz, 1998). People specialize within
clusters, build bridges to integrate across clusters. The setting is a generic division of
labor familiar from Durkheim (1893), but focused on network structures within and
between cluster specializations. Work on factors responsible for the emergence of
such structures is illustrated in economics by Becker and Murphy (1992) on the
incentives to integrate rather than specialize, and in sociology by Feld (1981) on the
DRAFT MANUSCRIPT — The Social Origins of Good Ideas, Page 3
social foci responsible for network clusters, building on Festinger, Schachter, and
Back's (1950) analysis of location effects in network formation and Blau's (1977) work
on the parameters of social structure.
An analytical implication of bridge-and-cluster structures is the two leadership
roles illustrated by Robert and James in Figure 1. James illustrates the network
principle of cohesion, or network closure. The people with whom James discusses
work are densely connected with one another within the same cluster. James is
positioned to better integrate people sharing the same specialization. Robert
illustrates the network principle of brokerage. The people with whom Robert discusses
work are disconnected from one another across multiple clusters. Robert is positioned
to integrate across specializations.
——— Figure 1 About Here ———
Belief and behavioral implications of the analytical duality illustrated by Robert
and James have been the subject of extensive work — for example, Merton (1948a)
and Katz and Lazarsfeld (1955) on the diffusion of tastes through cosmopolitan
"opinion leaders" whose relationships bridge the gaps between social worlds (cf. Burt,
1999), Milgram (1967; Travers and Milgram, 1969) on the "small world" phenomenon
in which people at great geographic remove can communicate with one another
through surprisingly few intermediaries because of bridges between social worlds (cf.
Watts, 1999), Granovetter (1973) on the critical role that "weak ties" would play in
information access and flow if bridge relationships were weak rather than strong
relationships, Burt (1982, 1992) on the information access and control advantages
created when networks span the "structural holes" between social groups, or Padgett
and Ansell (1993) on the "robust action" made possible when networks span the
structural holes between groups.
One can see a broad theme in this work: information, beliefs, and behaviors are
more homogeneous within than between groups. Most people focus on activities
inside their own group, which creates holes in the flow of information between groups,
or more simply, structural holes. People with contacts in separate groups are in a
position to broker the flow of information across structural holes. Brokerage is social
capital in that brokers have a competitive advantage in creating value with projects

DRAFT MANUSCRIPT — The Social Origins of Good Ideas, Page 4
that integrate otherwise separate ways of thinking or behaving. Consistent with the
social capital prediction, managers with networks that span structural holes tend to
receive more positive performance evaluations, faster promotions, higher
compensation, and participate in more successful teams (Burt, 2000, for review).
Brokerage opens up opportunities for people to create value, but the value only
happens if people act on their opportunities. Beyond work reporting a correlation
between brokerage and performance lies work on processes by which people harvest
the value buried in structural holes. Having contacts in other groups can be an
advantage in recognizing and implementing valuable projects, which then results in the
observed correlation between brokerage and performance (e.g., Burt, 2002).
Processing and distributing information is the key to the association. Imagine
four levels of brokerage by which a person could create value by spanning the
structural hole between two groups: The simplest act of brokerage is to make people
on both sides of the hole aware of interests and difficulties in the other group; so much
conflict and confusion in organizations seems to result from misunderstandings of the
constraints on colleagues in other groups. Transferring best practice is a higher level
of brokerage. People familiar with activities in two groups are better able than people
confined within either group to see how a belief or practice in one group could create
value in the other, and to know how to translate the belief or practice into language
digestible in the target group. A third level of brokerage is to draw analogy between
groups ostensibly irrelevant to one another. Something about the way in which those
people think or behave has implications for the value of operations in my group. This
step can be difficult for people who have spent a long time inside one group. Such
people often look for differences between themselves and others to justify their
assertion that "our situation is different" so they can feel comfortable ignoring beliefs
and behaviors different from their own. Differences can always be found if one wants
to find them. The question is whether there are by analogy elements of belief or
practice in one group that could have value in another. Synthesis is a fourth level of
brokerage. People familiar with activities in two groups are more likely to see new
beliefs or behaviors that combine elements from both groups.1
DRAFT MANUSCRIPT — The Social Origins of Good Ideas, Page 5
A conclusion across the stories one could tell about the relevance of these four
levels to specific industries or organizations is that brokers are critical to learning and
creativity. People whose networks span structural holes have early access to diverse,
often contradictory, information and interpretations which gives them a competitive
advantage in delivering good ideas. To be sure, ideas come over a variety of paths
from a variety of sources (e.g., Von Hippel, 1988; Geroski and Mazzucato, 2002), but
idea generation at some point involves a broker moving knowledge from this group to
that or combining bits of knowledge across groups. People connected to groups
beyond their own can expect to find themselves delivering valuable ideas, seeming to
be gifted with creativity. This is not creativity born of deep intellectual ability. It is
creativity as an import-export business. An idea mundane in one group can be a
valuable insight in another. Value is defined by the idea recipient, not its source. An
idea is no less valuable to its recipients because there are people elsewhere who do
not value it. The certain path to feeling creative is to find a constituency more ignorant
than yourself. This is a familiar phenomenon in academic work. We specialize in
certain methods, theories, and topics. It is impossible to keep up with developments in
all specialties. It would be inefficient if it were possible. We appreciate the visitor,
familiar with developments in a distant speciality, who shows how those developments
can add value to our own work. In sum, my hypothesis is that good ideas come
disproportionately from people whose networks span structural holes.
ANECDOTAL EVIDENCE
Evidence for the hypothesis can be found in the opinions of prominent creatives. In an
often-cited lecture on the influence of commerce on manners, Adam Smith (1766, 539)
noted that; “When the mind is employed about a variety of objects it is some how
expanded and enlarged.” Swedberg (1990, 3) begins his book of interviews with
leading academics working across the boundary between economics and sociology
with John Stuart Mills’ (1848, 581) opinion: “It is hardly possible to overrate the value .
. . of placing human beings in contact with persons dissimilar to themselves, and with
modes of thought and action unlike those with which they are familiar. . . . Such
DRAFT MANUSCRIPT — The Social Origins of Good Ideas, Page 6
communication has always been, and is peculiarly in the present age, one of the
primary sources of progress.” Jean-René Fourtou, former CEO of the French
chemical giant Rhône-Poulenc, observed that his scientists were stimulated to their
best ideas by people outside their own discipline. Fourtou emphasized le vide —
literally, the emptiness; conceptually, what I have discussed as structural holes — as
essential to creative work (Stewart, 1996, 165): “Le vide has a huge function in
organizations. . . . Shock comes when different things meet. It’s the interface that’s
interesting. . . . If you don’t leave le vide, you have no unexpected things, no
creation. There are two types of management. You can try to design for everything,
or you can leave le vide and say, ‘I don’t know either; what do you think?’” Biochemist
Alex Zaffaroni is an exemplar. A former subordinate is quoted in an INSEAD video
case explaining Zaffaroni's value to his organization: ". . . he is reading and thinking
very widely. He is totally unafraid of any new technology in any area of human
creativity. He has wonderful contacts with people in many different areas, so he sees
the bridges between otherwise disparate fields."2
Archives on historical figures describe brokerage and ideas in wider perspective.
For example, Caro (1982, Chapter 15) describes Lyndon Johnson’s creation of a
Washington power base in 1933 from the “Little Congress,” through which he brokered
connections between journalists and prominent people in government. Dalzell (1987,
Part I) describes Francis Lowell's role as broker in creating the American cotton
industry. DiMaggio (1992, especially 129-130) describes Paul Sachs role as broker in
establishing the Museum of Modern Art in New York; “Sachs could employ his talents
precisely because his strong ties to sectors that had previously been only weakly
connected — museums, universities, and finance — placed him at the center of
structural holes that were critical to the art world of his time.” Padgett and Ansell
(1993) describe Cosimo de Medici‘s use of his contacts with opposing elite family
factions to establish his Medicean political party in Renaissance Florence. McGuire
and Granovetter (forthcoming) describe Samuel Insull’s use of his network of contacts
in finance, politics, and technology to shape the electric utility industry at the turn of the
century (cf. Sediatis, 1998, especially 373-374, on the greater flexibility, adaptability,
and volume of business in Russian commodity markets created by organizers who had

DRAFT MANUSCRIPT — The Social Origins of Good Ideas, Page 7
little previous contact with one another, and Granovetter, 2002, on polycentric
networks facilitating economic cooperation).
In his panoramic analysis of the history of philosophy, Collins (1998) presents
sociograms of the intergenerational social networks among philosophers to illustrate
his argument that the philosophers of greatest repute tend to be personal rivals
representing conflicting schools of thought for their generation (Collins, 1998, 76); “The
famous names, and the semi-famous ones as well who hold the stage less long, are
those persons situated at just those points where the networks heat up the emotional
energy to the highest pitch. Creativity is the friction of the attention space at the
moments when the structural blocks are grinding against one another the hardest.”
AGGREGATE EVIDENCE
There is also evidence at the aggregate level of organizations. In particular, it has
been popular to study the ways in which technological change affects social structure
at the same time that social structure affects technological advance (e.g., Barley,
1990, 92-95, provides crisp illustration with network data). Electronics and
biotechnology have been favored research sites, with Walter Powell (e.g., Powell and
Brantley, 1992; Powell, Koput and Smith-Doerr, 1996; Powell et al., 1999; Koput and
Powell, 2000) and Toby Stuart (Stuart, 1998; Stuart, Hoang and Hybels, 1999; Stuart
and Podolny, 1999; Stuart and Robinson, 2000) prominent ports of entry into the work.
More generally, Kogut (2000) builds on a series of studies (e.g., Shan, Walker and
Kogut, 1994; Zander and Kogut, 1995; Kogut and Zander, 1996; Walker, Kogut and
Shan, 1997) to propose a network theory of the firm in which value is derived from a
firm’s ability to create and lay claim to knowledge derived from its membership and
participation in networks (cf. Nahapiet and Ghoshal 1998, on social capital and
knowledge; Powell and Smith-Doerr, 1994, on information issues in the economic
sociology of networks, especially with respect to interorganization networks).
Structural holes are a correlate of organizational learning, often discussed in terms of
an organization’s ability to learn — what Cohen and Levinthal (1990, 128) describe as
an organization’s absorptive capacity: “the ability of a firm to recognize the value of

DRAFT MANUSCRIPT — The Social Origins of Good Ideas, Page 8
new, external information, assimilate it, and apply it to commercial ends,” which can be
studied in terms of industry factors that facilitate absorption (e.g., Cohen and Levinthal,
1990) and external networks that enhance an organization’s absorptive capacity (e.g.,
Cockburn and Henderson, 1998; see Knoke, 2001, 362ff. for review).
Organizations with management and collaboration networks that more often
bridge structural holes in their markets learn faster and are more productively creative.
Sutton and Hargadon (1996) describe processes by which a firm, IDEO, used
brainstorming to create product designs, and then clarify in Hargadon and Sutton
(1997) the brokerage function served. The firm’s employees work for clients in diverse
industries. In the brainstorming sessions, technological solutions from one industry
were used to solve client issues in other industries where the solutions are rare or
unknown. The firm profited, in other words, from employee bridge relations through
which they brokered the flow of technology between industries (cf. Allen and Cohen,
1969, on gatekeepers; Lazega and Pattison, 2001, on network management of the
status auction). Fleming (2002) describes a similar process within Hewlett-Packard:
policy was to move engineers between projects rather than having each project hire
and fire individually. The result was that HP technologies were constantly being mixed
in new combinations. As a senior engineer described the experience (Fleming,
2002:1073): "I had to work in a single field for only two or three years and then like
magic it was a whole new field; a paradise for creativity."
Drawing comparisons across companies, McEvily and Zaheer (1999) report
greater access to competitive ideas for small manufacturers with more non-redundant
sources of advice beyond the firm (and McEvily and Marcus, 2002, show lower
absorptive capacity when the sales network is concentrated in a single customer).
Stuart and Podolny (1999) report a higher probability of innovation from semiconductor
firms that establish alliances with firms outside their own technological area.
Comparing the biotechnology districts in Minneapolis and Philadelphia, Llobrera,
Meyer and Nammacher (2000) attribute the growth and adaptation of Philadelphia’s
district to its many overlapping but non-redundant networks around organizations in
the district. Ahuja (2000) reports higher patent output for organizations that hold
broker positions in the network of joint ventures or alliances at the top of their industry.

DRAFT MANUSCRIPT — The Social Origins of Good Ideas, Page 9
Baum, Calabrese and Silverman (2000) study Canadian companies in biotechnology
for their growth in revenues, number of patents granted, and the extent to which a
company had multiple kinds of alliance partners at start-up. Companies with a
heterogeneous mix of alliance partners tended to enjoy faster revenue growth, and a
dramatic advantage in obtaining patents. Koput and Powell (2000) report higher
earnings and survival chances of biotechnology firms with more kinds of activities in
alliances with more kinds of partner firms. Lofstrom (2000) asked scientists,
physicians, and engineers how much they learned from their firm’s participation in an
alliance intended to develop or extend a medical device technology. Individuals with a
more non-redundant contacts, especially contacts within their own firm, were more
likely to report that they had “learned a great deal” in the alliance. Podolny (2001)
describes venture-capital firms spanning structural holes by linking co-investors not
otherwise investing together. Firms with a "deal-flow" network more often spanning
structural holes more often invested in early product development — where the
information benefits of spanning structural holes could be a competitive advantage in
detecting potentially valuable ideas — and were more successful in developing their
early-stage investments into profitable IPOs (cf. Beckman and Haunschild, 2002, on
firms with more heterogeneous boards of directors paying lower premiums for
acquisitions; Ruef, 2002, on the tendency for entrepreneurs "attempting to combine
disparate ideas or routines" to discuss their venture with varied kinds of contacts;
Shane and Cable, 2002, on early-stage investors using social networks to decide
between ventures).
SUPPLY CHAIN IN A LARGE ELECTRONICS COMPANY
The cited work offers anecdotal and aggregate evidence consistent with the
hypothesis that brokerage increases the chances of having a good idea. To study the
hypothesis at the level of individual people proposing ideas, I draw on data describing
673 managers who ran the supply chain in 2001 for one of America's largest
electronics companies. This is not a population that comes immediately to mind as a
place to study creativity, but here, as in most walks of life, people vary in the quality of

DRAFT MANUSCRIPT — The Social Origins of Good Ideas, Page 10
their ideas. The study population was going through a leadership change (triggered by
exogenous events). The incoming leadership thought that a web-based network
analysis would be a quick way to become familiar with the current informal
organization of leaders in the supply chain. Changes moving forward would be
facilitated in some ways and inhibited in other ways by the current organization.
Knowing the current organization would be important for thinking about, and
communicating, future strategy.
Idea Data
Managers received an email message from the incoming leadership explaining
the study and directing the recipient to a website containing a short questionnaire that
asked for a brief description of the manager's best idea for improving supply chain
operations: "From your perspective, what is the one thing that you would change to
improve [the company's] supply chain management?" The box into which responses
were typed held a maximum of 2000 characters. The survey elicited 455 ideas.
Any rating of the ideas from good to bad has to take a point of view. An idea
deemed terrific within a group of specialists can be dismissed as trivial outside the
specialty. I return to this issue in the analysis, when I can use the data to speak more
articulately about alternative views, but the research design here was to defer to top
management for evaluations of relative merit. I do not recommend this point of view
for all studies, nor propose it as the best point of view. At the same time, the view
from the top is an eminently reasonable frame of reference: Top management was the
expert panel familiar with business operations. They were the people who would
reward ideas proposed in day-to-day operations. They were the people whose
careers would rise or fall with the value of the ideas they sponsored.
Two senior managers, one from each of the two largest business units, were
asked to evaluate ideas. Both judges were prominent for their experience in running
the supply chain for their respective businesses. Each judge was given a list of the
ideas and the question: "How much value could be generated if the idea were well
executed?" The five-point scale ranged from one defined as "low value or can't say,"
to a score of five defined as "value could be high."

DRAFT MANUSCRIPT — The Social Origins of Good Ideas, Page 11
The judges were under pressure from the incoming leadership to provide quality
evaluations, but rating 455 ideas is a daunting task. It seemed likely that the judges
would fatigue before rating all of the ideas. It also seemed likely that higher-quality
ideas would come from more senior people because they had a broader view across
the bureaucratic silos in the supply chain (illustrated below in Figures 2 and 3). To
guard against unreliable evaluations of the better ideas, ideas were presented to the
judges in random order within two categories: The first 48 ideas were a random order
of responses from respondents in the three highest ranks (Vice President, Director,
and Senior Manager). The subsequent 407 were a random order of ideas offered by
managers in lower ranks.
As expected, ratings are lower for ideas later on the list (-3.5 t-test; 2.7 mean
value for the first 50 ideas, 1.4 mean value for the last 50 ideas), and higher for the
ideas from people in more senior ranks (6.9 t-test; 3.0 mean value of ideas from
Directors and Vice Presidents, 2.5 for ideas from Senior Managers, and 1.8 for ideas
from the less senior managers). The effects of respondent rank and judge fatigue are
confounded in the ratings (since ideas from high-rank managers were listed before
ideas from other managers), but the two factors do not need to be separated for the
purposes of this paper so much as it is important to hold constant both job rank and an
idea's sequential order of evaluation when predicting the value of ideas. This, and
other bias issues, are discussed below in the analysis of association with brokerage.
——— Table 1 About Here ———
Table 1 lists four illustrative ideas (edited for grammar and spelling errors). The
first two ideas, judged high-value, propose extending supply-chain operations into
exogenous sources of inefficiency. Supply chain managers were often viewed by
company engineers as administrative assistants who executed equipment orders.
Engineers were deemed better informed about alternative vendors, so the decision
between vendors was theirs to make. Often, however, equivalent vendors existed for
a product but the local engineer had dealt with only one vendor in the past, which was
the vendor written into the proposal. The first idea in Table 1 is to move supply chain
operations into the proposal process so that the company could benefit from the scale
economies of purchasing from preferred vendors before low-volume, high-price

DRAFT MANUSCRIPT — The Social Origins of Good Ideas, Page 12
equipment purchases get written into a contract. A related inefficiency was created in
contracts with large subcontracts to vendors familiar to local engineers. The second
idea in Table 1 is to move supply chain operations into subcontracts to control the
sometimes high prices that contractors paid for supplies, which were then charged
back to the company.
The bottom two ideas in Table 1 were judged low in value. Both judges gave a
score of one to the third idea, which is a call for more consistency across geographic
locations. The bit of strategic thinking missing in the idea is to focus on consistency as
it creates value as opposed to consistency for its own sake. As stated, the third idea is
a classic lament from bureaucrats — we need people to adhere more consistently to
agreed-upon processes. The fourth idea in Table 1 has a tone of the bureaucrat's
lament, but it offers substantive detail, in fact so much detail that it is difficult to judge
the value of the idea. The respondent is down in the weeds with details about his
SixSigma project and the computer systems utilized in the project. It is difficult to
evaluate the value of this idea without knowing more about the specific project and
computer systems. One of the two judges gave the idea a score of one, the minimum
on the printed list of ideas given to the judges. The other judge dismissed the idea
without rating it (scored as zero, resulting in the 0.5 average across judges): ". . . for
ideas that were either too local in nature, incomprehensible, vague, or too whiny, I
didn't rate them."
Background Data
Several control variables were taken from company personnel records. In
addition to the organizational division and geographic site where a manager worked,
there were five job ranks: The executive rank was composed of people with job titles
of Director or Vice President. In descending order below them were Senior Managers,
followed by Managers III, II, and I. People in the Manager I rank were often individual
contributors, but they rarely dealt with blue-collar workers. Another rank below
Manager I was the front-line management dealing with blue-collar workers.
Managers were assigned to one of two roles in the supply chain: Some
purchased goods from external vendors. Others moved goods between groups within

DRAFT MANUSCRIPT — The Social Origins of Good Ideas, Page 13
the company. I include the role distinction because purchasing paid higher salary
($22,111 higher on average, 5.4 t-test) and could have affected a manager's ideas
about supply chain since the job involved contact with people in other companies.
Education is reported because it is so integral to the concept of human capital,
especially for a study such as this of ideas. A substantial number of the managers had
gone to graduate school (25% Master’s degrees and 3% Doctorates), but an equal
number had less than a college degree (17% had some college, short of a Bachelor’s
degree, and 10% had a high-school education or less). I also looked at race (86% of
the study population was white), gender (26% female), and marital status (78%
married), but none was a statistically significant predictor or slope-adjustment in the
analysis, so none of them is reported.
Judging from age and seniority, there was a great deal of work experience in the
study population. The average manager was 50 years old and had worked 18 years in
this company. Many managers had spent their whole career in the company. More
had spent their whole career in the industry. Age turned out to be more strongly
associated with performance and idea value, so I use age as the control for work
experience.
Performance Data
Performance data were gathered to assess the construct validity of the network
data ("Are high-performers more often the managers whose networks span structural
holes?"), and to generalize the idea data ("Do high-value ideas come more often from
the people deemed high-performers?"). Performance was reviewed annually by each
manager's supervisor. Salary and evaluation data for this analysis come from
company personnel records for the annual cycle six months before the website survey,
and the subsequent cycle six months after the survey.
Salary measures an employee's accumulated performance in that next year's
salary is typically an incremental addition to current salary. Salaries in this study
population increased slightly in the second year (5.5% on average, 2.8% standard
deviation, 0% minimum, 30% maximum), but relative salary did not change much
between the years (.99 correlation between salaries in the two years, .96 partial
DRAFT MANUSCRIPT — The Social Origins of Good Ideas, Page 14
correlation with job rank and age held constant). I use the salary figure current at the
time of the web-based survey (rather than combining salaries across the years)
because salary is so highly correlated between the years and I have complete data on
salary at the time of the survey (there was 5.2% turnover in managers between the
two years and I have no second-year salary data for managers who left the firm).
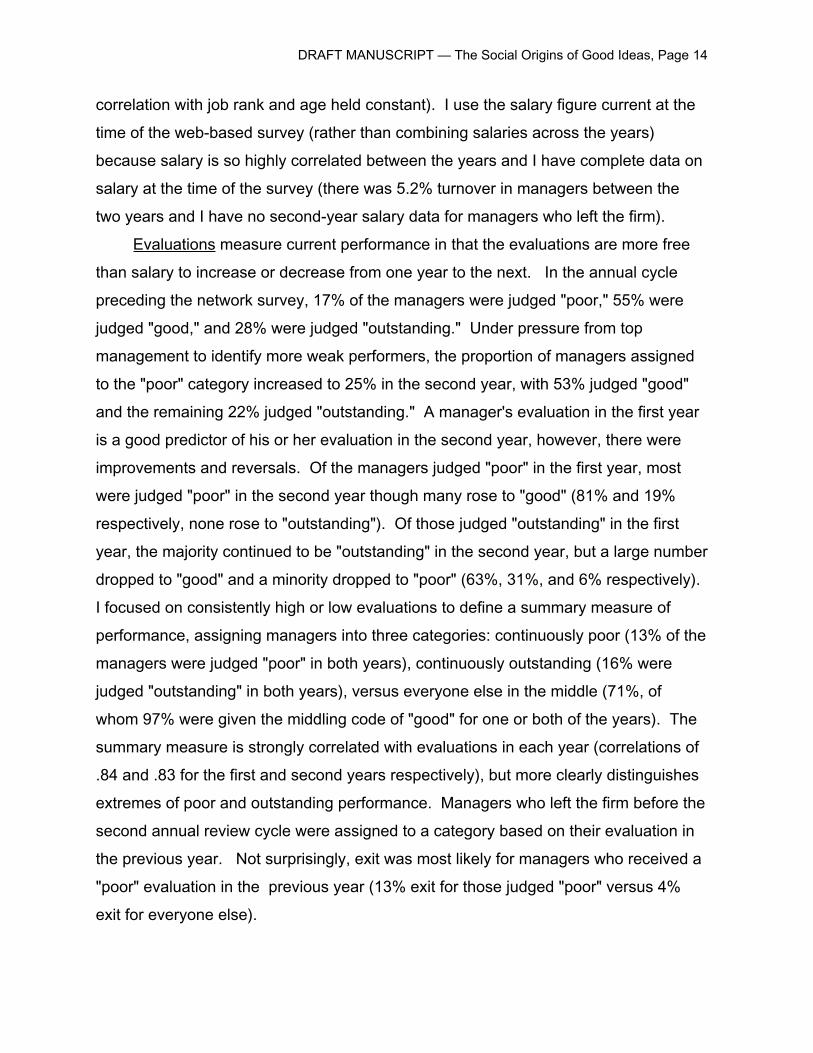
Evaluations measure current performance in that the evaluations are more free
than salary to increase or decrease from one year to the next. In the annual cycle
preceding the network survey, 17% of the managers were judged "poor," 55% were
judged "good," and 28% were judged "outstanding." Under pressure from top
management to identify more weak performers, the proportion of managers assigned
to the "poor" category increased to 25% in the second year, with 53% judged "good"
and the remaining 22% judged "outstanding." A manager's evaluation in the first year
is a good predictor of his or her evaluation in the second year, however, there were
improvements and reversals. Of the managers judged "poor" in the first year, most
were judged "poor" in the second year though many rose to "good" (81% and 19%
respectively, none rose to "outstanding"). Of those judged "outstanding" in the first
year, the majority continued to be "outstanding" in the second year, but a large number
dropped to "good" and a minority dropped to "poor" (63%, 31%, and 6% respectively).
I focused on consistently high or low evaluations to define a summary measure of
performance, assigning managers into three categories: continuously poor (13% of the
managers were judged "poor" in both years), continuously outstanding (16% were
judged "outstanding" in both years), versus everyone else in the middle (71%, of
whom 97% were given the middling code of "good" for one or both of the years). The
summary measure is strongly correlated with evaluations in each year (correlations of
.84 and .83 for the first and second years respectively), but more clearly distinguishes
extremes of poor and outstanding performance. Managers who left the firm before the
second annual review cycle were assigned to a category based on their evaluation in
the previous year. Not surprisingly, exit was most likely for managers who received a
"poor" evaluation in the previous year (13% exit for those judged "poor" versus 4%
exit for everyone else).

DRAFT MANUSCRIPT — The Social Origins of Good Ideas, Page 15
Promotion measures company-rewarded performance. Fourteen percent of the
managers continuing with the company in the second year were promoted to a higher
job grade in the annual performance review. A few were promoted two job grades, but
most were a single grade so I treat promotion as a dichotomy. Pay was sometimes a
substitute for promotion, for example, if a person was doing a terrific job but had been
promoted recently. Of the managers not promoted in the second year, 34% received
an above-average salary increase. The percent by which a manager's salary
increased is a continuous variable — salaries increased in the second year by an
average of 5.5% over a range of zero to 30 percent — but the performance signal
managers discuss is whether they received an above-average raise. Supervisors
were given a budget sufficient to cover an average raise for each subordinate. The
average was defined by headquarters and varied from one year to the next, so the
average was a consistent benchmark against which managers could interpret
individual pay increases. In sum, I have three promotion measures: In addition to
increased job grade and percentage increase in salary, my summary measure is a
dichotomy distinguishing the 42% of managers promoted or given an above-average
salary increase.
Network Data
Network data were collected by the standard survey method of name generators
and interpreters (e.g., Marsden, 1990). The web-based questionnaire contained two
name generators. After managers typed in their idea, they were asked if they had
discussed the idea with anyone. If yes, they were asked to provide the name of the
person with whom they had had the most detailed discussion. Next they were asked:
"More generally, who are the people with whom you most often discuss supply-chain
issues?" Five response boxes were provided for names. The questionnaire then
listed two name interpreters. The first asked for the number of years that the
respondent had known each cited person. The second asked about the relative
strength of connections among the cited contacts. To answer, the respondent was
guided through a matrix in which the respondent's perceived connection between each
pair of cited people was coded as "often," "sometimes," or "rarely" discussing supply-
DRAFT MANUSCRIPT — The Social Origins of Good Ideas, Page 16
chain issues with one another. There are multiple observations of relations between
people cited by more than one survey respondent.
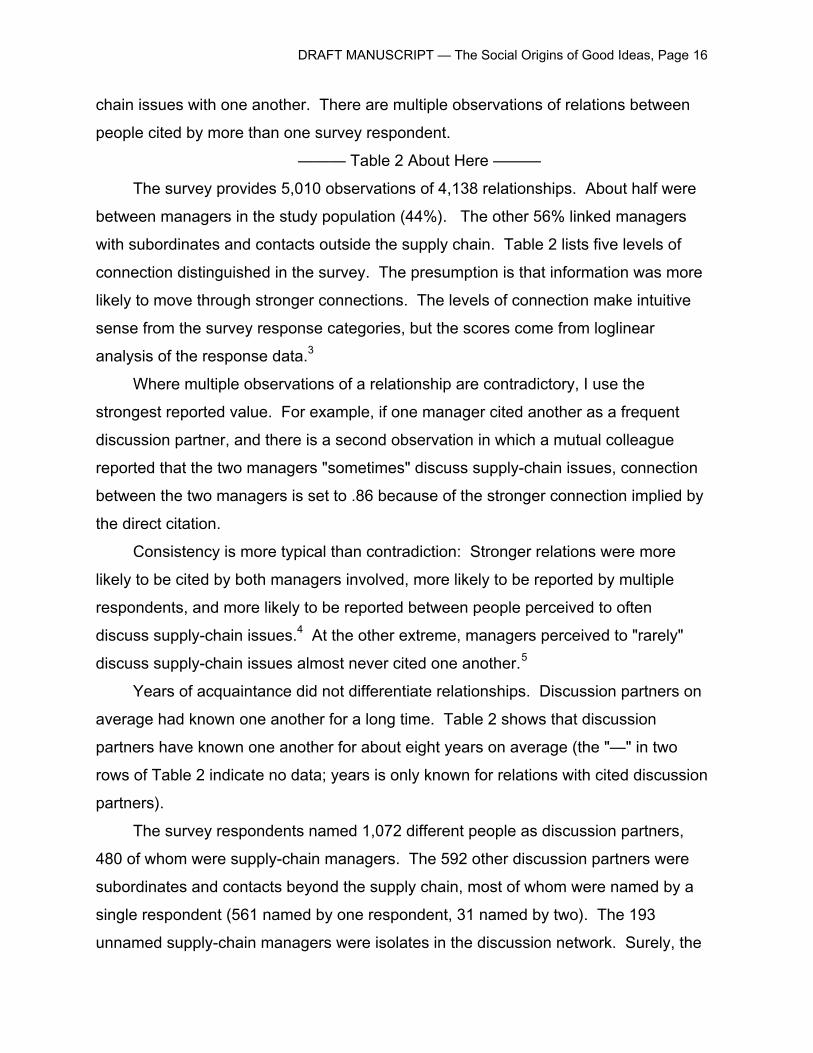
——— Table 2 About Here ———
The survey provides 5,010 observations of 4,138 relationships. About half were
between managers in the study population (44%). The other 56% linked managers
with subordinates and contacts outside the supply chain. Table 2 lists five levels of
connection distinguished in the survey. The presumption is that information was more
likely to move through stronger connections. The levels of connection make intuitive
sense from the survey response categories, but the scores come from loglinear
analysis of the response data.3
Where multiple observations of a relationship are contradictory, I use the
strongest reported value. For example, if one manager cited another as a frequent
discussion partner, and there is a second observation in which a mutual colleague
reported that the two managers "sometimes" discuss supply-chain issues, connection
between the two managers is set to .86 because of the stronger connection implied by
the direct citation.
Consistency is more typical than contradiction: Stronger relations were more
likely to be cited by both managers involved, more likely to be reported by multiple
respondents, and more likely to be reported between people perceived to often
discuss supply-chain issues.4 At the other extreme, managers perceived to "rarely"
discuss supply-chain issues almost never cited one another.5
Years of acquaintance did not differentiate relationships. Discussion partners on
average had known one another for a long time. Table 2 shows that discussion
partners have known one another for about eight years on average (the "—" in two
rows of Table 2 indicate no data; years is only known for relations with cited discussion
partners).
The survey respondents named 1,072 different people as discussion partners,
480 of whom were supply-chain managers. The 592 other discussion partners were
subordinates and contacts beyond the supply chain, most of whom were named by a
single respondent (561 named by one respondent, 31 named by two). The 193
unnamed supply-chain managers were isolates in the discussion network. Surely, the

DRAFT MANUSCRIPT — The Social Origins of Good Ideas, Page 17
193 isolates had a circle of local contacts. They were talking to someone. All I know
is that they were not cited as a discussion partner by any other supply-chain managers
in the company.
——— Figure 2 About Here ———
Figure 2 contains summary results on the 480 managers who were an active part
of the supply-chain discussion network. The sociogram displays managers with lines
indicating discussion citations. Managers are close in the sociogram to the extent that
they cited one another and had the same other people as discussion partners.6 The
193 social isolates would be distributed around the periphery of the diagram,
disconnected from anyone else in the network. The first column of the table in Figure
2 shows how isolation varied by job rank. No Vice President or Director was a social
isolate. Two Senior Managers were isolates. The largest concentration of isolates
was among first-rank managers, where it is easy to imagine a local circle of people cut
off from colleagues elsewhere.
I use network constraint to measure brokerage. Network constraint is a summary
measure that varies with three qualities of a network: size, density, and hierarchy;
increasing with the extent to which a network is concentrated in redundant contacts
(Burt, 1992:Chap. 2; 2000).7 The constraint on a manager is high if the manager's
discussion partners talked a lot to one another directly (dense network) or they shared
information indirectly via a central contact (hierarchical network). More constrained
networks spanned fewer structural holes, so performance and the value of a
manager's ideas should have a negative association with network constraint. I
measure the constraint on each manager with respect to the immediate network of
discussion partners, comprised of anyone that the manager cited as a discussion
partner and anyone who cited the manager.8 Figure 1 contains three illustrative
computations.9
The second column of the table in Figure 2 shows that managers had a handful
of discussion contacts on average. The average varied with rank: Directors and Vice
Presidents had an average of 12.6 contacts, versus an average of 3.4 for managers in
the first rank. The average was a handful of discussion partners. Connection scores
in Table 2 were used to define relations between a manager's contacts.
DRAFT MANUSCRIPT — The Social Origins of Good Ideas, Page 18
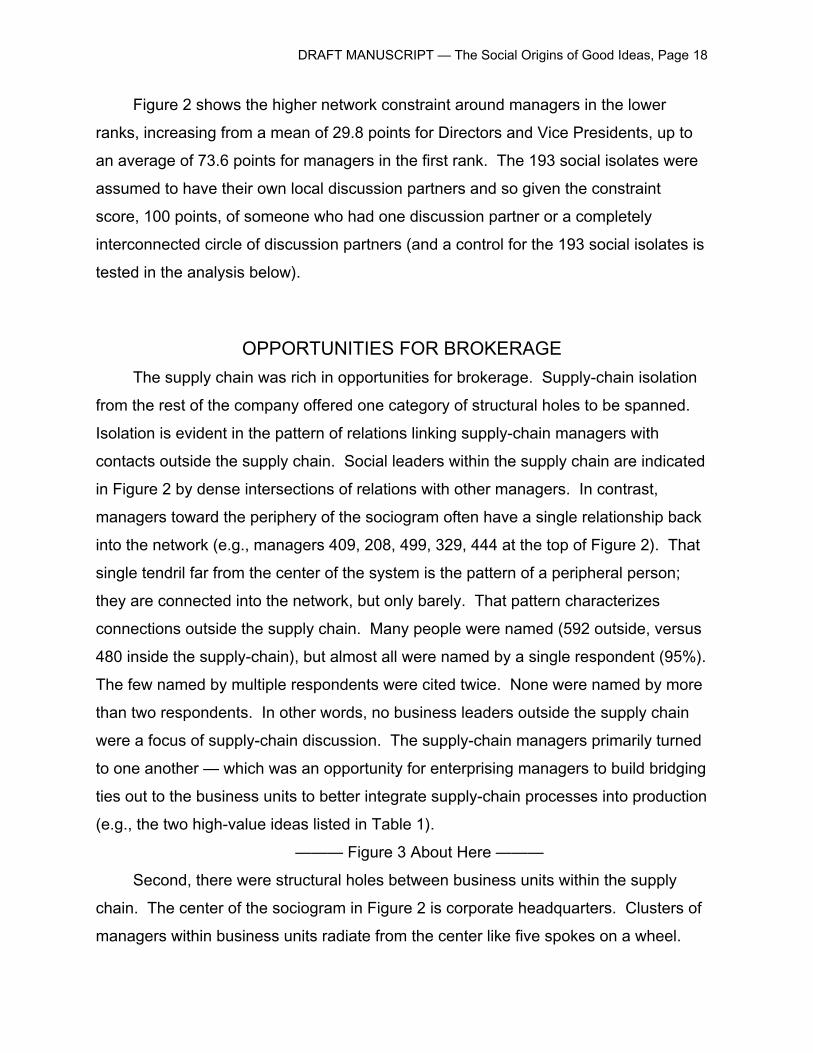
Figure 2 shows the higher network constraint around managers in the lower
ranks, increasing from a mean of 29.8 points for Directors and Vice Presidents, up to
an average of 73.6 points for managers in the first rank. The 193 social isolates were
assumed to have their own local discussion partners and so given the constraint
score, 100 points, of someone who had one discussion partner or a completely
interconnected circle of discussion partners (and a control for the 193 social isolates is
tested in the analysis below).
OPPORTUNITIES FOR BROKERAGE
The supply chain was rich in opportunities for brokerage. Supply-chain isolation
from the rest of the company offered one category of structural holes to be spanned.
Isolation is evident in the pattern of relations linking supply-chain managers with
contacts outside the supply chain. Social leaders within the supply chain are indicated
in Figure 2 by dense intersections of relations with other managers. In contrast,
managers toward the periphery of the sociogram often have a single relationship back
into the network (e.g., managers 409, 208, 499, 329, 444 at the top of Figure 2). That
single tendril far from the center of the system is the pattern of a peripheral person;
they are connected into the network, but only barely. That pattern characterizes
connections outside the supply chain. Many people were named (592 outside, versus
480 inside the supply-chain), but almost all were named by a single respondent (95%).
The few named by multiple respondents were cited twice. None were named by more
than two respondents. In other words, no business leaders outside the supply chain
were a focus of supply-chain discussion. The supply-chain managers primarily turned
to one another — which was an opportunity for enterprising managers to build bridging
ties out to the business units to better integrate supply-chain processes into production
(e.g., the two high-value ideas listed in Table 1).
——— Figure 3 About Here ———
Second, there were structural holes between business units within the supply
chain. The center of the sociogram in Figure 2 is corporate headquarters. Clusters of
managers within business units radiate from the center like five spokes on a wheel.

DRAFT MANUSCRIPT — The Social Origins of Good Ideas, Page 19
The clusters appear in the sociogram to the southeast, south, southwest, northwest,
and northeast. To make the clusters more apparent, I looked more closely at the top
89 senior people to see the core of the supply-chain network, drawn in Figure 3.
Managers are close together in Figure 3 to the extent that they cited one another and
had the same other people as discussion partners.10 Shaded areas indicate business
units. Managers not in a shaded area work at corporate headquarters. Discussion is
concentrated within business units. There are 514 connections in the sociogram at the
top of Figure 3: 321 between managers in the same business unit (62%), 178 with
managers at headquarters (35%), and a meager 15 direct connections between
managers in different business units (3%). To further highlight the concentration within
divisions, I removed the headquarters managers. Connections to headquarters are
bridges of a kind, but they are also a continuation of the bureaucratic structure up from
each division. In contrast, direct discussion between mangers in separate divisions
cuts across lines of corporate control. The sociogram at the bottom of Figure 3 —
exactly the sociogram at the top, but with headquarters removed — is stark illustration
of the fragile contact across business units. Again, the situation is rich with
opportunities for an enterprising manager to discover and bring home best practice in
other divisions, and by so doing, enhance coordination across the supply chain.
A third category of opportunities was at the level of individuals within the supply
chain. Bridges and clusters can be seen in Figure 2 and Figure 3, but Watts and
Strogatz (1998, and Watts, 1999) provide a useful metric for expressing the situation
at a micro level. There is a bridge and cluster structure in a population to the extent
that two conditions occur: relations are dense within clusters, and short path distances
connect people across the clusters. Bridges make the short path distances possible
(see Granovetter, 1973, especially pages 1373-1376 on a community's difficulty in
coordinating across dense clusters in the absence of bridging relationships).
The table of summary results at the top of Figure 2 show that managers tended
to be surrounded by a dense cluster of discussion partners. The second to the last
column is the mean network constraint among a manager's cited discussion partners.
The average across job ranks is a near-maximum 81.0, and the 70.2 average for the
highest-rank managers is not much lower. To put this in more concrete terms,
DRAFT MANUSCRIPT — The Social Origins of Good Ideas, Page 20
consider network density: discussion partners were reported 52% of the time to "often"
discuss supply chain issues with one another, and 80% were reported to at least
"sometimes" discuss supply chain with one another. In other words, managers on
average had a small clique within which they discussed supply-chain issues. As a
frame of reference for these averages, Marsden (1987) reports an average density of
62% for a national probability sample of Americans citing about the same number of
discussion partners, but half of the cited contacts were family so Marsden's density
average would have been lower if contacts were limited to work. Burt (2000) reports a
27.9 average level of colleague network constraint for about a thousand senior
managers drawn from five study populations. The senior managers were able to
name a larger number of contacts than allowed in this study, so accurate comparison
requires a control for network size. The constraint-size equation in the baseline data is
C = a(ebN
), where N is the number of contacts in a manager's network, C is the
projected level of network constraint for networks of size N, the estimated coefficients
a and b are 48.7 and -.075 respectively. Estimating the equation for the supply-chain
discussion network yields 68.4(e-.10N
) for network constraint among cited discussion
partners (second to last column in Figure 2) and 60.8(e-.12N
) for constraint when the
network is expanded to include people citing the manager (third column in Figure 2).
The intercepts show high levels of network constraint in the supply chain. The
standard error for the intercept is one point in both study-population equations, so test
statistics are large for the 20-point difference between the baseline 48.7 level of
constraint for five-contact networks versus the mean 68.4 constraint among discussion
partners in the supply chain, or the mean 60.8 constraint in the broader networks
including people who cited a manager.
Despite dense clustering within business units and around individual managers,
the managers who had any connection with one another were connected by short path
distances. Path distance is the minimum number of relationships required to connect
two people. Path distance to direct contacts is one. Path distance to friends of direct
contacts is two, and so on. Try tracing a path of indirect connections from one side to
the other in the Figure 2 sociogram in Figure 2. Intermediaries add up quickly. A

DRAFT MANUSCRIPT — The Social Origins of Good Ideas, Page 21
computer search for the shortest paths between people shows that the longest path
distance is 11 steps.
Average path distance is just 4.2 steps. Averages are listed by job rank in the
last column of Figure 2 with minimum and maximum means in parentheses (for the
476 connected managers, which excludes the 4 managers in the two disconnected
dyads in the lower-right corner of Figure 2). For example, Senior Managers on
average required 3.7 steps to reach anyone in Figure 2 — that is one direct connection
to a colleague, plus two intermediaries past the colleague, to reach anyone. The best-
connected could reach everyone in 2.9 steps on average. The worst-connected
required an average of 6.4 steps (putting aside the two Senior Managers who were
social isolates). Average path distance varied with job rank: more senior people had
shorter path distances across the supply chain (3.3 mean for Directors and Vice
Presidents versus 4.6 mean for first-rank managers). This is to be expected since
more senior people had more bridging relations, indicated by their lower levels of
network constraint, so they could more often reach directly out of their own social
cluster into others (mean path distance is correlated .57 with network constraint in
Figure 2 and .55 for the 89 people in Figure 3).
The shorter path distances to more senior people means that senior people were
more responsible for connections across the supply chain. A histogram of Figure 2
path distances peaks over the average of four steps. The distribution looks the same
for the much smaller core network of 89 people at the top of Figure 3, except the
distribution shifts one step to the left (average path distance drops from 4.2 steps in
Figure 2 to 3.2 steps at the top of Figure 3). In other words, connections across the
supply chain are primarily determined by path distances among the 89 people at the
top of Figure 3. The excluded 191 lower-rank, less-connected managers in Figure 2
require one connection to access the core network, which then connects them across
the supply chain. Within the core network, removing the headquarters managers
increases average path distance by two steps (3.2 mean path distance at the top of
Figure 3 is 5.2 for the sociogram at the bottom of Figure 3). Without the headquarters
managers, communication across the business units would depend on getting to the
few people who sit on the 15 relations at the bottom of Figure 3 that bridge business
DRAFT MANUSCRIPT — The Social Origins of Good Ideas, Page 22
units. In short, formal chains of command were integral to communication across the
supply chain; illustrated by the critical role that headquarters played in shortening path
distances across business units, and the tendency for managers to turn to a small
clique of interconnected colleagues to discuss supply-chain issues. With respect to
brokerage opportunities, a setting dependent on formal chains of command for
communication is a setting rich in opportunities for managers to coordinate directly
across the formal chains.
BROKERAGE AND PERFORMANCE
The opportunities for brokerage raise questions about manager incentives to
broker. If managers had an incentive to coordinate across structural holes within and
around the supply chain, why do so many brokerage opportunities still exist? It is easy
to imagine the lack of incentive: The network structure just described would result from
managers encouraged to a focus on their immediate assignments, relying on
headquarters for strategic thinking about how to coordinate across the supply chain.
In fact, such a view was crisply stated to me by a program manager describing how he
ran his group: "I don't want my people even thinking about alternatives. They spend
two weeks thinking about an alternative, only to learn that what we have is 90% as
good. The result is that they wasted two weeks and I'm behind schedule. I get some
complaints about stifling creativity, but all I want is to be good enough and on
schedule." Combine this view with a premium on personal loyalty from subordinates,
and it is easy to imagine an organization in which managers were rewarded for
sticking to an interconnected circle of colleagues focused on their immediate tasks.
Despite views such as the one quoted, the company recognized and rewarded
brokerage: Table 3 shows positive associations between brokerage and all three
measures of employee performance. Managers who often discussed supply-chain
issues with managers in other groups were better paid, received more positive job
evaluations, and were more likely to be promoted. Company promotion and
compensation policy encouraged individuals to think strategically about integrating
across the supply chain

DRAFT MANUSCRIPT — The Social Origins of Good Ideas, Page 23
The association between brokerage and performance is described by the bottom
five rows of Table 3: The "network constraint" row is the association for first-rank
managers, then the next four rows are slope adjustments for stronger or weaker
associations at each of the other ranks. For example, Model III is an ordinal logit
equation predicting the three-category annual performance evaluations (outstanding,
good, poor). Performance evaluations did not vary systematically with any of the
control variables except age: older managers were less likely to receive positive
evaluations. Above and beyond the control variables, there is a statistically significant
negative association with network constraint — the more interconnected a manager's
discussion contacts, the less positive his or her annual performance evaluation (-.014
coefficient, .004 standard error in parentheses, for a -3.5 test statistic). All of the slope
adjustments in the four bottom rows are smaller than their standard errors. In other
words, there is a strong negative association between network constraint and
performance evaluation at each job rank. Adding a dummy variable distinguishing the
193 social isolates does not add anything to the prediction (-1.6 test statistic), nor
change the fact that age and network constraint are the only statistically significant
predictors. The graph to the right in Figure 4 plots the aggregate association for a logit
model predicting evaluations from age and network constraint, the two statistically
significant predictors in Table 3. Few received a "poor" evaluation two years in a row,
but the few who did were disproportionately managers surrounded by a circle of
densely interconnected discussion partners. At the other extreme, being evaluated
"outstanding" for both years was unlikely on average (p = .16), but a manager whose
discussion network spanned numerous structural holes had twice those odds (p = .32
for C = .10).
A more intuitive, less robust, demonstration of the performance association with
brokerage is to sort managers into three broad groups with respect to business units:
non-brokers (312 managers in a group of densely interconnected discussion partners
as indicated by above-average network constraint), local brokers (196 managers with
discussion partners in other groups, but all within the manager's own business unit,
e.g., persons 283, 504, 528 in Figure 3), and enterprise brokers (165 managers with
discussion partners in other groups, some outside the manager's own business unit,

DRAFT MANUSCRIPT — The Social Origins of Good Ideas, Page 24
e.g., persons 9, 234, 402 in Figure 3). The hypothesis is that good ideas are borne of
engaging alternative ways of thinking and behaving. Since variation is more likely
between than within business units, enterprise brokers have the most of whatever
brokerage provides, local brokers have less, non-brokers the least. Consistent with
the hypothesis, the odds of being evaluated "outstanding" in the annual reviews before
and after the survey drop from 24% of enterprise brokers, to 19% of local brokers, and
10% of non-brokers. The odds of being evaluated "poor" in both years double from
5% of enterprise brokers, to 10% of local brokers, and 19% of non-brokers. The two
trends are nonrandom (33.5 chi-square with 4 d.f., P < .001), but they disappear when
network constraint is held constant (-6.4 test statistic for network constraint, versus 0.3
and -0.1 for dummy variables distinguishing local and enterprise brokers respectively
from non-brokers).11 In other words, performance increases with the extent to which a
manager's discussion partners come from otherwise disconnected groups, within or
beyond the manager's own business unit.
——— Table 3 and Figure 4 About Here ———
Models I and II in Table 3 describe the more complex association between salary
and brokerage. As a quantity that increases incrementally, salary is a measure of
cumulative performance reflecting a variety of conditions in a manager's past. Job
rank is an obvious control: The average salary of a first-rank manager was $31,099
less than the average salary of a manager in the third rank. Senior Managers, on
average, had salaries $19,638 higher than a third-rank manager. Intercepts are not
presented for Models I and II to protect salary confidentiality. Effects are expressed
with respect to managers in the third rank as a reference group. Beyond job rank,
managers played two assigned roles in the supply chain: Some purchased goods
from external vendors. Others moved goods within the company. Those who dealt
with external vendors had higher salaries, but the difference is statistically negligible
when job rank and age are held constant. Education was not directly associated with
salary, but managers were compensated for experience. Salary increased with age
($338 per year on average). People tend to spend their whole career within this
industry, so years in the company were less correlated with salary than years of age
(6.5 t-test for age in Table 3 versus 2.1 for years in the company).

DRAFT MANUSCRIPT — The Social Origins of Good Ideas, Page 25
To hold constant differences between business units, I regressed the residuals
from job rank, job role, age, and education across dummy variables distinguishing
fifteen business units. Salaries were significant low in the one unit for which supplies
were largely commodity goods so supply-chain managers were not required to have
technical expertise ("LowTech" in Table 3). Salaries were significantly high in four
units where supply-chain managers had to deal with higher-end electronic equipment
and components ("HighTech in Table 3).
I then took studentized residuals from salary regressed over the above control
variables, and distributed them across a map of the United States to look for pockets
of deviant salaries. Salaries were significantly higher in two high-cost urban areas.
"Urban 1" and "Urban 2" in Table 3 are dummy variables distinguishing managers who
live in the two identified urban areas.
The above control variables measuring job rank, role, age, education, business
unit, and location account for 78.6% of salary variance across the 673 managers. The
amount by which a manager's salary exceeds, or falls below, the salary expected from
his or her rank, role, age, education, business unit, and location measures the
company view of the manager's performance relative to peers.
That view is keyed to brokerage. The five rows at the bottom of Table 3 for
Models I and II show no association with network constraint for managers in the first
rank, nor for managers in the second rank. Note that the slope is increasing with job
rank, showing a stronger salary association with brokerage as a manager becomes
more the author of his or her own job, and success depends more on reading the
organization to identify valuable projects and know who can be brought together to
implement the projects (cf. Burt, 1997). Salary in Model I decreases for first-rank
managers by $7 with a one-point increase in network constraint. The decrease is
larger for managers in the second rank (add $19 to the $7), and larger still for
managers in the third rank (add $47 to the $7). The statistically significant association
is at the Senior-Manager and Executive ranks. The $214 additional decrement for
Senior Managers is significantly more negative than the $7 for first-rank managers (2.9
t-test). The $681 additional decrement for Directors and Vice Presidents is more so
DRAFT MANUSCRIPT — The Social Origins of Good Ideas, Page 26
(5.5 t-test). Adding a dummy variable distinguishing the 193 social isolates does not
add anything to the prediction (0.4 test statistic).
Model II is the same as Model I except it is estimated from the data on managers
who had two or more discussion partners. It seemed likely, from the results of Model I,
that the third rank of managers was a transition point after which managers enjoyed
the salary benefits of brokerage. I looked through the third-rank managers to see
where salary benefits were accumulating. Initially, I thought that seniority would be a
key. Managers who had been in the third rank for a while could have been playing a
Senior-Manager role and so perhaps compensated for that. The answer was more
simple. Third-rank managers involved in the informal discussion network showed the
salary benefits of brokerage. Model II shows the same pattern of salary correlates as
Model I, except that the salary of third-rank managers is significantly correlated with
network constraint.
The graph to the left in Figure 4 plots salary relative to peers against network
constraint for the managers identified in Table 3 as eligible for the salary benefits of
brokerage. The salary variable is the residual from predicting salary by the twelve
control variables in Table 3 standardized to unit variance and zero mean (salary
expected for a manger from his or her job rank, role, age, education, business unit,
and geographic location). Salary relative to peers clearly decreases as network
constraint increases (-.41 correlation, -5.6 test statistic, P < .001).
Model IV in Table 3 shows the brokerage association with promotion. The more
interconnected a manager's discussion contacts last year, the lower the probability of
being promoted or receiving an above-average pay increase this year (-.022
coefficient, -3.7 test statistic). The association is consistent across job ranks
(negligible slope adjustments). The only significant control variable is again age.
Holding age constant, the graph to the right in Figure 4 shows how the probability
predicted by Model IV changes with the network constraint around a manager. The
odds were good for being promoted, or receiving an above-average raise between the
two years observed (42%). Figure 4 shows how the odds varied above and below
average as a function of the manager's discussion network. Managers brokering
connections across segregated groups had more than twice the odds of a promotion

DRAFT MANUSCRIPT — The Social Origins of Good Ideas, Page 27
or above-average salary increase (.42 average is .68 for C = 10) while managers
limited their supply-chain discussion to a circle of densely interconnected colleagues
had the least chance (p= .28 for C = 100). Adding a dummy variable distinguishing the
193 social isolates does not add to the prediction (-1.4 test statistic). The same
conclusion holds if the logit model is used to predict promotion to a higher job rank (-
3.4 z-score for network constraint), or a regression model is used to predict the
percentage by which a manager's salary was increased in the second year (-3.2 t-test
for network constraint).12
In sum, managers at all ranks whose networks spanned structural holes
received more positive evaluations in their annual review, and were more likely to
promoted or receive above-average salary increases. The result was that more senior
managers had broader networks and their salaries varied with the extent to which they
had a broader network. From the middle of the third rank and up, manager salary
increased with the extent to which the manager's network spanned structural holes.
BROKERAGE AND GOOD IDEAS
Brokerage has its hypothesized association with good ideas. Model V in Table 4
predicts the value perceived in a manager's idea, and the left-hand graph in Figure 5
shows the nonlinear association with brokerage. The steepest drop in value happens
with initial network constraint, in other words, when a manager first begins to rely on
redundant discussion partners. Circles in the graph indicate ratings by one of the two
judges averaged across five-point intervals of network constraint, and squares indicate
pooled ratings from the other senior person evaluating ideas. Thin lines through their
respective ratings differ in level, but both show the strong negative association with
network constraint (t-tests of -5.8 and -3.9 for their 455 individual ratings, see Figure 5
box insert).
——— Table 4 and Figure 5 About Here ———
None of the control variables is associated with value when network constraint is
held constant. Higher-rank managers were more often the source of valuable ideas,
but the zero-order association with rank disappears when network constraint is held

DRAFT MANUSCRIPT — The Social Origins of Good Ideas, Page 28
constant (6.9 t-test for the direct association between rank and average value, but
negligible rank effects in Model V). Evidently, rank was no substitute for knowledge.
Even within the top ranks, senior people whose discussion partners were drawn from a
small circle of densely interconnected people were likely to have weak ideas for
improving supply-chain operations (-.43 correlation between idea value and network
constraint for the Senior Managers, Directors, and Vice Presidents, -3.2 t-test).13
Surprisingly, human capital is also a secondary factor. There is no association
with lessons learned over years of experience. Age has no direct association with
value in Model V, and a graph of value across age (not presented) is a random scatter
showing no linear, curvilinear, or episodic association (.04 correlation with age and a
similarly negligible .02 correlation with years in the company). In contrast, education
does have a zero-order association with idea value: Higher value is seen in ideas
from managers with a college education (4.4 t-test) or a graduate degree (3.4 t-test).
However, social capital has the more direct association: Value and network constraint
have a strong negative association within levels of education (among managers with a
college education, -6.5 t-test, or managers with a graduate degree, -4.5 t-test), and
Model V shows no association between value and education when network constraint
is held constant.14
The two bias effects in Model V are negligible. First, it seemed possible that
value ratings would be higher for ideas offered with more explanation. Responses
explaining ideas ranged from 13 to 1,897 characters (253 mean). However, there is
no zero-order association with either judge's evaluation of value (.06 and -.07
correlations), nor in the Model V prediction (-0.8 t-test). Second, it seemed likely that
judges would fatigue as they rated ideas so value would be lower for ideas later on the
list presented to the judges. There is a negative zero-order association between value
and sequential order (-3.5 t-test), but the association is negligible under the controls in
Model V (-0.9 t-test for sequential order).15
Ideas Dismissed
Recall that the two senior managers judging value sometimes dismissed an idea
without rating it. As one explained, “. . . for ideas that were either too local in nature,

DRAFT MANUSCRIPT — The Social Origins of Good Ideas, Page 29
incomprehensible, vague, or too whiny, I didn’t rate them.” Being dismissed was not a
rare event. Almost three fourths of the ideas were dismissed by one or the other
senior person evaluating ideas (71%). One in three ideas was dismissed by both
judges (32%), which is the outcome predicted by Model VI in Table 4. The positive
association between network constraint and being dismissed (3.5 test statistic) shows
that managers in networks of densely interconnected discussion partners were less
successful in communicating their idea to the senior managers judging value. Here
again, the association with network constraint is nonlinear. The dashed line in the
graph to the right in Figure 5 shows that the steepest increasing in the odds of being
dismissed happens with initial network constraint, in other words, when a manager first
begins to rely on redundant discussion partners.
The control variables in Model VI are again interesting for their lack of association
with dismissal. Job rank is more complicated here in that the first-rank managers have
a statistically significant higher risk of being dismissed and mangers in the top ranks
had none of their ideas dismissed (so dummy variables distinguishing Senior
Managers and the two executive ranks had to be removed from the prediction). Age,
education, and the other control variables had no association with dismissal.
Ideas Unexpressed
Among the managers not responding to the survey were 16 who entered their name in
the survey website, then left before answering the question about their best idea for
improving supply-chain operations. I have no way of knowing how many other
potential respondents decided not to answer the survey after seeing the questions, but
I do know which managers chose not to complete the survey. I estimated Model VII in
Table 4 to see whether non-response is idea-related in the sense of having the same
pattern of correlates as idea value and idea dismissal. Managers probably had
various reasons for not responding to the survey, but the pattern of correlates
predicting non-response in Model VII looks like the pattern in Model V predicting idea
value, and the pattern in Model VI predicting idea dismissal: There is a strong
association with network constraint and negligible associations with job rank, role, age,
education, business unit, and location. The steep dashed line in Figure 5’s right-hand

DRAFT MANUSCRIPT — The Social Origins of Good Ideas, Page 30
graph shows the dramatic association with network constraint. Managers with
networks that spanned structural holes were likely to express an idea (.06 predicted
probability of non-response for 10 points of network constraint), while those
surrounded by densely interconnected discussion partners were extremely unlikely to
express an idea (.78 predicted probability of non-response for 100 points of network
constraint).
Ideas Discussed
Social structure is an accretion of conversations. At the same moment that good ideas
emerge where bridge relations span holes in today's social structure, idea discussion
shapes tomorrow's structure. Brokerage is again a correlate.
After explaining their best idea for improving supply-chain operations, managers
were asked whether they had discussed the idea with anyone in the company. If yes,
they were asked to name the person with whom they had their most detailed
discussion. A substantial minority of the supply-chain managers were dead-ends in
the sense of never discussing their best idea (31%). A few said that they had
discussed their idea, but were ambiguous about the discussion partner (7%; e.g.,
"everyone I can get to listen," “various," “other managers in supply chain”). The
majority named a specific person with whom they had discussed their idea (67%), and
some went on to name two or more discussion partners (14%).
Who Discusses?
Brokerage is the key variable predicting idea discussion. Model VIII in Table 4 shows
that regardless of job rank, age, education, business unit, or region, the people likely
to discuss their idea were the people whose networks spanned structural holes.
Job rank would appear to matter (3.2 test statistic for association between job
rank and idea discussion), but more senior people are more involved in bridging
structural holes, and the negligible effects for job rank in Model VIII show that it is the
bridging that is directly associated with idea discussion.
Idea value would appear to matter. Discussed ideas have higher value scores
(3.1 t-test) and were less likely to be dismissed by the two senior managers evaluating

DRAFT MANUSCRIPT — The Social Origins of Good Ideas, Page 31
value — 27% of discussed ideas were dismissed versus 42% of the undiscussed
ideas (8.7 chi-square, 1 d.f., P < .01, where dismissed is the dependent variable in
Model VI). However, neither idea value (dependent variable for Model V), nor a
dummy variable distinguishing ideas dismissed (dependent variable for Model VI), add
anything to Model VIII (respective test statistics of 0.8 and -0.6).
Discussion has two statistically significant correlates in Model VIII: idea length
and brokerage. The length of a manager’s explanation makes sense in that a person
sufficiently interested to type a long explanation of an idea is more likely to spend
effort talking about the idea.16 The pattern of correlates other than length looks like
the pattern in the other Table 4 models. Managers with networks that spanned
structural holes were more likely to have a good idea (Models V and VI), express their
idea (Model VII), and discuss their idea with colleagues (Model VIII).
With Whom?
Further inference can be drawn from who a manager choses for idea discussion. As a
baseline model, consider an inertia model of social convenience. Who is most likely to
be cited by a manager putting no effort into spreading or building support for an idea?
The more that John speaks to the people with whom I frequently speak, the more likely
that John will be present in my conversations with colleagues. If I were to have a
conversation with a colleague selected at random, John has a good chance of being
that colleague.
In more formal terms, John is central in my discussion network: he is speaks
often to the people with whom I often discuss my work. Centrality in this sense is
measured by the network constraint posed by each of a manager's contacts. The
more a contact is connected with others in a manager's network, the more severe the
contact's constraint on the manager (footnote 7).
Figure 6 shows manager contacts sorted from most to least central. The first
position contains the contact with whom the manager had the most mutual friends.
This is the person most likely to be cited if social convenience determined who was
selected for idea discussion. At the other extreme on the horizontal axis are the most
distant contact. These are contacts with whom a manager had no mutual colleagues,

DRAFT MANUSCRIPT — The Social Origins of Good Ideas, Page 32
people in other business units, or people with whom the manager had the least
experience).17 I put aside the 662 contacts cited by managers who did not discuss
their best idea (grey bars in Figure 6) because they are not at risk of being cited for
idea discussion. At risk are the contacts of managers who did discuss their best idea
(1,788 uncited in white, and the 340 cited in red).
Social convenience is prominent in the graph. Idea discussion is concentrated in
colleagues at the center of a manager's network: 36% of the people cited for idea
discussion were the most central in a manager's network, 25% were the second most
central, and 13% where the third-most central. The number of citations decreases at
further removes from the manager, but so does the number of contacts available to be
cited. Model IX in Table 5 shows that the probability of being cited is statistically
significant in the first three positions. On average, contacts with whom managers
discussed their best idea posed 13.6 points of constraint versus 7.6 points for other
contacts (9.2 test statistic).18 The probability of a colleague being cited for idea
discussion increases systematically with relative level of constraint (8.3 test statistic).19
——— Figure 6 and Table 5 About Here ———
History does not have a direct association with idea discussion. There is an
incentive to discuss ideas with trusted colleagues because it can seem presumptuous
to propose ideas and Figure 5 shows that there was a good chance of being dismissed
or judged negatively by senior management. However, Model X in Table 5 shows no
association between idea discussion and years of acquaintance. Colleagues known
for a decade or more have a 13% chance of being cited for idea discussion, versus
18% for colleagues known less than a year. The probability does not vary from year to
year of acquaintance (7.8 chi-square, 8 d.f., P = .46), other than a decrease for
colleagues known for more than a decade (8.6 chi-square, 1 d.f., P = .003) which is
negligible in Model X.
Hierarchy matters in several ways. For one thing, ideas were typically discussed
within business units. In part, this is because most network contacts were inside the
same business unit (91%), but holding constant their numbers, contacts inside the
business unit were more likely to be cited as the person with whom managers had
discussed their best idea (2.3 test statistic). Second, the probability of citation varied

DRAFT MANUSCRIPT — The Social Origins of Good Ideas, Page 33
with colleague rank. Managers were unlikely to say that they had discussed their best
idea with colleagues below them in the corporate hierarchy, and were likely to cite
people above them (respective test statistics of -4.5 and 5.1 in Model X, where the
reference category is same rank). Third, immediate supervision mattered above and
beyond relative rank. Holding rank constant, the boss was disproportionately cited as
the person with whom managers had discussed their best idea (5.4 test statistic).
Chains of command can be ambiguous. The majority of managers excluded the
boss from their discussion network (69%), and the managers most likely to exclude the
boss were the managers isolated inside a closed circle of densely interconnected
colleagues (-6.7 test statistic for the lower network constraint associated with the boss
in the manager's discussion network). Just connecting with the authority structure was
a form of brokerage in this study population.
Managers segregated from formal supervision were connected informally to the
authority structure. They often built their discussion network around a person of higher
rank, just not the person to whom they had been assigned. It is productive to make
the familiar distinction between formal and informal supervision (e.g., Blau, 1955, or
Podolny and Baron, 1997, for a treatment more explicit about network implications). A
formal boss is the person to whom a manager reported in the organization chart. An
informal boss is a person of rank who is central among the colleagues with whom the
manager discusses work.
Let the "informal boss" be the most central person of higher rank in a manager's
discussion network. John would be my informal boss if he holds a job rank higher than
mine and speaks more often than anyone else with all of the people with whom I
discuss my work. The decision rule I used with the supply-chain data was to look
down the list of a manager's contacts, ranked in descending order of network
constraint (Figure 6), and the first person who held a job rank higher than the manager
was deemed the informal boss. Where two contacts posed equal constraint, the
contact holding higher rank was deemed the informal boss. If the equal-constraint
contacts were of equal job rank, they were both coded as informal boss.20
Informal supervision was prominent in two ways: First, informal bosses were the
most likely target of idea discussion (9.3 test statistic in Model XI): 41% of the informal
DRAFT MANUSCRIPT — The Social Origins of Good Ideas, Page 34
bosses were cited as the person with whom a manager's best idea was discussed.
The odds drop to 9% for other contacts. A second consideration is the shear number
of managers involved: 56% of the managers had only an informal boss in their
discussion network, and 31% had both an informal and formal boss (sometimes in the
same person; 91 supervisors were both formal and informal boss). The remaining
13% had neither formal nor informal supervision in their discussion networks (i.e.,
there were no contacts of a higher job rank than the manager, and the formal boss
was not part of the discussion network). Managers in the third category, found in
every job rank, had small networks of densely interconnected discussion partners (5.7
test statistic for higher network constraint) and tended not to have discussed with
colleagues their best idea for improving supply-chain operations (-3.5 test statistic).
In sum, idea discussion was targeted at socially convenient authority. The
informal boss combines both: he or she is of higher rank, and is socially convenient by
dint of being best connected to a manager's other discussion partners. Rank alone
was insufficient. The formal boss is a factor — as long as he or she is active in the
discussion network around a manager. However, two thirds of the managers did not
include the immediate supervisor in their discussion network, so their formal bosses
are not included in Table 5. If I add the excluded bosses to Model XI, the positive
association between idea discussion and formal supervision disappears.21 Further,
holding formal and informal supervision constant in Model XI has eliminated the
tendency in Model X for managers to cite higher-rank contacts for idea discussion. In
other words, higher rank elicited idea discussion when it was socially convenient.
CONCLUSIONS
This paper was about the hypothesis that people who live in the intersection of social
worlds are at higher risk of having good ideas. I reviewed previous work showing
anecdotal and aggregate evidence to support the hypothesis, but my purpose was to
study the hypothesis in finer detail at the level of individual managers, linking ideas
with network measures of social capital known to be associated with performance.

DRAFT MANUSCRIPT — The Social Origins of Good Ideas, Page 35
I analyzed archival and survey data on 673 managers in the supply chain of a
large American electronics company in 2001. The study population is well-suited to
testing the hypothesized association between brokerage and good ideas: There were
numerous opportunities for brokerage (Figure 2 and Figure 3), and managers were
rewarded for brokerage in the sense that compensation, positive performance
evaluations, and promotions were disproportionately in the hands of managers who
brokered connections across structural holes (Figure 4).
Brokerage has the expected association with good ideas: Managers whose
networks more often spanned structural holes were more likely to express their ideas,
less likely to have their ideas dismissed by senior management, and more likely to
have their ideas evaluated as valuable (Figure 5).
I infer a cycle of structural reproduction from the results. On the negative side,
managers surrounded by densely interconnected discussion partners were likely to
have their ideas dismissed by senior management, have their ideas seen as low-value
if not dismissed, so they have learned not to express ideas. These managers can be
expected to obey the maxim that a closed mouth gathers no feet, withdrawing into
their local social world to wait for orders, thereby contributing to the continued
segregation of groups in the supply chain (see Morrison and Milliken, 2002, on
organizational silence and its correlates).
The positive side of the cycle rewards able managers, but serves the same end
as the negative side of the cycle. Managers whose networks spanned structural holes
were likely to express their ideas, likely to have their ideas engaged by senior
management, and likely to have their ideas perceived as valuable. These managers
can be expected to continue to propose ideas. But to what end? Although managers
with discussion partners in other groups were positioned to spread good ideas across
business units, the people they cited for idea discussion were overwhelmingly
colleagues already close in their informal discussion network (Figure 6). It would
appear that the distribution of good ideas was guided by social convenience, which is
to say that ideas were not discussed to change business practice so much as they
were discussed to display competence and entertain familiar colleagues.

DRAFT MANUSCRIPT — The Social Origins of Good Ideas, Page 36
This conclusion strains the limits of my data. I know the names of the people
with whom managers had their most detailed discussion. I do not have a census of
the people with whom managers discussed their idea. Managers could have had their
most detailed discussion with socially convenient colleagues, then moved on to
mobilize support in subsequent discussion with people beyond their own group. I think
not because there are multiple indicators of inertia: from the tendency for managers at
all ranks to cite a dense circle of colleagues for work discussion (81% density on
average, Figure 2), to the segregation of work discussion from the formal authority
structure (discussion network around 69% of the managers excluded their immediate
supervisor, footnote 21). The point remains that I do not have a census of people with
whom managers discussed their best idea.
As a check on my conclusion, I returned to the organization (ten months after
collecting the data reported in the paper) to ask a favor of the long-time employee who
had been promoted to run supply-chain operations for the company (not one of the
original two judges who evaluated ideas). I presented a list of the top 100 ideas, with
the names and business units of the people proposing the ideas, and asked: "To your
knowledge, has the person mobilized support to implement the idea or made an effort
to mobilize support for the idea?" The 100 included all ideas that either of the two
judges had given a maximum-value rating, all ideas that the judges together gave a
3.5 or higher average rating, and all ideas proposed by senior managers, directors, or
vice presidents. If any of the original ideas were acted upon, these 100 would be the
most likely (it seemed too big a favor to ask for an update on all ideas in the original
data).
The results corroborate the conclusion about social convenience. There is little
evidence of managers acting on their ideas. Of the 100 listed managers and their
ideas, 16 were perceived to have worked on mobilizing support for their idea. More
important to this paper, the ideas on which action occurred are consistent with the
conclusion about social convenience. A logistic model of the 100 ideas shows that
action was more likely for more valuable ideas (2.6 test statistic), from managers with
contacts in other groups (-3.1 test statistic for network constraint) who cited more
distant contacts for idea discussion (2.9 test statistic for idea-discussion contact

DRAFT MANUSCRIPT — The Social Origins of Good Ideas, Page 37
centrality, Figure 6). People holding more senior rank were more likely to act on their
idea, but the association disappears when network constraint is held constant (3.0
zero-order test statistic drops to 1.4) showing that action was less a function of rank
than connections to other groups. With respect to Figure 6, the managers who acted
on their idea rose above social convenience to discuss their idea with contacts beyond
their closest collagues (average rank 5.5 in Figure 6). The managers not taking action
cited much closer colleagues, as expected if social convenience determined their
selection of discussion partners (2.4 rank in Figure 6; 3.5 test statistic for difference).
My summary conclusion is that good ideas emerged from the intersection of
social worlds, but spread in a way that would continue segregation between the
worlds. There was a brokerage advantage in producing ideas, and company systems
were working correctly to reward brokers who produced good ideas, but the potential
value for integrating operations across the company was dissipated in the distribution
of ideas.
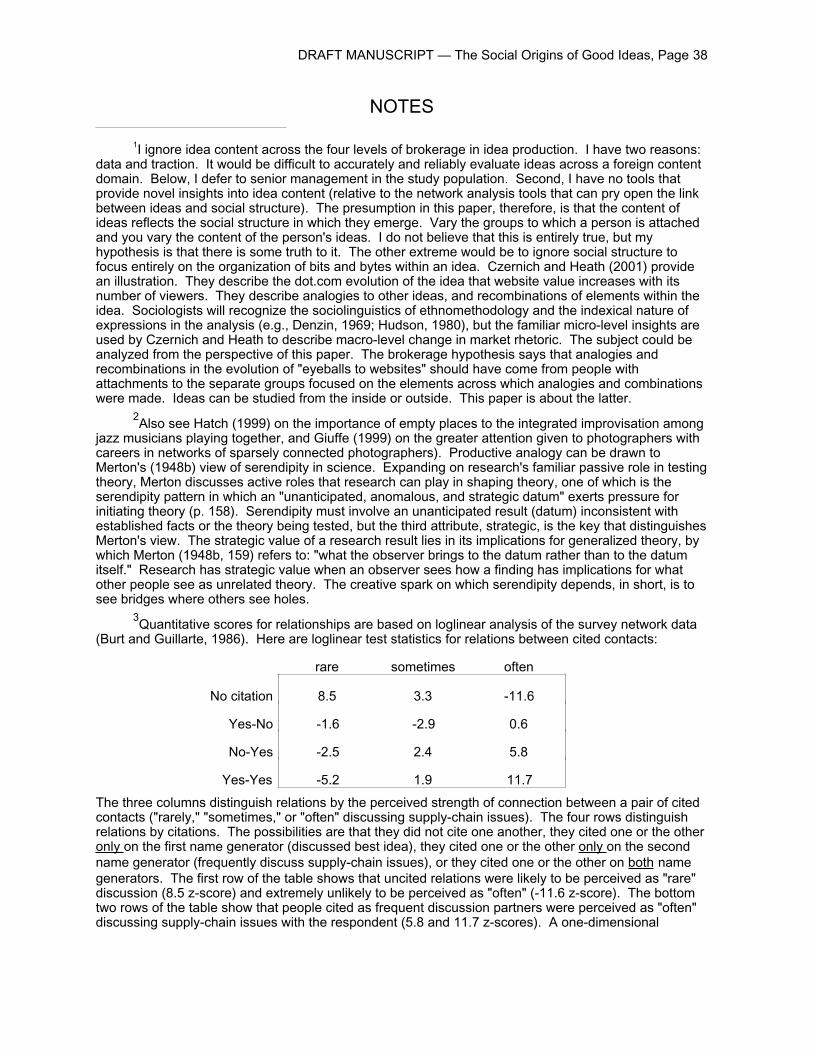
DRAFT MANUSCRIPT — The Social Origins of Good Ideas, Page 38
NOTES
1I ignore idea content across the four levels of brokerage in idea production. I have two reasons:data and traction. It would be difficult to accurately and reliably evaluate ideas across a foreign contentdomain. Below, I defer to senior management in the study population. Second, I have no tools thatprovide novel insights into idea content (relative to the network analysis tools that can pry open the linkbetween ideas and social structure). The presumption in this paper, therefore, is that the content ofideas reflects the social structure in which they emerge. Vary the groups to which a person is attachedand you vary the content of the person's ideas. I do not believe that this is entirely true, but myhypothesis is that there is some truth to it. The other extreme would be to ignore social structure tofocus entirely on the organization of bits and bytes within an idea. Czernich and Heath (2001) providean illustration. They describe the dot.com evolution of the idea that website value increases with itsnumber of viewers. They describe analogies to other ideas, and recombinations of elements within theidea. Sociologists will recognize the sociolinguistics of ethnomethodology and the indexical nature ofexpressions in the analysis (e.g., Denzin, 1969; Hudson, 1980), but the familiar micro-level insights areused by Czernich and Heath to describe macro-level change in market rhetoric. The subject could beanalyzed from the perspective of this paper. The brokerage hypothesis says that analogies andrecombinations in the evolution of "eyeballs to websites" should have come from people withattachments to the separate groups focused on the elements across which analogies and combinationswere made. Ideas can be studied from the inside or outside. This paper is about the latter.
2Also see Hatch (1999) on the importance of empty places to the integrated improvisation among
jazz musicians playing together, and Giuffe (1999) on the greater attention given to photographers withcareers in networks of sparsely connected photographers). Productive analogy can be drawn toMerton's (1948b) view of serendipity in science. Expanding on research's familiar passive role in testingtheory, Merton discusses active roles that research can play in shaping theory, one of which is theserendipity pattern in which an "unanticipated, anomalous, and strategic datum" exerts pressure forinitiating theory (p. 158). Serendipity must involve an unanticipated result (datum) inconsistent withestablished facts or the theory being tested, but the third attribute, strategic, is the key that distinguishesMerton's view. The strategic value of a research result lies in its implications for generalized theory, bywhich Merton (1948b, 159) refers to: "what the observer brings to the datum rather than to the datumitself." Research has strategic value when an observer sees how a finding has implications for whatother people see as unrelated theory. The creative spark on which serendipity depends, in short, is tosee bridges where others see holes.
3Quantitative scores for relationships are based on loglinear analysis of the survey network data
(Burt and Guillarte, 1986). Here are loglinear test statistics for relations between cited contacts:
rare sometimes often
No citation 8.5 3.3 -11.6
Yes-No -1.6 -2.9 0.6
No-Yes -2.5 2.4 5.8
Yes-Yes -5.2 1.9 11.7
The three columns distinguish relations by the perceived strength of connection between a pair of citedcontacts ("rarely," "sometimes," or "often" discussing supply-chain issues). The four rows distinguishrelations by citations. The possibilities are that they did not cite one another, they cited one or the otheronly on the first name generator (discussed best idea), they cited one or the other only on the secondname generator (frequently discuss supply-chain issues), or they cited one or the other on both namegenerators. The first row of the table shows that uncited relations were likely to be perceived as "rare"discussion (8.5 z-score) and extremely unlikely to be perceived as "often" (-11.6 z-score). The bottomtwo rows of the table show that people cited as frequent discussion partners were perceived as "often"discussing supply-chain issues with the respondent (5.8 and 11.7 z-scores). A one-dimensional

DRAFT MANUSCRIPT — The Social Origins of Good Ideas, Page 39
loglinear association model yields the following raw scores for the rows and columns: -.74, -.06, .45, and.65 for the rows, -.76, .15, and .64 for the columns. Normalizing raw scores to vary from zero (minimumconnection) to one (maximum connection) yields the scores in Table 2.
4On the first point, note the increasing percent mutual in the middle column of Table 2. On the
second point, note that the 11 relations observed twice in the first row of Table 2 are 2% of all relationsin that row, which increases to the 287 relations observed two or more times in the bottom row, whichconstitute 21% of the bottom-row relations. On the third point, note the increasing percent often in thelast column of Table 2 (and see the first row of loglinear results in the preceding footnote). Another wayto see the pattern is to distinguish relations by the number of times they were reported in the survey,then describe the percent of relations cited as discussion partners:
Once Twice Three or more
Rarely 3% 0% no observations
Sometimes 12% 15% 100%
Often 18% 52% 77%
where the rows distinguish relations by colleague perceptions and the columns distinguish the numberof times that the relationship was reported in the survey. For example, the first row contains 615relations between people reported as "rarely" discussing supply-chain issues. Eight of the relationswere reported twice and in none of the relations did one manager cite the other (0%). The other 607were reported just once and in 16 of them one manager cited the other as a discussion partner (3%).The point illustrated is that cited discussion partners were unlikely to be reported as "rarely" discussingsupply-chain issues. Direct citations between managers were more likely when the two managers wereperceived to "sometimes" discuss supply-chain issues. Most "sometimes" relations were observedonce, but seventy were reported two or three times (none more than three times). Direct citations wereespecially likely between managers perceived to "often" discuss supply-chain issues; 18% likely inrelations reported once, 52% likely in relations reported twice, and 77% likely in relations reported threeor more times (the category of "three or more" contains 28 relations reported as "often" by threerespondents, 13 reported by four respondents, six reported by five respondents, one reported by six,and one reported by seven respondents).
5This is evident in the first row of loglinear results in footnote 3, the near-zero percent rare in all
but the first row of the second to the last column in Table 2, or the table in the preceding footnoteshowing a lack of direct citations between people reported as "rarely" discussing supply-chain issues.
6To depict this large sociogram, I used computer software circulated under the name InFlow by
an organization consultant, Valdis Krebs. Documentation on the software is minimal. My statementabout how people are positioned in Figure 2 is based on conversation with the author. Furtherinformation on the software can be found at the author's URL (http://www.orgnet.com).
7The index begins with the extent to which manager i’s network is directly or indirectly invested in
the manager's relationship with contact j: cij = (pij + Σqpiqpqj)2, for q ≠ i,j, where pij is the proportion ofi’s network time and energy invested in contact j, pij = zij / Σqziq, and variable zij measures the zero toone strength of connection between contacts i and j (footnote 3). The total in parentheses is theproportion of i’s relations that are directly or indirectly invested in connection with contact j. The sum ofsquared proportions, Σicij, is the network constraint index C. I multiply scores by 100 and report integerscores.
8I considered two alternative boundary definitions. One was to preserve asymmetry: Manager i
would be in i's network only if i cites j. It seemed unwise to read the survey data this closely given thenumber of people who did not respond to the survey, the uneven availability of data between the centerand periphery of the network (discussed in the text), and the small, ego-centric networks that wouldresult (reported in Figure 2, average network size would drop from 5.0 to 2.9 and average networkconstraint would increase from 60.5 points to 81.0; see previous footnote for the network-constraint
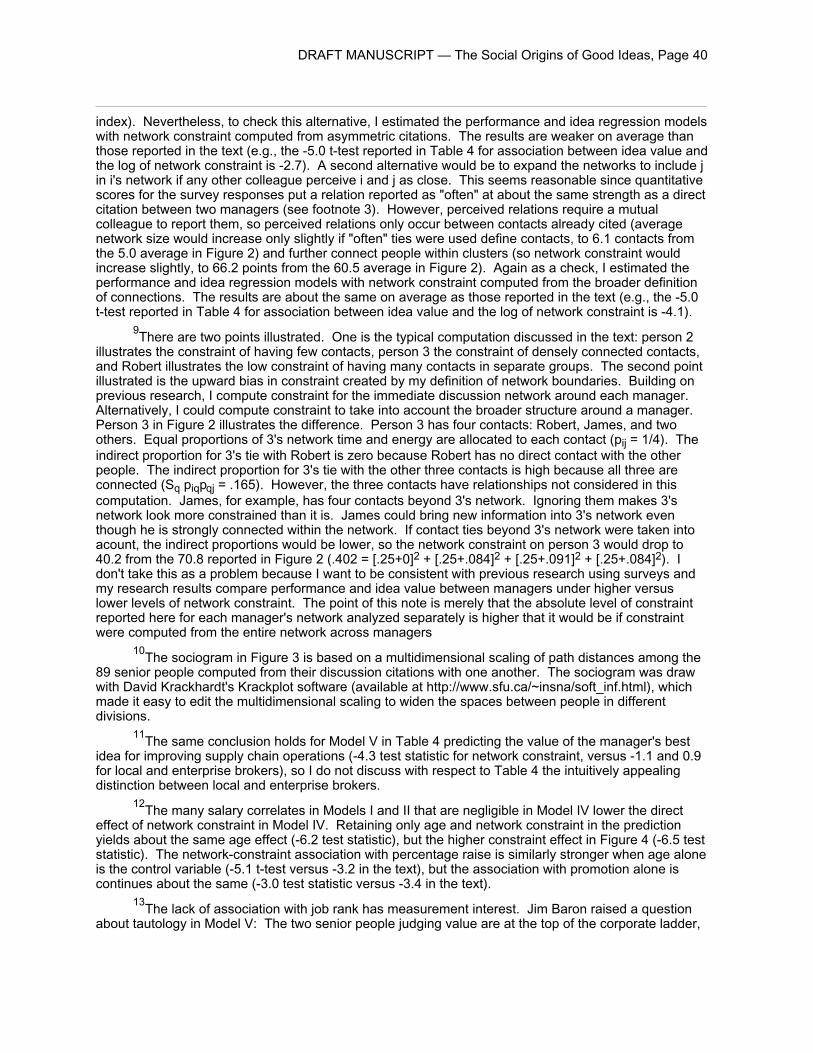
DRAFT MANUSCRIPT — The Social Origins of Good Ideas, Page 40
index). Nevertheless, to check this alternative, I estimated the performance and idea regression modelswith network constraint computed from asymmetric citations. The results are weaker on average thanthose reported in the text (e.g., the -5.0 t-test reported in Table 4 for association between idea value andthe log of network constraint is -2.7). A second alternative would be to expand the networks to include jin i's network if any other colleague perceive i and j as close. This seems reasonable since quantitativescores for the survey responses put a relation reported as "often" at about the same strength as a directcitation between two managers (see footnote 3). However, perceived relations require a mutualcolleague to report them, so perceived relations only occur between contacts already cited (averagenetwork size would increase only slightly if "often" ties were used define contacts, to 6.1 contacts fromthe 5.0 average in Figure 2) and further connect people within clusters (so network constraint wouldincrease slightly, to 66.2 points from the 60.5 average in Figure 2). Again as a check, I estimated theperformance and idea regression models with network constraint computed from the broader definitionof connections. The results are about the same on average as those reported in the text (e.g., the -5.0t-test reported in Table 4 for association between idea value and the log of network constraint is -4.1).
9There are two points illustrated. One is the typical computation discussed in the text: person 2
illustrates the constraint of having few contacts, person 3 the constraint of densely connected contacts,and Robert illustrates the low constraint of having many contacts in separate groups. The second pointillustrated is the upward bias in constraint created by my definition of network boundaries. Building onprevious research, I compute constraint for the immediate discussion network around each manager.Alternatively, I could compute constraint to take into account the broader structure around a manager.Person 3 in Figure 2 illustrates the difference. Person 3 has four contacts: Robert, James, and twoothers. Equal proportions of 3's network time and energy are allocated to each contact (pij = 1/4). Theindirect proportion for 3's tie with Robert is zero because Robert has no direct contact with the otherpeople. The indirect proportion for 3's tie with the other three contacts is high because all three areconnected (Sq piqpqj = .165). However, the three contacts have relationships not considered in thiscomputation. James, for example, has four contacts beyond 3's network. Ignoring them makes 3'snetwork look more constrained than it is. James could bring new information into 3's network eventhough he is strongly connected within the network. If contact ties beyond 3's network were taken intoacount, the indirect proportions would be lower, so the network constraint on person 3 would drop to40.2 from the 70.8 reported in Figure 2 (.402 = [.25+0]2 + [.25+.084]2 + [.25+.091]2 + [.25+.084]2). Idon't take this as a problem because I want to be consistent with previous research using surveys andmy research results compare performance and idea value between managers under higher versuslower levels of network constraint. The point of this note is merely that the absolute level of constraintreported here for each manager's network analyzed separately is higher that it would be if constraintwere computed from the entire network across managers
10The sociogram in Figure 3 is based on a multidimensional scaling of path distances among the
89 senior people computed from their discussion citations with one another. The sociogram was drawwith David Krackhardt's Krackplot software (available at http://www.sfu.ca/~insna/soft_inf.html), whichmade it easy to edit the multidimensional scaling to widen the spaces between people in differentdivisions.
11The same conclusion holds for Model V in Table 4 predicting the value of the manager's best
idea for improving supply chain operations (-4.3 test statistic for network constraint, versus -1.1 and 0.9for local and enterprise brokers), so I do not discuss with respect to Table 4 the intuitively appealingdistinction between local and enterprise brokers.
12The many salary correlates in Models I and II that are negligible in Model IV lower the direct
effect of network constraint in Model IV. Retaining only age and network constraint in the predictionyields about the same age effect (-6.2 test statistic), but the higher constraint effect in Figure 4 (-6.5 teststatistic). The network-constraint association with percentage raise is similarly stronger when age aloneis the control variable (-5.1 t-test versus -3.2 in the text), but the association with promotion alone iscontinues about the same (-3.0 test statistic versus -3.4 in the text).
13The lack of association with job rank has measurement interest. Jim Baron raised a question
about tautology in Model V: The two senior people judging value are at the top of the corporate ladder,

DRAFT MANUSCRIPT — The Social Origins of Good Ideas, Page 41
so the ideas that they would find valuable are the ideas most relevant to their personal concerns withintegrating across business units — which would be the ideas of managers who have discussionpartners in other business units. Therefore, it would not be surprising to find this measure of valueassociated with brokerage. A generic response is to defer to the people in charge. The perceptions ofthe most senior managers guide the allocation of this company's resources to people and projects.What they see as value is what is valuable in this organization. The job-rank results offer anotherresponse. If there is an ego-centric bias in the perception of value by the two senior people judgingvalue then ratings should increase with job rank because people of higher rank have job concerns moresimilar to the two most senior people. Judged value does increase with the job rank of the personproposing an idea, but the association disappears when network constraint is held constant. I do notthink that the judges were impressed with ideas relevant to their own jobs so much as they wereimpressed with the extent to which an idea reflected alternative ways of thinking or behaving. Adefinitive answer to Baron's question, however, requires an experimental design in which idea value isjudged under a mix of two factors: idea similarity to the concerns of the person judging value, and ideaquality reflecting alternative ways of thinking and behaving.
14Another measure of individual ability shows the same lack of direct association with value: 114
people in the study population had graduated from the company's Strategic Leadership Program (SLP).I have the grade on a four-point scale that each received in the program. Managers whose networksspan structural holes do well in the Strategic Leadership Program (-4.1 t-test for the associationbetween SLP grade and network constraint), but the rated value of their idea for improving supply-chainoperations is associated with their network, not their program performance (regressing value over SLPgrade and network constraint yields a 0.3 t-test for SLP grade and -3.3 t-test for network constraint). Ialso have the grade on a 100-point scale that 59 people received on a conceptual examinationadministered during a special session of the SLP for key people in the supply chain, but examinationgrades are uncorrelated with idea value, SLP grade, and network constraint (.10, .17, and -.11respectively).
15Chip Heath noted another possible rating bias. The two senior managers, familiar with their
own operations, might recognize and over-praise an idea from one of their subordinates. Rivalry is arelated possibility. The two judges ran the two largest supply-chain operations in the company, socompetition between them was inevitable. Feelings of competition might result in lower ratings for ideasfrom the rival organization. Neither bias was statistically significant in the ratings. I regressed ratingsfrom each judge over two dummy variables (with controls for the rank of the respondent proposing anidea and the sequential order in which an idea was evaluated). One dummy variable identifiedrespondents in the judge's own division. The other dummy variable distinguished respondents in theother judge's division. The reference group was respondents in neither division. Ratings were biased inthe expected direction, but negligibly so (0.9 t-test for positive evaluations of ideas within a judge's owndivision, -1.3 t-test for evaluations of ideas from the other judge's division).
16The brokerage effect in Model VIII is stable across three alternative variables measuring
manager effort in mobilizing colleague interest in an idea. In an ordinal logit model predicting threecategories of targeted discussion (no discussion, discussion with unknown colleague, discussion withnamed colleagues), there are no statistically significant associations with any of the control variables inModel VIII (including length of explanation, 1.8 test statistic), and there is the strong negativeassociation with network constraint (-3.4 test statistic). The same is true for an ordinal logit modelpredicting three categories of discussion effort (no discussion, discussion with one named colleague,discussion with multiple colleague; -2.8 test statistic for brokerage), and an ordinal logit modeldistinguishing action from discussion (no discussion, discussion only, discussion and action where thethird category contains the 16 managers distinguished in the Conclusion section for trying to mobilizesupport for their idea; -3.9 test statistic for brokerage).
17Of the 2,790 contacts, 1,991 could be ordered by network constraint. Where contacts posed
the same level of constraint (for example, a network in which every contact discusses work frequentlywith every other contact), another 61 contacts could be ordered by putting colleagues in the manager'sbusiness unit ahead of contacts in other business units (there are so few because most discussionpartners were in the same business unit). Another 443 contacts could be ordered by their years of

DRAFT MANUSCRIPT — The Social Origins of Good Ideas, Page 42
relationship with the manager, which left 295 contacts to be ordered at random within same level ofnetwork constraint, same business unit, and same years known to manager.
18The survey generated 2,790 contacts for the 455 managers proposing an idea for improving
supply-chain operations. The contacts are discussion partners cited by the 455 managers, and peopleciting the managers as discussion partners. All test statistics computed from manager-contact relationshave been adjusted for autocorrelation within manager networks (e.g., Kish and Frankel 1974).Network constraint is correlated across relations within a network (connection between two contactsincreases the level of network constraint they each pose) so the autocorrelation adjustment is large (9.2test statistic in the text is 12.7 without the autocorrelation adjustment). The adjustment is lesssubstantial for best-idea discussion (e.g., the 5.3 test statistic in Table 5 for discussion with the boss is5.9 without autocorrelation adjustment).
19I measured relative centrality as follows: Let Rcij be the network constraint that contact j posesfor manager i relative to the maximum posed by any of the manager's contacts: Rcij = cij/(max cij),where cij is network constraint defined in footnote 7. Rcij equals 1.0 for the contact posing the mostsevere constraint on manager i, whether the cij level of constraint is high or low. The 10.1 test statisticin the text is for a logit model predicting from Rcij which of a manager's contacts were cited for ideadiscussion: the probability of being cited increases sharply as relative constraint approches its maximum(3.18 intercept, 2.42 logit coefficient).
20There are alternative decision rules that would capture the idea of informal supervision. I triedsome alternatives and obtained similar results, so I stayed with the simple rule in the text. One rule wasto exclude the formal boss from being an informal boss (a manager could have a formal and an informalboss, but not in the same person; 9.3 test statistic in Model XI for informal boss becomes 9.4). Anotherrule was to limit informal bosses to the managers who had not included the formal boss in theirdiscussion network (a manager could have a formal or informal boss in their discussion network, but notboth; 9.3 test statistic for informal boss becomes 7.7). A third rule was to limit the control variable forhigher-rank contacts such that the "higher-rank" variable in Table 5 equals zero if a higher-rank contactis either the formal or informal boss to the manager whose discussion is being predicted (9.3 teststatistic for informal boss in Model XI becomes 9.5).
21I added a record to the Table 5 data for each of the 314 managers whose immediate supervisorwas not in his or her discussion network. The record represented the manager's relationship with his orher formal boss. Going down the predictors in Model XI, the record contained zero for the first fivepredictors (since the formal boss was not among the manager's five most central contacts), one for thesame business unit, zero for lower rank, one for higher rank, one for formal boss, and zero for informalboss (the immediate supervisor must not have been an informal boss because he or she had not beenincluded in the manager's discussion network). I dropped the two statistically negligible years-knownvariables in Table 5. Estimating the model with all 2,442 observations (in place of the 2,128 in Table 5)shows that the formal boss, on average, was unlikely to be the person with whom managers discussedtheir best idea (0.5 test statistic versus 4.0 in Table 5). The most likely discussion partner is theinformal boss (8.7 test statistic), and again the three most-central contacts are disproportionately likelyto be cited for best-idea discussion (test statistics for the four most-central contacts are 2.4, 3.6, 2.2,and 0.5 respectively).

DRAFT MANUSCRIPT — The Social Origins of Good Ideas, Page 43
REFERENCESAhuja, Gautam (2000) “Collaboration Networks, Structural Holes, and Innovation: A
Longitudinal Study." Administrative Science Quarterly 45:425-455.
Allen, Thomas J. and Saul Cohen (1969) “Information Flow in R&D Labs.“Administrative Science Quarterly 14:12-19.
Barley, Stephen R. (1990) “The Alignment of Technology and Structure Through Rolesand Networks.“ Administrative Science Quarterly 35: 61-103.
Baum, Joel A. C., Tony Calabrese, and Brian S. Silverman (2000) “Don’t Go it Alone:Alliance Network Composition and Startups’ Performance in CanadianBiotechnology.” Strategic Management Journal 21: 267-294.
Becker, Gary S. and Kevin M. Murphy (1992) "The division of labor, coordination costs,and knowledge." Quarterly Journal of Economics 107:1137-1160.
Beckman, Christine M. and Pamela R. Haunschild (2002) "Network learning: the effectsof partners' heterogeneity of experience on corporate acquisitions."Administrative Science Quarterly 47: 92-124.
Blau, Peter M. (1955) The Dynamics of Bureaucracy. Chicago: University of ChicagoPress.
Blau, Peter M. (1977) Heterogeneity and Inequality. New York: Free Press.
Burt, Ronald S. (1982) Toward a Structural Theory of Action. New York: AcademicPress.
Burt, Ronald S. (1992) Structural Holes. Cambridge, MA: Harvard University Press.
Burt, Ronald S. (1997) “The Contingent Value of Social Capital.“ Administrative ScienceQuarterly 42:339-365.
Burt, Ronald S. (1999) “The Social Capital of Opinion Leaders.“ Annals 566:37-54.
Burt, Ronald S. (2000) “The Network Structure of Social Capital.” Pp. 345-423 inResearch in Organizational Behavior, edited by Robert I. Sutton and Barry M.Staw. Greenwich, CT: JAI Press.
Burt, Ronald S. (2002) “The social capital of structural holes.” Pp. 148-192 in The NewEconomic Sociology, edited by Mauro F. Guillén, Randall Collins, Paula England,and Marshall Meyer. New York: Russell Sage Foundation.
Burt, Ronald S. and Miguel Guillarte (1986) "A note on scaling the General SocialSurvey network data." Social Networks 8: 387-396.
Caro, Robert A. (1982) The Path to Power. New York: Alfred A. Knopf.
Cockburn, Iain M. and Rebecca M. Henderson (1998) “Absorptive Capacity,Coauthoring Behavior, and the Organization of Research in Drug Discovery.“Journal of Industrial Economics 64: 157-182.
Cohen, Wesley M. and Daniel A. Levinthal (1990) “Absorptive Capacity: A NewPerspective on Learning and Innovation.“ Administrative Science Quarterly 35:128-152.
Collins, Randall (1998) The Sociology of Philosophies. Cambridge, MA: HarvardUniversity Press.

DRAFT MANUSCRIPT — The Social Origins of Good Ideas, Page 44
Czernich, Christian and Chip Heath (2001) "Toward a theory of variation in idea-markets: attracting 'eyeballs' to websites during the dot-com boom and bust."Working paper, Graduate School of Business, Stanford University.
Dalzell, Robert F. (1987) Enterprising Elite. New York: W. W. Norton.
Denzin, Norman K. (1969) "Symbolic interactionism and ethnomethodology: a proposedsynthesis." American Sociological Review 34: 922-934.
DiMaggio, Paul (1992) “Nadel’s Paradox Revisited: Relational and Cultural Aspects ofOrganizational Structure.“ Pp. 118-142 in Networks and Organizations, edited byNitin Nohria and Robert G. Eccles. Boston, MA: Harvard Business School Press.
Durkheim, Emile (1933 [1893]) The Division of Labor in Society, translated by GeorgeSimpson. New York: Free Press.
Feld, Scott L. (1981) "The focused organization of social ties." American Journal ofSociology 86:1015-1035.
Festinger, Leon, Stanley Schachter, and Kurt W. Back (1950) Social Pressures inInformal Groups. Stanford, CA: Stanford University Press.
Fleming, Lee (2002) "Finding the organizational sources of technological breakthroughs:the story of Hewlett-Packard's thermal ink-jet." Industrial and Corporate Change11: 1059-1084.
Geroski, Paul and Mariana Mazzucato (2002) "Learning and the sources of corporategrowth." Industrial and Corporate Change 11: 623-644.
Giuffe, Katherine A. (1999) “Sandpiles of Opportunity: Success in the Art World.“ SocialForces 77:815-832.
Granovetter, Mark S. (1973) “The Strength of Weak Ties.“ American Journal ofSociology 78:1360-1380.
Granovetter, Mark S. (2002) "A theoretical agenda for economic sociology." Pp. 46-80 inThe New Economic Sociology, edited by Mauro F. Guillén, Randall Collins, PaulaEngland, and Marshall Meyer. New York: Russell Sage Foundation.
Hargadon, Andrew B. and Robert I. Sutton (1997) “Technology Brokering andInnovation in a Product Development Firm.“ Administrative Science Quarterly 42:716-749.
Hatch, Mary Jo (1999) “Exploring the Empty Spaces of Organizing: How ImprovisationalJazz Helps Redescribe Organizational Structure.“ Organization Studies 20:75-100.
Hudson, R. A. (1980) Sociolinguistics. New York: Cambridge University Press.
Kish, Leslie and Martin R. Frankel (1974) “Inference from complex samples.” Journal ofthe Royal Statistical Society, Series A 36:1-37.
Knoke, David (2001) Changing Organizations. Boulder, CO: Westview Press.
Kogut, Bruce and Udo Zander (1996) “What Firms Do? Coordination, Identity, andLearning.“ Organization Science 7:502-518.
Kogut, Bruce (2000) The network as knowledge: generative rules and the emergence ofstructure. Strategic Management Journal 21: 405-425.

DRAFT MANUSCRIPT — The Social Origins of Good Ideas, Page 45
Koput, Kenneth and Walter W. Powell (2000) “Not Your Stepping Stone: Collaborationand the Dynamics of Industry Evolution in Biotechnology.“ Paper presented at theOrganization Science Winter Conference. Denver, CO (February, 2000).
Kuhn, Thomas S. (1962) The Structure of Scientific Revolutions. Chicago: University ofChicago Press.
Lazega, Emmanuel and Philippa E. Pattison (2001) “Social Capital as SocialMechanisms and Collective Assets: The Example of Status Auctions amongColleauges.“ Pp. 185-208 in Social Capital, edited by Nan Lin, Karen S. Cook,and Ronald S. Burt. Chicago, IL: Aldine de Gruyter.
Llobrera, Joseph T., David R. Meyer and Gregory Nammacher (2000) “Trajectories ofIndustrial Districts: Impact of Strategic Intervention in Medical Districts.“Economic Geography 76: 68-98.
Lofstrom, Shawn M. (2000) “Absorptive Capacity in Strategic Alliances: Investigating theEffects of Individuals’ Social and Human Capital on Inter-firm Learning.“ Paperpresented at the Organization Science Winter Conference. Denver, CO(February, 2000).
Marsden, Peter V. (1987) "Core discussion networks of Americans." AmericanSociological Review 52: 122-131.
Marsden, Peter V. (1990) "Network data and measurement." Annual Review ofSociology 16:435-463.
McEvily, Bill and Akbar Zaheer (1999) “Bridging Ties: A Source of Firm Heterogeneity inCompetitive Capabilities.“ Strategic Management Journal 20: 1133-1156.
McEvily, Bill and Alfred Marcus (2002) “Embeddedness and the acquisition ofcompetitive capabilities.“ Working Paper, Carnegie Mellon University.
McGuire, Patrick and Mark Granovetter (forthcoming) “The Social Construction of theElectric Utility Industry, 1878-1919.“ In Constructing Industries and Markets,edited by Joe Porac and Marc Ventresca. New York: Elsevier.
Merton, Robert K. (1968 [1948]) "The Bearing of Empirical Research on SociologicalTheory." Pp. 156-171 in Social Theory and Social Structure. New York: FreePress.
Milgram, Stanley (1967) "The small world problem." Psychology Today 1:61-67.
Mills, John Stuart (1987 [1848]) Principles of Political Economy. Fairchild, NJ: AugustusM. Kelley.
Morrison, Elizabeth Wolfe and Frances J. Milliken (2002) "Organizational silence: abarrier to change and development in a pluralistic world." Academy ofManagement Review 25: 706-725.
Nahapiet, Janine and Sumantra Ghoshal (1998) “Social Capital, Intellectual Capital, andthe Organization Advantage.“ Academy of Management Review 23:242-266.
Padgett, John F. and Christopher K. Ansell (1993) “Robust Action and the Rise of theMedici, 1400-1434.“ American Journal of Sociology 98:1259-1319.
Planck, Max (1968 [1949]) Scientific Autobiography and Other Papers. Westport, CT:Greenwood Publishing Group.

DRAFT MANUSCRIPT — The Social Origins of Good Ideas, Page 46
Podolny, Joel M. (2001) "Networks as the pipes and prisms of the market." AmericanJournal of Sociology 107:33-60.
Podolny, Joel M. and James N. Baron (1997) “Resources and relationships: socialnetworks and mobility in the workplace.” American Sociological Review 62: 673-693.
Powell, Walter W. and Laurel Smith-Doerr (1994) “Networks and economic life.“ Pp.368-402 in The Handbook of Economic Sociology, edited by Neil J. Smelser andRichard Swedberg. Princeton, NJ: Princeton University Press.
Powell, Walter W. and Peter Brantley (1992) “Competitive Cooperation inBiotechnology: Learning Through Networks?“ Pp. 366-394 in Networks andOrganizations, edited by Nitin Nohria and Robert G. Eccles. Boston, MA: HarvardBusiness School Press.
Powell, Walter W., Kenneth W. Koput and Laurel Smith-Doerr (1996)“Interorganizational Collaboration and the Locus of Innovation: Networks ofLearning in Biotechnology.“ Administrative Science Quarterly 41: 116-145.
Powell, Walter W., Kenneth W. Koput, Laurel Smith-Doerr and Jason Owen-Smith(1999) “Network Position and Firm Performance: Organizational Returns toCollaboration.“ Pp. 129-160 in Research in the Sociology of Organizations, editedby Steven Andrews and David Knoke. Greenwich, CT: JAI Press.
Ruef, Martin (2002) "Strong ties, weak ties and islands: structural and cultural predictorsof organizational innovation." Industrial and Corporate Change 11: 427-449.
Sediatis, Judith (1998) “The Alliances of Spin-offs Versus Start-ups: Social Ties in theGenesis of Post-Soviet Alliances.“ Organization Science 9:368-381.
Shan, Weijian, Gordon Walker and Bruce Kogut (1994) “Interfirm Cooperation andStartup Innovation in the Biotechnology Industry.“ Strategic Management Journal15:387-394.
Shane, Scott and Daniel Cable (2002) "Network ties, reputation, and the financing ofnew ventures." Management Science 48: 364-381.
Smith, Adam (1982 [1766]) Lectures on Jurisprudence. Indianapolis, IN: Liberty Fund.
Stephan, Paula E. and Sharon G. Levin (1992) Striking the Mother Lode in Science.New York: Oxford University Press.
Stewart, Thomas A. (1996) “The Great Conundrum: You vs. the Team.“ Fortune 134(November):165-166.
Stuart, Toby E. (1998) “Producer Network Positions and Propensities to Collaborate: AnInvestigation of Strategic Alliance Formations in a High-technology Industry.“Administrative Science Quarterly 43: 668-698.
Stuart, Toby E. and David T. Robinson (2000) “Network Effects in the Governance ofStrategic Alliances in Biotechnology.“ Paper presented at the OrganizationScience Winter Conference. Denver, CO (February, 2000).
Stuart, Toby E. and Joel M. Podolny (1999) “Positional Causes and Correlates ofStrategic Alliances in the Semiconductor Industry.“ Pp. 161-182 in Research inthe Sociology of Organizations, edited by Steven Andrews and David Knoke.Greenwich, CT: JAI Press.

DRAFT MANUSCRIPT — The Social Origins of Good Ideas, Page 47
Stuart, Toby E., Ha Hoang, and Ralph C. Hybels (1999) “InterorganizationalEndorsements and the Performance of Entrepreneurial Ventures.“ AdministrativeScience Quarterly 44:315-349.
Sutton, Robert I. and Andrew B. Hargadon (1996) “Brainstorming Groups in Context:Effectiveness in a Product Design Firm.“ Administrative Science Quarterly41:685-718.
Swedberg, Richard (1990) Economics and Sociology. Princeton, NJ: PrincetonUniversity Press.
Travers, Jeffrey and Stanley Milgram (1969) "An experimental study of the small worldphenomenon." Sociometry 32:425-443.
Von Hippel, Eric (1988) The Sources of Innovation. New York: Oxford University Press.
Walker, Gordon, Bruce Kogut and Weijian Shan (1997) “Social Capital, Structural Holesand the Formation of an Industry Network.“ Organization Science 8:109-125.
Watts, Duncan J. (1999) "Networks, dynamics, and the small-world phenomenon."American Journal of Sociology 105-493-527.
Watts, Duncan J. and Steven H. Strogatz (1998) "Collective dynamics of 'small-world'networks." Nature 393: 440-442.
Williams, Katherine Y. and Charles A. O’Reilly III (1998) “Demography and Diversity inOrganizations: A Review of 40 Years of Research.“ Pp. 77-140 in Research inOrganizational Behavior, edited by Barry M. Staw and L. L. Cummings.Greenwich, CT: JAI Press.
Zander, Udo and Bruce Kogut (1995) “Knowledge and the Speed of the Transfer andImitation of Organizational Capabilities: An Empirical Test.“ Organization Science6: 76-92.
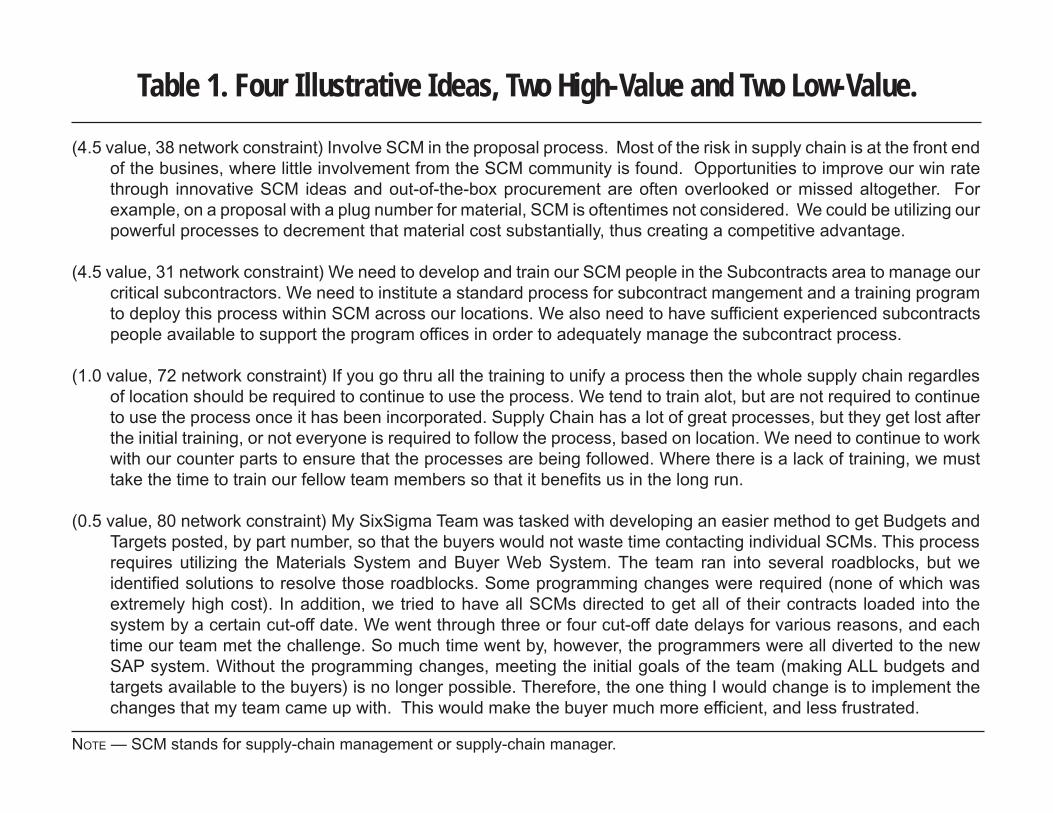
Table 1. Four Illustrative Ideas, Two High-Value and Two Low-Value.
(4.5 value, 38 network constraint) Involve SCM in the proposal process. Most of the risk in supply chain is at the front end
of the busines, where little involvement from the SCM community is found. Opportunities to improve our win rate
through innovative SCM ideas and out-of-the-box procurement are often overlooked or missed altogether. For
example, on a proposal with a plug number for material, SCM is oftentimes not considered. We could be utilizing our
powerful processes to decrement that material cost substantially, thus creating a competitive advantage.
(4.5 value, 31 network constraint) We need to develop and train our SCM people in the Subcontracts area to manage our
critical subcontractors. We need to institute a standard process for subcontract mangement and a training program
to deploy this process within SCM across our locations. We also need to have sufficient experienced subcontracts
people available to support the program offices in order to adequately manage the subcontract process.
(1.0 value, 72 network constraint) If you go thru all the training to unify a process then the whole supply chain regardles
of location should be required to continue to use the process. We tend to train alot, but are not required to continue
to use the process once it has been incorporated. Supply Chain has a lot of great processes, but they get lost after
the initial training, or not everyone is required to follow the process, based on location. We need to continue to work
with our counter parts to ensure that the processes are being followed. Where there is a lack of training, we must
take the time to train our fellow team members so that it benefits us in the long run.
(0.5 value, 80 network constraint) My SixSigma Team was tasked with developing an easier method to get Budgets and
Targets posted, by part number, so that the buyers would not waste time contacting individual SCMs. This process
requires utilizing the Materials System and Buyer Web System. The team ran into several roadblocks, but we
identified solutions to resolve those roadblocks. Some programming changes were required (none of which was
extremely high cost). In addition, we tried to have all SCMs directed to get all of their contracts loaded into the
system by a certain cut-off date. We went through three or four cut-off date delays for various reasons, and each
time our team met the challenge. So much time went by, however, the programmers were all diverted to the new
SAP system. Without the programming changes, meeting the initial goals of the team (making ALL budgets and
targets available to the buyers) is no longer possible. Therefore, the one thing I would change is to implement the
changes that my team came up with. This would make the buyer much more efficient, and less frustrated.
NOTE — SCM stands for supply-chain management or supply-chain manager.

Table 2. Connections in the Supply Chain
Strength of Connection between Two People
and Survey Criterion for Connection
0.00 Neither person cited the other (includes
colleagues saying that the two “rarely”
discussed supply-chain issues).
0.50 One cited the other only as someone
with whom their best idea was
discussed.
0.65 Colleagues said the two “sometimes”
discussed supply-chain issues (no direct
citation between the two).
0.86 One cited the other as someone with
whom he or she frequently discussed
supply-chain issues, but not as
someone with whom the best idea was
discussed.
1.00 Colleague(s) said the two people “often”
discussed supply-chain issues, or one
person cited the other both as someone
with whom the best idea was discussed
and supply-chain issues were frequently
discussed.
TOTAL (mean or frequency)
One
569
318
636
984
1076
3583
Number of Times
Reported in Survey
Two
11
12
34
130
176
363
Three or
More
0
3
5
74
111
193
Percent
Mutual
Citations
0%
0.5%
0%
2.8%
10.1%
2.2%
Mean
Years
Known
—
8.3
—
7.9
8.5
8.1
Total
Number
Relations
580
333
675
1188
1363
4138
“Rare”
100.0%
0.6%
1.5%
0.8%
0.6%
14.8%
“Often”
0%
3.3%
1.8%
12.8%
72.9%
28.2%
Percent Reported
as:

Table 3. Predicting Performance
NOTE — Coefficients in Models I and II are change in salary dollars with a unit increase in row variable (respectively .80 and .83
squared multiple correlations; network effect plotted in Figure 4). Coefficients in Model III predict three levels of evaluation for an
ordinal logit model (114.8 chi-square with 17 d.f; network effects are plotted in Figure 4 holding age constant). Coefficients in Model
IV are for a logit model predicting whether the employee was promoted in the year after the network survey or received an above
average raise (100.5 chi-square with 17 d.f.; network effect is plotted in Figure 4 holding age constant). Standard errors are given
in parentheses (* P < .05, ** P < .001).
Manager 1
Manager 2
Manager 3 (reference)
Sr. Manager
Executive
Purchasing
Age
Bachelor
Graduate
HighTech
LowTech
Urban 1
Urban 2
Network Constraint
Mgr2 * Constraint
Mgr3 * Constraint
SrMgr * Constraint
Executive * Constraint
-31,099
-16,652
——
19,638
65,394
754
338
1,610
734
3,516
-6,927
3,613
5,049
-7
-19
-47
-214
-681
(2,882)
(2,745)
(3,782)
(4,522)
(1,351)
(52)
(1,003)
(864)
(880)
(1,481)
(1,046)
(1,010)
(25)
(35)
(38)
(75)
(124)
**
**
**
**
**
**
**
**
**
*
**
-35,707
-19,892
——
15,484
61,930
1,811
300
200
-451
3,150
-6,607
3,947
5,585
-1
-47
-159
-216
-697
(3,498)
(3,479)
(4,143)
(4,835)
(1,884)
(71)
(1,401)
(1,155)
(1,189)
(2,375)
(1,456)
(1,427)
(38)
(58)
(59)
(84)
(132)
**
**
**
**
**
*
*
**
*
*
*
**
I.Salary
(n=673)
II.Salary
(n=398)
-.973
-.863
——
.116
.423
.410
-.085
-.211
-.208
.087
-.351
.423
-.564
-.014
.004
-.007
-.005
-.011
(.678)
(.631)
(.843)
(1.01)
(.313)
(.013)
(.237)
(.203)
(.209)
(.342)
(.247)
(.238)
(.004)
(.008)
(.009)
(.017)
(.028)
**
**
III.Evaluation
(n=673)
.689
1.165
——
-.635
.221
.478
-.084
.118
.182
.162
-.409
-.152
-.052
-.022
-.008
.003
.010
.024
(.670)
(.648)
(.885)
(1.08)
(.345)
(.013)
(.240)
(.204)
(.210)
(.378)
(.252)
(.243)
(.006)
(.009)
(.009)
(.019)
(.030)
**
**
IV.Promotion
(n=638)

Table 4. Predicting Best Idea
NOTE — Network constraint is the log of constraint in this table. Model V predicts idea value on a one-to-five scale (.15 squared
multiple correlation; network effect plotted in Figure 5). Models VI to VIII are logit predictions of the idea being dismissed (64.6 chi-
square with 13 d.f.; network effect plotted in Figure 5), no idea being expressed (177.2 chi-square with 13 d.f.; network effect plotted
in Figure 5), and discussing the idea with a named colleague (35.2 chi-square with 15 d.f.). Standard errors are given in parentheses
Intercept
Manager 1
Manager 2
Manager 3 (reference)
Sr. Manager
Executive
Purchasing
Age
Bachelor
Graduate
HighTech
LowTech
Urban 1
Urban 2
Length of Idea
Sequential Order
Network Constraint
4.082
-.228
-.133
——
.042
.291
.335
.004
.226
.094
.086
.404
.004
.071
-.0002
-.0005
-.694
(.159)
(.168)
(.276)
(.336)
(.177)
(.008)
(.148)
(.143)
(.138)
(.231)
(.183)
(.174)
(.0002)
(.0005)
(.144) **
-3.739
.721
.287
——
——
——
-.715
-.006
-.472
-.367
.071
-.595
-.590
-.277
-.0001
.0011
.972
(.285)
(.313)
(.513)
(.015)
(.266)
(.289)
(.260)
(.465)
(.371)
(.332)
(.0005)
(.0010)
(.281)
*
**
V.Idea Value
(n=455)
VI.Idea Dismissed
(n=455)
-9.689
-.015
-.054
——
.401
.438
.399
-.012
-.101
-.205
-.099
.697
.488
.323
——
——
2.356
(.281)
(.283)
(.458)
(.621)
(.322)
(.012)
(.239)
(.210)
(.212)
(.372)
(.253)
(.243)
(.243) **
VII.No Idea
(n=673)
5.328
-.300
.067
——
-.295
.210
-.160
-.013
-.019
.198
-.151
.338
.165
-.531
.0013
-.0006
-.939
(.290)
(.319)
(.525)
(.758)
(.323)
(.015)
(.267)
(.270)
(.251)
(.451)
(.349)
(.313)
(.0006)
(.0010)
(.267)
*
**
VIII.Discuss Idea
(n=455)

Table 5. Predicting Contact Selected to Discuss Best Idea
NOTE — These are logit equations predicting whom among a manager’s contacts was selected to discuss the manager’s best idea
(169.4 chi-square with 5 d.f. for Model IX, 252.5 chi-square with 11 d.f. for Model X, 316.4 chi-square with 12 d.f. for Model XI). The
first five predictors refer to the first five positions in the rank order displayed in Figure 6. Standard errors in parentheses are adjusted
for autocorrelation between contacts attached to the same manager (* P < .05, ** P < .001).
Intercept
Contact Most Central in Manager’s Network
Second-most Central Contact
Third-most Central Contact
Fourth-most Central Contact
Fifth-most Central Contact
Years Manager Has Known Contact
Contact Known for a Decade or More
Contact in the Manager’s Own Business Unit
Contact in Lower Job Rank
Contact in Higher Job Rank
Formal Boss
Informal Boss
-2.623
2.175
1.698
.832
.119
.199
(.207)
(.218)
(.233)
(.283)
(.281)
**
**
**
IX.(n=2,128)
-2.829
1.454
1.195
.331
-.345
-.195
-.036
-.278
.768
-1.445
.781
1.373
(.228)
(.229)
(.252)
(.299)
(.295)
(.021)
(.275)
(.332)
(.321)
(.155)
(.253)
**
**
*
**
**
**
X.(n=2,128)
-2.630
.453
.859
.291
-.390
-.115
-.036
-.232
.664
-1.411
.006
1.154
2.107
(.290)
(.245)
(.259)
(.321)
(.297)
(.021)
(.289)
(.334)
(.330)
(.184)
(.293)
(.227)
**
*
**
**
**
XI.(n=2,128)
Figure 1.Social Order of Markets and Organizations, Specialization vs Integration
James
Robert
1
23
54
6
7
A
B
C & D
25
1
0
100
29
Group A
Group B
Group C
Group D
Density Table
0
85
5
0
0
Network Constraint (C = Σj cij = Σj [pij + Σq piqpqj]2, i,j ≠ q)
person 2: .265 = [1 / 3.5 + 0]2 + [.5 / 3.5 + 0]2 + [1 / 3.5 + 0]2 + [1 / 3.5 + 0]2
person 3: .402 = [.25+0]2 + [.25+.084]2 + [.25+.091]2 + [.25+.084]2
Robert: .148 = [.077+0]2 + [.154+0]2 + [.154+0]2 + [.154+0]2 + [.154+0]2 + [.154+0]2 + [.154+0]2

66
300
100
205
102
202 366
402
641
569
398
584
625
227
234
301
403
140
194
328
381
331213
1
9
235
543
832
811
805
806675
1374
10211017
669
668
666
664
663
662
660
659
654
651
650
649
645
643
642
640
639
638
637636
635
634
633
632
631
628
627
617
616
615
614
613
612
611 610
609
605
604
601
599
598
597
594
593
592
591
590
589
588
587
585
581
580
578
577
574
572
571
567
566
565
562
561
560
559
558
557
556
554
553
551
550
549
547
546
545
544
541
540
539
537
536
535
534
533
532
531
530
529
528
527
526
524
523
522
521
520
519
518
516
515
514
513
512
511
510
509
508
507
504
503
501
500
499
498
497
496
492
490
489
488486
484
483
482
480
479
478
477
476
475
472
471
470
469
468
466
465
464
463
462
460
459
458
457
453
451
450
449
447
446
445
444
443
442
441
440
439
438
436
435
434
433
431
430429
427
426
425
424
423
422
421
420
419
418
417
416
414
412
410
409
408
407
406
405
404
400
399
397
395
394
393
392
391
388
387
386
384
382
379
378
377
376
374
370
369
368
367
365
362
359
357
355
353
350
346
344
343
342
340
338
337
335
332
330
329
326
325
324
323
322
318
314
313
311
309
308
307
306
303302
299
298
297
296292
291
289
287
285
284
283
282
280
279
278277
276
275
274
269
268
267
266
265
264
263
262
261
259
258
256
253
252
251
250
249248
247
246
245244 243
242
241
240
239
233
232
231
229
226
224
223
222
221
220
219
217
216
215
214
212
211
210
209
208
204
200
199
196
195
193
191
189
188
187
186
185
184
183181
178
177
176
175
173
170
168
166165
163
161
158
157
153
152
150
148
146
143
139
135
133
132
131
130
129
128
127
126
125
124
123
122
120
117
116
115
113
111110
106
105
103
101
99
98 97
95
94
92
91
90
89
88
86
85
84
82
7978
77
76
75
74
73
72
71
69
68
67
65
64
63
61
60
58
57
56
55
48
46
44
43
42
41
40
39
37
36
35
33
32
30
29
28
26
25
24
23
21
20
18
17
16
14
13 12
11
10
8
7
6
5
3
2
Supply-Chain
Discussion
Network(excludes 193
social isolates)
Mean PathDistance
(min-max)for the 476connected
managers ingraph
VP or Director (25) 0% 12.6 29.8 4.9 70.2 3.3 (2.7-4.2)
Senior Manager (41) 5% 8.5 37.3 3.8 78.1 3.7 (2.9-6.4)
Manager III (121) 11% 6.4 50.2 3.7 77.9 4.0 (3.0-6.4)
Manager II (199) 27% 4.1 65.0 2.8 83.1 4.3 (2.8-6.4)
Manager I (287) 44% 3.4 73.6 2.4 83.4 4.6 (3.4-7.4)
Mean (673) 29% 5.0 60.5 2.9 81.0 4.2 (2.7-7.4)
Figure 2. Supply-ChainDiscussion Network
(excludes 193 social isolates)

Figure 3. Core Network in the Supply Chain
193
1
202
519
235
468
88
510
660
634
219
406
403
227
140378
3
268
113
129
424
625
216
592
404
811
384
194
441
594
471
581
301
368
584
541
183
457 438
528
231283
106
638
593 28
511
205
423
813
370
381
365
504
640
264
276
209
615
248
25
366
26
263
123 76
665453
99
5
387
543
242
569
240372
336
193
1
9
202
519
235
402
468
88
510
234
634
219
406
100
403
227
140378
268
113
129
424
216
592
384
441
471
581
301
368
641
541
183
457 438
398
528
102
231283
106
638
59328
511
205
423
813
370365
504
640
264
276
209248
25
26
213
123 76
665453
99
387
543
569
336
66
300331
402
9
328
66234
398102
100
641
213
402
9
66234
398
100
213

Figure 4. Brokerage and Employee Performance
-4.0
-3.0
-2.0
-1.0
0.0
1.0
2.0
3.0
4.0
5.0
10 20 30 40 50 60 70 80 90 100
Sala
ry R
ela
tive t
o P
eers
(stu
den
tized
resid
ual)
Discussion Network Constraint (C) Around Employee
Y = 1.023 - .026 C
(-5.6 test statistic, black dots indicate Director or VP)
E
E
E
E
E
E
E
E
E
E
E
E
E
E
E
E
E
E
E
E
EE
E
EE
E
E
E
E
E
E
E
EE
E
E
E
E
E
E
E
E
E
E
E
EE
E
E
E
E
E
E
E
E
E
E
E
E
E
E
E
E EE
E
E
E
E
E
E
E
E
E
E
E
E
E
E
E
E
E
E
E
EEE
E
E
E
EE
E
E
E
E
E
E
E
JE
E
E
E
E
E
E
E
E
E
E
E
E
E
E
E
EE
E
E
E
E
E
EE
E
E
E
E
E
E
E
E
E
E
E
E
E
E
E
E
E
E
E
E
E
E
E
E
EE
E
E
E
E
E
E
E
E
E
E
E
EE
E
E
E
E
E
E
E
E
E
EE
E
E E
E
E
E
E
E
EE
J
J
J
J
J
J
J
J
J
J
J
J
J
J
J
J
J
J
J
J
JJ
J
J
E 0
0.1
0.2
0.3
0.4
0.5
0.6
0.7
10 20 30 40 50 60 70 80 90 100
Probability "Outstanding" Evaluation
(-5.0 logit test statistic)
Probability Promotion-Raise
(-6.5 logit test statistic)
Probability "Poor" Evaluation
(4.7 logit test statistic)

Figure 5. Brokerage and Employee Best Idea
^
Discussion Network Constraint (C) Around Person Offering Idea
Man
ag
em
en
t E
valu
ati
on
of
Idea's
Valu
e
Y = a + b ln(C)
Pro
bab
ilit
y
". . . for those ideas that were
either too local in nature,
incomprehensible, vague,
or too whiny, I didn't rate them"
P(dismiss)
E
E E
E
E
E
E
E
E
E
E
E
E
E
E
E
G
G
G
G
G
G
G
GG
G
G
G G
G
G
G
1
1.5
2
2.5
3
3.5
10 20 30 40 50 60 70 80 90 100
C
C
C
CC
C
C
C
C
C
C
C C C
C
C
J
J
J
J
J
J
J
J
J
J
J
J
J
J
J
J
J
J
0
0.1
0.2
0.3
0.4
0.5
0.6
0.7
0.8
0.9
10 20 30 40 50 60 70 80 90 100
a
6.42
4.08
5.51
b
-1.04
-.63
-.91
t
-5.8
-3.9
-7.4
Judge 1
Judge 2
Combined
^ P(no idea)
11.2 logit test statistic
^
^
5.5 logit
test statistic

Figure 6. Idea Discussion and Individual Contacts
1 2 3 4 5 6 7 8 9 10 11 12 13 14 15 16 17 18 19 20 21 22 23 240
50
100
150
200
250
300
Contacts Ordered from Most to Least Central in Manager's Network
Nu
mb
er
of
Co
nta
cts
Contact selected to discuss best idea
Contact not selected to discuss best idea
Contact of manager who didn't discuss best idea