social inequality and hiv-testing: comparing home- and ... filethis publication is part of the...
TRANSCRIPT

Demographic Research a free, expedited, online journal of peer-reviewed research and commentary in the population sciences published by the Max Planck Institute for Demographic Research Konrad-Zuse Str. 1, D-18057 Rostock · GERMANY www.demographic-research.org
DEMOGRAPHIC RESEARCH VOLUME 21, ARTICLE 21, PAGES 627-646 PUBLISHED 30 OCTOBER 2009 http://www.demographic-research.org/Volumes/Vol21/21/ DOI: 10.4054/DemRes.2009.21.21 Descriptive Findings
Social inequality and HIV-testing: Comparing home- and clinic-based testing in rural Malawi
Alexander Weinreb
Guy Stecklov This publication is part of the proposed Special Collection “HIV/AIDS in sub-Saharan Africa”, edited by Susan Watkins, Jere Behrman, Hans-Peter Kohler, and Simona Bignami-Van Assche. © 2009 Alexander Weinreb & Guy Stecklov.
This open-access work is published under the terms of the Creative Commons Attribution NonCommercial License 2.0 Germany, which permits use, reproduction & distribution in any medium for non-commercial purposes, provided the original author(s) and source are given credit. See http:// creativecommons.org/licenses/by-nc/2.0/de/
Table of Contents
1 Introduction 628 2 Inequality in HIV-testing 630 3 Institutional Response to testing problems 634 4 Data 635 5 Analysis 637 6 Results 639 7 Discussion 641 8 Acknowledgements 642 References 643
Demographic Research: Volume 21, Article 21 Descriptive Findings
http://www.demographic-research.org 627
Social inequality and HIV-testing: Comparing home- and clinic-based testing in rural Malawi
Alexander Weinreb1
Guy Stecklov2
Abstract
The plan to increase HIV testing is a cornerstone of the international health strategy against the HIV/AIDS epidemic, particularly in sub-Saharan Africa. This paper highlights a problematic aspect of that plan: the reliance on clinic- rather than home-based testing. First, drawing on DHS data from across Africa, we demonstrate the substantial differences in socio-demographic and economic profiles between those who report having ever had an HIV test, and those who report never having had one. Then, using data from a random household survey in rural Malawi, we show that substituting home-based for clinic-based testing may eliminate this source of inequality between those tested and those not tested. This result, which is stable across modeling frameworks, has important implications for accurately and equitably addressing the counseling and treatment programs that comprise the international health strategy against AIDS, and that promise to shape the future trajectory of the epidemic in Africa and beyond.
1 Corresponding author: Department of Sociology, Population Research Center, University of Texas, Austin. E-Mail: [email protected]. 2 Department of Sociology & Anthropology, Hebrew University, Jerusalem.

Weinreb & Stecklov: Social inequality and HIV-testing
628 http://www.demographic-research.org
"Even as vastly increased funding for HIV has become available, those most vulnerable to HIV and its impact continue to receive the least access to HIV prevention, care and treatment services." (UNAIDS Reference Group on HIV and Human Rights 2007:1)
1. Introduction
Over the last several years, dramatic increases in funding for AIDS and substantial reductions in the price of ART have promised to transform the life-prospects of HIV+ individuals in poor countries. In all but a handful of countries, this promise has yet to be realized, especially in sub-Saharan Africa (SSA). The main reason is that HIV-testing regimes, the "critical gateway" (Rennie and Behets 2006) to treatment and counseling, remain mired in two distinct problems.
The first, the generally low testing prevalence across the continent, is widely recognized. As shown in Table 1, which uses data from Demographic and Health Surveys administered in the field in 26 SSA countries, only 16 percent of respondents report ever having had an HIV test (column 3). This is in spite of the much larger percentage who both declare their willingness to have an HIV test (column 4), and who know where they can get one (column 5). It is also in spite of recent increases in testing. In 10 of these countries, for example, people have been asked whether they have had an HIV test in two discrete survey waves (administered on the average in 2000 and 2005). During the five years that separate those waves the percentage of 15 to 49 year olds who claimed to have been tested increased from 10.9 to 26.3 percent.
The second problem with the contemporary HIV-testing regime is related to inequalities within a given country. This can express itself in one of two ways. The first is differences across spatial boundaries, which in most SSA settings also signal ethnic and political boundaries. The second is differences across social boundaries, represented in the simplest terms by individuals' socio-demographic and economic characteristics.

Demographic Research: Volume 21, Article 21
http://www.demographic-research.org 629
Table 1: Sub-Saharan African countries by proportion tested and other HIV test-related characteristics
Country Year Ever had an HIV test Wants a test Knows a place to get test
Benin 2006 17.2 - 41.2 Cameroon 2004 21.5 - - Chad 2004 4.5 29.7 22.7 Congo (Brazzaville) 2005 11.4 - 52.8 Congo (Dem Rep) 2007 11.7 - 43.9 Cote D'Ivoire 2005 8.1 - 28.0 Ethiopia 2005 6.9 - 43.1 Gabon 2000 18.1 63.9 46.5 Ghana 2003 9.7 75.3 52.7 Guinea 2005 2.3 - 17.8 Kenya 2003 15.4 64.3 64.0 Lesotho 2004 15.8 63.9 69.5 Liberia 2007 4.1 - 24.8 Madagascar 2003 2.6 45.5 24.6 Malawi 2004 14.7 - 82.7 Mali 2006 6.7 - 22.3 Mozambique 2003 5.5 56.6 38.7 Namibia 2006 54.4 - 93.0 Niger 2006 4.0 - 24.6 Nigeria 2003 8.0 50.5 38.3 Rwanda 2005 25.8 - 81.5 Senegal 2005 5.3 - 38.6 Swaziland 2006 41.1 - 92.4 Tanzania 2007 33.2 - 68.2 Uganda 2006 29.2 - 81.2 Zambia 2007 40.8 77.1 65.4 Zimbabwe 2005 25.7 - 83.7
Unweighted averages 16.4 58.5 51.6

Weinreb & Stecklov: Social inequality and HIV-testing
630 http://www.demographic-research.org
This second type of within-country inequality is the focus of this article. In the first of three main sections we use DHS data from across SSA in order to highlight the scale of within-country differences in HIV testing, that is, the extent to which HIV testees' socio-demographic and economic characteristics differ from those of their untested counterparts. In the second section we briefly review three key institutional responses to HIV testing problems: the expansion of clinic-based Voluntary Counseling and Testing (VCT); the substitution of "opt-out" testing for traditional VCT approaches; and the emergence of home-based testing. Finally, in the third section, this time drawing on survey data collected in Malawi, we evaluate whether home-based HIV testing has a stronger or weaker association with households' socio-demographic and economic characteristics than clinic-based testing. In other words, we use the available evidence to identify whether moving HIV testing out of clinics would make the HIV testing process more equitable between different social groups.
Like any other question that focuses attention on the nexus of healthcare and equality issues, this is an important one. What makes it even more critical right now is the increasing provision of free or cheap antiretroviral therapy (ART). Specifically, since HIV-testing necessarily precedes the provision of ART, identifying inequalities in testing allows us to identify the clusters—in this case groups with given social characteristics—in which the most destructive effects of AIDS will be concentrated.3
2. Inequality in HIV-testing
That there should be high levels of inequality in HIV testing throughout Africa is to be expected. The established literature points to two distinct types of inequality that have affected African health policy for several decades, as well as an AIDS-specific factor that may augment the effect of those first two.
The first source of inequality, which is found at the aggregate level, is the fact that clinic placement in many countries, like development infrastructure in general, is not random. Rather, it is the product of a policy-making process which directs a disproportionate share of development resources, including health resources, to cities, regions that are better connected to key decision-makers (Weinreb 2001), or regions that have other characteristics not randomly distributed (Rosenzweig and Wolpin 1986; Angeles, Guilkey, and Mroz 1998).
3 There are some early signs of this in Botswana, where even though the rapid scale-up of ART—estimated coverage had reached 83% of the national target population by December 2007—has made it the most developed ART program in sub-Saharan Africa, reductions in AIDS-related mortality and HIV incidence have thus far been limited to urban areas (Stover et al. 2008)

Demographic Research: Volume 21, Article 21
http://www.demographic-research.org 631
The second type of inequality operates more overtly at the individual level. It addresses the extent to which, given the existence of a clinic, those who visit it are typically self-selecting on a number of characteristics. Demonstrated effects of education, wealth, ethnicity and gender exist in the literature (Gwatkin et al. 2003; Mahmud Khan et al. 2006). The hypothesized mechanism underlying such effects is that these socio-demographic and economic characteristics influence an individual's willingness or ability to absorb the monetary and time-related costs that clinic visits often entail—though on the aggregate level there is also some interaction with the clinic-placement issue. In addition, these same socio-demographic and economic characteristics can influence individuals' level of fear or suspicion of medical staff in unfamiliar and highly impersonal medical settings, and their concerns about possible breaches of confidentiality.
The third possible source of differences in HIV testing is specific to AIDS. It is conceivable that there may be less demand for HIV testing in the poorer and less educated sectors of the population because people in these sectors see themselves as less susceptible to AIDS. This argument is based on the perception – more accurate before HIV broadly diffused into poorer, rural settings – that important risk factors for being HIV positive in SSA are positively associated with having some wealth and education, giving HIV prevalence a positive correlation to socioeconomic status (SES) (examples include being a migrant, frequenting "bar-girls," drinking, living in an urban area). Assuming that these group-level differences would be accurately reflected in a willingness to be tested is problematic. Anglewicz and Kohler (2005), for example, demonstrate how Malawian women – and less so, men – have a substantial propensity to exaggerate their own risk of HIV infection. Nonetheless, it is reasonable to expect that at least a small part of the testing gap between socioeconomic groups derives from the awareness of relative risk.
Whatever the source of within-country social inequality in HIV testing, the scale of that inequality is substantial. One indication is provided in Figure 1, which graphs the percentage of DHS women respondents in 26 SSA countries reporting ever having had an HIV test, by residential, educational and economic characteristics. We see substantial differences between the three characteristics. First, urban women are roughly twice as likely to have reported having an HIV test as their rural counterparts. Second, there is a strong and increasing relationship between educational attainment and HIV testing. Specifically, across the 26 countries, 10 percent of women with no schooling report having had an HIV test, but throughout primary, secondary and higher education categories, that percentage climbs to 15, 23 and 44 percent, respectively. Third, there is a notable positive gradient in wealth: across the ranked quintiles based on the DHS wealth index, the percentage tested climbs from 10 percent among the poorest quintile to 25 percent amongst the wealthiest.

Weinreb & Stecklov: Social inequality and HIV-testing
Figure 1: Percentage of women DHS respondents in 26 sub-Saharan African countries reporting ever having had an HIV test, by selected socio-demographic characteristics
0
5
10
15
20
25
30
35
40
45
50
Rura
l
Urba
n
No E
duca
tion
Primary
Seconda
ry
Higher
Poores
t
Poorer
Middle
Richer
Riches
t
% re
port
ing
havi
ng h
ad a
n H
IV te
st
Adding weight to our concern about this inequality in testing are the data presented
in Figure 2. Drawing on data from all 10 SSA countries in which DHS respondents have been asked whether or not they have ever had an HIV test in more than one wave of data collection, it allows us to assess changes in relative testing rates between groups with given socio-demographic characteristics. This is important since the notable increase in the percentage of women reporting ever having been tested in these countries (noted above) could be associated with reduced inter-group differences.
Figure 2 shows that there has been no such reduction. It presents country-specific graphs of the absolute difference in percentage of women reporting HIV tests throughout educational classes, relative to those with no education. In these 10 countries, we see differences in proportions tested across educational classes becoming markedly greater with time in two countries (Benin and Zimbabwe), somewhat greater in two others (Kenya, Zambia), remaining stable in five (Malawi, Mali, Namibia, Rwanda, Uganda) and becoming smaller in only one (Tanzania). In other words, even though more people overall are being tested, there is no sign that this increase is reducing overall differences between groups. On the contrary, the overall trend signals increasing differences.
632 http://www.demographic-research.org

Demographic Research: Volume 21, Article 21
Figure 2: Absolute difference in percentage of women reporting HIV test across educational classes relative to those with no education, by country and year of survey
Benin
0 102030405060
No Pr Sec Hi
20062001
Kenya
0102030405060
No Pr Sec Hi
1998 2003 Malawi
0 10 20 30 40 50 60
No Pr Sec Hi
2000 2004
Mali
0102030405060
No Pr Sec Hi
2001 2006 Namibia
0 10 20 30 40 50 60
No Pr Sec Hi
2000 2006
Rwanda
0102030405060
No Pr Sec Hi
2000 2005 Tanzania
0 10 20 30 40 50 60
No Pr Sec Hi
2003 2007
Uganda
0102030405060
No Pr Sec Hi
2000 2006
http://www.demographic-research.org 633

Weinreb & Stecklov: Social inequality and HIV-testing
Figure 2: (Continued)
Zambia
010 20 30 40 50 60
No Pr Sec Hi
2001 2007
Zimbabwe
0102030405060
No Pr Sec Hi
1999 2005
Equally noteworthy, Figure 2 suggests that changes in relative proportion tested across educational categories are completely unrelated to the overall testing prevalence in the country. For example, the percentage of tested women in Mali increased from 4.6 to 6.7 percent between 2001 and 2006, and in Namibia from 24.3 to 54.4 percent (from 2000 to 2006). But not only did the relative differences between educational classes remain stable within each country. The overall trend lines also look extremely similar in these two countries. Parallel comparisons can be found elsewhere within this group of 10 countries.
3. Institutional response to testing problems
The main institutional response to low HIV-testing prevalence has been to focus on the expansion of clinic-based testing. Two primary methods have been tried thus far. The first has been to increase the number of sites—fixed and mobile—in which people are offered VCT services (Marum, Taegtmeyer, and Chebet 2006; Yeatman 2007). A second method, more recent, has been to substitute what is alternately referred to as "provider-initiated," "routine," "opt-out" testing for more traditional VCT approaches (Beckwith et al. 2005; Koo et al. 2006; Weiser et al. 2007). While each of these methods has generated increases in proportions tested, the time-trends graphed in Figure 2 show that they have not modified the differences in HIV testing between educational groups.
In addition to these clinic-based options, over the last few years, a small but growing chorus of scholars has begun to call for a third option. In what amounts to a paradigm shift, they have suggested that the most effective solution to low testing prevalence is to be found in substituting home-based for clinic-based tests. Thus far, supporters of this shift have justified their claims in two ways. First, because people in Africa prefer home-based testing to clinic-based alternatives (Kimchi 2006), wherever
634 http://www.demographic-research.org

Demographic Research: Volume 21, Article 21
http://www.demographic-research.org 635
home-based VCT has been tried—usually in the context of smaller research studies—it has generated a massive increase in proportions tested in comparison to more traditional clinic-based VCT (Were et al. 2003; Fylkesnes and Siziya 2004; Wolff et al. 2005). In fact, this increase has dwarfed the increases associated with the switch from VCT to routine testing (Miller et al. 2006; Zimba et al. 2006; Weiser et al. 2007). The second reason used to justify home-based testing has been that it is less ethically problematic than the increasingly popular provider-initiated approach, since it leaves the notion of patient consent intact (Yeatman 2007).
The core analytic question which we address now is whether, in addition to these two advantages, home-based VCT offers a third benefit. In particular, might home-based HIV-testing reduce socioeconomic differences between those who have an HIV test, and those who do not? Could it, in other words, make the testing process more equitable across different of social groups?
There is some evidence that it might indeed have such an effect. A series of recent papers have highlighted a number of mechanisms through which home-based testing could attenuate, if not entirely negate, differences in testing prevalence across social groups (Fylkesnes and Siziya 2004; Wolff et al. 2005; Angotti et al. 2007). First, home-based VCT eliminates all financial factors affecting testing levels. Likewise, it reduces transactional costs associated with time spent traveling to, and waiting at, the clinic. Second, by bringing the nurse or VCT counselor into the individual's home, the relative power dynamic between these two actors is completely changed. Third, since home-based VCT counselors visit every household, irrespective of residents' age, marital status, and the like, it reduces that part of the confidentiality issue which is related to fear of neighbors' gossip and, subsequently, of stigma. It does this, in a sense, by taking the routinization that underlies "opt-out" approaches one step further.
In summary, there are strong indications that home-based VCT can equalize access to testing across socioeconomic strata, marital status, or any other social characteristics that typically affect clinic use. This is precisely the hypothesis which we test here.
4. Data
We use data from the Malawi Diffusion and Ideation Change Project (MDICP), an ongoing demographic research project conducted in three rural areas of Malawi. This is an appropriate setting for three main reasons. First, Malawi has relatively high HIV prevalence: about 12% of adults are infected (UNAIDS 2008). Second, it is a poor country: its GNI PPP (per capita) is 720 USD, compared to an East Africa average of 1,180 USD (PRB 2007). Third, it has a relatively developed AIDS-related infrastructure and NGO presence, seen in the extensive framework of AIDS-related information
Weinreb & Stecklov: Social inequality and HIV-testing
636 http://www.demographic-research.org
campaigns (Watkins 2004; Smith and Watkins 2005), and in some of the other characteristics seen in Table 1. Of particular importance to this research is the fact that, according to the 2004 DHS, Malawi has one of the highest proportions of respondents who know where to get an HIV test (82.7%). Moreover, free ART, typically based in specialist clinics established in each district hospital, is being implemented in Malawi at a rapid pace.
Sampling and the initial wave of the MDICP survey data collection took place in 1998, targeting roughly 1500 women who had ever been married and their husbands (when the women are currently married). Follow-up surveys were then administered on half the sample in 1999, and on the full sample in 2001, 2004, and 2006. In these last two waves, small panels of adolescents (age 15-24), about half of whom were also married, were also surveyed.4
We restrict our analysis to the women's data. Our main reason is that survey response rates for husbands is below 80% (due to sex-selective out-migration) and for HIV testing lower still, raising questions about the selectivity of those who remain in the survey and testing pools (e.g., Groves and Couper 1998). More generally, analysis is also restricted to data from the 2004 wave since this is the only one which contains both a clinic-based (self-reported) and home-based (observed) measure of HIV-testing.5
Our clinic-based measure refers to reported HIV testing in the past. That is, during the administration of the main survey (survey response rate 92 percent), respondents were asked: "I don’t want to know the results, but have you ever been tested to see if you have the AIDS virus?" Informal interviews with local informants suggest that in virtually all cases, these tests would have been conducted in a hospital in the district capital or in one of the major cities rather than at a local clinic (testing was not widely available at the latter prior to the 2004 survey). In other words, prior testing entailed some travel expense (e.g., bus-fare), or was limited to those who were making a trip for some other reason.
In contrast, our home-based measure refers to observed data. Specifically, the 2004 wave of the MDICP included a biomarker component. All survey respondents were offered the opportunity to be tested by a nurse in their own home—most on either the same day as the survey interview or following day—using ORASURE oral swabs.
4 For more details on the MDICP, including details of the survey, access to the data, and a full list of publications, see http://malawi.pop.upenn.edu. 5 Analysis is limited to 1106 women – out of the 1,548 with survey data from 2004 – for two reasons. First, we dropped women missing data on important variables and those outside the 15-55 age range. Second, the village-level fixed effects specification automatically drops villages with no variation in either one of the two types of testing. Baseline models using the full sample did not generate substantively different results, suggesting that this process was not selective on any relationship of interest here (results available from the authors).
Demographic Research: Volume 21, Article 21
http://www.demographic-research.org 637
Results of these tests—processed in a laboratory in the capital city, Lilongwe—were then communicated to those individuals by VCT counselors between one and four months later (Bignami-Van Assche et al 2004; Anglewicz et al. 2009).6
5. Analysis
Two-way tabulations highlight the scale of increase in testing prevalence when moving from a clinic- to a home-based testing model. Specifically, out of the sample used in this analysis, 912 (82.5%) women had the MDICP home-test. 81% (736 women) were first-time testees, and the remainder repeat-testees. This is far in excess of the 203 (18.4%) who reported ever having had a clinic-based HIV test (note that this is marginally higher than the 14.7% tested in the 2004 round of the Malawi DHS). Moreover, the differences between these two groups are consistent with the data from other sub-Saharan countries shown in Table 1 and research from other African settings noted above (e.g., Fylkesnes and Siziya 2004; Were et al. 2003). This underscores the comparability of trends observed in the Malawian data to those observed elsewhere.
A first indicator that home-based testing is associated with a change in the type of person who has an HIV test can be found in the relatively weak relationship between the clinic- and home-based tests: the Spearman’s ranking correlation coefficient is .053; and the Cronbach alpha score is 0.10. In order to evaluate this relationship more systematically – in particular whether the increase in testing prevalence reduces inequality in characteristics of clinic- and home-based testees – we use two types of models. The first is traditional cross-sectional logistic regression in which the standard error estimates for the coefficients are adjusted for within-community auto-correlation to avoid biasing significance estimates. The second is village-level fixed effects (FE), which enable us to determine whether or not the effects of observable individual characteristics remain salient once fixed differences between villages are eliminated. In other words, we use a FE specification because households in various villages differ on many observed and unobserved village-level characteristics, including the availability of local health clinics, the activities of local health workers (paid or voluntary), and the effects of more active village headmen or religious leaders. The FE specification
6 Although 91 percent of the survey respondents said that they would consent to a test, some of them, according to the field teams, changed their minds between the survey and the subsequent nurse's visit, hence the reduction to 81.5 percent actually tested (Angotti et al. 2007). In addition, though it is not the focus of this paper, it is noteworthy that only 72% of those tested came to receive their results, even though VCT tents were set up close to every sampled household. By the 2006 MDICP wave, during which rapid tests were used – allowing respondents to receive results 20 minutes after having been tested – this difference between those who received their HIV test results and those who didn’t was all but eliminated.

Weinreb & Stecklov: Social inequality and HIV-testing
638 http://www.demographic-research.org
enables us to estimate within-village effects of the covariates of interest and, in so doing, to shed light on the extent to which these unobserved characteristics affect the baseline logistic regression estimates (Greene 2003).
As implied by this village-level FE approach, the primary covariates used in these models are measured at the individual level (village-level variables are automatically eliminated by the fixed-effects specification (Greene 2003). They include key background characteristics that allow us to explore the extent to which either of the two tests is selective on broad socio-demographic characteristics. Specifically, we include indicators of age, level of education, composite measures of wealth—one a dummy scale of durables, the other the value of livestock holdings (an alpha cronbach score of 0.003 between these confirms that these cover distinct dimensions of wealth)—an indicator of migration history, and the respondent's current marital status. Summary statistics for each characteristic are presented in Table 2 and confirm that there is considerable variation on all variables, allowing for substantial analytic leverage. Note that in our discussion of the results from these models, we primarily emphasize results from joint test statistics (χ2 tests), rather than individual coefficient tests, since the overall test of a variable's significance – for example, the two indicators of wealth and the three-category education variable – should take into account the multiple categories of that variable.
Table 2: Summary statistics from MDICP women sample from 2004
Variable Count Mean SD Min Max
Clinic HIV Test 1106 0.184 0.387 0.0 1.0
Home HIV Test 1119 0.825 0.380 0.0 1.0
Age 1119 33.900 10.500 15.0 77.0
Wealth 1 - Ownership of durables1 1119 2.729 1.433 0.0 6.0
Wealth 2 - Livestock holdings2 1119 0.824 2.776 0.0 50.2
Currently Married 1119 0.820 0.384 0.0 1.0
Ever Migrated3 1115 0.417 0.604 0.0 2.0
Primary Schooling 1111 0.495 0.500 0.0 1.0
Secondary schooling or more 1111 0.192 0.394 0.0 1.0 Notes: 1 An additive measure of six durables; 2 Includes cows, goats, pigs, sheep and domestic fowl; 3 Lived elsewhere for >6
months since age 15 or >1 month in the last year
Demographic Research: Volume 21, Article 21
http://www.demographic-research.org 639
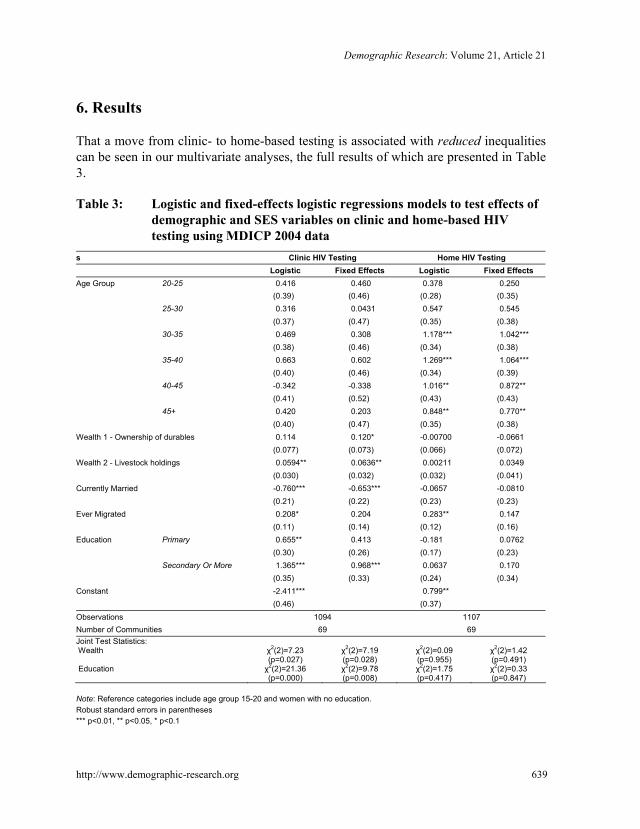
6. Results
That a move from clinic- to home-based testing is associated with reduced inequalities can be seen in our multivariate analyses, the full results of which are presented in Table 3.
Table 3: Logistic and fixed-effects logistic regressions models to test effects of demographic and SES variables on clinic and home-based HIV testing using MDICP 2004 data
s Clinic HIV Testing Home HIV Testing Logistic Fixed Effects Logistic Fixed Effects Age Group 20-25 0.416 0.460 0.378 0.250 (0.39) (0.46) (0.28) (0.35) 25-30 0.316 0.0431 0.547 0.545 (0.37) (0.47) (0.35) (0.38) 30-35 0.469 0.308 1.178*** 1.042*** (0.38) (0.46) (0.34) (0.38) 35-40 0.663 0.602 1.269*** 1.064*** (0.40) (0.46) (0.34) (0.39) 40-45 -0.342 -0.338 1.016** 0.872** (0.41) (0.52) (0.43) (0.43) 45+ 0.420 0.203 0.848** 0.770** (0.40) (0.47) (0.35) (0.38) Wealth 1 - Ownership of durables 0.114 0.120* -0.00700 -0.0661 (0.077) (0.073) (0.066) (0.072) Wealth 2 - Livestock holdings 0.0594** 0.0636** 0.00211 0.0349 (0.030) (0.032) (0.032) (0.041) Currently Married -0.760*** -0.653*** -0.0657 -0.0810 (0.21) (0.22) (0.23) (0.23) Ever Migrated 0.208* 0.204 0.283** 0.147 (0.11) (0.14) (0.12) (0.16) Education Primary 0.655** 0.413 -0.181 0.0762 (0.30) (0.26) (0.17) (0.23) Secondary Or More 1.365*** 0.968*** 0.0637 0.170 (0.35) (0.33) (0.24) (0.34) Constant -2.411*** 0.799** (0.46) (0.37) Observations 1094 1107 Number of Communities 69 69 Joint Test Statistics: Wealth Education
χ2(2)=7.23 (p=0.027) χ2(2)=21.36 (p=0.000)
χ2(2)=7.19 (p=0.028) χ2(2)=9.78 (p=0.008)
χ2(2)=0.09 (p=0.955) χ2(2)=1.75 (p=0.417)
χ2(2)=1.42 (p=0.491) χ2(2)=0.33 (p=0.847)
Note: Reference categories include age group 15-20 and women with no education. Robust standard errors in parentheses *** p<0.01, ** p<0.05, * p<0.1

Weinreb & Stecklov: Social inequality and HIV-testing
640 http://www.demographic-research.org
We begin with the characteristics of clinic-based testees. In both the baseline and FE models we see that they tend to be wealthier, more educated, and less likely to be currently married (as opposed to never married, separated, divorced, and widowed). In all cases, the point-size of the effects is substantial and the p-value of the χ2 test is well under the critical 5% value.
In relation to wealth, there is a notable absence of change in both of the SES effects when we look at the within community (FE) estimates relative to the standard logistic coefficients. This stability is impressive given the loss in degrees of freedom associated with the FE estimates. The change in coefficient magnitude and significance is greater for the education coefficients when we compare the logistic and FE models. The effect of primary education versus no education loses significance, and although the effect of secondary education versus no education remains very strong, it also declines by about one standard error. Nonetheless, the joint test of both coefficients – our main focus, since wealth is two-dimensional and education is categorical – remains highly significant (p<0.01) across the two models.
In terms of other variables in the clinic-based testing model, currently married women are less likely to report a clinic-based HIV test and this effect is highly significant (p<0.01) and little changed across the two specifications. In substantive terms, the odds of reporting a clinic-based HIV test for currently married women is 53 percent lower than for women who are not currently married. In addition, while the logistic model suggests that women who have ever migrated are more likely to have had a clinic-based test, this effect is only marginally significant and drops out in the FE specification. Finally, we note that the effects of age are marginally significant in a joint test (though not the individual coefficients) in the baseline logistic model (p=0.054) but not significant either individually or jointly (p=0.195) in the FE model.
The findings for home-based HIV testing highlight the very different factors that drive clinic and home-based HIV testing. Among women who consented to home-based testing, there was no observed difference between those with some formal schooling and those with none, between the poor or the wealthy, or the currently married and the unmarried. This is true whether we look at the individual coefficients or the joint tests. The only commonality with the clinic-based model is in the positive effect of having lived elsewhere, though in this case, too, this migration effect is rendered insignificant in the FE estimation. In fact, the only significant relationship between home-based testing and one of these background characteristics is with age. In both the baseline and FE models we see that the likelihood of having consented to a test—relative to the reference category of 15-19 year olds—increases in quinquennial bands up to ages 35-40, and then begins to descend for the two upper age groups. In terms of joint statistical significance, the age coefficients are highly significant in the baseline specification and remain significant in the FE models (p=0.000 and p=0.014, respectively).

Demographic Research: Volume 21, Article 21
http://www.demographic-research.org 641
7. Discussion
Consistent with a small but growing body of research, the Malawian data used here show that the number of individuals who agree to be tested at home exceeds the number who reported a prior clinic-based test by a factor of four. This dwarfs any observed increase resulting from the switch from traditional VCT to provider-initiated clinic-based testing, or from the increase in the number of available testing sites.
The particular contribution of our analysis is to show that, in addition to dramatically increasing HIV-testing prevalence, home-based testing is also associated with marked reductions in inequalities in the profile of testees. Thus, where clinic-based testees are wealthier in two different dimensions, more educated, and less likely to be married, home-based testees do not vary on these characteristics. To the extent that testing is the necessary precursor to receiving ARTs and, potentially, other social programs, and that it also affects the individual's own risk behavior, removing this variation in social characteristics from HIV testing is a crucial first step to reducing health-systems' inequitable—and perhaps discriminatory—practices. It is also a crucial first step in stopping such systems from reproducing contemporary inequalities by inscribing them onto differential future patterns of infection and mortality. Clinic-based testing in general—whether traditional VCT or provider-initiated—does not address these issues of inequality. Nor can it, given its total dependence on patients' prior deliberations about whether or not they are able to, or should, enter a clinic's doors.
Does this mean that home-based opt-in testing is the answer to contemporary testing problems? Although wary of making such a pronouncement unreservedly, perhaps especially in light of the acknowledged difficulties in scaling up testing (Asante 2007), we think so. Not only does the size of the increase in our study match that reported in other studies, consistent with respondents’ stated preference for home-based testing to clinic-based alternatives (Kimchi 2006), but in more practical terms, we think that a confluence of four factors make a home-based testing strategy both reasonable and logical. One, this is the era of rapid tests (of the type used during the subsequent 2006 round of the MDICP): increasingly cheap; mobile; easy to administer; offering results within 10-30 minutes; eliminating coding errors that generate mismatched or lost samples; more trusted than older types of tests; and also offering potential testees an escape from the suspected gossip of local nurses and, subsequently, from the scrutiny and stigma of the latter's friends (Angotti et al. 2007). Two, there is severe un- and underemployment of high school and college graduates in many high HIV-prevalence countries. It is therefore not difficult to imagine a group of youthful, motivated, and easily-trained testers moving around their respective countries in a 21st century reprise of the US New Deal's "Public Work's Administration" or more recent "Americorps," China's "barefoot doctors," Cuba's "literacy brigades," or any other of the many types of

Weinreb & Stecklov: Social inequality and HIV-testing
642 http://www.demographic-research.org
"national service" used in various countries. Three, there is now also a motive; simply, ARTs and other AIDS-related social programs are increasingly available to people in poor, high prevalence countries. In most, including Malawi, they are free. In other words, a positive HIV test no longer necessarily means an inexorable decline into poverty and death. Four, an added benefit of home-testing, though we have not focused on it here is that it would put to rest many of the ethical concerns associated with the new provider-initiated approaches (Rennie and Behets 2006; Weiser et al. 2007; Yeatman 2007), since it is reasonable to assume that people feel more empowered to refuse testing in their own homes than in a clinic setting in which they are subject to the whims of some un-trusted authority figure.
In summary, moving toward home-based VCT in high HIV prevalence countries such as Malawi makes sense. It out-performs its clinic-based alternative in a number of dimensions. It is the most effective way to both generate high testing prevalence and to reduce the selectivity issues related to who gets tested and who does not. It is, as a result, the only way to enact a testing policy which takes advantage of the fact that the poor and ill-educated, while less likely to come to clinics, are no less willing to have an HIV test. At this stage of the pandemic, with the ART pipeline already in place, this is a crucially important point. Ten years from now, looking back on the impact of ART on AIDS-related mortality in countries like Malawi, we will not want to see effects limited to, or at least concentrated among, the wealthier and more educated sectors of sub-Saharan African populations. We will want to see a general effect that spans social boundaries. Without moving towards home-based testing, it is difficult to see how that more general goal can be achieved.
8. Acknowledgements
The collection of data used in this analysis was funded by the US National Institute of Child Health and Human Development (NICHD), grants R01-HD37276, R01-HD044228-01. All data collection received ethical approval from institutional review boards at the University of Pennsylvania and the College of Medicine of the University of Malawi.

Demographic Research: Volume 21, Article 21
http://www.demographic-research.org 643
References
Angeles, G., Guilkey, D.K., and Mroz, T.A. (1998). Purposive program placement and the estimation of family planning program effects in Tanzania. Journal of the American Statistical Association 93: 884-899. doi:10.2307/2669827.
Anglewicz, P. and Kohler, H.P. (2005). Overestimating HIV infection: The Construction and accuracy of subjective probabilities of HIV infection in rural Malawi. MDICP Working paper: http://www.malawi.pop.upenn.edu/ Level%203/Papers/PDF-files/anglewicz-kohler-2005.pdf.
Anglewicz, P., adams, j., Obare, F., Kohler, H.P., and Watkins, S. (2009). The Malawi Diffusion and Ideational Change Project 2004-2006: Data collection, data quality, and analysis of attrition. Demographic Research 20(21): 503-540. doi:10.4054/DemRes.2009.20.21.
Angotti, N., Bula, A., Gaydosh, L., Kimchi, E.Z., Thornton, R., Watkins, S.C., and Yeatman, S. (2007). If not fear, then what? Local reactions to HIV rapid blood testing in rural Malawi. Paper presented at 2007 National AIDS Commission (NAC) Dissemination Conference, Lilongwe, Malawi.
Asante, A.D. (2007). Scaling up HIV prevention: why routine or mandatory testing is not feasible for sub-Saharan Africa. Bulletin of the World Health Organization 85: 569-648. doi:10.2471/BLT.06.037671.
Beckwith, C.G., Flanigan, T.P., del Rio, C., Simmons, E., Wing, E.J., Carpenter, C.C.J., and Bartlett, J.G. (2005). It is time to implement routine, not risk-based, HIV testing. Clinical Infectious Diseases 40: 1037-1040. doi:10.1086/428620.
Bignami-Van Assche, S., Reniers, G., and Weinreb, A.A. (2003). An assessment of the KDICP and MDICP data quality. Demographic Research S1(2): 29-76. doi:10.4054/DemRes.2003.S1.2.
Bignami-Van Assche, S., Reniers, G., Chao, L., and Anglewicz, P. (2004). Protocol for biomarker testing in the 2004 Malawi Diffusion and Ideational Change Project. SNP Working Paper No.7, Philadelphia: University of Pennsylvania. http://malawi.pop.upenn.edu/Level%203/Papers/PDF-files/bignami-et-al-2004.pdf.
Farmer, P. (1992). AIDS and Accusation: Haiti and the Geography of Blame. Berkeley: University of California Press.

Weinreb & Stecklov: Social inequality and HIV-testing
644 http://www.demographic-research.org
Fylkesnes, K. and Siziya, S. (2004). A randomized trial on acceptability of voluntary HIV counselling and testing. Tropical Medicine and International Health 9: 566–572. doi:10.1111/j.1365-3156.2004.01231.x.
Greene, W.H. (2003). Econometric Analysis. 5th ed. Upper Saddle River, NJ: Prentice Hall.
Groves, R.M. and Couper, M.P. (1998). Nonresponse in Household Interview Surveys. New York: John Wiley and Sons.
Gwatkin, D., Rutstein, S., Johnson, K., Suliman, E., and Wagstaff, A. (2003). Socio-economic Differences in Health, Nutrition and Population. Volumes I and II. Washington DC: World Bank.
Kimchi, E. (2006). Reactions to at-home voluntary counseling and rapid HIV testing in rural Malawi. Working Paper, Jefferson Medical College, Philadelphia, PA. http://www.malawi.pop.upenn.edu/Level%203/Papers/PDF-files/kimchi_2006.doc.
Koo, D.J., Begier, E.M., Henn, M.H., Sepkowitz, K.A., and Kellerman, S.E. (2006). HIV counseling and testing: Less targeting, more testing. American Journal of Public Health 96: 962-964. doi:10.2105/AJPH.2006.089235.
Mahmud Khan, M., Hotchkiss, D.R., Berruti, A.A., and Hutchinson, P.L. (2006). Geographic aspects of poverty and health in Tanzania: Does living in a poor area matter? Health Policy and Planning 21: 110-122. doi:10.1093/heapol/czj008.
Marum, E., Taegtmeyer, M., and Chebet, K. (2006). Scale-up of voluntary HIV counseling and testing in Kenya. JAMA 296: 859-862. doi:10.1001/jama.296.7.859.
Miller, A., Chandisareva, W., Stranix-Chibanda, L., and Chirapa, E. (2006). Pilot implementation of revised national policy for routine offer of HIV testing in antenatal services: Quantitative and qualitative impact in urban and rural Zimbabwe. Abstract 112 in http://www.blsmeetings.net/implementhiv2006 /orals101-125.htm#112.
PRB (2007). World Population Data Sheet. Washington: Population Reference Bureau.
Rennie, S. and Behets, F. (2006). Desperately seeking targets: the ethics of routine HIV testing in low-income countries. Bulletin of the World Health Organization 84: 52-57. doi:10.2471/BLT.05.025536.
Demographic Research: Volume 21, Article 21
http://www.demographic-research.org 645
Rosenzweig, M.R. and Wolpin, K.I. (1986). Evaluating the effects of optimally distributed public programs - child health and family-planning interventions. American Economic Review 76: 470-482.
Smith, K. and Watkins, S.C. (2005). Perception of risk and strategies for prevention: Responses to HIV/AIDS in rural Malawi. Social Science and Medicine 60: 649-660. doi:10.1016/j.socscimed.2004.06.009.
Stover, J., Fidzani, B., Molomo, B.C., Moeti, T., and Musuka, G. (2008). Estimated HIV Trends and Program Effects in Botswana. PLoS ONE 3(11): e3729. doi:10.1371/journal.pone.0003729. doi:10.1371/journal.pone.0003729.
UNAIDS (2008). Epidemiological Fact Sheet on HIV and AIDS: Malawi 2008 Update. http://www.unaidsrstesa.org/files/malawi.pdf.
UNAIDS Reference Group on HIV and Human Rights (2007). Statement and Recommendations on Scaling Up HIV Testing and Counseling.
Watkins, S.C. (2004). Navigating the AIDS epidemic in rural Malawi. Population and Development Review 30: 673-705. doi:10.1111/j.1728-4457.2004.00037.x.
Weinreb, A.A. (2001). First politics, then culture: Accounting for ethnic differences in demographic behavior in Kenya. Population and Development Review 27: 437-467. doi:10.1111/j.1728-4457.2001.00437.x.
Weiser, S.D., Heisler, M., Leiter, K., Percy-de Korte, F., Tlou, S., DeMonner, S., Phaladze, N., Bangsberg, D.R., and Iacopino, V. (2007). Routine HIV testing in Botswana: A population-based study on attitudes, practices, and human rights concerns. PLoS Med 3: e261. doi:10.1371/journal.pmed.0030261.
Were, W., Mermin, J., Bunnell, R., Ekwaru, J.P., and Kaharuza, F. (2003). Home-based model for HIV voluntary counseling and testing. The Lancet 361: 1569. doi:10.1016/S0140-6736(03)13212-6.
Wolff, B., Nyanzi, B., Katongole, G., Ssesanga, D., Ruberantwari, A., and Whitworth, J. (2005). Evaluation of a home-based voluntary counseling and testing intervention in rural Uganda. Health Policy and Planning 20: 109-116. doi:10.1093/heapol/czi013.
Yeatman, S.E. (2007). Ethical and public health considerations in HIV counseling and testing: Policy implications. Studies in Family Planning 38: 271–278. doi:10.1111/j.1728-4465.2007.00139.x.
Zimba, C., Kamanga, E., Chilongozi, D., Martinson, F., Kayambo, F., Meme, J., Hoffman, I., and van der Horst, C. (2006). Impact of routine HIV counseling and

Weinreb & Stecklov: Social inequality and HIV-testing
646 http://www.demographic-research.org
testing with an opt-out strategy compared to voluntary counseling and testing in the implementation of PMTCT services, Lilongwe, Malawi. Int Conf AIDS. 2006 Aug 13-18;16 Abstract No. WeAe0104.