demographic patterns of hiv testing uptake in sub-saharan africa
TRANSCRIPT
DHS COMPARATIVEREPORTS 30
DEMOGRAPHIC PATTERNS
OF HIV TESTING UPTAKE IN
SUB-SAHARAN AFRICA
APRIL 2013
This publication was produced for review by the United States Agency for International Development (USAID). The report was prepared by
Sarah Staveteig, Shanxiao Wang, Sara K. Head, Sarah E.K. Bradley, and Erica Nybro of ICF Macro.

MEASURE DHS assists countries worldwide in the collection and use of data to monitor and evaluate population, health, and nutrition programs. Additional information about the MEASURE DHS project can be obtained by contacting Demographic and Health Research Division, ICF International, 11785 Beltsville Drive, Suite 300, Calverton, MD 20705 (telephone: 301-572-0200; fax: 301-572-0999; e-mail: [email protected]; internet: www.measuredhs.com).
The main objectives of the MEASURE DHS project are:
• to provide decisionmakers in survey countries with information useful for informed policy choices;
• to expand the international population and health database;
• to advance survey methodology; and
• to develop in participating countries the skills and resources necessary to conduct high-quality demographic and health surveys.

DHS Comparative Reports No. 30
Demographic Patterns of HIV Testing Uptake in Sub-Saharan Africa
Sarah Staveteig Shanxiao Wang Sara K. Head
Sarah E.K. Bradley Erica Nybro
ICF International Calverton, Maryland, USA
April 2013
Corresponding author: Sarah Staveteig, Demographic and Health Research Division, ICF International, 11785 Beltsville Drive, Calverton, Maryland 20705, USA; Phone 301-572-0200; Fax 301-572-0999; Email: [email protected]

Editor: Bryant Robey Document Production: Audrey Shenett This study was carried out with support provided by the United States Agency for International Development (USAID) through the MEASURE DHS project (#GPO-C-00-08-00008-00). The views expressed are those of the authors and do not necessarily reflect the views of USAID or the United States Government.
Recommended citation:
Staveteig, Sarah, Shanxiao Wang, Sara K. Head, Sarah E.K. Bradley, and Erica Nybro. 2013. Demographic Patterns of HIV Testing Uptake in Sub-Saharan Africa. DHS Comparative Reports No. 30. Calverton, Maryland, USA: ICF International.

iii
Table of Contents Tables ............................................................................................................................................................ v
Figures and Maps ......................................................................................................................................... vi
Appendix Tables ......................................................................................................................................... vii
Acknowledgments ....................................................................................................................................... vii
Preface ......................................................................................................................................................... ix
Abstract ........................................................................................................................................................ xi
1 Introduction ............................................................................................................................................ 1
1.1 A brief history of HIV testing in sub-Saharan Africa ................................................................... 1
1.2 Purpose ......................................................................................................................................... 3
2 Data and Methods ................................................................................................................................... 4
2.1 Data ............................................................................................................................................... 4
2.2 Definitions .................................................................................................................................... 4
2.3 Surveys included ........................................................................................................................... 6
2.4 Limitations .................................................................................................................................... 8
3 Factors Associated with HIV Testing Uptake ........................................................................................ 9
3.1 Recent cross-national patterns in HIV testing uptake ................................................................... 9
3.2 HIV testing uptake by place of residence ................................................................................... 13
3.3 HIV testing uptake by age .......................................................................................................... 14
3.4 HIV testing uptake by education ................................................................................................ 18
3.5 HIV testing uptake by wealth ..................................................................................................... 22
3.6 HIV testing uptake by marital status .......................................................................................... 26
3.7 HIV testing uptake by ever had sex ............................................................................................ 27
4 Time Trends in HIV Testing Uptake .................................................................................................... 30
4.1 Cross-national trends .................................................................................................................. 30
4.2 Trends within country by residence ............................................................................................ 34
5 Trends in HIV Testing Uptake Associated with Antenatal Care .......................................................... 39
5.1 Receipt of HIV testing by time since most recent birth .............................................................. 39
5.2 Uptake of HIV testing during ANC ............................................................................................ 40
5.3 HIV counseling during ANC ...................................................................................................... 41
5.4 HIV testing before, after, and during ANC ................................................................................ 43
5.5 Time trends in the uptake of HIV testing during ANC ............................................................... 45
iv
6 HIV Testing by Serostatus.................................................................................................................... 48
6.1 HIV serotesting in DHS and AIS surveys .................................................................................. 48
6.2 Cross-national patterns in HIV prevalence and testing uptake ................................................... 49
6.3 Uptake of HIV testing by respondent’s serostatus ...................................................................... 56
7 Conclusions .......................................................................................................................................... 61
Appendix Tables ......................................................................................................................................... 63
References ................................................................................................................................................... 79

v
Tables
Table 2.1 Inclusion of surveys by chapter ................................................................................................... 7
Table 3.1 Uptake of HIV testing overall and in past 12 months by sex1 ................................................... 10
Table 3.2 Uptake of HIV testing by sex and place of residence ................................................................ 13
Table 3.3 Uptake of HIV testing in the past 12 months by sex and place of residence ............................. 14
Table 3.4 Uptake of HIV testing among women by 5-year age group ...................................................... 15
Table 3.5 Uptake of HIV testing among men by 5-year age group ........................................................... 16
Table 3.6 Uptake of HIV testing in the past 12 months among women by 5-year age group ................... 17
Table 3.7 Uptake of HIV testing in the past 12 months among men by 5-year age group ........................ 18
Table 3.8 Uptake of HIV testing by sex and education ............................................................................. 19
Table 3.9 Uptake of HIV testing in the past 12 months by sex and education .......................................... 22
Table 3.10 Uptake of HIV testing by sex and wealth quintile ................................................................... 24
Table 3.11 Uptake of HIV testing in the past 12 months by sex and wealth quintile ................................ 25
Table 3.12 Uptake of HIV testing by sex and marital status ..................................................................... 26
Table 3.13 Uptake of HIV testing in the past 12 months by sex and marital status .................................. 27
Table 3.14 Uptake of HIV testing by sex and sexual activity .................................................................... 28
Table 3.15 Uptake of HIV testing in the past 12 months by sex and sexual activity ................................. 29
Table 4.1 Trends in the uptake of HIV testing among women and men.................................................... 30
Table 4.2 Trends in the uptake of HIV testing by sex and place of residence ........................................... 34
Table 4.3 Trends in the uptake of HIV testing in the past 12 months by sex and place of residence ............................................................................................................................................... 38
Table 5.1 Uptake of HIV testing among women by date of last birth ....................................................... 39
Table 5.2 Uptake of HIV testing during ANC ........................................................................................... 41
Table 5.3 HIV counseling and testing during ANC ................................................................................... 43
Table 5.4 HIV testing during, after, and outside of ANC .......................................................................... 44
Table 6.1. HIV prevalence and testing uptake ........................................................................................... 49
Table 6.2. Uptake of HIV testing by sex and serostatus ............................................................................. 56

vi
Figures and Maps Figure 3.1 Uptake of HIV testing by sex ................................................................................................... 11
Figure 3.2 Uptake of HIV testing in the past 12 months by sex ................................................................ 12
Figure 3.3 Uptake of HIV testing among women by education ................................................................ 20
Figure 3.4 Uptake of HIV testing among men by education ..................................................................... 21
Figure 4.1 Trends in the uptake of HIV testing among women in sub-Saharan Africa ............................. 32
Figure 4.2 Trends in the uptake of HIV testing among men in sub-Saharan Africa .................................. 33
Figure 4.3 Trends in the uptake of HIV testing by country, residence, and sex ........................................ 35
Figure 5.1 Trends in receipt of ANC, and receipt of HIV testing during ANC, by country ...................... 46
Figure 6.1 Percentage of women who have ever been tested for HIV by year and women’s HIV prevalence ..................................................................................................................................... 54
Figure 6.2 Percentage of men who have ever been tested for HIV by year and women’s HIV prevalence ..................................................................................................................................... 55
Figure 6.3 Uptake of HIV testing among women by serostatus ................................................................ 57
Figure 6.4 Uptake of HIV testing among men by serostatus ..................................................................... 58
Map 6.1 HIV prevalence among women, sub-Saharan Africa .................................................................. 50
Map 6.2 Percentage of women who have ever been tested for HIV, sub-Saharan Africa ......................... 51
Map 6.3 HIV prevalence among men, sub-Saharan Africa ....................................................................... 52
Map 6.4 Percentage of men who have ever been tested for HIV, sub-Saharan Africa .............................. 53

vii
Appendix Tables Table A.1 Denominators for tables 3.2-3.3: Number of women and men by place of residence .............. 64
Table A.2 Denominators for tables 3.4 and 3.6: Number of women by 5-year age group ........................ 65
Table A.3 Denominators for tables 3.5 and 3.7: Number of men by 5-year age group ............................. 66
Table A.4 Denominators for tables 3.8 and 3.9: Number of women and men by education ..................... 67
Table A.5 Denominators for tables 3.10 and 3.11: Number of women and men by wealth quintile ......... 68
Table A.6 Denominators for tables 3.12 and 3.13: Number of women and men by marital status ........... 69
Table A.7 Denominators for tables 3.14 and 3.15: Number of women and men by sexual activity ......... 70
Table A.8 DHS/AIS serotesting response rate ........................................................................................... 71
Table A.9 Women and men who have ever been tested for HIV by serostatus and place of residence ............................................................................................................................................... 72
Table A.10 Women and men who have ever been tested for HIV by serostatus and 5-year age group ..................................................................................................................................................... 73
Table A.11 Women and men who have ever been tested for HIV by serostatus and education ................ 75
Table A.12 Women and men who have ever been tested for HIV by serostatus and wealth quintile........76
Acknowledgments The authors are grateful to Mary Mahy, Joy Fishel, and Bernard Barrère for their feedback on earlier drafts. We also want to thank our editor, Bryant Robey; Audrey Shenett for document production; and Thea Roy, Cameron Taylor, and Christopher Gramer for their assistance with charts and maps.


ix
Preface One of the most significant contributions of the MEASURE DHS program is the creation of an
internationally comparable body of data on the demographic and health characteristics of populations in developing countries.
The DHS Comparative Reports series examines these data across countries in a comparative framework. The DHS Analytical Studies series focuses on specific topics. The principal objectives of both series are to provide information for policy formulation at the international level and to examine individual country results in an international context. Whereas Comparative Reports are primarily descriptive, Analytical Studies have a more analytical approach.
The Comparative Reports series covers a variable number of countries, depending on the availability of data sets. Where possible, data from previous DHS surveys are used to evaluate trends over time. Each report provides detailed tables and graphs organized by region. Survey-related issues such as questionnaire comparability, survey procedures, data quality, and methodological approaches are addressed as needed.
The topics covered in Comparative Reports are selected by MEASURE DHS staff in conjunction with the U.S. Agency for International Development. Some reports are updates of previously published reports.
It is anticipated that the availability of comparable information for a large number of developing countries will enhance the understanding of important issues in the fields of international population and health by analysts and policymakers.
Sunita Kishor Project Director


xi
Abstract HIV testing is an integral component of HIV prevention strategies and provides a gateway to
treatment and care. Knowledge of one’s HIV status is a prerequisite for seeking and obtaining medical care, including antiretroviral therapy (ART), and may act to mobilize support networks and discourage risky sexual behavior. Over the past decade, as the expansion of ARTs in the developing world has made medications and treatment more widely available, HIV testing and efforts to link HIV-positive individuals to available treatment and care have become important policy priorities. Even so, lack of knowledge of HIV status remains an important programmatic barrier to initiating ART support.
Since 1998, the MEASURE DHS Project’s Demographic and Health Surveys (DHS) and AIDS Indicator Surveys (AIS) have collected nationally representative data from women and men about whether they have ever been tested for HIV and whether they received the test results. Additionally since 2001, many DHS and AIS surveys have included anonymous, informed, and voluntary HIV testing. Within the past decade the MEASURE DHS project has noted marked increases in testing uptake in surveyed sub-Saharan African countries, sometimes by more than ten-fold. In the treatment scale-up era, these demographic patterns of divergence in HIV testing uptake over time and across countries are important to recognize and understand, both to evaluate previous outreach programs and to shed light on opportunities for additional growth.
In this report, using nationally representative data on HIV testing uptake from 47 surveys in 29 sub-Saharan African countries that the DHS project conducted between 2003 and 2011, we examine four aspects of HIV testing uptake: (1) uptake by individual and household characteristics; (2) increases in uptake over time; (3) the role of HIV testing during ANC in overall uptake; and (4) uptake by HIV serostatus. We do not conduct tests of statistical significance or conduct multivariate analysis; nonetheless, the descriptive results show clear trends and divergences in testing uptake.
While uptake of HIV testing has increased in every country studied, the gains have been uneven. Regardless of any male-female testing differential in the earliest survey in a country, the most recent survey in every country indicates that women are more likely than men to have ever been tested for HIV. This disparity appears to reflect the relative success of increased testing uptake during antenatal care (ANC). Only one country, Rwanda, has achieved near-universal uptake of HIV testing among both men and women in both rural and urban areas. In the median country, a large majority of women (71 percent) and men (83 percent) have never been tested for HIV.
Universal access to HIV testing in a country is a key policy goal, but as countries scale up treatment programs, it is vital for testing to reach persons most at risk of HIV so that they may access care and support. Across countries, our analysis shows that uptake of testing is not strongly correlated with overall HIV prevalence. While seropositive individuals are more likely to have ever been tested for HIV, in 16 of 25 countries studied with respect to serostatus the majority of HIV-positive men and women have no way of knowing their HIV status because they have never been tested. Scaling up access and outreach to testing among underserved populations in particular, including men in rural areas, remains an important frontier on the road to achieving universal access to treatment and support in most countries.


1
1 Introduction Worldwide, an estimated 34 million people are living with HIV. Global estimates indicate that
2.5 to 3 million people have been newly infected annually over the past five years (WHO/UNAIDS/UNICEF 2011). Sub-Saharan Africa is the world region most heavily affected by HIV/AIDS. Although sub-Saharan Africa comprises just 12 percent of the world’s population, approximately two-thirds of people living with HIV reside in this region. In 2010, 70 percent of new HIV infections occurred in sub-Saharan Africa (UNAIDS 2011).
HIV-prevention efforts in sub-Saharan Africa have varied across countries and communities. Some countries have focused on behavioral interventions directed at preventing mother-to-child transmission and increasing safe-sex practices. Treatment and care for people living with HIV is also improving in many countries (UNAIDS 2011), and Millennium Development Goal 6 continues to target universal access to treatment among people with advanced infection. AIDS-related deaths and HIV incidence have decreased steadily in sub-Saharan Africa within the last decade (UNAIDS 2011).
HIV testing is an integral component of HIV prevention strategies and is a prerequisite to seeking and receiving treatment and care. Knowledge of one’s HIV status may act to mobilize support networks, increase sensitivity and decrease stigma, open dialogue regarding future plans and status disclosure, and discourage risky sexual behaviors (Commonwealth Regional Health Community Secretariat 2002; Denison et al. 2008; Tedrow et al. 2011). Furthermore, HIV treatment may also act as a form of prevention: early provision of antiretroviral therapy (ART) has been shown to reduce HIV transmission (Cohen et al. 2011; Granich et al. 2009). Depending on the context, HIV testing is broadly marketed to or directed at specific high-risk populations. In sub-Saharan Africa pregnant women are perhaps the most common focus for HIV testing, probably because mother-to-child transmission is the leading cause of HIV infection among children, and antenatal care (ANC) is a common point of contact that adult women have with health services (WHO 2010).
1.1 A brief history of HIV testing in sub-Saharan Africa
The first HIV tests became available in 1985, a few years after the virus was discovered to be the cause of AIDS. Before the development of an effective treatment for HIV, many people questioned the benefit of HIV testing and emphasized the ethical concerns and potential harms that might arise from various testing strategies. Clinic settings offered HIV testing when patients presented from a “high-risk category” or with HIV/AIDS symptoms (WHO 2012). Individuals could also seek out testing via voluntary counseling and testing (VCT) (UNAIDS 2000), and client-initiated VCT became the major means by which individuals learned their HIV status (Bayer and Edington 2009; Matovu and Makumbi 2007).
The direction of the HIV epidemic and HIV testing was dramatically altered in the mid-1990s when antiretroviral treatment (ART) was found to extend and improve lives of persons living with HIV. The development of HIV treatment spurred many changes, including changes in testing strategies, increases in funding for testing, improvements in testing technology, and increased access to testing and treatment.
Soon after the development of ART, an international movement challenged the high prices for ART medications made treatment more available to sub-Saharan Africa and elsewhere in the developing world. By 2001, international organizations were examining ways to rapidly increase HIV testing on a global scale and to link HIV-positive individuals to treatment and care. Many in the HIV-prevention community argued that the standard VCT approach could remain useful but that additional testing strategies were necessary given the new treatment options. Proponents of this argument fought for
2
creative models that would respond to a larger community of individuals than those actively seeking testing via VCT (Bayer and Edington 2009; De Cock, Bunnell, and Mermin 2006).
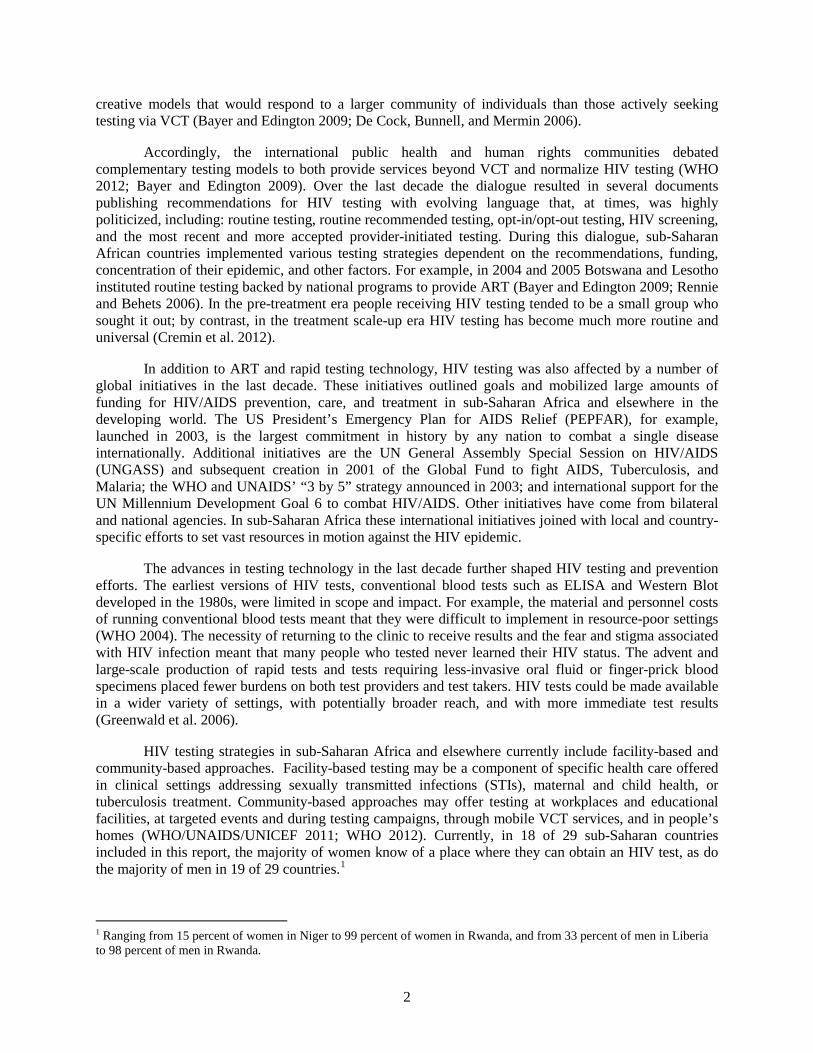
Accordingly, the international public health and human rights communities debated complementary testing models to both provide services beyond VCT and normalize HIV testing (WHO 2012; Bayer and Edington 2009). Over the last decade the dialogue resulted in several documents publishing recommendations for HIV testing with evolving language that, at times, was highly politicized, including: routine testing, routine recommended testing, opt-in/opt-out testing, HIV screening, and the most recent and more accepted provider-initiated testing. During this dialogue, sub-Saharan African countries implemented various testing strategies dependent on the recommendations, funding, concentration of their epidemic, and other factors. For example, in 2004 and 2005 Botswana and Lesotho instituted routine testing backed by national programs to provide ART (Bayer and Edington 2009; Rennie and Behets 2006). In the pre-treatment era people receiving HIV testing tended to be a small group who sought it out; by contrast, in the treatment scale-up era HIV testing has become much more routine and universal (Cremin et al. 2012).
In addition to ART and rapid testing technology, HIV testing was also affected by a number of global initiatives in the last decade. These initiatives outlined goals and mobilized large amounts of funding for HIV/AIDS prevention, care, and treatment in sub-Saharan Africa and elsewhere in the developing world. The US President’s Emergency Plan for AIDS Relief (PEPFAR), for example, launched in 2003, is the largest commitment in history by any nation to combat a single disease internationally. Additional initiatives are the UN General Assembly Special Session on HIV/AIDS (UNGASS) and subsequent creation in 2001 of the Global Fund to fight AIDS, Tuberculosis, and Malaria; the WHO and UNAIDS’ “3 by 5” strategy announced in 2003; and international support for the UN Millennium Development Goal 6 to combat HIV/AIDS. Other initiatives have come from bilateral and national agencies. In sub-Saharan Africa these international initiatives joined with local and country-specific efforts to set vast resources in motion against the HIV epidemic.
The advances in testing technology in the last decade further shaped HIV testing and prevention efforts. The earliest versions of HIV tests, conventional blood tests such as ELISA and Western Blot developed in the 1980s, were limited in scope and impact. For example, the material and personnel costs of running conventional blood tests meant that they were difficult to implement in resource-poor settings (WHO 2004). The necessity of returning to the clinic to receive results and the fear and stigma associated with HIV infection meant that many people who tested never learned their HIV status. The advent and large-scale production of rapid tests and tests requiring less-invasive oral fluid or finger-prick blood specimens placed fewer burdens on both test providers and test takers. HIV tests could be made available in a wider variety of settings, with potentially broader reach, and with more immediate test results (Greenwald et al. 2006).
HIV testing strategies in sub-Saharan Africa and elsewhere currently include facility-based and community-based approaches. Facility-based testing may be a component of specific health care offered in clinical settings addressing sexually transmitted infections (STIs), maternal and child health, or tuberculosis treatment. Community-based approaches may offer testing at workplaces and educational facilities, at targeted events and during testing campaigns, through mobile VCT services, and in people’s homes (WHO/UNAIDS/UNICEF 2011; WHO 2012). Currently, in 18 of 29 sub-Saharan countries included in this report, the majority of women know of a place where they can obtain an HIV test, as do the majority of men in 19 of 29 countries.1
1 Ranging from 15 percent of women in Niger to 99 percent of women in Rwanda, and from 33 percent of men in Liberia to 98 percent of men in Rwanda.

3
1.2 Purpose
HIV testing is an essential part of providing medical care to persons living with HIV and key to preventing HIV transmission. For people who test HIV-positive, testing is the starting point for care and management of the disease. It is also an entry point for efforts to prevent infection of their sexual partners and their children. Even for people who test HIV-negative, the testing process is an opportunity for counseling about HIV transmission that may strengthen prevention efforts and reduce stigma.
Since 1998, the MEASURE DHS Project’s Demographic and Health Surveys (DHS) and AIDS Indicator Surveys (AIS) have collected nationally representative data from women and men about whether they have ever been tested for HIV and if they received the test results. Additionally, since 2001, anonymous, informed, and voluntary HIV testing has been conducted in 47 DHS and AIS surveys.
Within the past decade, the MEASURE DHS project has noted marked increases in HIV testing uptake in many surveyed sub-Saharan countries. This report examines broad trends in uptake of HIV testing, as well as correlates of testing uptake across 29 countries in sub-Saharan Africa. It uses data from 47 nationally representative surveys conducted over the past decade, profiling trends within and across countries, both of any HIV testing and of testing during antenatal care. The aim is to provide a comparative portrait of the changing face of HIV testing within sub-Saharan Africa.

4
2 Data and Methods 2.1 Data
The study uses data from 47 Demographic and Health Surveys (DHS) and AIDS Indicator Surveys (AIS) conducted from 2003-2011 in 29 sub-Saharan African countries where questions about receipt of HIV testing were asked. To ensure comparability, data were restricted to women and men ages 15-49. The standard DHS and AIS questionnaires ask women and men about their experiences with HIV testing. Specifically they are asked, “I don’t want to know the results, but have you ever been tested to see if you have the AIDS virus?” Those who answer “yes” are then asked, “How many months ago was your most recent test,” and “I don’t want to know the results, but did you get the results of the test?” Through these questions, MEASURE DHS tabulates the two basic indicators on HIV testing presented in this paper—ever tested and received results, and tested in the last 12 months and received results.
Note that respondents’ self-reports of HIV testing do not include the voluntary HIV serostatus testing undertaken in the DHS and AIS surveys themselves. For the purpose of this report, ‘HIV testing uptake’ is specific to respondents’ self-reports about obtaining or receiving an HIV test and the results before being interviewed in the DHS or AIS.
Although the MEASURE DHS program is based on a standard core questionnaire, some surveys use slightly different questions in order to address country-specific concerns. In addition, questions have changed over time as understanding of the HIV epidemic has advanced. Every attempt has been made to note these country-specific exceptions, which can also be found in the final report for each survey.
DHS and AIS surveys use a two-stage cluster sampling design to reach households and ultimately individuals, as described in the DHS Sampling Manual (Macro International 1996). Individual male and female weights were applied to the data in Chapters 3 to 5 to adjust for nonresponse and to restore representativeness of the sample. In Chapter 6 HIV-specific weights are used.
2.2 Definitions
Over the course of the HIV/AIDS epidemic, multiple terms have been used to describe HIV testing, including the types of tests, test delivery, and the context in which testing occurs. Country-specific questions are often introduced into DHS and AIS surveys in order to more specifically respond to a country’s needs for monitoring and evaluating HIV/AIDS-related programs. Respondents are asked about the place where the most recent HIV test was taken and about whether it was offered or required. Comparative analysis of the place of testing is difficult because of the variety of options across countries and survey years. Furthermore, DHS and AIS questions generally do not distinguish between types of testing; respondents are asked about “voluntary counseling and testing” versus consent to provider-initiated opt-out testing that has occurred as part of a standard medical visit in different ways across surveys or with regard to ANC. For purposes of comparability, we consider only the end effect: whether or not the respondent was tested and received results.
Being tested for HIV and receiving results of the most recent test within a given time is sometimes considered a proxy for knowledge of one’s current HIV serostatus. While for many respondents the most recent test results may in fact reflect their current HIV status, using recent testing as a proxy for knowledge is misleading, for several reasons. First, even for tests within the past year only, there is a small risk that the respondent was exposed to HIV and seroconverted after receiving test results, or was newly exposed to HIV after the test altogether. Second, using recent testing as a proxy for knowledge of HIV status may be misleading among individuals who test HIV-positive. For example, while those who test HIV-negative are encouraged to retest at regular intervals, those who test HIV-

5
positive are unlikely to keep being retested. Thus people who tested HIV-positive five years before the survey would be misclassified as not “knowing” their status, because they have not been tested recently for HIV. For these reasons we do not refer to testing as indicating knowledge of one’s HIV status. Instead, we only consider the opposite: those who report never having been tested for HIV have no knowledge of their HIV status.
In some DHS and AIS surveys, biomarker testing for HIV prevalence is included for survey participants. In these surveys respondents are asked to give a few drops of blood to be tested in a laboratory for HIV. This biomarker information is anonymously linked to information from the interview, including whether the respondent was ever tested for HIV. Serostatus testing in DHS and AIS surveys is discussed in detail in Chapter 6.
This report uses the following definitions:
• Ever tested for HIV: Respondent answers yes to “I don't want to know the results, but have you ever been tested to see if you have the AIDS virus?” and, after being asked about the most recent test, responds yes to “I don't want to know the results, but did you get the results of the test?”
• Tested in the past 12 months: Among ever-tested respondents, who are then asked “How many months ago was your most recent HIV test?”, those who report that their most recent test was in the past 12 months
• Wealth quintile: The MEASURE DHS wealth index is calculated within each survey based on household access to sanitation facilities, water, electricity, flooring and roofing materials, and asset ownership. Households are ranked by wealth based on the computed index and divided into quintiles, from lowest to highest. It is important to understand that the wealth index is a relative measure; wealthier households may still be ‘poor’ on an absolute basis. The measure is only designed to allow relative comparisons within each country at the time of the interview. See Rutstein and Johnson (2004) for detailed calculation methods.
• Marital status: Women and men are categorized as being “married” or “in union” in DHS and AIS surveys if they self-report that they are “married or living with a woman/man as if married.”
• Antenatal care (ANC): Women who have given birth in the past five years before the survey are asked, for their most recent birth, “Did you see anyone for antenatal care for this pregnancy?” If the respondent answers yes, she is considered as having received ANC, regardless of the place of the visit, the number of visits, or the skill of the provider.
• Counseled about HIV during ANC: Women who received ANC for their most recent birth in the past five years are asked about HIV counseling during ANC. In five older surveys2 women were asked, “During any of the antenatal visits for this pregnancy, were you given any information or counseled about AIDS or the AIDS virus?” Women who responded yes are classified as having received counseling for HIV during ANC. In more recent surveys, women are specifically asked about three types of counseling;
2 Ghana 2003, Kenya 2003, Lesotho 2004, Malawi 2004, and Nigeria 2003.

6
During any of the antenatal visits for your last birth, did anyone talk to you about:
• Babies getting the AIDS virus from their mother
• Things that you can do to prevent getting the AIDS virus
• Getting tested for the AIDS virus3
In order to maintain comparability, women who answer yes to any of these three questions are classified as having received counseling about HIV during ANC.4 Note that any additional questions asked in some surveys about pre- and post-test counseling are excluded, as these questions are not asked in every survey and are dependent on having been tested during ANC.
• Tested for HIV during ANC: Women who received ANC for their most recent birth in the past five5 years are asked, “I don't want to know the results, but were you tested for the AIDS virus as part of your antenatal care?” and, if yes, are then asked, “I don't want to know the results, but did you get the results of the test?” Women who answer yes to both of these questions are classified as having been tested for HIV during ANC.
• Tested for HIV during and after ANC: In most surveys women who report having been tested during ANC are asked: “Have you been tested for the AIDS virus since that time you were tested during your pregnancy?” If they answer yes to this question and also report having received results of their most recent test, they are classified as having been tested during and after ANC.
• HIV serostatus: Respondent’s HIV status as determined by serotesting in the DHS or AIS. See Chapter 6 for a detailed discussion of these methods and measurements.
2.3 Surveys included
This comparative report is limited to surveys in sub-Saharan Africa, due to the unique nature of HIV prevalence and testing uptake in this region. The report in at least one chapter includes DHS or AIS surveys conducted in sub-Saharan Africa since 2003 if the surveys asked respondents whether they had been tested for HIV. In all, the report includes 47 surveys from 29 countries.
This report endeavored to include as many of the selected surveys as possible in each chapter, while limiting individual chapters to surveys that can be directly compared, given the indicators discussed. The report thus includes different combinations of surveys by chapter in order to best show trends across countries, over time, during antenatal care, and by serostatus. Table 2.1 includes a list of these surveys and the corresponding sample sizes.
3 Women in Cameroon 2004 were not asked this question. 4 Note that this definition is different than that used in DHS/AIS reports, where women must respond yes to all three questions in order to be classified as having been counseled for HIV. The definition is expanded in order to be consistent with earlier measures of HIV counseling during ANC. 5 While the questions are asked of all women who gave birth in the past five years, in order to ensure recency and consistency with final reports, we consider women who gave birth in the past two years only.

7
Table 2.1 Inclusion of surveys by chapter
Chapter 3: Covariates
Chapter 4: Trends
Chapter 5: ANC
Chapter 6: Serostatus
Number of women1
Number of men1
Benin DHS 2006 ● ●q ● 17,794 4,615 Burkina Faso DHS 2010 ● ●q ●q 17,087 6,500 Burundi DHS 2010 ● ●q ●q 9,389 3,760 Cameroon DHS 2004 ● ●q 10,656 4,815 Cameroon DHS 2011 ● ● ●q ●q 7,457 6,455 Chad DHS 2004 ● ●q 6,085 1,682 Congo (Brazzaville) DHS 2005 ● ●q 7,051 2,924 Congo (Brazzaville) AIS 2009 ● ● ●q ●q 6,550 5,863 Cote d’Ivoire AIS 2005 ● ●q ● 5,183 4,503 D.R. Congo DHS 2007 ● ●q ●q 9,995 4,316 Ethiopia DHS 2005 ● ●q 6,751 5,464 Ethiopia DHS 2011 ● ● ●q ●q 16,515 12,834 Ghana DHS 2003 ● ●q ●2 5,691 4,529 Ghana DHS 2008 ● ● ●q 4,916 4,058 Guinea DHS 2005 ● ●q ●q 7,954 2,709 Kenya DHS 2003 ● ●3 8,195 3,363 Kenya DHS 2008-09 ● ● ●q ●q 8,444 3,258 Lesotho DHS 2004-05 ● ●3 7,095 2,496 Lesotho DHS 2009 ● ● ●q ●q 7,624 3,008 Liberia DHS 2007 ● ●3 ●q 7,092 6,009 Madagascar DHS 2003-04 ● ●3 7,949 2,216 Madagascar DHS 2008-09 ● ● ●q 8,547 7,645 Malawi DHS 2004 ● ●q 11,698 3,114 Malawi DHS 2010 ● ● ●q ●q 23,020 6,818 Mali DHS 2006 ● ●q ●q 14,583 3,704 Mozambique DHS 2003 ● ●3 12,418 2,490 Mozambique AIS 2009 ● ● ●q ●q 5,674 4,168 Namibia DHS 2006-07 ● ●q 9,804 3,915 Niger DHS 2006 ● ●q ●q 9,223 3,101 Nigeria DHS 2003 ● ●3 7,620 2,093 Nigeria DHS 2008 ● ● ●q 33,385 13,808 Rwanda DHS 2005 ● ●q 11,321 4,413 Rwanda DHS 2010 ● ● ●q ●q 13,671 5,687 Senegal DHS 2005 ● ●q 14,602 3,415 Senegal DHS 2010-11 ● ● ●q ●q 15,688 4,417 Sierra Leone DHS 2008 ● ●q ●q 7,374 2,944 Swaziland DHS 2006-07 ● ●q ●q 4,987 4,156 Tanzania AIS 2003-04 ● ●q 6,863 5,659 Tanzania DHS 2004-05 ● ●q 10,329 2,635 Tanzania AIS/MIS 2007-08 ● ●q ●q 9,343 6,975 Tanzania DHS 2010 ● ● ●q 10,139 2,527 Uganda AIS 2004-05 ● ●q 9,941 8,010 Uganda DHS 2006 ● ●q 8,531 2,385 Uganda AIS 2011 ● ● ●q ●q 8,674 2,173 Zambia DHS 2007 ● ●q ●q 7,146 5,995 Zimbabwe DHS 2005-06 ● ●q 8,907 6,863 Zimbabwe DHS 2010-11 ● ● ●q ●q 9,171 7,110 1 The sample size is smaller in Chapter 5 on ANC testing, which includes women who gave birth in the past 5 years, and in Chapter 6 on HIV serostatus, which only includes adults who consented to be tested. Sample sizes are listed in those chapters. 2 Most recent survey does not have HIV serotesting; earlier survey used. 3 Country excluded from tables 5.2 to 5.4 because the survey did not ask about HIV testing during ANC.

8
Chapter 3, on current patterns in HIV testing uptake by characteristics of respondents, includes the most recent DHS or AIS survey from each of 29 countries. Chapter 4, which examines trends in HIV testing uptake over time, includes 33 surveys from 15 countries that have had multiple surveys with questions about HIV testing since 2003. Chapter 5, which examines HIV testing during ANC, uses all 47 surveys in the first table, and subsequently 41 surveys that asked about HIV testing during ANC. Finally, Chapter 6, on HIV testing by serostatus, includes the most recent survey from the 25 countries that conducted serostatus testing. Appendix Tables A.9 to A.14, on HIV testing by serostatus and covariates, include the 13 countries from Chapter 6 with adult HIV prevalence greater than 3 percent.
2.4 Limitations
This is a descriptive report of comparative trends; the study did not conduct multivariate regressions and tests of statistical significance. Patterns found in one dimension of HIV testing uptake, such as urban residence, are undoubtedly linked to other factors, such as wealth, education, and HIV serostatus.
Given the dramatic changes in HIV testing technology, funding, and outreach over the past decade in sub-Saharan Africa, cross-national trends should be interpreted with caution as to the year when the survey was conducted. Further, among the 15 countries with more than one survey since 2001, the number of years between the first survey and the most recent survey in a country ranges from four to seven years. Thus cross-national patterns and trends suggested by the data must be interpreted with caution and attention to the timing of the surveys.
Despite the standardization of the DHS and AIS core questionnaires, there are slight differences across countries in how HIV-related question are asked. This is particularly true regarding counseling and testing in antenatal care, addressed in Chapter 5. Footnotes indicate exceptions whenever possible; further details can be found in the survey-specific questionnaires at the end of the final report for each survey.

9
3 Factors Associated with HIV Testing Uptake Chapter 3 explores the most up-to-date national estimates of HIV testing uptake from all 29
surveyed countries in sub-Saharan Africa. The chapter examines patterns of testing uptake overall as well as by place of residence, age, education, wealth, marital status, and previous sexual activity.
3.1 Recent cross-national patterns in HIV testing uptake
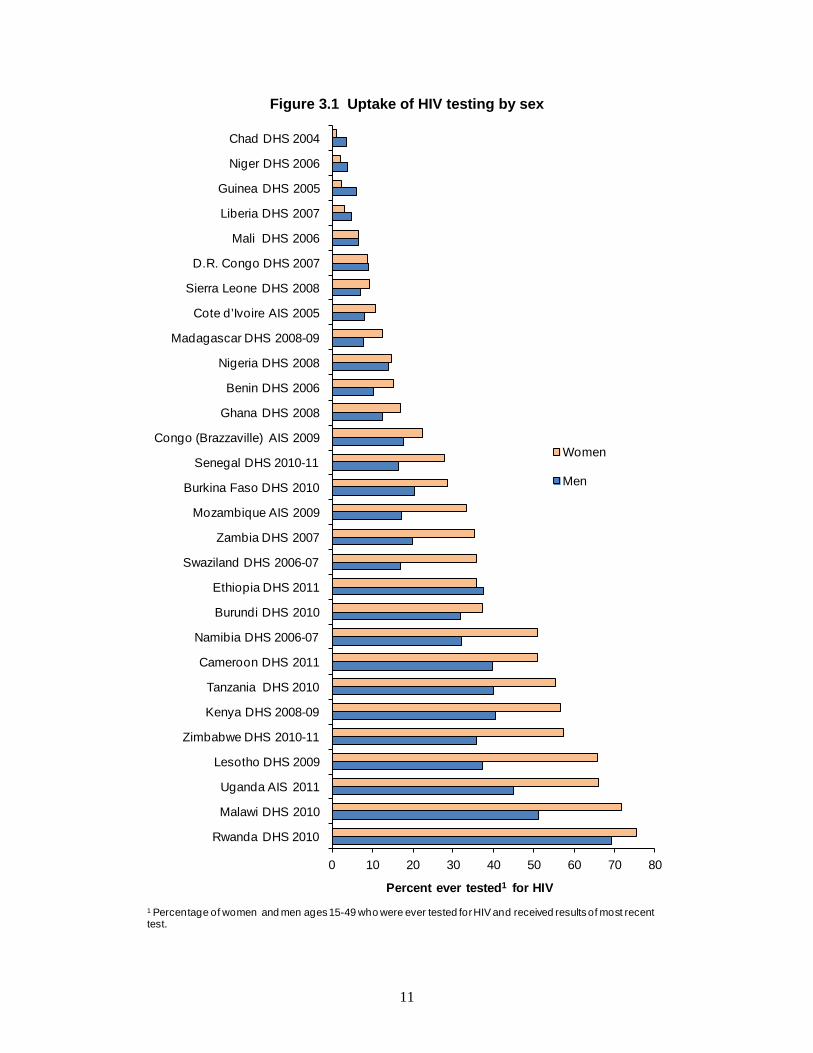
Table 3.1 presents the percentage of women and men who have ever been tested for HIV by country, for the most recent survey. The proportion of women ever tested for HIV ranges from 1 percent in Chad 2004 to 76 percent in Rwanda 2010, and for men ranges from 4 to 69 percent, also in Chad 2004 and Rwanda 2010, respectively. The median national uptake of HIV testing for women was 28.8 percent and for men was 17.2 percent.
Figure 3.1 shows the uptake of HIV testing by sex. In 9 of 29 countries, the majority of women have been tested for HIV at least once—Cameroon 2011, Kenya 2008-09, Lesotho 2009, Malawi 2010, Namibia 2006-07, Rwanda 2010, Tanzania 2010, Uganda 2011, and Zimbabwe 2010-11. In only two countries have the majority of men been tested for HIV at least once—Rwanda 2010 and Malawi 2010.
In 23 of 29 countries, more women than men report having ever been tested for HIV. The largest differential between women and men is 28 percentage points in Lesotho 2009. Of the six countries where the differential is reversed—that is, more men than women report having been tested—five are in West Africa; in these countries there was less than a four percentage point difference in ever testing between men and women.
Table 3.1 also shows uptake of HIV testing in the past 12 months; these data are displayed in Figure 3.2. For women, recent uptake of HIV testing ranges from less than 1 percent in Chad 2004 to 42 percent in Lesotho 2009, with a country median of 11.2 percent. For men the percent tested in the past year ranges from less than 2 percent in Niger 2006 to 38 percent in Rwanda 2010, with a country median of 8.9 percent.
In 22 of 27 countries,6 more women than men report having been tested for HIV in the past year. Of the five countries where more men than women report recent testing, four are in West Africa.
6 Due to a problem with the questionnaires for the Malawi 2010 DHS and Uganda 2011 AIS, data on time since last HIV test are not available for some women. Therefore these estimates are omitted.

10
Table 3.1 Uptake of HIV testing overall and in past 12 months by sex1
Among women and men age 15-49
Ever tested for HIV Tested in past 12 months Total Women Men Women Men Women Men
% % % % n n
Benin DHS 2006 15.1 10.4 6.5 4.8 17,794 4,615 Burkina Faso DHS 2010 28.8 20.3 11.2 8.4 17,087 6,500 Burundi DHS 2010 37.4 31.9 18.7 11.7 9,389 3,760 Cameroon DHS 2011 50.9 39.7 22.3 20.4 7,457 6,455 Chad DHS 2004 1.1 3.7 0.5 1.7 6,085 1,682 Congo (Brazzaville) AIS 2009 22.5 17.7 8.5 7.1 6,550 5,863 Cote d’Ivoire AIS 2005 10.9 7.9 3.7 3.2 5,183 4,503 D.R. Congo DHS 2007 8.6 9.2 4.1 3.8 9,995 4,316 Ethiopia DHS 2011 35.8 37.6 20.0 20.7 16,515 12,834 Ghana DHS 2008 16.9 12.4 6.8 4.1 4,916 4,058 Guinea DHS 2005 2.1 6.0 1.1 2.9 7,954 2,709 Kenya DHS 2008-09 56.5 40.4 29.3 22.8 8,444 3,258 Lesotho DHS 2009 65.6 37.2 42.0 24.0 7,624 3,008 Liberia DHS 2007 3.2 4.9 1.6 2.3 7,092 6,009 Madagascar DHS 2008-09 12.5 7.7 4.2 3.6 8,547 7,645 Malawi DHS 2010 71.6 51.2 2 31.3 23,020 6,818 Mali DHS 2006 6.6 6.4 3.1 2.7 14,583 3,704 Mozambique AIS 2009 33.3 17.2 17.0 8.9 5,674 4,168 Namibia DHS 2006-07 50.9 32.0 28.6 17.6 9,804 3,915 Niger DHS 2006 1.9 3.9 0.9 1.6 9,223 3,101 Nigeria DHS 2008 14.6 14.0 6.6 6.5 33,385 13,808 Rwanda DHS 2010 75.5 69.3 38.6 37.7 13,671 5,687 Senegal DHS 2010-11 27.7 16.5 13.6 9.0 15,688 4,417 Sierra Leone DHS 2008 9.4 7.0 4.1 3.4 7,374 2,944 Swaziland DHS 2006-07 35.8 17.1 21.9 8.9 4,987 4,156 Tanzania DHS 2010 55.3 39.8 29.5 25.0 10,139 2,527 Uganda AIS 2011 65.8 44.9 2 23.2 11,160 8,735 Zambia DHS 2007 35.3 19.8 18.5 11.7 7,146 5,995 Zimbabwe DHS 2010-11 57.4 35.9 33.6 20.5 9,171 7,110 1 'Tested' means tested and received results of the last test 2 Due to a problem with the questionnaires for the Malawi 2010 DHS and Uganda 2011 AIS, data on time since last HIV test are not available for some women. Therefore these estimates are omitted.
11
Figure 3.1 Uptake of HIV testing by sex
0 10 20 30 40 50 60 70 80
Rwanda DHS 2010
Malawi DHS 2010
Uganda AIS 2011
Lesotho DHS 2009
Zimbabwe DHS 2010-11
Kenya DHS 2008-09
Tanzania DHS 2010
Cameroon DHS 2011
Namibia DHS 2006-07
Burundi DHS 2010
Ethiopia DHS 2011
Swaziland DHS 2006-07
Zambia DHS 2007
Mozambique AIS 2009
Burkina Faso DHS 2010
Senegal DHS 2010-11
Congo (Brazzaville) AIS 2009
Ghana DHS 2008
Benin DHS 2006
Nigeria DHS 2008
Madagascar DHS 2008-09
Cote d’Ivoire AIS 2005
Sierra Leone DHS 2008
D.R. Congo DHS 2007
Mali DHS 2006
Liberia DHS 2007
Guinea DHS 2005
Niger DHS 2006
Chad DHS 2004
Percent ever tested1 for HIV
Women
Men
1 Percentage of women and men ages 15-49 who were ever tested for HIV and received results of most recent test.

12
Figure 3.2 Uptake of HIV testing in the past 12 months by sex
0 10 20 30 40 50 60 70 80
Rwanda DHS 2010
Malawi DHS 2010
Uganda AIS 2011
Lesotho DHS 2009
Zimbabwe DHS 2010-11
Kenya DHS 2008-09
Tanzania DHS 2010
Cameroon DHS 2011
Namibia DHS 2006-07
Burundi DHS 2010
Ethiopia DHS 2011
Swaziland DHS 2006-07
Zambia DHS 2007
Mozambique AIS 2009
Burkina Faso DHS 2010
Senegal DHS 2010-11
Congo (Brazzaville) AIS 2009
Ghana DHS 2008
Benin DHS 2006
Nigeria DHS 2008
Madagascar DHS 2008-09
Cote d’Ivoire AIS 2005
Sierra Leone DHS 2008
D.R. Congo DHS 2007
Mali DHS 2006
Liberia DHS 2007
Guinea DHS 2005
Niger DHS 2006
Chad DHS 2004
Percent ever tested1 for HIV
Women
Men
1 Percentage of women and men ages 15-49 who were tested for HIV in the past 12 months and received results of most recent test.* Due to a problem with the questionnaires for the Malawi 2010 DHS and Uganda 2011 AIS, data on time since last HIV test are not available for some women. Therefore these estimates are omitted.
*
13
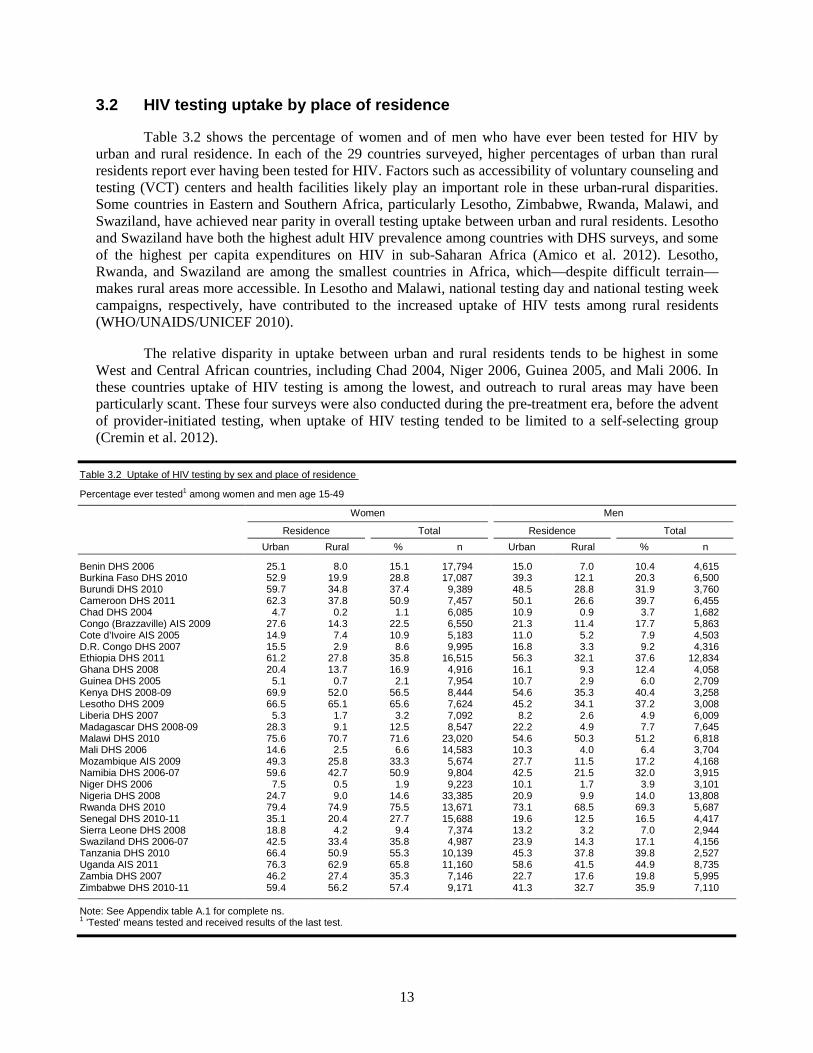
3.2 HIV testing uptake by place of residence
Table 3.2 shows the percentage of women and of men who have ever been tested for HIV by urban and rural residence. In each of the 29 countries surveyed, higher percentages of urban than rural residents report ever having been tested for HIV. Factors such as accessibility of voluntary counseling and testing (VCT) centers and health facilities likely play an important role in these urban-rural disparities. Some countries in Eastern and Southern Africa, particularly Lesotho, Zimbabwe, Rwanda, Malawi, and Swaziland, have achieved near parity in overall testing uptake between urban and rural residents. Lesotho and Swaziland have both the highest adult HIV prevalence among countries with DHS surveys, and some of the highest per capita expenditures on HIV in sub-Saharan Africa (Amico et al. 2012). Lesotho, Rwanda, and Swaziland are among the smallest countries in Africa, which—despite difficult terrain—makes rural areas more accessible. In Lesotho and Malawi, national testing day and national testing week campaigns, respectively, have contributed to the increased uptake of HIV tests among rural residents (WHO/UNAIDS/UNICEF 2010).
The relative disparity in uptake between urban and rural residents tends to be highest in some West and Central African countries, including Chad 2004, Niger 2006, Guinea 2005, and Mali 2006. In these countries uptake of HIV testing is among the lowest, and outreach to rural areas may have been particularly scant. These four surveys were also conducted during the pre-treatment era, before the advent of provider-initiated testing, when uptake of HIV testing tended to be limited to a self-selecting group (Cremin et al. 2012).
Table 3.2 Uptake of HIV testing by sex and place of residence
Percentage ever tested1 among women and men age 15-49
Women Men
Residence Total Residence Total Urban Rural % n Urban Rural % n
Benin DHS 2006 25.1 8.0 15.1 17,794 15.0 7.0 10.4 4,615 Burkina Faso DHS 2010 52.9 19.9 28.8 17,087 39.3 12.1 20.3 6,500 Burundi DHS 2010 59.7 34.8 37.4 9,389 48.5 28.8 31.9 3,760 Cameroon DHS 2011 62.3 37.8 50.9 7,457 50.1 26.6 39.7 6,455 Chad DHS 2004 4.7 0.2 1.1 6,085 10.9 0.9 3.7 1,682 Congo (Brazzaville) AIS 2009 27.6 14.3 22.5 6,550 21.3 11.4 17.7 5,863 Cote d’Ivoire AIS 2005 14.9 7.4 10.9 5,183 11.0 5.2 7.9 4,503 D.R. Congo DHS 2007 15.5 2.9 8.6 9,995 16.8 3.3 9.2 4,316 Ethiopia DHS 2011 61.2 27.8 35.8 16,515 56.3 32.1 37.6 12,834 Ghana DHS 2008 20.4 13.7 16.9 4,916 16.1 9.3 12.4 4,058 Guinea DHS 2005 5.1 0.7 2.1 7,954 10.7 2.9 6.0 2,709 Kenya DHS 2008-09 69.9 52.0 56.5 8,444 54.6 35.3 40.4 3,258 Lesotho DHS 2009 66.5 65.1 65.6 7,624 45.2 34.1 37.2 3,008 Liberia DHS 2007 5.3 1.7 3.2 7,092 8.2 2.6 4.9 6,009 Madagascar DHS 2008-09 28.3 9.1 12.5 8,547 22.2 4.9 7.7 7,645 Malawi DHS 2010 75.6 70.7 71.6 23,020 54.6 50.3 51.2 6,818 Mali DHS 2006 14.6 2.5 6.6 14,583 10.3 4.0 6.4 3,704 Mozambique AIS 2009 49.3 25.8 33.3 5,674 27.7 11.5 17.2 4,168 Namibia DHS 2006-07 59.6 42.7 50.9 9,804 42.5 21.5 32.0 3,915 Niger DHS 2006 7.5 0.5 1.9 9,223 10.1 1.7 3.9 3,101 Nigeria DHS 2008 24.7 9.0 14.6 33,385 20.9 9.9 14.0 13,808 Rwanda DHS 2010 79.4 74.9 75.5 13,671 73.1 68.5 69.3 5,687 Senegal DHS 2010-11 35.1 20.4 27.7 15,688 19.6 12.5 16.5 4,417 Sierra Leone DHS 2008 18.8 4.2 9.4 7,374 13.2 3.2 7.0 2,944 Swaziland DHS 2006-07 42.5 33.4 35.8 4,987 23.9 14.3 17.1 4,156 Tanzania DHS 2010 66.4 50.9 55.3 10,139 45.3 37.8 39.8 2,527 Uganda AIS 2011 76.3 62.9 65.8 11,160 58.6 41.5 44.9 8,735 Zambia DHS 2007 46.2 27.4 35.3 7,146 22.7 17.6 19.8 5,995 Zimbabwe DHS 2010-11 59.4 56.2 57.4 9,171 41.3 32.7 35.9 7,110
Note: See Appendix table A.1 for complete ns. 1 'Tested' means tested and received results of the last test.

14
Table 3.3 shows the percentage of women and men who have been tested in the past 12 months. Here, the disparity in recent testing uptake between urban and rural residents is generally similar to what it was among respondents who were ever tested. In Zimbabwe 2010-11 (for women only) and Rwanda 2010, the pattern is slightly reversed: the percent recently tested is slightly higher among rural than urban residents. To the extent that patterns from the past 12 months are indicative of future trends, these results suggest that testing uptake among urban and rural residents may become increasingly equal over time.
Table 3.3 Uptake of HIV testing in the past 12 months by sex and place of residence
Percentage tested1 in the past 12 months among women and men age 15-49
Women Men Residence Total Residence Total
Urban Rural % n Urban Rural % n
Benin DHS 2006 10.5 3.6 6.5 17,794 7.8 2.6 4.8 4,615 Burkina Faso DHS 2010 21.3 7.5 11.2 17,087 18.1 4.3 8.4 6,500 Burundi DHS 2010 30.1 17.3 18.7 9,389 19.2 10.3 11.7 3,760 Cameroon DHS 2011 28.6 15.0 22.3 7,457 26.5 12.7 20.4 6,455 Chad DHS 2004 2.4 0.0 0.5 6,085 5.2 0.4 1.7 1,682 Congo (Brazzaville) AIS 2009 9.5 6.7 8.5 6,550 8.1 5.2 7.1 5,863 Cote d’Ivoire AIS 2005 5.0 2.5 3.7 5,183 4.7 1.9 3.2 4,503 D.R. Congo DHS 2007 7.3 1.4 4.1 9,995 7.0 1.4 3.8 4,316 Ethiopia DHS 2011 36.0 15.0 20.0 16,515 30.4 17.9 20.7 12,834 Ghana DHS 2008 8.6 5.1 6.8 4,916 4.8 3.5 4.1 4,058 Guinea DHS 2005 2.7 0.4 1.1 7,954 5.2 1.4 2.9 2,709 Kenya DHS 2008-09 37.6 26.4 29.3 8,444 26.2 21.5 22.8 3,258 Lesotho DHS 2009 42.1 42.0 42.0 7,624 30.3 21.5 24.0 3,008 Liberia DHS 2007 2.7 0.9 1.6 7,092 4.0 1.1 2.3 6,009 Madagascar DHS 2008-09 11.5 2.6 4.2 8,547 10.2 2.4 3.6 7,645 Malawi DHS 2010 2 2 2 2 33.2 30.8 31.3 6,818 Mali DHS 2006 6.8 1.2 3.1 14,583 5.3 1.1 2.7 3,704 Mozambique AIS 2009 25.3 13.2 17.0 5,674 15.9 5.1 8.9 4,168 Namibia DHS 2006-07 33.1 24.3 28.6 9,804 23.1 12.0 17.6 3,915 Niger DHS 2006 3.7 0.2 0.9 9,223 4.8 0.5 1.6 3,101 Nigeria DHS 2008 10.9 4.1 6.6 33,385 9.2 4.9 6.5 13,808 Rwanda DHS 2010 38.1 38.7 38.6 13,671 37.4 37.7 37.7 5,687 Senegal DHS 2010-11 17.5 9.9 13.6 15,688 11.1 6.3 9.0 4,417 Sierra Leone DHS 2008 8.2 1.8 4.1 7,374 6.5 1.6 3.4 2,944 Swaziland DHS 2006-07 24.1 21.1 21.9 4,987 12.8 7.4 8.9 4,156 Tanzania DHS 2010 36.9 26.5 29.5 10,139 28.8 23.6 25.0 2,527 Uganda AIS 2011 2 2 2 2 30.4 21.4 23.2 8,735 Zambia DHS 2007 23.9 14.6 18.5 7,146 13.4 10.4 11.7 5,995 Zimbabwe DHS 2010-11 33.1 34.0 33.6 9,171 22.1 19.5 20.5 7,110
Note: See Appendix table A.1 for complete ns. 1 'Tested' means tested and received results of the last test. 2 Due to a problem with the questionnaires for the Malawi 2010 DHS and Uganda 2011 AIS, data on time since last HIV test are not available for some women. Therefore these estimates are omitted.
3.3 HIV testing uptake by age
Table 3.4 displays the percentage of women ever tested for HIV by age group. The age pattern of HIV testing uptake among women tends to follow an inverse U-shape; in 28 of 29 countries, receipt of HIV testing peaks between at age 20-34, and is far lower at either end of the age distribution, particularly among teens. For example, in the Malawi 2010 DHS—which has the second highest uptake of HIV testing among women overall—more than 80 percent of women in each of the three five-year age groups between 20 and 34 report having been tested. Meanwhile, uptake among women age 15-19 is 43 percent, and among women age 45-49, 54 percent.
The only exception to this age pattern is the country with the lowest overall uptake of HIV testing, Chad 2004, where receipt of HIV testing is highest among women age 35-39. In no country is testing uptake highest among women age 15-19 or women over age 40.

15
In some countries with relatively high uptake of HIV testing, including Burundi 2010, Namibia 2006-07, and Swaziland 2006-07, uptake among teens is particularly low, at less than 20 percent. While many factors may affect this age pattern, one of the most important may be that the age of consent for medical treatment is 18 or 21 in these three countries (Global Commission on HIV and the Law 2012). In other countries with high testing uptake among young people age 15-19, laws are much more permissive about testing among adolescents. In Lesotho the age of consent for HIV testing is 12 years, and in Malawi, 13 years. In Rwanda young women can use sexual and reproductive health services without their parents’ consent (UNFPA, IPPF, and The Global Coalition on Women and AIDS 2008b, 2008a; Global Commission on HIV and the Law 2012).
Table 3.4 Uptake of HIV testing among women by 5-year age group
Percentage ever tested1 among women age 15-49
Women Total 5-year age groups
15-19 20-24 25-29 30-34 35-39 40-44 45-49 % n
Benin DHS 2006 7.7 18.4 19.0 18.1 16.5 12.3 8.2 15.1 17,794 Burkina Faso DHS 2010 13.7 37.8 39.0 34.6 28.9 24.3 15.3 28.8 17,087 Burundi DHS 2010 16.0 50.0 50.8 48.0 46.6 32.0 22.2 37.4 9,389 Cameroon DHS 2011 28.3 59.1 63.2 62.7 57.4 47.5 44.4 50.9 7,457 Chad DHS 2004 0.6 0.9 1.4 1.3 2.0 1.0 1.3 1.1 6,085 Congo (Brazzaville) AIS 2009 10.2 25.2 29.5 29.6 25.3 19.0 16.9 22.5 6,550 Cote d’Ivoire AIS 2005 3.4 11.8 14.6 18.5 13.3 11.1 6.1 10.9 5,183 D.R. Congo DHS 2007 3.8 8.5 11.8 11.8 12.0 6.9 6.7 8.6 9,995 Ethiopia DHS 2011 32.1 44.4 39.8 36.6 34.4 29.4 23.7 35.8 16,515 Ghana DHS 2008 4.9 15.8 28.3 24.4 23.7 13.9 8.2 16.9 4,916 Guinea DHS 2005 1.8 3.2 2.6 2.7 1.2 1.5 1.5 2.1 7,954 Kenya DHS 2008-09 27.8 68.2 73.2 71.9 59.3 53.4 38.3 56.5 8,444 Lesotho DHS 2009 42.8 74.5 78.1 72.5 74.8 64.8 62.7 65.6 7,624 Liberia DHS 2007 2.7 4.4 4.2 2.7 3.4 2.3 1.7 3.2 7,092 Madagascar DHS 2008-09 8.3 15.1 15.5 15.3 11.6 12.9 8.9 12.5 8,547 Malawi DHS 2010 43.1 84.0 86.7 82.1 78.1 69.8 54.3 71.6 23,020 Mali DHS 2006 4.7 9.6 7.8 8.6 5.7 3.7 3.3 6.6 14,583 Mozambique AIS 2009 27.1 44.0 41.7 37.1 25.9 23.4 18.2 33.3 5,674 Namibia DHS 2006-07 17.5 60.2 68.5 64.6 64.1 54.7 40.0 50.9 9,804 Niger DHS 2006 1.7 2.4 1.7 2.4 1.6 1.5 1.2 1.9 9,223 Nigeria DHS 2008 4.0 14.7 21.7 22.8 17.8 12.8 7.1 14.6 33,385 Rwanda DHS 2010 43.5 76.9 90.3 92.6 89.3 80.8 72.6 75.5 13,671 Senegal DHS 2010-11 16.1 31.0 36.2 34.2 30.8 23.3 19.1 27.7 15,688 Sierra Leone DHS 2008 5.6 12.5 10.8 12.4 9.4 7.0 4.3 9.4 7,374 Swaziland DHS 2006-07 15.8 42.1 47.0 46.9 44.7 37.7 32.7 35.8 4,987 Tanzania DHS 2010 29.3 67.4 69.9 68.2 58.2 53.3 40.4 55.3 10,139 Uganda AIS 2011 40.8 77.4 80.8 73.0 70.6 64.6 54.7 65.8 11,160 Zambia DHS 2007 20.6 41.5 42.6 40.7 37.9 37.6 26.2 35.3 7,146 Zimbabwe DHS 2010-11 24.7 66.3 75.6 70.0 63.9 56.8 47.8 57.4 9,171
Note: See Appendix table A.2 for complete ns. 1 'Tested' means tested and received results of the last test.
Table 3.5 shows receipt of HIV testing among men by age group. The age profile of testing
uptake among men tends to differ in two respects from that for women: it peaks at slightly older ages (at age 25-39 in 25 of 29 countries), and it does not decline as sharply among men over age 40 as among women. For example, in the 2010 Rwanda DHS receipt of HIV testing peaks at 90 percent among men age 30-34, but at least 80 percent of men in every other five-year age group between 25 and 49 report having ever been tested for HIV. Meanwhile, the reported uptake of testing in Rwanda is 65 percent among men age 20-24 and 37 percent among young men age 15-19. In four countries the uptake of testing among men peaks at older ages. In no country is HIV testing uptake highest among men under age 25.

16
Table 3.5 Uptake of HIV testing among men by 5-year age group
Percentage ever tested1 among men age 15-49
Men
Total 5-year age groups
15-19 20-24 25-29 30-34 35-39 40-44 45-49 % n
Benin DHS 2006 5.4 11.0 12.6 11.0 15.0 11.0 8.8 10.4 4,615 Burkina Faso DHS 2010 7.4 23.4 28.9 28.2 25.1 18.2 15.6 20.3 6,500 Burundi DHS 2010 10.8 36.3 53.2 41.8 35.9 31.2 26.5 31.9 3,760 Cameroon DHS 2011 12.8 38.0 53.4 55.5 53.3 46.4 48.3 39.7 6,455 Chad DHS 2004 1.5 4.1 5.2 6.3 4.0 2.8 2.7 3.7 1,682 Congo (Brazzaville) AIS 2009 3.9 12.3 20.6 23.9 25.1 24.2 22.1 17.7 5,863 Cote d’Ivoire AIS 2005 2.2 5.6 11.4 10.7 15.1 5.4 7.5 7.9 4,503 D.R. Congo DHS 2007 2.9 8.2 10.1 15.4 14.1 9.8 10.2 9.2 4,316 Ethiopia DHS 2011 25.3 40.7 45.9 43.6 38.4 40.2 34.9 37.6 12,834 Ghana DHS 2008 3.1 11.1 13.8 20.3 17.5 16.6 12.4 12.4 4,058 Guinea DHS 2005 2.0 8.2 9.2 8.6 5.6 7.5 4.3 6.0 2,709 Kenya DHS 2008-09 21.9 42.7 55.7 47.5 48.8 43.3 34.7 40.4 3,258 Lesotho DHS 2009 18.5 35.3 44.7 46.4 46.8 58.8 51.3 37.2 3,008 Liberia DHS 2007 0.7 5.1 5.1 8.4 6.3 6.3 3.9 4.9 6,009 Madagascar DHS 2008-09 5.0 8.9 10.4 8.0 7.9 7.8 6.6 7.7 7,645 Malawi DHS 2010 30.6 57.6 64.9 58.3 57.0 53.9 51.4 51.2 6,818 Mali DHS 2006 2.2 7.9 7.7 10.3 7.1 7.1 4.9 6.4 3,704 Mozambique AIS 2009 9.2 23.4 21.9 22.3 14.9 15.1 14.0 17.2 4,168 Namibia DHS 2006-07 7.5 28.4 40.4 40.5 45.8 47.2 47.3 32.0 3,915 Niger DHS 2006 1.2 2.5 5.0 4.6 6.8 4.6 4.2 3.9 3,101 Nigeria DHS 2008 3.8 11.3 16.7 19.6 19.1 17.0 15.2 14.0 13,808 Rwanda DHS 2010 37.1 64.5 86.4 89.5 86.8 85.2 80.5 69.3 5,687 Senegal DHS 2010-11 10.6 15.2 17.3 23.4 20.7 20.3 17.9 16.5 4,417 Sierra Leone DHS 2008 1.4 5.6 7.7 9.5 8.9 12.6 5.4 7.0 2,944 Swaziland DHS 2006-07 3.0 13.2 25.8 28.9 30.6 31.8 27.1 17.1 4,156 Tanzania DHS 2010 17.9 42.3 50.9 46.9 51.3 47.3 46.4 39.8 2,527 Uganda AIS 2011 20.7 46.0 58.3 56.2 53.3 51.2 47.7 44.9 8,735 Zambia DHS 2007 8.7 21.3 25.4 25.0 21.6 21.1 24.2 19.8 5,995 Zimbabwe DHS 2010-11 10.3 33.9 47.5 46.4 48.5 48.1 48.5 35.9 7,110
Note: See Appendix table A.3 for complete ns. 1 'Tested' means tested and received results of the last test.
Ever testing is inherently cumulative: older adults have more exposure to the possibility of being
tested. Even so, the proportion of women who have ever been tested for HIV tends to be far lower at older ages. Among men, there are only a few cases where testing uptake is higher among men age 40-49. HIV testing has become widely available only in the past decade, so cumulative exposure may not mean as much as it otherwise would; additionally, older adults may have less of a perceived need for HIV testing.
Table 3.6 shows the percentage of women who have been tested in the past 12 months by age group, and Table 3.7 shows the percentage of men. Among women, receipt of HIV testing in the past year tends to be skewed more toward age 20-29 than was the case among ever-tested women. Presumably, receiving ANC is an important factor in recent testing for HIV. In 22 of 23 countries where testing uptake among women in the past year is above 2 percent, uptake is lowest among young women age 15-19 and women age 45-49. Lesotho, the country with the highest uptake of testing among women in the past year, is the only outlier in this regard: women age 45-49 in Lesotho are almost equally as likely as women age 30-44 to have been tested in the past 12 months. Among men, the age pattern of testing uptake in the past 12 months is very close to the age pattern of ever-tested men: very low at age 15-19, higher at age 20-24, and highest among men over age 25. In 23 of 29 countries, testing uptake peaks among men age 25-39; in the remaining six countries it peaks between ages 40 to 49.

17
Table 3.6 Uptake of HIV testing in the past 12 months among women by 5-year age group
Percentage tested1 in the past 12 months among women age 15-49
Women Total 5-year age groups
15-19 20-24 25-29 30-34 35-39 40-44 45-49 % n
Benin DHS 2006 4.5 9.9 7.8 6.6 6.1 4.0 2.8 6.5 17,794 Burkina Faso DHS 2010 7.9 16.5 14.8 12.4 9.6 6.9 3.3 11.2 17,087 Burundi DHS 2010 11.4 25.6 23.9 23.0 20.9 13.6 8.5 18.7 9,389 Cameroon DHS 2011 14.5 29.3 27.9 27.7 20.3 16.0 15.6 22.3 7,457 Chad DHS 2004 0.5 0.7 0.5 0.4 1.0 0.4 0.3 0.5 6,085 Congo (Brazzaville) AIS 2009 4.7 10.6 10.4 10.9 9.2 5.9 5.4 8.5 6,550 Cote d’Ivoire AIS 2005 2.3 3.2 5.8 4.8 2.8 6.3 0.6 3.7 5,183 D.R. Congo DHS 2007 2.3 4.5 6.0 5.6 4.2 2.5 2.5 4.1 9,995 Ethiopia DHS 2011 18.8 24.5 23.1 21.1 17.3 15.7 12.0 20.0 16,515 Ghana DHS 2008 2.6 7.6 12.5 7.3 8.7 4.3 3.1 6.8 4,916 Guinea DHS 2005 1.2 1.5 1.6 0.8 0.6 0.3 1.1 1.1 7,954 Kenya DHS 2008-09 17.8 38.6 40.2 36.0 22.7 23.3 14.9 29.3 8,444 Lesotho DHS 2009 33.1 48.9 45.2 42.2 43.6 40.5 43.7 42.0 7,624 Liberia DHS 2007 1.7 2.1 1.8 1.7 1.6 1.3 0.6 1.6 7,092 Madagascar DHS 2008-09 4 5.5 5.4 4.8 3 2.9 2.1 4.2 8,547 Malawi DHS 2010 2 2 2 2 2 2 2 2 2
Mali DHS 2006 3.2 4.2 3.6 3.7 2.3 0.7 1.6 3.1 14,583 Mozambique AIS 2009 15.1 24.2 21.1 18.7 11.9 10.6 7.2 17.0 5,674 Namibia DHS 2006-07 12.8 35.8 40.0 35.5 29.3 27.1 20.1 28.6 9,804 Niger DHS 2006 0.9 1.1 0.9 0.9 0.8 0.4 0.5 0.9 9,223 Nigeria DHS 2008 2.2 8.4 10.3 9.3 6.4 4.1 2.7 6.6 33,385 Rwanda DHS 2010 27.3 47.2 47.0 42.7 39.4 34.3 26.0 38.6 13,671 Senegal DHS 2010-11 9.6 16.3 17.3 15.2 13.9 10.9 8.5 13.6 15,688 Sierra Leone DHS 2008 3.3 5.6 4.7 5.6 3.2 2.4 1.8 4.1 7,374 Swaziland DHS 2006-07 10.0 27.9 29.7 27.4 24.1 20.7 20.3 21.9 4,987 Tanzania DHS 2010 20.5 37.9 34.5 35.1 29.6 24.2 18.6 29.5 10,139 Uganda AIS 2011 2 2 2 2 2 2 2 2 2
Zambia DHS 2007 12.8 21.9 22.5 21.6 16.3 18.8 12.7 18.5 7,146 Zimbabwe DHS 2010-11 18.4 42.2 44.1 38.0 33.8 29.3 23.0 33.6 9,171
Note: See Appendix table A.2 for complete ns. 1 'Tested' means tested and received results of the last test. 2 Due to a problem with the questionnaires for the Malawi 2010 DHS and Uganda 2011 AIS, data on time since last HIV test are not available for some women. Therefore these estimates are omitted.

18
Table 3.7 Uptake of HIV testing in the past 12 months among men by 5-year age group
Percentage tested1 in the past 12 months among men age 15-49
Men
Total 5-year age groups
15-19 20-24 25-29 30-34 35-39 40-44 45-49 % n
Benin DHS 2006 3.3 6.1 6.5 3.4 5.6 5.0 4.3 4.8 4,615 Burkina Faso DHS 2010 4.0 10.9 11.8 11.6 9.6 6.8 5.0 8.4 6,500 Burundi DHS 2010 6.4 16.9 16.6 13.7 9.2 10.0 7.9 11.7 3,760 Cameroon DHS 2011 6.9 21.5 31.0 27.4 22.5 21.1 22.5 20.4 6,455 Chad DHS 2004 1.1 1.9 2.7 2.1 2.4 0.6 1.3 1.7 1,682 Congo (Brazzaville) AIS 2009 2.4 5.9 7.9 8.3 8.2 10.7 10.1 7.1 5,863 Cote d’Ivoire AIS 2005 1.8 2.5 4.6 5.5 5.3 0.3 1.6 3.2 4,503 D.R. Congo DHS 2007 1.4 4.4 4.1 5.7 5.9 3.5 3.4 3.8 4,316 Ethiopia DHS 2011 16.5 24.8 23.7 22.5 17.7 22.2 17.0 20.7 12,834 Ghana DHS 2008 1.6 5.7 4.7 5.0 6.4 2.4 3.4 4.1 4,058 Guinea DHS 2005 0.9 3.6 5.6 4.6 2.5 2.3 2.7 2.9 2,709 Kenya DHS 2008-09 13.1 25.4 31.1 27.6 24.5 23.2 18.8 22.8 3,258 Lesotho DHS 2009 11.8 24.0 30.1 27.0 29.7 38.3 32.9 24.0 3,008 Liberia DHS 2007 0.4 2.9 2.6 3.2 3.1 3.8 0.7 2.3 6,009 Madagascar DHS 2008-09 2.5 4.8 4.4 3.9 3.2 3.9 2.9 3.6 7,645 Malawi DHS 2010 21.0 38.5 38.8 32.9 33.5 30.0 27.5 31.3 6,818 Mali DHS 2006 1.3 3.4 2.6 4.3 3.5 2.2 2.1 2.7 3,704 Mozambique AIS 2009 5.6 11.6 12.0 11.0 7.7 6.9 7.2 8.9 4,168 Namibia DHS 2006-07 5.7 16.3 23.7 19.8 23.9 21.9 27.1 17.6 3,915 Niger DHS 2006 1.0 1.5 2.5 1.8 1.9 1.3 1.7 1.6 3,101 Nigeria DHS 2008 2.2 5.6 7.9 9.2 9.1 6.5 6.1 6.5 13,808 Rwanda DHS 2010 23.9 41.7 47.4 43.9 40.4 38.7 35.0 37.7 5,687 Senegal DHS 2010-11 6.0 8.9 9.9 13.2 11.8 7.6 8.4 9.0 4,417 Sierra Leone DHS 2008 0.4 2.2 4.0 6.0 3.9 6.5 2.5 3.4 2,944 Swaziland DHS 2006-07 1.8 6.9 13.1 15.2 16.2 17.1 13.0 8.9 4,156 Tanzania DHS 2010 13.0 27.9 30.9 28.6 31.0 29.6 26.3 25.0 2,527 Uganda AIS 2011 11.3 25.5 31.3 29.3 28.5 21.7 20.9 23.2 8,735 Zambia DHS 2007 7.3 14.1 14.2 13.9 10.6 10.9 12.7 11.7 5,995 Zimbabwe DHS 2010-11 7.0 22.1 28.0 25.2 26.3 23.6 22.2 20.5 7,110
Note: See Appendix table A.3 for complete ns. 1 'Tested' means tested and received results of the last test.
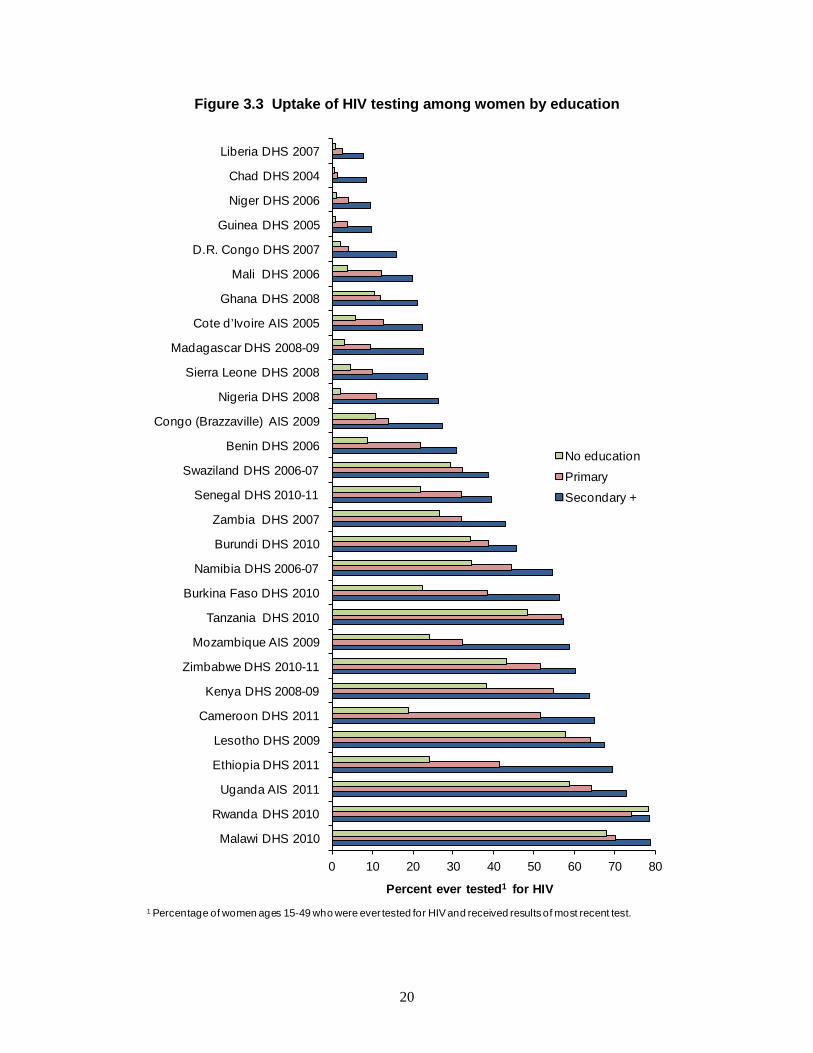
3.4 HIV testing uptake by education
Table 3.8 shows the percentage of women and men who have ever been tested for HIV by education, defined as the highest level of schooling attended. Figure 3.3 for women and Figure 3.4 for men illustrates these data. In all 29 countries, women who have attended secondary school are more likely to have ever been tested for HIV than women with no education or women who have attended primary school only. For example, in Uganda 2011 testing uptake among women with no education (59 percent), is markedly lower than uptake among women who have attended secondary school (73 percent), while women a primary school education have nearly the same uptake as women overall. The only exception to this pattern is Rwanda 2010, where testing uptake is higher among women with no education than among women with a primary school education.
Relative disparities in uptake of HIV testing between women with secondary education and women with no education tend to be larger when overall testing uptake is low. In Chad 2004 and Guinea 2005, for example, less than 1 percent of women with no education have ever been tested compared with more than 8 percent of women with secondary education. In countries with higher overall testing uptake, however, greater parity in testing among educational groups is not always the case. In Cameroon 2011, for example, a country where more than half of all women have ever been tested for HIV, women who

19
attended secondary school are more than three times as likely to have ever been tested for HIV compared with women with no education.
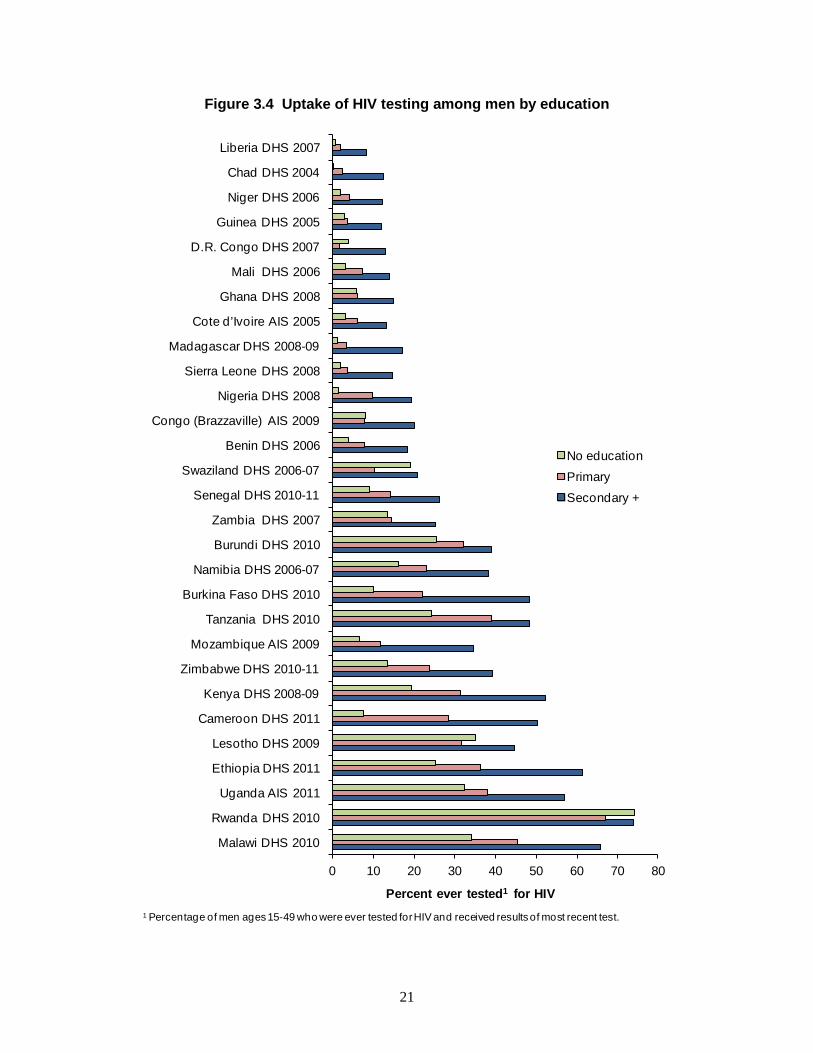
Table 3.8 and Figure 3.4 show HIV testing uptake for men by education. As with women, testing uptake tends to be higher among men who attended secondary education compared with men with no education or with primary education only. There are four exceptions: Congo Brazzaville 2009, D.R. Congo 2007, Lesotho 2009, and Rwanda 2010. In the first three surveys, testing uptake among men with no education is higher than among men who had attended primary school. In Rwanda 2010, testing uptake among men with no education is higher not only than uptake among men who attended primary school but also slightly higher than among men who attended secondary school. In the other 25 countries, however, uptake of HIV testing among men increases with education. In Table 3.9, which shows the percentage of women and men tested in the past 12 months by educational attainment, the patterns are quite similar to patterns for the percentage ever tested.
Table 3.8 Uptake of HIV testing by sex and education
Percentage ever tested1 among women and men age 15-49
Women Men Education2 Total Education2 Total
No education Primary
Secon-dary+ % n
No education Primary
Secon-dary+ % n
Benin DHS 2006 8.8 22.0 30.9 15.1 17,794 3.8 8.0 18.4 10.4 4,615 Burkina Faso DHS 2010 22.4 38.4 56.4 28.8 17,087 10.0 22.0 48.4 20.3 6,500 Burundi DHS 2010 34.1 38.7 45.6 37.4 9,389 25.7 32.2 39.1 31.9 3,760 Cameroon DHS 2011 18.8 51.5 65.0 50.9 7,457 7.7 28.4 50.3 39.7 6,455 Chad DHS 2004 0.5 1.3 8.6 1.1 6,085 0.3 2.5 12.5 3.7 1,682 Congo (Brazzaville) AIS 2009 10.9 13.9 27.2 22.5 6,550 8.2 8.0 20.2 17.7 5,863 Cote d’Ivoire AIS 2005 5.9 12.7 22.4 10.9 5,183 3.0 6.1 13.1 7.9 4,503 D.R. Congo DHS 2007 2.1 4.2 16.0 8.6 9,995 4.1 1.6 13.0 9.2 4,316 Ethiopia DHS 2011 24.1 41.5 69.5 35.8 16,515 25.4 36.5 61.5 37.6 12,834 Ghana DHS 2008 10.6 12.0 21.0 16.9 4,916 5.9 6.1 15.0 12.4 4,058 Guinea DHS 2005 0.7 4.0 9.9 2.1 7,954 2.8 3.5 11.9 6.0 2,709 Kenya DHS 2008-09 38.3 55.0 63.8 56.5 8,444 19.3 31.4 52.4 40.4 3,258 Lesotho DHS 2009 57.7 63.9 67.3 65.6 7,624 35.2 31.6 44.7 37.2 3,008 Liberia DHS 2007 0.9 2.7 7.8 3.2 7,092 0.7 1.8 8.4 4.9 6,009 Madagascar DHS 2008-09 3.2 9.5 22.8 12.5 8,547 1.3 3.3 17.2 7.7 7,645 Malawi DHS 2010 68.1 70.2 78.9 71.6 23,020 34.3 45.5 65.9 51.2 6,818 Mali DHS 2006 4.0 12.2 19.8 6.6 14,583 3.1 7.4 14.1 6.4 3,704 Mozambique AIS 2009 24.2 32.3 58.8 33.3 5,674 6.7 11.7 34.8 17.2 4,168 Namibia DHS 2006-07 34.4 44.5 54.8 50.9 9,804 16.2 23.3 38.3 32.0 3,915 Niger DHS 2006 1.0 4.2 9.5 1.9 9,223 1.8 4.2 12.1 3.9 3,101 Nigeria DHS 2008 2.1 11.0 26.2 14.6 33,385 1.4 9.7 19.3 14.0 13,808 Rwanda DHS 2010 78.4 74.2 78.5 75.5 13,671 74.2 67.1 74.1 69.3 5,687 Senegal DHS 2010-11 21.9 32.0 39.4 27.7 15,688 9.0 14.4 26.3 16.5 4,417 Sierra Leone DHS 2008 4.7 10.2 23.7 9.4 7,374 1.9 3.6 14.9 7.0 2,944 Swaziland DHS 2006-07 29.4 32.2 38.7 35.8 4,987 19.1 10.4 20.9 17.1 4,156 Tanzania DHS 2010 48.4 56.9 57.3 55.3 10,139 24.4 39.1 48.4 39.8 2,527 Uganda AIS 2011 58.8 64.2 72.9 65.8 11,160 32.4 38.1 56.9 44.9 8,735 Zambia DHS 2007 26.6 32.0 42.9 35.3 7,146 13.7 14.5 25.4 19.8 5,995 Zimbabwe DHS 2010-11 43.2 51.6 60.2 57.4 9,171 13.3 24.0 39.3 35.9 7,110
See Appendix table A.3 for complete ns. 1 'Tested' means tested and received results of the last test. 2 Highest level of schooling attended.
20
Figure 3.3 Uptake of HIV testing among women by education
0 10 20 30 40 50 60 70 80
Malawi DHS 2010
Rwanda DHS 2010
Uganda AIS 2011
Ethiopia DHS 2011
Lesotho DHS 2009
Cameroon DHS 2011
Kenya DHS 2008-09
Zimbabwe DHS 2010-11
Mozambique AIS 2009
Tanzania DHS 2010
Burkina Faso DHS 2010
Namibia DHS 2006-07
Burundi DHS 2010
Zambia DHS 2007
Senegal DHS 2010-11
Swaziland DHS 2006-07
Benin DHS 2006
Congo (Brazzaville) AIS 2009
Nigeria DHS 2008
Sierra Leone DHS 2008
Madagascar DHS 2008-09
Cote d’Ivoire AIS 2005
Ghana DHS 2008
Mali DHS 2006
D.R. Congo DHS 2007
Guinea DHS 2005
Niger DHS 2006
Chad DHS 2004
Liberia DHS 2007
Percent ever tested1 for HIV
No educationPrimarySecondary +
1 Percentage of women ages 15-49 who were ever tested for HIV and received results of most recent test.
21
Figure 3.4 Uptake of HIV testing among men by education
0 10 20 30 40 50 60 70 80
Malawi DHS 2010
Rwanda DHS 2010
Uganda AIS 2011
Ethiopia DHS 2011
Lesotho DHS 2009
Cameroon DHS 2011
Kenya DHS 2008-09
Zimbabwe DHS 2010-11
Mozambique AIS 2009
Tanzania DHS 2010
Burkina Faso DHS 2010
Namibia DHS 2006-07
Burundi DHS 2010
Zambia DHS 2007
Senegal DHS 2010-11
Swaziland DHS 2006-07
Benin DHS 2006
Congo (Brazzaville) AIS 2009
Nigeria DHS 2008
Sierra Leone DHS 2008
Madagascar DHS 2008-09
Cote d’Ivoire AIS 2005
Ghana DHS 2008
Mali DHS 2006
D.R. Congo DHS 2007
Guinea DHS 2005
Niger DHS 2006
Chad DHS 2004
Liberia DHS 2007
Percent ever tested1 for HIV
No educationPrimarySecondary +
1 Percentage of men ages 15-49 who were ever tested for HIV and received results of most recent test.

22
Table 3.9 Uptake of HIV testing in the past 12 months by sex and education
Percentage tested1 in the past 12 months among women and men age 15-49
Women Men
Education2 Total Education2 Total
No education Primary
Secon-dary+ % n
No education Primary
Secon-dary+ % n
Benin DHS 2006 3.7 8.9 14.5 6.5 17,794 1.3 3.3 9.3 4.8 4,615 Burkina Faso DHS 2010 8.0 15.1 25.9 11.2 17,087 3.1 9.5 22.9 8.4 6,500 Burundi DHS 2010 16.0 20.0 24.0 18.7 9,389 7.7 11.6 17.0 11.7 3,760 Cameroon DHS 2011 4.9 21.2 31.0 22.3 7,457 2.3 13.3 26.8 20.4 6,455 Chad DHS 2004 0.2 0.6 4.0 0.5 6,085 0.1 1.1 6.0 1.7 1,682 Congo (Brazzaville) AIS 2009 3.8 5.4 10.2 8.5 6,550 2.4 3.8 7.9 7.1 5,863 Cote d’Ivoire AIS 2005 1.6 4.8 8.1 3.7 5,183 1.2 2.2 5.5 3.2 4,503 D.R. Congo DHS 2007 1.0 1.9 7.7 4.1 9,995 3.0 0.8 5.3 3.8 4,316 Ethiopia DHS 2011 12.9 23.7 39.8 20.0 16,515 13.1 19.7 36.5 20.7 12,834 Ghana DHS 2008 3.7 4.7 8.6 6.8 4,916 1.3 2.3 5.0 4.1 4,058 Guinea DHS 2005 0.3 2.6 5.0 1.1 7,954 1.5 2.1 5.3 2.9 2,709 Kenya DHS 2008-09 19.5 27.4 35.1 29.3 8,444 13.1 18.9 28.1 22.8 3,258 Lesotho DHS 2009 34.9 40.7 43.4 42.0 7,624 20.5 20.8 28.8 24.0 3,008 Liberia DHS 2007 0.3 1.7 3.9 1.6 7,092 0.4 0.9 3.9 2.3 6,009 Madagascar DHS 2008-09 1.1 2.8 8.2 4.2 8,547 0.5 1.4 8.4 3.6 7,645 Malawi DHS 2010 3 3 3 3 3 19.2 27.5 41.4 31.3 6,818 Mali DHS 2006 1.8 5.4 10.4 3.1 14,583 1.3 2.6 6.5 2.7 3,704 Mozambique AIS 2009 11.7 16.8 29.9 17.0 5,674 3.4 5.4 19.6 8.9 4,168 Namibia DHS 2006-07 18.9 23.8 31.2 28.6 9,804 10.3 11.9 21.2 17.6 3,915 Niger DHS 2006 0.5 2.1 4.0 0.9 9,223 0.7 1.8 5.6 1.6 3,101 Nigeria DHS 2008 1.0 4.3 12.0 6.6 33,385 0.6 4.3 9.1 6.5 13,808 Rwanda DHS 2010 35.6 38.0 44.3 38.6 13,671 38.1 36.5 41.2 37.7 5,687 Senegal DHS 2010-11 10.5 15.6 20.5 13.6 15,688 3.9 7.5 15.6 9.0 4,417 Sierra Leone DHS 2008 1.9 4.4 10.8 4.1 7,374 1.4 1.7 6.7 3.4 2,944 Swaziland DHS 2006-07 19.0 20.3 23.2 21.9 4,987 11.4 6.2 10.2 8.9 4,156 Tanzania DHS 2010 23.9 29.8 34.9 29.5 10,139 11.7 24.8 31.0 25.0 2,527 Uganda AIS 2011 3 3 3 3 3 14.0 19.2 30.5 23.2 8,735 Zambia DHS 2007 14.1 16.1 23.5 18.5 7,146 7.3 8.6 15.0 11.7 5,995 Zimbabwe DHS 2010-11 27.1 31.1 34.9 33.6 9,171 7.0 13.1 22.6 20.5 7,110
Note: See Appendix table A.3 for complete ns. 1 'Tested' means tested and received results of the last test. 2 Highest level of schooling attended. 3 Due to a problem with the questionnaires for the Malawi 2010 DHS and Uganda 2011 AIS, data on time since last HIV test are not available for some women. Therefore these estimates are omitted.
Disparities in uptake by education may be caused by a number of factors, such as differences in
awareness of the importance of testing, access to testing sites, and riskier sexual behaviors. People with more education may have better access to health services overall, and particularly more uptake of ANC services among women with more education. As with other covariates, inequities in testing uptake by education are largest in countries where overall uptake is low, suggesting that in countries where client-initiated VCT remains the predominant model, individuals with greater education have more access and perhaps a greater propensity to seek out VCT services. On the other hand, in countries where opportunities to be tested are more widespread or are integrated into routine healthcare, there are fewer relative disparities in testing uptake by education.
3.5 HIV testing uptake by wealth
Tables 3.10 and 3.11, respectively, show the percentage of women and men who have ever been tested for HIV and the percentage tested in the past 12 months by wealth quintile. The uptake of HIV testing tends to increase monotonically with wealth. But there are exceptions, particularly in countries with the highest and lowest overall testing uptake. For example, in Rwanda 2010 and Malawi 2010, two
23
of the countries with highest overall uptake of HIV testing, relatively equal proportions of men and women in each wealth quintile report ever testing and recent testing. Nonetheless, in every country surveyed, men and women in the fourth and the highest wealth quintiles are more likely to have ever been tested for HIV and tested in the past 12 months compared with those in the lowest quintile.
Unlike age and education, which are measured at the individual level, wealth is measured at the household level. For this reason we might expect more similarity in patterns among men and women. Yet in some countries, inequalities in testing uptake by wealth differ widely among women and men. In Zimbabwe 2010 and Lesotho 2009 testing uptake is generally equitable for women but not for men: men in the highest wealth quintile are at least 50 percent more likely to report being tested (both ever and in the past 12 months) than those in the lowest quintile. In contrast, among women in these two countries the disparity is much less. Women in the highest quintile are between 4 and 18 percent more likely to have been tested (ever and in past 12 months) than women in the lowest wealth quintile. This pattern could indicate that men and women access HIV testing in different ways. Chiefly, provider-initiated testing during ANC is a major source of testing that may reach women more evenly across socioeconomic groups than other testing options.
In countries where uptake of HIV testing is very low overall, proportional disparities in testing by wealth quintile tend to be larger. In Chad 2004, Niger 2006, and Guinea 2005, for example, the proportions ever tested and tested in the past 12 months are at least four times higher among men and women in the highest wealth quintile than in the lowest, a result that—as with disparities by education—may indicate self-selection or greater inequities in access to healthcare.

24
Tabl
e 3.
10 U
ptak
e of
HIV
test
ing
by s
ex a
nd w
ealth
qui
ntile
Per
cent
age
ever
test
ed1 a
mon
g w
omen
and
men
age
15-
49
Wom
en
Men
Wea
lth q
uint
ile
Tota
l W
ealth
qui
ntile
To
tal
Low
est
Sec
ond
Mid
dle
Four
th
Hig
hest
%
n
Low
est
Sec
ond
Mid
dle
Four
th
Hig
hest
%
n
Ben
in D
HS
200
6 4.
9 6.
6 9.
1 17
.0
32.0
15
.1
17,7
94
2.6
5.2
7.2
11.9
20
.1
10.4
4,
615
Bur
kina
Fas
o D
HS
2010
13
.4
18.9
20
.5
29.3
53
.2
28.8
17
,087
6.
4 7.
8 10
.3
20.9
43
.1
20.3
6,
500
Bur
undi
DH
S 20
10
30.1
32
.5
34.6
37
.7
52.2
37
.4
9,38
9 27
.3
26.5
26
.5
28.1
45
.5
31.9
3,
760
Cam
eroo
n D
HS
201
1 15
.4
41.4
51
.5
65.1
68
.3
50.9
7,
457
10.1
27
.2
37.9
47
.1
58.4
39
.7
6,45
5 C
had
DH
S 20
04
0.2
0.0
0.1
0.6
4.9
1.1
6,08
5 0.
0 0.
6 1.
2 1.
3 11
.3
3.7
1,68
2 C
ongo
(Bra
zzav
ille)
AIS
200
9 11
.4
17.4
23
.4
26.7
35
.1
22.5
6,
550
8.6
14.1
17
.7
20.3
27
.2
17.7
5,
863
Cot
e d’
Ivoi
re A
IS 2
005
2.4
2.9
10.3
15
.0
19.7
10
.9
5,18
3 2.
5 3.
3 5.
7 9.
0 16
.4
7.9
4,50
3 D
.R. C
ongo
DH
S 20
07
1.4
2.8
4.1
9.8
22.3
8.
6 9,
995
2.3
2.1
5.0
12.5
22
.1
9.2
4,31
6 E
thio
pia
DH
S 2
011
18.2
23
.4
28.3
37
.1
61.3
35
.8
16,5
15
22.2
28
.6
32.9
38
57
.7
37.6
12
,834
G
hana
DH
S 20
08
10.2
10
.7
14.6
19
.3
26.3
16
.9
4,91
6 6.
5 7.
8 8.
8 13
.7
22.0
12
.4
4,05
8 G
uine
a D
HS
2005
0.
2 0.
5 0.
8 2.
8 5.
9 2.
1 7,
954
2.3
1.7
3.5
6.0
11.9
6.
0 2,
709
Ken
ya D
HS
2008
-09
44.5
51
.1
53.3
55
.8
70.6
56
.5
8,44
4 22
.0
34.1
35
.3
41.1
56
.0
40.4
3,
258
Leso
tho
DH
S 20
09
57.3
66
.0
66.1
67
.6
67.5
65
.6
7,62
4 30
.9
32.3
33
.9
39.2
46
.8
37.2
3,
008
Libe
ria D
HS
2007
0.
7 1.
4 2.
7 4.
6 5.
7 3.
2 7,
092
1.5
1.3
3.4
7.1
9.6
4.9
6,00
9 M
adag
asca
r DH
S 2
008-
09
3.4
4.3
8.4
14
27
12.5
8,
547
1.3
1.9
3.8
7.1
20.6
7.
7 7,
645
Mal
awi D
HS
201
0 68
.0
69.8
71
.6
73.0
74
.9
71.6
23
,020
44
.6
47.1
49
.0
55.5
56
.3
51.2
6,
818
Mal
i DH
S 20
06
1.9
1.9
2.2
7.0
17.2
6.
6 14
,583
3.
3 4.
2 4.
1 4.
4 12
.7
6.4
3,70
4 M
ozam
biqu
e AI
S 20
09
14.7
21
.0
30.7
39
.9
55.5
33
.3
5,67
4 5.
3 9.
6 11
.1
18.4
35
.0
17.2
4,
168
Nam
ibia
DH
S 20
06-0
7 38
.5
42.3
47
.2
57.6
62
.0
50.9
9,
804
13.1
16
.2
28.8
38
.7
50.2
32
.0
3,91
5 N
iger
DH
S 20
06
0.3
0.1
0.5
0.8
6.9
1.9
9,22
3 1.
5 1.
7 1.
2 1.
9 9.
7 3.
9 3,
101
Nig
eria
DH
S 2
008
1.5
4.4
10.3
18
.2
33.8
14
.6
33,3
85
2.5
6.3
10.2
15
.3
28.4
14
.0
13,8
08
Rw
anda
DH
S 2
010
74.8
73
.8
73.3
76
.5
78.9
75
.5
13,6
71
65.2
66
.6
69.5
69
.5
73.1
69
.3
5,68
7 S
eneg
al D
HS
2010
-11
13.1
22
.8
27.5
31
.3
38.2
27
.7
15,6
88
10.6
13
.4
17.0
15
.1
22.7
16
.5
4,41
7 S
ierr
a Le
one
DH
S 2
008
2.3
5.3
3.8
8.9
23.6
9.
4 7,
374
1.2
2.6
4.5
6.1
17.0
7.
0 2,
944
Sw
azila
nd D
HS
200
6-07
30
.8
33.6
33
.5
36.6
41
.7
35.8
4,
987
8.5
13.5
13
.4
17.6
26
.4
17.1
4,
156
Tanz
ania
DH
S 2
010
45.8
50
.4
53.3
58
.9
64.5
55
.3
10,1
39
28.1
35
.1
37.4
40
.5
52.3
39
.8
2,52
7 U
gand
a AI
S 20
11
62.8
61
.2
59.7
65
.5
75.5
65
.8
11,1
60
40.6
38
.1
40.4
42
.6
57.8
44
.9
8,73
5 Za
mbi
a D
HS
2007
23
.4
25.8
31
.2
44.0
45
.8
35.3
7,
146
15.0
14
.3
19.9
21
.1
25.2
19
.8
5,99
5 Zi
mba
bwe
DH
S 2
010-
11
51.9
55
.1
59.1
61
.7
57.7
57
.4
9,17
1 27
.6
27.7
32
.7
38.0
46
.9
35.9
7,
110
Not
e: S
ee A
ppen
dix
tabl
e A.
4 fo
r com
plet
e ns
. 1 'T
este
d' m
eans
test
ed a
nd re
ceiv
ed re
sults
of t
he la
st te
st.
24
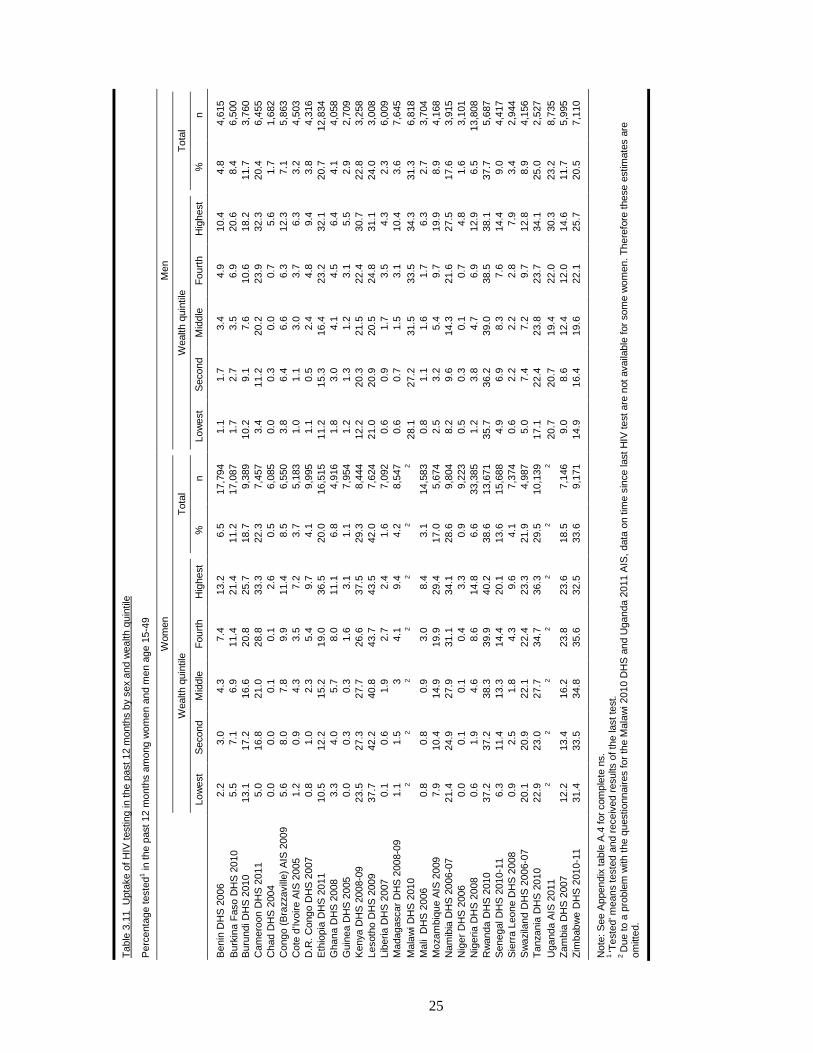
25
Tabl
e 3.
11 U
ptak
e of
HIV
test
ing
in th
e pa
st 1
2 m
onth
s by
sex
and
wea
lth q
uint
ile
Per
cent
age
test
ed1 in
the
past
12
mon
ths
amon
g w
omen
and
men
age
15-
49
Wom
en
Men
Wea
lth q
uint
ile
Tota
l W
ealth
qui
ntile
To
tal
Low
est
Sec
ond
Mid
dle
Four
th
Hig
hest
%
n
Low
est
Sec
ond
Mid
dle
Four
th
Hig
hest
%
n
Ben
in D
HS
200
6 2.
2 3.
0 4.
3 7.
4 13
.2
6.5
17,7
94
1.1
1.7
3.4
4.9
10.4
4.
8 4,
615
Bur
kina
Fas
o D
HS
2010
5.
5 7.
1 6.
9 11
.4
21.4
11
.2
17,0
87
1.7
2.7
3.5
6.9
20.6
8.
4 6,
500
Bur
undi
DH
S 20
10
13.1
17
.2
16.6
20
.8
25.7
18
.7
9,38
9 10
.2
9.1
7.6
10.6
18
.2
11.7
3,
760
Cam
eroo
n D
HS
201
1 5.
0 16
.8
21.0
28
.8
33.3
22
.3
7,45
7 3.
4 11
.2
20.2
23
.9
32.3
20
.4
6,45
5 C
had
DH
S 20
04
0.0
0.0
0.1
0.1
2.6
0.5
6,08
5 0.
0 0.
3 0.
0 0.
7 5.
6 1.
7 1,
682
Con
go (B
razz
avill
e) A
IS 2
009
5.6
8.0
7.8
9.9
11.4
8.
5 6,
550
3.8
6.4
6.6
6.3
12.3
7.
1 5,
863
Cot
e d’
Ivoi
re A
IS 2
005
1.2
0.9
4.3
3.5
7.2
3.7
5,18
3 1.
0 1.
1 3.
0 3.
7 6.
3 3.
2 4,
503
D.R
. Con
go D
HS
2007
0.
8 1.
0 2.
3 5.
4 9.
7 4.
1 9,
995
1.1
0.5
2.4
4.8
9.4
3.8
4,31
6 E
thio
pia
DH
S 2
011
10.5
12
.2
15.2
19
.0
36.5
20
.0
16,5
15
11.2
15
.3
16.4
23
.2
32.1
20
.7
12,8
34
Gha
na D
HS
2008
3.
3 4.
0 5.
7 8.
0 11
.1
6.8
4,91
6 1.
8 3.
0 4.
1 4.
5 6.
4 4.
1 4,
058
Gui
nea
DH
S 20
05
0.0
0.3
0.3
1.6
3.1
1.1
7,95
4 1.
2 1.
3 1.
2 3.
1 5.
5 2.
9 2,
709
Ken
ya D
HS
2008
-09
23.5
27
.3
27.7
26
.6
37.5
29
.3
8,44
4 12
.2
20.3
21
.5
22.4
30
.7
22.8
3,
258
Leso
tho
DH
S 20
09
37.7
42
.2
40.8
43
.7
43.5
42
.0
7,62
4 21
.0
20.9
20
.5
24.8
31
.1
24.0
3,
008
Libe
ria D
HS
2007
0.
1 0.
6 1.
9 2.
7 2.
4 1.
6 7,
092
0.6
0.9
1.7
3.5
4.3
2.3
6,00
9 M
adag
asca
r DH
S 2
008-
09
1.1
1.5
3 4.
1 9.
4 4.
2 8,
547
0.6
0.7
1.5
3.1
10.4
3.
6 7,
645
Mal
awi D
HS
201
0 2
2 2
2 2
2 2
28.1
27
.2
31.5
33
.5
34.3
31
.3
6,81
8 M
ali
DH
S 2
006
0.8
0.8
0.9
3.0
8.4
3.1
14,5
83
0.8
1.1
1.6
1.7
6.3
2.7
3,70
4 M
ozam
biqu
e AI
S 20
09
7.9
10.4
14
.9
19.9
29
.4
17.0
5,
674
2.5
3.2
5.4
9.7
19.9
8.
9 4,
168
Nam
ibia
DH
S 20
06-0
7 21
.4
24.9
27
.9
31.1
34
.1
28.6
9,
804
8.2
9.6
14.3
21
.6
27.5
17
.6
3,91
5 N
iger
DH
S 20
06
0.0
0.1
0.1
0.4
3.3
0.9
9,22
3 0.
5 0.
3 0.
1 0.
7 4.
8 1.
6 3,
101
Nig
eria
DH
S 2
008
0.6
1.9
4.6
8.6
14.8
6.
6 33
,385
1.
2 3.
8 4.
7 6.
9 12
.9
6.5
13,8
08
Rw
anda
DH
S 2
010
37.2
37
.2
38.3
39
.9
40.2
38
.6
13,6
71
35.7
36
.2
39.0
38
.5
38.1
37
.7
5,68
7 S
eneg
al D
HS
2010
-11
6.3
11.4
13
.3
14.4
20
.1
13.6
15
,688
4.
9 6.
9 8.
3 7.
6 14
.4
9.0
4,41
7 S
ierr
a Le
one
DH
S 2
008
0.9
2.5
1.8
4.3
9.6
4.1
7,37
4 0.
6 2.
2 2.
2 2.
8 7.
9 3.
4 2,
944
Sw
azila
nd D
HS
200
6-07
20
.1
20.9
22
.1
22.4
23
.3
21.9
4,
987
5.0
7.4
7.2
9.7
12.8
8.
9 4,
156
Tanz
ania
DH
S 2
010
22.9
23
.0
27.7
34
.7
36.3
29
.5
10,1
39
17.1
22
.4
23.8
23
.7
34.1
25
.0
2,52
7 U
gand
a AI
S 20
11
2 2
2 2
2 2
2 20
.7
20.7
19
.4
22.0
30
.3
23.2
8,
735
Zam
bia
DH
S 20
07
12.2
13
.4
16.2
23
.8
23.6
18
.5
7,14
6 9.
0 8.
6 12
.4
12.0
14
.6
11.7
5,
995
Zim
babw
e D
HS
201
0-11
31
.4
33.5
34
.8
35.6
32
.5
33.6
9,
171
14.9
16
.4
19.6
22
.1
25.7
20
.5
7,11
0
Not
e: S
ee A
ppen
dix
tabl
e A.
4 fo
r com
plet
e ns
. 1 'T
este
d' m
eans
test
ed a
nd re
ceiv
ed re
sults
of t
he la
st te
st.
2 D
ue to
a p
robl
em w
ith th
e qu
estio
nnai
res
for t
he M
alaw
i 201
0 D
HS
and
Uga
nda
2011
AIS
, dat
a on
tim
e si
nce
last
HIV
test
are
not
ava
ilabl
e fo
r som
e w
omen
. The
refo
re th
ese
estim
ates
are
om
itted
.
25

26
3.6 HIV testing uptake by marital status
Tables 3.12 and 3.13, respectively, present the percentage of women and men who have ever been tested and the percentage tested in the past 12 months by current marital status. Patterns of testing by marital status are not as consistent as those found for other demographic characteristics. In the majority of countries surveyed, never-married women and men report lower uptake of HIV testing (ever and in past 12 months) than currently and formerly married women and men. Never-married respondents include those who report that they have never had sex, and also tend to be the youngest, so lower uptake of HIV testing is to be expected.
In more than half of the countries surveyed, higher percentages of formerly married women and men report ever having been tested than currently married or never-married women and men. Similarly, in many countries (14 of 29 for men and 12 of 29 for women) among respondents testing in the past 12 months, formerly married men and women report higher uptake than married men and women. These patterns are likely related to the fact that HIV prevalence tends to be highest among formerly married people, who on average are somewhat older than currently married or never-married people.
Table 3.12 Uptake of HIV testing by sex and marital status
Percentage ever tested1 among women and men age 15-49
Women Men Marital Status Total Marital Status Total
Never married
Currently married
Formerly married % n
Never married
Currently married
Formerly married % n
Benin DHS 2006 12.2 15.7 17.7 15.1 17,794 8.6 11.4 17.3 10.4 4,615 Burkina Faso DHS 2010 19.4 30.6 38.0 28.8 17,087 17.0 22.3 22.8 20.3 6,500 Burundi DHS 2010 17.9 48.4 39.7 37.4 9,389 20.5 41.3 18.1 31.9 3,760 Cameroon DHS 2011 39.0 54.5 63.3 50.9 7,457 29.1 50.6 47.6 39.7 6,455 Chad DHS 2004 0.8 1.1 2.0 1.1 6,085 3.3 3.6 8.9 3.7 1,682 Congo (Brazzaville) AIS 2009 16.1 23.7 30.1 22.5 6,550 9.8 23.3 21.0 17.7 5,863 Cote d’Ivoire AIS 2005 6.6 12.5 16.2 10.9 5,183 6.1 9.2 13.2 7.9 4,503 D.R. Congo DHS 2007 7.0 9.0 9.9 8.6 9,995 7.1 11.2 4.9 9.2 4,316 Ethiopia DHS 2011 36.1 34.7 40.9 35.8 16,515 34.2 39.7 50.5 37.6 12,834 Ghana DHS 2008 7.8 21.9 17.8 16.9 4,916 8.1 16.7 12.4 12.4 4,058 Guinea DHS 2005 3.0 1.8 4.6 2.1 7,954 4.5 6.5 14.3 6.0 2,709 Kenya DHS 2008-09 35.8 66.9 60.4 56.5 8,444 32.7 47.9 38.2 40.4 3,258 Lesotho DHS 2009 49.4 75.1 69.7 65.6 7,624 26.9 49.9 54.4 37.2 3,008 Liberia DHS 2007 4.5 2.5 4.5 3.2 7,092 3.6 5.6 6.6 4.9 6,009 Madagascar DHS 2008-09 6.2 14.4 11.2 12.5 8,547 7.5 7.9 6.7 7.7 7,645 Malawi DHS 2010 37.3 80.5 77.9 71.6 23,020 40.1 58.4 58.5 51.2 6,818 Mali DHS 2006 4.8 6.7 9.6 6.6 14,583 3.7 7.6 11.4 6.4 3,704 Mozambique AIS 2009 27.2 33.6 36.7 33.3 5,674 15.6 17.6 21.3 17.2 4,168 Namibia DHS 2006-07 44.1 61.3 55.0 50.9 9,801 24.7 46.2 41.1 32.0 3,914 Niger DHS 2006 3.1 1.6 4.0 1.9 9,223 3.5 4.0 6.7 3.9 3,101 Nigeria DHS 2008 12.6 15.3 15.3 14.6 33,385 11.7 16.1 17.4 14.0 13,808 Rwanda DHS 2010 52.2 92.4 80.2 75.5 13,671 49.2 90.1 81.1 69.3 5,687 Senegal DHS 2010-11 19.2 31.1 32.3 27.7 15,688 14.9 18.5 34.5 16.5 4,417 Sierra Leone DHS 2008 12.9 8.7 8.1 9.4 7,374 4.3 8.7 6.4 7.0 2,944 Swaziland DHS 2006-07 27.8 43.1 47.0 35.8 4,987 10.7 29.8 25.9 17.1 4,156 Tanzania DHS 2010 34.6 62.0 63.6 55.3 10,139 27.8 48.3 48.2 39.8 2,527 Uganda AIS 2011 42.3 73.6 70.4 65.8 11,160 30.5 53.6 49.8 44.9 8,735 Zambia DHS 2007 24.1 39.0 40.5 35.3 7,146 15.5 22.9 24.1 19.8 5,995 Zimbabwe DHS 2010-11 26.4 67.0 68.1 57.4 9,171 21.3 47.9 48.4 35.9 7,110
Note: See Appendix table A.5 for complete ns. 1 'Tested' means tested and received results of the last test.

27
Table 3.13 Uptake of HIV testing in the past 12 months by sex and marital status
Percentage tested1 in the past 12 months among women and men age 15-49
Women Men Marital Status Total Marital Status Total
Never married
Currently married
Formerly married % n
Never married
Currently married
Formerly married % n
Benin DHS 2006 6.6 6.5 5.5 6.5 17,794 5.0 4.6 9.0 4.8 4,615 Burkina Faso DHS 2010 9.9 11.5 10.8 11.2 17,087 8.1 8.6 9.0 8.4 6,500 Burundi DHS 2010 11.3 23.1 17.4 18.7 9,389 10.8 12.5 3.6 11.7 3,760 Cameroon DHS 2011 18.9 23.5 24.8 22.3 7,457 16.4 24.5 23.1 20.4 6,455 Chad DHS 2004 0.3 0.6 0.8 0.5 6,085 1.6 1.8 2.6 1.7 1,682 Congo (Brazzaville) AIS 2009 6.6 8.9 10.4 8.5 6,550 4.2 9.3 6.8 7.1 5,863 Cote d’Ivoire AIS 2005 3.2 3.9 3.9 3.7 5,183 3.3 2.8 5.9 3.2 4,503 D.R. Congo DHS 2007 3.6 4.0 5.4 4.1 9,995 3.8 4.1 1.8 3.8 4,316 Ethiopia DHS 2011 21.2 19.5 19.7 20 16,515 20.8 20.3 26.2 20.7 12,834 Ghana DHS 2008 3.7 8.9 4.3 6.8 4,916 3.7 4.4 5.1 4.1 4,058 Guinea DHS 2005 1.7 0.8 3.9 1.1 7,954 2.1 3.4 3.7 2.9 2,709 Kenya DHS 2008-09 21.9 33.0 30.5 29.3 8,444 20.5 25.7 15.0 22.8 3,258 Lesotho DHS 2009 33.7 46.4 46.2 42.0 7,624 17.6 32.0 33.6 24.0 3,008 Liberia DHS 2007 2.2 1.3 2.2 1.6 7,092 1.4 2.8 3.2 2.3 6,009 Madagascar DHS 2008-09 3 4.6 3.7 4.2 8,547 3.7 3.7 2.3 3.6 7,645 Malawi DHS 2010 2 2 2 2 2 26.9 33.9 39.8 31.3 6,818 Mali DHS 2006 3.0 3.1 3.1 3.1 14,583 1.6 3.2 4.5 2.7 3,704 Mozambique AIS 2009 17.1 17.0 17.3 17.0 5,674 8.4 8.9 13.5 8.9 4,168 Namibia DHS 2006-07 25.4 33.8 28.9 28.6 9,801 14.7 22.8 22.8 17.5 3,914 Niger DHS 2006 1.8 0.7 1.2 0.9 9,223 2.1 1.2 5.6 1.6 3,101 Nigeria DHS 2008 6.7 6.5 5.9 6.6 33,385 5.9 7.0 8.5 6.5 13,808 Rwanda DHS 2010 31.1 44.9 36.3 38.6 13,671 30.4 45.1 46.2 37.7 5,687 Senegal DHS 2010-11 10.3 15.0 15.3 13.6 15,688 8.7 9.1 15.3 9.0 4,417 Sierra Leone DHS 2008 6.3 3.7 2.2 4.1 7,374 1.6 4.6 2.4 3.4 2,944 Swaziland DHS 2006-07 17.0 26.7 27.4 21.9 4,987 5.4 15.9 14.5 8.9 4,156 Tanzania DHS 2010 21.6 32.5 29.8 29.5 10,139 18.5 29.8 28.6 25.0 2,527 Uganda AIS 2011 2 2 2 2 2 16.8 27.4 22.4 23.2 8,735 Zambia DHS 2007 14.0 20.3 19.1 18.5 7,146 10.6 12.5 13.2 11.7 5,995 Zimbabwe DHS 2010-11 16.8 39.9 34.4 33.6 9,171 12.8 26.6 28.9 20.5 7,110
Note: See Appendix table A.5 for complete ns. 1 'Tested' means tested and received results of the last test. 2 Due to a problem with the questionnaires for the Malawi 2010 DHS and Uganda 2011 AIS, data on time since last HIV test are not available for some women. Therefore these estimates are omitted.
3.7 HIV testing uptake by ever had sex
Tables 3.14 and 3.15, respectively, present the percentage of women and men who have ever been tested and the percentage tested in the past 12 months by sexual activity. In general, higher percentages of sexually active respondents report ever testing and testing in the past 12 months than respondents who have never had sex. Even so, notable percentages of women and men who have never had sex also still report having been tested for HIV, even in countries where the risk of nonsexual transmission is low. In five countries—Rwanda, Malawi, Uganda, Lesotho, and Ethiopia—more than one-fifth of women who have never had sex report ever being tested for HIV. In three countries—Rwanda, Malawi, and Ethiopia—the same is true for men.

28
Although some respondents may have misreported their sexual activity, other factors may contribute to HIV testing among people who have never been sexually active. Many national testing day campaigns, for example, focus on the general population regardless of age or sexual activity (Goldberg, Kombe, and Osewe 2008). In Ethiopia and Rwanda, the Multi-Sectoral AIDS Program has mobilized youth groups to encourage testing among their members, including a voucher program for young people to receive expedited testing on certain days (Görgens-Albino et al. 2007). These campaigns tend to not distinguish between sexually active and inactive individuals, likely because of the stigma associated with premarital sex. Additionally, some of the youngest respondents may have been tested as children to screen for mother-to-child transmission of HIV.
Table 3.14 Uptake of HIV testing by sex and sexual activity
Percentage ever tested1 among women and men age 15-49
Women Men
Never had sex
Ever had sex
Total2 Never had sex
Ever had sex
Total2 % n % n
Benin DHS 2006 4.6 16.2 15.1 17,794 4.1 11.6 10.4 4,615 Burkina Faso DHS 2010 8.7 31.7 28.8 17,087 8.3 23.7 20.3 6,500 Burundi DHS 2010 13.6 47.3 37.4 9,389 15.3 40.0 31.9 3,760 Cameroon DHS 2011 16.6 56.3 50.9 7,457 10.5 46.8 39.7 6,455 Chad DHS 2004 0.4 1.3 1.1 6,085 0.5 4.6 3.7 1,682 Congo (Brazzaville) AIS 2009 3.4 23.8 22.5 6,550 3.3 19.0 17.7 5,863 Cote d’Ivoire AIS 2005 1.2 11.9 10.9 5,183 0.5 9.0 7.9 4,503 D.R. Congo DHS 2007 2.4 9.4 8.6 9,995 3.8 10.1 9.2 4,316 Ethiopia DHS 2011 33.1 36.7 35.8 16,515 28.8 42.5 37.6 12,834 Ghana DHS 2008 3.8 19.4 16.9 4,916 3.4 15.2 12.4 4,058 Guinea DHS 2005 1.4 2.2 2.1 7,954 1.1 6.9 6.0 2,709 Kenya DHS 2008-09 18.6 64.2 56.5 8,444 17.3 44.9 40.4 3,258 Lesotho DHS 2009 29.3 71.9 65.6 7,624 15.8 40.6 37.2 3,008 Liberia DHS 2007 0.0 3.4 3.2 7,092 0.7 5.4 4.9 6,009 Madagascar DHS 2008-09 3.9 13.6 12.5 8,547 3.0 8.5 7.7 7,645 Malawi DHS 2010 26.7 78.7 71.6 23,020 26.6 55.4 51.2 6,818 Mali DHS 2006 3.4 7.0 6.6 14,583 1.5 8.0 6.4 3,704 Mozambique AIS 2009 4.3 34.7 33.3 5,674 4.4 18.4 17.2 4,168 Namibia DHS 2006-07 10.6 58.8 50.9 9,804 5.8 36.2 32 3,915 Niger DHS 2006 2.7 1.8 1.9 9,223 1.5 4.8 3.9 3,101 Nigeria DHS 2008 6.0 16.0 14.6 33,385 4.3 17.1 14.0 13,808 Rwanda DHS 2010 44.4 88.9 75.5 13,671 40.1 82.1 69.3 5,687 Senegal DHS 2010-11 15.8 31.8 27.7 15,688 10.7 20.1 16.5 4,417 Sierra Leone DHS 2008 3.0 9.9 9.4 7,374 1.3 7.9 7.0 2,944 Swaziland DHS 2006-07 5.8 42.3 35.8 4,987 3.8 23.0 17.1 4,156 Tanzania DHS 2010 16.5 61.6 55.3 10,139 16.1 45.4 39.8 2,527 Uganda AIS 2011 23.4 72.0 65.8 11,160 19.8 50.4 44.9 8,735 Zambia DHS 2007 10.3 39.2 35.3 7,146 7.3 22.2 19.8 5,995 Zimbabwe DHS 2010-11 15.5 66.7 57.4 9,171 13.8 43.3 35.9 7,110 1 'Tested' means tested and received results of the last test. 2 Total includes a small number of missing cases. See Appendix table A.6 for complete ns.

29
Table 3.15 Uptake of HIV testing in the past 12 months by sex and sexual activity
Percentage tested1 in the past 12 months among women and men age 15-49
Women Men
Never had sex
Ever had sex
Total2 Never had sex
Ever had sex
Total2 % n % n
Benin DHS 2006 2.5 6.9 6.5 17,794 2.4 5.2 4.8 4,615 Burkina Faso DHS 2010 4.5 12.1 11.2 17,087 4.3 9.6 8.4 6,500 Burundi DHS 2010 9.3 22.5 18.7 9,389 7.7 13.6 11.7 3,760 Cameroon DHS 2011 7 24.7 22.3 7,457 4.8 24.2 20.4 6,455 Chad DHS 2004 0.2 0.6 0.5 6,085 0.3 2.1 1.7 1,682 Congo (Brazzaville) AIS 2009 1.7 8.9 8.5 6,550 2.0 7.5 7.1 5,863 Cote d’Ivoire AIS 2005 0.4 4.1 3.7 5,183 0.2 3.6 3.2 4,503 D.R. Congo DHS 2007 1.3 4.4 4.1 9,995 1.5 4.2 3.8 4,316 Ethiopia DHS 2011 19.0 20.3 20.0 16,515 17.6 22.4 20.7 12,834 Ghana DHS 2008 1.9 7.7 6.8 4,916 1.9 4.8 4.1 4,058 Guinea DHS 2005 0.6 1.1 1.1 7,954 0.9 3.2 2.9 2,709 Kenya DHS 2008-09 12.0 32.8 29.3 8,444 9.8 25.3 22.8 3,258 Lesotho DHS 2009 21.3 45.6 42.0 7,624 11.3 26.0 24.0 3,008 Liberia DHS 2007 0.0 1.7 1.6 7,092 0.2 2.6 2.3 6,009 Madagascar DHS 2008-09 1.9 4.5 4.2 8,547 1.4 4.0 3.6 7,645 Malawi DHS 2010 3 3 3 3 18.4 33.5 31.3 6,818 Mali DHS 2006 2.5 3.1 3.1 14,583 0.4 3.4 2.7 3,704 Mozambique AIS 2009 3.4 17.6 17.0 5,674 3.1 9.5 8.9 4,168 Namibia DHS 2006-07 7.0 32.9 28.6 9,804 4.3 19.6 17.6 3,915 Niger DHS 2006 1.6 0.8 0.9 9,223 0.9 1.9 1.6 3,101 Nigeria DHS 2008 3.3 7.1 6.6 33,385 2.3 7.9 6.5 13,808 Rwanda DHS 2010 26.6 43.8 38.6 13,671 25.0 43.3 37.7 5,687 Senegal DHS 2010-11 8.4 15.5 13.6 15,688 6.3 10.6 9.0 4,417 Sierra Leone DHS 2008 1.9 4.3 4.1 7,374 0.2 3.9 3.4 2,944 Swaziland DHS 2006-07 2.9 26.0 21.9 4,987 2.0 12.0 8.9 4,156 Tanzania DHS 2010 10.4 32.5 29.5 10,139 12.3 28.0 25.0 2,527 Uganda AIS 2011 3 3 3 3 10.5 25.9 23.2 8,735 Zambia DHS 2007 6.8 20.3 18.5 7,146 6.0 12.8 11.7 5,995 Zimbabwe DHS 2010-11 9.3 39.0 33.6 9,171 8.3 24.6 20.5 7,110 1 'Tested' means tested and received results of the last test 2 Total includes a small number of missing cases. See Appendix table A.6 for complete ns. 3 Due to a problem with the questionnaires for the Malawi 2010 DHS and Uganda 2011 AIS, data on time since last HIV test are not available for some women. Therefore these estimates are omitted.
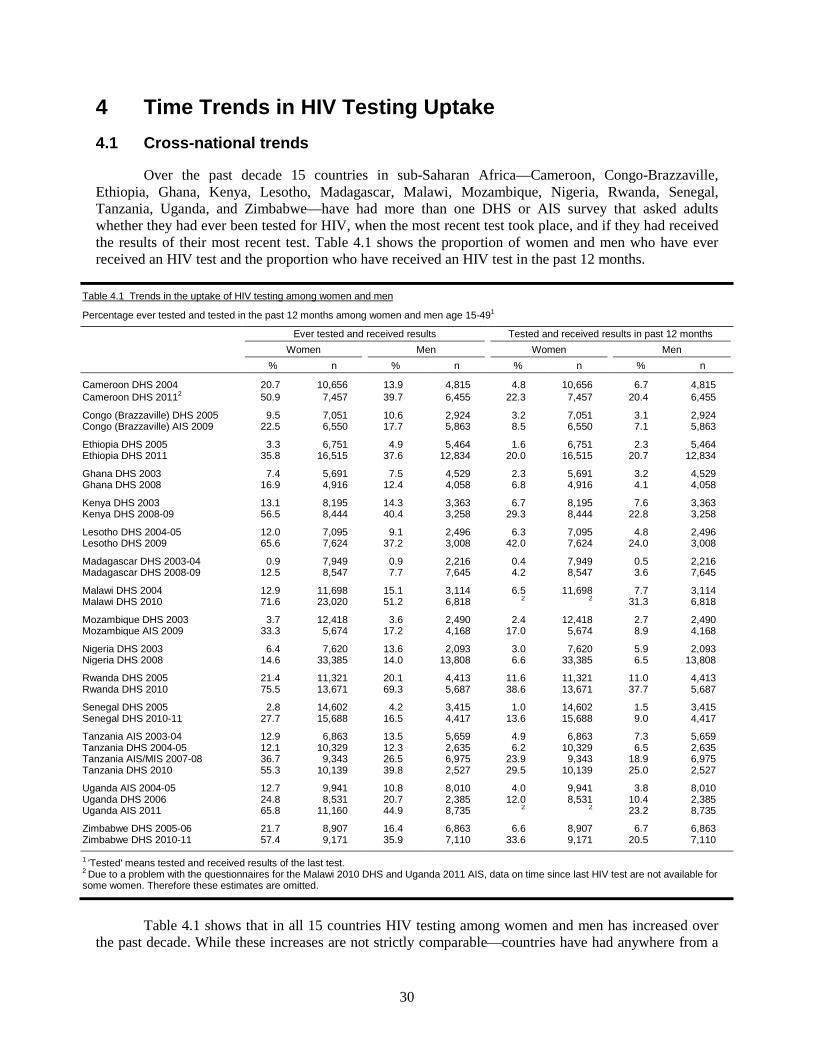
30
4 Time Trends in HIV Testing Uptake 4.1 Cross-national trends
Over the past decade 15 countries in sub-Saharan Africa—Cameroon, Congo-Brazzaville, Ethiopia, Ghana, Kenya, Lesotho, Madagascar, Malawi, Mozambique, Nigeria, Rwanda, Senegal, Tanzania, Uganda, and Zimbabwe—have had more than one DHS or AIS survey that asked adults whether they had ever been tested for HIV, when the most recent test took place, and if they had received the results of their most recent test. Table 4.1 shows the proportion of women and men who have ever received an HIV test and the proportion who have received an HIV test in the past 12 months.
Table 4.1 Trends in the uptake of HIV testing among women and men
Percentage ever tested and tested in the past 12 months among women and men age 15-491
Ever tested and received results Tested and received results in past 12 months Women Men Women Men
% n % n % n % n
Cameroon DHS 2004 20.7 10,656 13.9 4,815 4.8 10,656 6.7 4,815 Cameroon DHS 20112 50.9 7,457 39.7 6,455 22.3 7,457 20.4 6,455
Congo (Brazzaville) DHS 2005 9.5 7,051 10.6 2,924 3.2 7,051 3.1 2,924 Congo (Brazzaville) AIS 2009 22.5 6,550 17.7 5,863 8.5 6,550 7.1 5,863
Ethiopia DHS 2005 3.3 6,751 4.9 5,464 1.6 6,751 2.3 5,464 Ethiopia DHS 2011 35.8 16,515 37.6 12,834 20.0 16,515 20.7 12,834
Ghana DHS 2003 7.4 5,691 7.5 4,529 2.3 5,691 3.2 4,529 Ghana DHS 2008 16.9 4,916 12.4 4,058 6.8 4,916 4.1 4,058
Kenya DHS 2003 13.1 8,195 14.3 3,363 6.7 8,195 7.6 3,363 Kenya DHS 2008-09 56.5 8,444 40.4 3,258 29.3 8,444 22.8 3,258
Lesotho DHS 2004-05 12.0 7,095 9.1 2,496 6.3 7,095 4.8 2,496 Lesotho DHS 2009 65.6 7,624 37.2 3,008 42.0 7,624 24.0 3,008
Madagascar DHS 2003-04 0.9 7,949 0.9 2,216 0.4 7,949 0.5 2,216 Madagascar DHS 2008-09 12.5 8,547 7.7 7,645 4.2 8,547 3.6 7,645
Malawi DHS 2004 12.9 11,698 15.1 3,114 6.5 11,698 7.7 3,114 Malawi DHS 2010 71.6 23,020 51.2 6,818 2 2 31.3 6,818
Mozambique DHS 2003 3.7 12,418 3.6 2,490 2.4 12,418 2.7 2,490 Mozambique AIS 2009 33.3 5,674 17.2 4,168 17.0 5,674 8.9 4,168
Nigeria DHS 2003 6.4 7,620 13.6 2,093 3.0 7,620 5.9 2,093 Nigeria DHS 2008 14.6 33,385 14.0 13,808 6.6 33,385 6.5 13,808
Rwanda DHS 2005 21.4 11,321 20.1 4,413 11.6 11,321 11.0 4,413 Rwanda DHS 2010 75.5 13,671 69.3 5,687 38.6 13,671 37.7 5,687
Senegal DHS 2005 2.8 14,602 4.2 3,415 1.0 14,602 1.5 3,415 Senegal DHS 2010-11 27.7 15,688 16.5 4,417 13.6 15,688 9.0 4,417
Tanzania AIS 2003-04 12.9 6,863 13.5 5,659 4.9 6,863 7.3 5,659 Tanzania DHS 2004-05 12.1 10,329 12.3 2,635 6.2 10,329 6.5 2,635 Tanzania AIS/MIS 2007-08 36.7 9,343 26.5 6,975 23.9 9,343 18.9 6,975 Tanzania DHS 2010 55.3 10,139 39.8 2,527 29.5 10,139 25.0 2,527
Uganda AIS 2004-05 12.7 9,941 10.8 8,010 4.0 9,941 3.8 8,010 Uganda DHS 2006 24.8 8,531 20.7 2,385 12.0 8,531 10.4 2,385 Uganda AIS 2011 65.8 11,160 44.9 8,735 2 2 23.2 8,735
Zimbabwe DHS 2005-06 21.7 8,907 16.4 6,863 6.6 8,907 6.7 6,863 Zimbabwe DHS 2010-11 57.4 9,171 35.9 7,110 33.6 9,171 20.5 7,110 1 'Tested' means tested and received results of the last test. 2 Due to a problem with the questionnaires for the Malawi 2010 DHS and Uganda 2011 AIS, data on time since last HIV test are not available for some women. Therefore these estimates are omitted.
Table 4.1 shows that in all 15 countries HIV testing among women and men has increased over
the past decade. While these increases are not strictly comparable—countries have had anywhere from a

31
four-year to a seven-year gap between the earliest and latest surveys since 2003—the differentials in the uptake of HIV testing across countries range dramatically. Among women, the increase in the proportion ever tested between the earliest and latest surveys ranges from 8 percentage points in Nigeria to 59 percentage points in Uganda and Malawi; among men, the range of increase is from 0.4 percentage points in Nigeria to 49 percentage points in Rwanda.
Regardless of any male-female testing differential in the earliest survey, the most recent survey in 14 of the 15 countries (all except Ethiopia) indicates that women are more likely than men to have ever been tested for HIV. In five countries—Lesotho, Madagascar, Mozambique, Senegal, and Zimbabwe— the most recent survey indicates that women are at least 50 percent more likely than men to have ever been tested.
The proportion of adults who have ever been tested for HIV has an inherent momentum over time; persons who have ever received an HIV test before the first survey remain tested at the time of the next survey. Trends in uptake of HIV testing over the course of the past 12 months, however, can fluctuate more widely from year to year. Nonetheless, within each country the percent recently tested for HIV increased between the earliest and latest surveys among both women and men, as did the percent ever tested.
DHS and AIS surveys do not usually gather data on the number of times adults have been tested for HIV. An exception is the Uganda 2011 AIS, which did ask about the number of times tested. In this survey the majority of respondents who were ever tested (55 percent of women and 70 percent of men) said that they were tested only once or twice.7
In countries where DHS and AIS surveys did not ask adults about the number of times they were tested for HIV, it can be useful to compare the proportion of adults who have been tested for HIV in the past year with the proportion ever tested. If the proportion is high, it could indicate repeat testing or a recent surge in uptake. Looking at the most recent survey in all 15 countries studied, the proportion of women who have ever been tested for HIV who also were tested in the past 12 months ranges from 34 percent in Madagascar 2008-09 to 64 percent in Lesotho 2009; among men it ranges from 33 percent in Ghana 2008 to 65 percent in Lesotho 2009.8 Where recent uptake of HIV testing is high relative to overall uptake may be a barometer of programmatic expansion efforts or reflect a growing desire for and better access to re-testing.
The trends in ever testing among women reported in Table 4.1 are graphed in Figure 4.1. Here the dramatic increase in testing uptake is apparent, particularly among women. For women, the rate of increase in the uptake of HIV testing is lowest in Ghana, Nigeria, and Madagascar, and highest in Lesotho, Malawi, and Rwanda. However, these trends should be interpreted with caution, as the year in which the most recent survey was conducted appears to have a strong relationship to current patterns of testing: the three countries with highest reported uptake of HIV testing among women (Rwanda, Malawi, and Uganda) had surveys in 2010 or after; the three countries with lowest testing uptake (Ghana, Nigeria, Madagascar) are the only three to have had their most recent survey conducted before 2009.
Figure 4.2 shows trends in ever testing among men. Here there has been a steady increase in HIV testing uptake but it is slower than among women. As mentioned above, comparisons across countries are limited by the fact that the date of the last survey seems to influence the overall proportion ever tested, at both higher and lower bounds. Even so, Rwanda is a particularly notable outlier, with 69 percent of men reporting having ever been tested for HIV, compared to 54 percent in the next highest country (Malawi).
7 Among respondents who did not declare that they were HIV-positive (data not shown). 8 Calculations based on Table 4.1.

32
Figu
re 4
.1 T
rend
s in
the
upta
ke o
f HIV
test
ing
amon
g w
omen
in s
ub-S
ahar
an A
fric
a Pe
rcen
tage
of w
omen
age
s 15-
49 w
ho w
ere
ever
test
ed fo
r HIV
and
rece
ived
resu
lts o
f mos
t rec
ent t
est
01020304050607080
2003
2004
2005
2006
2007
2008
2009
2010
2011
2012
Percent ever tested for HIV
Rw
anda
Mal
awi
Mad
agas
car
Sen
egal
Gha
naN
iger
ia
Moz
ambi
que
Con
go (B
razz
avill
e)
Uga
nda
Eth
iopi
a
Zim
babw
e
Tanz
ania
Leso
tho
Ken
ya
Cam
eroo
n
32
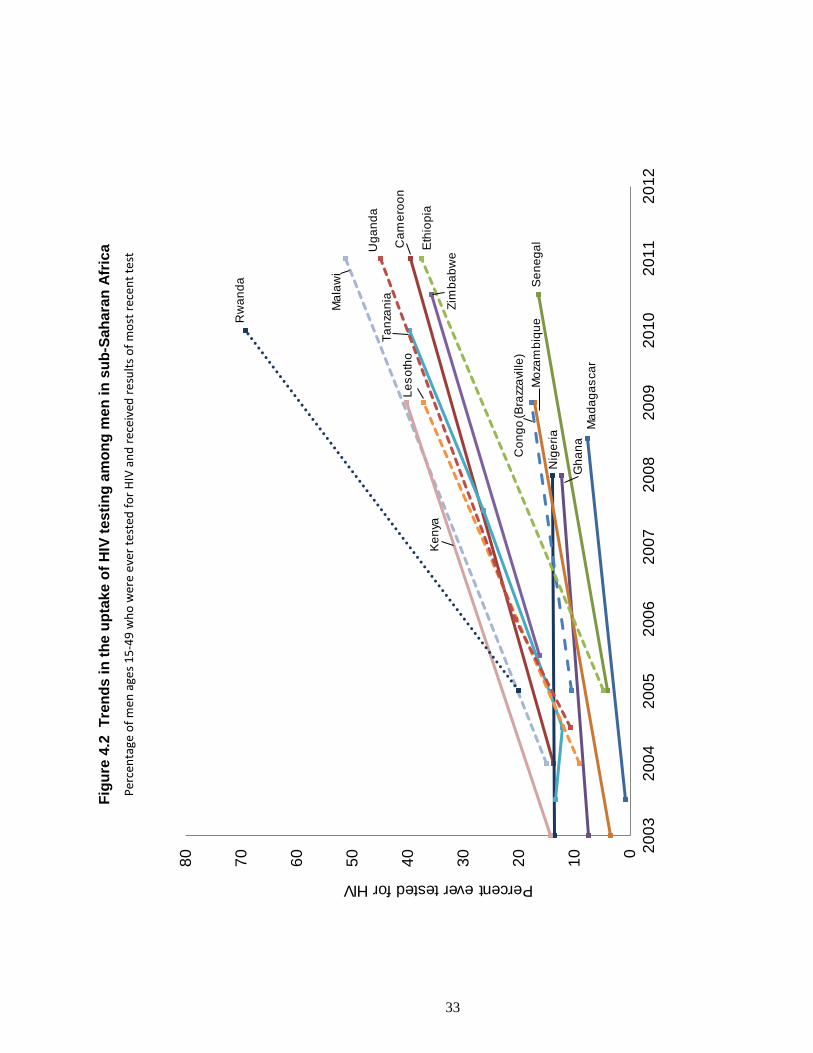
33
Figu
re 4
.2 T
rend
s in
the
upta
ke o
f HIV
test
ing
amon
g m
en in
sub
-Sah
aran
Afr
ica
Perc
enta
ge o
f men
age
s 15-
49 w
ho w
ere
ever
test
ed fo
r HIV
and
rece
ived
resu
lts o
f mos
t rec
ent t
est
01020304050607080
2003
2004
2005
2006
2007
2008
2009
2010
2011
2012
Percent ever tested for HIV
Mad
agas
car
Rw
anda
Mal
awi
Sen
egal
Gha
na
Nig
eria
Moz
ambi
que
Con
go (B
razz
avill
e)
Uga
nda
Eth
iopi
a
Zim
babw
e
Tanz
ania
Leso
tho
Ken
ya
Cam
eroo
n
33

34
4.2 Trends within country by residence
In many African countries HIV testing is less common among men and among rural residents. Reaching these groups has proven to be a particular public health challenge. Comparing increases in HIV testing uptake by sex and by place of residence reveals the extent to which gains in testing uptake have been concentrated or widespread.
Table 4.2 shows the percentage of women and men who have ever been tested for HIV by place of residence across all 15 countries. Among every subgroup (urban women, rural women, urban men, rural men) in all 33 surveys, there are gains in the percentage ever tested between the most recent and earlier surveys, except among rural men in Nigeria, where the proportion ever tested for HIV declined by two percentage points between surveys. Other gains range from five percentage points among urban men in Nigeria to 60 percentage points among rural women in Malawi and Uganda, comparing the earliest surveys with the most recent. In all 33 surveys urban women and men are more likely to have ever been tested for HIV than their rural counterparts.
Table 4.2 Trends in the uptake of HIV testing by sex and place of residence Percentage ever tested1 among women and men age 15-49
Women Men Residence Total Residence Total
Urban Rural % n Urban Rural % n
Cameroon DHS 2004 29.0 10.6 20.7 10,656 18.3 7.7 13.9 4,815 Cameroon DHS 2011 62.3 37.8 50.9 7,457 50.1 26.6 39.7 6,455
Congo (Brazzaville) DHS 2005 13.7 4.1 9.5 7,051 13.8 5.8 10.6 2,924 Congo (Brazzaville) AIS 2009 27.6 14.3 22.5 6,550 21.3 11.4 17.7 5,863
Ethiopia DHS 2005 15.1 0.9 3.3 6,751 17.4 2.6 4.9 5,464 Ethiopia DHS 2011 61.2 27.8 35.8 16,515 56.3 32.1 37.6 12,834
Ghana DHS 2003 9.3 5.5 7.4 5,691 10.9 4.7 7.5 4,529 Ghana DHS 2008 20.4 13.7 16.9 4,916 16.1 9.3 12.4 4,058
Kenya DHS 2003 22.4 10.0 13.1 8,195 22.0 11.7 14.3 3,363 Kenya DHS 2008-09 69.9 52.0 56.5 8,444 54.6 35.3 40.4 3,258
Lesotho DHS 2004-05 16.6 10.6 12.0 7,095 13.5 7.8 9.1 2,496 Lesotho DHS 2009 66.5 65.1 65.6 7,624 45.2 34.1 37.2 3,008
Madagascar DHS 2003-04 2.1 0.6 0.9 7,949 3.2 0.3 0.9 2,216 Madagascar DHS 2008-09 28.3 9.1 12.5 8,547 22.2 4.9 7.7 7,645
Malawi DHS 2004 22.9 10.7 12.9 11,698 25.1 12.4 15.1 3,114 Malawi DHS 2010 75.6 70.7 71.6 23,020 54.6 50.3 51.2 6,818
Mozambique DHS 2003 8.4 0.9 3.7 12,418 7.3 0.7 3.6 2,490 Mozambique AIS 2009 49.3 25.8 33.3 5,674 27.7 11.5 17.2 4,168
Nigeria DHS 2003 11.8 3.6 6.4 7,620 16.3 11.9 13.6 2,093 Nigeria DHS 2008 24.7 9.0 14.6 33,385 20.9 9.9 14.0 13,808
Rwanda DHS 2005 43.5 16.9 21.4 11,321 34.8 16.9 20.1 4,413 Rwanda DHS 2010 79.4 74.9 75.5 13,671 73.1 68.5 69.3 5,687
Senegal DHS 2005 4.4 1.2 2.8 14,602 5.1 2.9 4.2 3,415 Senegal DHS 2010-11 35.1 20.4 27.7 15,688 19.6 12.5 16.5 4,417
Tanzania AIS 2003-04 24.8 7.6 12.9 6,863 20.3 10.5 13.5 5,659 Tanzania DHS 2004-05 24.7 7.1 12.1 10,329 19.1 9.7 12.3 2,635 Tanzania AIS/MIS 2007-08 51.3 31.6 36.7 9,343 34.8 23.8 26.5 6,975 Tanzania DHS 2010 66.4 50.9 55.3 10,139 45.3 37.8 39.8 2,527
Uganda AIS 2004-05 31.0 9.4 12.7 9,941 24.3 8.4 10.8 8,010 Uganda DHS 2006 40.7 21.6 24.8 8,531 34.0 18.0 20.7 2,385 Uganda AIS 2011 76.3 62.9 65.8 11,160 58.6 41.5 44.9 8,735
Zimbabwe DHS 2005-06 28.5 17.4 21.7 8,907 23.9 11.3 16.4 6,863 Zimbabwe DHS 2010-11 59.4 56.2 57.4 9,171 41.3 32.7 35.9 7,110
1 'Tested' means tested and received results of the last test.
In the most recent survey from each country, urban women are the most likely group to have ever been tested for HIV, and—with the exception of Ethiopia and Nigeria—rural men are the least likely

35
group to have been tested. The size of the disparity between these two groups, and to what extent it reflects divergence by sex, residence, or both, is the subject of Figure 4.3. The figure shows trends in HIV testing uptake within each country by sex and residence for all 15 countries. Countries have been grouped into four broad categories: (A) countries characterized by higher uptake among urban residents, regardless of sex; (B) countries characterized by higher uptake among women, regardless of residence; (C) countries characterized by divergence in testing uptake between urban women and all other groups; (D) countries characterized by narrow differentials in testing uptake by sex and residence.
Figure 4.3 Trends in the uptake of HIV testing by country, residence, and sex
1 Percent who have been tested and received the results of the most recent test.
Rural menRural w omen
Urban menUrban w omen
0
10
20
30
40
50
60
70
80
2003
2004
2005
2006
2007
2008
2009
2010
2011
2012
Perc
ent e
ver t
este
d fo
r HIV
Ethiopia
Rural men
Rural w omen
Urban men
Urban w omen
0
10
20
30
40
50
60
70
80
2003
2004
2005
2006
2007
2008
2009
2010
2011
2012
Perc
ent e
ver t
este
d fo
r HIV
Lesotho
Rural men
Rural w omen
Urban men
Urban w omen
0
10
20
30
40
50
60
70
80
2003
2004
2005
2006
2007
2008
2009
2010
2011
2012
Perc
ent e
ver t
este
d fo
r HIV
Malawi
Rural menRural w omen
Urban menUrban w omen
0
10
20
30
40
50
60
70
80
2003
2004
2005
2006
2007
2008
2009
2010
2011
2012
Perc
ent e
ver t
este
d fo
r HIV
Madagascar
Rural menRural w omen
Urban menUrban w omen
0
10
20
30
40
50
60
70
80
2003
2004
2005
2006
2007
2008
2009
2010
2011
2012
Perc
ent e
ver t
este
d fo
r HIV
Nigeria
Rural men
Rural w omen
Urban men
Urban w omen
0
10
20
30
40
50
60
70
80
2003
2004
2005
2006
2007
2008
2009
2010
2011
2012
Perc
ent e
ver t
este
d fo
r HIV
Zimbabwe
Group A: Countries characterized by higher uptake among urban residents, regardless of sex (3)
Group B: Countries characterized by higher uptake among women, regardless of residence (3)

36
Figure 4.3—continued Trends in the uptake of HIV testing by country, residence, and sex
Rural men
Rural w omen
Urban men
Urban w omen
0
10
20
30
40
50
60
70
80
2003
2004
2005
2006
2007
2008
2009
2010
2011
2012
Perc
ent e
ver t
este
d fo
r HIV
Cameroon
Rural men
Rural w omenUrban men
Urban w omen
0
10
20
30
40
50
60
70
80
2003
2004
2005
2006
2007
2008
2009
2010
2011
2012
Perc
ent e
ver t
este
d fo
r HIV
Mozambique
Rural men
Rural w omenUrban men
Urban w omen
0
10
20
30
40
50
60
70
80
2003
2004
2005
2006
2007
2008
2009
2010
2011
2012
Perc
ent e
ver t
este
d fo
r HIV
Senegal
Rural men
Rural w omenUrban men
Urban w omen
0
10
20
30
40
50
60
70
80
2003
2004
2005
2006
2007
2008
2009
2010
2011
2012
Perc
ent e
ver t
este
d fo
r HIV
Uganda
Rural men
Rural w omenUrban men
Urban w omen
0
10
20
30
40
50
60
70
80
2003
2004
2005
2006
2007
2008
2009
2010
2011
2012
Perc
ent e
ver t
este
d fo
r HIV
Tanzania
Group C: Countries characterized by divergence in testing uptake between urban women and all other groups (6)
Rural men
Rural w omenUrban men
Urban w omen
0
10
20
30
40
50
60
70
80
2003
2004
2005
2006
2007
2008
2009
2010
2011
2012
Perc
ent e
ver t
este
d fo
r HIV
Kenya

37
Figure 4.3—continued Trends in the uptake of HIV testing by country, residence, and sex
Rural menRural w omen
Urban men
Urban w omen
0
10
20
30
40
50
60
70
80
2003
2004
2005
2006
2007
2008
2009
2010
2011
2012
Perc
ent e
ver t
este
d fo
r HIV
Congo-Brazzaville
Rural menRural w omenUrban menUrban w omen
0
10
20
30
40
50
60
70
80
2003
2004
2005
2006
2007
2008
2009
2010
2011
2012
Perc
ent e
ver t
este
d fo
r HIV
Ghana
Rural men
Rural w omenUrban men
Urban w omen
0
10
20
30
40
50
60
70
80
2003
2004
2005
2006
2007
2008
2009
2010
2011
2012
Perc
ent e
ver t
este
d fo
r HIV
Rwanda
Group D: Countries characterized by narrow differentials in testing uptake by sex and residence (3)
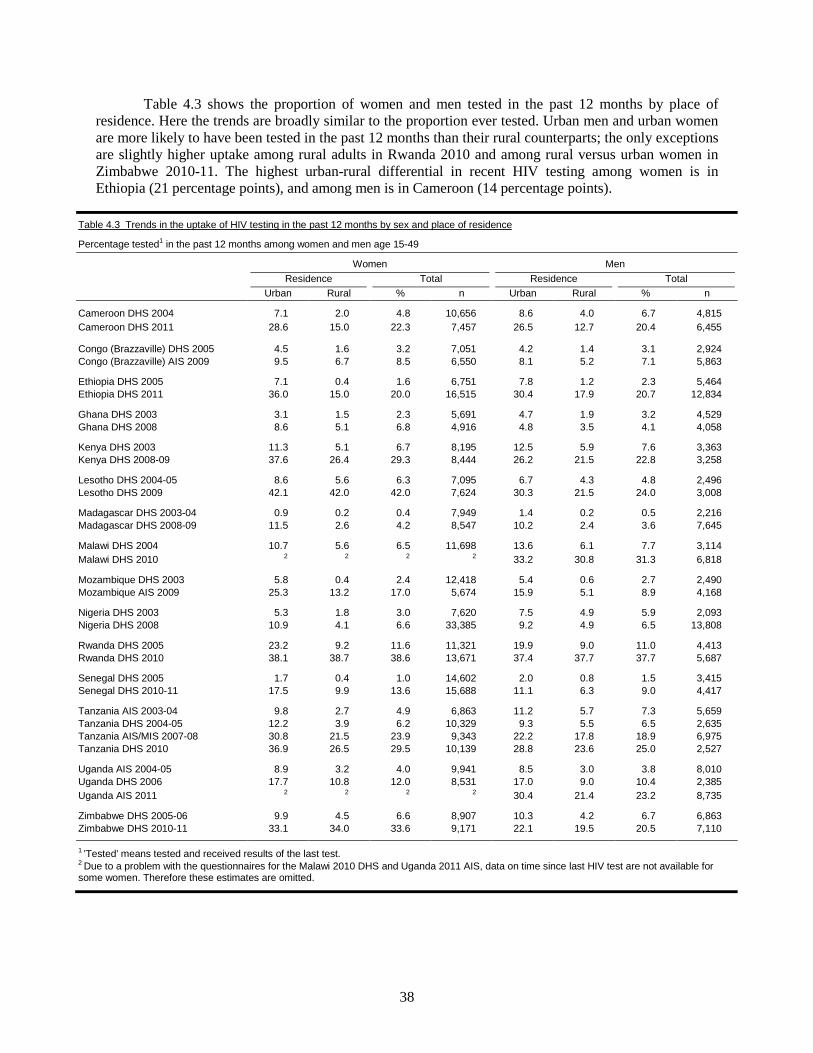
38
Table 4.3 shows the proportion of women and men tested in the past 12 months by place of residence. Here the trends are broadly similar to the proportion ever tested. Urban men and urban women are more likely to have been tested in the past 12 months than their rural counterparts; the only exceptions are slightly higher uptake among rural adults in Rwanda 2010 and among rural versus urban women in Zimbabwe 2010-11. The highest urban-rural differential in recent HIV testing among women is in Ethiopia (21 percentage points), and among men is in Cameroon (14 percentage points).
Table 4.3 Trends in the uptake of HIV testing in the past 12 months by sex and place of residence
Percentage tested1 in the past 12 months among women and men age 15-49
Women Men Residence Total Residence Total
Urban Rural % n Urban Rural % n
Cameroon DHS 2004 7.1 2.0 4.8 10,656 8.6 4.0 6.7 4,815 Cameroon DHS 2011 28.6 15.0 22.3 7,457 26.5 12.7 20.4 6,455
Congo (Brazzaville) DHS 2005 4.5 1.6 3.2 7,051 4.2 1.4 3.1 2,924 Congo (Brazzaville) AIS 2009 9.5 6.7 8.5 6,550 8.1 5.2 7.1 5,863
Ethiopia DHS 2005 7.1 0.4 1.6 6,751 7.8 1.2 2.3 5,464 Ethiopia DHS 2011 36.0 15.0 20.0 16,515 30.4 17.9 20.7 12,834
Ghana DHS 2003 3.1 1.5 2.3 5,691 4.7 1.9 3.2 4,529 Ghana DHS 2008 8.6 5.1 6.8 4,916 4.8 3.5 4.1 4,058
Kenya DHS 2003 11.3 5.1 6.7 8,195 12.5 5.9 7.6 3,363 Kenya DHS 2008-09 37.6 26.4 29.3 8,444 26.2 21.5 22.8 3,258
Lesotho DHS 2004-05 8.6 5.6 6.3 7,095 6.7 4.3 4.8 2,496 Lesotho DHS 2009 42.1 42.0 42.0 7,624 30.3 21.5 24.0 3,008
Madagascar DHS 2003-04 0.9 0.2 0.4 7,949 1.4 0.2 0.5 2,216 Madagascar DHS 2008-09 11.5 2.6 4.2 8,547 10.2 2.4 3.6 7,645
Malawi DHS 2004 10.7 5.6 6.5 11,698 13.6 6.1 7.7 3,114 Malawi DHS 2010 2 2 2 2 33.2 30.8 31.3 6,818
Mozambique DHS 2003 5.8 0.4 2.4 12,418 5.4 0.6 2.7 2,490 Mozambique AIS 2009 25.3 13.2 17.0 5,674 15.9 5.1 8.9 4,168
Nigeria DHS 2003 5.3 1.8 3.0 7,620 7.5 4.9 5.9 2,093 Nigeria DHS 2008 10.9 4.1 6.6 33,385 9.2 4.9 6.5 13,808
Rwanda DHS 2005 23.2 9.2 11.6 11,321 19.9 9.0 11.0 4,413 Rwanda DHS 2010 38.1 38.7 38.6 13,671 37.4 37.7 37.7 5,687
Senegal DHS 2005 1.7 0.4 1.0 14,602 2.0 0.8 1.5 3,415 Senegal DHS 2010-11 17.5 9.9 13.6 15,688 11.1 6.3 9.0 4,417
Tanzania AIS 2003-04 9.8 2.7 4.9 6,863 11.2 5.7 7.3 5,659 Tanzania DHS 2004-05 12.2 3.9 6.2 10,329 9.3 5.5 6.5 2,635 Tanzania AIS/MIS 2007-08 30.8 21.5 23.9 9,343 22.2 17.8 18.9 6,975 Tanzania DHS 2010 36.9 26.5 29.5 10,139 28.8 23.6 25.0 2,527
Uganda AIS 2004-05 8.9 3.2 4.0 9,941 8.5 3.0 3.8 8,010 Uganda DHS 2006 17.7 10.8 12.0 8,531 17.0 9.0 10.4 2,385 Uganda AIS 2011 2 2 2 2 30.4 21.4 23.2 8,735
Zimbabwe DHS 2005-06 9.9 4.5 6.6 8,907 10.3 4.2 6.7 6,863 Zimbabwe DHS 2010-11 33.1 34.0 33.6 9,171 22.1 19.5 20.5 7,110 1 'Tested' means tested and received results of the last test. 2 Due to a problem with the questionnaires for the Malawi 2010 DHS and Uganda 2011 AIS, data on time since last HIV test are not available for some women. Therefore these estimates are omitted.

39
5 Trends in HIV Testing Uptake Associated with Antenatal Care This chapter examines women’s reported uptake of HIV testing before, during, after, and outside
of antenatal care (ANC) in sub-Saharan Africa since 2003. In many countries, antenatal care (ANC) has been an important site of HIV testing, both for efforts to counsel and inform sexually-active women about HIV, and to help prevent mother-to-child transmission of the virus. Especially in high-fertility countries where the use of medical services is low, ANC can provide sexually active women with a link to health services; thus increases in HIV testing during ANC can contribute enormously to women’s receipt of HIV testing overall.
5.1 Receipt of HIV testing by time since most recent birth
Table 5.1 shows receipt of any HIV testing among women age 15-49 by timing of last birth, among 47 surveys in sub-Saharan Africa since 2003. In nearly every country women who have ever given birth, particularly women who have given birth in the past two years, are more likely to have ever been tested for HIV. In 19 surveys women who have given birth in the past two years are more than twice as likely to have ever been tested for HIV as women who have never given birth.
Table 5.1 Uptake of HIV testing among women by date of last birth
Percentage ever tested1 among women age 15-49
Country and year
Women who have never given birth
Women who gave birth more than 2 years ago
Women who have given birth in past 2 years2
All women 15-49
Number of women
Benin DHS 2006 12.2 13.3 19.2 15.1 17,794 Burkina Faso DHS 2010 19.6 27.7 36.2 28.8 17,087 Burundi DHS 2010 20.2 36.5 57.5 37.4 9,389 Cameroon DHS 2004 12.2 23.7 25.1 20.7 10,656 Cameroon DHS 20011 34.6 56.0 61.3 50.9 7,457 Chad DHS 2004 1.5 1.4 1.9 1.1 6,085 Congo (Brazzaville) DHS 2005 5.5 11.5 10.4 9.5 7,051 Congo (Brazzaville) AIS 2009 14.3 24.3 26.7 22.5 6,550 Cote d'Ivoire AIS 2005 6.8 11.0 15.0 10.9 5,183 D.R. Congo DHS 2007 6.4 9.9 8.9 8.6 9,995 Ethiopia DHS 2005 7.0 2.3 1.9 3.3 6,751 Ethiopia DHS 2011 37.4 35.5 34.2 35.8 16,515 Ghana DHS 2003 4.8 8.4 8.7 7.4 5,691 Ghana DHS 2008 8.7 16.1 30.6 16.9 4,916 Guinea DHS 2005 3.0 1.7 2.0 2.1 7,954 Kenya DHS 2003 9.2 14.1 15.5 13.1 8,195 Kenya DHS 2008-09 31.0 58.5 80.3 56.5 8,444 Lesotho DHS 2004-05 6.1 13.8 16.8 12.0 7,095 Lesotho DHS 2009 45.0 71.0 85.7 65.6 7,624 Liberia DHS 2007 3.2 3.2 3.2 3.2 7,092 Madagascar DHS 2003-04 1.2 1.3 0.3 0.9 7,949 Madagascar DHS 2008-09 9.0 12.3 16.1 12.5 8,547 Malawi DHS 2004 9.2 13.5 15.3 12.9 11,698 Malawi DHS 2010 37.8 73.5 91.1 71.6 23,020 Mali DHS 2006 4.7 6.2 8.1 6.6 14,583 Mozambique DHS 2003 5.4 3.2 3.3 3.7 12,418 Mozambique AIS 2009 19.3 28.2 47.0 33.3 5,674 Namibia DHS 2006-07 25.7 57.2 80.0 50.9 9,804 Niger DHS 2006 1.9 1.4 2.4 1.9 9,223 Nigeria DHS 2003 7.2 6.6 5.4 6.4 7,620 Nigeria DHS 2008 12.4 13.4 18.3 14.6 33,385 Rwanda DHS 2005 12.3 21.4 32.6 21.4 11,321 Rwanda DHS 2010 50.5 86.2 97.6 75.5 13,671 Senegal DHS 2005 2.3 4.9 7.1 2.8 14,602 Senegal DHS 2010-11 17.1 29.0 39.1 27.7 15,688 Sierra Leone DHS 2008 6.0 9.0 12.4 9.4 7,374 Swaziland DHS 2006-07 15.6 37.8 59.9 35.8 4,987
Continued…

40
Table 5.1—Continued
Percentage ever tested1 among women age 15-49
Country and year
Women who have never given birth
Women who gave birth more than 2 years ago
Women who have given birth in past 2 years2
All women 15-49
Number of women
Tanzania AIS 2003-04 10.0 12.8 15.2 12.9 6,863 Tanzania DHS 2004-05 9.0 11.9 14.5 12.1 10,329 Tanzania AIS/MIS 2007-08 21.1 37.2 48.5 36.7 9,343 Tanzania DHS 2010 29.8 56.1 75.9 55.3 10,139 Uganda AIS 2004-05 8.6 14.0 13.7 12.7 9,941 Uganda DHS 2006 15.3 26.9 29.6 24.8 8,531 Uganda AIS 2011 39.4 69.5 79.5 65.8 11,160 Zambia DHS 2007 17.7 38.2 44.4 35.3 7,146 Zimbabwe DHS 2005 12.9 22.3 31.5 21.7 8,907 Zimbabwe DHS 2010 25.2 63.5 79.1 57.4 9,171 1 'Tested' means tested and received results of the last test. 2 Women who gave birth in the past 2 years are also counted as 'ever tested' if they report having been tested and received results during or after ANC, whether or not it was the most recent test.
In six surveys the uptake of HIV testing is slightly higher among all women than among women
who have recently given birth (Ethiopia 2005 and 2011, Guinea 2005, Madagascar 2003-04, Mozambique 2003, and Nigeria 2003), but in each case the difference is less than two percentage points. These countries have relatively low uptake of ANC overall, and uptake of HIV testing is highest among unmarried, sexually active women (data not shown), suggesting that unmarried sexually active women may be more aware of HIV risk or that they may have been a target audience for testing campaigns.
5.2 Uptake of HIV testing during ANC
DHS and AIS surveys ask women who have recently given birth about their receipt of antenatal care. In 41 of 47 surveys9 in Table 5.1, women who recently gave birth were asked whether they were counseled and tested for HIV. Table 5.2 shows the proportion of women who gave birth in the past two years who were tested for HIV during one or more ANC visits. Women who were not tested during ANC are grouped into two categories: those who did not receive ANC at all, and those who received ANC but were not tested.
Table 5.2 shows that in 35 of the 41 surveys since 2003 in which women were asked about HIV testing during ANC, fewer than 20 percent of women who gave birth in the past two years had no ANC—in other words, more than 80 percent of women reported at least one ANC visit. In the other six surveys—Chad, Mali, Niger, Nigeria, and two from Ethiopia—between 30 and 80 percent of women who gave birth in the past two years did not receive any ANC for their most recent birth.
Looking at the proportion of women who received ANC during their most recent birth, in only 9 of 41 countries—Cameroon, Kenya, Malawi, Namibia, Rwanda, Swaziland, Tanzania, Uganda, and Zimbabwe—did more than half of women who gave birth in the past two years receive ANC and also HIV testing during ANC. These nine countries rank high for overall receipt of ANC but are not the highest. In particular, Cameroon (2011) and Zimbabwe (2010) stand out as countries where a relatively larger proportion of pregnant women did not receive any ANC (17 and 13 percent, respectively), but where the majority of those who did receive ANC were also tested for HIV (55 and 73 percent, respectively).
9 HIV testing during ANC was not asked about in Kenya 2003, Lesotho 2004-05, Liberia 2007, Madagascar 2003-04, Mozambique 2003, and Nigeria 2003.
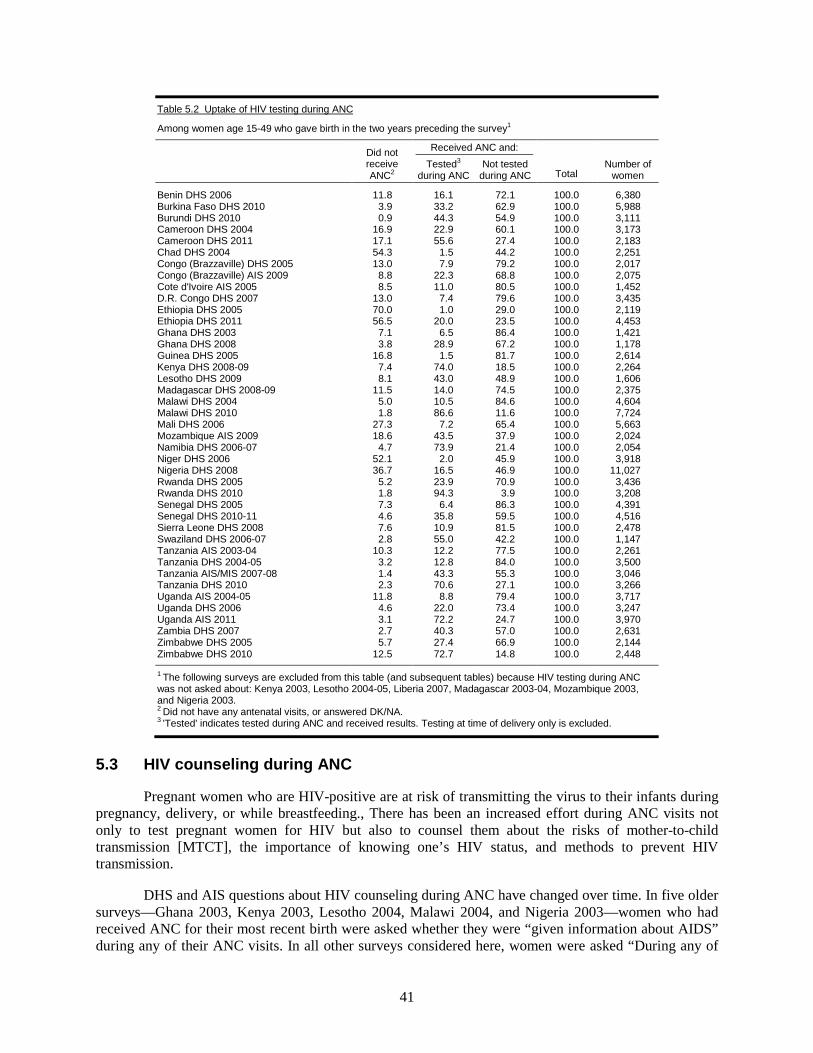
41
Table 5.2 Uptake of HIV testing during ANC
Among women age 15-49 who gave birth in the two years preceding the survey1
Did not receive ANC2
Received ANC and:
Total Number of
women Tested3
during ANC Not tested
during ANC
Benin DHS 2006 11.8 16.1 72.1 100.0 6,380 Burkina Faso DHS 2010 3.9 33.2 62.9 100.0 5,988 Burundi DHS 2010 0.9 44.3 54.9 100.0 3,111 Cameroon DHS 2004 16.9 22.9 60.1 100.0 3,173 Cameroon DHS 2011 17.1 55.6 27.4 100.0 2,183 Chad DHS 2004 54.3 1.5 44.2 100.0 2,251 Congo (Brazzaville) DHS 2005 13.0 7.9 79.2 100.0 2,017 Congo (Brazzaville) AIS 2009 8.8 22.3 68.8 100.0 2,075 Cote d'Ivoire AIS 2005 8.5 11.0 80.5 100.0 1,452 D.R. Congo DHS 2007 13.0 7.4 79.6 100.0 3,435 Ethiopia DHS 2005 70.0 1.0 29.0 100.0 2,119 Ethiopia DHS 2011 56.5 20.0 23.5 100.0 4,453 Ghana DHS 2003 7.1 6.5 86.4 100.0 1,421 Ghana DHS 2008 3.8 28.9 67.2 100.0 1,178 Guinea DHS 2005 16.8 1.5 81.7 100.0 2,614 Kenya DHS 2008-09 7.4 74.0 18.5 100.0 2,264 Lesotho DHS 2009 8.1 43.0 48.9 100.0 1,606 Madagascar DHS 2008-09 11.5 14.0 74.5 100.0 2,375 Malawi DHS 2004 5.0 10.5 84.6 100.0 4,604 Malawi DHS 2010 1.8 86.6 11.6 100.0 7,724 Mali DHS 2006 27.3 7.2 65.4 100.0 5,663 Mozambique AIS 2009 18.6 43.5 37.9 100.0 2,024 Namibia DHS 2006-07 4.7 73.9 21.4 100.0 2,054 Niger DHS 2006 52.1 2.0 45.9 100.0 3,918 Nigeria DHS 2008 36.7 16.5 46.9 100.0 11,027 Rwanda DHS 2005 5.2 23.9 70.9 100.0 3,436 Rwanda DHS 2010 1.8 94.3 3.9 100.0 3,208 Senegal DHS 2005 7.3 6.4 86.3 100.0 4,391 Senegal DHS 2010-11 4.6 35.8 59.5 100.0 4,516 Sierra Leone DHS 2008 7.6 10.9 81.5 100.0 2,478 Swaziland DHS 2006-07 2.8 55.0 42.2 100.0 1,147 Tanzania AIS 2003-04 10.3 12.2 77.5 100.0 2,261 Tanzania DHS 2004-05 3.2 12.8 84.0 100.0 3,500 Tanzania AIS/MIS 2007-08 1.4 43.3 55.3 100.0 3,046 Tanzania DHS 2010 2.3 70.6 27.1 100.0 3,266 Uganda AIS 2004-05 11.8 8.8 79.4 100.0 3,717 Uganda DHS 2006 4.6 22.0 73.4 100.0 3,247 Uganda AIS 2011 3.1 72.2 24.7 100.0 3,970 Zambia DHS 2007 2.7 40.3 57.0 100.0 2,631 Zimbabwe DHS 2005 5.7 27.4 66.9 100.0 2,144 Zimbabwe DHS 2010 12.5 72.7 14.8 100.0 2,448 1 The following surveys are excluded from this table (and subsequent tables) because HIV testing during ANC was not asked about: Kenya 2003, Lesotho 2004-05, Liberia 2007, Madagascar 2003-04, Mozambique 2003, and Nigeria 2003. 2 Did not have any antenatal visits, or answered DK/NA. 3 'Tested' indicates tested during ANC and received results. Testing at time of delivery only is excluded.
5.3 HIV counseling during ANC
Pregnant women who are HIV-positive are at risk of transmitting the virus to their infants during pregnancy, delivery, or while breastfeeding., There has been an increased effort during ANC visits not only to test pregnant women for HIV but also to counsel them about the risks of mother-to-child transmission [MTCT], the importance of knowing one’s HIV status, and methods to prevent HIV transmission.
DHS and AIS questions about HIV counseling during ANC have changed over time. In five older surveys—Ghana 2003, Kenya 2003, Lesotho 2004, Malawi 2004, and Nigeria 2003—women who had received ANC for their most recent birth were asked whether they were “given information about AIDS” during any of their ANC visits. In all other surveys considered here, women were asked “During any of
42
the antenatal visits for your last birth, did anyone talk to you about: (1) Babies getting the AIDS virus from their mother? (2) Things that you can do to prevent getting the AIDS virus? and (3) Getting tested for the AIDS virus?”10
To ensure consistency over time and across countries, we consider a woman to have been counseled for HIV during an ANC visit if she was “given information about AIDS” or if she discussed any of the three specific HIV-related topics. Post-test counseling is not included, as by definition it is not comparable for women who received an HIV test and those who did not, and also is not asked about in every survey. Table 5.3 shows receipt of HIV counseling and testing among women who received any ANC for their most recent birth in the past two years.
Among women who were tested for HIV during ANC, in every country the vast majority of respondents report that they were also counseled about HIV. In six surveys (Burundi 2010, Cameroon 2011, Ethiopia 2011, Namibia 2006-07, Senegal 2010-2011, and Swaziland 2006-07), more than 3 percent of women who received ANC report being tested for HIV but do not recall being counseled about HIV.
Table 5.3 also shows wide variation in receipt of HIV counseling among women who were not tested for HIV during ANC. In 15 surveys more than half of women who received ANC for a recent birth were neither tested nor counseled about HIV. All 15 of these surveys were conducted between 2003 and 2008; more recent surveys have found a larger proportion of women counseled about HIV during ANC even if they were not tested.
10 In 2009, women who received ANC in Lesotho were also asked whether they received counseling about “special medications that can be taken by pregnant women to reduce the risk of transmission of HIV to her baby.” For purposes of comparability, this question was not used in assessing ‘counseling’ during ANC; if it had been included, an additional 21 respondents would have been classified as receiving counseling.

43
Table 5.3 HIV counseling and testing during ANC
Among women age 15-49 who gave birth in the two years preceding the survey and had at least one ANC visit, receipt of HIV counseling and testing during ANC
Tested1 for HIV during ANC and:
Not tested for HIV during ANC and:
Total Number of
women Counseled2 about HIV
Not counseled about HIV
Counseled about HIV
Not counseled about HIV
Benin DHS 2006 16.7 1.5 27.2 54.6 100.0 5,626 Burkina Faso DHS 2010 33.0 1.5 34.3 31.2 100.0 5,753 Burundi DHS 2010 41.4 3.3 33.3 22.1 100.0 3,084 Cameroon DHS 2004 26.9 0.7 39.5 32.9 100.0 2,636 Cameroon DHS 2011 62.1 4.9 14.2 18.8 100.0 1,810 Chad DHS 2004 3.1 0.3 37.7 59.0 100.0 1,029 Congo (Brazzaville) DHS 2005 8.4 0.7 38.8 52.1 100.0 1,755 Congo (Brazzaville) AIS 2009 23.0 1.5 33.0 42.4 100.0 1,891 Cote d'Ivoire AIS 2005 11.2 0.8 16.4 71.6 100.0 1,328 D.R. Congo DHS 2007 7.9 0.5 36.5 55.1 100.0 2,987 Ethiopia DHS 2005 3.0 0.5 32.8 63.8 100.0 635 Ethiopia DHS 2011 38.9 7.0 15.5 38.5 100.0 1,936 Ghana DHS 2003 5.5 1.5 41.0 52.0 100.0 1,320 Ghana DHS 2008 29.0 1.1 45.9 24.0 100.0 1,133 Guinea DHS 2005 1.4 0.5 23.3 74.9 100.0 2,176 Kenya DHS 2008-09 77.2 2.8 10.0 10.1 100.0 2,095 Lesotho DHS 2009 46.2 0.6 4.6 48.6 100.0 1,475 Madagascar DHS 2008-09 14.4 1.5 28.5 55.7 100.0 2,102 Malawi DHS 2004 9.8 1.2 45.4 43.6 100.0 4,376 Malawi DHS 2010 87.4 0.8 9.7 2.1 100.0 7,589 Mali DHS 2006 8.4 1.5 21.4 68.7 100.0 4,116 Mozambique AIS 2009 52.0 1.4 34.7 11.9 100.0 1,647 Namibia DHS 2006-07 74.3 3.2 14.8 7.7 100.0 1,958 Niger DHS 2006 3.2 0.9 24.1 71.8 100.0 1,875 Nigeria DHS 2008 24.1 1.9 29.1 44.9 100.0 6,984 Rwanda DHS 2005 24.4 0.8 49.1 25.6 100.0 3,259 Rwanda DHS 2010 94.9 1.2 3.0 1.0 100.0 3,149 Senegal DHS 2005 5.6 1.4 12.5 80.6 100.0 4,071 Senegal DHS 2010-11 33.3 4.3 20.5 42.0 100.0 4,306 Sierra Leone DHS 2008 11.0 0.8 31.4 56.8 100.0 2,290 Swaziland DHS 2006-07 53.5 3.1 35.1 8.3 100.0 1,116 Tanzania AIS 2003-04 11.7 1.9 30.4 56.0 100.0 2,028 Tanzania DHS 2004-05 12.0 1.2 36.5 50.3 100.0 3,389 Tanzania AIS/MIS 2007-08 42.4 1.5 28.1 28.0 100.0 3,002 Tanzania DHS 2010 70.5 1.7 15.2 12.5 100.0 3,192 Uganda AIS 2004-05 9.4 0.6 49.4 40.5 100.0 3,279 Uganda DHS 2006 22.0 1.1 40.5 36.4 100.0 3,099 Uganda AIS 2011 72.8 1.7 16.9 8.5 100.0 3,846 Zambia DHS 2007 41.2 0.2 42.6 16.0 100.0 2,560 Zimbabwe DHS 2005 27.8 1.3 44.8 26.1 100.0 2,022 Zimbabwe DHS 2010 80.9 2.2 11.1 5.8 100.0 2,142 1 'Tested' means tested and received results of the last test. 2 Counseling means that a respondent said that she was 'given information about AIDS' during ANC, or--in more recent surveys--that someone talked to her about any the following topics: (1) babies getting HIV from their mother; (2) preventing the virus; or (3) getting tested for the virus.
5.4 HIV testing before, after, and during ANC
DHS and AIS surveys do not ask all adults about the number of times they have been tested for HIV, nor the timing of the test for any except the most recent. For this reason, asking detailed questions about HIV testing among women who have recently given birth, not only during ANC but also at the time of delivery and after delivery, offers a unique opportunity to examine the timing of HIV testing, whether before, during, or after a recent pregnancy.
Table 5.4 shows receipt of HIV testing during, after, and outside of ANC among women who have given birth in the past two years. In most countries women who were tested during ANC also were not tested afterward. However, recent surveys in Lesotho, Malawi, Namibia, Rwanda, Uganda, and

44
Zimbabwe indicate that more than one in five women who have recently given birth received HIV testing at the time of delivery or after delivery. The sizeable proportion of women who were tested during and after ANC in these countries may reflect particular initiatives to test women at the time of delivery and during follow-ups.
Table 5.4 HIV testing during, after, and outside of ANC
Among women age 15-49 who gave birth in the two years preceding the survey
Tested1during ANC and: Not tested during ANC2 and:
Total Number of
women Tested
after ANC3 Not tested after ANC
Never tested
Tested in past 2 years
Tested more than 2 years
ago4
Benin DHS 2006 1.1 15.0 80.8 1.6 1.5 100.0 6,380 Burkina Faso DHS 2010 8.8 24.4 63.8 1.2 1.8 100.0 5,988 Burundi DHS 2010 6.8 37.4 42.5 3.6 9.6 100.0 3,111 Cameroon DHS 2004 2.2 20.7 74.9 1.2 0.9 100.0 3,173 Cameroon DHS 2011 8.8 46.7 38.7 0.7 5.1 100.0 2,183 Chad DHS 2004 0.3 1.2 98.1 0.2 0.1 100.0 2,251 Congo (Brazzaville) DHS 2005 1.1 6.7 89.6 1.2 1.3 100.0 2,017 Congo (Brazzaville) AIS 2009 2.0 20.4 73.3 1.7 2.6 100.0 2,075 Cote d'Ivoire AIS 2005 0.1 10.9 85.0 1.7 2.3 100.0 1,452 D.R. Congo DHS 2007 1.0 6.3 91.1 0.8 0.7 100.0 3,435 Ethiopia DHS 2005 0.0 1.0 98.1 0.6 0.3 100.0 2,119 Ethiopia DHS 2011 6.9 13.1 65.8 9.0 5.2 100.0 4,453 Ghana DHS 20035 6.5 91.3 1.0 1.2 100.0 1,421 Ghana DHS 2008 5.0 23.9 69.4 0.9 0.8 100.0 1,178 Guinea DHS 2005 0.2 1.4 98.0 0.4 0.1 100.0 2,614 Kenya DHS 2008-09 19.8 54.2 19.7 4.3 1.9 100.0 2,264 Lesotho DHS 2009 21.7 21.3 14.3 40.6 2.2 100.0 1,606 Madagascar DHS 2008-09 1.8 12.3 83.9 1.9 0.2 100.0 2,375 Malawi DHS 20045 10.5 84.7 3.5 1.4 100.0 4,604 Malawi DHS 2010 30.9 55.8 8.9 0.0 4.4 100.0 7,724 Mali DHS 2006 0.6 6.6 91.9 0.4 0.4 100.0 5,663 Mozambique AIS 2009 6.8 36.7 53.0 2.8 0.8 100.0 2,024 Namibia DHS 2006-07 30.9 43.0 20.0 4.7 1.4 100.0 2,054 Niger DHS 2006 0.4 1.6 97.6 0.3 0.1 100.0 3,918 Nigeria DHS 2008 2.5 14.0 81.7 1.2 0.6 100.0 11,027 Rwanda DHS 2005 1.8 22.1 67.4 3.6 5.1 100.0 3,436 Rwanda DHS 2010 26.2 68.1 2.4 1.9 1.4 100.0 3,208 Senegal DHS 2005 0.2 6.2 92.9 0.3 0.4 100.0 4,391 Senegal DHS 2010-11 11.0 24.8 60.9 1.9 1.3 100.0 4,516 Sierra Leone DHS 2008 2.1 8.8 87.6 1.2 0.3 100.0 2,478 Swaziland DHS 2006-07 15.7 39.3 40.1 3.8 1.1 100.0 1,147 Tanzania AIS 2003-04 1.9 10.3 84.8 2.1 0.9 100.0 2,261 Tanzania DHS 2004-055 12.8 85.5 0.9 0.8 100.0 3,500 Tanzania AIS/MIS 2007-08 9.4 33.9 51.5 4.8 0.4 100.0 3,046 Tanzania DHS 2010 11.9 58.7 24.1 3.6 1.7 100.0 3,266 Uganda AIS 2004-05 1.0 7.8 86.3 1.9 3.0 100.0 3,717 Uganda DHS 2006 3.8 18.2 70.4 4.2 3.4 100.0 3,247 Uganda AIS 20116 72.2 20.5 4.9 2.4 100.0 3,970 Zambia DHS 2007 8.8 31.6 55.6 2.9 1.2 100.0 2,631 Zimbabwe DHS 2005 3.5 23.9 68.5 2.4 1.7 100.0 2,144 Zimbabwe DHS 2010 24.4 48.4 20.9 5.1 1.3 100.0 2,448
1 'Tested' means tested and received results of the last test. 2 Includes those who did not receive ANC. 3 At time of delivery (if asked) or after delivery. 4 Default for ever tested but more than 2 years ago. 5 In Ghana 2003, Malawi 2004, and Tanzania 2004-05, women were asked about HIV testing during but not after ANC. 6 Uganda 2011 is the only survey where women who received testing during ANC were asked about their test results. Women who reported testing positive during ANC were not asked if they had been tested after ANC; therefore these categories have been grouped.

45
With the exception of Lesotho, in every survey the majority of women who were not tested for HIV during ANC (including those who did not receive ANC) had never been tested for HIV. That is, women who are not being tested for HIV during ANC also are not being reached through outside initiatives or other campaigns to promote voluntary counseling and testing. This pattern appears to hold regardless of whether overall uptake of ANC (and of HIV testing during ANC) is high or low in a country, suggesting the primacy of ANC as a site for HIV testing.
5.5 Time trends in the uptake of HIV testing during ANC
Over the past decade, nine countries in sub-Saharan Africa have had more than one DHS or AIS survey that asked about HIV testing during ANC. In every case, the more recent survey has found a higher uptake of HIV testing during ANC. Is this trend due to increased access to ANC among pregnant women, or to increased uptake of testing among women who receive ANC? Figure 5.1 shows the proportion who received ANC and the proportion who received HIV testing during ANC in each country among women who have given birth in the past two years, shown in ascending order by most recent proportion tested during ANC.
In all nine countries HIV testing during ANC has increased over time. Even in Zimbabwe, where receipt of ANC declined, more women who have given birth in the past two years were tested for HIV during ANC than ever before. In all nine countries the rate of increase in the uptake of HIV testing during ANC is higher than the rate of increase in receipt of ANC overall. The rate is highest in Rwanda, Malawi, Tanzania, Zimbabwe, and Uganda, suggesting that early adoption of provider-initiated opt-out testing in these countries, and the positive perceptions of these programs (Baggaley et al. 2012), may have been an important factor in increasing the uptake of testing during ANC.
Overall, HIV testing during ANC in sub-Saharan Africa appears to be a major source of women’s knowledge about their HIV status. In the median country, women who have never given birth are half as likely to have ever been tested for HIV as women who gave birth in the past two years. And among women who have given birth in the past two years but were not tested during ANC, the majority—at least two-thirds in 39 of 41 countries—had never been tested. Additionally, even if not tested for HIV during an ANC visit, more and more women are being counseled about HIV during ANC.

46
Figure 5.1 Trends in receipt of ANC, and receipt of HIV testing during ANC, by country
1 Received ANC means had 1 or more ANC visits for most recent birth in the past two years. Tested during ANC means tested and received results.
Tested during ANC
Received ANC
0102030405060708090
100
2003
2004
2005
2006
2007
2008
2009
2010
2011
2012
Congo-Brazzaville
Tested during ANC
Received ANC
0102030405060708090
100
2003
2004
2005
2006
2007
2008
2009
2010
2011
2012
Ghana
Tested during ANC
Received ANC
0102030405060708090
100
2003
2004
2005
2006
2007
2008
2009
2010
2011
2012
Ethiopia
Tested during ANC
Received ANC
0102030405060708090
100
2003
2004
2005
2006
2007
2008
2009
2010
2011
2012
Senegal
Tested during ANC
Received ANC
0102030405060708090
100
2003
2004
2005
2006
2007
2008
2009
2010
2011
2012
Uganda
y y
Among women ages 15-49 who have given birth in the 2 years preceding the survey
Tested during ANC
Received ANC
0102030405060708090
10020
03
2004
2005
2006
2007
2008
2009
2010
2011
2012
Cameroon
Countries in ascending order by current proportion tested for HIV during ANC

47
Figure 5.1—continued Trends in receipt of ANC, and receipt of HIV testing during ANC, by country
Tested during ANC
Received ANC
0102030405060708090
100
2003
2004
2005
2006
2007
2008
2009
2010
2011
2012
Malawi
Tested during ANC
Received ANC
0102030405060708090
10020
03
2004
2005
2006
2007
2008
2009
2010
2011
2012
Rwanda
Tested during ANC
Received ANC
0102030405060708090
100
2003
2004
2005
2006
2007
2008
2009
2010
2011
2012
Tanzania
Tested during ANC
Received ANC
0102030405060708090
100
2003
2004
2005
2006
2007
2008
2009
2010
2011
2012
Zimbabwe
Among women ages 15-49 who have given birth in the 2 years preceding the survey
Countries in ascending order by current proportion tested for HIV during ANC

48
6 HIV Testing by Serostatus 6.1 HIV serotesting in DHS and AIS surveys
Before 2001, HIV prevalence was estimated largely from sentinel surveillance systems that monitored HIV rates in pregnant women attending antenatal care. At the time, this was the best available proxy measure for national prevalence. In 2001, MEASURE DHS included testing for HIV in the Mali Demographic and Health Survey, providing one of the first-ever HIV prevalence estimates from a nationally representative, population-based sample. Unlike sentinel surveillance, population-level HIV testing includes men, nonpregnant women, and people without access to health facilities. Thus it provides more representative estimates of HIV prevalence nationwide.
The HIV serostatus data collected by DHS can be linked with all of the information collected during the interview. This allows for a comprehensive examination of the sociodemographic and behavioral factors associated with HIV infection, such as age, education, residence, wealth, marital status, and sexual behaviors, including previous HIV testing and receipt of results.
Between January 2001 and October 2012, MEASURE DHS included population-based HIV testing as part of 48 surveys in 34 countries, including 37 completed surveys in sub-Saharan Africa. HIV testing is usually conducted for women and men age 15-49, although some country surveys have tested children, and others have tested older adults.
The HIV testing protocol for the DHS and AIS surveys provides for informed, anonymous, and voluntary testing of women and men selected for an interview. The testing protocol undergoes an ethical review by the host-country as well as an ethical review at ICF International. In countries with involvement of the U.S. Centers for Disease Control (CDC), the testing protocol is also reviewed by the CDC. The testing protocol is simple; in most cases, the interviewer collects blood drops from a finger prick on filter paper. Procedures to ensure DBS testing quality and reliability are strictly followed in every country.11 After testing, each filter paper is assigned a unique bar code that can be linked to the questionnaire to allow for analysis of HIV status by respondents’ background characteristics but does not allow the results of the HIV test to be identified to the name or location of a specific individual.
Coverage rates for DHS-initiated HIV testing in the surveys included in this comparative report range from 77 percent of women in Zambia 2007 and 69 percent of men in Zimbabwe 2010-11 to 99 percent of women in Rwanda 2010 and 98 percent of men in Rwanda 2010 and Congo Brazzaville 2009. A detailed list of coverage rates can be found in Appendix Table A.8.
As discussed earlier (Section 2.2), respondents who report that they have ever been tested in the past and received the results of the test do not necessarily know their current HIV status. Even someone who tested negative in the last 12 months before the survey may have become infected after the test and therefore would not know their current status. Alternatively, someone who tested positive for HIV five years before the survey would have no need to be retested, and therefore would not be captured in the data on recent testing. Thus this chapter analyzes only ever testing for HIV. Figures on uptake of HIV testing
11 The blood spots are then dried, and the dried blood spots (DBS) are transported to a laboratory for testing. In the laboratory, the sample undergoes an initial ELISA test, and then all positive samples and 5 to 10 percent of negative samples are retested with a second ELISA. For those tests with discordant results on the two ELISA tests, another test, usually a Western blot, is used to determine the result. As external quality control, all positive samples and a random sample of about 3 to 5 percent of the negative samples are sent for testing to another lab that is not associated with the survey. The results from the independent lab are checked against the results of the main laboratory. However, for the few cases where the HIV testing protocol has not led to conclusive results, a small number of indeterminant cases have been excluded from the categories HIV-positive and HIV-negative, but are included in the total.

49
in this chapter are calculated among adults who consented to DHS-initiated HIV testing only and therefore differ slightly from percentages reported earlier.
6.2 Cross-national patterns in HIV prevalence and testing uptake
Table 6.1 shows the proportion of women and men ever tested for HIV and the corresponding national HIV prevalence. The data on HIV uptake and prevalence among women are shown, respectively, in Maps 6.1 and 6.2, and corresponding prevalence data for men are shown in maps 6.3 and 6.4. As discussed in Chapter 4, the proportion of adults who have ever been tested for HIV varies substantially across countries. Maps 6.2 and 6.4 also illustrate that HIV prevalence varies substantially throughout sub-Saharan Africa. In general, HIV prevalence is lowest in Western Africa and highest in Southern Africa, with Central and Eastern African countries in the mid-range. For example, less than 1 percent of women and men in Senegal and Niger are HIV-positive, while more than 25 percent of women and more than 18 percent of men in Lesotho and Swaziland tested positive for HIV in their respective country surveys. In all countries except Niger, HIV prevalence is higher among women than it is among men, ranging from 30 percent higher to more than twice as high.
Table 6.1. HIV prevalence and testing uptake
Prevalence of HIV and percentage ever tested1 among women and men age 15-49
Women (%) Men (%) Ever
tested HIV
prevalence Ever
tested HIV
prevalence
Benin DHS 20062 14.8 1.5 10.4 0.8 Burkina Faso DHS 2010 27.8 1.2 20.2 0.8 Burundi DHS 2010 37.3 1.7 31.8 1.0 Cameroon DHS 2011 51.1 5.6 39.6 2.9 Congo (Brazzaville) AIS 2009 22.8 4.1 17.6 2.1 Cote d'Ivoire AIS 2005 10.1 6.4 7.9 2.9 D.R. Congo DHS 2007 8.5 1.6 8.6 0.9 Ethiopia DHS 2011 36.0 1.9 38.1 1.0 Ghana DHS 2003 7.4 2.7 7.2 1.5 Guinea DHS 2005 1.7 1.9 5.6 0.9 Kenya DHS 2008-09 57.8 8.0 40.7 4.3 Lesotho DHS 2009 64.8 26.7 37.8 18.0 Liberia DHS 2007 3.1 1.9 4.6 1.2 Malawi DHS 2010 71.9 12.9 51.8 8.1 Mali DHS 2006 6.3 1.5 6.5 1.0 Mozambique AIS 2009 32.9 13.1 16.9 9.2 Niger DHS 2006 1.8 0.7 3.9 0.8 Rwanda DHS 2010 75.0 3.7 69.3 2.2 Senegal DHS 2010-11 27.3 0.8 16.9 0.5 Sierra Leone DHS 2008 9.2 1.7 6.6 1.2 Swaziland DHS 2006-07 35.7 31.1 16.3 19.7 Tanzania AIS/MIS 2007-08 36.7 6.6 26.4 4.6 Uganda AIS 2011 65.8 8.3 44.9 6.1 Zambia DHS 2007 35.8 16.1 20.0 12.3 Zimbabwe DHS 2010-11 58.6 17.7 36.3 12.3 1 Among those who consented to DHS serotesting only. ‘Tested' means the respondent reported ever obtaining an HIV test and receiving the results of the most recent test. 2 Benin HIV data are restricted; numbers are from the country's final report.

50
Map 6.1 HIV prevalence among women, sub-Saharan Africa

51
Map 6.2 Percentage of women who have ever been tested for HIV, sub-Saharan Africa

52
Map 6.3 HIV prevalence among men, sub-Saharan Africa

53
Map 6.4 Percentage of men who have ever been tested for HIV, sub-Saharan Africa
Figures 6.1 and 6.2 show the percentage of women and men, respectively, ever tested for HIV (the y-axis) by year of survey (the x-axis) and HIV prevalence (bubble size). For women, some countries with high HIV prevalence, such as Swaziland, Zambia, and Mozambique, have relatively low levels of HIV testing (about one-third of women have ever been tested for HIV). In contrast, lower countries with lower HIV prevalence, such as Kenya and Rwanda, have fairly high levels of ever testing (58 percent among women in Kenya and 75 percent in Rwanda). Lesotho and Zimbabwe have both high HIV prevalence and high percentages of women reporting that they have ever been tested. Many of the countries with very low HIV prevalence, such as Senegal, Benin, Mali, Niger, Liberia, and D.R. Congo, have very low levels of ever testing among women.

54
Figure 6.2 indicates that levels of ever testing among men are lower than among women, as is HIV prevalence. But the same inconsistent relationship between ever testing and HIV prevalence is found among men as among women. Again, Rwanda stands out as an exception—with relatively low HIV prevalence among men (2 percent) but the highest level of testing (69 percent). Malawi, a relatively high-prevalence country (8 percent among men) is the only other country in which at least half of men have ever been tested for HIV. Other high-prevalence countries, such as Zimbabwe and Lesotho, have relatively low levels of HIV testing uptake. Countries with very low HIV prevalence, such as Senegal, D.R. Congo, Mali, Niger, and Benin, all have correspondingly low levels of ever testing for HIV among men.
Figure 6.1 Percentage of women who have ever been tested for HIV by year and women’s HIV prevalence
0
10
20
30
40
50
60
70
80
90
100
2002 2003 2004 2005 2006 2007 2008 2009 2010 2011 2012
Sierra Leone
Kenya
Lesotho
Zimbabwe
Burundi
Senegal
Ethiopia
Cameroon
Malawi
Rwanda
Per
cent
age
ever
test
ed fo
r HIV
Uganda
Cote d’Ivoire
Guinea Niger
Mali
Benin
Swaziland Zambia Tanzania
Liberia
D.R. CongoCongo
Brazzaville
Mozambique
Bubble size=HIV prevalence among women age 15-49
Burkina Faso
Ghana

55
Figure 6.2 Percentage of men who have ever been tested for HIV by year and women’s HIV prevalence
Countries with higher HIV prevalence are likely also to have higher levels of HIV testing, both due to individual motivation and assessment of risk and to a more active policy and funding environment that makes testing accessible and acceptable. Figures 6.1 and 6.2, for women and men respective, both indicate a pattern of increase in HIV testing uptake in recent years, with some exceptions. For example, women in Swaziland, Zambia, and Tanzania—three higher-prevalence countries—have a much higher uptake of HIV testing compared with other countries surveyed in 2006-2007. Among men, recent surveys in Senegal and Burkina Faso still find relatively low levels of testing uptake compared with other surveys conducted at the same time.
Overall among the countries surveyed, however, the year of the survey is a stronger predictor of HIV testing uptake than of HIV prevalence, for both women and men. The correlation between testing uptake and year of survey is more than 70 percent among both women and men, while the correlation between HIV prevalence and uptake of HIV testing is 50 percent for women and 26 percent for men.12
12 Calculations based on Table 6.1, using the midpoint between two years if the survey overlapped (for example, 2008.5 for a 2008-09 survey).
0
10
20
30
40
50
60
70
80
90
100
2002 2003 2004 2005 2006 2007 2008 2009 2010 2011 2012
Burundi
Bubble size=HIV prevalence among men age 15-49
Burkina Faso
Perc
enta
ge e
ver t
este
d fo
r HIV
Uganda
Cote d’Ivoire
Guinea Niger Mali
Benin
Swaziland Zambia
Tanzania
Liberia
D.R. Congo Congo
Brazzaville
Kenya
Lesotho
Zimbabwe Cameroon
Malawi
Rwanda
MozambiqueSenegal
Sierra Leone
Ethiopia
Ghana

56
6.3 Uptake of HIV testing by respondent’s serostatus
At the national level HIV testing uptake may not be strongly related to overall HIV prevalence, but among individuals the uptake of HIV testing is consistently higher among HIV-positive persons in each country examined. Table 6.1 and Figures 6.3 and 6.4 describe ever testing by respondent’s serostatus. In all 25 surveys HIV-positive individuals report having been tested for HIV more often than HIV-negative individuals. In some countries, such as Cote d’Ivoire, Ethiopia, Guinea, Liberia, Mali, Niger, Sierra Leone, and Swaziland, the proportion of HIV-positive men or women who report ever being tested for HIV is double that of their HIV-negative counterparts. In Ethiopia, for example, HIV ever testing is twice as high among HIV-positive women and men (about 70 percent) as among women who tested HIV-negative in the 2011 Ethiopia DHS (about 35 percent).
Table 6.2. Uptake of HIV testing by sex and serostatus
Percentage ever tested1 among women and men age 15-49
Women (%) Men (%) Women (n) Men (n)
HIV+ HIV- Total2 HIV+ HIV- Total2 HIV + HIV - Total2 HIV + HIV - Total2
Benin DHS 20063 24.9 14.6 14.8 20.3 10.3 10.4 76 4,949 5,025 33 3,916 3,949 Burkina Faso DHS 2010 41.6 27.6 27.8 39.9 20.0 20.2 97 8,196 8,298 51 6,263 6,317 Burundi DHS 2010 64.9 36.9 37.3 (49.1) 31.6 31.8 78 4,454 4,533 36 3,518 3,554 Cameroon DHS 2011 69.4 50.0 51.1 63.9 38.9 39.6 402 6,817 7,221 181 6,100 6,282 Congo (Brazzaville) AIS 2009 35.2 22.2 22.8 21.1 17.5 17.6 266 6,172 6,438 117 5,555 5,671 Cote d'Ivoire AIS 2005 13.6 9.9 10.1 23.6 7.4 7.9 283 4,131 4,414 115 3,908 4,023 D.R. Congo DHS 2007 8.7 8.4 8.5 (14.5) 8.5 8.6 73 4,419 4,492 38 3,974 4,012 Ethiopia DHS 2011 72.5 35.3 36 70.3 37.8 38.1 273 14,412 14,695 127 12,442 12,582 Ghana DHS 2003 12.4 7.3 7.4 8.2 7.2 7.2 138 4,951 5,097 59 3,986 4,047 Guinea DHS 2005 5.4 1.7 1.7 (5.2) 5.6 5.6 71 3,667 3,742 24 2,548 2,577 Kenya DHS 2008-09 73.5 56.5 57.8 58.6 39.9 40.7 291 3,350 3,641 130 2,936 3,066 Lesotho DHS 2009 70.8 62.6 64.8 51.8 34.7 37.8 1,010 2,768 3,778 514 2,342 2,856 Liberia DHS 2007 8.0 3.0 3.1 11.5 4.6 4.6 114 6,267 6,381 63 5,288 5,351 Malawi DHS 2010 81.0 70.6 71.9 63.1 50.9 51.8 913 6,177 7,091 529 5,967 6,497 Mali DHS 2006 11.7 6.2 6.3 (10.9) 6.4 6.5 70 4,458 4,528 37 3,577 3,614 Mozambique AIS 2009 43.2 31.3 32.9 30.1 15.6 16.9 687 4,543 5,229 352 3,479 3,832 Niger DHS 2006 (3.4) 1.8 1.8 (16.9) 3.8 3.9 31 4,374 4,406 22 2,834 2,856 Rwanda DHS 2010 91.3 74.4 75.0 87.1 68.9 69.3 257 6,660 6,917 127 5,563 5,690 Senegal DHS 2010-11 29.7 27.3 27.3 * 16.9 16.9 44 5,282 5,326 19 4,085 4,104 Sierra Leone DHS 2008 20.2 9.0 9.2 (19.1) 6.4 6.6 60 3,389 3,448 33 2,692 2,726 Swaziland DHS 2006-07 44.0 31.9 35.7 28.8 13.2 16.3 1,378 3,046 4,424 741 3,022 3,763 Tanzania AIS/MIS 2007-08 43.2 36.2 36.7 30.8 26.2 26.4 541 7,638 8,179 313 6,552 6,865 Uganda AIS 2011 76.5 64.8 65.8 57.3 44.0 44.8 907 9,976 10,883 529 8,144 8,673 Zambia DHS 2007 45.4 33.9 35.8 28.3 18.9 20.0 885 4,614 5,502 606 4,336 4,942 Zimbabwe DHS 2010-11 71.0 55.9 58.6 51.4 34.2 36.3 1,295 6,018 7,313 769 5,481 6,250
Note: An asterisk denotes a figure based on fewer than 25 unweighted cases that has been suppressed. Figures in parentheses are based on 25-49 unweighted cases. 1 Among those who consented to DHS serotesting only. ‘Tested' means the respondent reported ever obtaining an HIV test and receiving the results of the most recent test. DHS serostatus testing is not included in the definition of tested. 2 Total includes a small number of cases with indeterminant results 3 Benin HIV data are restricted; numbers are from the country's final report (unable to check unweighted cases as a result).

57
Figure 6.3 Uptake of HIV testing among women by serostatus
0 10 20 30 40 50 60 70 80 90 100
Rwanda DHS 2010
Malawi DHS 2010
Uganda AIS 2011
Kenya DHS 2008-09
Ethiopia DHS 2011
Zimbabwe DHS 2010-11
Lesotho DHS 2009
Cameroon DHS 2011
Burundi DHS 2010
Zambia DHS 2007
Swaziland DHS 2006-07
Mozambique AIS 2009
Tanzania AIS/MIS 2007-08
Burkina Faso DHS 2010
Congo (Brazzaville) AIS 2009
Senegal DHS 2010-11
Benin DHS 2006
Sierra Leone DHS 2008
Cote d'Ivoire AIS 2005
Mali DHS 2006
Ghana DHS 2003
D.R. Congo DHS 2007
Liberia DHS 2007
Guinea DHS 2005
Niger DHS 2006
Percent ever tested for HIV
HIV-negative
HIV-positive
Percentage of women ages 15-49 who have ever been tested1 for HIV by serostatus
‡
1 'Tested' means the respondent reported ever obtaining an HIV test and receiving the results of the most recent test. DHS serostatus testing is not included in the definition of tested. See Table 6.1 for additional notes. ‡ Based on 25-49 unw eighted cases

58
Figure 6.4 Uptake of HIV testing among men by serostatus
0 10 20 30 40 50 60 70 80 90 100
Rwanda DHS 2010
Malawi DHS 2010
Uganda AIS 2011
Kenya DHS 2008-09
Ethiopia DHS 2011
Zimbabwe DHS 2010-11
Lesotho DHS 2009
Cameroon DHS 2011
Burundi DHS 2010
Zambia DHS 2007
Swaziland DHS 2006-07
Mozambique AIS 2009
Tanzania AIS/MIS 2007-08
Burkina Faso DHS 2010
Congo (Brazzaville) AIS 2009
Senegal DHS 2010-11
Benin DHS 2006
Sierra Leone DHS 2008
Cote d'Ivoire AIS 2005
Mali DHS 2006
Ghana DHS 2003
D.R. Congo DHS 2007
Liberia DHS 2007
Guinea DHS 2005
Niger DHS 2006
Percent ever tested for HIV
HIV-negative
HIV-positive
Percentage of men ages 15-49 who have ever been tested1 for HIV by serostatus
‡
‡
‡
‡
‡
‡
1 'Tested' means the respondent reported ever obtaining an HIV test and receiving the results of the most recent test. DHS serostatus testing is not included in the definition of tested. See Table 6.1 for additional notes. ‡ Based on 25-49 unw eighted cases‡‡ Based on fewer than 25 unw eighted cases; result suppressed.
‡‡

59
While receipt of an HIV test and the results does not mean that respondents actually know their current HIV status, the higher uptake of testing among HIV-positive women and men may indicate something about individual awareness of risk, or better targeting of testing by policymakers and NGOs. For example, programs for most-at-risk populations may be successfully reaching these groups for HIV testing, while individuals who engage in higher-risk behaviors such as multiple sexual partnerships or paid sex are correctly identifying themselves as at higher risk of HIV infection.
Figure 6.5 Percentage of HIV-positive adults who cannot know their HIV status
0102030405060708090100 0 10 20 30 40 50 60 70 80 90 100
Rwanda DHS 2010
Malawi DHS 2010
Uganda AIS 2011
Kenya DHS 2008-09
Ethiopia DHS 2011
Zimbabwe DHS 2010-11
Lesotho DHS 2009
Cameroon DHS 2011
Burundi DHS 2010
Zambia DHS 2007
Swaziland DHS 2006-07
Mozambique AIS 2009
Tanzania AIS/MIS 2007-08
Burkina Faso DHS 2010
Congo (Brazzaville) AIS 2009
Senegal DHS 2010-11
Benin DHS 2006
Sierra Leone DHS 2008
Cote d'Ivoire AIS 2005
Mali DHS 2006
Ghana DHS 2003
D.R. Congo DHS 2007
Liberia DHS 2007
Guinea DHS 2005
Niger DHS 2006 ‡
‡
‡
‡
‡
‡
‡‡
‡
1 'Tested' means the respondent reported ever obtaining an HIV test and receiving the results of the most recent test. DHS serostatus testing is not included in the definition of tested. See Table 6.1 for additional notes. ‡ Based on 25-49 unw eighted cases‡‡ Based on fewer than 25 unw eighted cases; result suppressed.
Percentage of seropositive adults ages 15-49 w ho have never been tested1 for HIV
Niger DHS 2006
Guinea DHS 2005
Liberia DHS 2007
D.R. Congo DHS 2007
Ghana DHS 2003
Mali DHS 2006
Cote d'Ivoire AIS 2005
Sierra Leone DHS 2008
Benin DHS 2006
Senegal DHS 2010-11
Congo (Brazzaville) AIS 2009
Burkina Faso DHS 2010
Tanzania AIS/MIS 2007-08
Mozambique AIS 2009
Swaziland DHS 2006-07
Zambia DHS 2007
Burundi DHS 2010
Cameroon DHS 2011
Lesotho DHS 2009
Zimbabwe DHS 2010-11
Ethiopia DHS 2011
Kenya DHS 2008-09
Uganda AIS 2011
Malawi DHS 2010
Rwanda DHS 2010
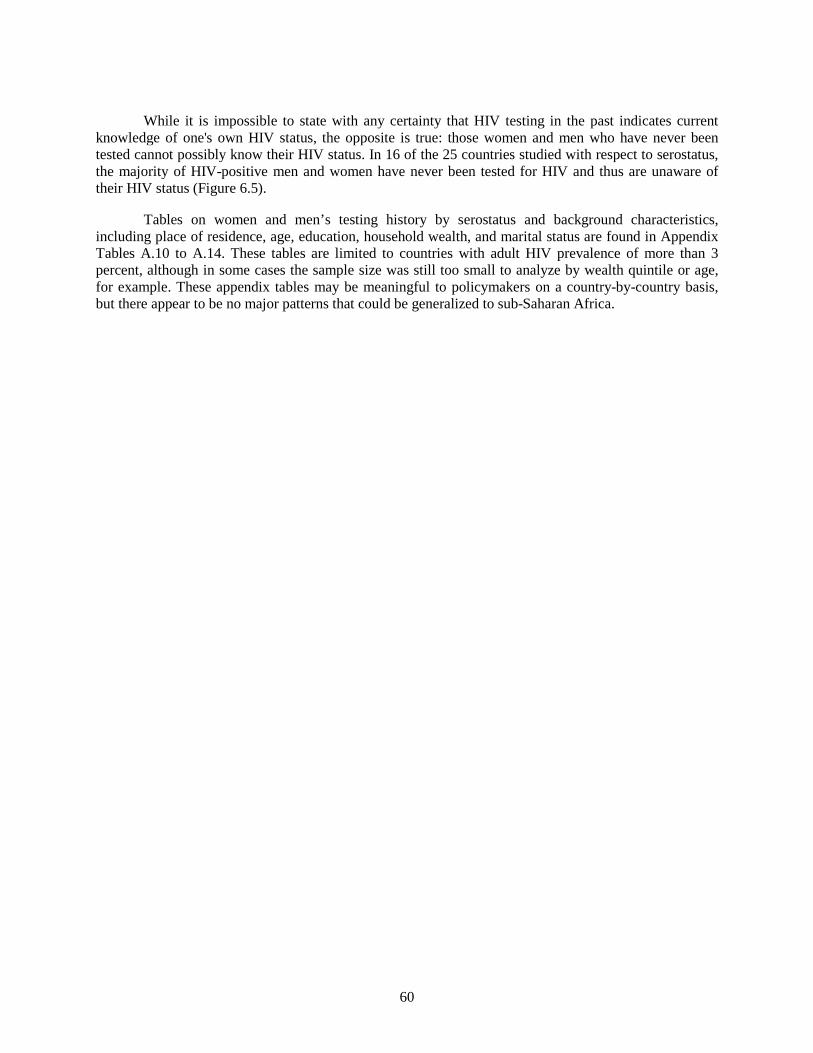
60
While it is impossible to state with any certainty that HIV testing in the past indicates current
knowledge of one's own HIV status, the opposite is true: those women and men who have never been tested cannot possibly know their HIV status. In 16 of the 25 countries studied with respect to serostatus, the majority of HIV-positive men and women have never been tested for HIV and thus are unaware of their HIV status (Figure 6.5).
Tables on women and men’s testing history by serostatus and background characteristics, including place of residence, age, education, household wealth, and marital status are found in Appendix Tables A.10 to A.14. These tables are limited to countries with adult HIV prevalence of more than 3 percent, although in some cases the sample size was still too small to analyze by wealth quintile or age, for example. These appendix tables may be meaningful to policymakers on a country-by-country basis, but there appear to be no major patterns that could be generalized to sub-Saharan Africa.

61
7 Conclusions Regular testing for all adults at risk of HIV is vital to both care and prevention. Lack of
knowledge of HIV status remains a critical barrier to treatment and support. Sub-Saharan Africa, the world region most affected by HIV, has experienced dramatic increases in the uptake of HIV testing over the past decade. Among all 15 countries with more than one DHS or AIS survey, the percent ever tested among women increased dramatically over the survey period, ranging from more than double in Nigeria to more than a ten-fold increase in Madagascar. Among men, the uptake of HIV testing doubled in 12 of 15 countries, with Madagascar experiencing the sharpest increase. Mozambique, Ghana, and Congo-Brazzaville experienced the smallest relative increases in uptake of HIV testing among men (3 percent, 65 percent, and 67 percent, respectively).
In the treatment scale-up era, funding for HIV testing programs has grown dramatically (Amico, Aran, and Avila 2010), and most countries have implemented outreach campaigns. Hence the timing of the DHS or AIS survey is clearly an important factor in the level of HIV testing uptake. As more programs focus on HIV testing, more women and men are likely to be tested. Even a few years can make a difference in survey results.
Disparities in uptake between women and men persist. In the most recent surveys from 22 of 28 countries, men are less likely than women to have ever been tested for HIV. Disparities in recent testing (within the past 12 months) are lower than overall disparities between women and men in testing, which may signal that this pattern is changing.
Among women, increased uptake of HIV testing during antenatal care appears to be an important component of the overall increase in testing. In the median country, women who have given birth in the past two years are 26 percent more likely to have ever been tested for HIV, and the dramatic increase in women’s uptake of HIV testing in at least three countries—Malawi, Tanzania, and Uganda—appears to have been largely driven by increases in testing during ANC.
Urban and rural disparities in HIV testing remain high in most countries. In Madagascar and Nigeria, urban women and men are more than twice as likely to have ever been tested for HIV compared with rural women and men; the same is true among women in Ethiopia and among men in Mozambique. Continuing disparities in testing between urban and rural areas suggest an important frontier for expansion of voluntary counseling and testing programs in many countries.
While universal access to HIV testing is a policy priority, in the treatment scale-up era it is particularly important that testing reach HIV-positive persons so that they may obtain care and support. Although HIV testing rates have increased dramatically over the past 10 years in sub-Saharan Africa, the relationship between national HIV prevalence and HIV testing uptake is relatively weak. Even so, the data show that in every African country where DHS-initiated serostatus testing was conducted, reported testing uptake among HIV-positive adults is higher than among HIV-negative adults. This difference probably reflects a combination of greater awareness of risk among HIV-positive persons and focused targeting on HIV-positive persons by testing programs. Increased efforts to test spouses and partners of people found to be HIV-positive may also contribute to the increased uptake of testing among HIV-positive persons, as these partners are themselves more likely than the average adult to be HIV-positive.
Underlying differences in medical infrastructure, level of funding for HIV programs, and accessibility of rural populations contribute to differences in coverage and disparities in the uptake of HIV testing. The experience of countries such as Rwanda, Malawi, and Uganda, which have been particularly successful at scaling up testing across the population, may be useful models for other countries in sub-Saharan Africa.

62
Overall, gains in the uptake of HIV testing in sub-Saharan Africa have been impressive. Even so, in the median country the majority of women (71 percent) and men (83 percent) have never been tested for HIV. Regular testing for all adults at risk of HIV is an important means of both care and prevention, but those who are unaware that they are living with HIV are of particular concern. HIV-positive adults are more likely to have been tested for HIV than their HIV-negative counterparts in nearly every country surveyed; even so, in the majority of countries surveyed HIV-positive adults have no way of knowing their serostatus, because they have never been tested for HIV.
Continued expansion of voluntary counseling and testing (VCT) services and integrated opportunities to be tested during regular medical care—and, more broadly, an increase in access to healthcare overall—remain policy priorities in sub-Saharan Africa. Treatment as well as prevention is contingent on the identification of seropositive individuals. Scaling up testing, particularly among men, rural residents, and other hard-to-reach populations, remains a critical part of HIV prevention and treatment efforts.

63
Appendix Tables

64
Table A.1 Denominators for tables 3.2-3.3: Number of women and men by place of residence
Women Men Residence Residence
Urban Rural Total Urban Rural Total
Benin DHS 2006 7,360 10,434 17,794 1,992 2,623 4,615 Burkina Faso DHS 2010 4,624 12,463 17,087 1,947 4,553 6,500 Burundi DHS 2010 1,002 8,387 9,389 578 3,181 3,760 Cameroon DHS 2011 3,992 3,465 7,457 3,607 2,847 6,455 Chad DHS 2004 1,289 4,796 6,085 469 1,213 1,682 Congo (Brazzaville) AIS 2009 4,036 2,514 6,550 3,726 2,137 5,863 Cote d’Ivoire AIS 2005 2,454 2,729 5,183 2,115 2,388 4,503 D.R. Congo DHS 2007 4,540 5,455 9,995 1,890 2,426 4,316 Ethiopia DHS 2011 3,947 12,568 16,515 2,882 9,952 12,834 Ghana DHS 2008 2,383 2,533 4,916 1,866 2,191 4,058 Guinea DHS 2005 2,472 5,482 7,954 1,096 1,612 2,709 Kenya DHS 2008-09 2,148 6,296 8,444 866 2,392 3,258 Lesotho DHS 2009 2,573 5,051 7,624 845 2,162 3,008 Liberia DHS 2007 2,998 4,094 7,092 2,426 3,583 6,009 Madagascar DHS 2008-09 1,483 7,064 8,547 1,226 6,419 7,645 Malawi DHS 2010 4,302 18,718 23,020 1,440 5,379 6,818 Mali DHS 2006 4,918 9,665 14,583 1,384 2,321 3,704 Mozambique AIS 2009 1,810 3,864 5,674 1,483 2,685 4,168 Namibia DHS 2006-07 4,772 5,032 9,804 1,962 1,953 3,915 Niger DHS 2006 1,817 7,406 9,223 816 2,285 3,101 Nigeria DHS 2008 11,934 21,451 33,385 5,215 8,593 13,808 Rwanda DHS 2010 2,057 11,614 13,671 939 4,748 5,687 Senegal DHS 2010-11 7,738 7,950 15,688 2,467 1,951 4,417 Sierra Leone DHS 2008 2,655 4,719 7,374 1,123 1,822 2,944 Swaziland DHS 2006-07 1,330 3,657 4,987 1,181 2,975 4,156 Tanzania DHS 2010 2,892 7,247 10,139 693 1,834 2,527 Uganda AIS 2011 2,365 8,795 11,160 1,739 6,995 8,735 Zambia DHS 2007 3,009 4,137 7,146 2,601 3,395 5,995 Zimbabwe DHS 2010-11 3,548 5,623 9,171 2,621 4,488 7,110
Notes: See tables 3.2 and 3.3.
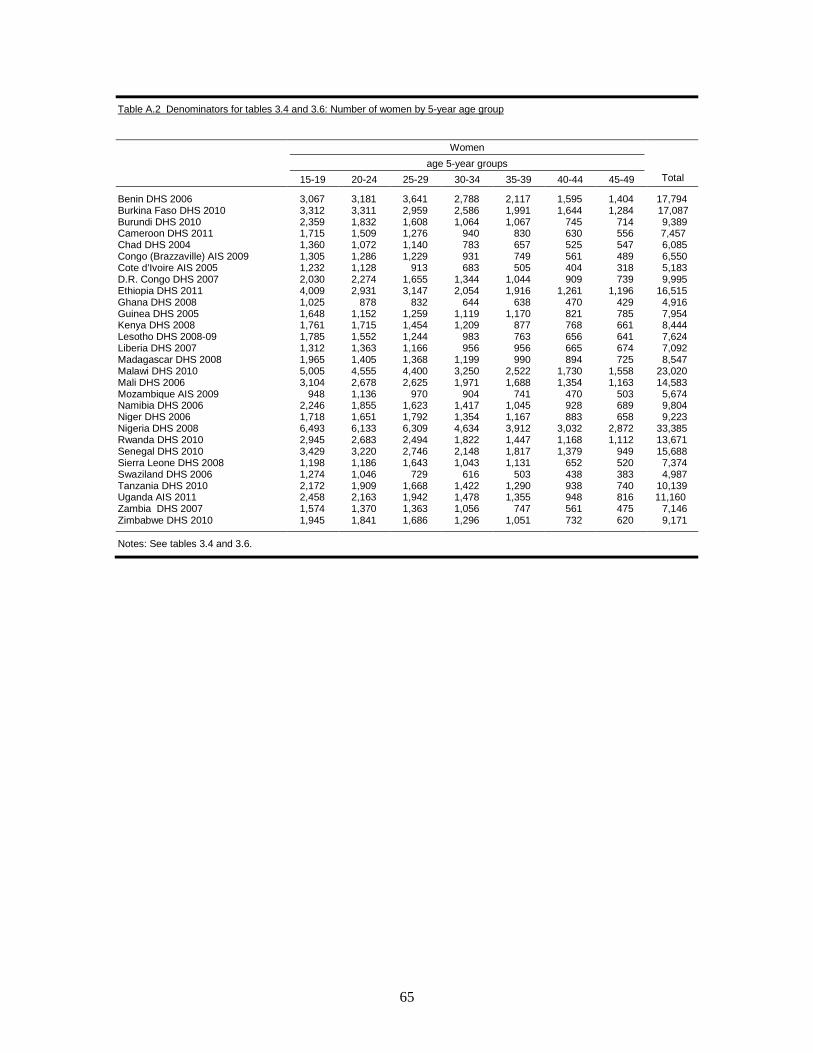
65
Table A.2 Denominators for tables 3.4 and 3.6: Number of women by 5-year age group
Women
Total age 5-year groups
15-19 20-24 25-29 30-34 35-39 40-44 45-49
Benin DHS 2006 3,067 3,181 3,641 2,788 2,117 1,595 1,404 17,794 Burkina Faso DHS 2010 3,312 3,311 2,959 2,586 1,991 1,644 1,284 17,087 Burundi DHS 2010 2,359 1,832 1,608 1,064 1,067 745 714 9,389 Cameroon DHS 2011 1,715 1,509 1,276 940 830 630 556 7,457 Chad DHS 2004 1,360 1,072 1,140 783 657 525 547 6,085 Congo (Brazzaville) AIS 2009 1,305 1,286 1,229 931 749 561 489 6,550 Cote d’Ivoire AIS 2005 1,232 1,128 913 683 505 404 318 5,183 D.R. Congo DHS 2007 2,030 2,274 1,655 1,344 1,044 909 739 9,995 Ethiopia DHS 2011 4,009 2,931 3,147 2,054 1,916 1,261 1,196 16,515 Ghana DHS 2008 1,025 878 832 644 638 470 429 4,916 Guinea DHS 2005 1,648 1,152 1,259 1,119 1,170 821 785 7,954 Kenya DHS 2008 1,761 1,715 1,454 1,209 877 768 661 8,444 Lesotho DHS 2008-09 1,785 1,552 1,244 983 763 656 641 7,624 Liberia DHS 2007 1,312 1,363 1,166 956 956 665 674 7,092 Madagascar DHS 2008 1,965 1,405 1,368 1,199 990 894 725 8,547 Malawi DHS 2010 5,005 4,555 4,400 3,250 2,522 1,730 1,558 23,020 Mali DHS 2006 3,104 2,678 2,625 1,971 1,688 1,354 1,163 14,583 Mozambique AIS 2009 948 1,136 970 904 741 470 503 5,674 Namibia DHS 2006 2,246 1,855 1,623 1,417 1,045 928 689 9,804 Niger DHS 2006 1,718 1,651 1,792 1,354 1,167 883 658 9,223 Nigeria DHS 2008 6,493 6,133 6,309 4,634 3,912 3,032 2,872 33,385 Rwanda DHS 2010 2,945 2,683 2,494 1,822 1,447 1,168 1,112 13,671 Senegal DHS 2010 3,429 3,220 2,746 2,148 1,817 1,379 949 15,688 Sierra Leone DHS 2008 1,198 1,186 1,643 1,043 1,131 652 520 7,374 Swaziland DHS 2006 1,274 1,046 729 616 503 438 383 4,987 Tanzania DHS 2010 2,172 1,909 1,668 1,422 1,290 938 740 10,139 Uganda AIS 2011 2,458 2,163 1,942 1,478 1,355 948 816 11,160 Zambia DHS 2007 1,574 1,370 1,363 1,056 747 561 475 7,146 Zimbabwe DHS 2010 1,945 1,841 1,686 1,296 1,051 732 620 9,171
Notes: See tables 3.4 and 3.6.

66
Table A.3 Denominators for tables 3.5 and 3.7: Number of men by 5-year age group
Men
age 5-year groups 15-19 20-24 25-29 30-34 35-39 40-44 45-49 Total
Benin DHS 2006 1,010 695 752 677 651 460 370 4,615 Burkina Faso DHS 2010 1,437 1,035 952 940 795 713 628 6,500 Burundi DHS 2010 932 732 584 442 388 349 331 3,760 Cameroon DHS 2011 1,591 1,227 1,074 828 697 577 460 6,455 Chad DHS 2004 406 267 293 212 181 172 151 1,682 Congo (Brazzaville) AIS 2009 1,137 938 966 1,001 796 622 402 5,863 Cote d’Ivoire AIS 2005 898 938 806 624 523 385 330 4,503 D.R. Congo DHS 2007 988 869 651 568 483 400 357 4,316 Ethiopia DHS 2011 3,013 2,319 2,297 1,483 1,648 1,121 952 12,834 Ghana DHS 2008 911 704 624 533 528 394 364 4,058 Guinea DHS 2005 664 482 311 307 362 301 281 2,709 Kenya DHS 2008 776 630 483 461 344 306 257 3,258 Lesotho DHS 2008-09 835 634 463 396 290 196 193 3,008 Liberia DHS 2007 1,156 1,039 917 766 830 687 613 6,009 Madagascar DHS 2008 1,711 1,322 1,178 1,068 914 763 689 7,645 Malawi DHS 2010 1,748 1,239 1,099 948 798 529 458 6,818 Mali DHS 2006 876 633 476 497 452 390 380 3,704 Mozambique AIS 2009 901 683 663 629 543 372 377 4,168 Namibia DHS 2006 910 750 702 586 400 331 235 3,915 Niger DHS 2006 620 490 472 425 382 369 343 3,101 Nigeria DHS 2008 2,532 2,378 2,459 2,058 1,794 1,413 1,174 13,808 Rwanda DHS 2010 1,449 1,159 1,038 710 490 430 412 5,687 Senegal DHS 2010 1,170 897 701 545 438 383 284 4,417 Sierra Leone DHS 2008 526 403 446 373 525 336 335 2,944 Swaziland DHS 2006 1,323 886 624 431 367 269 256 4,156 Tanzania DHS 2010 645 414 343 352 300 270 204 2,527 Uganda AIS 2011 2,072 1,406 1,354 1,160 1,129 890 722 8,735 Zambia DHS 2007 1,416 1,066 977 954 717 475 390 5,995 Zimbabwe DHS 2010 1,735 1,372 1,236 970 828 589 379 7,110
Notes: See tables 3.5 and 3.7.

67
Table A.4 Denominators for tables 3.8 and 3.9: Number of women and men by education
Women Men
Education Education No
education Primary Secondary+ Total No
education Primary Secondary+ Total
Benin DHS 2006 11,334 3,550 2,910 17,794 1,523 1,407 1,684 4,615 Burkina Faso DHS 2010 12,642 2,329 2,116 17,087 3,852 1,328 1,319 6,500 Burundi DHS 2010 4,211 4,042 1,136 9,389 1,066 1,891 803 3,760 Cameroon DHS 2011 1,559 2,457 3,441 7,457 533 2,073 3,849 6,455 Chad DHS 2004 4,549 1,144 392 6,085 757 556 368 1,682 Congo (Brazzaville) AIS 2009 390 1,826 4,333 6,550 114 1,086 4,663 5,863 Cote d’Ivoire AIS 2005 2,794 1,373 1,016 5,183 1,532 1,129 1,841 4,503 D.R. Congo DHS 2007 2,081 3,851 4,063 9,995 234 1,262 2,821 4,316 Ethiopia DHS 2011 8,394 6,276 1,845 16,515 3,785 6,813 2,236 12,834 Ghana DHS 2008 1,046 988 2,883 4,916 551 619 2,888 4,058 Guinea DHS 2005 6,162 909 883 7,954 1,304 482 923 2,709 Kenya DHS 2008-09 752 4,798 2,894 8,444 112 1,687 1,459 3,258 Lesotho DHS 2009 93 3,551 3,979 7,624 336 1,467 1,205 3,008 Liberia DHS 2007 3,012 2,334 1,746 7,092 1,059 2,000 2,950 6,009 Madagascar DHS 2008-09 1,637 4,210 2,700 8,547 1,186 3,856 2,602 7,645 Malawi DHS 2010 3,505 14,916 4,599 23,020 422 4,270 2,126 6,818 Mali DHS 2006 11,410 1,668 1,505 14,583 2,146 759 799 3,704 Mozambique AIS 2009 1,673 3,263 737 5,674 439 2,634 1,094 4,168 Namibia DHS 2006-07 651 2,435 6,718 9,804 360 1,108 2,447 3,915 Niger DHS 2006 7,700 963 560 9,223 2,047 574 480 3,101 Nigeria DHS 2008 11,942 6,566 14,878 33,385 2,597 2,761 8,449 13,808 Rwanda DHS 2010 2,119 9,337 2,216 13,671 583 3,916 1,189 5,687 Senegal DHS 2010-11 9,079 3,414 3,195 15,688 1,632 1,261 1,525 4,417 Sierra Leone DHS 2008 4,860 960 1,554 7,374 1,426 414 1,104 2,944 Swaziland DHS 2006-07 402 1,628 2,957 4,987 316 1,450 2,389 4,156 Tanzania DHS 2010 1,940 6,553 1,646 10,139 239 1,710 578 2,527 Uganda AIS 2011 1,566 6,606 2,988 11,160 485 4,957 3,292 8,735 Zambia DHS 2007 744 3,891 2,511 7,146 267 2,775 2,953 5,995 Zimbabwe DHS 2010-11 212 2,568 6,390 9,171 56 1,508 5,546 7,110
Notes: See tables 3.8 and 3.9.

68
Table A.5 Denominators for tables 3.10 and 3.11: Number of women and men by wealth quintile
Women Men
Wealth quintile Wealth quintile
Lowest Second Middle Fourth Highest Total Lowest Second Middle Fourth Highest Total
Benin DHS 2006 3,125 3,227 3,397 3,805 4,240 17,794 714 834 885 1,018 1,164 4,615 Burkina Faso DHS 2010 2,996 3,189 3,252 3,395 4,255 17,087 1,057 1,231 1,183 1,241 1,788 6,500 Burundi DHS 2010 1,898 1,910 1,854 1,811 1,916 9,389 600 700 717 772 970 3,760 Cameroon DHS 2011 1,227 1,325 1,447 1,642 1,816 7,457 987 1,032 1,175 1,465 1,795 6,455 Chad DHS 2004 1,216 1,310 1,100 1,246 1,213 6,085 258 325 308 332 460 1,682 Congo (Brazzaville) AIS 2009 1,403 1,345 1,269 1,251 1,282 6,550 1,123 1,140 1,198 1,236 1,166 5,863 Cote d’Ivoire AIS 2005 885 948 962 1,100 1,287 5,183 755 846 904 943 1,055 4,503 D.R. Congo DHS 2007 1,798 1,967 2,043 1,888 2,300 9,995 769 786 999 806 956 4,316 Ethiopia DHS 2011 2,986 3,041 3,031 3,215 4,242 16,515 2,141 2,362 2,454 2,683 3,194 12,834 Ghana DHS 2008 783 900 979 1,119 1,135 4,916 708 738 699 974 939 4,058 Guinea DHS 2005 1,640 1,508 1,535 1,594 1,677 7,954 446 456 464 518 824 2,709 Kenya DHS 2008-09 1,393 1,483 1,613 1,736 2,220 8,444 457 577 574 725 926 3,258 Lesotho DHS 2009 1,073 1,190 1,325 1,900 2,136 7,624 443 575 666 640 684 3,008 Liberia DHS 2007 1,251 1,332 1,359 1,580 1,569 7,092 1,062 1,181 1,170 1,160 1,437 6,009 Madagascar DHS 2008-09 1,521 1,599 1,576 1,743 2,109 8,547 1,277 1,436 1,456 1,669 1,807 7,645 Malawi DHS 2010 4,268 4,332 4,517 4,515 5,388 23,020 997 1,309 1,367 1,376 1,770 6,818 Mali DHS 2006 2,675 2,803 2,774 2,864 3,467 14,583 663 674 584 785 998 3,704 Mozambique AIS 2009 1,066 1,070 1,095 1,176 1,266 5,674 683 799 843 806 1,038 4,168 Namibia DHS 2006-07 1,621 1,668 1,885 2,292 2,338 9,804 560 607 875 963 911 3,915 Niger DHS 2006 1,755 1,780 1,756 1,906 2,026 9,223 412 553 645 618 873 3,101 Nigeria DHS 2008 6,194 6,234 6,341 6,938 7,678 33,385 2,275 2,332 2,570 3,163 3,468 13,808 Rwanda DHS 2010 2,622 2,661 2,736 2,677 2,976 13,671 854 986 1,139 1,235 1,474 5,687 Senegal DHS 2010-11 2,585 2,805 3,114 3,494 3,689 15,688 665 688 908 1,019 1,137 4,417 Sierra Leone DHS 2008 1,382 1,368 1,428 1,472 1,723 7,374 558 520 530 597 739 2,944 Swaziland DHS 2006-07 785 862 968 1,111 1,262 4,987 601 665 856 953 1,081 4,156 Tanzania DHS 2010 1,681 1,947 1,997 2,112 2,403 10,139 401 447 490 572 618 2,527 Uganda AIS 2011 1,894 2,024 2,056 2,292 2,894 11,160 1,504 1,632 1,667 1,706 2,226 8,735 Zambia DHS 2007 1,240 1,283 1,280 1,567 1,776 7,146 1,114 869 1,097 1,381 1,534 5,995 Zimbabwe DHS 2010-11 1,546 1,594 1,681 2,073 2,278 9,171 1,074 1,216 1,371 1,664 1,786 7,110
Notes: See tables 3.10 and 3.11.

69
Table A.6 Denominators for tables 3.12 and 3.13: Number of women and men by marital status
Women Men
Marital Status Marital Status Never
married Currently married
Formerly married Total
Never married
Currently married
Formerly married Total
Benin DHS 2006 3,556 13,403 835 17,794 1,791 2,727 97 4,615 Burkina Faso DHS 2010 2,991 13,563 531 17,087 2,497 3,867 136 6,500 Burundi DHS 2010 3,121 5,421 847 9,389 1,652 2,057 51 3,760 Cameroon DHS 2011 2,109 4,692 655 7,457 3,227 2,958 270 6,455 Chad DHS 2004 873 4,663 549 6,085 649 977 55 1,682 Congo (Brazzaville) AIS 2009 1,788 3,892 870 6,550 2,360 3,008 495 5,863 Cote d’Ivoire AIS 2005 1,674 3,057 452 5,183 2,236 2,000 267 4,503 D.R. Congo DHS 2007 2,432 6,622 941 9,995 1,816 2,279 221 4,316 Ethiopia DHS 2011 4,469 10,287 1,758 16,515 5,600 6,872 363 12,834 Ghana DHS 2008 1,593 2,876 446 4,916 1,936 1,950 172 4,058 Guinea DHS 2005 1,311 6,292 351 7,954 1,161 1,419 129 2,709 Kenya DHS 2008-09 2,634 4,928 881 8,444 1,524 1,592 142 3,258 Lesotho DHS 2009 2,618 4,049 957 7,624 1,691 1,169 148 3,008 Liberia DHS 2007 1,853 4,540 699 7,092 2,274 3,413 319 6,009 Madagascar DHS 2008-09 1,566 5,899 1,081 8,547 2,315 4,906 423 7,645 Mali DHS 2006 1,726 12,365 491 14,583 1,312 2,236 156 3,704 Mozambique AIS 2009 682 4,157 834 5,674 1,255 2,710 203 4,168 Namibia DHS 2006-07 5,673 3,451 678 9,801 2,545 1,205 163 3,914 Niger DHS 2006 916 7,941 366 9,223 1,109 1,923 69 3,101 Nigeria DHS 2008 8,397 23,578 1,409 33,385 6,548 7,018 238 13,808 Rwanda DHS 2010 5,285 6,897 1,489 13,671 2,873 2,699 115 5,687 Senegal DHS 2010-11 4,585 10,347 757 15,688 2,738 1,609 71 4,417 Sierra Leone DHS 2008 1,399 5,525 450 7,374 1,085 1,767 92 2,944 Swaziland DHS 2006-07 2,487 2,062 438 4,987 2,734 1,219 203 4,156 Tanzania DHS 2010 2,540 6,412 1,188 10,139 1,046 1,317 164 2,527 Uganda AIS 2011 2,641 7,097 1,422 11,160 3,227 4,994 514 8,735 Zambia DHS 2007 1,856 4,402 888 7,146 2,553 3,168 274 5,995 Zimbabwe DHS 2010-11 2,197 5,703 1,271 9,171 3,221 3,584 304 7,110
Notes: See tables 3.12 and 3.13.

70
Table A.7 Denominators for tables 3.14 and 3.15: Number of women and men by sexual activity
Women Men Never
had sex Ever
had sex Total* Never
had sex Ever
had sex Total*
Benin DHS 2006 1,786 15,993 17,794 744 3,863 4,615 Burkina Faso DHS 2010 2,122 14,952 17,087 1,460 5,038 6,500 Burundi DHS 2010 2,742 6,643 9,389 1,230 2,526 3,760 Cameroon DHS 2011 1,018 6,434 7,457 1,243 5,193 6,455 Chad DHS 2004 801 5,283 6,085 358 1,323 1,682 Congo (Brazzaville) AIS 2009 405 6,113 6,550 478 5,358 5,863 Cote d’Ivoire AIS 2005 476 4,696 5,183 552 3,944 4,503 D.R. Congo DHS 2007 1,195 8,791 9,995 601 3,706 4,316 Ethiopia DHS 2011 4,169 12,328 16,515 4,598 8,225 12,834 Ghana DHS 2008 774 4,140 4,916 953 3,101 4,058 Guinea DHS 2005 741 7,194 7,954 394 2,309 2,709 Kenya DHS 2008-09 1,410 7,028 8,444 529 2,729 3,258 Lesotho DHS 2009 1,123 6,501 7,624 409 2,598 3,008 Liberia DHS 2007 365 6,686 7,092 671 5,323 6,009 Madagascar DHS 2008-09 1,005 7,537 8,547 1,147 6,493 7,645 Malawi DHS 2010 3,123 19,875 23,020 999 5,810 6,818 Mali DHS 2006 1,549 13,006 14,583 954 2,740 3,704 Mozambique AIS 2009 254 5,399 5,674 353 3,813 4,168 Namibia DHS 2006-07 1,590 8,147 9,804 533 3,355 3,915 Niger DHS 2006 881 8,314 9,223 818 2,267 3,101 Nigeria DHS 2008 4,686 28,572 33,385 3,370 10,393 13,808 Rwanda DHS 2010 4,097 9,568 13,671 1,734 3,950 5,687 Senegal DHS 2010-11 4,087 11,601 15,688 1,679 2,739 4,417 Sierra Leone DHS 2008 475 6,857 7,374 383 2,548 2,944 Swaziland DHS 2006-07 880 4,102 4,987 1,276 2,876 4,156 Tanzania DHS 2010 1,403 8,736 10,139 483 2,044 2,527 Uganda AIS 2011 1,440 9,720 11,160 1,563 7,171 8,735 Zambia DHS 2007 952 6,188 7,146 969 5,021 5,995 Zimbabwe DHS 2010-11 1,661 7,510 9,171 1,794 5,316 7,110
*Total includes missings
Notes: See tables 3.14 and 3.15.
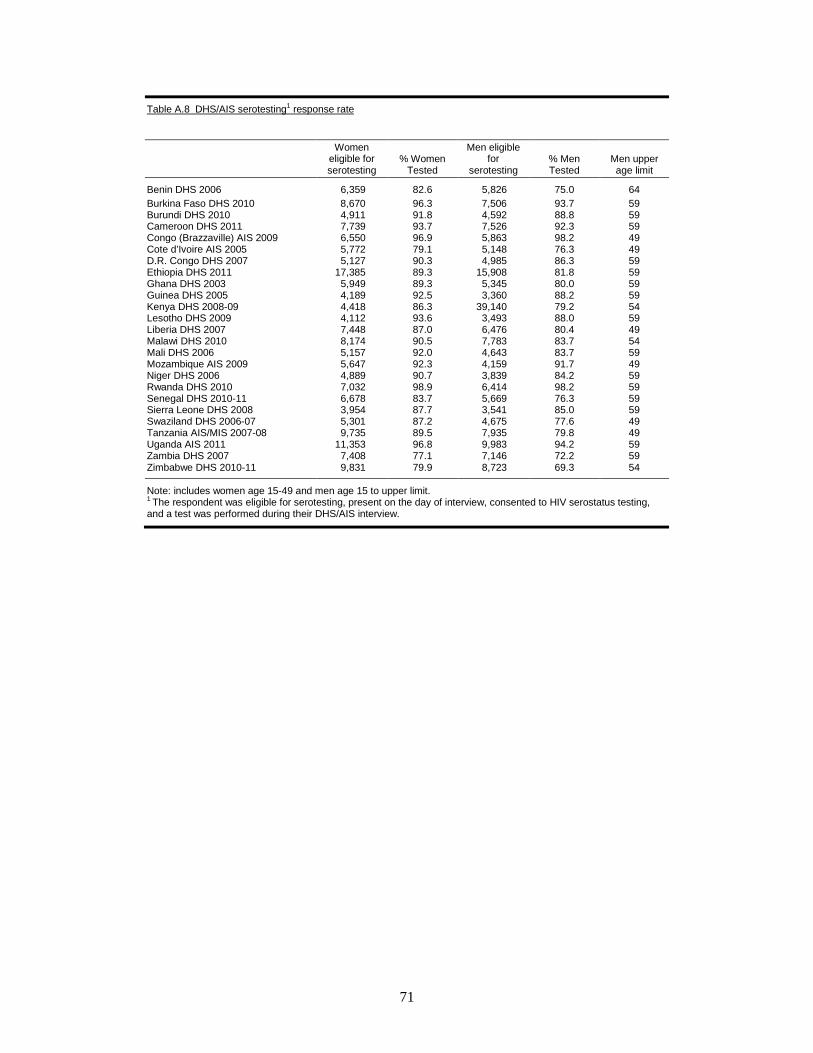
71
Table A.8 DHS/AIS serotesting1 response rate
Women eligible for serotesting
% Women Tested
Men eligible for
serotesting % Men Tested
Men upper age limit
Benin DHS 2006 6,359 82.6 5,826 75.0 64 Burkina Faso DHS 2010 8,670 96.3 7,506 93.7 59 Burundi DHS 2010 4,911 91.8 4,592 88.8 59 Cameroon DHS 2011 7,739 93.7 7,526 92.3 59 Congo (Brazzaville) AIS 2009 6,550 96.9 5,863 98.2 49 Cote d’Ivoire AIS 2005 5,772 79.1 5,148 76.3 49 D.R. Congo DHS 2007 5,127 90.3 4,985 86.3 59 Ethiopia DHS 2011 17,385 89.3 15,908 81.8 59 Ghana DHS 2003 5,949 89.3 5,345 80.0 59 Guinea DHS 2005 4,189 92.5 3,360 88.2 59 Kenya DHS 2008-09 4,418 86.3 39,140 79.2 54 Lesotho DHS 2009 4,112 93.6 3,493 88.0 59 Liberia DHS 2007 7,448 87.0 6,476 80.4 49 Malawi DHS 2010 8,174 90.5 7,783 83.7 54 Mali DHS 2006 5,157 92.0 4,643 83.7 59 Mozambique AIS 2009 5,647 92.3 4,159 91.7 49 Niger DHS 2006 4,889 90.7 3,839 84.2 59 Rwanda DHS 2010 7,032 98.9 6,414 98.2 59 Senegal DHS 2010-11 6,678 83.7 5,669 76.3 59 Sierra Leone DHS 2008 3,954 87.7 3,541 85.0 59 Swaziland DHS 2006-07 5,301 87.2 4,675 77.6 49 Tanzania AIS/MIS 2007-08 9,735 89.5 7,935 79.8 49 Uganda AIS 2011 11,353 96.8 9,983 94.2 59 Zambia DHS 2007 7,408 77.1 7,146 72.2 59 Zimbabwe DHS 2010-11 9,831 79.9 8,723 69.3 54
Note: includes women age 15-49 and men age 15 to upper limit. 1 The respondent was eligible for serotesting, present on the day of interview, consented to HIV serostatus testing, and a test was performed during their DHS/AIS interview.
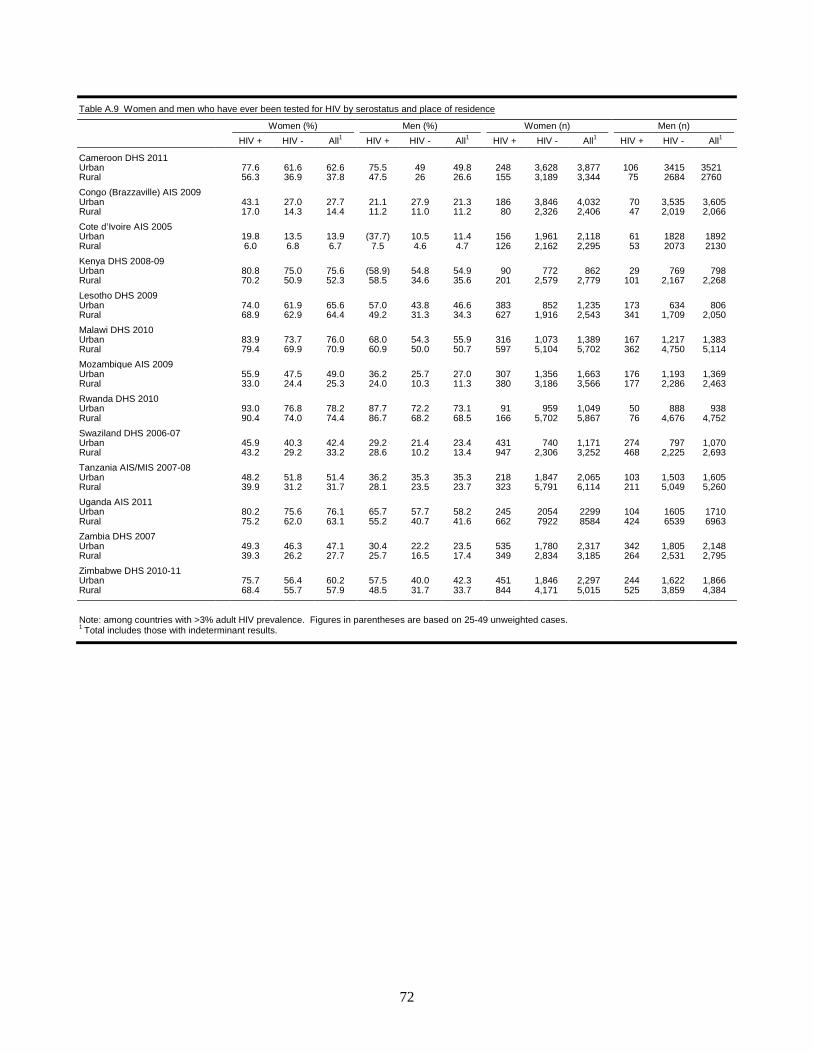
72
Table A.9 Women and men who have ever been tested for HIV by serostatus and place of residence
Women (%) Men (%) Women (n) Men (n)
HIV + HIV - All1 HIV + HIV - All1 HIV + HIV - All1 HIV + HIV - All1
Cameroon DHS 2011 Urban 77.6 61.6 62.6 75.5 49 49.8 248 3,628 3,877 106 3415 3521 Rural 56.3 36.9 37.8 47.5 26 26.6 155 3,189 3,344 75 2684 2760 Congo (Brazzaville) AIS 2009 Urban 43.1 27.0 27.7 21.1 27.9 21.3 186 3,846 4,032 70 3,535 3,605 Rural 17.0 14.3 14.4 11.2 11.0 11.2 80 2,326 2,406 47 2,019 2,066
Cote d’Ivoire AIS 2005 Urban 19.8 13.5 13.9 (37.7) 10.5 11.4 156 1,961 2,118 61 1828 1892 Rural 6.0 6.8 6.7 7.5 4.6 4.7 126 2,162 2,295 53 2073 2130
Kenya DHS 2008-09 Urban 80.8 75.0 75.6 (58.9) 54.8 54.9 90 772 862 29 769 798 Rural 70.2 50.9 52.3 58.5 34.6 35.6 201 2,579 2,779 101 2,167 2,268 Lesotho DHS 2009 Urban 74.0 61.9 65.6 57.0 43.8 46.6 383 852 1,235 173 634 806 Rural 68.9 62.9 64.4 49.2 31.3 34.3 627 1,916 2,543 341 1,709 2,050
Malawi DHS 2010 Urban 83.9 73.7 76.0 68.0 54.3 55.9 316 1,073 1,389 167 1,217 1,383 Rural 79.4 69.9 70.9 60.9 50.0 50.7 597 5,104 5,702 362 4,750 5,114 Mozambique AIS 2009 Urban 55.9 47.5 49.0 36.2 25.7 27.0 307 1,356 1,663 176 1,193 1,369 Rural 33.0 24.4 25.3 24.0 10.3 11.3 380 3,186 3,566 177 2,286 2,463
Rwanda DHS 2010 Urban 93.0 76.8 78.2 87.7 72.2 73.1 91 959 1,049 50 888 938 Rural 90.4 74.0 74.4 86.7 68.2 68.5 166 5,702 5,867 76 4,676 4,752
Swaziland DHS 2006-07 Urban 45.9 40.3 42.4 29.2 21.4 23.4 431 740 1,171 274 797 1,070 Rural 43.2 29.2 33.2 28.6 10.2 13.4 947 2,306 3,252 468 2,225 2,693 Tanzania AIS/MIS 2007-08 Urban 48.2 51.8 51.4 36.2 35.3 35.3 218 1,847 2,065 103 1,503 1,605 Rural 39.9 31.2 31.7 28.1 23.5 23.7 323 5,791 6,114 211 5,049 5,260
Uganda AIS 2011 Urban 80.2 75.6 76.1 65.7 57.7 58.2 245 2054 2299 104 1605 1710 Rural 75.2 62.0 63.1 55.2 40.7 41.6 662 7922 8584 424 6539 6963 Zambia DHS 2007 Urban 49.3 46.3 47.1 30.4 22.2 23.5 535 1,780 2,317 342 1,805 2,148 Rural 39.3 26.2 27.7 25.7 16.5 17.4 349 2,834 3,185 264 2,531 2,795
Zimbabwe DHS 2010-11 Urban 75.7 56.4 60.2 57.5 40.0 42.3 451 1,846 2,297 244 1,622 1,866 Rural 68.4 55.7 57.9 48.5 31.7 33.7 844 4,171 5,015 525 3,859 4,384
Note: among countries with >3% adult HIV prevalence. Figures in parentheses are based on 25-49 unweighted cases. 1 Total includes those with indeterminant results.

73
Table A.10 Women and men who have ever been tested for HIV by serostatus and 5-year age group
Women (%) Men (%) Women (n) Men (n)
HIV + HIV - All1 HIV + HIV - All1 HIV + HIV - All1 HIV + HIV - All1 Cameroon DHS 2011
15-19 (57.4) 27.7 28.3 * 12.6 12.6 34 1614 1647 6 1545 1551 20-24 68.8 58.9 59.3 * 38.1 37.8 50 1420 1470 8 1195 1203 25-29 64.0 63.5 63.5 (85.2) 52.6 53.6 95 1155 1250 32 1014 1045 30-34 82.9 61.3 62.9 (65.4) 55.0 55.6 66 838 903 43 763 807 35-39 72.2 55.4 57.1 (64.2) 52.6 53.2 81 727 808 40 645 685 40-44 70.5 46.3 48.1 (76.9) 44.6 46.1 43 567 612 26 521 547 45-49 (63.7) 43.0 44.3 (52.9) 47.2 47.6 34 497 531 28 417 445
Congo (Brazzaville) AIS 2009 15-19 * 10.4 10.2 * 0.0 3.8 24 1,251 1,275 1,087 9 1,096 20-24 (33.4) 25.0 25.2 * 34.8 12.6 37 1,231 1,268 899 6 905 25-29 (49.2) 28.8 29.8 * 28.8 20.5 64 1,169 1,233 924 16 940 30-34 (55.5) 28.1 29.6 * 30.9 23.7 50 851 901 953 18 971 35-39 (18.8) 26.5 26.3 * 12.7 24.7 34 698 733 757 16 773 40-44 (38.4) 18.1 19.2 (24.6) 23.4 24.5 30 518 549 563 34 597 45-49 * 17.1 17.1 * 14.0 21.3 27 452 480 371 18 389
Cote d’Ivoire AIS 2005 15-19 * 3.4 3.4 * 2.8 2.8 4 1058 1065 2 804 807 20-24 (15.4) 11.3 11.5 * 4.7 4.6 44 933 979 3 893 899 25-29 18.7 15.4 15.6 * 10.9 11.3 59 723 785 23 726 749 30-34 8.7 12.7 12.1 * 8.9 11.5 84 476 560 29 490 519 35-39 (23.0) 12.6 13.4 * 15.7 15.3 35 384 420 22 417 440 40-44 (1.1) 12.2 11.2 * 7.2 7.6 29 307 336 22 291 313 45-49 (18.0) 4.5 5.9 * 5.6 5.5 28 241 269 14 282 296
Kenya DHS 2008-09 15-19 (58.2) 27.1 27.9 * 22.1 22.3 21 729 750 6 763 769 20-24 82.3 68.7 69.6 * 42.0 42.0 47 682 729 9 577 585 25-29 89.0 75.0 76.5 * 55.5 56.3 67 576 643 29 421 450 30-34 74.1 73.1 73.2 (61.8) 48.1 49.0 56 450 506 30 413 444 35-39 (61.1) 61.5 61.5 (51.4) 51.8 51.8 32 332 364 30 257 287 40-44 (70.4) 50.0 52.9 * 43.4 44.1 49 295 344 17 276 292 45-49 (41.8) 39.2 39.3 * 32.4 34.0 20 286 306 10 230 240
Lesotho DHS 2009
15-19 (48.4) 39.9 40.3 * 18.9 18.9 37 845 882 23 790 813 20-24 74.7 75.8 75.5 (44.6) 35.6 36.2 191 601 792 35 563 598 25-29 75.2 80.6 78.7 42.7 46.1 45.5 206 376 582 82 362 444 30-34 65.6 74.7 71.0 59.4 37.9 46.5 197 287 485 150 223 372 35-39 76.9 74.6 75.6 43.0 52.2 48.9 170 232 401 96 175 271 40-44 64.2 61.2 62.3 69.5 56.9 61.8 118 208 326 70 108 178 45-49 70.4 56.1 60.3 55.7 48.0 50.5 92 219 311 58 122 180
Malawi DHS 2010 15-19 56.2 41.4 42.0 * 31.1 31.1 64 1,481 1,545 22 1,681 1,703 20-24 79.0 84.7 84.3 (57.0) 58.9 58.9 89 1,311 1,401 33 1,143 1,176 25-29 87.2 86.4 86.5 58.7 66.2 65.6 190 1,217 1,407 72 967 1,040 30-34 82.3 81.5 81.7 60.0 58.7 58.9 194 741 937 95 791 885 35-39 86.9 78.1 80.2 69.9 54.8 57.5 192 614 806 137 619 756 40-44 77.4 73.8 74.5 68.5 51.4 55.0 109 424 533 105 402 507 45-49 75.1 48.2 52.5 64.4 51.4 53.3 74 388 462 64 365 429
Mozambique AIS 2009
15-19 46.7 25.4 27.0 (21.7) 8.8 9.2 63 816 879 23 820 843 20-24 37.9 44.3 43.4 (36.2) 23.1 23.8 152 900 1,052 32 600 632 25-29 43.9 40.2 40.8 22.4 21.6 21.7 150 743 894 71 539 610 30-34 58.6 31.8 35.9 33.3 20.1 21.9 127 702 829 77 494 571 35-39 38.6 24.0 25.9 34.8 10.3 13.8 90 584 674 71 427 497 40-44 27.9 22.7 23.4 (27.9) 11.5 13.5 56 374 430 42 296 339 45-49 38.3 16.3 18.5 (31) 12.4 14.4 48 424 472 37 303 340
Rwanda DHS 2010 15-19 * 42.5 42.9 * 37.0 37.1 12 1,520 1,532 4 1,446 1,450 20-24 (93.2) 75.5 75.9 * 64.4 64.4 33 1,339 1,372 5 1,153 1,158 25-29 (90.2) 90.2 90.2 * 86.5 86.4 50 1,220 1,270 18 1,019 1,037 30-34 (93.5) 91.8 91.8 (92.7) 89.3 89.5 37 843 881 25 685 710 35-39 94.6 89.6 90.0 * 86.5 86.8 57 658 715 19 474 493 40-44 (87.7) 82.4 82.7 (94.5) 84.5 85.3 37 575 612 32 397 430 45-49 (86.7) 71.2 72.1 (78.3) 80.6 80.5 31 503 534 23 390 413
Swaziland DHS 2006-07
15-19 22.7 14.8 15.6 * 2.8 2.7 116 1,036 1,152 24 1,247 1,271 20-24 45.2 41.3 42.8 19.3 11.0 12.1 354 568 922 96 684 780 25-29 48.4 47.0 47.7 26.7 24.6 25.2 319 329 648 153 399 553 30-34 46.8 45.2 45.9 27.8 29.3 28.7 243 294 536 166 214 380 35-39 47.4 43.9 45.2 36.9 26.8 31.3 167 275 441 144 177 321 40-44 42.4 34.1 36.4 35.3 27.4 30.6 106 276 382 94 137 230 45-49 38.4 30.0 31.8 34.1 26.0 28.3 73 269 342 64 165 229
Continued…

74
Table A.10—Continued
Women (%) Men (%) Women (n) Men (n)
HIV + HIV - All1 HIV + HIV - All1 HIV + HIV - All1 HIV + HIV - All1 Tanzania AIS/MIS 2007-08
15-19 * 21.6 21.5 * 12.8 12.7 23 1,733 1,756 13 1,803 1,815 20-24 47.5 45.6 45.7 * 28.0 28.0 96 1,434 1,530 19 1,106 1,125 25-29 52.9 49.3 49.6 (30.9) 34.4 34.2 112 1,311 1,423 49 921 970 30-34 43.2 41.1 41.3 (20.4) 34.9 33.8 121 1,043 1,164 71 884 955 35-39 41.7 38.0 38.4 34.0 32.8 32.9 95 912 1,007 85 721 806 40-44 (48.2) 30.9 32.2 (37.3) 27.3 28.0 51 617 668 41 573 615 45-49 (23.3) 21.2 21.4 * 28.8 29.9 43 587 630 35 545 580
Uganda AIS 2011 15-19 55.1 40.3 40.7 (38.3) 20.2 20.5 71 2323 2393 35 2020 2055 20-24 76.8 77.5 77.4 (54.7) 45.4 45.7 149 1962 2111 39 1356 1396 25-29 81.8 80.7 80.8 54.7 58.1 58.0 185 1711 1897 54 1295 1350 30-34 77.4 72.5 73.1 59.1 56.1 56.4 158 1276 1434 104 1040 1144 35-39 80.1 69.3 70.6 59.0 53.0 53.7 161 1165 1326 124 999 1123 40-44 77.2 63.6 65.1 51.3 51.5 51.5 99 823 921 99 784 883 45-49 73.2 52.4 54.6 72.5 44.9 47.7 84 717 801 74 649 723
Zambia DHS 2007
15-19 34.9 21.5 22.3 (9.1) 9.3 9.3 69 1,133 1,202 42 1,120 1,162 20-24 53.5 40.0 41.6 (31.7) 21.1 21.7 120 901 1,023 45 821 865 25-29 46.5 42.6 43.4 32.9 24.5 25.5 211 847 1,058 91 705 796 30-34 44.2 39.4 40.6 28.8 23.6 24.5 213 606 819 135 653 788 35-39 43.4 36.5 38.2 31.1 20.0 22.5 146 440 586 136 472 608 40-44 47.3 34.8 37.3 26.2 18.7 20.5 81 362 445 99 311 410 45-49 43.1 23.6 25.9 28.5 23.3 24.3 45 324 369 58 255 313
Zimbabwe DHS 2010-11
15-19 47.0 25.2 26.2 15.6 10.4 10.5 66 1,487 1,553 53 1,516 1,569 20-24 72.6 67.3 67.9 (42.0) 34.1 34.4 155 1,309 1,463 46 1,158 1,204 25-29 76.6 76.3 76.4 43.9 47.8 47.4 272 1,082 1,354 112 970 1,082 30-34 73.8 69.4 70.7 44.8 48.9 48.2 293 717 1,010 146 697 844 35-39 70.4 62.7 65.0 59.0 43.3 47.2 246 598 843 179 533 712 40-44 68.3 54.4 57.9 59.7 48.0 51.0 151 438 589 132 374 506 45-49 66.7 44.6 49.6 68.0 45.3 52.1 113 388 501 100 233 333
Note: among countries with >3% adult HIV prevalence. An asterisk denotes a figure based on fewer than 25 unweighted cases that has been suppressed. Figures in parentheses are based on 25-49 unweighted cases. 1 Total includes those with indeterminant results.

75
Table A.11 Women and men who have ever been tested for HIV by serostatus and education
Women (%) Men (%) Women (n) Men (n)
HIV + HIV - All1 HIV + HIV - All1 HIV + HIV - All1 HIV + HIV - All1 Cameroon DHS 2011
no education (36.0) 18.5 19.0 * 7.3 7.8 42 1456 1498 9 500 508 primary 63.7 50.8 51.7 56.4 27.3 28.2 159 2231 2392 62 1953 2015 secondary + 81.0 64.1 65.1 70.3 49.4 50.0 201 3130 3331 111 3648 3759
Congo (Brazzaville) AIS 2009
no education * 11.5 11.3 * 0.0 8.7 13 356 369 105 1 106 primary (30.4) 13.0 13.7 (7.7) 23.0 8.0 62 1,727 1,790 1,040 18 1,058 secondary + 38.9 27.0 27.5 20.0 21.0 20.1 190 4,089 4,279 4,410 98 4,507
Cote d’Ivoire AIS 2005
no education 4.0 6.1 6.0 (4.6) 3.6 3.6 123 2228 2351 38 1254 1294 primary 15.7 12.6 12.8 * 5.8 6.0 102 1133 1239 17 1032 1050 secondary + (30.5) 17.3 18.2 (38.1) 11.4 12.3 58 763 823 60 1615 1680
Kenya DHS 2008 no education * 42.0 42.2 * 14.1 18.5 19 300 319 5 93 98 primary 73.5 54.4 56.1 52.2 30.4 31.4 186 1,888 2,073 78 1,523 1,602 secondary + (79.7) 63.5 64.6 (65.1) 52.6 53.0 86 1,163 1,249 47 1,320 1,366
Lesotho DHS 2009 no education 72.9 56.7 60.0 40.8 32.4 34.7 9 35 44 89 234 322 primary 68.1 61.1 63.2 47.8 28.5 31.9 539 1,249 1,788 242 1,155 1,397 secondary + 73.9 64.0 66.4 62.3 42.8 45.9 462 1,484 1,946 183 954 1,137
Malawi DHS 2010 no education (76.6) 67.9 69.1 (58.7) 31.6 34.4 154 942 1,096 43 352 397 primary 78.7 69.4 70.5 59.9 44.9 46.0 530 4,038 4,569 311 3,741 4,052 secondary + 89.2 76.6 78.6 69.9 66.4 66.7 229 1,197 1,426 174 1,875 2,049
Mozambique AIS 2009 no education (34.2) 22.8 23.9 (3.4) 5.6 5.5 150 1,380 1,530 28 360 388 primary 40.6 30.1 31.6 25.5 10.1 11.5 436 2,589 3,025 223 2,212 2,435 secondary + 67.3 57.4 58.9 47.3 33.0 34.4 101 574 675 102 907 1,009
Rwanda DHS 2010 no education * 76.9 77.4 * 74.0 74.3 44 1,011 1,055 17 566 583 primary 90.9 73.0 73.6 91.0 66.5 67.1 160 4,582 4,742 82 3,840 3,922 secondary + * 77.8 78.6 (76.9) 74.0 74.1 52 1,067 1,119 27 1,158 1,185
Swaziland DHS 2006-07 no education 37.4 23.6 29.0 28.4 13.0 17.8 142 220 362 88 196 284 primary 40.0 27.9 32.0 23.6 7.0 10.0 500 979 1,480 242 1,096 1,338 secondary + 48.0 35.0 38.7 32.0 17.1 20.0 735 1,847 2,582 411 1,730 2,141
Tanzania AIS/MIS 2007-08
no education (22.6) 25.0 24.8 (20.4) 16.0 16.2 104 1,623 1,728 44 757 801 primary 47.1 38.0 38.6 29.9 24.5 24.7 399 5,282 5,681 235 4,816 5,051 secondary + * 48.6 49.1 * 42.4 42.6 38 733 771 34 979 1,014
Uganda AIS 2011
no education 68.3 58.1 59.0 (28.0) 33.1 32.7 144 1377 1521 40 436 476 primary 75.9 63.1 64.2 54.1 37.0 38.2 577 5880 6457 329 4603 4933 secondary + 85.0 72.1 72.9 71.5 55.9 56.7 186 2719 2905 159 3105 3265
Zambia DHS 2007
no education * 25.2 25.3 * 13.7 14.0 60 489 549 16 194 210 primary 43.1 30.0 32.2 24.9 12.6 13.9 463 2,471 2,937 246 2,001 2,247 secondary + 51.4 42.4 44.0 31.3 25.2 26.0 362 1,654 2,016 343 2,142 2,485
Zimbabwe DHS 2010-11
no education * 45.0 47.0 * 14.6 14.5 26 142 168 8 42 50 primary 59.2 52.0 53.5 36.7 22.7 24.6 434 1,722 2,156 190 1,212 1,402 secondary + 77.5 57.9 61.2 56.8 37.7 39.9 835 4,153 4,989 570 4,227 4,798
Note: among countries with >3% adult HIV prevalence. An asterisk denotes a figure based on fewer than 25 unweighted cases that has been suppressed. Figures in parentheses are based on 25-49 unweighted cases. 1 Total includes those with indeterminant results.

76
Table A.12 Women and men who have ever been tested for HIV by serostatus and wealth quintile
Women (%) Men (%) Women (n) Men (n)
HIV + HIV - All1 HIV + HIV - All1 HIV + HIV - All1 HIV + HIV - All1
Cameroon DHS 2011 poorest (22.4) 15.3 15.5 * 10.1 10.3 30 1150 1180 12 939 951 poorer 59.5 40.3 41.3 (47.7) 26.3 27.1 63 1223 1285 35 972 1007 middle 63.1 51 51.7 (58.6) 37.2 37.8 83 1322 1404 30 1119 1150 richer 79.3 64.8 65.8 (71.8) 46.6 47.4 112 1501 1612 44 1390 1434 richest 82.2 67.4 68.5 (77.3) 57 57.7 115 1623 1739 61 1679 1740
Congo (Brazzaville) AIS 2009 poorest 17.8 11.1 11.3 (8.4) 8.8 8.4 38 1,314 1,351 1,062 28 1,089 poorer 33.4 16.7 17.5 (13.9) 20.7 14.1 65 1,228 1,293 1,084 24 1,108 middle (23.0) 22.7 22.7 (17.7) 13.8 17.6 43 1,238 1,281 1,133 27 1,161 richer (37.2) 27.2 27.6 * 43.6 20.2 52 1,196 1,248 1,177 23 1,200 richest (52.5) 34.6 35.6 * 22.8 27.2 69 1,196 1,265 1,099 14 1,113
Cote d’Ivoire AIS 2005
poorest (10.5) 2.1 2.4 * 2.1 2.0 28 731 760 12 664 676 poorer 0.0 2.6 2.5 (1.7) 3.2 3.1 32 784 819 26 745 772 middle 13.1 11.2 11.3 * 5.5 7.0 54 772 826 35 770 808 richer 6.1 16.1 15.2 * 10.1 9.9 73 838 914 17 792 809 richest 25.0 15.4 16.2 * 13.9 14.8 96 998 1095 25 931 958
Kenya DHS 2008-09
poorest (72.1) 45.1 46.7 * 20.1 20.7 40 618 658 10 410 420 poorer 72.1 46.2 48.5 (34.5) 35.4 35.3 55 565 619 25 525 549 middle (74.3) 52.4 53.9 * 34.8 36.2 41 585 626 24 511 535 richer 67.5 55.7 56.5 (67.6) 40.1 41.6 61 755 815 40 670 710 richest 78.4 75.5 75.8 (64.1) 55.6 55.9 94 828 922 33 820 852
Lesotho DHS 2009 poorest 59.1 57.2 57.6 43.9 29.1 31.5 113 442 554 70 359 429 poorer 70.0 62.6 64.5 45.6 30.5 33.1 163 463 626 97 454 551 middle 72.0 65.9 67.5 52.7 28.8 33.0 185 494 679 111 519 631 richer 75.6 64.2 67.8 54.8 37.5 40.7 299 644 943 108 490 598 richest 70.1 62.3 64.3 57.3 45.5 47.8 251 725 975 128 520 648
Malawi DHS 2010 poorest 77.5 69.4 70.1 57.6 44.9 45.6 107 1,095 1,202 52 878 932 poorer 77.6 68.0 68.9 60.4 46.8 47.7 129 1,262 1,392 82 1,173 1,255 middle 74.9 70.9 71.3 56.3 48.7 49.3 148 1,244 1,393 104 1,195 1,298 richer 79.3 72.8 73.7 66.5 55.5 56.4 188 1,181 1,369 107 1,201 1,308 richest 86.8 71.6 74.6 67.7 55.5 56.8 341 1,394 1,735 184 1,520 1,704
Mozambique AIS 2009 poorest (10.5) 14.8 14.5 (10.4) 4.9 5.2 66 924 989 32 614 646 poorer 30.3 19.7 20.6 (27.5) 7.8 9.0 86 910 997 43 690 734 middle 32.0 30.1 30.3 16.3 10.7 11.1 102 920 1,021 56 710 766 richer 45.6 37.8 39.2 21.7 17.9 18.4 195 869 1,065 92 641 733 richest 59.7 54.5 55.6 47.7 32.4 34.5 238 919 1,157 129 825 954
Rwanda DHS 2010 poorest (90.1) 73.3 73.9 * 65.0 65.2 41 1,211 1,252 17 839 855 poorer (92.7) 71.8 72.5 * 66.1 66.6 43 1,349 1,392 18 968 986 middle (89.8) 73.2 73.6 * 69.3 69.5 35 1,338 1,374 17 1,123 1,140 richer (93.5) 76.5 76.9 (91.2) 69.0 69.5 34 1,350 1,384 27 1,209 1,236 richest 91.0 76.8 77.7 88.0 72.5 73.0 103 1,413 1,515 48 1,424 1,472
Swaziland DHS 2006-07 poorest 36.3 28.9 31.2 18.3 4.6 7.3 225 486 711 111 450 561 poorer 45.0 28.7 33.9 32.1 8.5 13.2 248 526 774 121 486 607 middle 43.7 29.4 33.9 28.3 9.5 12.7 275 599 873 133 652 785 richer 47.3 29.5 35.2 30.3 13.1 16.7 315 676 991 181 671 851 richest 45.8 40.1 41.8 31.8 24.4 25.9 316 759 1,075 196 763 959
Tanzania AIS/MIS 2007-08 poorest 39.6 25.7 26.4 (11.8) 16.1 15.9 76 1,426 1,501 47 1,121 1,168 poorer 32.3 26.4 26.8 (15.8) 21.7 21.5 97 1,358 1,455 50 1,385 1,435 middle 32.8 34.2 34.1 (14.4) 22.7 22.4 81 1,501 1,582 54 1,261 1,315 richer 44.5 39.9 40.2 (59.2) 30.3 31.6 98 1,543 1,641 62 1,301 1,363 richest 54.0 50.4 50.7 38.5 37.3 37.4 189 1,811 2,000 100 1,482 1,582
Uganda AIS 2011 poorest 75.3 62.1 63.0 56.7 39.9 40.8 126 1716 1842 85 1410 1496 poorer 67.9 60.7 61.2 54.2 37.4 38.3 148 1831 1979 82 1544 1627 middle 73.2 58.5 59.6 52.4 39.6 40.4 148 1867 2014 108 1563 1672 richer 80.7 64.2 65.7 49.1 41.9 42.4 207 2034 2241 122 1565 1687 richest 80.4 74.8 75.4 71.5 56.8 57.7 278 2529 2807 130 2062 2193
Zambia DHS 2007 poorest 39.2 22.4 23.9 27.0 12.6 13.6 83 856 939 62 854 916 poorer 33.5 24.3 25.3 18.9 14.4 14.8 95 891 987 68 646 714 middle 39.5 30.3 31.5 31.8 19.0 20.4 129 843 973 95 791 886 richer 46.3 43.9 44.5 27.0 20.5 21.7 273 919 1,193 204 925 1,129 richest 52.4 45.2 46.8 32.2 24.7 25.7 305 1,105 1,410 176 1,121 1,297
Continued…

77
Table A.12—Continued
Women (%) Men (%) Women (n) Men (n)
HIV + HIV - All1 HIV + HIV - All1 HIV + HIV - All1 HIV + HIV - All1
Zimbabwe DHS 2010-11 poorest 63.7 52.4 54.3 46.9 25.4 28.6 236 1,139 1,375 153 887 1,040 poorer 70.2 54.2 56.8 38.0 27.2 28.5 231 1,180 1,411 147 1,053 1,200 middle 70.9 57.9 60.5 46.5 32.1 33.8 290 1,167 1,457 155 1,141 1,296 richer 72.2 60.9 63.1 57.8 37.0 39.4 300 1,226 1,527 160 1,223 1,383 richest 77.4 54.1 57.7 66.8 46.0 48.4 239 1,305 1,544 154 1,177 1,331
Note: among countries with >3% adult HIV prevalence. An asterisk denotes a figure based on fewer than 25 unweighted cases that has been suppressed. Figures in parentheses are based on 25-49 unweighted cases. 1 Total includes those with indeterminant results.

78
Table A.13 Women and men who have ever been tested for HIV by serostatus and marital status
Women (%) Men (%) Women (n) Men (n)
HIV + HIV - All1 HIV + HIV - All1 HIV + HIV - All1 HIV + HIV - All1
Cameroon DHS 2011 never married 62.3 38.5 39.2 (57.7) 28.5 28.8 58 1984 2042 33 3116 3149 currently married 67.2 54.0 54.7 66.5 49.9 50.7 239 4297 4535 133 2732 2866 formerly married 78.4 60.5 63.5 * 47.2 47.6 106 537 644 15 252 268
Congo (Brazzaville) AIS 2009
never married 19.2 15.9 16.1 (9.7) 17.3 9.8 74 1686 1759 26 2248 2274 currently married 37.4 23.7 24.2 23.2 20.8 23.1 125 3684 3810 77 2831 2908 formerly married 48.6 28.4 30 * 29.8 21.1 67 802 869 14 475 489
Cote d’Ivoire AIS 2005
never married 19.8 5.1 5.7 * 5.7 6.0 67 1399 1472 26 2034 2065 currently married 9.3 12.3 12.1 17.6 8.9 9.2 156 2389 2546 62 1650 1713 formerly married 17.9 13.5 14.1 * 12.1 14.8 59 336 395 27 218 245
Kenya DHS 2008-09
never married (65.7) 36.6 37.7 * 32.3 32.7 42 1,091 1,133 22 1447 1469 currently married 76.8 66.9 67.6 60.4 48.2 48.9 143 1,990 2,134 87 1376 1463 formerly married 72.2 59.2 62.9 * 35.3 38.1 106 269 375 22 113 135
Lesotho DHS 2009
never married 67.3 44.5 48.1 34.3 27.0 27.5 205 1,097 1,302 119 1509 1628 currently married 72.8 76.7 75.7 56.7 48.6 51.1 534 1,486 2,020 336 758 1094 formerly married 69.6 56.4 64.2 59.1 50.1 54.0 271 185 456 59 75 134
Malawi DHS 2010
never married 58.6 36.0 36.9 (36.9) 40.6 40.5 59 1,327 1,386 54 2552 2605 currently married 83.0 80.4 80.7 65.5 58.5 59.3 557 4,218 4,775 425 3256 3682 formerly married 81.6 77.7 79.0 (70.4) 59.0 61.8 298 632 931 51 160 210
Mozambique AIS 2009
never married 46.2 24.9 26.7 33.3 14.8 15.6 53 569 622 53 1110 1163 currently married 41.6 32.0 33.0 29.4 15.8 17.2 413 3,422 3,835 260 2223 2483 formerly married 45.5 33.9 37.2 (29.9) 19.1 21.4 221 552 773 39 147 186
Rwanda DHS 2010
never married 85.7 51.0 51.6 * 49.1 49.2 48 2,687 2,735 17 2,857 2,874 currently married 96.2 92.2 92.3 90.6 90.1 90.1 124 3,329 3,453 98 2,603 2,701 formerly married 87.3 80.2 81.0 * 79.9 81.0 85 644 729 11 103 114
Swaziland DHS 2006-07
never married 39.8 23.4 27.7 22.1 8.3 9.7 573 1,640 2,213 250 2271 2520 currently married 45.6 41.7 43.0 33.2 29.1 30.6 589 1,222 1,811 385 674 1059 formerly married 50.9 42.2 46.9 28.9 16.6 23.7 216 183 400 107 77 184
Tanzania AIS/MIS 2007-08
never married (30.9) 23.5 23.7 (9.2) 19.4 19.3 47 1,901 1,948 55 2882 2937 currently married 43.4 40.4 40.6 36.9 31.4 31.7 319 4,916 5,235 218 3382 3600 formerly married 46.3 40.4 41.4 * 32.7 32.1 175 821 996 40 289 328
Uganda AIS 2011
never married 64.7 41.4 42.3 43.1 29.9 30.2 100 2476 2576 64 3130 3195 currently married 76.8 73.4 73.6 59.4 53.3 53.7 502 6422 6924 380 4584 4963 formerly married 79.9 67.8 70.5 58.8 48.5 50.2 306 1078 1384 85 430 515
Zambia DHS 2007
never married 41.4 24.3 25.8 19.4 16.5 16.7 129 1,292 1,421 94 2013 2107 currently married 45.8 37.9 39.1 31.5 20.8 22.5 496 2,878 3,375 420 2187 2607 formerly married 46.5 36.2 40.2 23.1 22.1 22.5 260 445 706 91 137 228
Zimbabwe DHS 2010-11
never married 54.9 24.0 26.3 29.7 20.8 21.1 129 1,565 1,694 114 2732 2845 currently married 71.2 67.4 68.0 55.7 47.6 49.0 737 3,832 4,569 554 2578 3131 formerly married 75.5 65.6 69.6 52.2 45.8 48.2 429 620 1,049 102 172 273
Note: among countries with >3% adult HIV prevalence. An asterisk denotes a figure based on fewer than 25 unweighted cases that has been suppressed. Figures in parentheses are based on 25-49 unweighted cases. 1 Total includes those with indeterminant results.

79
References Amico, P., C. Aran, and C. Avila. 2010. "HIV spending as a share of total health expenditure: An analysis of regional variation in a multi-country study." PLoS ONE 5 (9):e12997.
Amico, P., B. Gobet, C. Avila-Figueroa, C. Aran, and P. De Lay. 2012. "Pattern and levels of spending allocated to HIV prevention programs in low- and middle-income countries." BMC Public Health 12 (221).
Baggaley, R., B. Hensen, O. Ajose, K. Grabbe, V. Wong, A. Schilsky, Y. Lo, F. Lule, R. Granich, and J. Hargreaves. 2012. "From caution to urgency: the evolution of HIV testing and counselling in Africa." Bulletin of the World Health Organization 90 (9):652-658.
Bayer, R., and C. Edington. 2009. "HIV testing, human rights, and global AIDS policy: Exceptionalism and its discontents." Journal of Health Politics, Policy and Law 34 (3):301-323.
Cohen, M.S., Y.Q. Chen, M. McCauley, T. Gamble, M.C. Hosseinipour, N. Kumarasamy, J.G. Hakim, J. Kumwenda, B. Grinsztejn, J.H.S. Pilotto, S.V. Godbole, S. Mehendale, S. Chariyalertsak, B.R. Santos, K.H. Mayer, I.F. Hoffman, S.H. Eshleman, E. Piwowar-Manning, L. Wang, J. Makhema, L.A. Mills, G. de Bruyn, I. Sanne, J. Eron, J. Gallant, D. Havlir, S. Swindells, H. Ribaudo, V. Elharrar, D. Burns, T.E. Taha, K. Nielsen-Saines, D. Celentano, M. Essex, and T.R. Fleming. 2011. "Prevention of HIV-1 infection with early antiretroviral therapy." New England Journal of Medicine 365 (6):493-505.
Commonwealth Regional Health Community Secretariat. 2002. HIV/AIDS voluntary counselling and testing: review of policies, programmes and guidelines in east, central and southern Africa. Arusha, Tanzania: CRHCS. Available at http://www.who.int/hiv/topics/vct/toolkit/components/policy/review_of_policies_programmes_and_guidelines.pdf.
Cremin, I., S. Cauchemez, G.P. Garnett, and S. Gregson. 2012. "Patterns of uptake of HIV testing in sub-Saharan Africa in the pre-treatment era." Tropical Medicine & International Health 17 (8):e26-e37.
De Cock, K.M., R. Bunnell, and J. Mermin. 2006. "Unfinished business—expanding HIV testing in developing countries." New England Journal of Medicine 354 (5):440-442.
Denison, J., K. O’Reilly, G. Schmid, C. Kennedy, and M. Sweat. 2008. "HIV voluntary counseling and testing and behavioral risk reduction in developing countries: A Meta-analysis, 1990–2005." AIDS and Behavior 12 (3):363-373.
Global Commission on HIV and the Law. 2012. Regional Issues Brief: Children, HIV, and the law. New York: UNDP, HIV/AIDS Practice.
Goldberg, A., G. Kombe, and G. Osewe. 2008. VCT Events: Country case studies. Health Systems 20/20. Available at http://pdf.usaid.gov/pdf_docs/PNADN768.pdf.
Görgens-Albino, M., N. Mohammad, D. Blankhart, and O. Odutolu. 2007. The Africa Multi-Country AIDS Program 2000–2006: Results of the World Bank's response to a development crisis. Washington, DC: The World Bank.

80
Granich, R.M., C.F. Gilks, C. Dye, K.M. De Cock, and B.G. Williams. 2009. "Universal voluntary HIV testing with immediate antiretroviral therapy as a strategy for elimination of HIV transmission: a mathematical model." The Lancet 373 (9657):48-57.
Greenwald, J., G. Burstein, J. Pincus, and B. Branson. 2006. "A rapid review of rapid HIV antibody tests." Current Infectious Disease Reports 8 (2):125-131.
Macro International. 1996. Sampling Manual. DHS-III Basic Documention No. 6. Calverton, Maryland, USA: Macro International Inc.
Matovu, J.K.B., and F.E. Makumbi. 2007. "Expanding access to voluntary HIV counselling and testing in sub-Saharan Africa: alternative approaches for improving uptake, 2001–2007." Tropical Medicine & International Health 12 (11):1315-1322.
Rennie, S., and F. Behets. 2006. "Desperately seeking targets: the ethics of routine HIV testing in low-income countries." Bulletin of the World Health Organization 84:52-57.
Rutstein, S.O., and K. Johnson. 2004. The DHS Wealth Index. DHS Comparative Reports No. 6. Calverton, Maryland, USA: ORC Macro.
Tedrow, V.A., J. Denison, C.E. Kennedy, K. O'Reilly, and M. Sweat. 2011. "Voluntary counseling and testing (VCT) for changing HIV-related risk behavior in developing countries." The Cochrane Library.
UNAIDS. 2000. UNAIDS technical update: Voluntary counselling and testing (VCT). UNAIDS Best Practice Collection. Geneva: UNAIDS.
UNAIDS. 2011. World AIDS day report 2011. Geneva, Switzerland: UNAIDS Available at http://www.unaids.org/en/media/unaids/contentassets/documents/unaidspublication/2011/jc2216_worldaidsday_report_2011_en.pdf.
UNFPA, IPPF, and The Global Coalition on Women and AIDS. 2008a. Malawi: Report card on HIV prevention for girls and young women. Available at http://www.unfpa.org/hiv/docs/report-cards/malawi.pdf.
UNFPA, IPPF, and The Global Coalition on Women and AIDS. 2008b. Rwanda: Report card on HIV prevention for girls and young women. Available at http://rwanda.unfpa.org/drive/rwanda_reportcard.pdf.
WHO. 2004. Rapid HIV tests: guidelines for use in HIV testing and counselling services in resource-constrained settings. Geneva: WHO. Available at http://apps.who.int/iris/bitstream/10665/44646/1/9789241501972_eng.pdf.
WHO. 2010. PMTCT strategic vision 2010–2015 : preventing mother-to-child transmission of HIV to reach the UNGASS and Millennium Development Goals. Geneva: WHO. Available at http://www.who.int/hiv/pub/mtct/strategic_vision.pdf.
WHO. 2012. Service delivery approaches to HIV testing and counselling (HTC): a strategic HTC policy framework. Geneva: WHO. Available at http://apps.who.int/iris/bitstream/10665/75206/1/9789241593877_eng.pdf.

81
WHO/UNAIDS/UNICEF. 2010. Towards universal access: Scaling up priority HIV/AIDS interventions in the health sector. Progress Report 2010. Geneva: WHO. Available at http://www.who.int/hiv/pub/progress_report2011/en/index.html.
WHO/UNAIDS/UNICEF. 2011. Global HIV/AIDS response: Epidemic update and health sector progress towards universal access. Progress Report 2011. Available at http://www.who.int/hiv/pub/progress_report2011/en/index.html.