social, economic and environmental evaluation of beneficial management ... · social, economic and...
TRANSCRIPT

Social, Economic and Environmental Evaluation of Beneficial Management Practices, Series 3
1
Social, Economic and Environmental Evaluation of Beneficial Management Practices, Series 3:
Treatment Systems for Solid or Liquid Manure (0201) June 2014

Social, Economic and Environmental Evaluation of Beneficial Management Practices, Series 3
2
Acknowledgements This project was funded through Growing Forward II, a federal-provincial-territorial initiative. Report prepared by: Amy Kitchen, P.Ag., MRM, Yarrow Environmental Consulting Patrick Kitchen, MRM, Yarrow Environmental Consulting Ione Smith, P.Ag., M.Sc., Upland Consulting Ryan Trenholm, M.Sc., Yarrow Environmental Consulting Prepared for: The Sustainable Agriculture Management Branch, BC Ministry of Agriculture (AGRI) Project Steering Committee: Mark Raymond, Environmental Agrologist, AGRI Geoff Hughes-Games, Provincial Soil Specialist, AGRI Tom Droppo, Industry Specialist, AGRI Jill Hatfield, Regional Agrologist, AGRI Gary Telford, Manager, Agriculture and Agri-Food Canada Thank you and words of appreciation: We would like to thank all of the farmers from across BC who participated in the interview and survey process, the steering committee for your guidance, and the staff at ARDCorp and the BC Agriculture Council for your help with the data collection process. Thank you to staff at the BC Dairy Association for your assistance with the evaluation. Disclaimer: Opinions expressed in this document are those of the authors and not necessarily those of Agriculture and Agri-Food Canada and the BC Ministry of Agriculture. The Government of Canada, the BC Ministry of Agriculture, and the BC Agriculture Council or its directors, agents, employees, or contractors will not be liable for any claims, damages, or losses of any kind whatsoever arising out of the use of, or reliance upon, this information.

Social, Economic and Environmental Evaluation of Beneficial Management Practices, Series 3
3
Executive Summary Between July 2013 and March 2014 a project team from Yarrow Environmental Consulting and Upland Consulting was contracted by the British Columbia Ministry of Agriculture (AGRI) to conduct a social, economic and environmental evaluation of the Treatment Systems for Solid or Liquid Manure beneficial management practice (BMPs) promoted through the Canada-British Columbia Environmental Farm Plan Beneficial Management Practices Program (BMP Program). The BMP Program cost-shares the implementation of agri-environmental practices and technology on British Columbia farms, promoting agricultural sustainability and contributing to a cleaner, healthier environment. This project was supported by Growing Forward II, a federal provincial initiative that supports provincial agricultural programs, such as the Environmental Farm Plan and BMP Programs. This project is the third in the series of BMP evaluation projects. The objectives of this project were to:
Understand and summarize experiences with manure treatment technologies from other jurisdictions;
Use the established BMP evaluation framework to evaluate the social, economic and environmental outcomes of the Manure Treatment BMP; and
Draw conclusions from the results of the evaluation and make recommendations based on the findings.
A BMP survey was developed for the evaluation. The survey captured information about the financial and environmental outcomes associated with the implementation of the Manure Treatment BMP on farms as well as feedback from program participants. Surveys were administered in the fall of 2013 through personal interviews with producers who implemented the Manure Treatment BMP. The majority of interviews were conducted on-farm and manure samples were also collected to compare the chemical and biological components of manure prior to and post-treatment at the time of the interview. Additional interviews were conducted with dairy producers who have not adopted the Manure Treatment BMP to explore reasons for lack of implementation. BMP Program application files submitted by producers were also used for the evaluation. A discounted cash flow (DCF) analysis was conducted to understand the private financial outcomes of BMP implementation at the farm level. In addition, a cost-benefit analysis (CBA) was conducted for the Manure Treatment BMP to understand the benefits of BMP implementation to society. Additional calculations were made for dairies that were smaller (<200 milking cows) than the average size of operations captured in this BMP Program, (298 milking cows). This is important because the average size of BC dairy operations is 125 milking cows. A SWOT analysis framework was used to highlight the strengths, weaknesses, opportunities and threats associated with the Manure Treatment BMP and helped to form the basis for recommendations and conclusions made about the BMP. Results of the project highlight the outcomes of the Manure Treatment BMP to individual farm operations and the effectiveness of BMPs at environmental risk mitigation. The results show that, generally, the BMP results in positive environmental outcomes on-farm and can help producers to manage their environmental risk. Specifically, operators benefit from more targeted application of nutrients and in re-use of solids for bedding material. In most cases the BMP provides a financial benefit to producers; however, the

Social, Economic and Environmental Evaluation of Beneficial Management Practices, Series 3
4
level of benefit is dependent on the type of manure treatment technology implemented and the unique characteristics of the individual farm operation. Smaller dairy operations (<200 milking cows) are less likely to realize financial benefits over the lifetime of the technology. Results of the CBAs show that over the expected life of the BMP a net benefit to society is realized. Continued support of the Manure Treatment BMP is recommended, with an overall category cap that reflects the high level of benefits experienced by those who adopt the BMP and an increased emphasis on pooled projects where average to smaller sized dairy farms may also benefit from the Manure Treatment BMP cost-share funding. The BMP evaluation results presented in this report will aid in:
Demonstrating the environmental merits of the BMPs to funding agencies;
Promoting the on-farm benefits of BMPs to producers; and
Effectively allocating limited program funding in a means that maximizes the net benefits of the BMP Program to the public.

Social, Economic and Environmental Evaluation of Beneficial Management Practices, Series 3
5
Table of Contents
Acknowledgements ............................................................................................ 2
Executive Summary ............................................................................................ 3
Table of Contents ................................................................................................ 5
1.0 Introduction and Background ...................................................................... 6 1.1 Limitations of the BMP Evaluation Project ........................................................ 7
2.0 BMP Evaluation Methodology ...................................................................... 9
3.0 Manure Treatment Technology Overview ................................................. 13 3.1 Solid/Liquid Manure Separation Technology Overview .................................. 13 3.2 Bedding Recovery Technology Overview ........................................................ 14
4.0 Jurisdictional Review Summary ................................................................ 17 4.1 Uptake of Manure Treatment Technology ........................................................ 17 4.2 Factors Leading to Uptake of Solid/Liquid Separation Technology ............... 18 4.3 Factors Leading to Uptake of Bedding Recovery Systems ............................ 20
5.0 Results of the Social, Economic and Environmental Evaluation of the Manure Treatment BMP .................................................................................... 22
5.1 Introduction to the Treatment Systems for Solid or Liquid Manure BMP ...... 22 5.2 Evaluation Survey Response ............................................................................ 23 5.3 Cost-Share Structure and BMP Implementation Costs ................................... 23 5.4 Manure Treatment BMP Uptake Statistics ....................................................... 23 5.5 Characteristics of Farms Implementing the Manure Treatment BMP ............ 26 5.6 The Manure Treatment BMP in Practice ........................................................... 27 5.7 The Environmental Outcomes of the Manure Treatment BMP ....................... 29 5.8 The On-Farm Outcomes of Manure Treatment BMPs ..................................... 36 5.9 Public Benefits of the Manure Treatment BMP ................................................ 40
5.9.1 Case Study: Valuing the Environmental Impact of Manure Treatment Systems ............................................................................................................................... 45
5.10 Manure Treatment BMP Financial and Economic Analyses for Smaller Dairies ...................................................................................................................... 46 5.11 Social Factors of Manure Treatment BMP Uptake ......................................... 49
6.0 Manure Treatment BMP SWOT Analysis, Conclusions and Recommendations ............................................................................................ 53
6.1 Manure Treatment BMP SWOT Analysis .......................................................... 53 6.2 Conclusions and Recommendations for the Manure Treatment BMP ........... 54
Appendices ....................................................................................................... 57 I. References and Literature Consulted ................................................................ 57 II. Manure Sampling and Lab Methods ................................................................... 59 III. Extended Summary of Jurisdictional Review ................................................... 64 IV. Data Sources for Benefits and Costs Used in the Cost-Benefit Analysis ...... 74 V. Cost-Benefit Analysis Assumptions and Limitations ....................................... 76

Social, Economic and Environmental Evaluation of Beneficial Management Practices, Series 3
6
1.0 Introduction and Background This project is supported by Growing Forward II, a federal-provincial-territorial initiative that supports provincial agricultural programs, such as the Canada-British Columbia Environmental Farm Plan Program (EFP) and Beneficial Management Practices Programs (BMP Program). In British Columbia, the EFP Program, launched in 2004, was designed to raise awareness and to complement and enhance the current environmental stewardship practices of agriculture producers. Programs were developed based upon a risk assessment of regional issues concerning air, soil, water, and biodiversity and Beneficial Management Practices (BMPs) needed to address the issues. Encouraging the uptake of BMPs such as those reviewed in this report contributes to improved environmental stewardship. Since 2005, the BMP Program has encouraged the uptake of environmentally friendly practices on farms and ranches in BC by cost-sharing the implementation of BMP projects with producers. An essential aspect of BMP Program management is to evaluate the process and outcomes of the program. Evaluation and monitoring of a program is a means to discover program strengths, weaknesses, and potential opportunities that could be acted upon as well as threats to the success of the program. Evaluation delivers valuable feedback to BMP Program managers to allow the program to be adaptively managed and changed over time to meet the needs of BC farms and the changing environment. In 2011/12, the BC Ministry of Agriculture commissioned Amy Kitchen, Ryan Trenholm and a team from Simon Fraser University to conduct the first BMP evaluation project. An evaluation framework was developed to assess the social, economic and environmental outcomes of BMPs with four BMPs evaluated for the initial project. A second BMP evaluation project was conducted by Yarrow Environmental Consulting in 2012/13 and three BMPs were evaluated. This project is the third in the series of BMP evaluation projects. The BMP evaluated for this project was:
Treatment Systems for Solid or Liquid Manure (0201).
The objectives of this project were to:
Understand and summarize manure treatment experiences from other jurisdictions;
Use the established BMP evaluation framework to evaluate the social, economic and environmental outcomes of the Manure Treatment BMP; and
Draw conclusions from the results of the evaluation and make recommendations based on the findings.
The specific research questions addressed in this report are:
What can be learned from other jurisdictions about on-farm manure treatment?
What was the uptake of the BMP between 2009 and 2013?
What were the social, financial and environmental outcomes of the BMP?
What were the benefits (if any) of the BMP to society?
Was the BMP effective at mitigating environmental risks?
Could the BMP be improved in any way? The BMP evaluation project was conducted by a project team from Yarrow Environmental Consulting and Upland Consulting and directed by a project steering committee from the BC Ministry of Agriculture (AGRI), Agricultural Research and

Social, Economic and Environmental Evaluation of Beneficial Management Practices, Series 3
7
Development Corporation (ARDCorp), and Agriculture and Agri-Food Canada (AAFC). Yarrow Environmental Consulting is a consulting firm with a mandate of helping to create a resilient local agriculture industry in BC. We specialize in agri-environmental resource management, economic analysis and stakeholder engagement. Upland Consulting specializes in agroecological practices and brings over ten years of experience in crop production, soil nutrition, land use planning, and climate change adaptation and mitigation policy development. Upland is committed to policies and actions that articulate long-term solutions, particularly the enhancement of existing farms and farmland, and the promotion of networks that support local, resilient agricultural systems. This evaluation project delivers information to BMP Program managers regarding how BMPs have been implemented on-farm, their environmental and financial outcomes and the benefits that the BMPs provide to society. The evaluation results presented in this report will aid in:
Demonstrating the environmental merits of the BMPs to funding agencies;
Promoting the on-farm benefits of BMPs to producers; and
Effectively allocating limited program funding in a means that maximizes the net benefits of the BMP Program to the public.
The remainder of this report is organized as follows:
In section 2 the evaluation framework and methodology used to conduct the BMP evaluations is described;
In section 3 we review the manure treatment technology adopted by BC producers;
In section 4, the results of the manure treatment technology Jurisdictional Review are presented;
In section 5 we present the results of the Manure Treatment BMP evaluation;
In section 6 we discuss the results of the evaluation using a Strength, Weaknesses, Opportunities and Threats (SWOT) analysis framework and we present our recommendations and conclusions specific to the Manure Treatment BMP.
1.1 Limitations of the BMP Evaluation Project The BMP evaluation framework used for this project was developed in response to a desire for more information about the outcomes of BMPs implemented through the BMP Program. The methods used for this project were an appropriate means for the evaluation considering time, budget and data constraints associated with the evaluation. Due to the nature and timing of the evaluation and complexities associated with summarizing on-farm outcome data we would like to point out some limitations to the information presented in this report:
The methods used to determine outcomes are not a true measurement of program impact. To estimate the impact of a program, either baseline data collected prior to BMP implementation or an experimental design procedure where BMP Program participants are compared to non-program participants is required.
The Manure Treatment BMP was evaluated as a unique piece of technology; however, it is important to recognize that BMPs are often implemented as a suite of on-farm projects or improvements. As well, each farm implements

Social, Economic and Environmental Evaluation of Beneficial Management Practices, Series 3
8
environmental improvements within a unique set of operational and environmental circumstances. Thus it is potentially inaccurate to attribute certain environmental and financial outcomes solely to the BMP. It is also possible that a BMP with similar outcomes was funded under a different practice code and this evaluation does not capture the duplication of benefit that may be associated with those implemented BMPs.
Certain environmental benefits of BMP implementation could not be valued monetarily within the scope of this report. As a result, the net present values of BMP projects determined by the cost-benefit analyses are conservative.
The conclusions made in this report are not based on statistically significant data.
The conclusions and recommendations made in this report are based on the results of the BMP evaluations, qualitative information gleaned during the interview process and site visits as well as the authors’ opinions and experiences.
The BMP program is a voluntary program, participants self-select themselves to participate. Often, voluntary environmental programs attract participants who are like-minded. Therefore, their practices, experiences and opinions may not be representative of the industry as a whole.
The evaluation of the Manure Treatment BMP occurred relatively soon after the majority producers who were included in the evaluation had installed the equipment. Because of this, evaluation results may be skewed as respondents did not have more than a few years of experience with the technology.

Social, Economic and Environmental Evaluation of Beneficial Management Practices, Series 3
9
2.0 BMP Evaluation Methodology This project is the third evaluation of BMPs cost-shared through the Canada-British Columbia Environmental Farm Plan Program. The methods used for this BMP evaluation project were, in general, similar to the previous BMP evaluation project. The remainder of this section outlines the methodology used to conduct the evaluation. For more detailed step-by-step information about the methodology, please consult the BMP Evaluation Methodology Guide, 2012 available through AGRI. Evaluation Framework Overview To evaluate the environmental outcomes of BMPs on farms, environmental indicators were developed based on the specific environmental risk that the Manure Treatment BMP is intended to address. Agri-environmental indicators were used as a proxy for the actual environmental impact of the BMP, as it was beyond the scope of this project to measure impact directly. To identify on-farm outcomes of BMP uptake, changes that occurred on-farm after the implementation of Manure Treatment BMP were assessed by asking respondents to identify their practices prior to BMP adoption, and post BMP adoption. To determine the financial outcomes of the BMP to the average participant, both private costs and private benefits prior to and post BMP implementation were assessed. A discounted cash flow analysis (DCF) was conducted to portray the on-farm financial outcomes of BMP implementation.1 To determine the economic outcomes of the BMP to society, a cost-benefit analysis (CBA) was conducted.2 Five main steps are followed when conducting a cost-benefit analysis:
1. Identify the issues, risks, and the baseline scenario; 2. Set objectives; 3. Develop alternative regulatory and non-regulatory options; 4. Assess the benefits and costs (using a variety of possible techniques); and 5. Prepare an accounting statement.
To understand the motivational factors for and barriers to BMP uptake, a set of social evaluation questions were developed. Several semi-structured interviews with non-adopters of the BMPs and industry experts were also conducted to better understand the barriers to uptake of the BMP as well as weaknesses of the BMP.
Data Sources and Data Collection Methodology The data for this project came from five sources:
1 Discounted cash flow analyses are used by individuals to determine the financial outcomes of a proposed
project over its lifetime. The tool tracks cash flows and discounts them based on a set rate to determine the present value of a project. 2 Cost benefit analyses are used by governments to determine the economic efficiency of alternative policies
(i.e. government intervention) for solving a specific problem (e.g. water pollution). Governments at varying levels around the world have adopted this decision tool for assessing new or existing policies.

Social, Economic and Environmental Evaluation of Beneficial Management Practices, Series 3
10
1. Industry experts and equipment suppliers were interviewed to understand manure treatment equipment and experiences in other jurisdictions. The purpose of the jurisdictional review was to determine manure treatment system uptake rates and the motivating factors/opportunities and deterring factors/barriers that influence those uptake rates in five jurisdictions; Alberta, Manitoba, Ontario, Idaho, and Washington. Information sources for the jurisdictional review included academic and government publications. We also conducted semi-structured interviews with industry experts (government, industry, and equipment suppliers). A total of eight interviews were completed over the phone. The semi-structured interview focused on three main areas: manure treatment uptake rates in the jurisdiction, motivating factors/opportunities, and deterring factors/barriers. 2. BMP project application files were supplied by the BC Agricultural Research and Development Corporation (ARDCorp). ARDCorp acts as the delivery agent for both the Environmental Farm Plan and BMP programs in BC. When a farm applies for BMP project funding, they submit an application form to ARDCorp. The BMP project file data was collected from paper archives by photocopying files and entering relevant data into a database. The data that was obtained from the program files included the contact information for adopters, the total number of adopters (N), the specific city/region where the BMP was implemented, the date the BMP was completed, and the total cost of the infrastructure paid by both the agencies and the producer as well as relevant information on the manure treatment system. The data files collected from ARDCorp included 25 application forms from producers who applied for funding for Manure Treatment BMPs.
3. A survey was used to conduct the social, economic and environmental outcome evaluation. A survey instrument was developed to evaluate the social, economic and environmental outcomes. Questions were designed to capture the outcome indicators as well as based on recommendations made by the project team and AGRI steering committee. Data was collected in two ways:
1. Personal interviews with producers; and 2. Manure sampling at 20 farms.
A target of 20 interviews was set. Interviews were conducted between October and December 2013 and focused on key areas of BMP uptake across the Province including:
The Fraser Valley;
Metro Vancouver; and
Vancouver Island. Interviews were arranged by telephone and email prior to visiting the farms in-person. Phone interviews were conducted with producers on Vancouver Island. In most cases, interviews corresponded with a site visit and manure sampling. A total of 22 BMP interviews were completed. In addition, five targeted interviews were conducted with industry experts and producers who were not captured by the BMP Program to understand the barriers to uptake and current weaknesses of the BMPs.

Social, Economic and Environmental Evaluation of Beneficial Management Practices, Series 3
11
4. Manure samples were collected to compare chemical and biological parameters of the pre-treatment manure and post-treatment manure streams. At twenty sites, samples were collected using methods outlined in the Manure Sampling and Analysis for Nutrient Management factsheet.3 At most sites three samples were obtained:
Liquid manure before entering the separator;
Solid manure leaving the separator; and
Liquid manure leaving the separator.
On two occasions the third sample could not be obtained due to physical challenges in collecting the sample (manure in the pit was too deep to reach). At sites with a sand lane a fourth sample (sand) was also collected).4 The liquid and solid samples were all analyzed by A & L Canada Laboratories Inc.
(subcontracted by Exova Laboratories) for the following parameters:
Table 1. Manure Sampling Methods and Parameters.
Parameter Unit Detection Limit
Method Reference
Dry matter % 0.10 Gravimetric Total Potassium % 0.01 Inductively Coupled
Plasma (ICP) Total Phosphorus % 0.01 Inductively Coupled
Plasma (ICP) Ammonium (NH4-N) ug/ml or ug/g 0.10 Colourimetric Total Organic Nitrogen
% 0.10 Combustion
Total Nitrogen % 0.10 Combustion pH N/A pH meter Fecal coliform Most probable
number (MPN/ml) N/A MFHPB-19 accredited test
The extraction method for Total Phosphorus and Total Potassium is based on EPA Method 3050B as follows:
The dried, ground sample is weighed into a digestion vessel where hydrochloric and nitric acid are added.
It is digested for 2 hours at 95 Co then made up to volume with deionized water, shaken and filtered.
It is submitted for analysis by ICP-OES.
3 Nutrient Management Factsheet - No. 5 in Series (Revised September 2010, Order Reference
No. 631-500-3). 4 Refer to Appendix II for the detailed manure sampling methods.

Social, Economic and Environmental Evaluation of Beneficial Management Practices, Series 3
12
5. Data from relevant literature sources were used, particularly to value environmental benefits for the purposes of the CBA.
Some environmental benefits could not be valued monetarily within the scope and timeframe of this project. In order to conduct the cost benefit analysis, values for environmental benefits were gathered from relevant literature sources. This methodology is termed “value transfer” or “benefit transfer”. Data Analysis The data collected through personal interviews and phone surveys was combined and analyzed jointly. Average or median values for BMP outcomes are reported to demonstrate both the typical case as well as the aggregate outcomes of BMP implementation. Financial data supplied by respondents was analyzed using a discounted cash flow (DCF) methodology. A DCF allows private costs and on-farm benefits to be compared over the life of the BMP to determine the net present value (NPV) of the BMP project to the producer. Data used to conduct the cost-benefit analyses came from both BMP Program data and data collected during the evaluation.5 The net present value (NPV) test was applied as the decision rule to determine whether the project was an overall benefit or cost to society. SWOT Analysis, Conclusions and Recommendations To organize the main findings of the evaluation as well as to present some anecdotal findings from interviews, a SWOT (Strengths, Weaknesses, Opportunities and Threats) analysis was conducted. Finally, conclusions and recommendations, based on the findings of the BMP evaluation were made.
5 Refer to the first BMP evaluation report for a detailed summary of the CBA methods: http://www.agf.gov.bc.ca/resmgmt/EnviroFarmPlanning/AGRI_BMP_Report_FINAL.pdf
Social, Economic and Environmental Evaluation of Beneficial Management Practices, Series 3
13
3.0 Manure Treatment Technology Overview In this section we provide a broad overview of the manure treatment technology implemented by producers through the BMP Program. The technologies may be generally categorized as solid/liquid separation (dewatering) equipment and bedding recovery units.
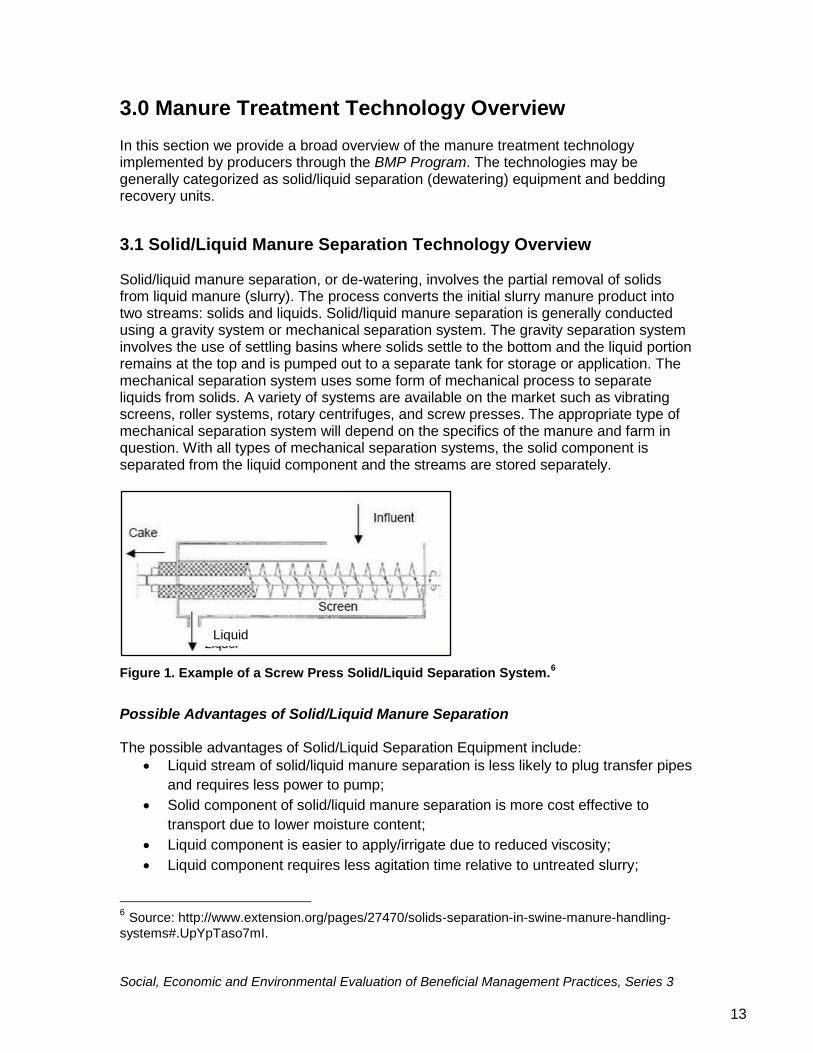
3.1 Solid/Liquid Manure Separation Technology Overview Solid/liquid manure separation, or de-watering, involves the partial removal of solids from liquid manure (slurry). The process converts the initial slurry manure product into two streams: solids and liquids. Solid/liquid manure separation is generally conducted using a gravity system or mechanical separation system. The gravity separation system involves the use of settling basins where solids settle to the bottom and the liquid portion remains at the top and is pumped out to a separate tank for storage or application. The mechanical separation system uses some form of mechanical process to separate liquids from solids. A variety of systems are available on the market such as vibrating screens, roller systems, rotary centrifuges, and screw presses. The appropriate type of mechanical separation system will depend on the specifics of the manure and farm in question. With all types of mechanical separation systems, the solid component is separated from the liquid component and the streams are stored separately.
Figure 1. Example of a Screw Press Solid/Liquid Separation System.6
Possible Advantages of Solid/Liquid Manure Separation The possible advantages of Solid/Liquid Separation Equipment include:
Liquid stream of solid/liquid manure separation is less likely to plug transfer pipes
and requires less power to pump;
Solid component of solid/liquid manure separation is more cost effective to
transport due to lower moisture content;
Liquid component is easier to apply/irrigate due to reduced viscosity;
Liquid component requires less agitation time relative to untreated slurry;
6 Source: http://www.extension.org/pages/27470/solids-separation-in-swine-manure-handling-
systems#.UpYpTaso7mI.
Liquid

Social, Economic and Environmental Evaluation of Beneficial Management Practices, Series 3
14
The odours associated with separated liquids and solids is reduced compared to
unprocessed slurry; and
N:P ratios of the solid and liquid components are different (solid component has
higher P while liquid component has higher N). Thus, the separation allows for
more accurate application of nutrients based on the needs of each field.
Possible Disadvantages of Solid/Liquid Manure Separation The possible disadvantages of Solid/Liquid Separation equipment include:
High initial cost associated with implementation;
Ongoing maintenance costs;
The system results in two waste streams and farms may not be set up to manage
two streams of manure;
Solid/liquid manure separation adds an additional step to the manure
management system, which requires attention; and
The system may require modification to existing facilities such as the
construction of new buildings to house the equipment or new electrical systems.
Possible Uses of the Solid/Liquid Output
The solid component can have a variety of uses:
Land application;
Green bedding (i.e. not-composted bedding)7;
Soil amendments; or
Solids can be composted for use or sale.
Alternative uses for the liquid component include:
Use in in-barn flushing systems; or
A source of irrigation water.
3.2 Bedding Recovery Technology Overview Bedding Recovery Systems take the manure from a dairy operation and convert a portion of it into bedding material for cows through a composting process. A bedding recovery system is a two-step process: Step 1. Liquid/slurry manure is separated into solid and liquid streams using a solid/liquid manure separator, such as a screw press (Figure 1). The purpose is to reduce the separated solid component to approximately 65% to 68% moisture content. Solids can be separated from manure as well as anaerobic digestate. Step 2. The separated solids are fed into a drum that rotates and draws in fresh air to feed the aerobic bacteria creating ideal conditions for composting. The composting solids can reach temperatures of 65 to 70 degrees Celsius, which kills most pathogens
7 Note that use of green bedding may increase bedding pathogens resulting in consequences to
animal health.

Social, Economic and Environmental Evaluation of Beneficial Management Practices, Series 3
15
in the manure. The solid material will remain in the drum for between one and three days. When the composting process is complete, the solids are ready to be used as livestock bedding. It is recommended that the bedding is to be used fresh. If the bedding is stored for two or three days, it may begin to compost again. Possible Advantages of Bedding Recovery Systems The possible advantages of Bedding Recovery Systems include:
Producers may realize savings related to reduced bedding expenses;
Bedding recovery systems ensure producers have a reliable source of bedding;
Producers can realize additional revenue;
o Producers may process other dairy farms’ manure for bedding either for a
fee or for use on their farm;
o Producers may sell excess bedding to other farms; or
o Producers may sell composted materials as soil amendments or fertilizer;
Some aspects of animal health, such as hock sores, abrasions and mastitis, may
improve with the use of manure bedding.
Possible Disadvantages of Bedding Recovery Systems The possible disadvantages of Bedding Recovery Systems include but are not limited to:
Bedding can reheat if stored for too long prior to use, leading to new bacterial
growth which in turn could increase environmental mastitis, therefore bedding
should be used when fresh;
Potential for higher disease incidence when used for calves, in sick pens or
maternity pens; and
Initial investment costs and ongoing operating costs.

Social, Economic and Environmental Evaluation of Beneficial Management Practices, Series 3
16
Figure 2. An example of a Bedding Recovery System installed on-farm.8
Figure 3. The solid output of a Bedding Recovery System.
8 Source: http://www.daritech.com/categories/manure/beddingmaster/
Social, Economic and Environmental Evaluation of Beneficial Management Practices, Series 3
17
4.0 Jurisdictional Review Summary
We reviewed five jurisdictions including Washington, Idaho, Alberta, Manitoba, and Ontario with the purpose of understanding manure treatment system uptake and the experiences of producers in other jurisdictions. For each jurisdiction, we investigated the level of uptake of Solid/Liquid Separation and Bedding Recovery Systems, the unique factors leading the uptake of the technologies and the primary motivations and barriers for the adoption of each technology. For the full summary on each jurisdiction, please see Appendix III.
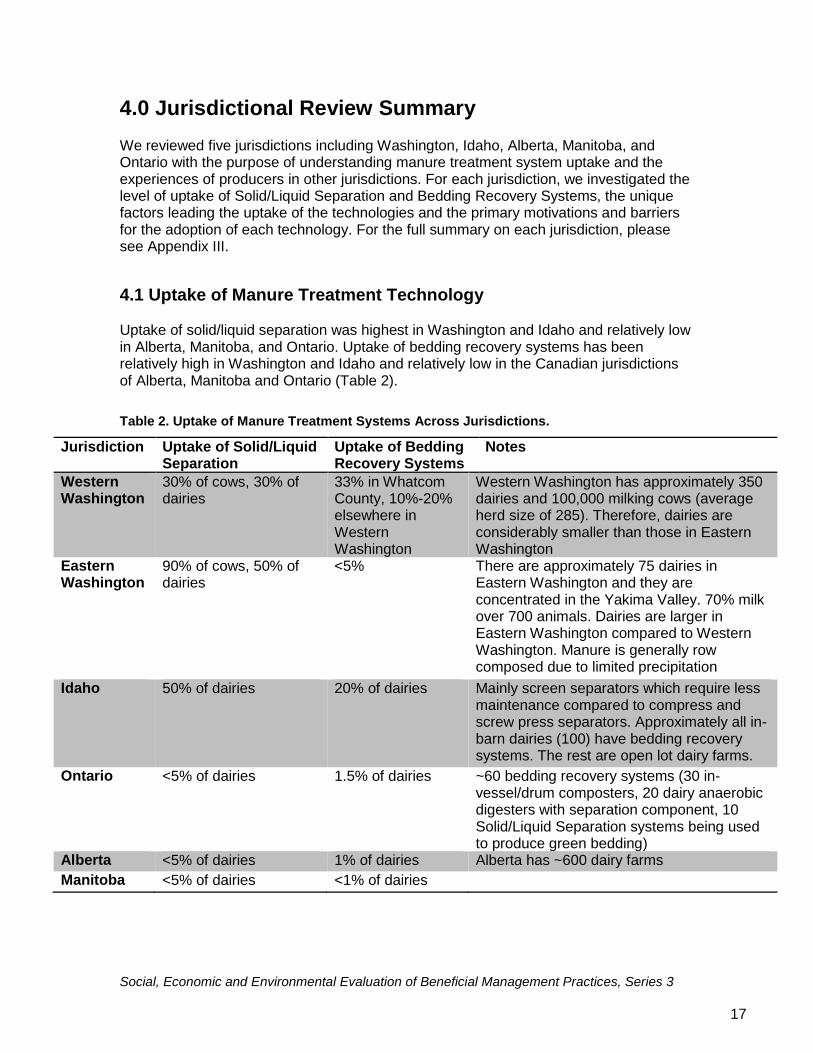
4.1 Uptake of Manure Treatment Technology Uptake of solid/liquid separation was highest in Washington and Idaho and relatively low in Alberta, Manitoba, and Ontario. Uptake of bedding recovery systems has been relatively high in Washington and Idaho and relatively low in the Canadian jurisdictions of Alberta, Manitoba and Ontario (Table 2).
Table 2. Uptake of Manure Treatment Systems Across Jurisdictions.
Jurisdiction Uptake of Solid/Liquid Separation
Uptake of Bedding Recovery Systems
Notes
Western Washington
30% of cows, 30% of dairies
33% in Whatcom County, 10%-20% elsewhere in Western Washington
Western Washington has approximately 350 dairies and 100,000 milking cows (average herd size of 285). Therefore, dairies are considerably smaller than those in Eastern Washington
Eastern Washington
90% of cows, 50% of dairies
<5% There are approximately 75 dairies in Eastern Washington and they are concentrated in the Yakima Valley. 70% milk over 700 animals. Dairies are larger in Eastern Washington compared to Western Washington. Manure is generally row composed due to limited precipitation
Idaho 50% of dairies 20% of dairies Mainly screen separators which require less maintenance compared to compress and screw press separators. Approximately all in-barn dairies (100) have bedding recovery systems. The rest are open lot dairy farms.
Ontario <5% of dairies 1.5% of dairies ~60 bedding recovery systems (30 in-vessel/drum composters, 20 dairy anaerobic digesters with separation component, 10 Solid/Liquid Separation systems being used to produce green bedding)
Alberta <5% of dairies 1% of dairies Alberta has ~600 dairy farms
Manitoba <5% of dairies <1% of dairies

Social, Economic and Environmental Evaluation of Beneficial Management Practices, Series 3
18
4.2 Factors Leading to Uptake of Solid/Liquid Separation Technology Across jurisdictions, producers were motivated to adopt solid/liquid manure separation to better manage nutrients on farm, earn additional revenue from selling separated solids, and to better manage manure volumes (Table 3). Additionally, adoption is more common at larger dairies. Common barriers across jurisdictions include the financial cost of the system and the additional time, attention, and maintenance required by the system. solid/liquid manure separation is also less common on small dairies with lower revenues (Table 4).
Table 3. Motivating Factors and Opportunities Leading to Uptake of Solid/Liquid Technology Across Jurisdictions.
Western Washington
Eastern Washington
Idaho Ontario Alberta Manitoba
Increased Manure Storage Capacity
✓ ✓ ✓
Additional Tool for Manure Management
✓ ✓ ✓ ✓
Systems are more affordable for larger dairy farms
✓ ✓
Cost-share programs ✓ ✓ ✓ Manage nutrients in a way that reduces environmental risk
✓
Opportunity for sales of manure by-products
✓ ✓
Intention to install a Bedding Recovery System in future
✓
Increased interest due to an increase in use of Bedding Recovery Systems
✓
Proximity to urban areas
✓
To reduce solids in manure lagoons
✓

Social, Economic and Environmental Evaluation of Beneficial Management Practices, Series 3
19
Table 4. Barriers and Deterrents to Uptake of Solid/Liquid Separation Technology Across Jurisdictions.
Western Washington
Eastern Washington
Idaho Ontario Alberta Manitoba
The financial cost of the technology
✓ ✓ ✓ ✓ ✓ ✓
Additional time and maintenance
✓ ✓ ✓ ✓
Hesitation to change current system
✓ ✓ ✓
Less perceived need for treatment due to external factors (i.e. land base and weather)
✓ ✓ ✓
The financial cost of transporting solid manure
✓ ✓
Availability of affordable bedding materials
✓
Lack of incentive programs
✓
Not appropriate for the style of dairy farm (open lot)
✓

Social, Economic and Environmental Evaluation of Beneficial Management Practices, Series 3
20
4.3 Factors Leading to Uptake of Bedding Recovery Systems Across jurisdictions, the primary motivations for uptake of Bedding Recovery Systems include a desire to decrease bedding costs (Table 5). Common barriers include financial cost, limited applicability of systems to specific farm operations, additional maintenance and time associated with the system, and access to inexpensive bedding alternatives (Table 6).
Table 5. Motivating Factors and Opportunities Leading to Uptake of Bedding Recovery Systems Across Jurisdictions.
Western Washington
Eastern Washington
Ontario Alberta Manitoba Idaho
Bedding cost savings ✓ ✓ ✓ ✓ ✓
Access to a reliable source of bedding
✓
Opportunity for sales of manure by-products
✓ ✓
Opportunity to process other farm's manure
✓
Additional tool for manure management
✓
Cost-share programs ✓
Increased manure storage capacity
✓
The technology makes financial sense on larger dairy farms
✓
Many farms have Solid/Liquid Separator equipment already
✓

Social, Economic and Environmental Evaluation of Beneficial Management Practices, Series 3
21
Table 6. Barriers and Deterrents to Uptake of Bedding Recovery Systems Across Jurisdictions.
Western Washington
Eastern Washington
Ontario Alberta Manitoba Idaho
The financial cost of the technology
✓ ✓ ✓ ✓ ✓ ✓
Additional time and maintenance
✓ ✓ ✓ ✓
Solids row composted outside already
✓ ✓
Availability of affordable bedding materials
✓ ✓
Lack of incentive programs
✓ ✓
Animal health concerns ✓ Style of dairy farms not conducive to technology
✓ ✓

Social, Economic and Environmental Evaluation of Beneficial Management Practices, Series 3
22
5.0 Results of the Social, Economic and Environmental Evaluation of the Manure Treatment BMP This section will report the findings of the social, economic and environmental evaluation of the Treatment Systems for Solid or Liquid Manure BMP that was conducted between August 2013 and March 2014. The BMP uptake statistics, environmental and financial outcomes, social factors of BMP uptake as well as the results of the cost-benefit analysis are reported below in section 5.
5.1 Introduction to the Treatment Systems for Solid or Liquid Manure BMP The Treatment Systems for Solid or Liquid Manure Beneficial Management Practice (herein referred to as the Manure Treatment BMP) is intended to address environmental risks associated with the storage, handling and application of un-treated manure produced, handled and stored on farms. Some of the environmental risks associated with untreated manure include: 9
Excess manure volume relative to on-farm storage capacity resulting in application of manure in less than ideal conditions; and
Excess nutrient application on cropland due to an inability to viably export untreated manure.
The BMP Program has cost-shared the implementation of solid-liquid separation equipment, bedding recovery units and nutrient recovery technology since the 2009/10 program year. Pathogen and vector attraction reduction treatment systems have been cost-shared through the BMP Program since the 2013/14 program year. Pathogen and vector attraction reduction systems were not included in this project as there were no completed projects at the time of the evaluation. Treatment of manure may reduce the risk of odour or pathogen release, or greenhouse gas emissions associated with livestock manure. In addition, treatment of manure may increase the efficiency of manure management and allow farms to use manure as nutrients more effectively as manure application may occur at more appropriate times.
Additionally, separated manure may allow for nutrient application to be better targeted to areas of the farm that are deficient in certain nutrients and away from areas where nutrients are in excess. Manure that has been separated into liquid and solid streams may be easier to handle during manure application because the liquid stream is less likely to clog pipes than untreated slurry. Solid/liquid separation of manure as well as bedding recovery units can allow producers to reuse the solid portion of manure as bedding. Manure by-products such as bedding and soil amendments may be sold off-farm as a result of implementing a manure treatment system as solids and excess nutrients may be viably transported off-farm.
9 National Farm Stewardship Program. (2006). Beneficial management practices descriptions.
Ottawa, ON: Agriculture and Agri-Food Canada.

Social, Economic and Environmental Evaluation of Beneficial Management Practices, Series 3
23
5.2 Evaluation Survey Response A total of 22 interviews and 20 site visits were conducted with adopters of manure treatment technology through the BMP Program, which equates to an 96% response rate for the survey overall. An additional interview was conducted with a producer who had implemented bedding recovery units (not cost-shared through the BMP Program). Four interviews were conducted with producers who had not adopted any manure treatment technologies, but were considered to be potential candidates.
5.3 Cost-Share Structure and BMP Implementation Costs Funding for the Manure Treatment BMP has been available since the 2009/10 and up to and including the time that this evaluation was conducted (in the 2013/14 program year). Cost-share funding has been available for dewatering systems for liquid manure (i.e. manure separators) and bedding recovery systems for solid and liquid manure since 2009/10. The cost-share level and cap for the Manure Treatment BMP (0201) has changed throughout the years that it has been available. The cost-share and category cap levels have been as follows:
2009/2010 – 30% up to $30,000
2010/2011 – 30% up to $30,000
2011/2012 – 30% up to $30,000
2012/2013 – 30% up to $70,000
2013/2014 – 30% up to $50,000 The average implementation cost of a Manure Treatment BMP project taking into account only the eligible costs was $175,000.10 The BMP Program provided an average of $35,000 in cost-share dollars to producers per BMP project. The average net implementation cost of a Manure Treatment BMP project for producers, taking into account only the eligible costs was $140,000. Between 2009/2010 and 2012/2013, producers contributed $3,863,000 and the BMP Program contributed $769,000 towards Manure Treatment BMPs.11
5.4 Manure Treatment BMP Uptake Statistics This section reports the Manure Treatment BMP implementation and distribution statistics for the period between 2009/2010 and 2012/2013.
10
The average total cost of implementing a Bedding Recovery Unit was $205,000 and the average total cost of implementing a Solid/Liquid Separator was $112,000. 11
Project costs were determined using the ARDCorp BMP programs data.

Social, Economic and Environmental Evaluation of Beneficial Management Practices, Series 3
24
BMP Uptake and Regional Distribution of BMPs A total of 23 Manure Treatment BMP projects occurred across BC between 2009/2010 and 2012/2013.12 13 One of the projects involved one dairy producer and two poultry producers who applied for a Bedding Recovery Unit as a pooled project; therefore, 25 producer applications were approved in total. Figure 4 and Table 7 and display the regional distribution of implementation for the BMP. To date Manure Treatment BMP projects have been concentrated in the Fraser Valley. It is not clear why there has been no uptake in the Okanagan region; however, the lack of uptake may be due to factors such as:
The drier climate in the Okanagan resulting in less rain accumulation in manure storages;
Better access to reliable and cheap sources of bedding (i.e. straw or shavings); and/or
Limited awareness/exposure to the technology.
12
A BMP ‘project’ was defined as a single BMP approved and cost-shared by the BMP programs. Using this definition, an individual farm operation may have implemented one or more distinct BMP projects on one or multiple farm properties. 13
At the time of this project there were 517 active dairy farms in BC. This information was supplied by the BC Dairy Association.

Social, Economic and Environmental Evaluation of Beneficial Management Practices, Series 3
25
Figure 4. Map of Manure Treatment BMP uptake between the 09/10 and 12/13 program years.
Table 7. Manure Treatment BMPs implemented by Regional District.14
Regional District Number of BMP Projects
Comox Valley 1 Capital 1 Fraser Valley 16 Metro Vancouver 5
Uptake by Commodity All producers who have implemented manure treatment technologies on their farm through the BMP Program were dairy producers. Three producers applied for a pooled project, two of which were poultry producers; however the manure treatment equipment
14
The regional distribution of BMP uptake was determined using the ARDCorp BMP Program data.

Social, Economic and Environmental Evaluation of Beneficial Management Practices, Series 3
26
was installed on the dairy farm and is used to treat manure from all three farms.15 Approximately 5% of the current total dairy farms in the province have adopted the technology through the BMP Program. Uptake Over Time The Manure Treatment BMP has been cost-shared through the BMP Program since 2009. It is likely too early to determine if there is a trend in uptake, however uptake of the BMP appears to be increasing, with the majority of producers (52%) implementing their Manure Treatment BMP in 2012 (Figure 5). The increase in BMP uptake corresponds with the increase of the BMP cap from $30,000 to $70,000 in the 2012/13 program year although this may not necessarily be the only reason for increased uptake. Other factors contributing to increase in uptake since the initial program year include an increase in awareness of the technology and the benefits that manure treatment offers.
Figure 5. Uptake of the Manure Treatment BMP by year.
5.5 Characteristics of Farms Implementing the Manure Treatment BMP The average area of land farmed by producers who implemented the Manure Treatment BMP was 128 hectares (110 hectares was the median area).16 The average size of the
15 Through the BMP Program, producers are able to apply for a joint or pooled BMP project whereby the applicants may combine the cost-share funding available to them in order to facilitate the development or larger more effective and economically viable projects. Projects must meet all regulatory requirements with regards to the storage, manure and use of manure produced off-farm. It is important to note that with the transport of manure between farms, there is an increased risk of disease transfer between farm operations. Producers who implement pooled Manure Treatment BMPs should have a biosecurity plan in place to mitigate this risk. For more information on pooled projects visit www.bcefp.ca. 16 The calculations for average and median area of land is based on owned land and do not include other land that producers may lease.
17%
9%
22%
52%
0%
10%
20%
30%
40%
50%
60%
2009 2010 2011 2012

Social, Economic and Environmental Evaluation of Beneficial Management Practices, Series 3
27
milking herd was 298 cows, which is more than double the province’s current average milking herd size of 125 cows (Table 8). Herd sizes, of farms that implemented a Manure Treatment BMP, ranged from 80 milking cows 600 milking cows. The survey indicated that there was almost no change in the average dairy herd size or the land base farmed between the time that the application was submitted and the time of the survey. Two producers indicated that they did not keep their young stock at the farm where the Manure Treatment BMP was implemented. All respondents indicated that the farm operators privately owned the land where the BMP was implemented.
Table 8. Average Number of Livestock on Farms that Implemented Manure Treatment BMPs.
17
Average Number of Livestock
Median Number of Livestock
Total Herd Size 510 478
Milking Herd Size 298 290
Young Stock 196 200
Farming Experience and Age of Respondents The average number of years that producers who implemented the Manure Treatment BMP have farmed is 28 years. The average number of years that the property, where the BMP was implemented has been farmed was 51 years.18 Those who participated in the survey were asked to indicate their age category (Table 9). The majority of producers fell into the 35-54 age category (72.7% of respondents). Thus, the majority of producers who implemented the Manure Treatment BMP are younger than the average age of BC farmers (55.7 years).19
Table 9. Age of Producers who Implemented the Manure Treatment BMP.
Age Percentage
18-34 4.5%
35-44 40.9%
45-54 31.8%
55-64 18.2%
65+ 4.5%
5.6 The Manure Treatment BMP in Practice
17
Farm characteristics were determined from the ARDCorp BMP program files and the BMP evaluation survey. 18
Farming experience was determined from the BMP evaluation survey. 19
Average age of BC farmers was determined by Statistics Canada, 2011 Census of Agriculture: http://www29.statcan.gc.ca/ceag-web/eng/community-agriculture-profile-profil-agricole?geoId=590000000&selectedVarIds=357%2C359%2C358%2C360%2C

Social, Economic and Environmental Evaluation of Beneficial Management Practices, Series 3
28
This section gives an overview of the how the Manure Treatment BMP has, in general, been implemented on farms. The BMP Program funding may have been allocated towards the purchase of:
Solid/liquid separation equipment; such as: o Screw presses; o Screen presses; o Roller presses; and
Bedding recovery systems. Manure Treatment Practices Prior to BMP Implementation In general, producers had not been treating their manure prior to implementing the Manure Treatment BMP. Two producers (10% of respondents) indicated that they already had one separator installed prior to implementing the Manure Treatment BMP. Of the producers who had manure treatment equipment prior to installing their Manure Treatment BMP, one producer implemented a Bedding Recovery System and one producer installed a second Solid/Liquid Separator. Type of BMP Implemented The types of BMPs funded through the Manure Treatment BMP may be separated into two general categories:
Solid/Liquid Separators; and
Bedding Recovery Systems.20 Of the 23 Manure Treatment BMPs implemented between 2009/10 and 2012/13, approximately one third of producers implemented Solid/Liquid Separation equipment (seven projects total) and two thirds of producers implemented Bedding Recovery System BMPs (16 projects total). There was a range of technologies implemented within these general categories (Table 10). For Solid/Liquid Separation equipment, screw presses were the most popular followed by roller presses. In some cases, producers implemented more than one Solid/Liquid Separator in order to achieve a more desirable end product (i.e. a lower moisture content). The Bedding Master system manufactured by Daritech was the most popular bedding recovery system among producers (10 projects total) who used sawdust bedding, followed by the Daritech Sand Recovery System for producers who used sand bedding (3 projects total). Reponses indicated that approximately 89% of the total manure produced on farm was treated by the Manure Treatment BMP. On farms that did not treat 100% of their manure, the remaining manure that was untreated was likely from solid pack barns, maternity or calf pens. Producers who use sand bedding often used other types of bedding (i.e. wood shavings or straw) for these purposes. Other than the dairy farm that
20
See Section 3.0 for a description of these technologies.

Social, Economic and Environmental Evaluation of Beneficial Management Practices, Series 3
29
treats manure from two other poultry farms (the pooled BMP project), no respondents indicated that they treat other farms’ manure with their system.
Table 10. Manure Treatment Technologies Implemented.
Type of Technology Implemented Solid/Liquid Separators
Bedding Recovery Systems
Screw Press 7 Roller Press 5 Sand lane 1 Sidehill Screen 1 Daritech Bedding Master 10 Daritech Sand Recovery System 3 Other Bedding Recovery Unit 3 Total 14 16
Use of Treated Manure All respondents indicated that they use the liquid fraction of the treated manure as fertilizer on cropland. Two producers indicated that they use a portion of the liquid fraction as flush water. The majority of respondents (70%) indicated that they use some of or the entire solid fraction of the treated manure for bedding. Producers also used some or all of their solid manure on crops (30% of respondents) and some indicated that they sold or gave away a portion of their solid manure (22% of respondents). Of those who indicated they use their solid manure for bedding, an average of 86% of the total solid fraction was recycled as bedding. The remaining solid fraction was either spread on cropland or used off-farm in various applications.
5.7 The Environmental Outcomes of the Manure Treatment BMP The above sections described how the Manure Treatment BMP has been implemented in practice, whereas this section provides insight into the environmental impacts that the BMP has had on farms where it has been implemented.21 The indicators used to understand the environmental outcomes of the Manure Treatment BMP were:
Change in the nutrient composition of manure that is applied to land;
Change in the amount of nutrients applied to crop land;
Change in the timing of manure application; and
Change in the amount of nutrients exported off-farm. Change in the Nutrient Composition of Manure that is Applied to Crop Land
21
Environmental outcomes were determined by the BMP evaluation survey.

Social, Economic and Environmental Evaluation of Beneficial Management Practices, Series 3
30
All producers indicated that they were applying the liquid portion of the treated manure to cropland and most were using the solid portion as bedding. A small portion of producers indicated that they were applying either all or some of their solid fraction to corn land. The results of the manure samples indicate that there are some differences in the chemical composition of the manure prior to and post treatment (Tables 11 and 12). Table 13 describes the manure sampling methods and parameters used by the lab. Figures 6 and 7 compare the total NPK percentages of the input and outputs of both Solid/Liquid Separators and Bedding Recovery Systems. Solid/Liquid Separators Treatment decreased the DM composition of the post-treatment liquid fraction by 0.8% and the DM content of the solid fraction was on average 25%. The majority of the ammonium N (NH4) was concentrated in the liquid fraction of the output. The majority of Phosphorus (79%) was concentrated in the liquid fraction, while 21% was concentrated in the solid fraction. No change in fecal coliforms was detected. Bedding Recovery Units Treatment decreased the DM composition of the samples from the Bedding Recovery Unit treatment systems an average of 0.6% and the DM content of the solid fraction was on average 32%. Similar to the samples from the Solid/Liquid Separation equipment, the majority ammonium N was concentrated in the liquid sample. The majority of Phosphorus (83%) was concentrated in the liquid fraction, while 17% was concentrated in the solid fraction. No change in fecal coliforms were detected between the slurry and liquid fraction; however, fecal coliforms in the solid fraction of manure showed a decrease from >1000 MPN/g to an average of 478 MPN/g indicating that the composting process reduces the amount of fecal coliforms detected in the solid fraction of treated manure.

Table 11. Average Chemical and Biological Components of Manure Treated by Solid/Liquid Separation Equipment
Dry
Matter (%)
pH Total N (%) NH4-H Total P (%) Total K (%) Fecal Coliforms (MPN/g dry)
dry as received
dry (ug/g)
as received (ug/ml)
dry as received
dry as received
dry as received
Slurry (pre-treatment)
3.5 7.1 6.3 0.2 32434.6 800.7 1.18 0.03 7.27 0.17 0 >1000
Liquid (post-treatment)
2.7 7.3 6.9 0.2 31363.1 710.9 0.95 0.03 5.56 0.15 0 >1000
Solid (post-treatment)
25.3 7.9 1.4 0.4 1311.1 324.4 0.51 0.1 0.78 0.2 0 >1000
Table 12. Average Chemical and Biological Components of Manure Treated with Bedding Recovery Systems
Dry Matter
(%)
pH Total N (%) NH4-H Total P (%) Total K (%) Fecal Coliforms (MPN/g dry)
dry as received
dry (ug/g)
as received (ug/ml)
dry as received
dry as received
dry as received
Slurry (pre-treatment)
5.4 7.4 5.0 0.2 22355.1 1059.4 0.89 0.04 4.72 0.23 0 >1000
Liquid (post-treatment)
4.8 8.1 5.9 0.2 29860.6 968.7 1.18 0.05 5.82 0.18 0 >1000
Solid (post-treatment)
32.0 7.9 1.5 0.5 1721.1 470.5 0.34 0.11 0.87 0.25 259 478

Social, Economic and Environmental Evaluation of Beneficial Management Practices, Series 3
32
Figure 6. Comparison of NPK Percentages Between the Input and Outputs of Solid/Liquid Separation Technology.
Figure 7. Comparison of NPK Percentages Between the Input and Outputs of Bedding Recovery Systems
6.30%
1.18%
7.27%
Slurry Pre-Treatment
Total N (%)
Total P (%)
Total K (%)6.90%
0.95%
5.56%
Liquid Post-Treatment
Total N (%)
Total P (%)
Total K (%)1.40%
0.51%
0.78%
Solid Post-Treatment
Total N (%)
Total P (%)
Total K (%)
5.00%
0.89%
4.72%
Slurry Pre-Treatment
Total N (%)
Total P (%)
Total K (%)
5.90%
1.18%
5.82%
Liquid Post-Treatment
Total N (%)
Total P (%)
Total K (%)1.50%
0.34%
0.87%
Solid Post-Treatment
Total N (%)
Total P (%)
Total K (%)

Table 13. Manure Sampling Methods and Parameters
Parameter Unit Detection Limit
Method Reference
Dry matter % 0.10 Gravimetric Total Potassium % 0.01 Inductively Coupled
Plasma (ICP) Total Phosphorus % 0.01 Inductively Coupled
Plasma (ICP) Ammonium (NH4-N) ug/ml or ug/g 0.10 Colourimetric Total Organic Nitrogen
% 0.10 Combustion
Total Nitrogen % 0.10 Combustion pH N/A pH meter Fecal coliform Most probable
number (MPN/ml) N/A MFHPB-19 accredited test
Change in the Amount of Nutrients Applied to Crop Land The Manure Treatment BMP can lead to a decrease in the volume of manure being applied and a change in the nutrient content of the manure if only the liquid fraction of manure is applied on-farm, and the solid portion is used elsewhere.22 The average farm surveyed produced/applied 2,427,239 gallons of manure per year prior to adopting the Manure Treatment BMP. This manure consisted of 19,628 lbs of ammonium Nitrogen, which contained 8215 lbs of Phosphorus (Table 14). With the installation of a Manure Treatment BMP, there was a decrease in manure volume applied and a change in nutrient content of the manure resulting in a net decrease in the amount of nutrients applied annually on the average dairy farm. The average farm applied 2,063,153 gallons of manure per year after implementing the Manure Treatment BMP, consisting of 15,203 lbs/year of ammonium Nitrogen, a 23% decrease, and 7394 lbs of Phosphorus, a 10% decrease.
22 In this section, we assume that separated solids are not applied.

Social, Economic and Environmental Evaluation of Beneficial Management Practices, Series 3
34
14. Average Change in the Amount of Nutrients Applied to Crop Land Per Farm that Implements a Manure Treatment BMP.
2324
Change in Manure Storage Capacity and the Timing of Spreading The implementation of Manure Treatment BMPs increased manure storage capacity by an average of 22 days (a gain of 15%).25 Anecdotally, producers indicated that the change in their storage capacity ranged anywhere from negligible to a 40% increase in capacity. Producers were asked to indicate the average amount of days that they spread manure during specific time periods to determine whether the Manure Treatment BMP affects the timing of manure application. Although the amount of nutrient loss to the environment is dependent on the weather conditions at the time of spreading as well as other factors, research indicates that generally applying manure to dormant cropland during the winter or “non advised” period increases the risk of nutrient loss. Generally, implementation of the Manure Treatment BMP did not affect the timing of manure spreading with the average number of spreading days in each period differing only slightly in any given period (Table 15).
23
Figures in Table 14 were obtained from the manure samples and survey of producers. 24 The calculation assumes that the manure samples measured were representative of the real average. If sampling error or variation in the piles were high, there might be a high degree of error in the calculations. 25 This calculation is based on producers who had not increased the size of their manure storage or installed roofs over their manure pit since implementing their BMP.
Pre-Manure Treatment System
Post Manure Treatment System
% Change
Number of milking cows 298 298 0% Total number of cows 611 611 0% Number of cow equivalents 445 445 0% Average annual volume of manure applied (gallons)
2,427,239 2,063,153 -15%
Amount of ammonium N in manure (lbs/1000 gallons)
8.09 7.37
-9%
Amount of Phosphorus in manure (lbs/1000 gallons)
3.38 3.58 6%
Amount of ammonium N applied in manure (lbs/year)
19,628 15,203 -23%
Amount of Phosphorus applied in manure (lbs/year)
8,215 7,394 -10%

Social, Economic and Environmental Evaluation of Beneficial Management Practices, Series 3
35
Table 15. Change in the timing of manure spreading since BMP implementation.
Average # of Spreading Days Prior to BMP
Average # of Spreading Days Post BMP Implementation
Sept 1 – Nov 15 5.5 5.3
Nov 16 – Jan 31* not advised
0.36 0.21
Feb 1 – Mar 31 4.6 4.5
April 1 – Aug 31 10.3 9.9
Total Spreading Days 20.8 19.9
Prior to implementing their BMP, four producers indicated that they experienced times where they needed to spread manure during the ‘not advised period’. After implementing the Manure Treatment BMP, two producers indicated that still experience times where they need to spread during the ‘not advised’ period. Change in the Export of Manure Off-Farm By separating manure into solid and liquid fractions, transport of solid manure off-farm may be more economical because of the reduced water content. Implementation of manure treatment systems may facilitate the export of nutrients off-farm to farms that are nutrient deficient. Prior to implementation of the Manure Treatment BMP, 14% of respondents (three producers) indicated that they shipped some liquid manure off-farm to neighbouring farms. Of these producers, they shipped between 8% and 60% of their total liquid manure production off-farm (an average of 26% of their total manure slurry production). Similarly, 14% of respondents (three producers) indicated that prior to implementing their Manure Treatment BMP, they exported an average of 27% of their solid manure (i.e. from young stock) off-farm. After implementing their Manure Treatment BMP nine percent (two producers) indicated that they ship 5% of the liquid fraction of their manure off-farm. Twenty three percent of respondents (five producers) indicated that they ship between 20% and 70% (an average of 42%) of the solid fraction of their manure off-farm. Results indicate that there has been a slight increase in the amount of solid manure shipped off-farm since implementation of the Manure Treatment BMP.26 Anecdotally, producers who use the solid fraction as bedding indicated that they did not have enough solid manure to ship off-farm after they satisfy their own bedding needs. Change in Odour Generated by Manure Respondents generally indicated that the implementation of their Manure Treatment BMP either improved (42%) or did not change (42%) the odour generated by manure on their farm. For those whose manure odour improved it was mostly due to less agitation of their manure pit during storage. Some producers (16%) indicated that manure odour
26
Sales of manure by-products are discussed in Section 5.8.

Social, Economic and Environmental Evaluation of Beneficial Management Practices, Series 3
36
had worsened since implementing their manure treatment technology, which was attributed to increased odour when spreading.
5.8 The On-Farm Outcomes of Manure Treatment BMPs This section will present the on-farm outcomes experienced by farmers and ranchers that implemented Manure Treatment BMPs as well as the costs they incurred. The financial and economic outcomes are presented for all BMP projects as well as for solid/liquid separation and bedding recovery systems separately. To evaluate the private (or on-farm) financial outcomes of the Manure Treatment BMPs to the producer, a discounted cash flow (DCF) analysis was conducted. The results of the DCF are presented below in this section. The analysis considers the on-farm situation immediately before BMP uptake compared to directly after BMP uptake and does not consider unrelated changes that may have occurred on the farm after BMP uptake. On-Farm Benefits and Costs of the Manure Treatment BMP A series of survey questions aimed at assessing the costs and benefits experienced by farmers due to the adoption of the Manure Treatment BMP were asked. The following sections present the results of these survey questions. Changes in Flexibility and Targeting of Manure Application The majority of respondents (74%) indicated that they had more flexibility in the timing of manure application since implementing their Manure Treatment BMP. Similarly, the majority of producers (70%) indicated that they felt they were better able to target their nutrients to where they were needed. Generally producers indicated that they were able to spread liquid manure on grass between cuts without risk of burning the crop or causing surface crusting. Some producers indicated that they felt that the liquid manure was able to get to the roots of the crop faster than their untreated manure. Change in Crop Yield and Quality Approximately half of respondents (52%) indicated that they had noticed an improvement in crop yields. Of these producers, they indicated that their grass yields had increased by 10% and in some cases up to 25%. Producers indicated that where crop yields had improved, it was likely due to the ability to apply liquid manure between cuts in the summer without surface crusting and burning . It is important to note here that for the majority of respondents the 2013 cropping season was their first season since implementing their Manure Treatment BMP, and therefore responses are likely skewed to some degree by other factors. Bedding Expenditures Respondents were asked if their total bedding costs changed as a result of implementing the BMP. On average, for farms that recycle bedding either by use of a bedding recovery system or solid/liquid separator, $29,500 in annual bedding cost savings were realized, taking into account the cost of bedding for their operation for two to three years prior to
Social, Economic and Environmental Evaluation of Beneficial Management Practices, Series 3
37
implementing their Manure Treatment BMP. Farms that installed solid/liquid separation saved an average of $21,800 annually in bedding costs. The average farm that installed a bedding recovery system saved $33,400 in annual bedding costs. The types of bedding used prior to implementing of the Manure Treatment BMP included sand, wood shavings, bedding pellets and straw. Most producers indicated that they still use either sand, shavings or straw to a lesser extent in addition to the composted bedding product. Bedding/By-product Sales Respondents were asked if they sold bedding and/or separated solids byproducts associated with the BMP. Eight respondents (35%) indicated that at some point since implementing their Manure Treatment BMP they have sold manure byproducts. Six producers indicated that they have sold some solid manure for bedding, and two producers indicated that they have sold some manure as a soil amendment. One producer indicated that they sold some solid manure for a potting mix used by a greenhouse. These producers, on average sold $9,125 in manure by-products annually. Animal Health Changes Respondents were asked if they noticed changes in animal health as a result of using treated manure as bedding. Half of respondents (50%) indicated that their animal health had improved. Half of respondents indicated that they did not notice a change in animal health since implementing the Manure Treatment BMP. Reasons for health improvement included:
Fewer hock sores;
Less mastitis; and
Fewer abrasions. Several producers indicated that their cows are more comfortable on manure bedding because they are providing deeper bedding than prior to implementing their Manure Treatment BMP. Anecdotally, producers indicated that there was an adjustment period where higher somatic cell counts were experienced when first switching to manure bedding. However, over time and with the appropriate moisture content of recycled bedding, that has improved. Fertilizer Expenditures Respondents were asked if their average annual chemical fertilizer expenditures changed as a result of implementing the Manure Treatment BMP. Most producers were not able to answer this question because they only had one seasons experience with the BMP on their farm. For respondents who did indicate that their fertilizers costs had changed (5 respondents), on average, these producers realized $2,166.67 per year in fertilizer cost savings. One respondent indicated that the installation of their solid/liquid separation system realized $10,000 per year in cost savings.27 The average farm that installed a bedding recovery system indicated that they realized $600 per year per farm in fertilizer cost savings since implementing a manure treatment system. Note that the
27 Average fertilizer savings of $10,000 are based on one respondent and therefore we assume fertilizer savings to be $0 for the DCF and CBA to ensure a conservative estimate.

Social, Economic and Environmental Evaluation of Beneficial Management Practices, Series 3
38
change in fertilizer expenditures may be attributed to factors other than the Manure Treatment BMP, such as changes in the price of fertilizer. Manure Application Expenditures Respondents were asked if their manure application costs (if a custom applicator was used) and/or labour changed as a result of implementing the Manure Treatment BMP. On average, each BMP resulted in manure application cost savings of $2,600 per farm per year and labour savings of 86.4 hours (a 44% decrease) valued at $1,296 per farm annually. Farms that installed solid/liquid separation realized $2,500 per year in manure application cost savings, a 14% decrease, as a result of adopting the Manure Treatment BMP. Labour savings figures were not available due to insufficient data. The average farm that installed a bedding recovery system realized a manure application cost savings of $2,667 per year, a 12% decrease. Each farm also experience labour savings of 86.4 hours per year (a 44% decrease) equal to $1,296 per year as a result of implementing the BMP. Labour Requirements Respondents were asked if the labour required to maintain their manure treatment system changed as a result of adopting the BMP. On average, each farm experienced an increase of 51.43 hours of labour per year equal to $772 or a 35% increase as a result of adopting the BMP.28 The increase in labour was attributed to additional maintenance and repairs of manure treatment equipment. Farms that installed solid/liquid separation realized an increase of 179 hours per year, or $2,685. The average farm that installed a bedding recovery system experienced a decrease of 17 hours of labour per year equal to $253 or an 8% decrease as a result of adopting the BMP. It is not clear why there was a difference in the amount of labour required between producers who installed solid/liquid separation equipment and those who implemented bedding recovery systems. For those who realized labour savings, less need to agitate pits and not having to clean out solids at the bottom of pits were cited as the reasons why. It is important to note that these figures may change as producers become more experienced with manure treatment technology on their farms. Repair and Maintenance Requirements Respondents were asked if their repair and maintenance costs differed between the previous manure treatment system and the Manure Treatment BMP they implemented. On average, each farm realized a $6,871 per year cost increase as a result of adopting the BMP. Each farm that implemented a solid/liquid separation system experienced a $7,423 annual increase in repair and maintenance costs. Each farm that implemented a bedding recovery system experienced a $6,601 annual increase in operational costs. The increase in cost was generally attributed to replacement of screens in the dewatering equipment. It is important to note that these figures may change as producers become more experienced with manure treatment technology on their farms.
28
A cost of $15/hour was used to calculate the value of labour.

Social, Economic and Environmental Evaluation of Beneficial Management Practices, Series 3
39
Operational Expenses Respondents were asked if their operational costs differed between the previous manure treatment system and the Manure Treatment BMP they implemented. On average, each farm realized a $4,146 per year cost increase as a result of adopting the BMP. Each farm that implemented a solid/liquid separation system experienced a $3,080 annual increase in operational costs. Each farm that implemented a bedding recovery system experienced a $4,501 annual increase in operational costs. These costs are generally attributed to the additional power (mostly hydro-electricity) needed to operate the systems. Manure Treatment BMP Discounted Cash Flow Analysis To understand the financial outcomes of the Manure Treatment BMP to the farmer, a discounted cash flow analysis (DCF) was conducted. The DCF is used to present the private costs and benefits associated with the Manure Treatment BMP over the life of the BMP to a producer. The breakeven year for each BMP is also presented. 29 The project lifespan of a Manure Treatment BMP is assumed to be 15 years. Values included in the DCF included:
Producer capital contribution to project;
Additional capital expenses incurred by producer;
Repair and maintenance expenditures;
Operational expenditures;
Labour expenditures;
Fertilizer savings;
Manure application savings;
Bedding/Byproduct sales;
Bedding savings; and
Animal health savings. Depending on the specification of the discount rate, aggregate benefits for all BMP projects ranged from a low of $320,168 to a high of $561,077 while the costs ranged from a low of $282,385 to a high of $358,307 (Table 16). The net present values at all discount rates were positive. They ranged from a low of $37,783 in the case of an 8% discount rate to a high of $202,769 in the case of a 0% discount rate. All NPVs are positive due to the benefits associated with the BMP and the long life span.
Table 16. Private Benefit, Cost, and NPV of the Discounted Cash Flow Analysis for all BMP Projects
a
Discount Rate
Benefit Cost Net Present Value
Breakeven Year
0 % $561,077 $358,307 $202,769 8
3 % $446,540 $322,211 $124,329 9
8 % $320,168 $282,385 $37,783 11 a Values are in 2013 Canadian dollars.
29
The breakeven year is the year of the project (Year 0 to 15) where the NPV of the project for s specified discount rate becomes positive.

Social, Economic and Environmental Evaluation of Beneficial Management Practices, Series 3
40
Depending on the specification of the discount rate aggregate benefits for solid/liquid separation BMP projects ranged from a low of $222,669 to a high of $390,214 while the costs ranged from a low of $241,495 to a high of $326,427 (Table 17). The net present values were positive for 0% and 3% discount rates and negative for the 8% discount rate. They ranged from a low of -$18,827 in the case of an 8% discount rate to a high of $63,787 in the case of a 0% discount rate.
Table 17. Private Benefit, Cost, and NPV of the Discounted Cash Flow Analysis for Solid/Liquid Separation BMP projects
a
Discount Rate
Benefit Cost Net Present Value
Breakeven Year
0 % $390,214 $326,427 $63,787 11
3 % $310,557 $286,047 $24,509 13
8 % $222,669 $241,495 -$18,827 - a Values are in 2013 Canadian dollars.
Depending on the specification of the discount rate aggregate benefits for Bedding Recovery System BMP projects ranged from a low of $344,004 to a high of $602,847 while the costs ranged from a low of $294,696 to a high of $366,200 (Table 18). The net present values at all discount rates were positive. They ranged from a low of $49,308 in the case of an 8% discount rate to a high of $236,647 in the case of a 0% discount rate.
Table 18. Private Benefit, Cost, and NPV of the Discounted Cash Flow Analysis for Bedding Recovery System BMP projects
a
Discount Rate
Benefit Cost Net Present Value
Breakeven Year
0 % $602,847 $366,200 $236,647 7
3 % $479,783 $332,204 $147,579 8
8 % $344,004 $294,696 $49,308 11 a Values are in 2013 Canadian dollars.
5.9 Public Benefits of the Manure Treatment BMP To understand the economic outcomes of BMP adoption, a cost benefit analysis methodology was used. The project lifespan of a Manure Treatment BMP is assumed to be 15 years. Appendix III contains a summary of the average costs and benefits used in the Manure Treatment BMP CBA. Values included in the CBA included:
BMP Program cost-share contribution to project;
Producer capital contribution to project;
Additional capital expenses incurred by producer;
Repair and maintenance expenditures;
Operational expenditures;
Labour expenditures;
Fertilizer savings;

Social, Economic and Environmental Evaluation of Beneficial Management Practices, Series 3
41
Manure application savings;
Manure application labour savings;
Bedding/Byproduct sales;
Bedding savings; and
Animal health savings. CBA Summary All of the NPV calculated for the Manure Treatment BMP to date are negative because the projects were implemented fairly recently. NPV estimates for the BMP over the life of the program all positive with the exception of the NPV of Solid/Liquid separation projects at an 8% discount rate. NPV estimates for adding one farmer to the BMP program at all positive with the exception of the NPV of Solid/Liquid separation projects at a 3% and 8% discount rate. The following sections present the details of the CBA. Net Present Value of the Program to Date Depending on the specification of the discount rate, aggregate benefits for all BMP projects ranged from a low of $1,645,825 to a high of $1,754,945 while the costs ranged from a low of $5,492,205 to a high of $6,338,225 (Table 19). The net present values at all discount rates were negative. They ranged from a low of -$4,583,281 in the case of an 8% discount rate to a high of -$3,846,380 in the case of a 0% discount rate. All NPVs are negative due to the relatively short time that they have been installed on-farm.
Table 19. Benefit, Cost, and NPV of the Program to Date for all BMP projectsa
Discount Rate Benefit Cost Net Present Value
0 % $1,645,825 $5,492,205 -$3,846,380 3 % $1,685,710 $5,797,129 -$4,111,419 8 % $1,754,945 $6,338,225 -$4,583,281
a Values are in 2013 Canadian dollars.
Depending on the specification of the discount rate, aggregate benefits for solid/liquid separation projects ranged from a low of $390,214 to a high of $422,956, while the costs ranged from a low of $1,283,418 to a high of $1,501,736 (Table 20). The net present values calculated for the program to date were negative. They ranged from a low of -$1,078,779 in the case of an 8% discount rate to a high of -$893,203 in the case of a 0% discount rate.
Table 20. Benefit, Cost, and NPV of the Program to Date for Solid/Liquid Separation projects
a
Discount Rate Benefit Cost Net Present Value
0 % $390,214 $1,283,418 -$893,203 3 % $402,133 $1,361,380 -$959,247 8 % $422,956 $1,501,736 -$1,078,779
a Values are in 2013 Canadian dollars.
Depending on the specification of the discount rate, aggregate benefits for bedding recovery separation BMP projects ranged from a low of $1,165,504 to a high of $1,232,164, while the costs ranged from a low of $4,130,740 to a high of $4,733,013

Social, Economic and Environmental Evaluation of Beneficial Management Practices, Series 3
42
(Table 21). The net present values calculated for the program to date were negative. They ranged from a low of -$3,500,849 in the case of an 8% discount rate to a high of -$2,965,236 in the case of a 0% discount rate.
Table 21. Benefit, Cost, and NPV of the Program to Date for Bedding Recovery System projects.
Discount Rate Benefit Cost Net Present Value
0 % $1,165,504 $4,130,740 -$2,965,236 3 % $1,189,946 $4,348,937 -$3,158,991 8 % $1,232,164 $4,733,013 -$3,500,849
a Values are in 2013 Canadian dollars.
Net Present Value over the Expected Life of the Program Depending on the specification of the discount rate, aggregate benefits for all BMP projects ranged from a low of $8,565,583 to a high of $12,904,763 while the costs ranged from a low of $8,484,598 to a high of $9,040,460 (Table 22). The net present values at all discount rates were positive. They ranged from a low of $80,984 in the case of an 8% discount rate to a high of $3,864,303 in the case of a 0% discount rate. All NPVs are positive due to the benefits associated with the BMP and the long life span.
Table 22. Benefit, Cost, and NPV over the Expected Life of the Program for all BMP projects
a
Discount Rate Benefit Cost Net Present Value
0 % $12,904,763 $9,040,460 $3,864,303 3 % $10,874,132 $8,692,860 $2,181,271 8 % $8,565,583 $8,484,598 $80,984
a Values are in 2013 Canadian dollars.
Depending on the specification of the discount rate, aggregate benefits for solid/liquid separation projects ranged from a low of $1,848,304 to a high of $2,731,500, while the costs ranged from a low of $2,191,329 to a high of $2,470,257 (Table 23). The net present values were positive for 0% and 3% discount rates and negative for the 8% discount rate. They ranged from a low of -$343,025 in the case of an 8% discount rate to a high of $261,243 in the case of a 0% discount rate.
Table 23. Benefit, Cost, and NPV over the Expected Life of the Program for a Solid/Liquid Separation project
a
Discount Rate Benefit Cost Net Present Value
0 % $2,731,500 $2,470,257 $261,243 3 % $2,317,917 $2,307,283 $10,634 8 % $1,848,304 $2,191,329 -$343,025
a Values are in 2013 Canadian dollars.
Depending on the specification of the discount rate, aggregate benefits for bedding recovery separation BMP projects ranged from a low of $6,347,796 to a high of $9,645,554, while the costs ranged from a low of $6,146,191 to a high of $6,473,328 (Table 24). The net present values calculated for the program to date were positive.

Social, Economic and Environmental Evaluation of Beneficial Management Practices, Series 3
43
They ranged from a low of $201,605 in the case of an 8% discount rate to a high of $3,172,227 in the case of a 0% discount rate.
Table 24. Benefit, Cost, and NPV over the Expected Life of the Program for a Bedding Recovery System
a
Discount Rate Benefit Cost Net Present Value
0 % $9,645,554 $6,473,328 $3,172,227 3 % $8,102,698 $6,258,564 $1,844,135 8 % $6,347,796 $6,146,191 $201,605
a Values are in 2013 Canadian dollars.
Net Present Value of Adding one Farmer in 2013 This subsection reports on the value of one farm implementing a Manure Treatment BMP in 2013. This is the value of the BMP, per BMP project, based on the average aggregate costs and benefits. Depending on the specification of the discount rate, aggregate benefits for all BMP projects ranged from a low of $320,168 to a high of $561,077 while the costs ranged from a low of $317,141 to a high of $393,063 (Table 25). The net present values at all discount rates were positive. They ranged from a low of $3,027 in the case of an 8% discount rate to a high of $168,013 in the case of a 0% discount rate. All NPVs are positive due to the benefits associated with the BMP and the long life span.
Table 25. Benefit, Cost, and NPV of Adding One Farmer with a Manure Treatment BMP project to the Program in 2013
a
Discount Rate
Benefit Cost Net Present Value
Breakeven Year
0 % $561,077 $393,063 $168,013 9 3 % $446,540 $356,967 $89,573 10 8 % $320,168 $317,141 $3,027 15
a Values are in 2013 Canadian dollars.
Depending on the specification of the discount rate, aggregate benefits for solid/liquid separation projects ranged from a low of $222,669 to a high of $390,214, while the costs ranged from a low of $267,962 to a high of $352,894 (Table 26). The net present values were positive for the 0% discount rate and negative for the 3% and 8% discount rates. They ranged from a low of -$45,293 in the case of an 8% discount rate to a high of $37,320 in the case of a 0% discount rate.
Table 26. Benefit, Cost, and NPV of Adding One Farmer with a Solid/Liquid Separation to the Program in 2013
a
Discount Rate
Benefit Cost Net Present Value
Breakeven Year
0 % $390,214 $352,894 $37,320 13 3 % $310,557 $312,514 -$1,957 - 8 % $222,669 $267,962 -$45,293 -
a Values are in 2013 Canadian dollars.

Social, Economic and Environmental Evaluation of Beneficial Management Practices, Series 3
44
Depending on the specification of the discount rate, aggregate benefits for bedding recovery separation BMP projects ranged from a low of $344,004 to a high of $602,847, while the costs ranged from a low of $33,078 to a high of $404,583 (Table 27). The net present values calculated for the program to date were positive. They ranged from a low of $10,926 in the case of an 8% discount rate to a high of $198,264 in the case of a 0% discount rate.
Table 27. Benefit, Cost, and NPV of Adding One Farmer with a Bedding Recovery System to the Program in 2013
a
Discount Rate
Benefit Cost Net Present Value
Breakeven Year
0 % $602,847 $404,583 $198,264 9 3 % $479,783 $370,587 $109,196 10 8 % $344,004 $333,078 $10,926 14
a Values are in 2013 Canadian dollars.
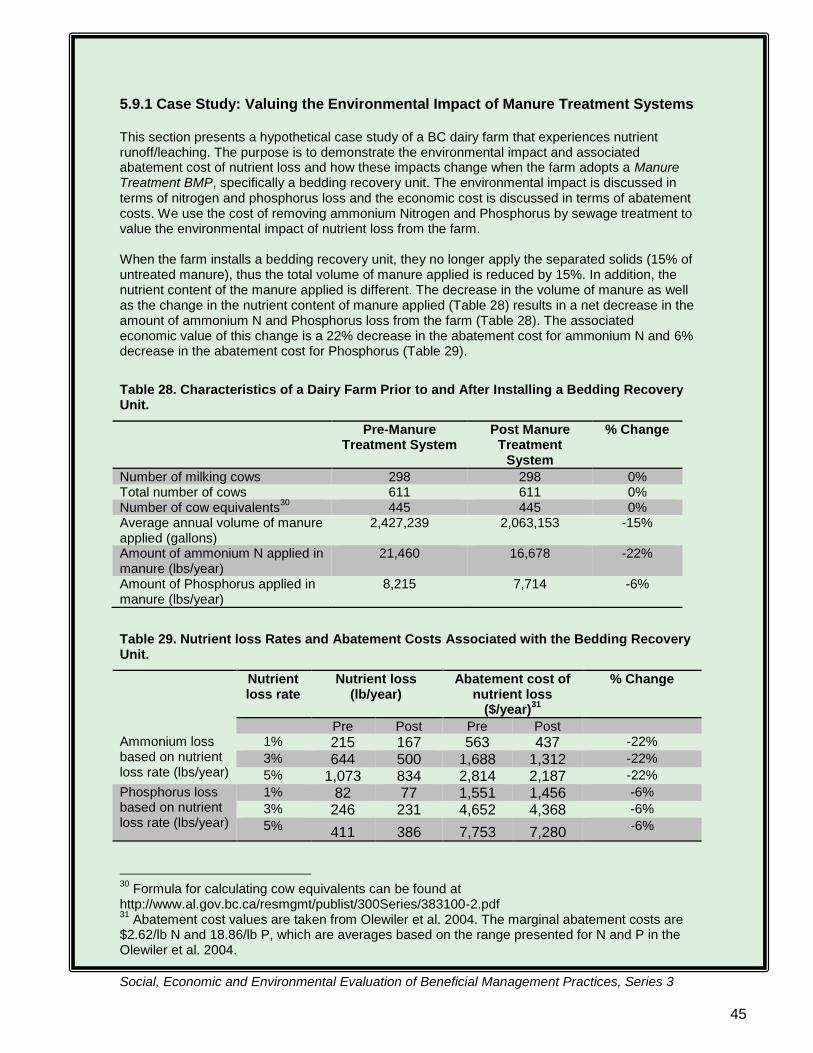
Social, Economic and Environmental Evaluation of Beneficial Management Practices, Series 3
45
5.9.1 Case Study: Valuing the Environmental Impact of Manure Treatment Systems This section presents a hypothetical case study of a BC dairy farm that experiences nutrient runoff/leaching. The purpose is to demonstrate the environmental impact and associated abatement cost of nutrient loss and how these impacts change when the farm adopts a Manure Treatment BMP, specifically a bedding recovery unit. The environmental impact is discussed in terms of nitrogen and phosphorus loss and the economic cost is discussed in terms of abatement costs. We use the cost of removing ammonium Nitrogen and Phosphorus by sewage treatment to value the environmental impact of nutrient loss from the farm. When the farm installs a bedding recovery unit, they no longer apply the separated solids (15% of untreated manure), thus the total volume of manure applied is reduced by 15%. In addition, the nutrient content of the manure applied is different. The decrease in the volume of manure as well as the change in the nutrient content of manure applied (Table 28) results in a net decrease in the amount of ammonium N and Phosphorus loss from the farm (Table 28). The associated economic value of this change is a 22% decrease in the abatement cost for ammonium N and 6% decrease in the abatement cost for Phosphorus (Table 29).
Table 28. Characteristics of a Dairy Farm Prior to and After Installing a Bedding Recovery Unit.
Table 29. Nutrient loss Rates and Abatement Costs Associated with the Bedding Recovery Unit.
Nutrient loss rate
Nutrient loss (lb/year)
Abatement cost of nutrient loss
($/year)31
% Change
Pre Post Pre Post Ammonium loss based on nutrient loss rate (lbs/year)
1% 215 167 563 437 -22%
3% 644 500 1,688 1,312 -22%
5% 1,073 834 2,814 2,187 -22%
Phosphorus loss based on nutrient loss rate (lbs/year)
1% 82 77 1,551 1,456 -6%
3% 246 231 4,652 4,368 -6%
5% 411 386 7,753 7,280
-6%
30
Formula for calculating cow equivalents can be found at http://www.al.gov.bc.ca/resmgmt/publist/300Series/383100-2.pdf 31
Abatement cost values are taken from Olewiler et al. 2004. The marginal abatement costs are $2.62/lb N and 18.86/lb P, which are averages based on the range presented for N and P in the Olewiler et al. 2004.
Pre-Manure Treatment System
Post Manure Treatment
System
% Change
Number of milking cows 298 298 0% Total number of cows 611 611 0% Number of cow equivalents
30 445 445 0%
Average annual volume of manure applied (gallons)
2,427,239 2,063,153 -15%
Amount of ammonium N applied in manure (lbs/year)
21,460 16,678 -22%
Amount of Phosphorus applied in manure (lbs/year)
8,215 7,714 -6%

Social, Economic and Environmental Evaluation of Beneficial Management Practices, Series 3
46
5.10 Manure Treatment BMP Financial and Economic Analyses for Smaller Dairies To understand the financial and economic outcomes of the Manure Treatment BMP to the smaller dairies than the average size of those who have implemented the BMP to date, we conducted a discounted cash flow analysis (DCF) using a subset of BMP adopters. Dairies with fewer than 200 milking cows were selected (n = 5) the average dairy included in the analysis milked 130 cows. All smaller dairies installed Bedding Recovery Systems. Discounted Cash Flow Analysis for Smaller Dairies The DCF is used to present the private costs and benefits associated with the Manure Treatment BMP over the life of the BMP to a small dairy producer. The project lifespan of a Manure Treatment BMP is assumed to be 15 years. Values included in the DCF included:
Producer capital contribution to project;
Additional capital expenses incurred by producer;
Repair and maintenance expenditures;
Operational expenditures
Labour expenditures;
Fertilizer savings;
Manure application savings;
Bedding/Byproduct sales;
Bedding savings; and
Animal health savings. Depending on the specification of the discount rate, aggregate benefits for all BMP projects ranged from a low of $301,764 to a high of $528,825 while the costs ranged from a low of $331,170 to a high of $408,124 (Table 30). The net present values for 0% and 3% discount rates were positive and negative for the 8% discount rate. They ranged from a low of -$29,406 in the case of an 8% discount rate to a high of $120,701 in the case of a 0% discount rate.
Table 30. Private Benefit, Cost, and NPV of the Discounted Cash Flow Analysis for BMP projects implemented by smaller dairies (<200 milking cows)
Discount Rate
Benefit Cost Net Present Value
Breakeven Year
0 % $528,825 $408,124 $120,701 10 3 % $420,872 $371,537 $49,335 12 8 % $301,764 $331,170 -$29,406 -
a Values are in 2013 Canadian dollars.

Social, Economic and Environmental Evaluation of Beneficial Management Practices, Series 3
47
Manure Treatment BMP Cost Benefit Analysis for Smaller Dairies To understand the economic outcomes of BMP adoption to small dairies, a cost benefit analysis was conducted.32 The project lifespan of a Manure Treatment BMP is assumed to be 15 years. Values included in the CBA included:
BMP Program cost-share contribution to project;
Producer capital contribution to project;
Additional capital expenses incurred by producer;
Repair and maintenance expenditures;
Operational expenditures;
Labour expenditures;
Fertilizer savings;
Manure application savings;
Bedding/Byproduct sales;
Bedding savings;
Animal health savings. Net Present Value of the Program to Date Depending on the specification of the discount rate, aggregate benefits for all BMP projects ranged from a low of $352,550 to a high of $376,034 while the costs ranged from a low of $1,453,976 to a high of $1,689,677 (Table 31). The net present values at all discount rates were negative. They ranged from a low of -$1,313,643 in the case of an 8% discount rate to a high of -$1,101,426 in the case of a 0% discount rate.
Table 31. Benefit, Cost, and NPV of the Program to Date for BMP projects implemented by smaller dairies (<200 milking cows)
Discount Rate Benefit Cost Net Present Value
0 % $352,550 $1,453,976 -$1,101,426 3 % $361,139 $1,538,907 -$1,177,768 8 % $376,034 $1,689,677 -$1,313,643
a Values are in 2013 Canadian dollars.
Net Present Value over the Expected Life of the Program Depending on the specification of the discount rate, aggregate benefits for all BMP projects ranged from a low of $1,766,314 to a high of $2,644,125 while the costs were ranged from a low of $2,160,859 to a high of $2,230,618 (Table 32). The net present values for 0% and 3% discount rates were positive and negative for the 8% discount rate. They ranged from a low of -$394,545 in the case of an 8% discount rate to a high of $413,507 in the case of a 0% discount rate.
32
Refer to the first BMP evaluation report for a detailed summary of the CBA methods: http://www.agf.gov.bc.ca/resmgmt/EnviroFarmPlanning/AGRI_BMP_Report_FINAL.pdf

Social, Economic and Environmental Evaluation of Beneficial Management Practices, Series 3
48
Table 32. Benefit, Cost, and NPV over the Expected Life of the Program for BMP projects implemented by small dairies (<200 milking cows)
a
Discount Rate Benefit Cost Net Present Value
0 % $2,644,125 $2,230,618 $413,507 3 % $2,233,697 $2,173,539 $60,158 8 % $1,766,314 $2,160,859 -$394,545
a Values are in 2013 Canadian dollars.
Net Present Value of Adding one Farmer in 2013 Depending on the specification of the discount rate, aggregate benefits for all BMP projects ranged from a low of $301,764 to a high of $528,825 while the costs ranged from a low of $369,170 to a high of $446,124 (Table 33). The net present values for 0% and 3% discount rates were positive and negative for the 8% discount rate. They ranged from a low of -$67,406 in the case of an 8% discount rate to a high of $82,701 in the case of a 0% discount rate.
Table 33. Benefit, Cost, and NPV of Adding One Small Dairy Farmer with a Manure Treatment BMP project to the Program in 2013
a
Discount Rate
Benefit Cost Net Present Value
Breakeven Year
0 % $528,825 $446,124 $82,701 12 3 % $420,872 $409,537 $11,335 15 8 % $301,764 $369,170 -$67,406 -
a Values are in 2013 Canadian dollars.

Social, Economic and Environmental Evaluation of Beneficial Management Practices, Series 3
49
5.11 Social Factors of Manure Treatment BMP Uptake This section will present the results of a series of questions about various personal and social aspects of BMP uptake to try to understand the following:
The motivations for uptake of the Manure Treatment BMP; and
The barriers to uptake of the Manure Treatment BMP by other farmers.33 Motivations for Uptake of the Manure Treatment Storage BMP When asked explicitly the main reasons why they decided to implement the Manure Treatment BMP, respondents indicated that their main reasons were to:
Reduce bedding costs (55%);
Improve crop yields (14%);
Reduce surface crusting when applying manure to cropland (14%);
Increase manure storage capacity (14%); and
Improve cow health (5%).
Respondents were also asked to rate on a scale of 1 to 5 (not important to very important), the reasons why they chose to adopt the Manure Treatment BMP from a list of possible motivations (Table 34). Producers indicated that all of the possible motivations listed were at least somewhat important motivating factors when deciding to implement the Manure Treatment BMP. Overall “improving the profitability of my operation” was listed as the most important motivating factor (4.6), which is consistent with reducing bedding costs and improving crop yields. Other important factors were improving manure/nutrient management (4.3) and contributing to a positive image for the dairy industry (4.2).
Table 34. Motivating factors for uptake of the Manure Treatment BMP.
Motivation Average Score
Improving the profitability of my operation 4.6
Improving manure/nutrient management 4.3
Contributing to a positive industry image 4.2
Improving the long-term sustainability of my operation 4.1
Demonstrating stewardship 3.6
Limiting the farm's impact on the environment 3.6
Meeting regulatory requirements 3.3
Facilitating increase in herd size 3.0
Other potential factors that may contribute to uptake of the Manure Treatment BMP include the size of the farm and age of the main farm operator. Evaluation results indicate that those who implemented Manure Treatment BMPs milk approximately double the average amount of cows for dairy farms in BC. The average evaluation participant was younger than the average age of farmers in BC.
33
Motivations and barriers were determined from the BMP evaluation survey and interviews. Additional insight into the barriers to BMP uptake was provided by interviews with non-adopters.

Social, Economic and Environmental Evaluation of Beneficial Management Practices, Series 3
50
Barriers to Uptake of the Manure Treatment BMP Respondents were asked to indicate what the main barriers to uptake of the Manure Treatment BMP are for other producers in their industry. Responses included:
High costs and other financial barriers (39%);
Implementation costs are too high for smaller farms (22%);
Concerns/sigma about using manure bedding (16%);
The status quo is acceptable for the farm (11%);
Lack of information/understanding of the technology (6%); and
Lack of pressure from neighbours to improve practices (6%).
Similar to the motivation question described above, respondents were asked to rate on a scale from 1 to 5 (not a barrier to a large barrier) a set of barriers to Manure Treatment BMP uptake. The exact wording of the question was “In your opinion, how significant are the following barriers to the adoption of the Manure Treatment BMP for other producers in your industry?” The high cost of BMP implementation was rated as the largest barrier to uptake of the BMP (4.1). The financial situation of the farm and inadequate cost share levels provided through the BMP Program were also considered to be barriers to uptake of the BMP. (Table 35).
Table 35. Barriers to uptake of the Manure Treatment BMP.
Barrier Average Score
The capital costs of BMP implementation 4.1
The financial situation of the farm 3.6
Inadequate cost-share levels provided through the BMP Program 3.4
No family succession plan for the farm 3.2
A lack of understanding about which BMPs will benefit operations 2.7
Barriers to accessing funding through the BMP Program 2.6
A lack of understanding about how the BMP will benefit operations 2.5
A lack of support from public agencies 2.2
A lack of time or labour 2.1
A lack of industry pressure 2.0
Other environmental priorities take precedent 1.8
Lack of awareness of risks to the environment from farm practices 1.7
A lack of public pressure 1.4
To further understand the barriers to uptake of the Manure Treatment BMP, four interviews were conducted with dairy producers in the Fraser Valley who had not implemented a manure treatment technology. The average size of these producers milking herd was 115 cows, which was more consistent with the average size of dairy farms in BC at the time of the evaluation (125 milking cows). All four producers indicated that they had some familiarity with/knowledge of the technology. These producers indicated that the biggest barrier for them was that the initial infrastructure costs were too high to justify implementation of the technologies on their

Social, Economic and Environmental Evaluation of Beneficial Management Practices, Series 3
51
farm. Beyond the purchase of the treatment technology, farms often need to upgrade their electrical, buildings and other infrastructure at the same time. For larger dairy farm operations, that have higher bedding costs, the payback period is sooner. However, bedding costs for the average dairy farm are already relatively low and therefore they felt it may take between 10 to 15 years for the systems to pay for themselves. Two producers indicated that their current manure storage facilities were adequate for their farm operation and would consider manure treatment technologies if that were not the case. One producer indicated that they had concerns with using manure bedding for milking cows as it could lead to an increase in somatic cell counts. They had no concern about using the bedding for the heifer barn. In another case, a producer indicated that sand bedding was considered the industry gold standard and using manure bedding may be considered an inferior practice. Increased odour was a concern for one producer who believed that there was potential for increased odour during application of the liquid fraction of the manure. Evaluation results indicated that some producers experienced increased manure odours during application depending on their method of application. For example, some producers were spreading a portion of the liquid fraction using an irrigation gun, which resulted in increased odour. Preferred Sources of Information Understanding the producers preferred information channels may help to shed light on the barriers to awareness of the Manure Treatment BMP as well as provide insight into how the successful promotion of the Manure Treatment BMP may be accomplished in the future. The most preferred information source selected by respondents was the producers’ peers (95% of respondents). Agricultural supply companies and agricultural magazines were also highly preferred by respondents as sources of information (Table 36). Two producers indicated that they had been on a tour in the United States to view the manure treatment technology in action. The tour helped them to understand the technology as well as allowed them to see it in action prior to the technology becoming widespread in BC.
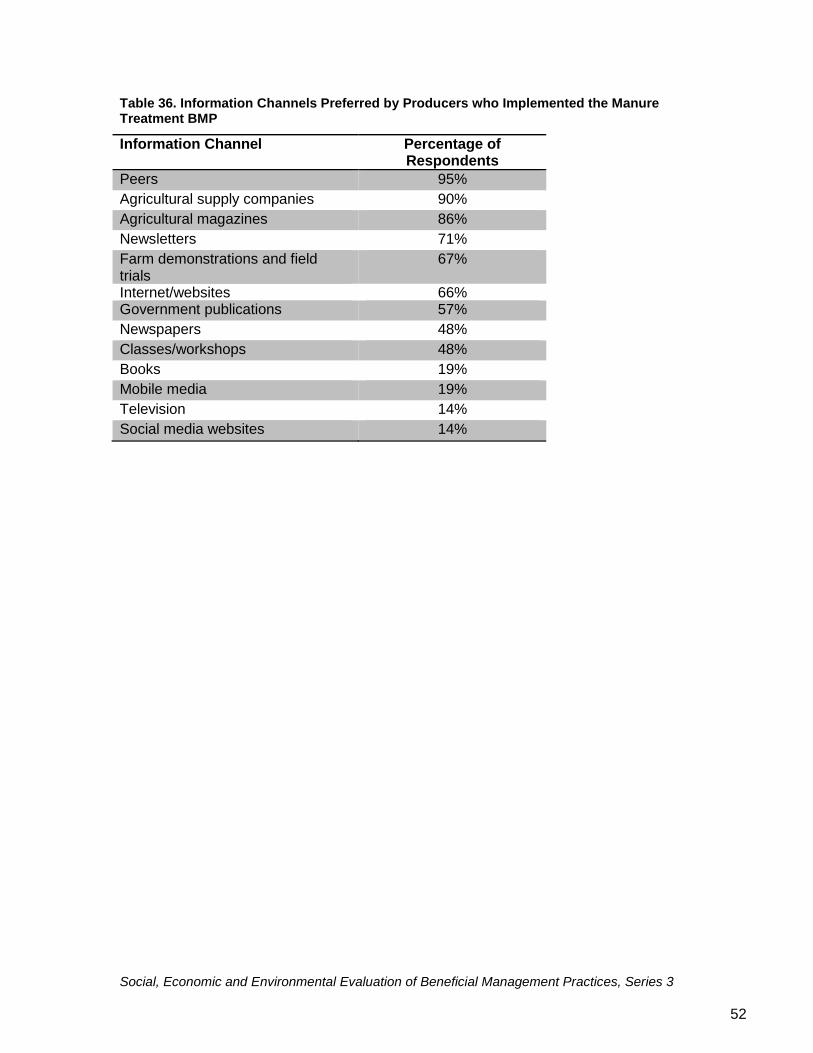
Social, Economic and Environmental Evaluation of Beneficial Management Practices, Series 3
52
Table 36. Information Channels Preferred by Producers who Implemented the Manure Treatment BMP
Information Channel Percentage of Respondents
Peers 95%
Agricultural supply companies 90%
Agricultural magazines 86%
Newsletters 71%
Farm demonstrations and field trials
67%
Internet/websites 66% Government publications 57%
Newspapers 48%
Classes/workshops 48%
Books 19%
Mobile media 19%
Television 14%
Social media websites 14%

Social, Economic and Environmental Evaluation of Beneficial Management Practices, Series 3
53
6.0 Manure Treatment BMP SWOT Analysis, Conclusions and Recommendations
A SWOT Analysis is presented in this section to organize some of the main findings of the BMP evaluation as well as present anecdotal information that may not be presented in the above sections. Note that this section is only the preliminary step in a SWOT analysis and further steps including a detailed analysis and development of an action plan often follows this step in order to direct policy.
6.1 Manure Treatment BMP SWOT Analysis Strengths
For those who use the manure byproduct as bedding, bedding costs have been drastically reduced by the BMP.
The BMP has increased the flexibility of manure spreading timing, allowing producers to avoid spreading during poor conditions.
The BMP can facilitate targeting of nutrients to areas of specific nutrient deficiency.
The BMP has allowed farmers to utilize manure more effectively as a fertilizer, particularly during the summer months between cuts of grass.
Anecdotally, the BMP contributes to improved grass crop yields as manure may be applied as fertilizer during the growing season as there is less risk of build up of organic matter on the soil surface (i.e. surface crusting).
The BMP may result in operational efficiencies, depending on the manure management practices of the farm previously. Some farmers indicated that they spend much less time agitating, cleaning solids out of pits and fixing blockages while spreading manure.
The BMP has a positive financial outcome, taking 9 years for producers who have implemented the BMP already to break even (based on an average farm size of 298 milking cows and a discount rate of 3%).
Implementation of the BMP may lead to other positive changes in the manure management of the farm such as implementation of draglines and injection application equipment.
The use of composted bedding in general, has a positive impact on animal health, generally reducing hock sores, other issues of lameness and in some cases mastitis.
Weaknesses
The capital cost of an average Manure Treatment BMP appears to be too high for the average BC dairy farm.
The uptake of the BMP is concentrated in the Lower Mainland area. Few producers have adopted this technology outside this area.
The uptake of the BMP has mostly been confined to the dairy industry, other technologies specific to the poultry and other livestock industries have not been introduced in the province yet.
The implementation of the BMP does not appear to effectively increase manure storage capacity for some producers; therefore, in these cases implementation of the BMP may not reduce the need for manure storage expansion.

Social, Economic and Environmental Evaluation of Beneficial Management Practices, Series 3
54
According to respondents, the costs of maintaining and operating the Manure Treatment BMP are currently higher than expected.
According to some respondents, the DM content of the treatment manure was not meeting their expectations, resulting in a need for an additional Solid/Liquid Separator. This issue did not appear to be specific to any particular technology.
Opportunities
Producers appear to respond positively to tours and demos of the technology. There may be an opportunity to increase BMP uptake by highlighting manure treatment technologies on dairy tours.
Producer awareness of the nutrient benefits of manure is increasing, potentially increasing demand for this BMP in the future.
Respondents indicated that there may be an opportunity to treat neighbouring farms dairy or poultry manure, reducing the implementation costs of the technology while spreading the benefits amongst other producers. It is important to note that with the transport of manure between farms, there is an increased risk of disease transfer between farm operations. Producers who implement pooled Manure Treatment BMPs should have a biosecurity plan in place to mitigate this risk.
Currently few producers are selling manure by-products; however several indicated that they would consider it in the future if marketing avenues were established.
Threats
Farms with no plans for family succession lack the incentive to invest in Manure Treatment BMPs.
In the past there has been a stigma around using manure bedding for cows. This view may still prevalent amongst producers.
6.2 Conclusions and Recommendations for the Manure Treatment BMP This section provides an overview of the main conclusions of the BMP evaluation. Recommendations will also be provided where appropriate. Note that these conclusions and recommendations are based on the authors’ opinions and reflect both qualitative and quantitative information collected during the evaluation. Did the BMP have the outcomes it was designed to have? To recap, the Manure Treatment BMP is designed to have the following environmental outcomes:
Reduction in stored manure volume resulting in application of manure in more ideal conditions; and
A reduction in excess manure nutrient application on cropland due to the ability to viably export solid manure off-farm.
The Manure Treatment BMP is meeting the targeted outcomes to have to some degree. Note however, that these outcomes are limited in their applicability across BC since the

Social, Economic and Environmental Evaluation of Beneficial Management Practices, Series 3
55
dairy farms adopting these technologies to date are more than double the size of the average dairy farm in BC On average, uptake of the Manure Treatment BMP resulted in a 22-day increase in liquid manure storage capacity (a 15% increase in storage capacity on average). Some producers indicated that they had realized much less increase while others indicated that they had realized up to a 40% increase in storage capacity due to the implementation of their BMP. The timing of manure application did not appear to change drastically due to the implementation of the BM.. The BMP has slightly increased the amount of solid manure that is exported off-farm; however, most producers indicated that they just enough solid manure to meet their own needs. Eight producers indicated that they have sold some manure-byproducts since implementing their manure storage BMP. Did the BMP meet the expectations of producers? The BMP is meeting the expectation of producers in most cases. However, is important to note that the majority of producers had only experienced one season with their BMP, therefore the evaluation results may not accurately reflect the long term experiences of producers. A reduction in bedding costs was the largest benefit experienced by those who implemented the BMP. Most producers who implemented the BMP also experienced an increase in the flexibility of manure application. An improvement in animal health and cow comfort as well as a potential to improve crop yields were benefits experienced by producers. Some producers indicated that they were dissatisfied with the cost and time associated with maintaining the equipment, for example, replacing screens as well as the operating costs of the equipment. In some cases, producers indicated that they were also dissatisfied with the actual DM content of the solid manure product as well as the increase in manure storage capacity versus what the equipment suppliers had indicated they would experience. Overall, the DCF analysis indicates that the BMP results in positive financial outcomes for the individual producer. Is there justification for continued support of the BMP? Based on the following criteria we recommend continued support of the Manure Treatment BMP with an overall category cap that reflects the high level of benefits experienced by those who adopt the BMP and increased emphasis on pooled projects where average to smaller sized dairy farms may also benefit from the Manure Treatment BMP cost-share funding. The criteria used to generate this recommendation was: Is the BMP effective at mitigating environmental risks?
Yes, in some cases, the BMP appears to be effective in increasing manure storage capacity as well as facilitating export of nutrients off-farm.

Social, Economic and Environmental Evaluation of Beneficial Management Practices, Series 3
56
Does the BMP provide the expected outcomes to producers?
Yes, in general producers indicate that their expectations were met by the BMP despite the high cost of repair and maintenance and increase in operating costs.
Does the BMP provide a benefit to society?
Our analysis shows that over the lifetime of the BMP (15 years), the BMP has a positive net benefit to society. However it is important to note here that this benefit is based solely on public and private costs and private benefits, as we were not able to value some of the environmental outcomes of BMP implementation within the scope of this report.

Social, Economic and Environmental Evaluation of Beneficial Management Practices, Series 3
57
Appendices
I. References and Literature Consulted
BC Ministry of Agriculture. (2010). Nutrient management planning reference guide. Abbotsford, BC: ARDCorp.
BC Ministry of Agriculture. (2010). Growing Forward Manure Sampling and Analysis for Nutrient Management . Nutrient Management Factsheet - No. 5 in Series (Revised September 2010, Order Reference No. 631-500-3).
BC Ministry of Agriculture. (2010). Reference guide: The Canada -British Columbia environmental farm plan program. (No. 4). Abbotsford, BC: Agricultural Research and Development Corporation.
BC Ministry of Agriculture and Food. (1990). Sizing dairy manure storage facilities. Retrieved from http://www.al.gov.bc.ca/resmgmt/publist/300Series/383100-2.pdf
Hamilton, D. (2010). Solids separation in manure handling systems. Retrieved from http://www.extension.org/pages/27470/solids-separation-in-swine-manure-handling-systems#.UpYpTaso7mI
National Farm Stewardship Program. (2006). Beneficial management practices descriptions. Ottawa, ON: Agriculture and Agri-Food Canada.
Oleweiler, N., et al. (2004). The value of natural capital in settled areas of Canada. Ducks Unlimited & The Nature Conservancy of Canada. Retrieved from http://www.cmnbc.ca/sites/default/files/natural%2520capital_0.pdf
Suess, A., W. Haider, R. Trenholm. (2012). Socio-Economic and Environmental Assessment of Beneficial Management Practices. Abbotsford, BC: BC Ministry of Agriculture. Retrieved from: http://www.agf.gov.bc.ca/resmgmt/EnviroFarmPlanning/AGRI_BMP_Report_FINAL.pdf
Kitchen, A., P. Kitchen, R. Trenholm. (2013). Socio-Economic and Environmental Evaluation of Beneficial Management Practices. Abbotsford, BC: BC Ministry of Agriculture. Retrieved from: http://www.agf.gov.bc.ca/resmgmt/EnviroFarmPlanning/SocioEconomic_&_Environmental_Review_of_BMPs_2012.pdf
Statistics Canada. (2012). Farm operator data tables. Retrieved, 2012, from http://www29.statcan.gc.ca.proxy.lib.sfu.ca/ceag-web/eng/index-index;jsessionid=E2C5006284CAF869F729BEF1DED5D6E2
Treasury Board of Canada Secretariat. (2007). Canadian cost-benefit analysis guide. Ottawa, Ontario:
Treasury Board of Canada Secretariat. (2012). Policy on evaluation. Retrieved from

Social, Economic and Environmental Evaluation of Beneficial Management Practices, Series 3
58
http://www.tbs-sct.gc.ca.proxy.lib.sfu.ca/pol/doc-eng.aspx?section=text&id=15024

Social, Economic and Environmental Evaluation of Beneficial Management Practices, Series 3
59
II. Manure Sampling Methods and Results At twenty sites, samples were collected using methods outlined in the Manure Sampling and Analysis for Nutrient Management – Nutrient Management Factsheet - No. 5 in Series (Revised September 2010, Order Reference No. . 631-500-3). At most sites three samples were obtained:
Liquid manure before entering the separator;
Solid manure leaving the separator; and
Liquid manure leaving the separator.
On two occasions the third sample could not be obtained due to physical challenges in collecting the sample (manure in the pit was too deep to reach). At sites with a sand lane a fourth sample (sand) was also collected. A summary of liquid and solid manure collection is provided below. Liquid manure collection
A long PVC pipe fitted with a stopper was lowered into the manure pit.
Most pits had recently been agitated, however if a crust was visible on the top
layer or if the pit had not been agitated then the pipe was used to mix the manure
before a sample was obtained.
The pipe was lifted from the pit and the sample was emptied into a plastic pail.
This process was repeated two to three times until about 2 L of sample was
collected.
A funnel was used to pour a subsample of about 750 ml into a 1 L screwtop
plastic container.
The container was labeled and placed on ice in a cooler.
Solid manure collection
A small shovel (trowel) was used to collect 3 to 4 subsamples of fresh solid
manure from the pile of solids created by the separator.
The surface was scraped away so that dry and weathered material was avoided.
The material was placed into a plastic pail, mixed, and a subsample of about 750
ml was transferred into a 1 L plastic screwtop container.
The container was labeled and placed on ice in a cooler.
Shipping to the Lab
All samples were stored on ice in a cooler for a maximum of 30 hours.
The date, time, manure type, and farm location was recorded in a sample
submission form upon delivery at the laboratory.
Upon arrival the temperature of the samples was measured to ensure that they
had been stored at an appropriate temperature.
Laboratory Analysis
The liquid and solid samples were all analyzed by A & L Canada Laboratories
Inc. (subcontracted by Exova Laboratories) for the following parameters:

Social, Economic and Environmental Evaluation of Beneficial Management Practices, Series 3
60
Parameter Unit Detection Limit
Method Reference
Dry matter % 0.10 Gravimetric Total Potassium % 0.01 Inductively Coupled
Plasma (ICP) Total Phosphorus % 0.01 Inductively Coupled
Plasma (ICP) Ammonium (NH4-N) ug/ml 0.10 Colourimetric Total Organic Nitrogen
% 0.10 Combustion
Total Nitrogen % 0.10 Combustion pH N/A pH meter Fecal coliform Most probable
number (MPN/ml)
N/A MFHPB-19 accredited test
The extraction method for Total Phosphorus and Total Potassium is based on EPA Method 3050B as follows:
The dried, ground sample is weighed into a digestion vessel where hydrochloric and nitric acid are added.
It is digested for 2 hours at 95 Co then made up to volume with deionized water, shaken and filtered.
It is submitted for analysis by ICP-OES.

Municipality or Local Area
Sample ID
Dry matter
% pH
Total N NH4-N Total Organic N P (total) K (total) Fecal coliform
% ug/g % % % MPN/g dry
dry as
received dry as
received dry as
received dry as
received dry as
received dry as
received
Rosedale
01A 6.0 7.0 3.83 0.23 13198 791 2.51 0.15 0.89 0.05 4.54 0.27 0 >1000
01B 33.9 8.4 1.59 0.54 1738 590 1.42 0.48 0.40 0.14 0.73 0.25 0 >1000
01C 3.6 7.2 6.47 0.23 20526 741 4.42 0.16 1.47 0.05 6.60 0.24 0 >1000
Chilliwack
02A 2.7 7.1 6.56 0.18 25113 671 4.05 0.11 1.25 0.03 5.48 0.15 0 >1000
02B 4.0 6.9 4.86 0.19 16644 657 3.20 0.13 1.10 0.04 2.61 0.10 0 >1000
02C 19.5 7.6 1.36 0.26 1709 333 1.19 0.23 0.17 0.03 0.73 0.14 0 >1000
Chilliwack
03A 3.7 7.5 6.09 0.22 28293 1033 3.26 0.12 1.50 0.05 8.47 0.31 0 >1000
03B 41.2 8.7 1.89 0.78 1716 707 1.72 0.71 0.85 0.35 1.05 0.43 549 226
03C 9.7 7.4 3.37 0.33 11534 1121 2.22 0.22 1.60 0.16 3.53 0.34 0 >1000
Chilliwack 04A 3.6 7.6 6.81 0.24 36695 1303 3.14 0.11 1.20 0.04 8.68 0.31 0 >1000
04B 37.5 8.7 1.33 0.50 1036 388 1.23 0.46 0.26 0.10 0.76 0.28 0 <3
Abbotsford 05A 6.7 7.0 4.77 0.32 21709 1463 2.60 0.18 1.05 0.07 3.94 0.27 0 >1000
05B 37.0 8.6 1.58 0.59 1548 574 1.43 0.53 0.26 0.10 0.62 0.23 0 >1000
Abbotsford
06A 5.5 6.4 4.00 0.22 17255 949 2.27 0.12 0.73 0.04 3.05 0.17 0 >1000
06B 38.3 7.3 1.38 0.53 577 221 1.38 0.53 0.19 0.07 0.52 0.20 640 245
06C 0.6 10.1 8.10 BDL 47000 282 3.39 BDL 1.60 BDL 7.71 0.05 0 >1000
Abbotsford
07A 1.7 6.6 6.56 0.11 33235 565 3.24 BDL 1.37 0.02 7.30 0.12 0 >1000
07B 15.3 8.0 1.59 0.24 1712 262 1.42 0.22 2.29 0.35 0.85 0.13 0 >1000
07C 92.2 7.9 BDL BDL 1 1 BDL BDL 0.07 0.06 0.14 0.13 542 500
07D 1.9 10.1 5.43 0.10 26368 501 2.79 BDL 1.58 0.03 6.42 0.12 0 >1000
Abbotsford
08A 5.8 8.9 3.73 0.22 16034 930 2.13 0.12 0.89 0.05 3.21 0.19 0 >1000
08B 34.1 7.8 1.76 0.60 1460 498 1.61 0.55 0.59 0.20 0.68 0.23 2067 705
08C 3.2 9.5 6.06 0.19 33531 1073 2.71 BDL 1.11 0.04 6.71 0.21 0 >1000
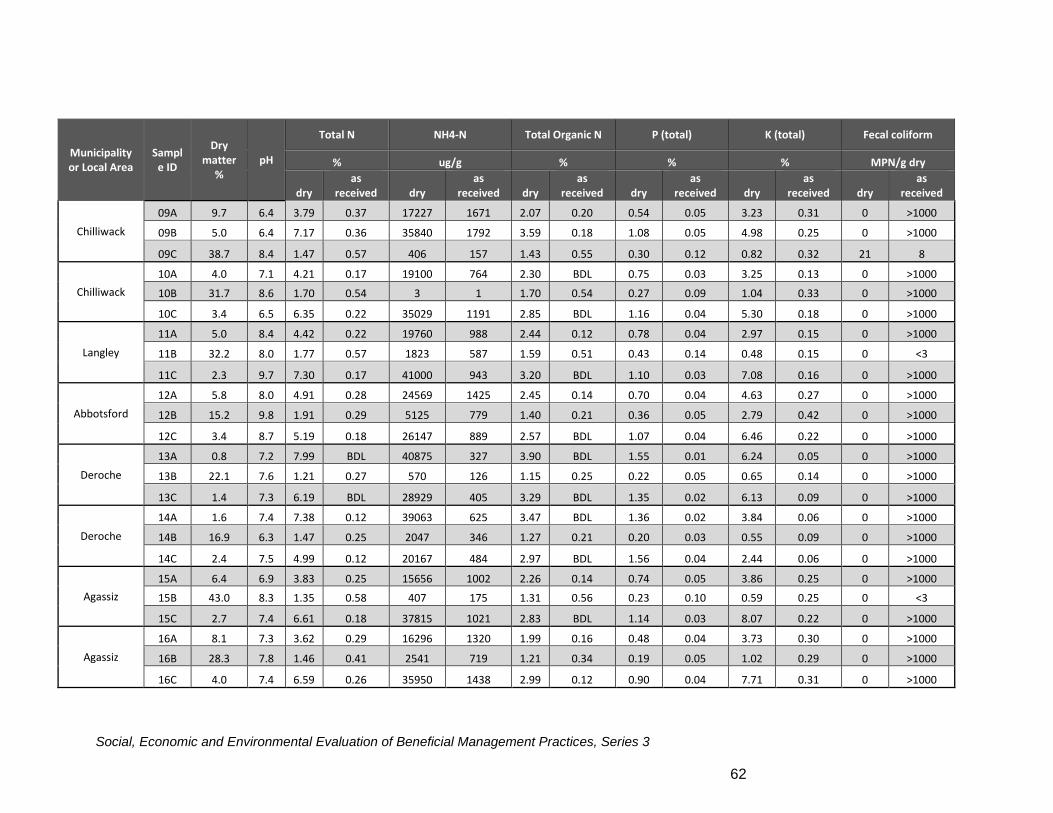
Social, Economic and Environmental Evaluation of Beneficial Management Practices, Series 3
62
Municipality or Local Area
Sample ID
Dry matter
% pH
Total N NH4-N Total Organic N P (total) K (total) Fecal coliform
% ug/g % % % MPN/g dry
dry as
received dry as
received dry as
received dry as
received dry as
received dry as
received
Chilliwack
09A 9.7 6.4 3.79 0.37 17227 1671 2.07 0.20 0.54 0.05 3.23 0.31 0 >1000
09B 5.0 6.4 7.17 0.36 35840 1792 3.59 0.18 1.08 0.05 4.98 0.25 0 >1000
09C 38.7 8.4 1.47 0.57 406 157 1.43 0.55 0.30 0.12 0.82 0.32 21 8
Chilliwack
10A 4.0 7.1 4.21 0.17 19100 764 2.30 BDL 0.75 0.03 3.25 0.13 0 >1000
10B 31.7 8.6 1.70 0.54 3 1 1.70 0.54 0.27 0.09 1.04 0.33 0 >1000
10C 3.4 6.5 6.35 0.22 35029 1191 2.85 BDL 1.16 0.04 5.30 0.18 0 >1000
Langley
11A 5.0 8.4 4.42 0.22 19760 988 2.44 0.12 0.78 0.04 2.97 0.15 0 >1000
11B 32.2 8.0 1.77 0.57 1823 587 1.59 0.51 0.43 0.14 0.48 0.15 0 <3
11C 2.3 9.7 7.30 0.17 41000 943 3.20 BDL 1.10 0.03 7.08 0.16 0 >1000
Abbotsford
12A 5.8 8.0 4.91 0.28 24569 1425 2.45 0.14 0.70 0.04 4.63 0.27 0 >1000
12B 15.2 9.8 1.91 0.29 5125 779 1.40 0.21 0.36 0.05 2.79 0.42 0 >1000
12C 3.4 8.7 5.19 0.18 26147 889 2.57 BDL 1.07 0.04 6.46 0.22 0 >1000
Deroche
13A 0.8 7.2 7.99 BDL 40875 327 3.90 BDL 1.55 0.01 6.24 0.05 0 >1000
13B 22.1 7.6 1.21 0.27 570 126 1.15 0.25 0.22 0.05 0.65 0.14 0 >1000
13C 1.4 7.3 6.19 BDL 28929 405 3.29 BDL 1.35 0.02 6.13 0.09 0 >1000
Deroche
14A 1.6 7.4 7.38 0.12 39063 625 3.47 BDL 1.36 0.02 3.84 0.06 0 >1000
14B 16.9 6.3 1.47 0.25 2047 346 1.27 0.21 0.20 0.03 0.55 0.09 0 >1000
14C 2.4 7.5 4.99 0.12 20167 484 2.97 BDL 1.56 0.04 2.44 0.06 0 >1000
Agassiz
15A 6.4 6.9 3.83 0.25 15656 1002 2.26 0.14 0.74 0.05 3.86 0.25 0 >1000
15B 43.0 8.3 1.35 0.58 407 175 1.31 0.56 0.23 0.10 0.59 0.25 0 <3
15C 2.7 7.4 6.61 0.18 37815 1021 2.83 BDL 1.14 0.03 8.07 0.22 0 >1000
Agassiz
16A 8.1 7.3 3.62 0.29 16296 1320 1.99 0.16 0.48 0.04 3.73 0.30 0 >1000
16B 28.3 7.8 1.46 0.41 2541 719 1.21 0.34 0.19 0.05 1.02 0.29 0 >1000
16C 4.0 7.4 6.59 0.26 35950 1438 2.99 0.12 0.90 0.04 7.71 0.31 0 >1000

Social, Economic and Environmental Evaluation of Beneficial Management Practices, Series 3
63
Municipality or Local Area
Sample ID
Dry matter
% pH
Total N NH4-N Total Organic N P (total) K (total) Fecal coliform
% ug/g % % % MPN/g dry
dry as
received dry as
received dry as
received dry as
received dry as
received dry as
received
Rosedale
17A 0.7 7.6 10.4
3 BDL 70714 495 3.35 BDL 1.82 0.01 20.93 0.15 0 >1000
17B 23.4 6.9 0.95 0.22 1094 256 0.84 0.20 0.14 0.03 0.54 0.13 0 >1000
17C 0.8 7.5 10.5
0 BDL 71625 573 3.33 BDL 1.09 BDL 11.49 0.09 0 >1000
Rosedale 18A 10.1 7.2 3.71 0.37 13624 1376 2.35 0.24 0.60 0.06 3.29 0.33 0 >1000
18B 32.2 8.1 1.60 0.52 2606 839 1.34 0.43 0.26 0.08 0.70 0.23 90 29
Delta
19A 1.6 7.3 6.89 0.11 26920 431 4.20 BDL 1.03 0.02 7.62 0.12 0 >1000
19B 16.4 6.7 1.08 0.18 2058 338 0.87 0.14 0.22 0.04 0.95 0.16 0 >1000
19C 1.3 7.3 8.21 0.11 44721 581 3.74 BDL 1.25 0.02 10.29 0.13 0 >1000
19D 20.8 8.1 0.86 0.18 2209 1751 0.64 0.13 0.18 0.04 0.88 0.18 0 >1000
Surrey
20A 5.6 6.9 5.06 0.28 22323 1250 2.82 0.16 0.67 0.04 3.99 0.22 0 >1000
20B 35.8 5.8 0.96 0.34 1375 492 0.82 0.29 0.15 0.05 0.75 0.27 0 >1000
20C 2.5 7.6 6.84 0.17 37838 946 3.05 BDL 1.02 0.03 5.14 0.13 0 >1000

III. Extended Summary of Jurisdictional Review We reviewed five jurisdictions including Washington, Idaho, Alberta, Manitoba, and Ontario. In each jurisdiction at least one industry expert was interviewed over the phone. Industry experts included government staff, equipment suppliers as well as industry spokespeople. For each jurisdiction, we looked at uptake of solid/liquid separation and bedding recovery systems and the primary motivations and barriers for the adoption of each technology. Uptake of solid/liquid separation was highest in Washington and Idaho and lowest in Alberta, Manitoba, and Ontario. Across jurisdictions, producers were motivated to adopt solid/liquid manure separation to better manage nutrients on farm, earn additional revenue from selling separated solids, and to better manage manure volumes. Additionally, adoption is more common at larger dairies. Common barriers across jurisdictions include financial cost of the system and the additional time, attention, and maintenance required by the system. Additionally, solid liquid manure separation is less common on small dairies with lower revenues. Uptake of bedding recovery systems has been relatively high in Washington and Idaho and relatively low in the Canadian jurisdictions of Alberta, Manitoba and Ontario. Primary motivations for uptake include a desire to increase manure storage capacity, decrease bedding costs, and earn revenue on manure by-products. Common barriers include financial cost, limited applicability of system to specific farm operation, additional maintenance and time associated with the system, and access to inexpensive bedding alternatives. Washington The dairy landscape in Washington can be divided into Eastern Washington, which exists in dry, semi-arid climate and Western Washington, which shares a similar climate to the Fraser Valley with high annual precipitation. Western Washington
System Uptake Notes
Solid Liquid Manure Separation
30% of cows 30% of dairies
Western Washington has approximately 350 dairies and 100,000 milking cows. Therefore, dairies are considerably smaller than those in Eastern Washington
Bedding Recovery Systems
33% in Whatcom County 10%-20% elsewhere in Western Washington

Social, Economic and Environmental Evaluation of Beneficial Management Practices, Series 3
65
Solid/Liquid Separation Motivating Factors/Opportunities
Manure storage capacity;
o Producers use the separation technology to reduce manure volumes in
lagoon effectively increasing liquid storage capacity.
Additional tool for manure management;
o Separated solid manure can be higher in Phosphorous and separated
liquid manure can be higher in Nitrogen. As a result, producers can more
accurately target nutrients. Additionally, the liquid manure stream is
easier to pump and apply in a drag line system.
Systems are more affordable for larger dairies; and,
o Generally speaking, larger dairies are better able to justify the financial
cost of the system.
Federal cost-share programs.
o Programs are available which can cover the majority of costs for a
separator, pumps, and a storage building.
Deterring Factors/ Barriers
Financial cost of system;
o Producers are deterred by the financial cost of the system, especially for
smaller dairies common to Western Washington.
Additional time and maintenance;
o More maintenance associated with adding the new component to the
manure management system on-farm.
Bedding Recovery Systems Motivating Factors/Opportunities
Bedding savings;
o With the production of bedding on-farm, producers reduce bedding costs.
Opportunity to sell bedding and other composted products off-farm; and,
Opportunity to process other dairy farms’ solid manure.
Deterring Factors
Financial cost of system;
o Producers are deterred by the financial cost of the system, especially for
smaller dairies common to Western Washington.
Additional time and maintenance; and,
o More maintenance associated with adding the new component to the
manure management system on-farm.
Unsuitable bedding material.
o Existing bedding materials may not be suitable for a bedding recovery
system.

Social, Economic and Environmental Evaluation of Beneficial Management Practices, Series 3
66
Eastern Washington
System Uptake Notes
Solid Liquid Manure Separation
90% of cows 50% of dairies
There are approximately 75 dairies in Eastern Washington and they are concentrated in the Yakima Valley. 70% milk over 700 animals. Dairies are larger in Eastern Washington compared to Western Washington
Bedding Recovery Systems
<5% Manure is generally row composted due to limited precipitation.
Solid/Liquid Separators Motivating Factors/Opportunities
Manure storage capacity;
o Producers use the separation technology to reduce manure volumes in
pits/lagoons effectively increasing liquid storage capacity.
Additional tool for manure management;
o Separated solid manure can be higher in Phosphorous and separated
liquid manure can be higher in Nitrogen. As a result, producers can more
accurately target nutrients. Additionally, the liquid manure stream is
easier to pump and apply in a drag line system.
Nutrient concentrations in groundwater;
o Manure separation has been repurposed as a means of generating a
solid component that can be shipped out of the Yakima Valley. Manure
separation allows the producer to ship a portion of nutrients off-farm to
reduce potential for nutrient concentrations.
Off-farm sales of separated solids;
o Producers can sell a composted product or sell the separated solids to
compost facility that processes (composts) manure and sells the finished
product as a soil amendment.
Affordability of system for larger dairies; and,
Federal cost-share programs.
o Programs are available which can cover majority of separator, pumps,
and storage building.
Deterring Factors/Barriers
Financial cost of system;
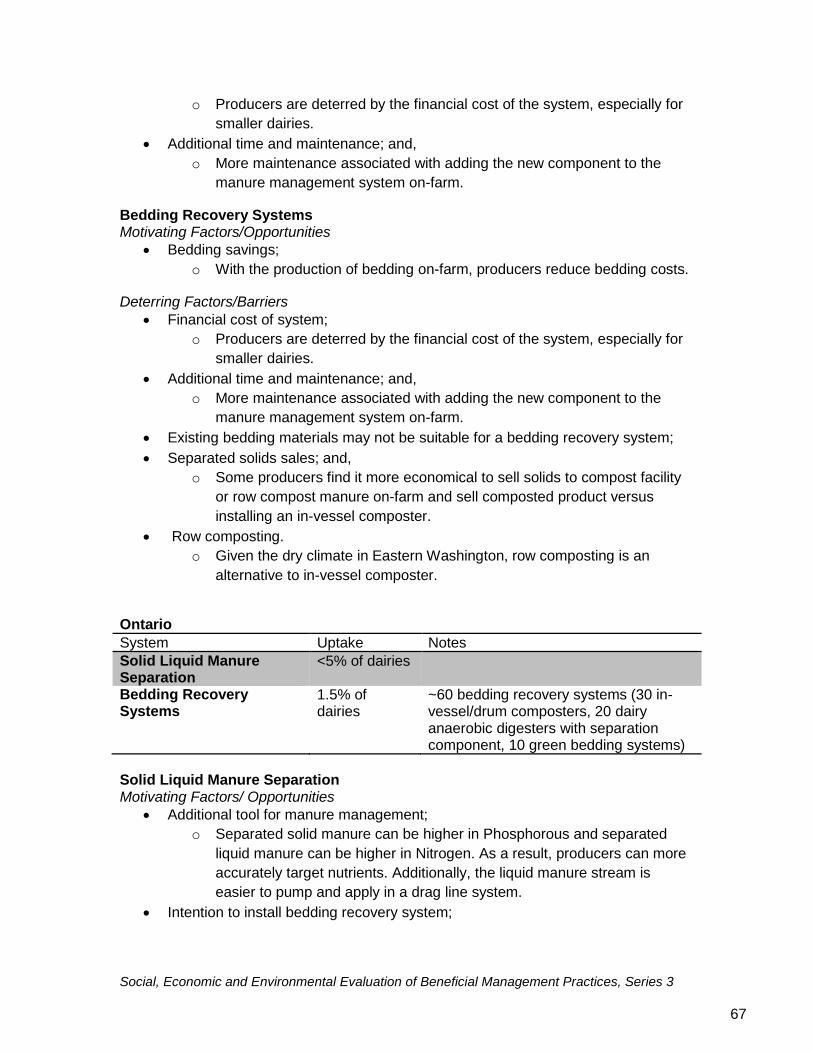
Social, Economic and Environmental Evaluation of Beneficial Management Practices, Series 3
67
o Producers are deterred by the financial cost of the system, especially for
smaller dairies.
Additional time and maintenance; and,
o More maintenance associated with adding the new component to the
manure management system on-farm.
Bedding Recovery Systems Motivating Factors/Opportunities
Bedding savings;
o With the production of bedding on-farm, producers reduce bedding costs.
Deterring Factors/Barriers
Financial cost of system;
o Producers are deterred by the financial cost of the system, especially for
smaller dairies.
Additional time and maintenance; and,
o More maintenance associated with adding the new component to the
manure management system on-farm.
Existing bedding materials may not be suitable for a bedding recovery system;
Separated solids sales; and,
o Some producers find it more economical to sell solids to compost facility
or row compost manure on-farm and sell composted product versus
installing an in-vessel composter.
Row composting.
o Given the dry climate in Eastern Washington, row composting is an
alternative to in-vessel composter.
Ontario
System Uptake Notes
Solid Liquid Manure Separation
<5% of dairies
Bedding Recovery Systems
1.5% of dairies
~60 bedding recovery systems (30 in-vessel/drum composters, 20 dairy anaerobic digesters with separation component, 10 green bedding systems)
Solid Liquid Manure Separation Motivating Factors/ Opportunities
Additional tool for manure management;
o Separated solid manure can be higher in Phosphorous and separated
liquid manure can be higher in Nitrogen. As a result, producers can more
accurately target nutrients. Additionally, the liquid manure stream is
easier to pump and apply in a drag line system.
Intention to install bedding recovery system;

Social, Economic and Environmental Evaluation of Beneficial Management Practices, Series 3
68
o In many cases in Ontario, dairy farms install separators because they are
planning to implement a bedding recovery system on their farm that
requires separation (i.e. composters, anaerobic digesters, green bedding)
Anaerobic Digester Incentive Program;
o The program has increased uptake of digesters and producers have
installed separators to process digestate for sale or use as bedding.
Deterring Factors/ Barriers
Additional component to manure management system;
o Solid/liquid separation adds an additional component to a farm’s manure
management system and some producers are comfortable with their
existing system and are hesitant to change it.
Different agricultural conditions;
o Ontario dairies face different conditions, such as more land and less
rainfall relative to BC, which may make manure separation less
appropriate/necessary. Thus, they do not have the same challenges
around manure storage capacity. Some Ontario dairies are also not
interested in using manure separation as a component of nutrient
management.
Financial cost of system;
o Producers are deterred by the financial cost of the system, especially for
smaller dairies which are common in Ontario.
Financial cost of transporting manure;
o While separated solids are valuable, transporting solids can be expensive
which in some cases can outweigh the benefits of selling separated solids
as a compost or soil amendment.
Bedding Recovery Systems Motivating Factors/ Opportunities
Source of reliable, inorganic bedding;
o For dairies that do not want to use sand, bedding recovery systems are
viewed as a good alternative that provide a renewable source of inorganic
bedding.
Additional tool for manure management;
o Separated solid manure can be higher in Phosphorous and separated
liquid manure can be higher in Nitrogen. As a result, producers can more
accurately target nutrients. Additionally, the liquid manure stream is
easier to pump and apply in a drag line system.
Bedding savings;
o With the production of bedding on-farm, producers reduce bedding costs.
Anaerobic Digester Incentive Program;
o The program has increased uptake of digesters and producers have
installed separators to process digestate for sale or use as bedding.
Deterring Factors/ Barriers

Social, Economic and Environmental Evaluation of Beneficial Management Practices, Series 3
69
Additional component to manure management system;
o Solid/liquid separation adds an additional component to a farm’s manure
management system and some producers are comfortable with their
existing system and are hesitant to change it.
Availability of sand as an inexpensive bedding option;
o Sand is an affordable, readily available source of bedding materials in
Ontario and many dairies do not want to switch to a different bedding
material. Many larger dairies that could possibly afford the system use
sand bedding and are hesitant to switch.
Financial cost of system;
o Producers are deterred by the financial cost of the system, especially for
smaller dairies which are common in Ontario.
Additional component to manure management system;
o Solid/liquid separation adds an additional component to a farm’s manure
management system and some producers are comfortable with their
existing system and are hesitant to change it.
Dispersion of Ontario dairies;
o Ontario dairies are relative dispersed and so the option of one dairy
processing a number of farms manure, thus making a system more
economical for a farm, is limited.
Existing tie-stall dairies;
o There are a large number of older, tie-stall dairies with small herds where
a bedding recovery system is not economical.
Incentive programs;
o The BMP program has had limited uptake most likely due to
existing barriers in Ontario, notably cost of installing and operating
system on small dairies.
Animal health concerns;
o Some producers in Ontario have had mixed experiences with animal
health as a result of using bedding from a bedding recovery system.
Alberta
System Uptake Notes
Solid Liquid Separation <5% of dairies Alberta has ~600 dairies Bedding Recovery Systems
1% of dairies
Solid Liquid Manure Separation Motivating Factors/ Opportunities
Sand reclamation;
o A couple of dairies have sand bedding systems and wanted to reclaim
sand due to the high cost of sand in Alberta.
Additional tool for manure management;
o Separated solid manure can be higher in Phosphorous and separated
liquid manure can be higher in Nitrogen. As a result, producers can more

Social, Economic and Environmental Evaluation of Beneficial Management Practices, Series 3
70
accurately target nutrients. Additionally, the liquid manure stream is
easier to pump and apply in a drag line system.
Off-farm sales of separated solids;
o Producers can sell a composted product or sell the separated solids to a
compost facility that processes (composts) manure and sells the finished
product as a soil amendment.
Emergence of bedding recovery technologies;
o There has been more interest in manure separation in the past few years
due to the emergence of bedding recovery technologies.
Proximity to urban areas.
o Producers facing challenges such as close proximity to urban centers
have looked at system to reduce nuisance issues (i.e. odour).
Deterring Factors/ Barriers
Financial cost of system;
o Producers are deterred by the financial cost of the system, especially for
smaller dairies.
Limited perceived need for systems;
o There is a limited need for manure separation as part of Alberta
producers’ manure management system. Dairies are less concentrated
and there is a large land mass on which to apply manure. Furthermore,
manure application technologies (mostly broadcast to date) can handle
slurry.
Additional component to manure management system;
o Solid/liquid separation adds an additional component to a farm’s manure
management system and some producers are comfortable with their
existing system and are hesitant to change it. Producers are not willing to
dedicate time and attention to learn and operate new system.
Bedding Recovery Systems Motivating Factors/ Opportunities
Cost effective alternative to bedding;
o Bedding costs including the cost of transporting bedding materials such
as woodchips are high and producers are looking for cost-effective
alternatives.
Off-farm sales of separated solids;
o Producers can sell a composted product or sell the separated solids to a
compost facility that processes (composts) manure and sells the finished
product as a soil amendment.
Deterring Factors/ Barriers
Financial cost of system;
o Producers are deterred by the financial cost of the system.
Additional component to manure management system;
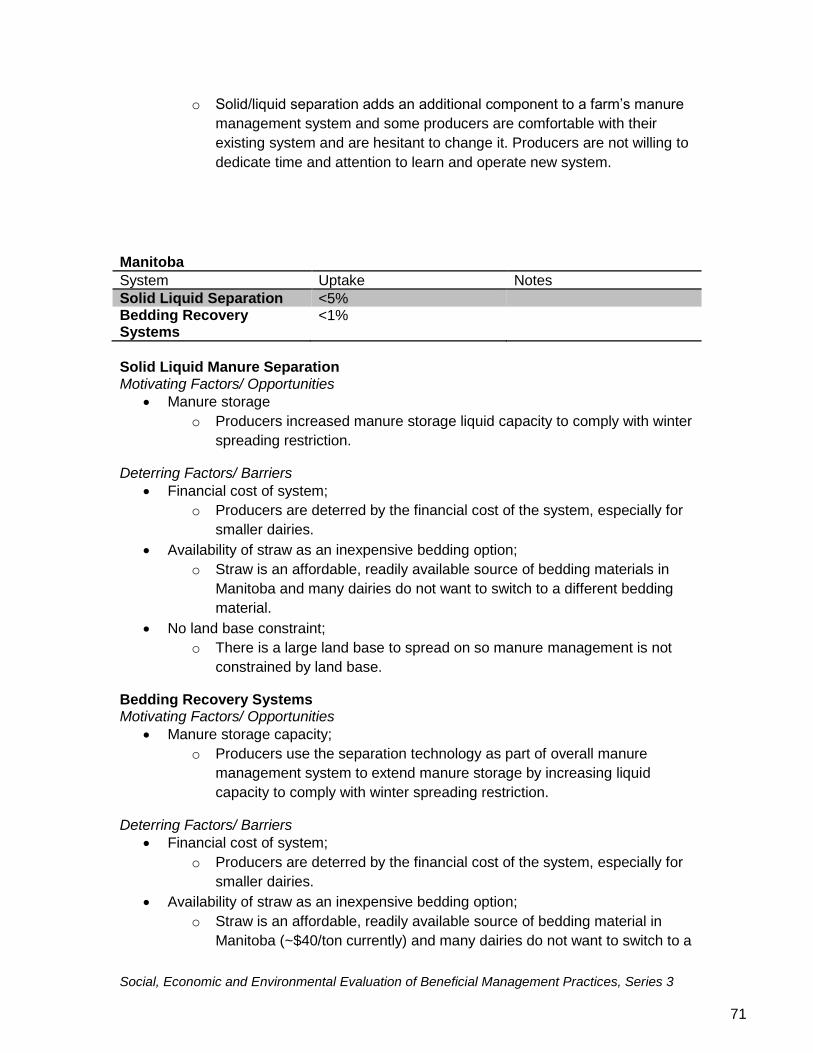
Social, Economic and Environmental Evaluation of Beneficial Management Practices, Series 3
71
o Solid/liquid separation adds an additional component to a farm’s manure
management system and some producers are comfortable with their
existing system and are hesitant to change it. Producers are not willing to
dedicate time and attention to learn and operate new system.
Manitoba
System Uptake Notes
Solid Liquid Separation <5% Bedding Recovery Systems
<1%
Solid Liquid Manure Separation Motivating Factors/ Opportunities
Manure storage
o Producers increased manure storage liquid capacity to comply with winter
spreading restriction.
Deterring Factors/ Barriers
Financial cost of system;
o Producers are deterred by the financial cost of the system, especially for
smaller dairies.
Availability of straw as an inexpensive bedding option;
o Straw is an affordable, readily available source of bedding materials in
Manitoba and many dairies do not want to switch to a different bedding
material.
No land base constraint;
o There is a large land base to spread on so manure management is not
constrained by land base.
Bedding Recovery Systems Motivating Factors/ Opportunities
Manure storage capacity;
o Producers use the separation technology as part of overall manure
management system to extend manure storage by increasing liquid
capacity to comply with winter spreading restriction.
Deterring Factors/ Barriers
Financial cost of system;
o Producers are deterred by the financial cost of the system, especially for
smaller dairies.
Availability of straw as an inexpensive bedding option;
o Straw is an affordable, readily available source of bedding material in
Manitoba (~$40/ton currently) and many dairies do not want to switch to a
Social, Economic and Environmental Evaluation of Beneficial Management Practices, Series 3
72
different bedding material. Thus, bedding recovery systems are less
attractive/competitive.
Idaho
System Uptake Notes
Solid Liquid Separation 50% of dairies Mainly screen separators which require less maintenance compared to compress and screw press separators.
Bedding Recovery Systems
20% of dairies Approximately all 100 in-barn dairies in Idaho. The remaining dairies are open-lot dairies.
Solid Liquid Manure Separation Motivating Factors/ Opportunities
Reduce solids in lagoons;
o Primary reason is to reduce amount of solids in lagoons. Most dairies are
irrigated and the lagoon water is pumped through irrigation system.
Separated liquids are more easily pumped than slurry.
Deterring Factors/ Barriers
Financial cost of system;
o Producers are deterred by the financial cost of the system, especially for
smaller dairies.
Not appropriate for open-lot dairies;
o Solid/liquid separation equipment is not applicable to open-lot dairies in
most cases, which are common in Idaho, due to infrequent manure
collection and minimal use of bedding.
No funding/incentive programs available;
Additional component to manure management system;
o Solid/liquid separation adds an additional component to a farm’s manure
management system and some producers are comfortable with their
existing system and are hesitant to change it. Producers are not willing to
dedicate time and attention to learn and operate new system.
Bedding Recovery Systems Motivating Factors/ Opportunities
Larger dairies can afford systems;

Social, Economic and Environmental Evaluation of Beneficial Management Practices, Series 3
73
o Many Idaho dairies are larger (6,000 to 10,000 cows) and the economics
of bedding recovery are favorable relative to the cost of bedding (mainly
straw).
Existing separators;
o Many dairies have separators to avoid loading lagoons with solids and so
bedding recovery from solids is a logical next step.
Deterring Factors/ Barriers
Limited rainfall making row composting possible;
o Due to limited rainfall (9 inches annually), dairies can row compost solid
manure for bedding which is cheaper than in-vessel drum composting.
Limited need for bedding recovery in open-lot dairies;
o Open-lot dairies do not use large amounts of bedding and thus a bedding
recovery system is not as applicable to open-lot as it is to in-barn dairies.
Financial cost of system;
o Producers are deterred by the financial cost of the system, especially for
smaller dairies.
No funding/incentive programs available.

Social, Economic and Environmental Evaluation of Beneficial Management Practices, Series 3
74
IV. Data Sources for Benefits and Costs Used in the Cost-Benefit Analysis
All values are per farm (or per farm per year)
Negative cost indicates a benefit.
All values are in 2013 Canadian dollars.
Values were calculated based on the average value per producer who implemented a Manure Treatment BMP between 2009 – 2012.
Values and Data Sources for Manure Treatment BMP – All Projects (0201)
BMP Impact Amount Source
Benefits Reduction in Nutrient Loss (N + P)
N/A
Costs Infrastructure:
Provided by the EFP program Provided by the farmer Additional infrastructure cost
$34,756.04 $140,822.80 $40,661.29
ARDCorp ARDCorp Survey
Repair/Maintenance $6,871.09 per year Survey Operational Costs
Maintenance Labour Fertilizer Costs Bedding Costs Manure application costs Manure application labour costs Bedding sales Crop yield changes Animal health costs
$4,145.63 per year $771.51 per year -$2,166.67 per year -$29,538.10 per year -$2,600 per year -$1,296 per year -$1,586.96 per year NA -$217.39 per year
Survey Survey Survey Survey Survey Survey Survey Survey

Social, Economic and Environmental Evaluation of Beneficial Management Practices, Series 3
75
Table Values and Data Sources for Manure Treatment BMP – Solid/Liquid Separation (0201)
BMP Impact Amount Source
Benefits Reduction in Nutrient Loss (N + P)
N/A
Costs Infrastructure:
Provided by the EFP program Provided by the farmer Additional infrastructure cost
$26,466.73 $86,065.01 $42,555.56
ARDCorp ARDCorp Survey
Repair/Maintenance $7,422.86 per year Survey Operational Costs
Maintenance Labour Fertilizer Costs Bedding Costs Manure application costs Manure application labour costs Bedding sales Crop yield changes Animal health costs
$3,080.00 per year $2,684.25 per year -$10,000 per year -$21,800 per year -$2,500 per year N/A -$1,714.29 per year N/A N/A
Survey Survey Survey Survey Survey
Values and Data Sources for Manure Treatment – Bedding Recovery Systems (0201)
BMP Impact Amount Source
Benefits Reduction in Nutrient Loss (N + P)
N/A
Costs Infrastructure:
Provided by the EFP program Provided by the farmer Additional infrastructure cost
$38,382.62 $164,779.333 $34,886.36
ARDCorp ARDCorp Survey
Repair/Maintenance $6,601.48 per year Survey Operational Costs
Maintenance Labour Fertilizer Costs Bedding Costs Manure application costs Manure application labour costs Bedding sales Crop yield changes Animal health costs
$4,500.83 per year -$253.33 per year -$600 per year -$33,407.14 per year -$2,666.67 -$1,296 -$1,633.33 NA -$333.33
Survey Survey Survey Survey Survey Survey Survey Survey

Social, Economic and Environmental Evaluation of Beneficial Management Practices, Series 3
76
V. Cost-Benefit Analysis Assumptions and Limitations Key Assumptions 1. We assumed that the initial infrastructure costs occurred in the first time period and
that annual benefits and costs started to occur in the following time period. 2. We assumed that the annual benefits and costs were constant throughout the life of
each program. This may not be the case. For example, maintenance and labour costs may increase over the life of a BMP as infrastructure may begin to deteriorate at a faster rate.
3. We assumed that the baseline and BMP scenarios were not impacted by changes in
key variables (e.g. population or technological changes). We did not complete a detailed forecast of the baseline or scenario.
4. We assumed that enrolment in the BMP programs would not change from current
levels when completing the cost-benefit analysis over the program’s lifetime. 5. We assumed that transitional and government regulatory costs were zero. In the case
of transitional costs it is likely safe to assume that they are “small and can be ignored”34. However, government regulatory costs are likely not zero (e.g. administration costs associated with the EFP Program). However, we did not have any information on these costs.
6. We assumed that the information obtained from the survey and ARDCorp used to
determine benefits and costs was representative of the larger population of BMP adopters. For example, average maintenance costs calculated from survey responses were applied to the population of BMP adopters.
Key Limitations 1. We could not quantify all of the benefits or costs. There may be other benefits of this
BMP that we’re not assessed. For example, a change in nutrient uptake by crops could not be calculated because of inadequate data.
2. We were not able to complete a rigorous analysis of the impacts of the BMP on the
environment on or near each farm. This is especially difficult to complete for a program such as the Environmental Farm Plan since agricultural producers are distributed throughout the province. This makes monitoring difficult as information on the change in environmental characteristics such as soil erosion or water quality is difficult and costly to obtain. An additional complication is that it may be difficult to link changes in management practices to any changes observed in the environment. A further issue is that the environmental impacts of management practices on one farm may be negligible, but cumulative impacts of implementing BMPs on many farms may be substantial.
34 Treasury Board of Canada Secretariat. (2007). Canadian Cost-Benefit Analysis Guide: Regulatory Proposals. Ottawa, ON: Government of Canada. Retrieved on January 22, 2012 from: http://www.tbs-sct.gc.ca/ri-qr/documents/gl-ld/analys/analys00-eng.asp
Social, Economic and Environmental Evaluation of Beneficial Management Practices, Series 3
77
3. We did not complete a dynamic risk assessment that linked into the CBA. 4. We did not complete a detailed stakeholder impact analysis.