beneficial management practices evaluation project -...
TRANSCRIPT
Beneficial Management Practices
Summary and Recommendations
Government
Nutrient
Evaluation Project
2
Nutrient Beneficial Management PracticesEvaluation Project
Summary and Recommendations
Paterson Earth & Water Consulting Ltd.and
Alberta Agriculture and Rural Development
2014
3
CitationPaterson Earth & Water Consulting Ltd. and Alberta Agriculture and Rural Development. 2014.Nutrient Beneficial Management Practices Evaluation Project. Volume 1: Summary andRecommendations. Lethbridge, Alberta, Canada. pp.134
Published byAlberta Agriculture and Rural Development
Copyright © 2014. Her Majesty the Queen in Right of Alberta (Alberta Agriculture and RuralDevelopment).
All rights reserved.
No part of this publication may be reproduced, stored in a retrieval system, or transmitted in anyform or by any means, electronic, mechanical, photocopying, or otherwise without permissionfrom Alberta Agriculture and Rural Development.
Printed in Canada
This report is also available athttp://www1.agric.gov.ab.ca/$department/deptdocs.nsf/all/epw11955
Index to Volumes
Volume 1: Summary and RecommendationsPaterson Earth & Water Consulting Ltd. and Alberta Agriculture and Rural Development
Volume 2: Field StudyAlberta Agriculture and Rural Development
Volume 3: Modelling StudyApplication of the Model to Alberta WatershedsCEEOTAndrzej Jedrych, Edward Osei, Richard Heikkila, Ali Saleh, and Oscar Gallego
Protocol for AssessmentBMPEdward Osei, Ali Saleh, and Oscar Gallego
Application of the Model on the Central Portion of the Red Deer RiverCEEOTWatershedAndrzej Jedrych, Edward Osei, Richard Heikkila, Ali Saleh, and Oscar Gallego
4
EXECUTIVE SUMMARY
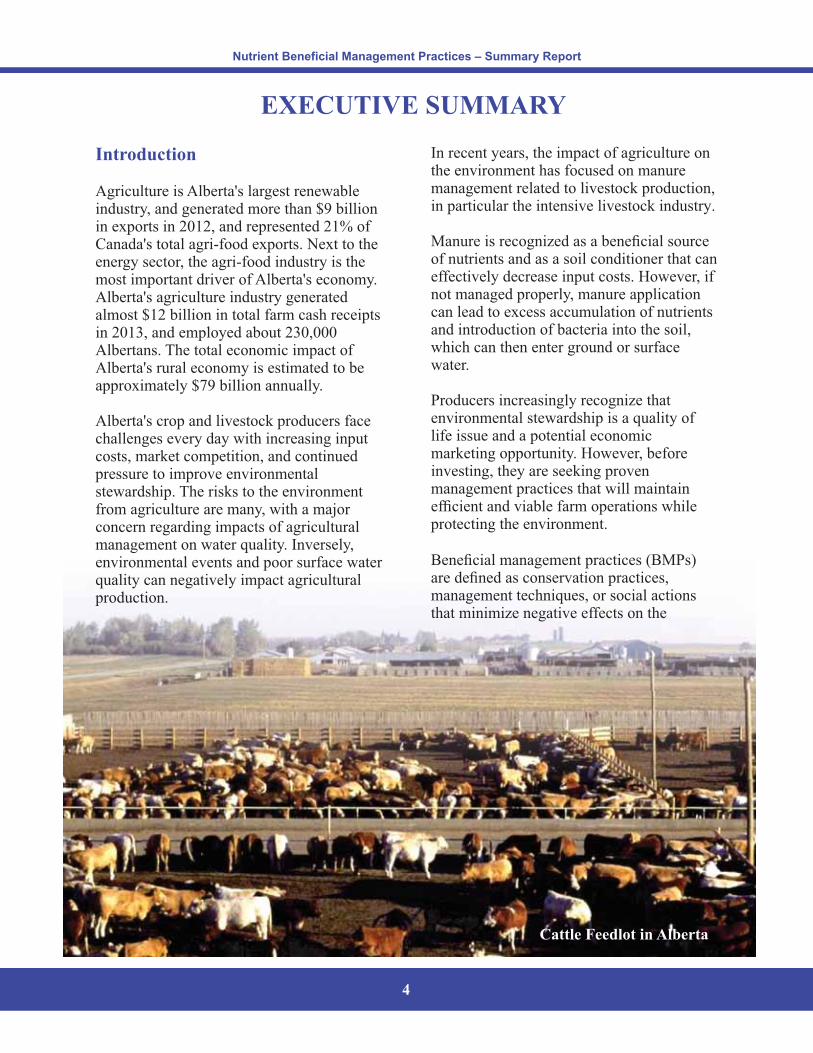
Cattle Feedlot in Alberta
Introduction
Agriculture is Alberta's largest renewableindustry, and generated more than $9 billionin exports in 2012, and represented 21% ofCanada's total agri-food exports. Next to theenergy sector, the agri-food industry is themost important driver of Alberta's economy.Alberta's agriculture industry generatedalmost $12 billion in total farm cash receiptsin 2013, and employed about 230,000Albertans. The total economic impact ofAlberta's rural economy is estimated to beapproximately $79 billion annually.
Alberta's crop and livestock producers facechallenges every day with increasing inputcosts, market competition, and continuedpressure to improve environmentalstewardship. The risks to the environmentfrom agriculture are many, with a majorconcern regarding impacts of agriculturalmanagement on water quality. Inversely,environmental events and poor surface waterquality can negatively impact agriculturalproduction.
In recent years, the impact of agriculture onthe environment has focused on manuremanagement related to livestock production,in particular the intensive livestock industry.
Manure is recognized as a beneficial sourceof nutrients and as a soil conditioner that caneffectively decrease input costs. However, ifnot managed properly, manure applicationcan lead to excess accumulation of nutrientsand introduction of bacteria into the soil,which can then enter ground or surfacewater.
Producers increasingly recognize thatenvironmental stewardship is a quality oflife issue and a potential economicmarketing opportunity. However, beforeinvesting, they are seeking provenmanagement practices that will maintainefficient and viable farm operations whileprotecting the environment.
Beneficial management practices ( s)BMPare defined as conservation practices,management techniques, or social actionsthat minimize negative effects on the
Nutrient Beneficial Management Practices – Summary Report
5
environment, while being practical tools forproducers to meet or exceed regulatoryrequirements and production targets.Numerous s have been developed andBMPpromoted to minimize the impacts ofagriculture on the environment and increasethe sustainability of the agricultural industry.
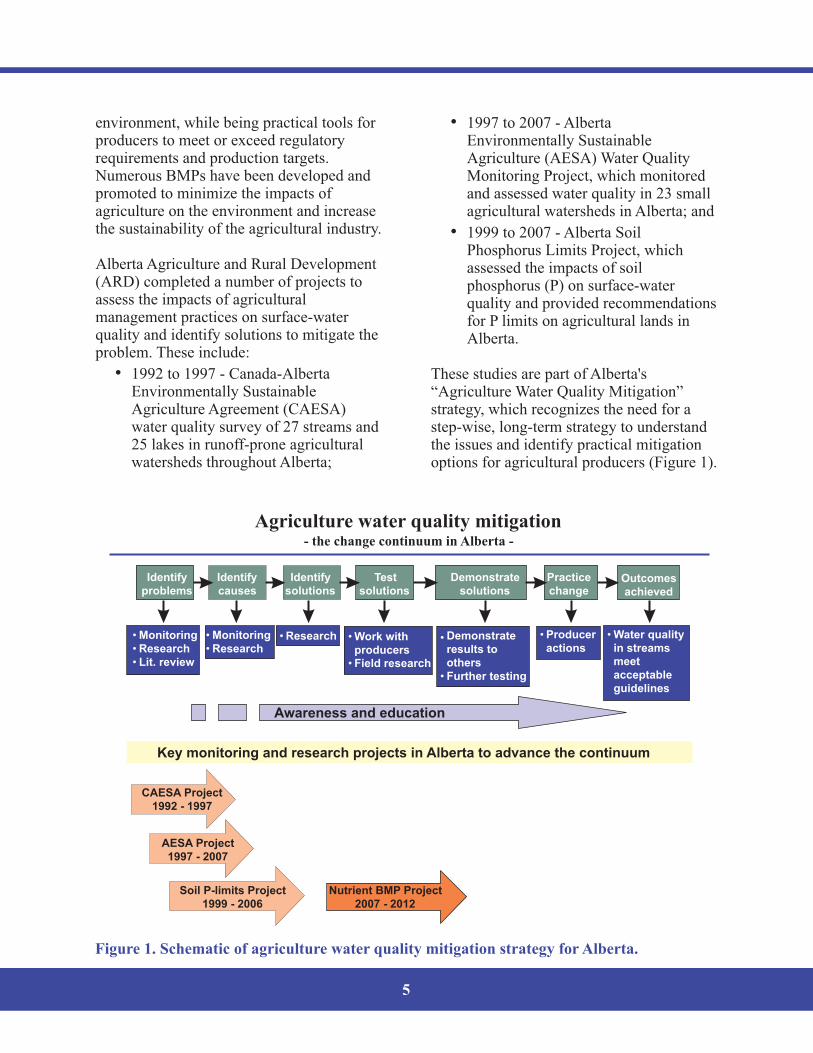
Alberta Agriculture and Rural Development( ) completed a number of projects toARDassess the impacts of agriculturalmanagement practices on surface-waterquality and identify solutions to mitigate theproblem. These include:
� 1992 to 1997 - Canada-AlbertaEnvironmentally SustainableAgriculture Agreement ( )CAESAwater quality survey of 27 streams and25 lakes in runoff-prone agriculturalwatersheds throughout Alberta;
Awareness and education
Test
solutions
Identify
problems
Identify
causes
Identify
solutions
Demonstrate
solutions
Practice
changeOutcomes
achieved
• Water quality
in streamsmeet
acceptable
guidelines
• Monitoring
• Research
• Lit. review
• Monitoring
• Research• Research • Work with
producers• Field research
• Producer
actions• Demonstrate
results to
others
• Further testing
Agriculture water quality mitigation- the change continuum in Alberta -
Key monitoring and research projects in Alberta to advance the continuum
CAESA Project
1992 - 1997
Soil P-limits Project
1999 - 2006
AESA Project
1997 - 2007
Nutrient ProjectBMP
2007 - 2012
Figure 1. Schematic of agriculture water quality mitigation strategy for Alberta.
� 1997 to 2007 - AlbertaEnvironmentally SustainableAgriculture ( ) Water QualityAESAMonitoring Project, which monitoredand assessed water quality in 23 smallagricultural watersheds in Alberta; and
� 1999 to 2007 - Alberta SoilPhosphorus Limits Project, whichassessed the impacts of soilphosphorus (P) on surface-waterquality and provided recommendationsfor P limits on agricultural lands inAlberta.
These studies are part of Alberta's“Agriculture Water Quality Mitigation”strategy, which recognizes the need for astep-wise, long-term strategy to understandthe issues and identify practical mitigationoptions for agricultural producers (Figure 1).
6
The earlier studies helped quantify theeffects of agriculture on water quality andhighlighted the need for field-scale s.BMPHowever, the effectiveness of field-scaleBMPs was still unknown under Albertaconditions. Producers continue to requestsite-specific, risk-based tools to assist themin deciding which s will yield theBMPgreatest environmental benefit for theirfinancial investment. To address the need tobetter understand the effectiveness of s,BMPthe Nutrient Beneficial ManagementPractices Evaluation Project ( Project)BMPwas initiated in 2007 to evaluate s atBMPfield and watershed scales in Alberta.
Nutrient Beneficial ManagementPractices Evaluation Project
Alberta Agriculture and Rural Developmentand partners carried out the ProjectBMPfrom 2007 to 2012. The main objectives ofthe Project were to:BMP
� Evaluate the effectiveness of nutrientBMPs in reducing agricultural impactson the environment at the farm scale;
� A BMPssess the of s on watereffectsquality in specific reaches of awatershed stream;
� P BMPredict the cumulative of seffectson the overall quality of a watershedstream using models;
� E BMPvaluate nutrient s for effectiveuse of manure in crop production; and
� Assess economic costs and benefitsassociated with implemented s.BMP
The Project is described in threeBMPvolumes. This volume (Summary andRecommendations) provides the conclusionsand recommendations from a tremendousamount of information collected and
processed for the field and modellingstudies. The detailed technical descriptions,data summaries, and interpretations arepresented in Volume 2 for the Field Studyand in Volume 3 for the Modelling Study.The latter volume is a compilation of threemodelling reports.
Volume 1: Summary andRecommendations
Volume 2: Field Study
Volume 3: Modelling Study� A CEEOTpplication of the Model
to Alberta Watersheds
� P BMProtocol for Assessment
� A CEEOTpplication of the Modelon the central portion of the RedDeer River Watershed
Field Research Study
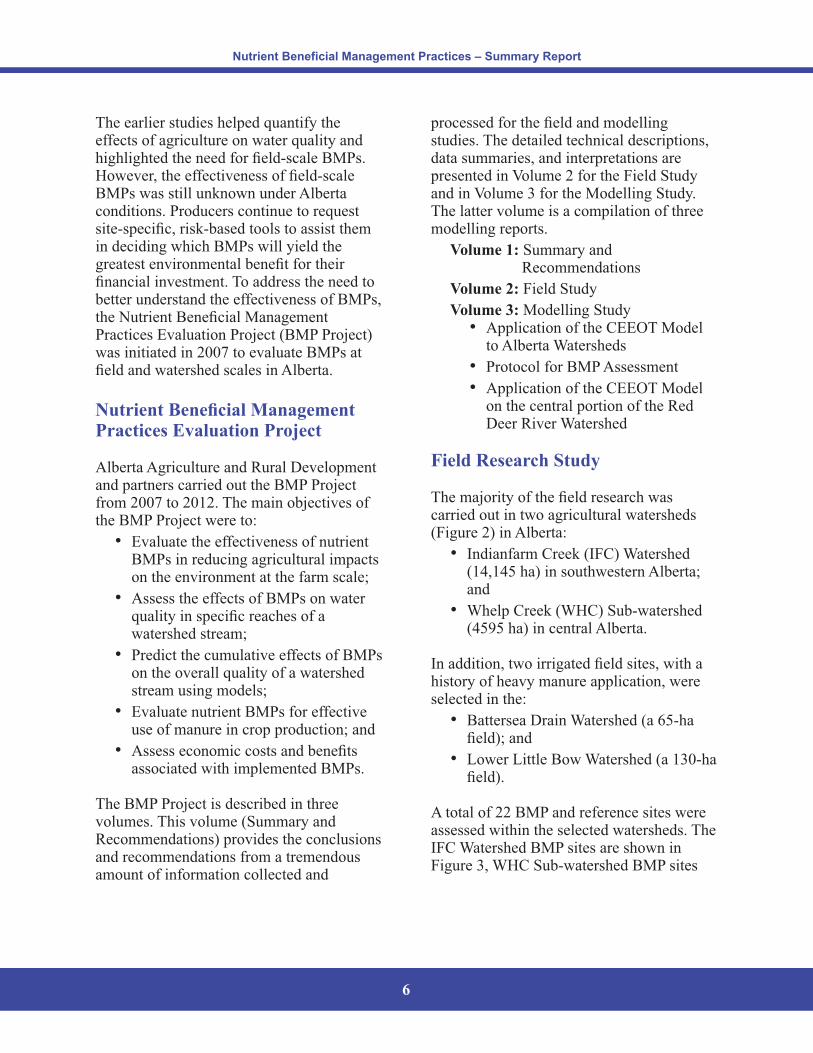
The majority of the field research wascarried out in two agricultural watersheds(Figure 2) in Alberta:
� I IFCndianfarm Creek ( ) Watershed(14,145 ha) in southwestern Alberta;and
� W WHChelp Creek ( ) Sub-watershed(4595 ha) in central Alberta.
In addition, two irrigated field sites, with ahistory of heavy manure application, wereselected in the:
� Battersea Drain Watershed (a 65-hafield); and
� Lower Little Bow Watershed (a 130-hafield).
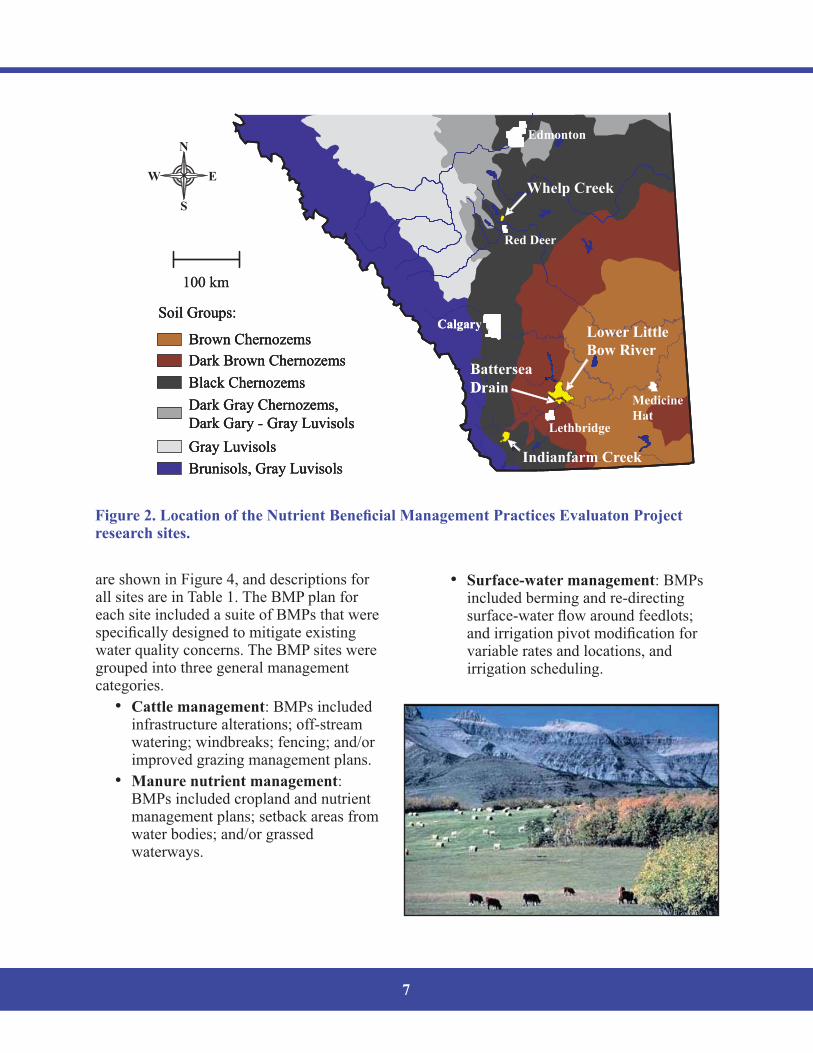
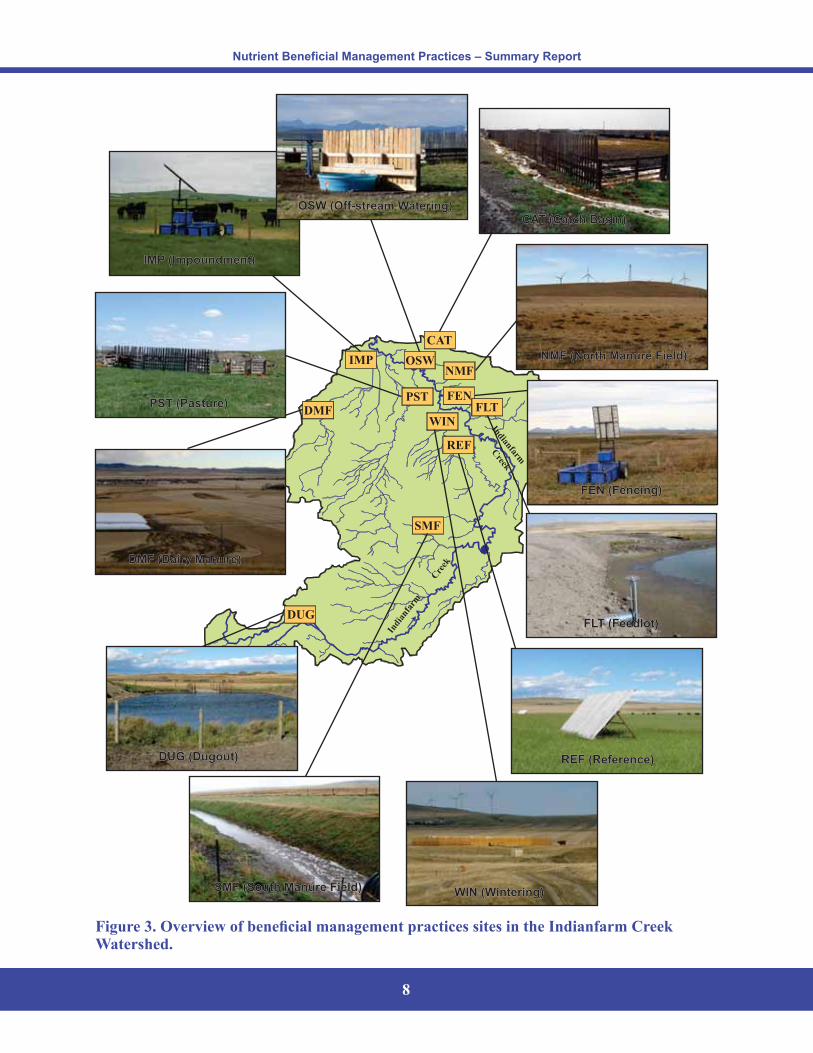
A total of 22 and reference sites wereBMPassessed within the selected watersheds. TheIFC BMPWatershed sites are shown niFigure 3, Sub-watershed sitesWHC BMP
Nutrient Beneficial Management Practices – Summary Report
7
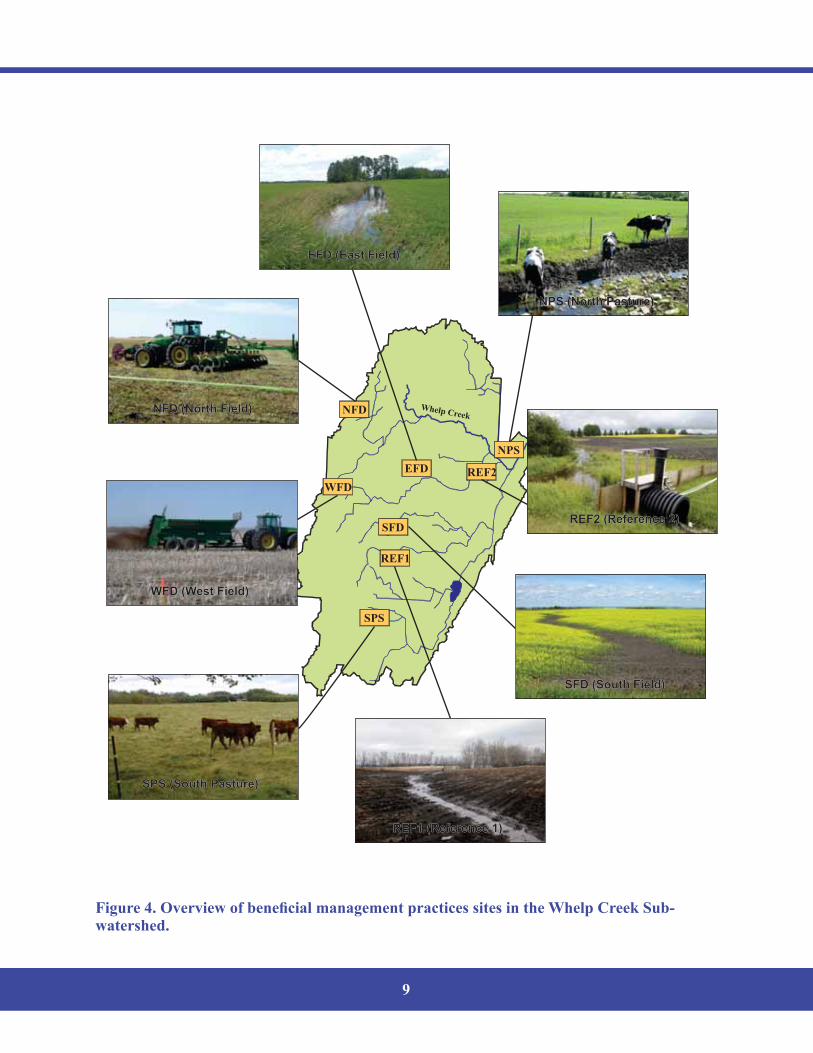
are shown in Figure 4, and descriptions forall sites are in Table 1. The plan forBMPeach site included a suite of s that wereBMPspecifically designed to mitigate existingwater quality concerns. The sites wereBMPgrouped into three general managementcategories.
� Cattle management: BMPs includedinfrastructure alterations off-stream;watering windbreaks fencing and/or; ; ;improved grazing management plans.
� Manure nutrient management:BMPs included cropland and nutrientmanagement plans setback areas from;water bodies and/or grassed;waterways.
� Surface-water management: BMPsincluded berming and re-directingsurface-water flow around feedlots;and irrigation pivot modification forvariable rates and locations, andirrigation scheduling.
Brown Chernozems
Dark Brown Chernozems
Dark Gray Chernozems,
Dark Gary - Gray Luvisols
Brunisols, Gray Luvisols
Gray Luvisols
Black Chernozems
Soil Groups:Calgary
Lethbridge
Medicine
Hat
Edmonton
Red Deer
Whelp Creek
Battersea
Drain
Indianfarm Creek
Lower Little
Bow River
100 km
Brown Chernozems
Dark Brown Chernozems
Dark Gray Chernozems,
Dark Gary - Gray Luvisols
Brunisols, Gray Luvisols
Gray Luvisols
Black Chernozems
Soil Groups:
Brown Chernozems
Dark Brown Chernozems
Dark Gray Chernozems,
Dark Gary - Gray Luvisols
Brunisols, Gray Luvisols
Gray Luvisols
Black Chernozems
Soil Groups:Calgary
Lethbridge
Medicine
Hat
Edmonton
Red Deer
Whelp Creek
Battersea
Drain
Indianfarm Creek
Lower Little
Bow River
100 km
EW
N
S
Figure 2. Location of the Nutrient Beneficial Management Practices Evaluaton Projectresearch sites.
8
SMF (South Manure Field)SMF (South Manure Field)
PST
IMP
CAT
DMF
FEN
OSWNMF
FLT
WIN
REF
DUG
SMF
CAT (Catch Basin)CAT (Catch Basin)
NMF (North Manure Field)NMF (North Manure Field)
Figure 3. Overview of beneficial management practices sites in the Indianfarm CreekWatershed.
Nutrient Beneficial Management Practices – Summary Report
IMP (Impoundment)IMP (Impoundment)
OSW (Off-stream Watering)OSW (Off-stream Watering)
PST (Pasture)PST (Pasture)
DMF (Dairy Manure)DMF (Dairy Manure)
FEN (Fencing)FEN (Fencing)
FLT (Feedlot)FLT (Feedlot)
DUG (Dugout)DUG (Dugout) REF (Reference)REF (Reference)
WIN (Wintering)WIN (Wintering)
9
WFD
NFD
SFD
EFD
NPS
SPS
REF1
REF2
EFD (East Field)EFD (East Field)
NPS (North Pasture)NPS (North Pasture)
NFD (North Field)NFD (North Field)
REF2 (Reference 2)REF2 (Reference 2)
WFD (West Field)WFD (West Field)
SFD (South Field)SFD (South Field)
REF1 (Reference 1)REF1 (Reference 1)
SPS (South Pasture)SPS (South Pasture)
Figure 4. Overview of beneficial management practices sites in the Whelp Creek Sub-watershed.
10
Nutrient Beneficial Management Practices – Summary Report
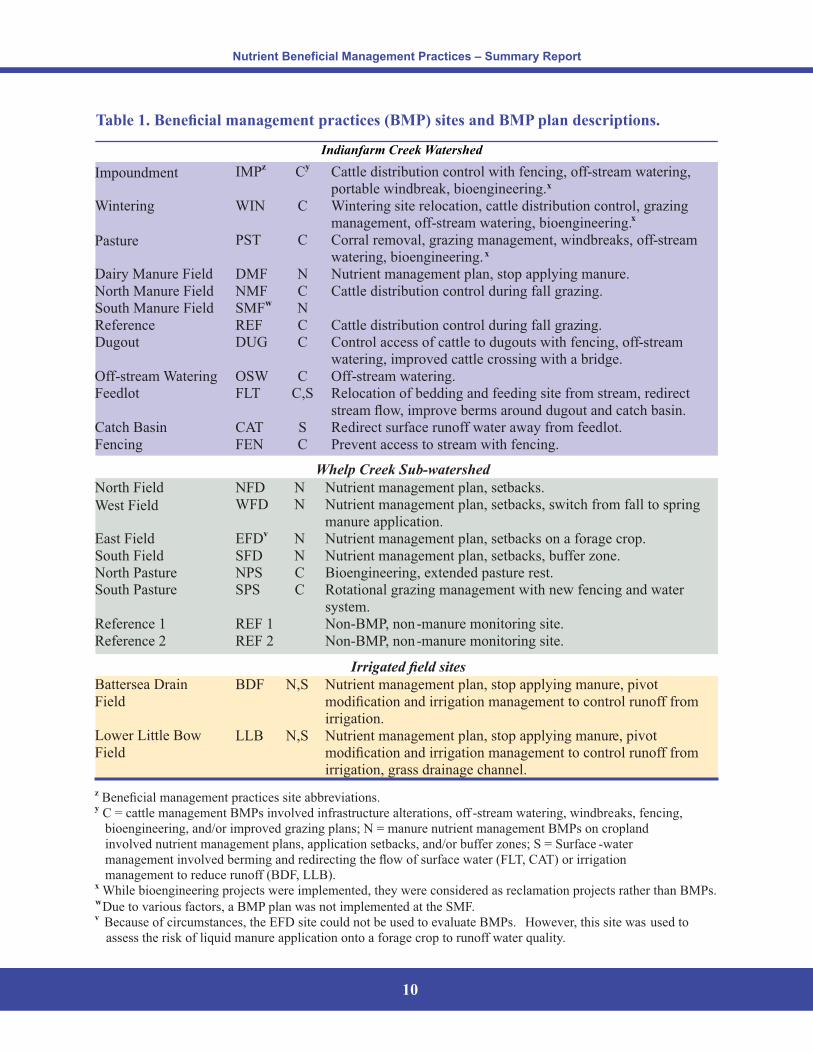
Table 1. Beneficial management practices ( ) sites and plan descriptions.BMP BMP
Indianfarm Creek Watershed
Impoundment IMPz Cy Cattle distribution control with fencing, off-stream watering,portable windbreak, bioengineering.
Wintering WIN C Wintering site relocation, cattle distribution control, grazingmanagement, off-stream watering, bioengineering.
Pasture PST C Corral removal, grazing management, windbreaks, off-streamwatering, bioengineering.
Dairy Manure Field DMF N Nutrient management plan, stop applying manure.North Manure Field NMF C Cattle distribution control during fall grazing.South Manure Field SMFw
x
x
x
NReference REF C Cattle distribution control during fall grazing.Dugout DUG C Control access of cattle to dugouts with fencing, off-stream
watering, improved cattle crossing with a bridge.Off-stream Watering OSW C Off-stream watering.Feedlot FLT C,S Relocation of bedding and feeding site from stream, redirect
stream flow, improve berms around dugout and catch basin.Catch Basin CAT S Redirect surface runoff water away from feedlot.Fencing FEN C Prevent access to stream with fencing.
Whelp Creek Sub-watershed
North Field NFD N Nutrient management plan, setbacks.
West Field WFD N Nutrient management plan, setbacks, switch from fall to springmanure application.
East Field EFDv N Nutrient management plan, setbacks on a forage crop.South Field SFD N Nutrient management plan, setbacks, buffer zone.North Pasture NPS C Bioengineering, extended pasture rest.South Pasture SPS C Rotational grazing management with new fencing and water
system.Reference 1 REF 1 Non-BMP, non-manure monitoring site.Reference 2 REF 2 Non-BMP, non-manure monitoring site.
Irrigated field sites
Battersea DrainField
BDF N,S Nutrient management plan, stop applying manure, pivotmodification and irrigation management to control runoff fromirrigation.
Lower Little BowField
LLB N,S Nutrient management plan, stop applying manure, pivotmodification and irrigation management to control runoff fromirrigation, grass drainage channel.
z Beneficial management practices site abbreviations.y C = cattle management s involved infrastructure alterations, offBMP -stream watering, windbreaks, fencing,
bioengineering, and/or improved grazing plans; N = manure nutrient management s on croplandBMPinvolved nutrient management plans, application setbacks, and/or buffer zones; S = Surface -watermanagement involved berming and redirecting the flow of surface water ( , ) or irrigationFLT CATmanagement to reduce runoff ( , ).BDF LLB
w
x
Due to various factors, a plan was not implemented at the .BMP SMF
While bioengineering projects were implemented, they were considered as reclamation projects rather than BMPs.
v Because of circumstances, the site could not be used to evaluate s.EFD BMP However, this site was used toassess the risk of liquid manure application onto a forage crop to runoff water quality.

11
Agricultural Policy
Environmental
eXtender ( )APEX
Soil and Water
Assessment Tool
( )SWAT
Comparison of
economic and
environmental
indicators
Farm-levelEconomic
Model ( )FEM
Scenarios/Practices
APEX SWATand
management
files and other
watershed data
FEM input
SWAPP – Fully linked
environmental model
Figure 5. Schematic of the model.CEEOT
Input Data
Modelling Studies
To extrapolate the key research resultsobtained from the field research sites toother non-monitored fields within the studyareas and to other parts of the province, theComprehensive Economic andEnvironmental Optimization Tool ( )CEEOTmodel was used (Figure 5). The CEEOTframework enabled interfacing among threeseparate computer models:
� Soil and Water Assessment Tool( );SWAT
� Agricultural Policy/EnvironmentaleXtender ( ); andAPEX
� F FEMarm-level Economic Model ( ).
This framework was designed to evaluatethe economic and environmental impacts ofagricultural s on water quality at fieldBMPand watershed scales.
The key objectives of the modellingCEEOTcomponent were to:
� Evaluate the performance of theCEEOT modelling system bycomparing the model simulationresults with field measurementscollected during the Project;BMP
� A BMPssess s and simulation scenariosin terms of environmentaleffectiveness and associated economicimpacts; and
� Provide recommendations on theextrapolation and application ofCEEOT modelling procedures andcalibrated results.
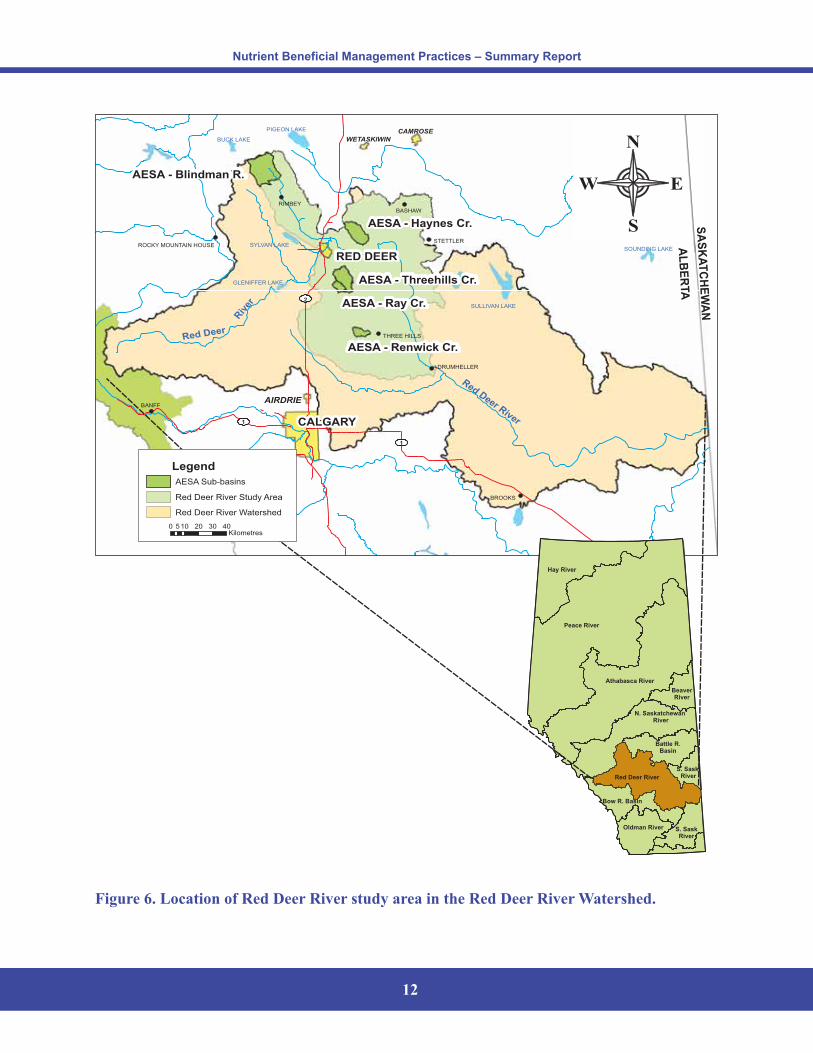
The model was first applied to theCEEOTIFC WHCand watersheds, as well as theLLB field site. It was then applied to acentral portion of the Red Deer River ( )RDRWatershed in central Alberta (Figure 6). Anumber of scenarios were assessedBMPusing the model and compared to a baselinescenario (Table 2).
The selected study area wasRDRapproximately 1.2 million ha in size andrepresented about 25% of the entire RedDeer River Watershed (Figure 6). The RDRstudy area was chosen for its diversity. It hasa relatively high agricultural intensity, andrepresents a variety of hydrologic conditionstypical of five natural regions of Alberta:Rocky Mountains; Foothills, Boreal Forest;Parkland; and Grassland. Most of the RDRstudy area was located in the CentralParkland Natural Sub-region. The RDRstudy area was also selected because long-term water quality information existed forfive sub-basins that were monitored as partof the Water Quality Program fromAESA1999 to 2006. These five sub-basinsAESAranged in size from 4,523 to 35,394 ha, andrepresented nearly 7% of the studyRDRarea. Additional information was availablefrom Enivronment and Sustainable ResourceDevelopment's long-term water qualitymonitoring sites located along the Red DeerRiver within the study area.
12
Red Deer River
AESA - Blindman R.
AESA - Haynes Cr.
AESA - Threehills Cr.
AESA - Ray Cr.
AESA - Renwick Cr.Red Deer
Riv
erROCKY MOUNTAIN HOUSE
DRUMHELLER
BROOKS
THREE HILLS
STETTLER
BASHAW
RIMBEY
SOUNDING LAKE
SULLIVAN LAKE
SYLVAN LAKE
GLENIFFER LAKE
PIGEON LAKE
BUCK LAKE
1
2
AL
BE
RTA
BANFF
1 CALGARY
AIRDRIE
WETASKIWIN
CAMROSE
´Calgary
ALBERTA
EW
N
S SA
SK
AT
CH
EW
AN
RED DEER
Figure 6. Location of Red Deer River study area in the Red Deer River Watershed.
Hay River
Peace River
Athabasca River
BeaverRiver
S. SaskRiver
Oldman River
N. SaskatchewanRiver
Battle R.Basin
S. Sask.RiverRed Deer River
Bow R. Basin
Nutrient Beneficial Management Practices – Summary Report
Legend
AESA Sub-basins
Red Deer River Study Area
Red Deer River Watershed
0 10 20 30 405Kilometres
13
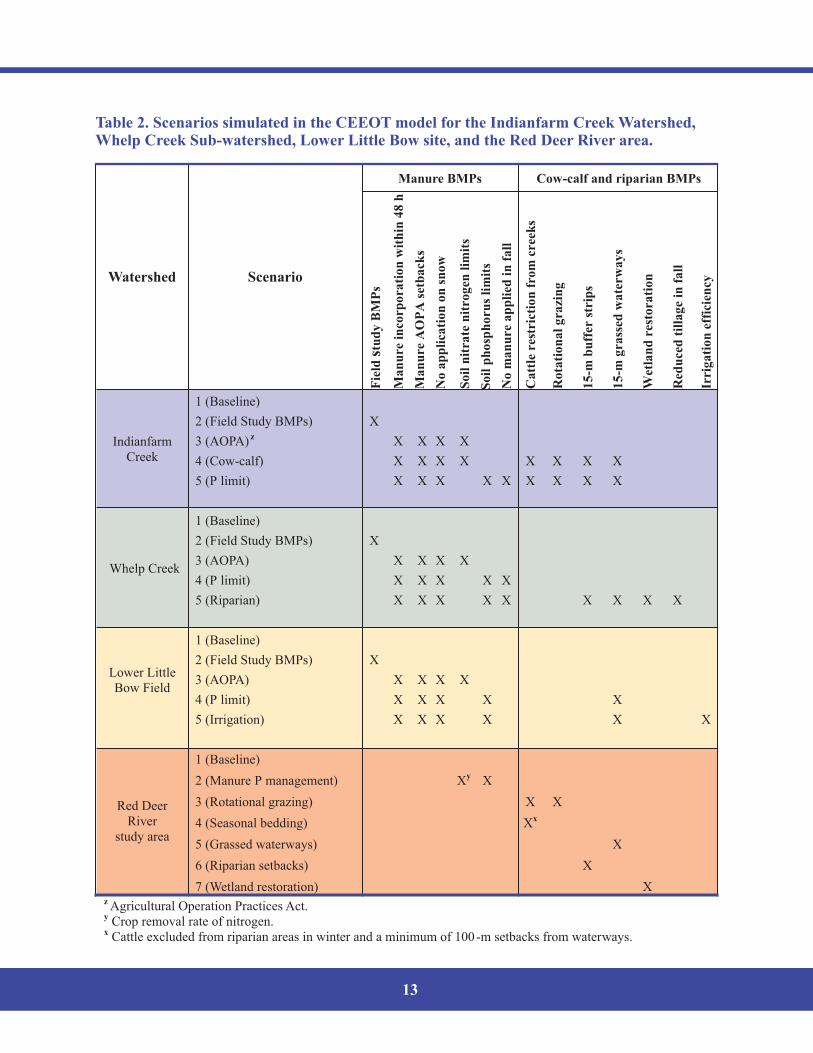
Table 2. Scenarios simulated in the model for the Indianfarm Creek Watershed,CEEOTWhelp Creek Sub-watershed, Lower Little Bow site, and the Red Deer River area.
Fie
ldst
ud
BM
Ps
Ma
nu
rein
crp
ora
tio
nw
ith
in4
8h
Ma
nu
reA
OA
setb
ack
s
No
ap
pli
cati
no
nsn
ow
So
iln
itra
ten
ito
gen
lim
its
So
ilp
ho
sph
or
sli
mit
s
No
ma
nu
rea
pli
edin
fall
Ca
ttle
rest
rict
on
fro
mcr
eek
s
Ro
tati
on
al
gra
zn
g
15
-mb
uff
er
str
ps
15
-mg
ra
ssed
wte
rw
ay
s
Wet
lan
dre
sto
ati
on
Red
uce
dti
llg
ein
fall
Irri
ga
tio
nef
icie
ncy
IndianfarmCreek
1 (Baseline)
2 (Field Study s)BMP X
3 ( )AOPA z X X X X
4 (Cow-calf) X X X X X X X X
5 (P limit) X X X X X X X X X
Whelp Creek
1 (Baseline)
2 (Field Study BMPs) X
3 ( )AOPA X X X X
4 (P limit) X X X X X
5 (Riparian) X X X X X X X X X
Lower LittleBow Field
1 (Baseline)
2 (Field Study BMPs) X
3 ( )AOPA X X X X
4 (P limit) X X X X X
5 (Irrigation) X X X X X X
Red DeerRiver
study area
1 (Baseline)
2 (Manure P management) Xy X
3 (Rotational grazing) X X
4 (Seasonal bedding) Xx
5 (Grassed waterways) X
6 (Riparian setbacks) X
7 (Wetland restoration) Xz Agricultural Operation Practices Act.y Crop removal rate of nitrogen.x Cattle excluded from riparian areas in winter and a minimum of 100 -m setbacks from waterways.
Watershed Scenario
Manure sBMP Cow
y
o P o
r u p i
i i a
r
a f
calf and riparian sBMP-
14
Conclusions and Recommendations
Based on the field and modelling results thefollowing conclusions and recommendationswere developed.
Conclusions
Field Study
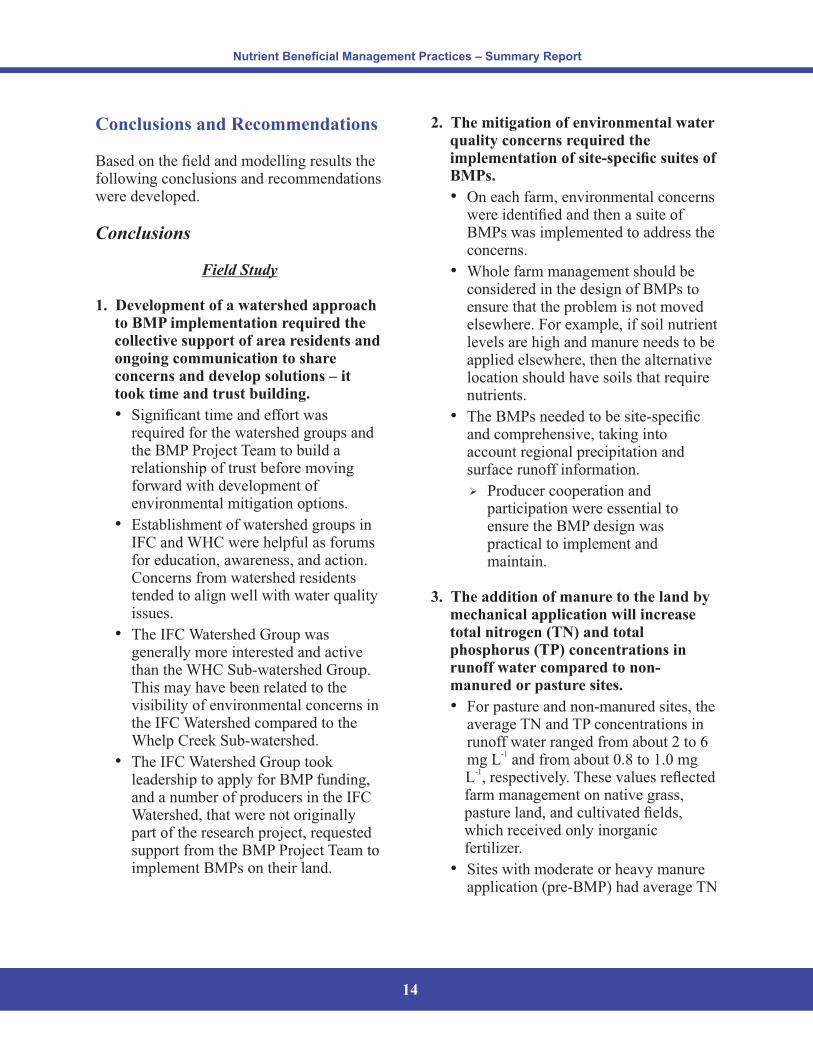
1. Development of a watershed approachto implementation required theBMPcollective support of area residents andongoing communication to shareconcerns and develop solutions – ittook time and trust building.
� Significant time and effort wasrequired for the watershed groups andthe Project Team to build aBMPrelationship of trust before movingforward with development ofenvironmental mitigation options.
� Establishment of watershed groups inIFC WHCand were helpful as forumsfor education, awareness, and action.Concerns from watershed residentstended to align well with water qualityissues.
� T IFChe Watershed Group wasgenerally more interested and activethan the Sub-watershed Group.WHCThis may have been related to thevisibility of environmental concerns inthe Watershed compared to theIFCWhelp Creek Sub-watershed.
� T IFChe Watershed Group tookleadership to apply for funding,BMPand a number of producers in the IFCWatershed, that were not originallypart of the research project, requestedsupport from the Project Team toBMPimplement s on their land.BMP
2. The mitigation of environmental waterquality concerns required theimplementation of site-specific suites ofBMPs.
� On each farm, environmental concernswere identified and then a suite ofBMPs was implemented to address theconcerns.
� Whole farm management should beconsidered in the design of s toBMPensure that the problem is not movedelsewhere. For example, if soil nutrientlevels are high and manure needs to beapplied elsewhere, then the alternativelocation should have soils that requirenutrients.
� T BMP eche s needed to be site-sp ificand comprehensive, taking intoaccount regional precipitation andsurface runoff information.
� Producer cooperation andpa icipation were essential tortensure the design wasBMPpractical to implement andmaintain.
3. The addition of manure to the land bymechanical application will increasetotal nitrogen ( ) and totalTNphosphorus ( ) concentrations inTPrunoff water compared to non-manured or pasture sites.
� For pasture and non-manured sites, theaverage and concentration inTN TP srunoff water ranged from about 2 to 6mg L and from about 0.8 to 1.0 mg
-1
L , respectively. These values reflected-1
farm management on native grass,pasture land, and cultivated fields,which received only inorganicfertilizer.
� Sites with moderate or heavy manureapplication (pre- ) had averageBMP TN
Nutrient Beneficial Management Practices – Summary Report
15
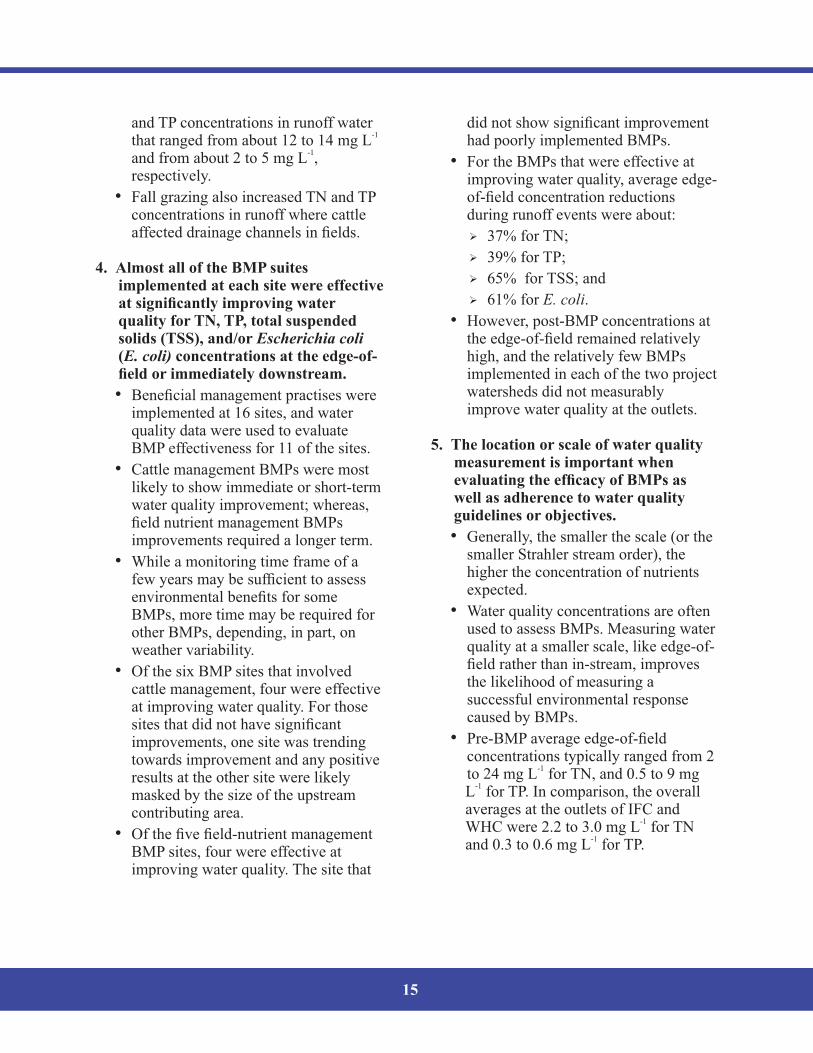
and concentrations in runoff waterTPthat ranged from about 12 to 14 mg L
-1
and from about 2 to 5 mg L ,-1
respectively.
� F TN TPall grazing also increased andconcentrations in runoff where cattleaffected drainage channels in fields.
4. Almost all of the suitesBMPimplemented at each site were effectiveat significantly improving waterquality for , , total suspendedTN TPsolids ( ), and/orTSS Escherichia coli( concentrations at the edge ofE. coli) - -field or immediately downstream.
� Beneficial management practises wereimplemented at 16 sites, and waterquality data were used to evaluateBMP effectiveness for 11 of the sites.
� C BMP moattle management s were stlikely to show immediate or short-termwater quality improvement; whereas,field nutrient management sBMPimprovements required a longer term.
� W ahile a monitoring time frame offew years may be sufficient to assessenvironmental benefits for someBMPs, more time may be required forother s, depending, in part, onBMPweather variability.
� O BMP nvf the six sites that i olvedcattle management, four were effectiveat improving water quality. For thosesites that did not have significantimprovements, one site was trendingtowards improvement and any positiveresults at the other site were likelymasked by the size of the upstreamcontributing area.
� Of the five field-nutrient managementBMP sites, four were effective atimproving water quality. The site that
did not show significant improvementhad poorly implemented s.BMP
� F BMPor the s that were effective atimproving water quality, average edge-of-field concentration reductionsduring runoff events were about:
� TN37% for ;
� TP39% for ;
� TSS65% for ; and
� E. coli61% for .
� H BMPowever, post- concentrations atthe edge-of-field remained relativelyhigh, and the relatively few sBMPimplemented in each of the two projectwatersheds did not measurablyimprove water quality at the outlets.
5. The location or scale of water qualitymeasurement is important whenevaluating the efficacy of s asBMPwell as adherence to water qualityguidelines or objectives.
� Generally, the smaller the scale (or thesmaller Strahler stream order), thehigher the concentration of nutrientsexpected.
� Water quality concentrations are oftenused to assess s. Measuring waterBMPquality at a smaller scale, like edge-of-field rather than in-stream, improvesthe likelihood of measuring asuccessful environmental responsecaused by s.BMP
� P BMPre- average edge-of-fieldconcentrations typically ranged from 2to 24 mg L for , and 0.5 to 9 mg
-1TN
L for . In comparison, the overall-1
TPaverages at the outlets of andIFCWHC TN
-1were 2.2 to 3.0 mg L for
and 0.3 to 0.6 mg L for .-1
TP
16
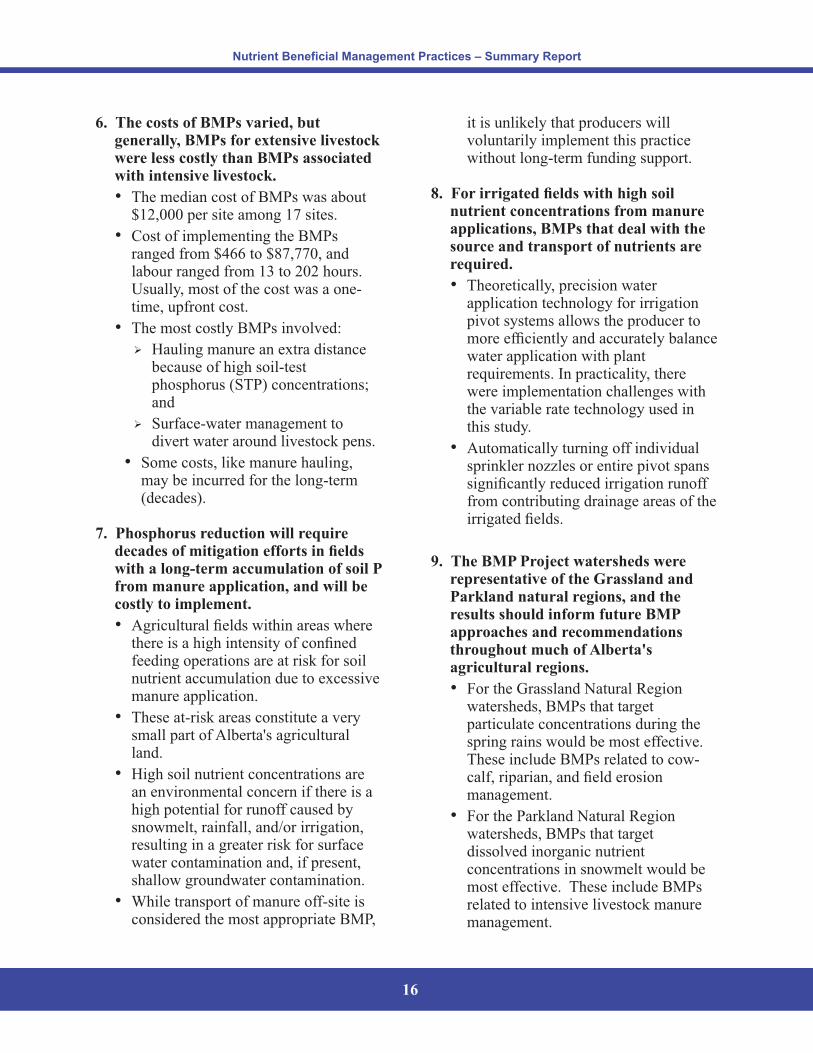
6. The costs of s varied, butBMPgenerally, s for extensive livestockBMPwere less costly than s associatedBMPwith intensive livestock.
� T BMPhe median cost of s was about$12,000 per site among 17 sites.
� C BMPost of implementing the sranged from $466 to $87,770, andlabour ranged from 13 to 202 hours.Usually, most of the cost was a one-time, upfront cost.
� T BMPhe most costly s involved:
� Hauling manure an extra distancebecause of high soil-testphosphorus ( ) concentrations;STPand
� Surface-water management todivert water around livestock pens.
� Some costs, like manure hauling,may be incurred for the long-term(decades).
7. Phosphorus reduction will requiredecades of mitigation efforts in fieldswith a long-term accumulation of soil Pfrom manure application, and will becostly to implement.
� Agricultural fields within areas wherethere is a high intensity of confinedfeeding operations are at risk for soilnutrient accumulation due to excessivemanure application.
� These at-risk areas constitute a verysmall part of Alberta's agriculturalland.
� High soil nutrient concentrations arean environmental concern if there is ahigh potential for runoff caused bysnowmelt, rainfall, and/or irrigation,resulting in a greater risk for surfacewater contamination and, if present,shallow groundwater contamination.
� While transport of manure off-site isconsidered the most appropriate ,BMP
it is unlikely that producers willvoluntarily implement this practicewithout long-term funding support.
8. For irrigated fields with high soilnutrient concentrations from manureapplications, s that deal with theBMPsource and transport of nutrients arerequired.
� Theoretically, precision waterapplication technology for irrigationpivot systems allows the producer tomore efficiently and accurately balancewater application with plantrequirements. In practicality, therewere implementation challenges withthe variable rate technology used inthis study.
� Automatically turning off individualsprinkler nozzles or entire pivot spanssignificantly reduced irrigation runofffrom contributing drainage areas of theirrigated fields.
9. The Project watersheds wereBMPrepresentative of the Grassland andParkland natural regions, and theresults should inform future BMPapproaches and recommendationsthroughout much of Alberta'sagricultural regions.
� For the Grassland Natural Regionwatersheds, s that targetBMPparticulate concentrations during thespring rains would be most effective.These include s related to cow-BMPcalf, riparian, and field erosionmanagement.
� For the Parkland Natural Regionwatersheds, s that targetBMPdissolved inorganic nutrientconcentrations in snowmelt would bemost effective. These include sBMPrelated to intensive livestock manuremanagement.
Nutrient Beneficial Management Practices – Summary Report
17
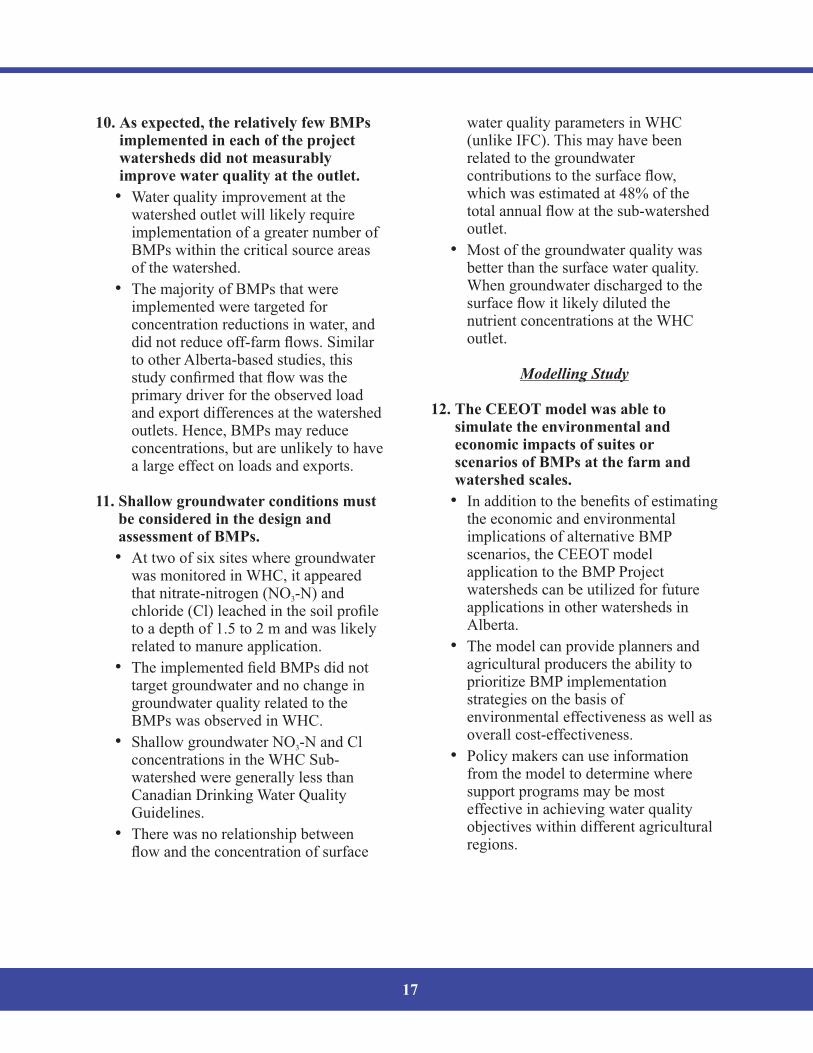
10. As expected, the relatively few sBMPimplemented in each of the projectwatersheds did not measurablyimprove water quality at the outlet.
� Water quality improvement at thewatershed outlet will likely requireimplementation of a greater number ofBMPs within the critical source areasof the watershed.
� T BMPhe majority of s that wereimplemented were targeted forconcentration reductions in water, anddid not reduce off-farm flows. Similarto other Alberta-based studies, thisstudy confirmed that flow was theprimary driver for the observed loadand export differences at the watershedoutlets. Hence, s may reduceBMPconcentrations, but are unlikely to havea large effect on loads and exports.
11. Shallow groundwater conditions mustbe considered in the design andassessment of s.BMP
� At two of six sites where groundwaterwas monitored in , it appearedWHCthat nitrate-nitrogen ( -N) andNO3
chloride (Cl) leached in the soil profileto a depth of 1.5 to 2 m was likelyandrelated to manure application.
� T BMPhe implemented field s did nottarget groundwater and no change ingroundwater quality related to theBMP WHCs was observed in .
� S NO3hallow groundwater -N and Clconcentrations in the Sub-WHCwatershed were generally less thanCanadian Drinking Water QualityGuidelines.
� There was no relationship betweenflow and the concentration of surface
water quality parameters in WHC(unlike ). This may have beenIFCrelated to the groundwatercontributions to the surface flow,which was estimated at 48% of thetotal annual flow at the sub-watershedoutlet.
� Most of the groundwater quality wasbetter than the surface water quality.When groundwater discharged to thesurface flow it likely diluted thenutrient concentrations at the WHCoutlet.
Modelling Study
12. The model was able toCEEOTsimulate the environmental andeconomic impacts of suites orscenarios of s at the farm andBMPwatershed scale .s
� In addition to the benefits of estimatingthe economic and environmentalimplications of alternative BMPscenarios, the modelCEEOTapplication to the ProjectBMPwatersheds can be utilized for futureapplications in other watersheds inAlberta.
� The model can provide planners andagricultural producers the ability toprioritize implementationBMPstrategies on the basis ofenvironmental effectiveness as well asoverall cost-effectiveness.
� Policy makers can use informationfrom the model to determine wheresupport programs may be mosteffective in achieving water qualityobjectives within different agriculturalregions.
18
13. The Farm-level Economic Model,which assessed the annual economicimpact of s on farm profits for 30BMPto 35 years, showed that financialimpacts were greater in some yearsthan others.
� M BMPost of the scenarios involvedconstruction and/or capital purchasesthat were incurred at the start of thescenario.
� Other costs, such as the loss of cropproduction, were incurred annually forthe entire modelling period.
� Although annual impacts may besmall, the long-term cumulativeimpacts on farm profits may besignificant.
14. The model scenario performanceBMPwas validated as it confirmed severalconclusions from the field study.
� S BMPcenario 2 (Field Study s) did notresult in large water qualityimprovements at the watershed outletswhen compared to the baseline.
� T BMPhis reflected the few s thatwere implemented relative to theland base in the watersheds.
� In contrast, significant edge-of-fieldwater quality improvements werepredicted by the implementation ofBMPs.
� Scenario 3 (Agricultural OperationPractices Act, , with manureAOPAmanagement based on -N limit)NO3
was only slightly more effective atimproving water quality than Scenario2.
� The baseline scenario and Scenario2 were similar to Scenario 3, exceptfor the inclusion of manureapplication setbacks in Scenario 3.
� The environmental and, to a lesserextent, the economic impacts of
Scenario 3 were dependent on thedistribution of manure applicationfields and common bodies of water,i.e., the more manure fields werecloser to water bodies, the greaterthe impacts. This was illustrated asScenario 3 resulted in greater waterquality improvements in thanWHCin and , because hadIFC LLB WHCgreater numbers of manured fieldsand common water bodies.
15. Although the model simulated thatriparian and cow-calf s resultedBMPin significant reductions of sedimentand nutrient losses, the environmentaloutcome may not be significant,depending on the watershed.
� I WHC BMPn , the riparian s resulted inabout 50% reduction of , , andTSS TNTP loads compared to the baselinescenario.
� I IFCn , the cow-calf and riparianBMPs resulted in about 25% reductionof loads and about 60 and 50%TSSreduction of and loads,TN TPrespectively, compared to the baselinescenario.
� Although the reductions appearsubstantial in both watersheds, WHCgenerally had very low baseline TSSand particulate nutrient concentrations,so the reduction may not bebiologically significant. In contrast,IFC TSS and particulate nutrientconcentrations were relatively high,and reduction in these parameters maybe environmentally beneficial.
� T BMPhe economic impacts of these swere minimal in areas where primecropland was not involved, because theopportunity cost of the land placed inthese structural controls was relativelylow compared to higher valuedcropland.
Nutrient Beneficial Management Practices – Summary Report

19
16. All Project watershed modelBMPscenarios resulted in negative netreturns either from a decline inrevenues or an increase in cost.
� T BMPhe economic impact of s variedamong farms and depended on theindividual farm characteristics and theextent to which the was applied.BMP
� The size of the individualrepresentative farms affected themagnitude of the economic impact.
� Large farms had smaller economicimpacts per hectare than smallfarms.
� Some scenarios will reduce loads for agiven indicator much more cost-effectively than for others.
17. For the Red Deer River study area,most scenarios were successful atBMPreducing nutrient losses from the farmor the study area as a whole, andusually at a financial cost to theproducer.
� O BMPf the six scenarios, only twoprovided a win-win outcome, i.e., areduction in nutrient loss and anincrease in farm profit.
� Scenario 3 (rotational grazing) wasthe only scenario shown to beBMPclearly cost-effective in terms ofmoderate environmentalimprovement, and increases in farmprofits. At the study areaRDRscale, the profit increase was about$4 ha yr , which amounted to
-1 -1
about $3 million year inperadditional farm profits at the studyarea scale.
� Scenario 2 (manure management)resulted in slightly improved farm
profits but provided more thantwice the reduction in load thanTPScenario 3.
� The cost was minimal for Scenario4 (seasonal bedding and feedingsites) and the environmentalimprovements were modest.
� Scenarios 5 and 7 (grassedwaterways and wetland restoration,respectively) resulted in modestimprovements to most of theenvironmental indicators at modestcosts.
� Scenario 6 (riparian setbacks)generally demonstrated significantenvironmental improvements butthe costs were the highest. Whenimplemented throughout thewatershed where applicable, theoverall costs to the regionamounted to almost $4 million peryear.
18. Water quality improvements weremore easily demonstrated at the edge-of-field or at the outlet of relativelysmall watersheds than for a largerwatershed like the Red Deer Riverstudy area.
� The impacts of the mountain-fed baseflow in the Red Deer River oftenovershadowed the cumulative effectsof scenarios in the studyBMP RDRarea.
� These modelling results were validatedand supported by findings from theBMP Field Study, i.e., scale makes adifference when consideringmeasurable changes in sediment andnutrient concentrations.
20
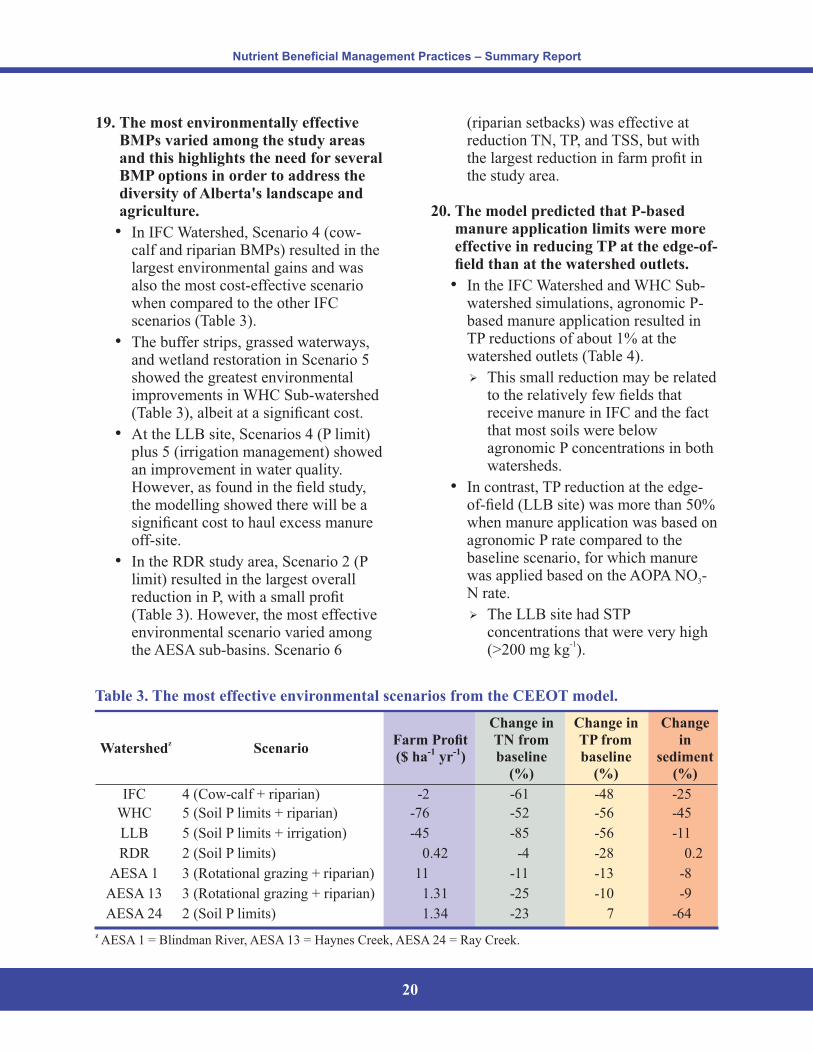
19. The most environmentally effectiveBMPs varied among the study areasand this highlights the need for severalBMP options in order to address thediversity of Alberta's landscape andagriculture.
� I IFCn Watershed, Scenario 4 (cow-calf and riparian s) resulted in theBMPlargest environmental gains and wasalso the most cost-effective scenariowhen compared to the other IFCscenarios (Table 3).
� The buffer strips, grassed waterways,and wetland restoration in Scenario 5showed the greatest environmentalimprovements in Sub-watershedWHC(Table 3), albeit at a significant cost.
� A LLBt the site, Scenarios 4 (P limit)plus 5 (irrigation management) showedan improvement in water quality.Howeve , as found in the field study,rthe modelling showed there will be asignificant cost to haul excess manureoff-site.
� I RDRn the study area, Scenario 2 (Plimit) resulted in the largest overallreduction in P, with a small profit(Table 3). However, the most effectiveenvironmental scenario varied amongthe sub-basins. Scenario 6AESA
Watershedz
ScenarioFarm Profit
($ ha-1
yr-1
)
Change in
TN from
baseline
(%)
Change in
TP from
baseline
(%)
Change
in
sediment
(%)
IFC 4 (Cow-calf + riparian) -2 -61 -48 -25
WHC 5 (Soil P limits + riparian) -76 -52 -56 -45
LLB 5 (Soil P limits + irrigation) -45 -85 -56 -11
RDR 2 (Soil P limits) 0.42 -4 -28 0.2
AESA 1 3 (Rotational grazing + riparian) 11 -11 -13 -8
AESA 13 3 (Rotational grazing + riparian) 1.31 -25 -10 -9
AESA 24 2 (Soil P limits) 1.34 -23 7 -64
(riparian setbacks) was effective atreduction , , and , but withTN TP TSSthe largest reduction in farm profit inthe study area.
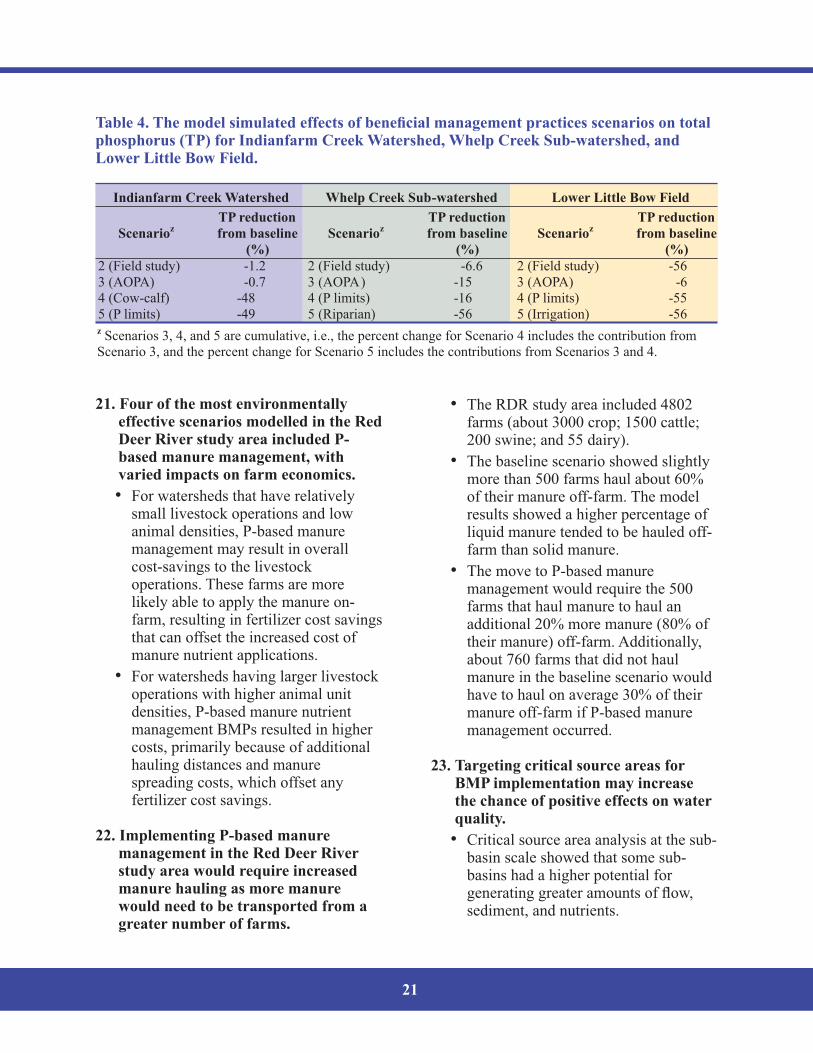
20. The model predicted that P-basedmanure application limits were moreeffective in reducing at the edge-of-TPfield than at the watershed outlets.
� I IFC WHCn the Watershed and Sub-watershed simulations, agronomic P-based manure application resulted inTP reductions of about 1% at thewatershed outlets (Table 4).
� This small reduction may be relatedto the relatively few fields thatreceive manure in IFC and the factthat most soils were belowagronomic P concentrations in bothwatersheds.
� I TPn contrast, reduction at the edge-of-field ( site) was more than 50%LLBwhen manure application was based onagronomic P rate compared to thebaseline scenario, for which manurewas applied based on the -AOPA NO3
N rate.
� T LLB STPhe site hadconcentrations that were very high(>200 mg kg ).
-1
Nutrient Beneficial Management Practices – Summary Report
Table 3. The most effective environmental scenarios from the model.CEEOT
zAESA 1 = Blindman River, AESA 13 = Haynes Creek, AESA 24 = Ray Creek.
21
21. Four of the most environmentallyeffective scenarios modelled in the RedDeer River study area included P-based manure management, withvaried impacts on farm economics.
� For watersheds that have relativelysmall livestock operations and lowanimal densities, P-based manuremanagement may result in overallcost-savings to the livestockoperations. These farms are morelikely able to apply the manure on-farm, resulting in fertilizer cost savingsthat can offset the increased cost ofmanure nutrient applications.
� For watersheds having larger livestockoperations with higher animal unitdensities, P-based manure nutrientmanagement s resulted in higherBMPcosts, primarily because of additionalhauling distances and manurespreading costs, which offset anyfertilizer cost savings.
22. Implementing P-based manuremanagement in the Red Deer Riverstudy area would require increasedmanure hauling as more manurewould need to be transported from agreater number of farms.
� T RDRhe study area included 4802farms (about 3000 crop; 1500 cattle;200 swine; and 55 dairy).
� The baseline scenario showed slightlymore than 500 farms haul about 60%of their manure off-farm. The modelresults showed a higher percentage ofliquid manure tended to be hauled off-farm than solid manure.
� The move to P-based manuremanagement would require the 500farms that haul manure to haul anadditional 20% more manure (80% oftheir manure) off-farm. Additionally,about 760 farms that did not haulmanure in the baseline scenario wouldhave to haul on average 30% of theirmanure off-farm if P-based manuremanagement occurred.
23. Targeting critical source areas forBMP implementation may increasethe chance of positive effects on waterquality.
� Critical source area analysis at the sub-basin scale showed that some sub-basins had a higher potential forgenerating greater amounts of flow,sediment, and nutrients.
Table 4. The model simulated effects of beneficial management practices scenarios on totalphosphorus ( ) for Indianfarm Creek Watershed, Whelp Creek Sub-watershed, andTPLower Little Bow Field.
Indianfarm Creek Watershed Whelp Creek Sub-watershed Lower Little Bow Field
Scenarioz
TP reduction
from baseline
(%)
Scenarioz
TP reduction
from baseline
(%)
Scenarioz
TP reduction
from baseline
(%)
2 (Field study) -1.2 2 (Field study) -6.6 2 (Field study) -563 ( )AOPA -0.7 3 (AOPA) -15 3 ( )AOPA -64 (Cow-calf) -48 4 (P limits) -16 4 (P limits) -555 (P limits) -49 5 (Riparian) -56 5 (Irrigation) -56z Scenarios 3, 4, and 5 are cumulative, i.e., the percent change for Scenario 4 includes the contribution fromScenario 3, and the percent change for Scenario 5 includes the contributions from Scenarios 3 and 4.
22
� It was estimated that 12 and 37% ofthe total study area exported 49RDRand 74% of and loads,TN TPrespectively.
� Averaged among the sevenenvironmental indicators, the criticalsource area represented 20% of theRDR study area and contributed 65%to the total load of the environmentalindicators.
Scientific Recommendations
1. Develop specific water qualityobjectives for key nutrients such as TNand in agricultural watershedTPstreams that reflect the naturallynutrient-rich prairie soils.
� Research is required to definebackground nutrient levels in thenatural environment of Alberta'sagricultural regions, and to developpractical, achievable, and acceptablenutrient concentration objectives instreams and tributaries.
� Water quality objectives will help theagricultural industry and producersdefine success in their pursuit ofenvironmental sustainability.
2. key preventative plan to protectAwater quality is to avoid the build-up ofsoil nutrients on agricultural land.
� Repetitive manure application throughgrazing or field application can quicklycause nutrients to accumulate in soil.
� Hotspots, or small areas with highnutrients, can develop within fields ifmanure or livestock are confined to asmall area.
� High soil nutrient concentrations arean environmental concern if there is a
high potential for runoff caused bysnowmelt, rainfall, and/or irrigation.
� The residual accumulation of organic Pfrom manure will maintain STPconcentrations for several years aftermanure application is stopped.
� Regular soil testing should bepracticed to monitor potential soil Paccumulation.
� Phosphorus-based management maybe cost-effective for small livestockoperations but it is not cost-effectivefor large operations that have less landper animal unit. Current fundingprograms do not support long-termBMP costs like hauling manure greaterdistances.
3. Critical source areas should bemapped and defined for allagricultural watersheds in Alberta.
� Research continues to show thatrelatively small areas or sub-basinswithin watersheds often contribute themajority of nutrient loading toreceiving streams and tributaries.
� Accurately defining these areas willallow effective planning of newintensive livestock development, andfocus water quality mitigaton efforts inareas that will be the most cost-effective.
4. Suites of agricultural s should beBMPimplemented within watersheds inorder to achieve measurabledownstream water qualityimprovement.
� T BMPhis study showed that s atindividual sites are unlikely to besuccessful in significantly improvingwater quality in receiving streams andat the watershed outlet.
Nutrient Beneficial Management Practices – Summary Report
23
� A BMPdefined number of manysuites, properly designed andimplemented at key watershedlocations (i.e., critical-source areas),should successfully mitigateagriculture-related water quality issuesat the watershed outlet.
� Programs that support the coordinationof assessment, design andBMPimplementation at the watershed scaleshould be encouraged.
5. Alberta should continue to assess thecumulative and long-term effectivenessof s to mitigate the impacts ofBMPagricultural management on waterquality at the watershed scale.
� T BMPhe Project provides a goodtemplate to move forward with
cooperation among producers,industry, and government. This hascontinued in the current 'AlbertaPhosphorus Watershed Project (startedin 2013)', which has the objectives todevelop a P-loss risk management tool,implement a critical number of sBMPin critical-source areas, and assessBMP effects on water quality at theoutlet of agricultural watersheds.
� Results from watershed researchprograms should be demonstrated toagricultural producers through on-sitetours, interviews with cooperatingproducers, publications, and theinternet.
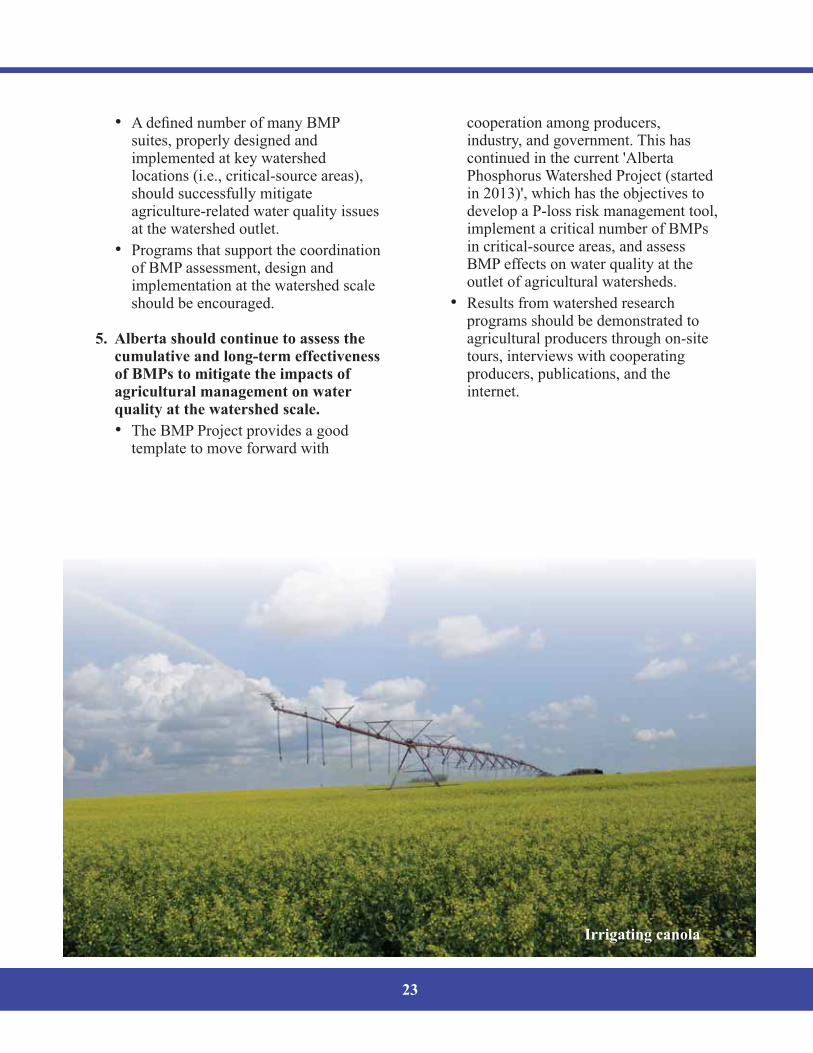
Irrigating canola
24
Nutrient Beneficial Management Practices – Summary Report
ACKNOWLEDGEMENTS
This report was prepared using information and graphics from Volumes 2 and 3, which wereprepared by a dedicated research team. The contributing authors of Volumes 2 and 3 were Ki Au,Wiebe Buruma, Janna Casson, Jollin Charest, Andy Jedrych,Taren Cleland, Richard Heikkila,Andrea Kalischuk, Madison Kobryn, Kristen Lorenz, Barry Olson,Lynda Miedema, TroyOrmann, Andrew Sommerville, andColleen Phelan, Nicole Seitz, Janelle Villeneuve of AlbertaAgriculture and Rural Development; and Oscar Gallego, Edward Osei, and Ali Saleh of theTexas Institute for Applied Environmental Research, Tarleton State University, Stephenville,Texas, United States.
Appreciation is expressed to Andrea Kalischuk (Project Sponsor and Manager) and Barry Olson(Project Scientist) for editorial guidance and support in preparation of this report (Volume 1).Appreciation is also expressed to Bonnie Hofer (Alberta Agriculture and Rural Development) forthe design and layout of this report.
Comments and suggestions on this report were appreciated from the Stakeholders ReviewCommittee, which included Ron Axelson, Rich Smith (Alberta Beef Producers), Stuart Thiessen(Alberta Beef Producers), Martin Van Diemen (Alberta Milk), Mike Slomp (Alberta Milk),Martin Zuidhof (Alberta Cattle Feeders' Association), Bryan Walton (Alberta Cattle Feeders'Association), Susan Gal (Egg Farmers of Alberta), and Jeff Kamlah (Alberta Turkey Producers)of the Intensive Livestock Working Group; Tom Jensen of the International Plant NutritionInstitute; David Chanasyk of the University of Alberta; and Trevor Wallace of EnvironmentalStewardship Division, Alberta Agriculture and Rural Development.
For the overall BMP Project, assistance from additional Alberta Agriculture and RuralDevelopment staff included Syd Abday, Phil Boehme, Angela Chinn, Brian Coffey, Dana Coles,Brian Cook, Alexandra Crook, Sarah Depoe, Mike Ellefson, Clair Fitzpatrick, Francine Forrest,Paul Graveland, Lloyd Healy, Ward Henry, Daniel Itenfisu, Mark Kadijk, Andy Jedrych, JenniferKerr, Adelle Kientz, Len Kryzanowski, Larry Kwasny, Joanne Little, Rhonda MacKay, GyanMankee, Cory McIsaac, Brock McLeod, Cody Metheral, Marilou Montemayor, GeoffMontgomery, Tanya Moskal-Hébert, Gerald Ontkean, Lana Ontkean, Olubukola Oyewumi, JimParker, Brent Paterson, Longin Pawlowski, Jason Pentland, Murray Peters, Mark Potvin, MikeSajjad, Lawrence Schinkel, Barb Shackel-Hardman, David Spiess, Trevor Wallace, Jamie Wuite,Karen Yakimishyn, Peter Yu, and Alison Zook.
Funding for this project was provided by the Alberta Crop Industry Development Fund (ACIDFProject 2007C012R), Alberta Environment and Sustainable Resource Development, and AlbertaConservation Association.
25
Support was also provided at various stages during this project from:
� The Municipal District of Pincher Creek and the County of Lacombe.
� Agriculture and Agri-Food Canada, through the former Agri-Environment Services Branch(AESB), for providing and modifying the AgCapture program for recording the land-coverinventories for the Indianfarm Creek and Whelp Creek watersheds, with particular thanksto Sonia Salyzyn and Jason Vanrodaeys. Also, thanks to Michael Bock and Tony Brierleyfrom Agriculture and Agri-Food Canada.
� The collaboration with Dr. Gary Kachanoski and his research team, including Dr. GroLilbaek, from the University of Alberta, with special thanks to Andre Christensen forassisting with the installation of the groundwater wells in the Whelp Creek Sub-watershed.
� The advice and suggestions from Dr. Stewart Rood of the University of Lethbridge,regarding riparian assessment.
� The Rocky Mountain Forage Association for advice in preparing a BMP plan for the SouthPasture Site in the Whelp Creek Sub-watershed
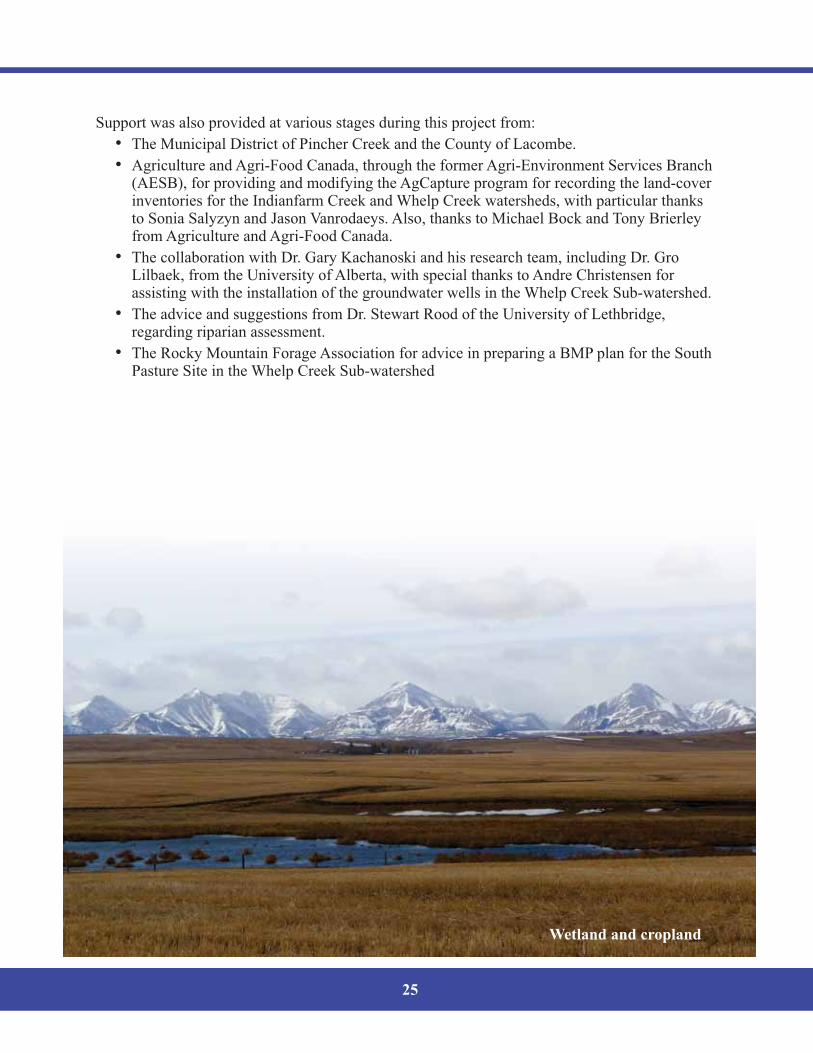
Wetland and cropland
26