social disruption in a mass stranding of long-finned pilot whales
TRANSCRIPT
http://researchspace.auckland.ac.nz
ResearchSpace@Auckland
Copyright Statement The digital copy of this thesis is protected by the Copyright Act 1994 (New Zealand). This thesis may be consulted by you, provided you comply with the provisions of the Act and the following conditions of use:
• Any use you make of these documents or images must be for research or private study purposes only, and you may not make them available to any other person.
• Authors control the copyright of their thesis. You will recognise the author's right to be identified as the author of this thesis, and due acknowledgement will be made to the author where appropriate.
• You will obtain the author's permission before publishing any material from their thesis.
To request permissions please use the Feedback form on our webpage. http://researchspace.auckland.ac.nz/feedback
General copyright and disclaimer In addition to the above conditions, authors give their consent for the digital copy of their work to be used subject to the conditions specified on the Library Thesis Consent Form.

GENETIC AND DEMOGRAPHIC INVESTIGATION OF POPULATION STRUCTURE AND SOCIAL SYSTEM IN
FOUR DELPHINID SPECIES
Marc Oremus
A thesis submitted in fulfilment of the requirements for the Degree of Doctor of
Philosophy in Biological Sciences
The University of Auckland
2008

i
Thesis Abstract
Population structure, genetic diversity and social system were investigated in four species of dolphins, thought to present contrasting habitat preferences and social organisation: spinner dolphins, rough-toothed dolphins, long-finned and short-finned pilot whales. To overcome methodological limitations, I combined molecular markers (mitochondrial DNA, -or mtDNA-, and microsatellite loci) and observational data (photo-identification and mass strandings) where possible. Genetic samples were obtained from skin biopsies of free-ranging (n = 243) and stranded (n = 375) dolphins. As with many species of delphinids, spinner dolphins (Stenella longirostris) form communities in which social and reproductive boundaries are poorly understood. In French Polynesia, capture-recapture analyses based on photographs of distinctly marked individuals (DMIs) and microsatellite genotypes (12 loci) indicated a community of about 150 dolphins around Moorea that is relatively closed on a generational time scale. Distinct communities, likely to follow a similar demographic pattern, were observed around neighbouring islands (Tahiti, Raiatea, Huahine and Bora Bora), as indicated by photo-identification data and restricted gene flow (FST = 0.143, n = 154). Surprisingly high levels of insular mtDNA genetic diversity (average π = 1.44%, suggesting Nef ~ 100,000) contrasted with demographic characteristics of these communities. There was no evidence for a recent bottleneck effect, suggesting that this pattern is the result of metapopulation structure, based on numerous insular communities connected through male and female gene flow. Investigation of the worldwide mtDNA diversity and phylogeography of long-finned and short-finned pilot whale species revealed a complex evolutionary history (Globicephala melas, n = 434; and G. macrorhynchus, n = 134, including published and unpublished sequences). Strong genetic differentiation between long-finned pilot whales from the North Atlantic (G. m. melas) and Southern Hemisphere (G. m. edwardii) indicated severely restricted gene flow, although shared haplotypes suggested some recent contact between the two subspecies. Low genetic distances among haplotypes and a star-like phylogeny suggested a recent worldwide expansion for this species. Higher levels of diversity (although low compared to other cetaceans) were found in short-finned pilot whales, in particular among samples from around Japan. Phylogeographic studies suggested that Japanese samples originate from three distinct populations, one of which could be the ancestral population of the species. Overall, my results confirmed that worldwide mtDNA diversity is low in the two species, probably due to a recent worldwide population expansion and, potentially, to a matrilineal social structure. The molecular ecology of the mass strandings of long-finned pilot whales around New Zealand was investigated to test the hypothesis that individuals stranding together are part of an extended matrilineal group. Analyses of mtDNA sequences indicate that more than one haplotype was found in five of the seven mass strandings
ii
investigated (n = 275), demonstrating that groups are sometimes composed of unrelated maternal lineages. This was further supported by analyses of relatedness within and between strandings based on microsatellites (14 loci). These analyses discount kinship as the only factor causing large mass strandings in long-finned pilot whales. Parentage analyses confirmed some aspects of previous studies in the North Atlantic, suggesting a social system with at least some level of male and female philopatry to the maternal group, and infrequent paternities within the group. In a detailed study of a large mass stranding (Stewart Island 2003, n = 122), there was no correlation between position of the whales on the beach and genetic relatedness (based on 20 microsatellite loci), discounting the assumption that kinship bonds are maintained during these traumatic events. This was further supported by the striking separation of stranded mothers and dependant calves. This disruption of kinship bonds could help explain the behavioural distress of stranded individuals and the tendency of many whales to re-strand even after being re-floated. Finally, a study of rough-toothed dolphins (Steno bredanensis) in the Society Archipelago, French Polynesia, provided new insights in the ecology of this poorly-known species. Although traditionally viewed as a pelagic dolphin, analyses supported a pattern of local communities, in some ways similar to spinner dolphins, with fine-scale population genetic structure (FST = 0.60, p < 0.001 based on mtDNA, n = 65) and local fidelity. These communities also showed a low level of mtDNA haplotype diversity (four unique haplotypes at Moorea compared to 18 for spinner dolphins), suggesting the potential influence of a matrilineal social structure similar to long-finned pilot whales.

iii
Dedication
To my parents
Bernadette and Jean-Louis OREMUS
For always being here for me

iv
Acknowledgments
During the first weeks of my thesis, preparing my fieldwork at Moorea, I have to say that I felt very lonely far from home and family left behind in France. As my next three (to five…) years were meant to be spent in French Polynesia and New Zealand, I had the first impression that I was about to live a great but rather solitary experience. Instead, it did not take very long for me to realise that I would not go anywhere in this endeavour alone. From fixing holes in the inflatable boat (which is pretty much how I started my PhD) to the last proof readings of my chapters, I received continuous and tremendous help and support from many many people that I wish to thank here. My first acknowledgments go to my main supervisor, Prof. C. Scott Baker, and my co-supervisor, Dr. M. Michael Poole. Thanks Scott for all your guidance, support and encouragement during this thesis (without forgeting your tonnes of editing). Thanks for the freedom you gave me, but always keeping an eye on my work to put me back on the right direction when I needed it. Michael, I’ll never be grateful enough for giving me this incredible opportunity to continue your research on dolphins in French Polynesia, and for sharing so much with me. This could well remain the greatest experience of my life. Thank you. This research has been possible thanks to the New Zealand Marsden Fund which provided the main funding for this project. I also thank the following institutions for providing additional funding: the Whale and Dolphin Adoption Project, the University of Auckland Graduate Research Fund, IFAW, Vista Press, Englehard Foundation, the SBS contestable travel fund and the Society for Marine Mammalogy student travel grant. To people in French Polynesia: Many thanks to Prof. René Galzin for all his advices and support during my fieldwork at Moorea. You always took the time to enquire about the progress of my thesis even though I was not your student. It has been very valuable help for me. Thanks to all my fellows at CRIOBE for all these great moments together and for coming on the boat with me when nobody else was there: I think in particular of Caroline Vieux, Marie Younger, Julien Million, Romain Foki, Elodie Lagouy, Catherine Gonnot, Thomas Binet, Lucie Penin, Medhi Adjerhoud, Moira Decima, and, of course, my dear Féroce & Rotui. Thanks to Yannick Chancerelle, Pascal Ung and James Algret from CRIOBE, for helping me so much with logistic. Thanks also to Emilie Leprêtre and Pierre Petitjean for your help on the field. Special thanks go to my friend Andrew Carroll, one of the most caring and loveable people I have ever met, with who I shared so much during my time at Moorea (including a lot of Hinano). I wish you all the best my friend. Big thanks to Rodolphe Holler and his family. I really hope that we’ll get the chance to go back on the field together during the whale season. I want to thank Yves Ducreux

v
and Véronique Pérard with the help of who I have been able to conduct some surveys in the Leeward Islands of the Society Archipelago and in the Tuamotu, aboard the superb Touaou. God, I was so sick on this boat… but the trip was still worth it, that’s for sure! Thanks also to Nelly and Laurent from Raiatea. I had a great time with you, driving the poti marara and going diving at night. All of you guys are so devoted to the cause; I truly admire you for your commitment. You offer the best help we (the ‘bloody scientists’) can hope for and we owe you a lot for our ‘scientific’ achievements. Thanks. Thank you to my “impeccable” colleague and friend, Manuel Ballesteros, who came to give me a hand during my first field season. It was a lot of fun. Please, let me know if I can give you a hand with your birds, it would be a pleasure for me to help you back. Thanks to Fred Jacques at Raiatea and Xavier Curvat from the Diving Club in Nuku Hiva for kindly providing me with a roof or a boat during my time in the outer islands. I wish to thank the “Ministère de l’Environnement” and the “Délégation à l’Environnement” of French Polynesia for allowing my research to be conducted under the research permit attributed to Dr. Poole. To the people in New Zealand: I would like to acknowledge the staff, past and present, of the Department of Conservation, for collecting so many stinky samples of stranded whales around New Zealand. In particular, I thank Helen Kettles and Caren Schröder, who dealt with large mass strandings in Stewart Island and Farewell Spit. Thanks to Sheryl Gybney for interesting discussions and for passing on some of her knowledge on cetacean mass strandings. Thank you to my lab mates from the laboratory of Molecular Ecology and Evolution for entertaining me, helping me, taking me on the field, and for enduring my moaning in French when PCRs were not working. An incredible mix of people with, I believe, as many as 11 nationalities represented. It’s not something that I would have got the chance to experience in a French laboratory! So a big thanks to you guys: Carlos Olavarría, Nicky Wiseman, Dorothea Heimeier, Gabriela de Tezanos Pinto, Susanna Caballero, Shane Lavery, Fabianna Mourão, Kirsty Russell, Colm Carraher, Alana Alexander, Jess Hayward, Hamish MacInnes, Murdock Vant, Emma Carroll, Vimoksalehi Lukoschek, Jennifer Jackson, Lida Pimper, Rebecca Hamner, Danielle Hannan, Andrew Veale and Agnes Le Port. I also wish good luck to the new ones in the Lavery lab: Leah, Claire, Martin and Frank. Thanks to my other fellows at SBS, I think in particular of Karin Farreyrol (now in La Reunion) and Björn Heijstra. I also want to thank Kristine Boxen for great help and great smile in the sequencing room. Thanks to the glorious ancients of the Baker lab: Merel Dalebout, Rochelle Constantine, Franz Pichler, Nathalie Patenaude and Tony Hickey. That was not an easy task to come after you guys, because you all did such a great job for your PhD. I tried to find inspiration in your manuscript, but I often ended up getting quite depressed, realising that it will be pretty hard for me to reach the same quality. Anyway, you all helped me in various ways at one stage or another of my thesis, so

vi
thank you. Special thank to you, Rochelle, for helping me finding extra funding to work on the pilot whale samples, first with the WADAP and now with the ACCAMS. Last in the lab but not least, I thank Debbie Steel for her tremendous help from day 1 to the day of submission. I should have counted the number of questions I asked you during my thesis. I’m sure it is quite an impressive number… Thank you very much Debbie, I owe you a lot (sorry I was not able to teach you how to pronounce a proper “r” in French…). Thanks to the French community in Auckland for providing me with a taste of France, and a lot of fun parties: in particular, I thank Louis Ranjard (thanks also for your help with MATLAB, and appreciable coffee breaks at the lab), Jean Markarian, Julien Arnoux, Karine David, Stéphane Guindon, Elsa Kassardjian and Bénédicte Madon. To people around the world: I wish to thanks Tetsuya Endo and Naoko Funahashi in Japan, and Rosemary Gales in Australia for providing samples of long-finned pilot whale from ‘whale-meat’ market and strandings. Thanks to Michael Russello, Christina Pomilla, Michael Krützen, Anna Chao and Steven Kalinowski for help with computer programs. Many thanks to Claire Garrigue from Opération Cétacés for her help, friendship and for giving me the opportunity to go in New Caledonia during the whale season. Thanks also for being such a great example for me. I thank the rest of the Opération Cétacés team, including Aline Schaffar, Remy Dodemont and Hughes Ducreux. Thanks to the members of the South Pacific Whale Research Consortium for supporting my research through collaborative work and accepting one more Frenchman into the circle. Thanks to Lui Bell and SPREP for giving me the opportunity to present my results during the workshop at Samoa, in August 2005. To people in France (so it will be in French): Je remercie la famille Moreau pour leur soutient et leur amitié depuis temps d’années. Merci à Arnaud Legrand et sa petite famille. Je ne désespère pas de pouvoir travailler un jour avec toi mon ami. En Polynésie ou à Chizé les Bains, peu importe… Je salue Sandra Gaborit, Julie Pradera, Caroline Poupart, Badr Slassi, Arnaud Delaire, les familles Legarrec et Renaud, ainsi que tous mes amis en France. Merci à Laurent Grammont pour avoir été présent dans les moments difficiles. Egalement un énorme merci à mes amis très chers que sont Etienne Preys, Yohann Cardon et Mallorie Baussey. Pleins de bonnes choses à tous. Merci à toute ma famille, côté Oremus et côté Blanchard, pour leur soutien moral et mais aussi financier. Je n’oublie pas que mes parents et ma grand mère Oremus m’ont évité la banqueroute dans les moments difficiles. Merci pour tout, sans vous j’y serai encore… Une pensée toute particulière va à mes deux grands pères, Johnny Oremus et Claude Blanchard.
vii
Un remerciement tout spécial revient à Elise Mechain qui, durant cette thèse, m’a tant donné et apporté sans jamais compter. Difficile de trouver les mots bien évidemment mais sache que… Enfin, je remercie mes « brothers » - Cedric Delaire, Vincent Legarrec, Alexandre Renaud, Willy Praud et Jérémie Batsalle - pour être reste fidèle à eux même et fidèle à nous. Je vais essayer de ne pas trop sombrer dans le sentimental car ce n’est pas trop le style de la maison (excepté à 2 g) mais je tiens à vous dire que pour moi, derrière le terme un peu puéril de « brothers » se cache une vérité : vous êtes la famille. Merci d’être là. Lasts but not least (English and French): A huge thanks to Sarah “limpet” Wells for giving me a normal life back and for her invaluable help, support and love during these last two years. I can’t believe you managed to live aside a PhD student in the last part of his thesis (probably one of the worst types of human being). I promise you that I’ll try to do as well as you when you’ll come to do your PhD. Thank you so much limpet, you cannot imagine how lucky I feel to have you next to me. Je fini avec ceux avec qui tout a commencé, mes parents Bernadette et Jean-Louis Oremus. Il n’y pas de mot suffisamment fort pour vous remercier comme il se doit. Sans votre soutient, sans votre amour, il n’y aurait rien eu de tout ca. On entend souvent des parents dire combien ils sont fiers de leurs enfants ; je peux vous dire aujourd’hui combien je suis fier de mes parents.
viii
Table of Contents
Thesis Abstract ................................................................................................... i
Dedication .......................................................................................................... iii
Acknowledgments............................................................................................. iv
Table of Contents ............................................................................................ viii
List of Tables ................................................................................................... xiii
List of Figures................................................................................................... xv
1. General Introduction ............................................................................... 1
1.1. Overview......................................................................................... 1
1.2. Brief review on the systematics of dolphins ................................... 2 1.2.1. Mechanisms of speciation in dolphins........................................ 3 1.2.2. Phylogeny and sources of paraphyly ......................................... 4 1.2.3. Convergence with terrestrial mammals ...................................... 5
1.3. Investigation of population structure .............................................. 7 1.3.1. A challenging task in delphinid species...................................... 7 1.3.2. Factors driving dolphin population structure............................... 9
1.4. Genetic diversity ........................................................................... 12
1.5. Social system ............................................................................... 14
1.6. Principal methodological tools used in this study......................... 19 1.6.1. Photo-identification................................................................... 19 1.6.2. Biopsy sampling ....................................................................... 20 1.6.3. Molecular markers.................................................................... 22
1.7. Thesis outline and collaborators................................................... 24
2. Isolation and interchange among insular spinner dolphin communities in the South Pacific revealed by individual identification and genetic diversity 28
2.1. Abstract......................................................................................... 29
2.2. Introduction................................................................................... 30
2.3. Materials & Methods..................................................................... 34 2.3.1. Study area and small-boat surveys.......................................... 34 2.3.2. Collection and analysis of photo-identification data ................. 35 2.3.3. Biopsy sampling and DNA extraction ....................................... 36 2.3.4. mtDNA sequencing, genotyping and sex identification ............ 36
ix
2.3.5. Moorea community size estimate............................................. 37 2.3.6. mtDNA and microsatellite diversity........................................... 38 2.3.7. Population structure and sex specific dispersal ....................... 39 2.3.8. Female long-term effective population size (Nef) ...................... 39 2.3.9. Testing for recent bottleneck effect .......................................... 40
2.4. Results.......................................................................................... 41 2.4.1. Survey effort and sample size .................................................. 41 2.4.2. Demographic closure at Moorea .............................................. 42 2.4.3. Abundance of Moorea community............................................ 44 2.4.4. Individual interchange among islands ...................................... 45 2.4.5. mtDNA diversity and effective population size ......................... 46 2.4.6. Population differentiation.......................................................... 48 2.4.7. Sex-biased dispersal ................................................................ 49 2.4.8. Genetic signature of community bottleneck ............................. 50
2.5. Discussion .................................................................................... 51 2.5.1. Demographic closure of Moorea community............................ 51 2.5.2. Demographic community trends in the Society Archipelago .... 51 2.5.3. Population genetic structure and sex-biased dispersal ............ 52 2.5.4. Pelagic colonisation or island metapopulation? ....................... 54
3. Worldwide mtDNA phylogeography and diversity of pilot whale species (Globicephala spp.) .......................................................................................... 57
3.1. Abstract......................................................................................... 58
3.2. Introduction................................................................................... 59
3.3. Materials & Methods..................................................................... 65 3.3.1. Sample collection and additional sequences ........................... 65 3.3.2. Laboratory analyses of tissue samples .................................... 67 3.3.3. Phylogenetic reconstruction ..................................................... 68 3.3.4. Geographical areas and adjusted sampling ............................. 69 3.3.5. Genetic diversity and population structure ............................... 70 3.3.6. Demographic history ................................................................ 71
3.4. Results.......................................................................................... 72 3.4.1. Phylogenetic reconstruction and sequence variation ............... 72 3.4.2. Long-finned pilot whales (Globicephala melas)........................ 76 3.4.3. Short-finned pilot whales (Globicephala macrorhynchus) ........ 80
3.5. Discussion .................................................................................... 85 3.5.1. Pilot whale species and sub-species........................................ 85
x
3.5.2. Long-finned pilot whale phylogeography.................................. 86 3.5.3. Short-finned pilot whales phylogeography ............................... 88
4. Patterns of kinship and mtDNA lineage within mass strandings of long-finned pilot whales around New Zealand ...................................................... 94
4.1. Abstract......................................................................................... 95
4.2. Introduction................................................................................... 96
4.3. Materials & Methods................................................................... 100 4.3.1. Data collection........................................................................ 100 4.3.2. DNA extraction and sequencing............................................. 102 4.3.3. Microsatellite genotyping........................................................ 102 4.3.4. Age/sex classes ..................................................................... 103 4.3.5. mtDNA control region............................................................. 104 4.3.6. Patterns of relatedness .......................................................... 104 4.3.7. Parentage analyses ............................................................... 105
4.4. Results........................................................................................ 107 4.4.1. Molecular sexing and age/sex classes................................... 107 4.4.2. Overall mtDNA diversity ......................................................... 107 4.4.3. mtDNA haplotype distribution................................................. 108 4.4.4. Microsatellite statistics............................................................ 110 4.4.5. Relatedness estimator............................................................ 110 4.4.6. Within-stranding mean relatedness........................................ 111 4.4.7. mtDNA haplotypes and microsatellite relatedness................. 113 4.4.8. Parentage inference............................................................... 114
4.5. Discussion .................................................................................. 115 4.5.1. Unrelated maternal lineages in mass strandings ................... 115 4.5.2. Using mass stranding data to infer social structure................ 117 4.5.3. A scenario of “unrelated matrilineal groups”........................... 117 4.5.4. A similar social system to the North Atlantic .......................... 118 4.5.5. Comparison to other matrilineal species of odontocetes........ 120
5. “O’ mother where art thou?” Social disruption in a mass stranding of long-finned pilot whales ................................................................................ 122
5.1. Abstract....................................................................................... 123
5.2. Introduction................................................................................. 124
5.3. Materials & Methods................................................................... 127 5.3.1. Circumstances of the stranding.............................................. 127 5.3.2. Data collection........................................................................ 128
xi
5.3.3. DNA extraction and microsatellite genotyping........................ 129 5.3.4. Age/sex class ......................................................................... 130 5.3.5. Spatial autocorrelation analyses ............................................ 131 5.3.6. Relatedness analyses ............................................................ 131 5.3.7. Parentage analyses ............................................................... 132
5.4. Results........................................................................................ 133 5.4.1. Sex/age class information ...................................................... 133 5.4.2. Microsatellite analyses ........................................................... 134 5.4.3. Spatial autocorrelation analyses ............................................ 134 5.4.4. Relatedness and overall spatial distribution ........................... 135 5.4.5. Parentage inference............................................................... 136
5.5. Discussion .................................................................................. 140 5.5.1. Missing mothers ..................................................................... 140 5.5.2. Potential scenarios explaining social disruption ..................... 141 5.5.3. Management of future strandings and animal welfare ........... 143
6. Evidence of fine-scale population structure in rough-toothed dolphins from the Society Archipelago, French Polynesia ....................................... 145
6.1. Abstract....................................................................................... 146
6.2. Introduction................................................................................. 147
6.3. Materials and Methods ............................................................... 149 6.3.1. Study site and sample collection ............................................ 149 6.3.2. Laboratory procedures ........................................................... 150 6.3.3. Microsatellite loci statistics ..................................................... 151 6.3.4. Mitochondrial DNA diversity and haplotype network .............. 152 6.3.5. Kinship and population structure ............................................ 153 6.3.6. Testing for recent genetic bottleneck ..................................... 154
6.4. Results........................................................................................ 154 6.4.1. Data collection........................................................................ 154 6.4.2. Photo-identification................................................................. 154 6.4.3. Microsatellite diversity and sex identification.......................... 155 6.4.4. Mitochondrial DNA diversity ................................................... 157 6.4.5. Kinship and population structure ............................................ 159 6.4.6. Bottleneck tests ...................................................................... 161
6.5. Discussion .................................................................................. 161 6.5.1. Rough-toothed dolphins in the Society Archipelago............... 161 6.5.2. Fine-scale population structure .............................................. 162
xii
6.5.3. Sex-biased dispersal .............................................................. 163 6.5.4. A spinner dolphin community structure with a pilot whales social organisation? ............................................................................ 164 6.5.5. Conclusions............................................................................ 165
7. General Discussion and Future Work ............................................... 167
7.1. Overview..................................................................................... 167
7.2. Metapopulation of spinner dolphins............................................ 171
7.3. Pilot whales evolutionary history ................................................ 173
7.4. Social systems and matrilineality ............................................... 175
8. Appendices .......................................................................................... 178
Appendix 1............................................................................................. 179
Appendix 2:............................................................................................ 180
Appendix 3............................................................................................. 181
Appendix 4............................................................................................. 183
Appendix 5............................................................................................. 184
Electronic Appendices........................................................................... 187 Appendix 6 .......................................................................................... 187 Appendix 7 .......................................................................................... 187 Appendix 8 .......................................................................................... 187 Appendix 9 .......................................................................................... 188 Appendix 10 ........................................................................................ 188
9. References ........................................................................................... 189

xiii
List of Tables
CHAPTER 1 Table 1.1. Social system and life history attributes of dolphins under investigation in this thesis. ...... 24
CHAPTER 2 Table 2.1. Boat surveys conducted from 2002 to 2004 in French Polynesia. ..................................... 34
Table 2.2. Microsatellite diversity for spinner dolphins from French Polynesia................................... 37
Table 2.3. Sex identification and genetic diversity statistics for spinner dolphins. .............................. 42
Table 2.4. Analysis of genetic differentiation among island communities........................................... 48
Table 2.5. Differences in sex-specific FST values and variance of corrected assignment index.......... 49
Table 2.6. Summary statistics of various tests to detect a recent bottleneck effect. ........................... 50
CHAPTER 3 Table 3.1. Sample data for all pilot whale specimens used in this study. ........................................... 63
Table 3.2. Variable nucleotide positions within the mtDNA control region of Globicephala sp.. ......... 73
Table 3.3. Genetic diversity statistics and neutrality tests in long-finned pilot whales. ....................... 76
Table 3.4. Analysis of genetic differentiation in long-finned pilot whales. ........................................... 78
Table 3.5. Genetic diversity statistics and neutrality test in short-finned pilot whales. ........................ 80
Table 3.6. Analysis of genetic differentiation in short-finned pilot whales........................................... 81
CHAPTER 4 Table 4.1. Summary of seven mass strandings from around New Zealand. .................................... 103
Table 4.2. Summary statistics of the 14 microsatellite loci in long-finned pilot whales. .................... 103
Table 4.3. Statistical behaviour of four relatedness estimators. ....................................................... 114
Table 4.4. Results of parentage analyses within three mass strandings. ......................................... 115
Table 4.5. Results of parentage analyses between three mass strandings...................................... 116
CHAPTER 5 Table 5.1. Microsatellite diversity of long-finned pilot whales from Stewart Island. .......................... 130
Table 5.2. Results of the parentage analyses in the mass stranding at Stewart Island 2003. .......... 138
CHAPTER 6 Table 6.1. Microsatellite diversity of rough-toothed dolphins from the Society Archipelago. ............ 151
Table 6.2. Samples of rough-toothed dolphins collected outside French Polynesia......................... 152
Table 6.3. List of samples identified as genetic re-sampling. ........................................................... 156
Table 6.4. Sex identification and genetic diversity in rough-toothed dolphins................................... 157
xiv
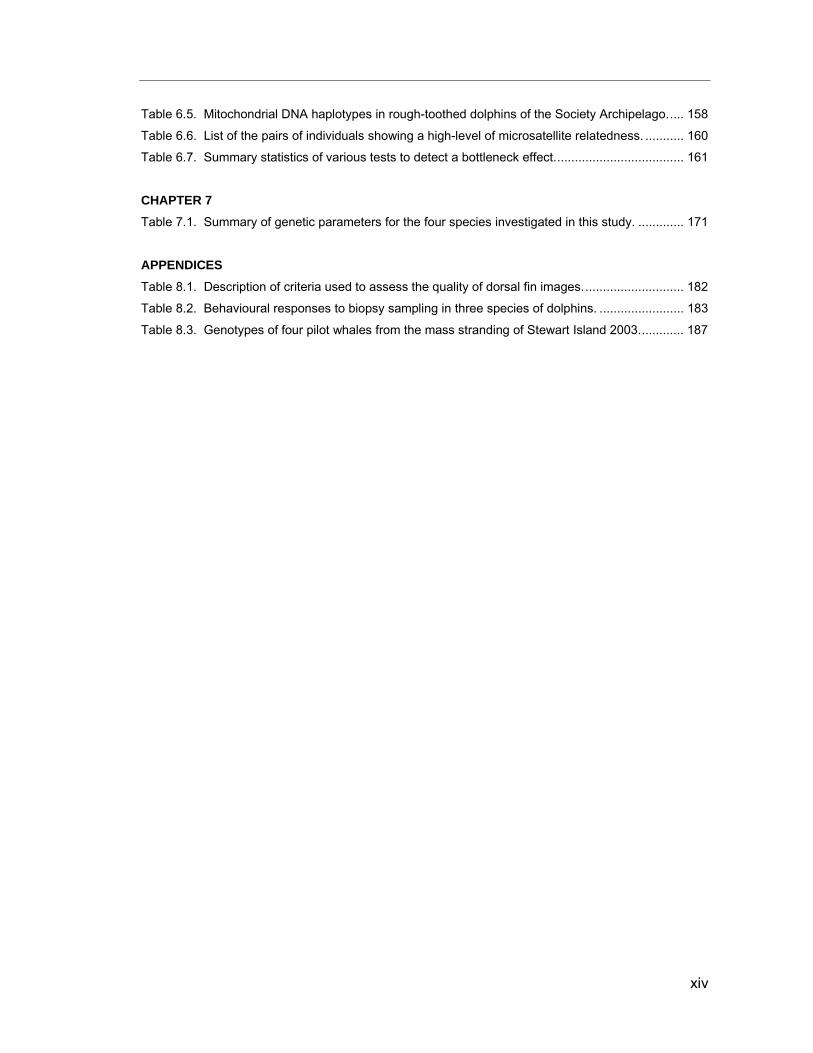
Table 6.5. Mitochondrial DNA haplotypes in rough-toothed dolphins of the Society Archipelago..... 158
Table 6.6. List of the pairs of individuals showing a high-level of microsatellite relatedness. ........... 160
Table 6.7. Summary statistics of various tests to detect a bottleneck effect..................................... 161
CHAPTER 7 Table 7.1. Summary of genetic parameters for the four species investigated in this study. ............. 171
APPENDICES Table 8.1. Description of criteria used to assess the quality of dorsal fin images............................. 182
Table 8.2. Behavioural responses to biopsy sampling in three species of dolphins. ........................ 183
Table 8.3. Genotypes of four pilot whales from the mass stranding of Stewart Island 2003............. 187
xv
List of Figures
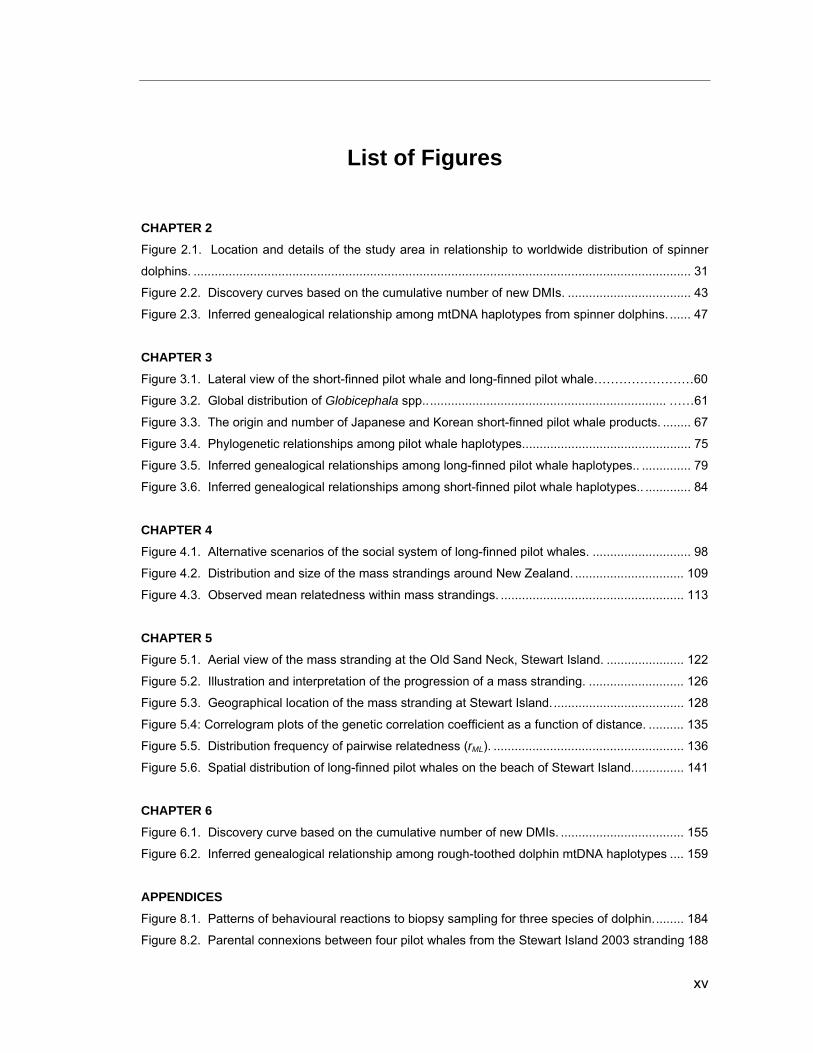
CHAPTER 2 Figure 2.1. Location and details of the study area in relationship to worldwide distribution of spinner
dolphins. ............................................................................................................................................. 31
Figure 2.2. Discovery curves based on the cumulative number of new DMIs. ................................... 43
Figure 2.3. Inferred genealogical relationship among mtDNA haplotypes from spinner dolphins. ...... 47
CHAPTER 3 Figure 3.1. Lateral view of the short-finned pilot whale and long-finned pilot whale……………………60
Figure 3.2. Global distribution of Globicephala spp..................................................................... ……61
Figure 3.3. The origin and number of Japanese and Korean short-finned pilot whale products. ........ 67
Figure 3.4. Phylogenetic relationships among pilot whale haplotypes................................................ 75
Figure 3.5. Inferred genealogical relationships among long-finned pilot whale haplotypes.. .............. 79
Figure 3.6. Inferred genealogical relationships among short-finned pilot whale haplotypes.. ............. 84
CHAPTER 4 Figure 4.1. Alternative scenarios of the social system of long-finned pilot whales. ............................ 98
Figure 4.2. Distribution and size of the mass strandings around New Zealand. ............................... 109
Figure 4.3. Observed mean relatedness within mass strandings. .................................................... 113
CHAPTER 5 Figure 5.1. Aerial view of the mass stranding at the Old Sand Neck, Stewart Island. ...................... 122
Figure 5.2. Illustration and interpretation of the progression of a mass stranding. ........................... 126
Figure 5.3. Geographical location of the mass stranding at Stewart Island...................................... 128
Figure 5.4: Correlogram plots of the genetic correlation coefficient as a function of distance. .......... 135
Figure 5.5. Distribution frequency of pairwise relatedness (rML). ...................................................... 136
Figure 5.6. Spatial distribution of long-finned pilot whales on the beach of Stewart Island............... 141
CHAPTER 6 Figure 6.1. Discovery curve based on the cumulative number of new DMIs. ................................... 155
Figure 6.2. Inferred genealogical relationship among rough-toothed dolphin mtDNA haplotypes .... 159
APPENDICES Figure 8.1. Patterns of behavioural reactions to biopsy sampling for three species of dolphin......... 184
Figure 8.2. Parental connexions between four pilot whales from the Stewart Island 2003 stranding 188

Chapter One: General Introduction
1
1. General Introduction
1.1. Overview
Pryor & Norris (1991) noted several misconceptions concerning dolphin research.
These misconceptions, some of which have persisted to the present day, include the
assumption that wild dolphins are so inaccessible that it is “not worthwhile” to study
them, and the assumption that the social behaviour and organisation of all dolphin
species is similar to Tursiops. However, the development of novel methods, such as
photo-identification, telemetry, biopsy sampling and molecular markers, and the
recent improvements in data analyses provide an opportunity to dismiss these
misconceptions.
It is true that a large proportion of dolphin studies have concerned bottlenose
dolphins (Genera Tursiops, composed of two species, T. truncatus and T. aduncus).
Around the world, bottlenose dolphins form small resident coastal populations
(Connor et al. 2000b), generally living in small groups, thus making them easier to
study than most other dolphin species. Tursiops is one of only two genera of
cetaceans in which some populations have been the subject of studies long enough
to gather information over more than one generation (see review by Mann et al.
2000). Only one other species of dolphin has benefited from a similar kind of
attention; the killer whale (Orcinus orca) from eastern North Pacific (e.g., Bigg et al.
1990, Baird 2000). Other long term studies on other dolphin species have been or
are currently being undertaken (e.g., Norris et al. 1994), but none have reached the
level of detail obtained on populations of bottlenose dolphins and killer whales.
Considering that more than 30 species of dolphins are currently recognised
worldwide (Rice 1998), it is evident that our knowledge on the ecology and status of
this taxonomic family remains very limited.
In this thesis, I used genetic and observational data to investigate the population
structure and social system of four species of dolphins which have not benefited from
Chapter One: General Introduction
2
the high level of attention directed to Tursiops and Orcinus. These are: the spinner
dolphin (Stenella longirostris); the long-finned pilot whale (Globicephala melas); the
short-finned pilot whale (Globicephala macrorhynchus); and the rough-toothed
dolphin (Steno bredanensis). My project was part of a larger research program led by
Prof. C.S. Baker, primarily using molecular markers to investigate the communities of
several species of dolphins with contrasting social systems and habitat use.
Therefore, I investigated several subjects that helped to address some of the specific
objectives of this larger research program. These were:
- Objective 1: Investigate comparative genetic structure of dolphin societies with
different life history attributes and habitat specialisation.
- Objective 2: Investigate genetic structure of dolphin societies in relation to
predictions concerning the genetic consequences of social systems on the structure
of local communities.
- Objective 3: Investigate whether dolphin groups and communities are structured
strictly along a single maternal lineage, or whether the social groups include multiple
maternal lineages.
- Objective 4: Investigate whether mating is directed outside of matrilineal groups
through permanent emigration of males, as characteristic of most mammals, or
whether mating occurs by temporary social fusion or interchange.
- Objective 5: Investigate whether some dolphins have adapted to inbreeding as a
strategy for maintaining social cohesion or because of geographic isolation.
In this chapter, I review some of the current knowledge of dolphin ecology and
evolutionary history. I also provide an outline for the rest of the manuscript as well as
information on my collaborators.
1.2. Brief review on the systematics of dolphins
In this thesis, the terms “dolphin” and “delphinid”, refer to all species of the family
Delphinidae, as described in Rice (1998). The family Delphinidae belongs to the
super-family Delphinoidea (along with the Monodontidae and the Phocoenidae), sub-
order Odontoceti, and order Cetacea.

Chapter One: General Introduction
3
Delphinids likely arose in the mid- to late Miocene (10-11 mya) from kentriodontid-like
ancestors (Barnes 1985). They are relatively uncommon in the fossil record of the
latest Miocene and Pliocene deposits, suggesting that the present diversity of
delphinids is the result of an explosive species radiation occurring in the later part of
the Pliocene (Barnes 2002). Delphinids represent the most diverse family of marine
mammals with 37 currently recognised (and generally accepted) species, including
the recently described Orcaella heinsohni (Beasley et al. 2005). It is very likely,
however, that this number will continue to increase as new species are still being
described, for example, the recognition of Sotalia as two distinct species: S. fluviatilis
and S. guianensis (Cunha et al. 2005, Caballero et al. 2007).
Dolphins show wide variation in their external morphology, including the length of the
beak, colour pattern and size (ranging from 1.5 m in some Cephalorhynchus spp. and
Stenella longirostris to 9.8 m in Orcinus orca). Several species of cosmopolitan,
largely pelagic dolphins also exhibit a large degree of morphological variation
throughout their geographic distribution (e.g., spinner dolphins, Perrin 1990). Overall,
dolphins are widespread in the world’s oceans, with the killer whales being the most
widely distributed. The highest species-level diversity is found in tropical and warm
temperate latitudes with many species showing a pantropical distribution (e.g.,
Stenella spp.). In contrast, several species are distributed anti-tropically, including
notably, the six species of Lagenorhynchus (Cipriano 1997).
1.2.1. Mechanisms of speciation in dolphins
The rapid radiation of delphinids is not fully understood, but several mechanisms of
speciation have been proposed. Allopatric speciation events might have occurred
following large geographical changes and the appearance of new barriers to gene
flow. Davies (1963) suggested that the African continent could have played a
significant role in cetacean evolution, acting as a geographical barrier to dispersal of
tropical cetacean species during the Pleistocene glaciations. This hypothesis was
later revisited by Perrin et al. (1978) and Rosel et al. (1994) to explain the current
distribution of Stenella and Delphinus spp.
Chapter One: General Introduction
4
Other physical barriers, such as water temperature, are not as apparent as land
masses but are also likely to have had a large influence on the biogeographical
distribution of many dolphin species. The variation of sea temperature in the tropical
zone during the Pleistocene glacial/interglacial cycles is suspected to have resulted
in the anti-tropical distribution of some closely related species (e.g., the right whale
dolphins, Lissodelphis spp.), through the movement across the equator of individuals
usually restricted to temperate and cold waters, resulting in subsequent geographic
isolation (Davis 1963). Whether speciation occurred as a consequence of founder
events by a few individuals or through vicariant isolation of large populations remains
a source of debate (Davis 1963, Cipriano 1997, Hare et al. 2002). In the case of
Lagenorhynchus spp., recent genetic evidence seems to support vicariant isolation
(Hare et al. 2002). Using mtDNA variation, Pichler et al. (2001) describe the radiation
process of the four species of Cephalorhynchus, showing that they likely originated in
the waters of South Africa, before colonising New Zealand and then South America,
following the West Wind Drift. Their results suggest that even coastal, depth-limited
odontocetes are occasionally prone to long-distance movements, perhaps following
periods of climatic change, ultimately resulting in speciation events.
Contrary to these examples which represent cases of allopatric or peripatric
speciation, it has also been suggested that some species of cetaceans could have
differentiated in sympatry (Hoelzel 1998). Dolphins have not only radiated
dramatically in terms of the number of species, but also in terms of ecological
characteristics, including a wide range of habitats, social systems and feeding
behaviours. Segregation on the basis of these ecological differences could have
acted as a barrier to gene flow. For instance, in the eastern North Pacific, two distinct
“forms” of killer whales exist sympatrically, one specialised in preying on mammals
and the other preying on fish. It is suspected that the two forms are in the process of
speciation (Baird & Dill 1995, Barrett-Lennard 2000).
1.2.2. Phylogeny and sources of paraphyly
Due to high morphological variability and the recent radiation of this group resulting in
incomplete lineage sorting of genes, much uncertainty exists in the evolutionary
relationships among delphinid species (Reeves et al. 2004). Although genetic

Chapter One: General Introduction
5
information may help reveal and clarify important features of cetacean taxonomy
(e.g., Milinkovitch 1997), it also has some inherent limitations as a tool for
systematics. The alleles of sister species reach monophyly after all ancestral
polymorphism is lost through genetic drift or directional selection. Although drift is
expected to be much quicker for mitochondrial genes than nuclear genes (as a
consequence of a smaller effective population size for the former), incomplete
lineage sorting can still affect mitochondrial gene trees, especially in the case of
rapidly radiating taxa in which successive speciation events occur before sorting is
completed (Funk & Omland 2003). Such an effect is suspected to obscure the
phylogeny of delphinids, in particular within the group commonly referred to as STDL,
which encompass the species of Stenella, Sousa, Tursiops, Delphinus and
Lagenodelphis (Reeves et al. 2004). As a result, several molecular markers,
including mitochondrial and nuclear markers, are now commonly combined to resolve
phylogenetic relationships among cetacean species (e.g., Harlin-Cognato &
Honeycutt 2006, Caballero et al. 2007).
Other sources of uncertainty may exist. Natoli et al. (2006) recently suggested that
the populations of long-beaked common dolphin (Delphinus capensis) in the Pacific
and South Africa could have each radiated independently from their sister-species,
the short-beaked common dolphin (Delphinus delphis). This would represent a case
of morphological convergence, rather than being the sole consequence of incomplete
lineage sorting. Similarly, it is believed that the morphotypic similarities between the
Asian and South African populations of Tursiops aduncus are a result of
convergence, the two being highly genetically differentiated (Natoli et al. 2004).
Ultimately, in order to resolve the taxonomic status of dolphin species it has been
recommended that congeneric analyses be conducted, including, for each of the
series of putative taxa, a large number of specimens from across its range (Funk &
Omland 2003, Reeves et al. 2004).
1.2.3. Convergence with terrestrial mammals
Perhaps the most striking and interesting characteristic of cetacean evolution (and of
odontocetes in particular), is the several lines of convergence found with terrestrial

Chapter One: General Introduction
6
mammals (Best 1979, Würsig 1989, Weilgart et al. 1996). For example, comparisons
between dolphins and apes shows convergence towards large brain size*, long life-
span, slow rate of reproduction, complex social organisation and cultural
transmission (Connor et al. 2000a, Marino 2002, Krützen et al. 2005, Connor 2007).
Yet, cetaceans and terrestrial mammals evolved entirely isolated from each other
since early in the Cenozoic radiation of mammals (archaecete cetaceans were
established at sea by early Eocene time, about 50 mya (Barnes et al. 1985)).
The evolution of cetaceans and terrestrial mammals occurred in radically different
physical and ecological environments, leading to numerous anatomical and
physiological adaptations in the former (Würsig 1989). These differences include a
lower cost of locomotion and a lack of refuge from predators in the ocean (Connor et
al. 1998). The availability of resources is also likely to differ with richer but less
predictable concentrations of prey in the marine environment (Connor et al. 1998). It
implies, a priori, different ecological pressures and thus different systems which
maximise fitness by best balancing the competing demands an organism faces with
respect to reproduction and survival. Yet, contrary to the expectation that different
environmental pressures should have resulted on different ecologies, the comparison
of social organisation between odontocetes and terrestrial mammals shows
numerous examples of convergence. The most striking example is found in the social
structure of the sperm whale and the African savannah elephant; in both species
mature females and their young form stable groups, while bachelor males herd
together and wide-ranging lone bulls rove, searching for mating opportunities
(Weilgart et al. 1996). Many examples are also found among dolphins. The structure
of some bottlenose dolphin communities appears to be very similar to the “fission-
fusion” structure of chimpanzee societies (Tayler & Saayman 1972, Würsig 1978),
notably regarding the alliances formed between males to coerce females (Connor et
al. 1992). These alliances have also been described in lions (Packer et al. 1991). In
killer whales and bonobos, mothers and sons seem to form very strong associations
*It seems that odontocete brain size has co-evolved with extended life history periods (similarly to
primates and birds) and that lengthened adult period could have been an important component of
their encephalisation (Lefebvre et al. 2006). Although primates and cetaceans have evolved very
different ways of increasing their brain mass (Marino 2002), it is thought that large brain size is
directly related to the development of social bonds and the formation of co-operative relationships
(e.g., Barton 1996, Connor 2007, but see Healy & Rowe 2007).
Chapter One: General Introduction
7
(Connor et al. 2000a). Despite these similarities, long-term studies revealed that the
fish-eating “resident” killer whales along the western coast of North America present
a particularly interesting system of social structure that has not been yet described in
any terrestrial mammal. Indeed, within these killer whale communities, neither males
nor females disperse from their natal group (while bonobo and chimpanzee females
do disperse). This pattern could be extended to other species of delphinids such as
the long-finned pilot whales (as suggested from molecular studies, Amos et al. 1993).
Although these comparisons appear as a promising framework to study the forces
behind the evolution of mammalian societies, it is obvious that such investigation is
still limited by the lack of knowledge on cetaceans in comparison to that available on
terrestrial mammals. Futhermore, the examples above illustrate the fact that it is not
simple to determine the evolutionary drivers behind the social patterns observed at
sea and on land.
1.3. Investigation of population structure
1.3.1. A challenging task in delphinid species
Populations constitute interbreeding units with more or less autonomous dynamics
and recruitment (but note that there are many different definitions of 'populations',
(Waples & Gaggiotti 2006)). Whilst the boundaries of some populations are rather
obvious, others are not. Yet, a crucial pre-requisite for management and effective
conservation of any population is a clear understanding of its structure within
demographic and evolutionary time scales (Lande & Barrowclough 1987, Taylor &
Dizon 1999). Note that in dolphin studies, and in analogy to primate studies, the
terms “community” or “society” (Struhsaker 1969) have often been employed as a
complement to, or instead of, the term “population” (e.g., Bigg 1982, Wells 1986).
Here, I will employ the definition proposed by Wells (1986, p19) for a dolphin
community: i.e., “an assemblage of dolphins that inhabited similar ranges and that
interacted socially more with each other than with adjacent assemblages”.
Investigating dolphin populations or communities poses a particular challenge
because of the lack of obvious geographical boundaries and because of the mobility
of individuals. It is hard to determine the population subdivisions of species that have

Chapter One: General Introduction
8
a vast geographic distribution and that migrate widely in relation to seasonal or
environmental changes (Hayano et al. 2003). Furthermore, well-known physical
oceanographic barriers to gene flow (e.g., currents, physio-chemical water
properties) that affect many marine species do not necessarily affect the movements
of highly mobile cetaceans.
Contrary to the expectation of large panmictic populations as a result of a few
geographical and physical barriers, many dolphins show a relatively extensive
structure among populations (Hoelzel et al. 2002a). Hoelzel et al. (1994, 1998)
highlighted that geographical barriers, or the apparent lack of them, are not
necessarily good indicators of population genetic structure in cetaceans. Whilst some
differentiation may be expected on the basis of allopatry and isolation by distance, or
restricted gene flow due to physical boundaries, many other examples cannot be
easily explained in this way. In the western North Atlantic, investigation of the genetic
population structure of the Atlantic spotted dolphin (Stenella frontalis) showed
significant genetic differentiation even though this species is continuously distributed
in this area (Adams & Rosel 2006). Following this, the authors suggested that in
other areas where Stenella frontalis is continuously distributed (e.g., in the eastern
Atlantic), the population might not be panmictic either. Consequently, this lack of
information could have a detrimental effect on the long-term viability and
maintenance of genetic diversity in this species in regions where incidental human-
induced mortality occurs (Adams & Rosel 2006). Another example is provided by
Pichler et al. (1998) who found a high level of population differentiation across the
range of Hector’s dolphins (Cephalorhynchus hectori) in New Zealand although no
obvious geographic boundaries separate these regional populations. Behavioural
observations and the movement of naturally marked individuals also suggest that
isolation among local populations is the result of ecological preferences and strong
philopatry (Dawson & Slooten 1993). The low rate of female dispersal in Hector’s
dolphins, as evidenced by mtDNA structure, indicates a vulnerability to local
extinctions and a poor ability to recover via recruitment of non-indigenous females
(Pichler et al. 1998, Pichler & Baker 2000).

Chapter One: General Introduction
9
Many of the observed patterns are likely due to a complex interaction between
historical changes in marine environments (e.g., the impact of ice ages), resource
requirements and specialisations, and aspects of life history and demographics
(Hoelzel et al. 2002a). In this context, the use of molecular markers has played an
increasingly important role in the study of cetacean population structure and thus, in
the management and conservation of these species (e.g., Rosel et al. 1994, Baker &
Palumbi 1995, García-Martínez et al. 1999). Genetic data contain information on the
present and past structure of the populations that can not be obtained by any other
method (Avise 2004). As such, most examples of dolphin population structure
mentioned in this thesis have been revealed by molecular studies. Note, however,
that it is not the only tool, as photo-identification or telemetry data can provide
valuable and complementary information on the patterns of individuals’ movements
(Whitehead 2001).
1.3.2. Factors driving dolphin population structure
Different factors such as sea-surface temperature, behavioural specialisation,
isolation-by-distance, social system and historical processes are thought to shape the
structure of dolphin populations (Hoelzel et al. 2002a). This section presents a few
examples which illustrate these factors.
In the North Atlantic, the patterns of genetic differentiation in long-finned pilot whales
(Globicephala melas) suggest that population isolation occurs between areas that
differ in sea-surface temperature (Fullard et al. 2000). On the other hand, population
differentiation shows no correlation with geographical distance (Fullard et al. 2000).
Temperature also seems to be the primary factor determining the relative distribution
of two populations of short-finned pilot whales off the coast of Japan (Kasuya et al.
1988). However, these correlations might not illustrate a particular sensitivity of these
two species for sea-surface temperature, but instead may be the result of other
ecological factors such as prey behaviour (Sergeant 1962). Such a pattern has been
suggested for several other species of dolphins such as the dusky dolphin
(Lagenorhynchus obscurus) in Argentina (Würsig & Würsig 1980). In temperate
waters, water temperature could affect prey distribution and in turn affect the
distribution of dolphin species (Norris 1967, Kasuya et al. 1988). For pilot whales, it is

Chapter One: General Introduction
10
also possible that other mechanisms are involved in these segregations, such the
effects of strong maternal philopatry (Whitehead 1998, Fullard et al. 2000).
Hoelzel (1998) suggested that an important mechanism for the formation of intra-
specific genetic differentiation within a geographic region is resource and/or habitat
specialisation. The best documented example is found in the sympatric forms of fish-
eating “resident” and mammal-eating “transient” killer whales of the eastern North
Pacific (Bigg et al. 1990). Evidence suggests that they are genetically isolated from
one another at the mitochondrial and nuclear level (Stevens et al. 1989, Hoelzel &
Dover 1991, Hoelzel et al. 1998a, Barrett-Lennard 2000).
Another striking example of segregation likely to be the result of resource or habitat
specialisation is found in the parapatric populations of nearshore and offshore
Tursiops truncatus in the western North Atlantic and Gulf of Mexico. Here, genetic
comparisons suggest limited or no gene flow in the recent past between the two
forms (Duffield et al. 1983, Hoelzel et al. 1998b, Sellas et al. 2005). It is also known
that in the western North Atlantic, the nearshore form feeds primarily on coastal
fishes while the offshore form forages on deep-water squids (Mead & Potter 1995).
In the eastern North Atlantic and Mediterranean Sea, Natoli et al. (2005) identified
five genetic populations of bottlenose dolphins and observed that the boundaries
between these populations coincide with variations of different oceanographic
parameters. From this, they suggested that local populations are habitat dependent
in such a way that it defines patterns of movement (Natoli et al. 2005). Such patterns
in bottlenose dolphin populations are also supported by other ecological data with, for
example, a relationship between feeding behaviour and habitat type (Gannon &
Waples 2004, Hastie et al. 2004).
For the bottlenose dolphins in Shark Bay, Australia (referred here as Tursiops sp.,
since molecular and morphological data failed to differentiate between truncatus and
aduncus; M. Krützen pers. comm.), a significant correlation was found between
genetic differentiation (using nuclear and mtDNA markers) and distance between
localities (Krützen et al. 2004b). Isolation-by-distance appears to be a factor that can

Chapter One: General Introduction
11
shape local dolphin populations. This finding was supported by behavioural data that
suggested natal philopatry for Shark Bay dolphins (Connor et al. 1992, Smolker et al.
1992, Richards 1996). However, on a larger scale, no such relation of isolation-by-
distance was found between the populations of bottlenose dolphins from Moray Firth,
north Scotland, and the neighbouring populations (Parsons et al. 2002).
Krützen et al. (2004b) suggested that population structure in male bottlenose
dolphins in Shark Bay may also be related to the evolution of mating systems. Males
are known to form alliances which permit these allied males to more successfully
compete for access to females (Connor et al. 1992). Evolutionary theory predicts that
if the males cooperating in this manner are related to each other, then they may gain
inclusive fitness benefits (Hamilton 1964a, b). Long-range dispersal of males to other
areas would thus minimise the chance of allying with a related partner (it was shown
that long-lasting alliances are biased toward related males, Krützen et al. 2003).
Therefore, social system would be simultaneously impacting with geographical
distances on the structure of the population.
At Sarasota Bay, central west Florida, USA, genetic analyses and extensive
behavioural data also support the hypothesis that the genetic distinction of a small
community of bottlenose dolphins (in regards to similar neighbouring communities) is
due to their social system (Wells 1986, Duffield & Wells 1991, Sellas et al. 2005).
There is, however, some gene flow with adjacent communities, thought to be largely
but not exclusively driven by male movements, as illustrated by the sharing of mtDNA
haplotypes between communities (Duffield & Wells 2002).
Finally, historical processes might also shape the structure of contemporary dolphin
populations. In particular, the glacial/interglacial events of the Pleistocene epoch
(1,808,000 to 11,550 years BP) could have played an important role, considering the
recent radiation of dolphin species. Hayano et al. (2004) suggested that the lowering
of the sea level during the late Pleistocene resulted in the isolation of some Pacific
white-sided dolphins in the Sea of Japan from the rest of the North Pacific population.
This may explain the genetic differentiation currently observed between the

Chapter One: General Introduction
12
population in Japanese coastal waters and the offshore population of the North
Pacific.
1.4. Genetic diversity
Throughout their evolutionary history, each species has had to face variations in their
environment; for example, climatic changes. To survive these variations, genetic
diversity is thought to be the base material upon which adaptation and speciation
depend. Maintenance of populations’ genetic diversity is thus a major focus in
conservation biology (Frankham et al. 2002), especially considering that
environmental changes are now augmented by anthropogenic impacts (e.g., through
the effects of global warming, pollution and habitat destruction). In general, high
levels of genetic variability are seen as healthy, while low levels of variability are seen
as limiting a species’ ability to respond to various threats in both the long- and short-
term.
Measures of intra-specific genetic diversity (traditionally based on protein allozymes)
vary considerably across taxa, with a tendency for large mammals to show relatively
low levels compared to that of other taxa (Nei 1987, Avise 2004). Diversity may be
gained either through mutation or through gene flow from a neighbouring population,
while loss of diversity occurs either passively through genetic drift or actively through
natural selection. Based on these principles, various processes can potentially
reduce genetic diversity in a population. Among them, demographic bottleneck (i.e., a
dramatic reduction in abundance) is one of the most important, in particular from a
conservation point of view (Frankham et al. 2002).
Among dolphins, Pichler & Baker (2000) found unusually low levels of mitochondrial
diversity in contemporary populations of Hector’s dolphins in New Zealand. A
comparison with historical samples revealed a significant decline in diversity which is
most likely the result of abundance depletion due to dolphin mortality in gill-nets. A
bottleneck is also thought to have reduced the mitochondrial diversity in the
population of dusky dolphins along the coast of Peru (Cassens et al. 2005). The use
of several molecular markers suggests, however, that this bottleneck is rather
ancient, pre-dating the recent El Niño oscillations and human exploitation of this

Chapter One: General Introduction
13
population (Cassens et al. 2005). On a larger scale, Hoelzel et al. (2002b) suggested
a historical bottleneck as a potential cause for the low worldwide genetic diversity of
killer whales. Other processes might also be involved in shaping the genetic diversity
in this species (see below in this section).
Hayano et al. (2004) suggested that the low genetic diversity found in the population
of Pacific white-sided dolphins along the coast of Japan was a result of a population
reduction. This could have occurred when the individuals in the Sea of Japan
became isolated from the rest of the North Pacific population during a glacial period
in the Late Pleistocene. This could also be considered a founder event rather than a
demographic bottleneck, since it does not necessarily represent a real decrease in
abundance. Although they represent different demographic processes, bottleneck
and founder events can have the same effect on the level of genetic diversity in a
population. Cases of founder events have been suggested for several nearshore
populations of bottlenose dolphins (notably in the western North Atlantic and South
Africa) in order to explain the lower level of genetic diversity than that in the offshore
populations from which they could have originated (Hoelzel et al. 1998b, Natoli et al.
2004).
Social behaviour can also reduce genetic diversity within local populations, for
instance as a result of high philopatry. This could be the case for the population of
about 130 bottlenose dolphins at Moray Firth, Scotland, that show no evidence of
contemporary exchange with neighbour populations (Wilson et al. 1999). Indeed,
Parsons et al. (2002) found a very low level of mtDNA variability among these
dolphins, which, in such a small population, could be due to the relative importance
of genetic drift. A similar case of low mtDNA diversity is observed in Doubtful Sound,
New Zealand (de Tezanos Pinto et al., unpublished data), within a small and isolated
community of bottlenose dolphins living in a fiord.
Unusually low levels of mitochondrial diversity were also found in several species of
dolphins thought to live in matrilineal societies (Whitehead 1998). These include killer
whales, long-finned pilot whales and short-finned pilot whales (with sperm whales
following a similar pattern). To explain this trend, Whitehead (1998, 2005)

Chapter One: General Introduction
14
hypothesised a form of “cultural hitchhiking” where mtDNA diversity is reduced by
parallel selection on maternally transmitted cultural traits. However, several authors
argue against this theory (e.g., Mesnick et al. 1999) and alternative models based on
demographic processes were proposed to explain low mtDNA diversity in matrilineal
whales (e.g., Tiedemann & Milinkovitch 1999). At this stage, the debate continues,
illustrating the difficulty in interpreting patterns of genetic diversity in these species
(Alexander 2006).
1.5. Social system
Alexander (1974) argued that while there seems to be no universal benefit from
group-living, there are universal detriments, such as parasite transmission and
competition for resources. Yet, one of the most obvious characteristics of dolphin
ecology is their propensity to live in groups. In contrast to random aggregations (for
example, due to food concentration), dolphin groups are more usually seen as
mutualistic groups, i.e., based on the exchange of benefits among individuals
(hereafter, I will simply use the term ‘group’).
For many scientists, predation is believed to be the major factor promoting group
formation (Alexander 1974, van Schaik 1983). This hypothesis lends well to dolphins,
and especially smaller open-ocean species, considering the lack of refuges in the
oceans within which they could hide from their main predators, i.e., oceanic sharks
and killer whales (Norris & Schilt 1988). For a review of the different ways by which a
group can reduce the risks of predation, see Connor (2000). Similarly to other taxa,
additional factors can also favour group-living in dolphins; for instance, the defence of
resources (Wrangham 1980, 1982), the defence of females against other males
(Wrangham 1980), and the protection of females against male aggression. In addition
to these benefits of group living, it has been suggested that, contrary to terrestrial
mammals, the low cost of locomotion in the water might reduce food competition, and
thus reduce the cost of grouping and philopatry in cetaceans (Connor 2000).
As illustrated by their strong tendency to live in groups, all dolphin species are social
to some degree (LeDuc 2002). However, characteristic group sizes for the different
species range from small pods of just a few individuals to large schools numbering in
Chapter One: General Introduction
15
the thousands. Group sizes can also vary within population depending on the
behavioural state of the dolphins (e.g., Würsig & Würsig 1980). These variations
presumably represent adaptation to different environmental pressures, depending on
life history parameters of, and habitat use by, the species. In general, the social
structure of female mammals is thought to be more influenced by predation and prey
resources, while male social structure is more influenced by access to mates
(Wrangham & Rubenstein 1986).
In the delphinid family, other than the few populations that have been investigated in
detail, the sizes of stable social units and the social boundaries of the communities
are unknown. Furthermore, these populations that have been studied over long time
scales are those that form relatively stable and small social groups within a short
distance of the coast and whose movements do not regularly take them out of their
study areas. Therefore, one must be aware that the social patterns of these
populations may not reflect the organisation of offshore populations of the same
species (LeDuc 2002).
An accurate model of a social system is essential to improve understanding of the
ecological pressures affecting sociality (Myers 1983). Here, social system refers to
the combination of three distinct elements: social organisation, social structure and
mating system (Kappeler & van Schaik 2002). Social organisation describes the size,
sexual composition and spatio-temporal cohesion of a community. Social structure
refers to the pattern of social interactions and the resulting relationships among the
members of a community. Mating system describes social interactions related to
mating (social component) and the reproductive consequences of these interactions
(genetic component). The study of sociality in dolphins is still in its early stages
compared, for example, to research on primates (Smuts et al. 1987, Kappeler & van
Schaik 2002). However, despite limited information, previous studies have revealed a
high level of diversity and complexity in the social systems of dolphins. Interestingly,
diversity exists between species as well as within species. Many populations of
bottlenose dolphins around the world have been described as ‘fission-fusion’
societies (Connor et al. 2000b), where fission-fusion refers to social systems in which
individuals of a same population live in subgroups that frequently merge and

Chapter One: General Introduction
16
dissociate again with similar or different memberships. However, long-term studies of
populations in different regions have shown that association patterns can show
substantial variability for both males and females (Connor et al. 2000b).
In Shark Bay, Australia, bottlenose dolphin males (Tursiops sp.) show a complex
pattern of alliances. There are stable ‘first-order’ pairs and trios that herd individual
females; ‘second-order’ teams of two first-order alliances that join forces against
rivals in contests for females; and ‘super-alliances’ where males form highly labile
pairs or trios that herd females, contrasting with the stable alliances (Connor et al.
1992, Connor et al. 1999). In Sarasota Bay, Florida, male bottlenose dolphins are
also found to form stable pairs (95% of their time spent together, Wells et al. 1987).
These pairs tend to form at sexual maturity between males of similar age, and seem
to be maintained through life, until one member dies (Wells et al. 1987). In contrast to
Shark Bay, however, the level of aggression between males and receptive females in
Sarasota is minimal. It was suggested that, in Sarasota, female choice could play an
important role in determining mating opportunities (Connor et al. 2000a). A different
pattern is found in the Moray Firth, Scotland, where male bottlenose dolphins do not
show the high association coefficients with other males that are typically observed in
other populations (Wilson 1995). This could be related to the wide coastal range for
bottlenose dolphins of this population, in comparison to smaller ranges of resident
dolphins of Shark Bay or Sarasota which stay in a limited area over several years.
However, in the Bay of Islands, New Zealand, where bottlenose dolphins are also
found to range widely along the coast (Constantine 2002), Mourão (2006) described
a similar pattern to Shark Bay and Sarasota bottlenose populations, with several
close and long-lasting associations within and between sexes. Finally, in Fiordland,
New Zealand, Lusseau et al. (2003) observed that, contrary to most populations of
the T. truncatus, bottlenose dolphins (both males and females) form a temporally
stable community, where constant companionship is prevalent. This is a much higher
degree of social stability than in other studied populations of bottlenose dolphins, with
strong association occurring within and between sexes. They hypothesised that
ecological constraints are an important factor shaping social interactions within the
community.

Chapter One: General Introduction
17
Similarly, two populations of spinner dolphins from distant islands in the Hawaiian
Archipelago (the Big Island and Midway Atoll) have been found to have different
social organisations (Norris et al. 1994, Karczmarski et al. 2005). In the remote atoll
of Midway, spinner dolphins seem to live in a smaller and more stable society, with
no obvious fission-fusion fusion. This is unlike the large groups and fission-fusion
observed in spinner dolphins at the Big Island (Karczmarski et al. 2005). The authors
suggest that these disparate characteristics were triggered by different environmental
pressures.
A common pattern in terrestrial mammals is a male-biased dispersal with female
philopatry (Greenwood 1980). Such a pattern also seems to occur in some dolphin
populations, as shown by molecular studies on bottlenose (Möller & Beheregaray
2004) and dusky dolphins (Cassens et al. 2005), and also by long-term demographic
studies (e.g., Wells 1986). However, female philopatry and male dispersal is not
always the rule in dolphins. Long-term studies on killer whales and molecular studies
on long-finned pilot whales have suggested that in some populations of these two
species, individuals live in matrilineal groups with no dispersal by either sex (Bigg et
al. 1990, Amos et al. 1993). Such an extreme scenario of philopatry has not yet been
described in any terrestrial mammals (Connor 2000). Note that killer whales offer
another example of intra-species diversity of social structure. In the eastern North
Pacific, communities of fish-eating “resident” killer whales (where no dispersal of
either sex occurs) are more stable than the communities of mammal-eating
“transient” killer whales, where individuals of both sexes might disperse from their
natal group (Baird & Whitehead 2000). The authors suggest that these dissimilar
social structures could be related to differences in foraging ecology.
Among the factors influencing group composition in social mammals, kinship is
thought to play a major role. While an individual can enhance its fitness directly by
maximising its own reproduction (Williams 1966), it can also do so indirectly by
maximising the reproduction of its relatives (Hamilton 1964a, b). Following the latter,
kin selection theory predicts that individuals should preferentially associate and
cooperate with kin whenever the inclusive benefits outweigh the costs (Hamilton
1964a, b). In the population of Tursiops sp. from Shark Bay, Krützen et al. (2003)

Chapter One: General Introduction
18
show that males in first- and second-order alliances are more related than expected
by chance, suggesting that they could gain inclusive fitness benefits from alliance
membership. On the other hand, they found no significant relationship between
members of super-alliances. Therefore, it seems that different models of the
evolution of social behaviour can favour association between males of this
population, similar to that in lions (Packer et al. 1991). In Tursiops truncatus males,
which form long-term alliances in the Bahamas, Parsons et al. (2003) found highly
significant correlations between patterns of association and both mitochondrial DNA
haplotype identity and microsatellite relatedness, as expected under the kin selection
theory. Contrary to the last two examples, however, no correlation was found
between associations/alliance membership and maternal kinship or genetic
relatedness in male Tursiops aduncus of Port Stephens, Australia (Möller et al.
2001). In that resident population, the majority of male pairs within alliances were
randomly related, although high relatedness values were found between males of
different alliances. Therefore, mechanisms other than kin selection seem to favour
cooperation between males in this case. However, Möller et al. (2006) showed that
among female Tursiops aduncus of the same population, association correlates with
kinship, although kinship relations are not necessarily a prerequisite for membership
in social clusters. Möller et al. (2006) hypothesised that different evolutionary forces
acting on female bottlenose dolphin sociality might promote the formation of
associations.
Note that correlation between behavioural association and kinship must be
interpreted with caution. Griffin & West (2002) argued that such a relationship is not,
in itself, sufficient evidence that kin selection is operating. Rather, a direct evaluation
of the relative reproductive success is necessary (e.g., Griffin et al. 2003). The study
by Krützen et al. (2004a) was a first attempt to do so in a population of dolphins,
revealing notably, that being a member of a bottlenose dolphin alliance is not a
prerequisite for paternity. Further similar studies are needed to allow a more
productive comparison of dolphin social organisation to that of terrestrial mammals.
Chapter One: General Introduction
19
1.6. Principal methodological tools used in this study
1.6.1. Photo-identification
Individual identification has a long history in the study of animal ecology; for example,
the use of coloured bands to follow the movement of birds (Lockley & Russell 1953).
In cetaceans, the first method utilised to identify individual animals was based on
“discovery marks” that were shot by the whalers into the blubber of whales and
recovered later when the animals were killed and flensed (Brown 1978). In the 1970s,
biologists started to use natural marks to recognise individuals, notably using
photographs of scars on and the shape of dolphins’ dorsal fins (e.g., Würsig & Würsig
1977).
Since then, identification of individual whales and dolphins by using photographs of
natural markings (e.g., trailing edge and pigmentation of humpback whales’ flukes, or
head callosities of right whales) has been a key component to all long-term and
reasonably detailed studies of cetacean social organisation (e.g., Bigg et al. 1990).
This technique has now been applied to more than 30 species of cetaceans (Mann
2000). Photo-identification can provide a wide range of information, including
movements and association patterns, population size and dynamics (e.g., Wells
1986, Smolker & Richards 1992, Rossbach & Herzing 1998, Wilson et al. 1999, Parra
et al. 2006). In long-term studies, it can also provide information on basic life history
parameters (Würsig & Jefferson 1990, Wells 2003) and in combination with other
information such as group composition, it has the potential to provide a model of
social systems (Whitehead 1997). See Whitehead et al. (2000) for a review on photo-
identification techniques.
For this thesis, photo-identification techniques was used on spinner dolphins
(Chapter 2) and rough-toothed dolphins (Chapter 6) to investigate various aspects of
their social organisation, including community size, pattern of residency and rate of
inter-change.

Chapter One: General Introduction
20
1.6.2. Biopsy sampling
For many research questions, observational methods alone are not sufficient. For
example, by using photo-identification it is possible to obtain some knowledge of
population structure, although this method provides information over only a short time
scale (one generation or a few at best). Using molecular tools, however, one can
easily study the structure and dynamics of a population on an evolutionary time scale
(over several generations), providing critical information for conservation issues.
Collecting the tissue samples necessary to conduct genetic analyses is not trivial.
Among the sources of samples exploited by scientists for cetacean studies are
strandings (e.g., Pichler et al. 1998), incidental by-catch (e.g., Dizon et al. 1991) and
direct hunting (e.g., Amos et al. 1993). Although these sources have proven to be
extremely valuable in many instances, they also have major drawbacks. These
sources can be unreliable or inconsistent (for example, some species rarely strand or
are not involved by-catch) or may be considered unethical (in particular those
samples obtained from direct hunting). More importantly, they might offer a poor
dataset for addressing specific issues such as demographics. Because of these
limitations, biopsy sampling from wild, free-ranging cetaceans has been increasingly
used, originally on large baleen whales (Lambertsen 1987). Biopsies are most often
collected by using crossbows and modified rifles firing darts that collect small plugs of
skin which provide enough material for genetic analyses (e.g., Barrett-Lennard et al.
1996, Weller et al. 1997, but see Bilgmann et al. 2007). Recently developed biopsy
systems use rifles with adjustable firing pressure and smaller dart cutting heads
(Krützen et al. 2002). These systems are more appropriate for sampling small
cetaceans, and it is now possible to biopsy dolphins with minimal impact. These
systems have been shown typically to elicit only short-term behavioural responses by
sampled animals, and no physiological complications have been reported during
wound healing (Weller et al. 1997, Krützen et al. 2002).
Other techniques of tissue collection on free-ranging cetaceans have also been
developed that are even less invasive than biopsy sampling. These include skin
swabbing (Harlin et al. 1999), faecal sampling (Parsons et al. 1999) and sloughed-

Chapter One: General Introduction
21
skin sampling (Whitehead et al. 1990). However, these techniques also present some
important disadvantages, such as a lower quality and quantity of tissue, which can
greatly limit the genetic analyses (especially when using nuclear markers such
microsatellite loci). Note also that, in terms of behaviour, a technique such as skin
swabbing does not necessarily provoke less reaction by the sampled dolphin than
does biopsy sampling (Harlin et al. 1999, Krützen et al. 2002). Therefore, depending
on the research question asked and conservation status of the species, the
advantages and drawbacks of the different methods should be considered so as to
choose the most appropriate sampling technique (Bilgmann et al. 2007).
Here, the Paxarms biopsy system©, described by Krützen et al. (2002), was used to
collect skin samples of spinner dolphins (Chapter 2), short-finned pilot whales
(Chapter 3) and rough-toothed dolphins (Chapter 4). This system is based on a small
stainless-steel biopsy dart fired from a modified veterinary capture rifle equipped with
a variable pressure valve (Krützen et al. 2002). The primary advantages of this
system for this study were: (1) it provides the capability to rapidly adjust the rifle
pressure in relation to the distance between the targeted dolphin and the boat
(between two and ten metres) and with regards to the skin of the targeted species (at
a similar distance from the boat, biopsy attempts on short-finned pilot whales
required a higher pressure cartridges than on spinner dolphins for the dart to properly
rebound off the animal and not remain attached); and (2) it obtains high quality tissue
samples which allow the screening of microsatellite loci. Note that in the first stages
of this study, skin swabbing with a pole was attempted, but this method was
inefficient: spinner dolphins at Moorea rarely broke the surface while bow-riding the
boat if the swabbing pole was hanging over their heads; in addition, samples
collected with this technique on short-finned pilot whales provided poor quality DNA
(data not shown).
Most tissue samples used in Chapter 3, 4 and 5 were obtained from alternative
sources; primarily strandings (see details in each chapter’s methods).
Chapter One: General Introduction
22
1.6.3. Molecular markers
Genetic data can provide information on individual identity, sex, kinship, philopatry,
dispersal, mating systems and gene flow (Avise 2004). Some of these are difficult or
impossible to obtain by any other means when investigating dolphin populations. For
dolphins, and for cetaceans in general, microsatellite DNA markers and mitochondrial
DNA (mtDNA) sequences have been particularly useful in population-level studies
(e.g., Baker et al. 1993, Rosel et al. 1999, Escorza-Trevino & Dizon 2000). It is
particularly productive to combine these two types of molecular markers in a study,
as they present different advantages and characteristics.
Mitochondrial DNA sequences – Over the years, mtDNA has become a definitive tool
of choice in molecular systematics and conservation genetics (Avise 2004). Several
of its characteristics make it especially valuable for investigating and understanding
patterns of genetic variation. First, it is a relatively straightforward technique. Notably,
there are several thousands of mitochondria in each cell, meaning that it is easier to
extract and amplify its DNA compared to the single copy of nuclear DNA. This is
particularly valuable when tissue samples are of limited size or bad quality (which
occurs frequently for cetaceans). Second, the mutation rate in mtDNA is relatively
high, in particular in the non-coding control region (D-Loop). The resulting high levels
of polymorphism have allowed researchers to conduct both intra- and inter-population
studies. Mitochondrial DNA is generally considered as a strictly neutral marker but
this has been controversial (e.g. Rand & Kann 1996) and it is recommended to
conduct tests of neutrality to explore this question (Ballard & Rand 2005). Third, there
is generally no recombination between mitochondrial molecules (but see Rokas et al.
2003). As a result, it is much easier, over space and time, to follow mitochondrial
lineages than nuclear lineages. Last, the mitochondrial genome is haploid and
maternally inherited in most species. It represents therefore only one quarter of the
effective population size of the diploid nuclear DNA, and is more sensitive to certain
demographic events (e.g., bottleneck events). Note however that if individuals are
usually homoplasmic for one mitochondrial haplotype, heteroplasmic conditions have
still been reported in several species (e.g. Wilkinson & Chapman 1991).

Chapter One: General Introduction
23
In this thesis, sequences of the mtDNA control region were amplified using universal
primers (see Chapter 2) to allow for comparison between species. The genetic
diversity of this mtDNA region has also been investigated in several dolphin
populations, allowing me to compare my results to those of other studies (Table 1.1).
Microsatellites – At present, microsatellites (or short tandem repeat) are the most
widely used DNA markers in population genetics, notably for molecular ecology and
conservation studies (Chambers & MacAvoy 2000, Avise 2004). Their main
advantage is that they are usually highly polymorphic, even in small populations and
endangered species. This high polymorphism results from a high mutation rate, likely
due to slipped-strand mis-pairing during DNA replication (Schlötterer & Tautz 1992).
See Chambers & MacAvoy (2000) and Goldstein & Schlötterer (1999) for a review of
these markers.
Microsatellite variability has been investigated in cetaceans to address a number of
different parameters, such as population structure, social structure (e.g., Amos et al.
1993), mating system (e.g., Krützen et al. 2004a), dispersal pattern (e.g., Möller &
Beheregaray 2004), recent evolutionary history (e.g., Dalebout et al. 2006) and
individual recognition. Interestingly, the primers developed for one species can often
be used for closely related species since the primer sites are generally highly
conserved (e.g., Goldstein & Schlötterer 1999). In this thesis, advantage was taken of
this characteristic by using a set of available ‘cetacean’ microsatellite primers
developed for other species. A summary of the primers used for each species is
presented in Appendix 1. Microsatellite variation was used to address questions
related to population structure (Chapter 2 and 6), population size (Chapter 2), social
organisation (Chapter 4, 5 and 6), sex dispersal (Chapter 2 and 6) and individual
identification (Chapter 2 and 6).
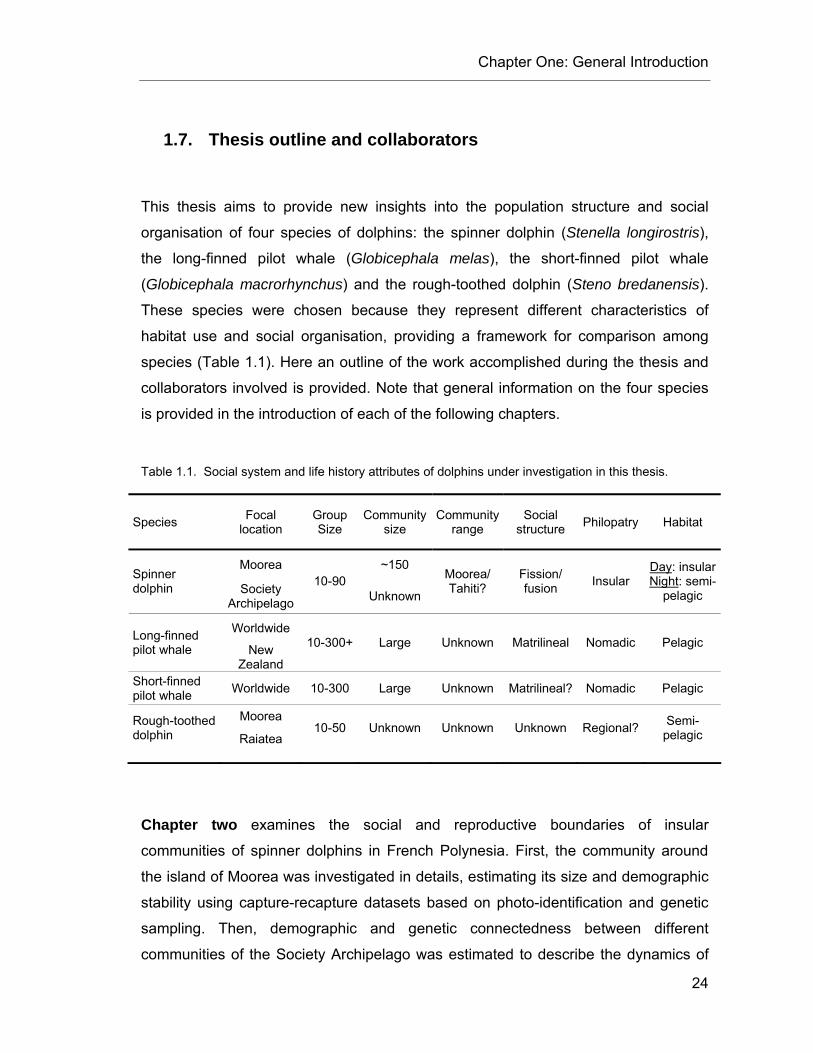
Chapter One: General Introduction
24
1.7. Thesis outline and collaborators
This thesis aims to provide new insights into the population structure and social
organisation of four species of dolphins: the spinner dolphin (Stenella longirostris),
the long-finned pilot whale (Globicephala melas), the short-finned pilot whale
(Globicephala macrorhynchus) and the rough-toothed dolphin (Steno bredanensis).
These species were chosen because they represent different characteristics of
habitat use and social organisation, providing a framework for comparison among
species (Table 1.1). Here an outline of the work accomplished during the thesis and
collaborators involved is provided. Note that general information on the four species
is provided in the introduction of each of the following chapters.
Table 1.1. Social system and life history attributes of dolphins under investigation in this thesis.
Species Focal location
Group Size
Community size
Community range
Social structure Philopatry Habitat
Moorea ~150 Spinner dolphin Society
Archipelago
10-90 Unknown
Moorea/ Tahiti?
Fission/ fusion Insular
Day: insularNight: semi-
pelagic
Worldwide Long-finned pilot whale New
Zealand
10-300+ Large Unknown Matrilineal Nomadic Pelagic
Short-finned pilot whale Worldwide 10-300 Large Unknown Matrilineal? Nomadic Pelagic
Moorea Rough-toothed dolphin Raiatea
10-50 Unknown Unknown Unknown Regional? Semi-pelagic
Chapter two examines the social and reproductive boundaries of insular
communities of spinner dolphins in French Polynesia. First, the community around
the island of Moorea was investigated in details, estimating its size and demographic
stability using capture-recapture datasets based on photo-identification and genetic
sampling. Then, demographic and genetic connectedness between different
communities of the Society Archipelago was estimated to describe the dynamics of
Chapter One: General Introduction
25
the insular spinner dolphin population in this region. These results have been
published in Marine Ecology - Progress Series:
Oremus M., Poole M.M., Steel D. and Baker C.S. (2007) Isolation and interchange
among insular spinner dolphin communities in the South Pacific revealed by
individual identification and genetic diversity. Marine Ecology Progress Series
336: 275-289.
I collected the data used in this chapter (photographs and biopsy samples) during
three field seasons in French Polynesia (2002 to 2004), which I organised with the
help of my supervisors, C.S. Baker (The University of Auckland, NZ/Oregon State
University, US) and M.M. Poole (Marine Mammal Research Program, Moorea,
French Polynesia). Analyses benefited from the photo-identification catalogue of
spinner dolphin dorsal fins compiled by M.M. Poole between 1987 and 1992 at
Moorea (Poole 1995).
Chapter three describes the worldwide mtDNA diversity of long-finned and short-
finned pilot whales. Phylogenetic reconstructions and phylogeography of mtDNA
haplotypes were investigated to test monophyly of the two species and to attempt to
explain the current distribution of worldwide mtDNA diversity.
Samples used in this chapter were made available by several people and institutions
(the samples’ places of origin are in parentheses): C. Garrigue, Opération Cétacés
(New Caledonia), C. Olavarría (Samoa), S. Gaitan-Caballero and A. Mignucci-
Giannoni (Puerto Rico), C.S. Baker (New Zealand, Japan, and Korea), R. Gales
(Tasmania), N. Funahashi and T. Endo (Japan). Samples from New Zealand were
collected courtesy of the Department of Conservation (DoC) and staff from the
University of Auckland (including C.S. Baker, R. Constantine, D. Steel and A.
Alexander). I collected biopsy samples in French Polynesia between 2002 and 2004
during opportunistic encounters that occurred while I conducted small-boat surveys.
All the sequences from Japanese samples were provided by C.S. Baker (as analysed
by himself, M.L. Dalebout, S. Lavery and V. Lukoschek). I genetically processed and
analysed most of the other samples but some were processed by D. Steel and M.L.
Chapter One: General Introduction
26
Dalebout. Previously published sequences from GenBank were also added to this
dataset.
A manuscript based on these results is in preparation to be submitted for publication,
from which I will be first author. Co-authors include C.S. Baker, M.L. Dalebout
(University of New South Wales, Australia), R. Gales (Department of Primary Industry
and Waters, Tasmania, Australia), N. Funahashi (International Fund for Animal
Welfare, Japan), T. Endo (University of Hokkaido, Japan) and T. Kage.
In Chapter four, a genetic study of mass strandings in New Zealand was conducted
to investigate the social system of long-finned pilot whales. In particular, I test the
hypothesis that this species lives in extended matrilineal groups, an assumption
recently questioned by the results of a behavioural study (Ottensmeyer & Whitehead
2003).
All of the samples used in the chapter came from the marine mammal tissue archives
held at the University of Auckland. These samples were collected over the last 15
years by staff from the University of Auckland and DoC, in collaboration with Anton
van Helden and the National Museum of New Zealand (Te Papa Tongarewa).
Additional samples were made available by C. Schroeder and F. Pichler. I genetically
processed and analysed most of these samples. However, similarly to Chapter 3,
some were processed for DNA extraction, molecular sexing and mtDNA control
region sequencing by D. Steel and M.L. Dalebout.
A manuscript based on these results is in preparation and will be co-authored by C.S.
Baker and D. Steel (Oregon State University, USA).
Chapter five explores the long-standing assumption that long-finned pilot whales
maintain social bonds during mass strandings. To test this assumption, I searched for
a correlation between kinship and spatial distribution of the whales stranded on a
beach after a large mass stranding at Stewart Island, New Zealand in 2003. This
work was made possible thanks to the data collected by DoC Southland staff,
coordinated by Helen Kettles. I processed and analysed all the samples used in this

Chapter One: General Introduction
27
chapter. The manuscript derived from this chapter will be co-authored by C.S. Baker
and H. Kettles.
Results presented in the Chapters 4 and 5 were presented in December 2005 at the
Society for Marine Mammalogy conference at San Diego, US:
Oremus M., Kettles H., Schroeder C., Gales R., Steel D. and Baker C.S. (2005) ‘O
mother where art thou?’ Genetic investigation into mass strandings of long-
finned pilot whales. 16th Biennial Conference on the Biology of Marine
Mammals. San Diego, USA, December 12-16, 2005
Chapter six describes the population structure of rough-toothed dolphins observed
in the nearshore waters of the Society Islands, French Polynesia. Photo-identification
data and levels of mtDNA diversity provide new insights into their social structure
when compared to results obtained on spinner dolphins and pilot whales. Similarly to
Chapter 2, I collected and processed all data for this chapter during three field
seasons in French Polynesia, between 2002 and 2004. A manuscript based on this
chapter is intended for submission to the journal Conservation Genetics:
Oremus M., Poole M.M. and Baker C.S. (in prep) Evidence of fine-scale population
structure in rough-toothed dolphins from the Society Archipelago, French
Polynesia.
Chapter seven provides some final conclusions, proposes future research following
the results presented in this thesis and reviews the completion of the primary
objectives of this study.

Chapter Two: Insular communities of spinner dolphins.
28
2. Isolation and interchange among insular spinner dolphin communities in the South Pacific revealed
by individual identification and genetic diversity
A spinner dolphin bow-riding in Tahiti, November 2003.
Chapter Two: Insular communities of spinner dolphins.
29
2.1. Abstract
Spinner dolphins (Stenella longirostris) are found in apparently relatively small and
discrete communities around many islands throughout the Pacific. However, the
boundaries of these communities on the scale of a dolphin’s lifespan or across
generations are unknown. Here a combined demographic and genetic approach is
reported to describe the isolation and interchange of insular spinner dolphins among
island communities of the Society Archipelago, French Polynesia. Dorsal fin
photographs for individual identification and biopsy samples for genetic analyses (n =
154) were collected from six island communities during 189 small-boat surveys over
three years. Capture-recapture analyses at Moorea (the primary study site), based on
long-term observations of distinctively marked individuals and microsatellite
genotypes (12 loci), indicated a local community of about 150 dolphins. This
community appeared relatively closed on an intra-generational scale, as confirmed by
re-sightings of individuals across 15 years. Surveys around neighbouring islands
indicated the presence of similar distinct communities, likely to follow similar
demographic patterns to Moorea, with relatively low level of interchange between
communities. Overall, significant differentiation at both mitochondrial and nuclear
levels indicates restricted gene flow among neighbouring communities, although
some individual movement was documented. High levels of insular mtDNA genetic
diversity (Nef ~ 100,000) contrasted with demographic characteristics. No evidence of
a bottleneck was found in microsatellite allele frequencies or mtDNA haplotypes,
discounting the possibility of a recent founder effect. Instead, this genetic pattern
suggests that it is the result of metapopulation structure, based on numerous insular
communities evolutionarily connected through male and female gene flow.

Chapter Two: Insular communities of spinner dolphins.
30
2.2. Introduction
Dolphins are often found in relatively small and apparently discrete coastal or insular
communities that are assumed to exhibit genetic exchange with neighbouring
communities or larger pelagic populations (e.g., Wells 2003). However, with the
exception of a few populations that have been the focus of extensive studies, the
social and reproductive boundaries of the communities and the extent of
demographic and genetic interchange remain unknown.
Demographic approaches, based principally on photographic documentation of
naturally marked individuals (i.e., photo-identification), can provide valuable
information on social relationships and local abundance. These methods are limited,
however, when assessing large-scale geographic structure and population dynamics
that extend across generations. On the other hand, evolutionary approaches are
often aimed primarily at estimating population genetic parameters but do not provide
a clear distinction between the relative importance of contemporary and historical
processes. Combining demographic and genetic methods can help overcome the
limitations of each (Lande 1988).
Spinner dolphins (Stenella longirostris) pose an interesting challenge to the
description of community structure. The species has a worldwide circum-tropical and
subtropical distribution (Perrin & Gilpatrick 1994) within which four subspecies have
been described based on morphological characters, distribution and habitat
preferences (Perrin & Gilpatrick 1994, Perrin et al. 1999): the eastern spinner
(Stenella longirostris orientalis), the Central American spinner (S. l.
centroamericana), the dwarf spinner (S. l. roseiventris) and Gray’s spinner (S. l.
longirostris) (Figure 2.1a). The distribution of the Central American spinner is limited
to waters of the west coast of southern Mexico to the Gulf of Panama, while the dwarf
spinner is only found in the Gulf of Thailand and Timor Sea (Perrin et al. 1999). In the
Eastern Tropical Pacific (ETP), the eastern spinner and the whitebelly spinner (an
apparent hybrid form between S. l. orientalis and S. l. longirostris) form large, pelagic,
mixed-species aggregations with spotted dolphins (Stenella�attenuata) and yellow-
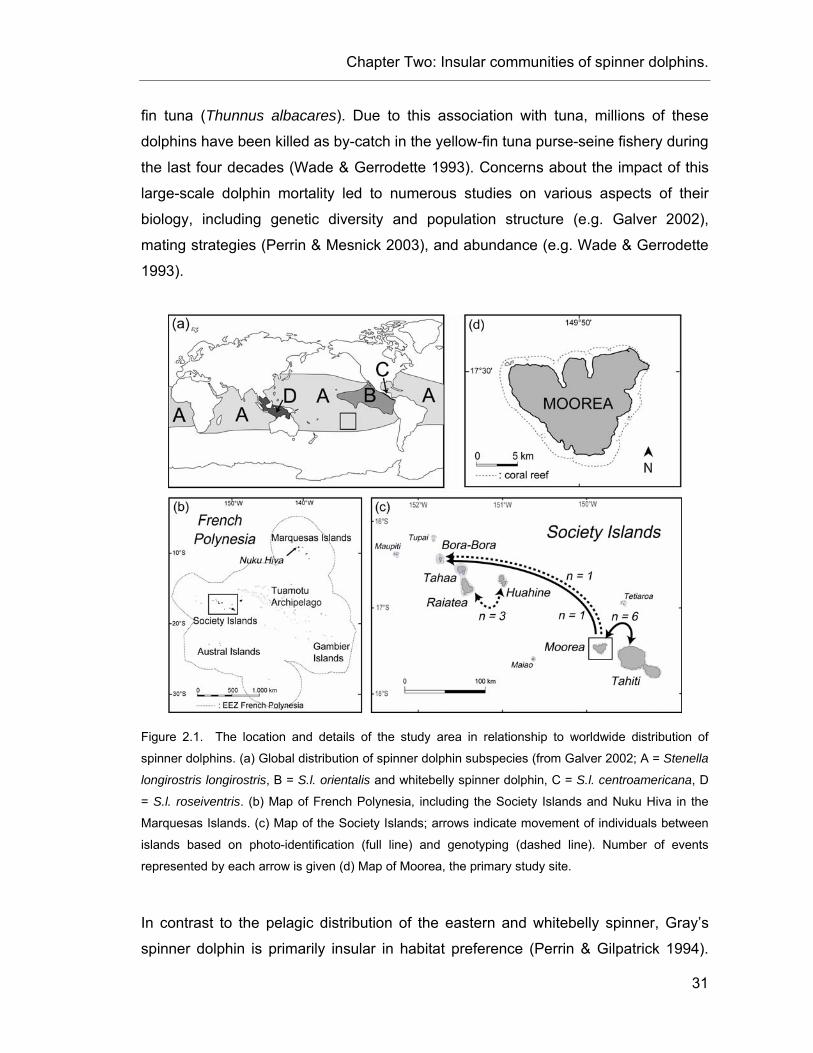
Chapter Two: Insular communities of spinner dolphins.
31
fin tuna (Thunnus albacares). Due to this association with tuna, millions of these
dolphins have been killed as by-catch in the yellow-fin tuna purse-seine fishery during
the last four decades (Wade & Gerrodette 1993). Concerns about the impact of this
large-scale dolphin mortality led to numerous studies on various aspects of their
biology, including genetic diversity and population structure (e.g. Galver 2002),
mating strategies (Perrin & Mesnick 2003), and abundance (e.g. Wade & Gerrodette
1993).
Figure 2.1. The location and details of the study area in relationship to worldwide distribution of
spinner dolphins. (a) Global distribution of spinner dolphin subspecies (from Galver 2002; A = Stenella
longirostris longirostris, B = S.l. orientalis and whitebelly spinner dolphin, C = S.l. centroamericana, D
= S.l. roseiventris. (b) Map of French Polynesia, including the Society Islands and Nuku Hiva in the
Marquesas Islands. (c) Map of the Society Islands; arrows indicate movement of individuals between
islands based on photo-identification (full line) and genotyping (dashed line). Number of events
represented by each arrow is given (d) Map of Moorea, the primary study site.
In contrast to the pelagic distribution of the eastern and whitebelly spinner, Gray’s
spinner dolphin is primarily insular in habitat preference (Perrin & Gilpatrick 1994).
Chapter Two: Insular communities of spinner dolphins.
32
Although absent from the ETP, its geographic distribution is much greater than the
distribution of the other sub-species, extending across the tropical and subtropical
waters of the Atlantic, Indian and Pacific Oceans (Figure 2.1a). Much of what is
known about the population dynamics of S. l. longirostris has been derived from a
few island locations: behavioural observation and photo-identification at the Big
Island, Oahu and Midway Atoll in Hawaii (Norris et al. 1994, Lammers 2004,
Karczmarski et al. 2005), Fernando de Noronha in Brazil (Silva-Jr et al. 2005) and
Moorea, in the Society Archipelago of French Polynesia (Poole 1995). These studies
reveal that insular Gray’s spinner dolphins (hereafter referred to as spinner dolphins)
follow a similar daily cycle at each location; during the day, they rest and socialise in
inshore habitats and at dusk, they move offshore where they feed on squid, shrimp
and mesopelagic fish. Demography and social organisation, on the other hand,
appear to be substantially different in each of the studies locations.
Around the Big Island of Hawaii, where the dolphins use specific bays and shallow
reefs during the daytime, Norris et al. (1994) found a ‘fission-fusion’ model of social
organisation, with groups forming and separating from day to day. Because of the
regular identification of new individuals in the resting groups, the authors concluded
that the dolphins observed around this island form an open population of more than
1,000 individuals (Norris et al. 1994). More recently, Karczmarski et al. (2005) has
described a very different social organisation of spinner dolphins at the remote atoll
of Midway, in the far-western leeward Hawaiian Islands. This population of about 200
individuals was found to be closed with respect to immigration/emigration (or nearly
so), with strong geographic fidelity and no obvious fission-fusion (Karczmarski et al.
2005).
In the Society Archipelago of French Polynesia, Poole (1995) described an
intermediate form of social organisation. Around the island of Moorea, the primary
study site (Figure 2.1), groups of spinners rest and socialise in a series of 10
pass/bay complexes (Figure 2.1d). These groups follow the same fission-fusion
model of social organisation observed at the Big Island, with day to day fluidity in
group composition (Poole 1995). However, similar to Midway Atoll, photo-
identification surveys over six years indicated that Moorea’s spinner dolphins were

Chapter Two: Insular communities of spinner dolphins.
33
year-round long-term residents forming a small and apparently closed community,
although some low-level of interchange was documented with the sister island of
Tahiti, just 17 km away (Poole 1995).
These island specific studies revealed important features of the behavioural ecology
of insular spinner dolphins, but left unanswered several crucial questions related to
genetic diversity and population dynamics: Do spinner dolphins typically form
relatively closed island communities distinct from one another, as suggested by
observations at Moorea and Midway? What are the social and genetic boundaries of
insular spinner dolphin communities? Is there any interchange of dolphins between
island communities and at what frequency? Are island communities formed by
colonisation events followed by isolation or do they maintain connectivity to ‘parent’
populations, forming large metapopulations?
To address these questions, evolutionary and demographic approaches were
combined, using microsatellite genotyping and mitochondrial DNA sequences
obtained from biopsy samples, and photographic sighting - re-sighting of distinctively
marked individuals, respectively, to describe community structure of spinner dolphins
frequenting the nearshore island waters of the Society Archipelago, French
Polynesia. First, to evaluate isolation or ‘closure’, intensive small-boat surveys at
Moorea were conducted, investigating in detail the demography and genetic diversity
of spinner dolphins around this island, and also taking advantage of the previous
photo-identification study conducted by Poole (1995) from 1987 to 1992. Second, to
address demographic and genetic connectedness, additional data (including biopsy
samples and photographs) were collected around the main islands of the Society
Archipelago and at Nuku Hiva in the Marquesas Archipelago, to provide insights on
population structure at a larger scale (Figure 2.1b). By combining demographic and
evolutionary approaches on a local and regional scale, it was hoped to provide a
more comprehensive description of the long- and short-term dynamics of insular
spinner dolphin populations.

Chapter Two: Insular communities of spinner dolphins.
34
2.3. Materials & Methods
2.3.1. Study area and small-boat surveys
From April 2002 to November 2004, spinner dolphins were photographed and
genetically sampled in French Polynesia, located in the central South Pacific Ocean
(Figure 2.1). Small-boat surveys were conducted (n = 189) around six islands of the
Society Archipelago including Moorea, Tahiti, Huahine, Raiatea, Tahaa and Bora
Bora (Figure 2.1c, Table 2.1). Efforts were made to survey the entire coastline of
each island (except in Tahiti), in order to avoid geographic bias in the sampling.
Because of logistical limitations, surveys in Tahiti were limited to the eastern part of
the island (from Point Venus to Papara). Four boat surveys were also conducted at
Nuku Hiva (n = 4), in the Marquesas Archipelago, 1,500 km north of Tahiti (Figure
2.1b). The islands of Raiatea and Tahaa were considered as one location (referred
as Raiatea-Tahaa), since they are enclosed within the same lagoon. Moorea, Tahiti
and Raiatea-Tahaa were visited on two consecutive years (Table 2.1).
Table 2.1. Boat surveys conducted from 2002 to 2004 in French Polynesia. DMI refers to Distinctively
Marked Individuals. Q is the quality rate of the photographs.
Island Year Start End # surveys
# encounters
# photos Q ≥ 3 # DMIs
Moorea 2002 2003
18/0409/07
01/1110/09
107 32
126 44
6985 792 25
Tahiti 2003 2004
28/1119/10
01/1231/10
4 12
7 19
342 1999 23
Bora Bora 2003 19/10 29/10 6 3 144 2
Raiatea-Tahaa 2003 2004
29/1004/11
04/1117/11
7 14
9 20
181 1447 24
Huahine 2003 05/11 12/11 7 6 288 5
Nuku Hiva 2004 22/11 27/11 4 4 - -
The primary study site was Moorea, where intensive boat surveys were conducted
from April to November 2002 (n = 107) and from July to September 2003 (n = 32)
(Table 2.1). This island was chosen since a previous study was carried out there by
Chapter Two: Insular communities of spinner dolphins.
35
Poole (1995), who conducted 275 boat surveys from 1987 to 1992, taking
photographs of 249 groups of spinner dolphins. Poole (1995) also conducted 13 boat
surveys along the north-east coast of Tahiti in 1988-89.
2.3.2. Collection and analysis of photo-identification data
During each encounter, group size was estimated by visual counts and dorsal fin
photographs were taken of as many individuals as possible, regardless of distinctive
marks. Photographs were taken using a digital Olympus E10 (4 megapixel CCD)
equipped with a 200 mm lens and Canon Digital Rebel (6.3 megapixel CMOS)
equipped with a 300 mm lens. Dorsal fin photographs were first assessed for quality
independently of distinctiveness of fins. Five criteria were used to assign photographs
a quality rating (Q) on a scale of 1 to 5 (poor to excellent): focus, size, exposure and
percentage of the dorsal fin visible on the photo (Arnborn 1987). Only images that
rated Q ≥ 3 were considered for the analyses (but see Appendix 2 for details).
Most spinner dolphins showed some unique marks on their dorsal fins but Poole
(1995) found that, overall, only a limited percentage of individuals (about 15% of the
population) are sufficiently distinctive to be confidently identified across time.
Therefore, in this study, only dolphins with deep distinctive nicks or deformations on
the edge of the dorsal fin were considered as ‘marked’ for the purpose of individual
identification. This allowed comparisons of images taken from either side of an
individual. This subset of dolphins is referred to as ‘Distinctively Marked Individuals’
or DMIs. All other photographed dolphins were classified as ‘unmarked’.
Based on the images of DMIs collected during the surveys, a photo-identification
catalogue was created for each island. All catalogues were compared to find re-
sights within and between islands. Inter-annual re-sightings around the same island
were also recorded for islands where surveys were conducted during two
consecutive years. Finally, the DMI catalogues from this study were compared to
Poole’s (1995) catalogues comprising DMI photographs taken around Moorea and
Tahiti between 1987 and 1992.

Chapter Two: Insular communities of spinner dolphins.
36
2.3.3. Biopsy sampling and DNA extraction
Skin samples for genetic analyses were collected from spinner dolphins using a small
stainless-steel biopsy dart fired from a modified veterinary capture rifle equipped with
a variable pressure valve (Krützen et al. 2002). Short-term behavioural responses to
biopsy attempts were recorded and are reported in Appendix 3. All samples were
preserved in 70% ethanol and stored at -20°C for subsequent analysis. Total cellular
DNA was isolated from skin tissue by digestion with proteinase K followed by a
standard phenol: chloroform extraction method (Sambrook et al. 1989) as modified
for small samples by Baker et al. (1994).
2.3.4. mtDNA sequencing, genotyping and sex identification
An 800 base pair (bp) fragment of the 5’ end of the mtDNA control region (d-loop)
was amplified using the polymerase chain reaction (PCR) and the primers light-
strand, tPro-whale M13-Dlp-1.5 (5'-TCACCCAAAGCTGRATTCTA-3', Dalebout et al.
1998), and heavy strand, Dlp-8G (5'-GGAGTACTATGTCCTGTAACCA-3', designed
by G. Lento as reported in Dalebout et al. 2005). All amplification reactions were
carried out in a total volume of 20 µL with 1 x Ampli-Taq buffer, 2.5 mM MgCl2, 0.4
µM each primer, 0.2 mM dNTPs and 0.5 U of Ampli-Taq® DNA polymerase. The
PCR temperature profile was as follows: a preliminary denaturing period of 2 minutes
at 94°C followed by 35 cycles of denaturation for 30 seconds at 94°C, primer
annealing for 45 seconds at 55°C and polymerase extension for 40 seconds at 72°C.
A final extension period of 10 minutes at 72°C was included at the end of the cycle.
PCR products were purified for sequencing with ExoSAP-IT (USB) and sequenced in
both directions with BigDye™ terminator chemistry v.3.1 on an ABI 3100 DNA
sequencer (Applied Biosystems Inc.). Sequences were aligned using SequencherTM
(version 4.1.2, Genes Codes Co.) and edited manually. Variable sites and unique
haplotypes were identified using MacClade v. 4.0 (Maddison & Maddison 2000).
Samples were genotyped using 12 published microsatellite loci developed from other
cetacean species (Table 2.2). Amplification via PCR was performed following
standard protocols, in 10 µL volumes with 1 x Platinium-Taq buffer, 1.5 mM MgCl2,

Chapter Two: Insular communities of spinner dolphins.
37
0.4 µM each primer, 0.2 mM dNTPs and 1/8 U of Platinium-Taq® DNA polymerase,
and annealing temperature varying by locus (Table 2.2). PCR products were run on
an ABI 377 DNA automated sequencer with a TAMRA350 size ladder (Applied
Biosystems Inc.). Data were collected by GeneScan v. 3.7, and the fragment size
was measured using Genotyper v. 2.5 (Applied Biosystems Inc.). The sex of sampled
dolphins was identified by amplification of a fragment of the sry gene multiplexed with
ZFX positive control, as described by Gilson et al. (1998).
Table 2.2. Microsatellite diversity for spinner dolphins from French Polynesia. HO is the observed
heterozygosity and HE is the expected heterozygosity. No significant deviation (p > 0.05) was found
after Bonferroni correction (pcrit = 0.042). k is the number of alleles found and n is the number of
screened chromosomes.
Locus k n HO HE Null allele frequencies References
415/416 12 132 0.788 0.833 +0.0274 (Amos et al. 1993)a AAT44 10 136 0.757 0.812 +0.0346 (Caldwell et al. 2002)c EV1 15 136 0.743 0.843 +0.0623 (Valsecchi & Amos 1996)b EV94 20 136 0.816 0.849 +0.0164 (Valsecchi & Amos 1996)b GATA98 9 137 0.825 0.815 -0.0069 (Palsbøll et al. 1997)b GT6 10 135 0.726 0.771 +0.0298 (Caldwell et al. 2002)b GT575 8 135 0.726 0.775 +0.0305 (Bérubé et al. 2000)a KWM12a 11 136 0.838 0.821 -0.0121 (Hoelzel et al. 1998b)b MK5 12 137 0.825 0.823 +0.0013 (Krützen et al. 2001)b MK6 19 136 0.809 0.875 +0.0395 (Krützen et al. 2001)b Ppho131 14 137 0.861 0.855 -0.0036 (Rosel et al. 1999)a Ppho142 10 132 0.674 0.677 +0.0010 (Rosel et al. 1999)a
abc indicate different PCR temperature profiles: (a) 94°-10’, (94°-30”, 55°-30”, 72°-20”) 30x, 72°-3’; (b)
94°-10’, (94°-30”, 50°-30”, 72°-30”) 35x, 72°-3’; (c) as reported in the original paper.
2.3.5. Moorea community size estimate
An extensive photographic collection at Moorea allowed estimation of the dolphins’
community size using the Bowden estimator for closed populations (Bowden & Kufeld
1995), as implemented in the program Noremark (White 1996a). This model requires
only a small proportion of the population to be marked, and provides an estimate of
the total population size and confidence intervals, taking into account the frequency
of sightings of each marked individual and the total number of sightings for unmarked

Chapter Two: Insular communities of spinner dolphins.
38
individuals. It allows for continuous sampling over long periods of time, removing the
need to sub-divide the dataset into sampling periods. This estimator is known to be
robust to heterogeneity of sighting probabilities (White 1996b).
Abundance was also estimated with the program Capwire (Miller et al. 2005), using
the frequency of capture-recapture found by genotyping of biopsy samples. This
method, based on a simple urn model, assumes a closed population and can be
applied using a single continuous sampling session. Simulations showed that it
performs better than commonly used capture-recapture models when population size
is small (not more than a few hundreds individuals) and heterogeneity occurs in
capture probability (Miller et al. 2005). Equal likelihood of capture was tested by
comparing the frequencies of capture to the zero-truncated Poisson distribution as
described by Caughley (1977). Biopsy samples were collected without consideration
of previous sampling of marked or unmarked individuals and therefore, provided a
dataset independent of photo-identification that was for the purpose of capture-
recapture analyses.
2.3.6. mtDNA and microsatellite diversity
The software Arlequin v. 3.01 (Excoffier et al. 2005) was used to estimate the number
of polymorphic sites, as well as haplotype diversity (h) and nucleotide diversity (π) of
the mtDNA control region, overall and for each island. Due to computer limitations,
the best model of substitution proposed by Modeltest v. 3.7 (Posada & Crandall
1998) could not be used, i.e., HKY+I+G; ti/tv ratio = 37.79; gamma correction =
0.4941, but instead used the closely related Tamura-Nei model of substitution with a
gamma correction of 0.4941.
Microsatellite loci were tested for departure from Hardy-Weinberg equilibrium using
the software Arlequin. The potential frequency of null alleles was estimated using
Cervus v. 2.0 (Marshall et al. 1998). The probability of identity (PID) was estimated, as
implemented in the program GenAlEx v. 6 (Peakall & Smouse 2005), and the
matching genotypes, assumed to represent replicate samples of individuals, were
found with Cervus. The PID is an estimate of the average probability that any two
individuals chosen by chance from the population would share an identical genotype.
Chapter Two: Insular communities of spinner dolphins.
39
Number of alleles per locus and allelic richness were calculated with the program
FSTAT v. 2.9.3.2 (Goudet 2001).
2.3.7. Population structure and sex specific dispersal
A median-joining network was constructed to infer phylogenetic relationship among
the mtDNA control region haplotypes using the program Network v. 4.1.0.8 (Bandelt
et al. 1999). Analyses of molecular variance (AMOVA) were conducted with Arlequin,
grouping animals by islands, based on the mtDNA control region (using FST and ΦST)
and on the microsatellite loci (using FST). The ΦST statistic takes into account the
relationship between haplotypes based on molecular distances, while FST uses only
the difference in frequencies of haplotype (Excoffier et al. 1992).
To test for bias in dispersal between males and females, we analysed microsatellite
genotypes and mtDNA (by coding individuals as homozygotes) using the “biased
dispersal” option implemented in FSTAT (Goudet 2001). From this program, two tests
are reported that seem to perform best across a range of conditions (Goudet et al.
2002): the comparison of sex-specific FST values; and, the sex-specific variance of
assignment index (νAIc) (Goudet et al. 2002). For the FST test, the value of the more
dispersing sex is expected to be lower than for the more philopatric sex. For the νAic
test, variance is expected to be higher in the dispersing sex. The significance of both
tests was judged by generating null distributions with 10,000 permutations.
2.3.8. Female long-term effective population size (Nef)
For comparison to the estimated census size of local communities, Nef was estimated
for island samples based on mtDNA diversity using the relationship, Nef = θf/2µ,
where µ is the neutral mutation rate per nucleotide per generation and θf is, in this
case, a measure of mtDNA diversity. The parameter θf was estimated with the
maximum likelihood coalescent approach implemented in the program Lamarc v. 2.0
(Kuhner 2006); searches included 10 short chains (500 trees used of 10,000
sampled) and 2 long chains (10,000 trees used of 200,000 sampled). Three runs of
Lamarc were performed for each sample, and the median value was chosen for a
Chapter Two: Insular communities of spinner dolphins.
40
final Nef estimate. For µ, a mutation rate of 7.46 – 9.35 x 10⁻⁹ nucleotides per year
was calculated (λ = d/2T) from the evolutionary distance (d) of 0.1775 +/- 0.0283
between Delphinidae and Phocoenidae (using our dataset and a harbour porpoise
sequence from Genbank, accession number AJ554063 (Arnason et al. 2004)), and
an assumed divergence time (T) of 1.0 – 1.1 x 10⁷ years ago based on the fossil
record (Barnes 1985). Such a mutation rate is comparable to mutation rates
previously reported for baleen whales (Baker et al. 1993) and Cuvier’s beaked
whales (Dalebout et al. 2005). The value was adjusted using a generation time of 15
years for spinner dolphins, estimated as the average age of mature females following
data from Perrin and Henderson (1984), for a final mutation rate estimate of µ = 1.12
– 1.40 x 10⁻⁷ nucleotides per generation.
2.3.9. Testing for recent bottleneck effect
The sample of mtDNA sequences from each island was tested for departures from
mutation-drift equilibrium with Tajima’s D test (Tajima 1989b) and Fu’s FS test (Fu
1997), as implemented in Arlequin. A positive Tajima’s D can indicate an admixture
of two distinct populations, while a negative Tajima’s D can be explained by a recent
bottleneck effect or population expansion (Tajima 1989a, Aris-Brosou & Excoffier
1996). Large negative values of Fu’s FS statistics can also indicate a population
demographic expansion (Fu 1997). Significance of both statistics was inferred by
randomisation (10,000 steps), using a coalescent simulation algorithm (Hudson
1990) as implemented in Arlequin.
For microsatellites, a test based on allele frequencies and implemented in the
program Bottleneck v. 1.2.02 was used (Cornuet & Luikart 1996); the Wilcoxon one-
tailed test for heterozygote excess, run under the stepwise mutation model (SMM)
and the two-phased model (TPM; variance = 30, 70% stepwise mutational model,
1000 iterations). The distribution of allelic frequencies was also inspected to detect a
mode-shift distortion due to the loss of rare alleles (Luikart et al. 1998). Finally, the
method implemented in the programs M_P_Val and Critical_M (Garza & Williamson
2001) was applied, to test if the M ratios (mean ratio of the number of alleles to the
range in allele size) of island samples were significantly smaller than expected under

Chapter Two: Insular communities of spinner dolphins.
41
a range of expected neutral values. Expected values of M were simulated assuming
a TPM, with parameters ∆g = 3.5 and ps = 90% (Garza & Williamson 2001) and
considering θ values of 1, 10 and 50, i.e., pre-bottleneck effective population sizes
ranging from 500 to 25,000 when µ = 5x10⁻⁴ nucleotides per generation (Goldstein &
Schlötterer 1999).
2.4. Results
2.4.1. Survey effort and sample size
Groups of spinner dolphins were found around all six islands surveyed. The number
of encounters at each island ranged from six to 170 (Table 2.1), and was highly
correlated with the number of surveys (Spearman R = 0.94; p < 0.005). Average
group size was 36.4 dolphins (ranging from three to 90). A large number of
photographs were taken for individual identification (Table 2.1), particularly at Moorea
in 2002. From the photographs, a total of 82 DMIs were identified, with the largest
numbers identified around Moorea, Tahiti and Raiatea-Tahaa (Table 2.1). No DMIs
were identified at Nuku Hiva. Long-term associations with calves (expected to be
mothers) and molecular sexing from biopsy samples of a few DMIs indicate that both
males and females can be distinctively marked (results not shown).
A total of 154 genetic samples were collected from dolphins around all the islands
visited during this study (Table 2.3); 151 were biopsy samples and three were
samples from dead stranded dolphins (Moorea, January 2003 and September 2005,
n = 2 + 1). Biopsy samples were collected from 79 different groups of dolphins (Table
2.3). Each sample was genotyped at nine to 12 microsatellite loci. All loci were found
to be highly polymorphic overall (Table 2.2) and within island samples (Table 2.3).
The PID was 6.8 x 10⁻¹², when calculated across the first nine loci (the minimum
number of loci successfully genotyped for each sample), and 8.59 x 10⁻¹⁶ over 12
loci. Comparison of genotypes from the 154 biopsies revealed that 17 individuals
were sampled on two occasions while two were sampled on three occasions (i.e., 19
individuals sampled more than once). All other pair-wise comparisons showed
mismatches at five or more loci between individuals, making false exclusion (due to
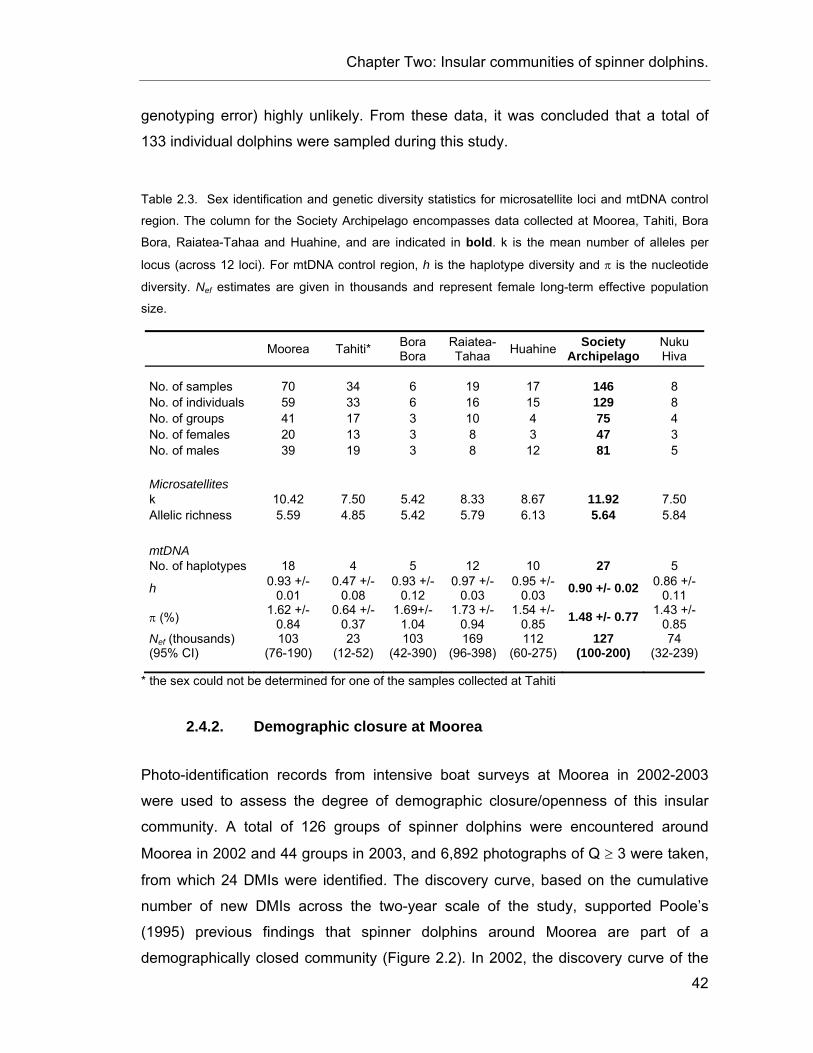
Chapter Two: Insular communities of spinner dolphins.
42
genotyping error) highly unlikely. From these data, it was concluded that a total of
133 individual dolphins were sampled during this study.
Table 2.3. Sex identification and genetic diversity statistics for microsatellite loci and mtDNA control
region. The column for the Society Archipelago encompasses data collected at Moorea, Tahiti, Bora
Bora, Raiatea-Tahaa and Huahine, and are indicated in bold. k is the mean number of alleles per
locus (across 12 loci). For mtDNA control region, h is the haplotype diversity and π is the nucleotide
diversity. Nef estimates are given in thousands and represent female long-term effective population
size.
Moorea Tahiti* Bora Bora
Raiatea-Tahaa Huahine Society
Archipelago Nuku Hiva
No. of samples 70 34 6 19 17 146 8 No. of individuals 59 33 6 16 15 129 8 No. of groups 41 17 3 10 4 75 4 No. of females 20 13 3 8 3 47 3 No. of males 39 19 3 8 12 81 5
Microsatellites
k 10.42 7.50 5.42 8.33 8.67 11.92 7.50 Allelic richness 5.59 4.85 5.42 5.79 6.13 5.64 5.84
mtDNA
No. of haplotypes 18 4 5 12 10 27 5
h 0.93 +/- 0.01
0.47 +/- 0.08
0.93 +/- 0.12
0.97 +/- 0.03
0.95 +/- 0.03 0.90 +/- 0.02 0.86 +/-
0.11
π (%) 1.62 +/- 0.84
0.64 +/- 0.37
1.69+/- 1.04
1.73 +/- 0.94
1.54 +/- 0.85 1.48 +/- 0.77 1.43 +/-
0.85 Nef (thousands) (95% CI)
103 (76-190)
23 (12-52)
103 (42-390)
169 (96-398)
112 (60-275)
127 (100-200)
74 (32-239)
* the sex could not be determined for one of the samples collected at Tahiti
2.4.2. Demographic closure at Moorea
Photo-identification records from intensive boat surveys at Moorea in 2002-2003
were used to assess the degree of demographic closure/openness of this insular
community. A total of 126 groups of spinner dolphins were encountered around
Moorea in 2002 and 44 groups in 2003, and 6,892 photographs of Q ≥ 3 were taken,
from which 24 DMIs were identified. The discovery curve, based on the cumulative
number of new DMIs across the two-year scale of the study, supported Poole’s
(1995) previous findings that spinner dolphins around Moorea are part of a
demographically closed community (Figure 2.2). In 2002, the discovery curve of the
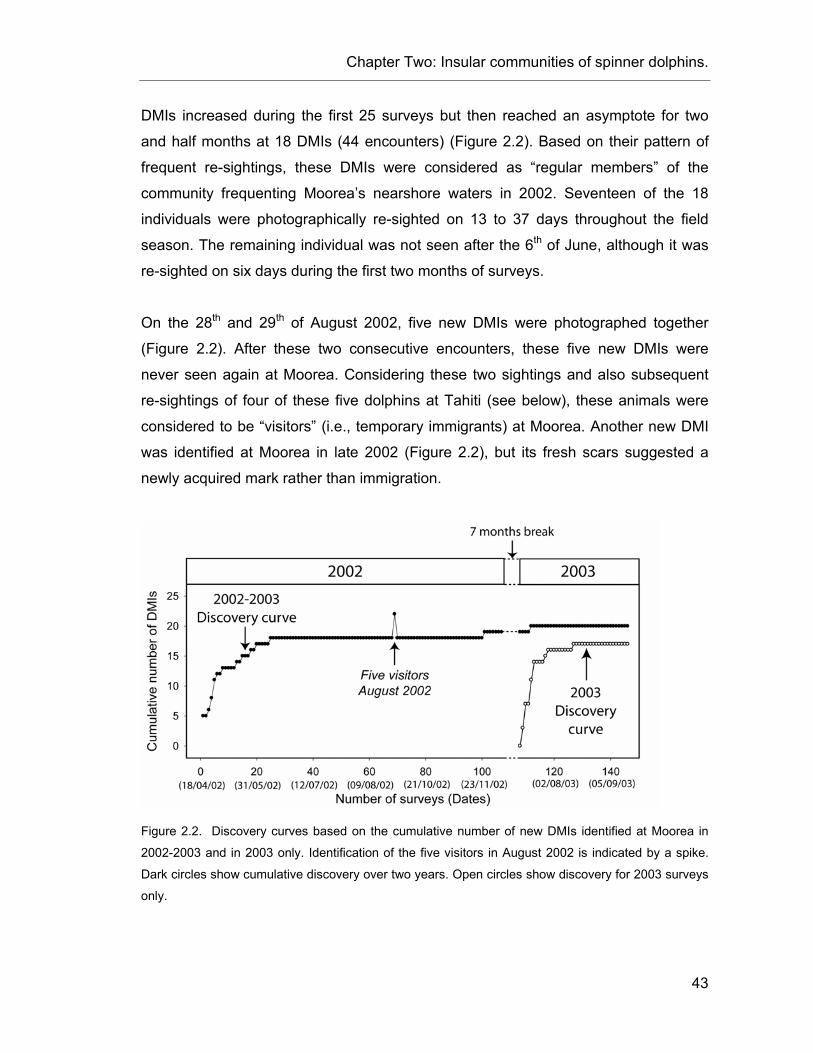
Chapter Two: Insular communities of spinner dolphins.
43
DMIs increased during the first 25 surveys but then reached an asymptote for two
and half months at 18 DMIs (44 encounters) (Figure 2.2). Based on their pattern of
frequent re-sightings, these DMIs were considered as “regular members” of the
community frequenting Moorea’s nearshore waters in 2002. Seventeen of the 18
individuals were photographically re-sighted on 13 to 37 days throughout the field
season. The remaining individual was not seen after the 6th of June, although it was
re-sighted on six days during the first two months of surveys.
On the 28th and 29th of August 2002, five new DMIs were photographed together
(Figure 2.2). After these two consecutive encounters, these five new DMIs were
never seen again at Moorea. Considering these two sightings and also subsequent
re-sightings of four of these five dolphins at Tahiti (see below), these animals were
considered to be “visitors” (i.e., temporary immigrants) at Moorea. Another new DMI
was identified at Moorea in late 2002 (Figure 2.2), but its fresh scars suggested a
newly acquired mark rather than immigration.
Figure 2.2. Discovery curves based on the cumulative number of new DMIs identified at Moorea in
2002-2003 and in 2003 only. Identification of the five visitors in August 2002 is indicated by a spike.
Dark circles show cumulative discovery over two years. Open circles show discovery for 2003 surveys
only.
Chapter Two: Insular communities of spinner dolphins.
44
During the surveys conducted from July to September 2003, 17 DMIs were
photographically identified on two to 10 occasions each (Figure 2.2). Only one of
these was not known from the previous 2002 surveys, but it could not be determined
if it was a visitor, a recent immigrant, or a previous member of the community with
recently acquired but already healed scars. Apart from this last DMI, photo-
identification data collected in 2003 did not alter the asymptote of the discovery curve
started in 2002 (Figure 2.2), suggesting strong community stability over the two years
of surveys. An independent discovery curve using only the 2003 photographs
reached asymptote after only 20 surveys (Figure 2.2).
Comparison to the data of Poole (1995) showed that five of the DMIs identified as
member of the community in 2002-2003 had been regularly photographed previously
around Moorea between 1987 and 1992. These five DMIs, three of which were first
identified in 1987 as adults (i.e., at least five years old), were also regularly
photographed around Moorea between the 1987-92 study and the 2002-03 study
(Poole. Unpublished data), supporting site fidelity of up to 15 years. Based on field
observations and/or molecular data, it was found that these five dolphins included at
least two females and one male (females: Slo02Mo15 and Slo02Mo16; male:
Slo02Mo27).
2.4.3. Abundance of Moorea community
The abundance of the Moorea community was estimated based on the frequency of
photographic recapture of the 18 DMIs identified as “regular members” of the
community during 2002. During the 106 encounters considered for the purpose of the
estimate, the 18 DMIs were photographed from 13 to 84 times each (based on Q ≥ 3
photos), giving a total of 811 sighting – re-sighting events. Photographs of unmarked
individuals (Q ≥ 3) represented 5295 ‘sightings’. Based on the frequencies of re-
sighting of each DMI and on the total number of unmarked individual sightings, the
Bowden estimator gave an abundance of 135 (95% CI. 112 – 163) for the Moorea
community. As expected, my estimate was slightly larger (due to demographic
effects) when including 2003 photographs (148, 95% CI. 121 – 181).

Chapter Two: Insular communities of spinner dolphins.
45
To corroborate the estimate from photo-identification, the abundance of the Moorea
community was also estimated by genotyping. Unlike the photo-identification, all
individuals were expected to be uniquely identifiable by genotyping but the number of
sampling events was much smaller. Of the total of 62 skin samples collected around
Moorea in 2002, comparison of genotypes revealed that 42 individuals were sampled
once, seven were sampled twice and two were sampled on three occasions.
Comparison to a zero-truncated Poisson distribution indicates that dolphins had
unequal likelihood of biopsy sampling (χ² = 6.67, p < 0.01). Based on these
frequencies of capture-recapture, the program Capwire provided an estimate of 151
individuals (95% CI. 97-294), showing relatively close agreement with the Bowden
estimate based on photo-identification.
2.4.4. Individual interchange among islands
Comparison among DMIs from all of the islands provided insight into low levels of
demographic interchanges and temporary immigration. Of the 23 DMIs identified at
Tahiti, six were encountered during surveys conducted at Moorea in 2002 and 2003.
Two of these dolphins were known as members of the Moorea community. The other
four DMIs were the “visitors” observed at Moorea in August 2002, supporting further
the particular status of these dolphins. A review of photographs collected previously
by Poole (1995) showed that one of these “visitors” was first identified at Tahiti in
1989. No matching of DMIs was found between Huahine (five DMIs), Raiatea-Tahaa
(24 DMIs) and Bora Bora (two DMIs), although these islands are geographically close
to one another (Figure 2.1c). Surprisingly, one DMI was observed at both Moorea
and Bora Bora, more than 200 km distant from each other (Figure 2.1). This dolphin
was the DMI regularly observed at Moorea for the first two months of surveys
conducted in 2002 but not seen after June (see above), suggesting a long-term
(perhaps permanent) emigration from Moorea.
Comparison of genotypes from biopsy samples collected at the outer islands
provided additional information on individual interchange among islands. Most of the
recapture events were around the island where the individuals were initially sampled
(11 at Moorea, one at Tahiti, two at Huahine and three at Raiatea-Tahaa), but four
dolphins were re-sampled at different islands. Among them, three dolphins (all males)
Chapter Two: Insular communities of spinner dolphins.
46
were biopsied in both Huahine and Raiatea, demonstrating at least occasional
interchange between these two islands. No genotype match was found between
Moorea and Tahiti. Finally, a female sampled at Moorea in May 2002 was re-sampled
at Bora Bora in 2003. This genetic recapture supports the other immigration event
between these two islands illustrated by the recapture of the DMI.
Replicate samples of individuals collected around the same islands (n = 17) were
removed from the dataset for subsequent analyses of genetic diversity, population
structure, sex-dispersal and bottleneck tests. However, replicate samples from
different islands (n = 4) were retained for these analyses, except where mentioned,
providing a total sample size of 137 individuals.
2.4.5. mtDNA diversity and effective population size
Considering the relative demographic closure of insular communities, levels of
mitochondrial genetic diversity were surprisingly high at Moorea and for the other
island samples. Across the 555 base pair region of the mtDNA control region that
was analysed, at total of 52 variable sites were found defining 31 haplotypes
(GenBank accession numbers EF558737 to EF558767) for the 59 individuals. The
overall haplotype diversity was 0.92 +/- 0.014 and nucleotide diversity was 1.59 % +/-
0.82 % (Table 2.3). Similar levels of diversity were observed for within-island
samples, except in Tahiti which showed much lower levels of haplotype and
nucleotide diversity (Table 2.3). There were no obvious differences in mtDNA control
region diversity between males (n = 83) and females (n = 49) (results not shown).
The median-joining network of mtDNA haplotypes showed no obvious overall
phylogeographic structuring but did indicate a striking absence of expected sister
lineage, i.e., haplotypes related by a single substitution to observed haplotypes
(Figure 2.3). In contrast to the other islands, samples from Tahiti were dominated by
only a few haplotypes (Slo02FP11 and Slo02FP27) shared with several other islands
of the Society Archipelago. Huahine showed four unique haplotypes, while Bora Bora
had one and Raiatea-Tahaa had none. Moorea had the largest number of unique
haplotypes (n = 7) but it also represented the largest data set. Finally, four of the five

Chapter Two: Insular communities of spinner dolphins.
47
haplotypes identified at Nuku Hiva, in the remote Marquesas Islands, were not found
in the Society Archipelago.
Based on the estimated substitution rate of 1.12 - 1.40 x 10⁻⁷ nucleotides per
generation, estimates of long-term Nef for each island sample ranged from 23,000 to
169,000, (Table 2.3). Note that the estimate of Nef at Moorea (Nef = 103,000) showed
obvious discrepancy with the current census size estimates (Ncensus < 200).
Interestingly, long-term Nef estimated for the whole Society Archipelago was of the
same order as estimates from single islands (such as Moorea, Raiatea and Huahine).
Figure 2.3. Inferred genealogical relationship among mtDNA haplotypes (n = 31) from spinner
dolphins of French Polynesia based on the median-joining algorithm. The diameter of each circle is
proportional to the number of individuals found for the haplotype (nind = 137). White dots represent
inferred node haplotypes not found in the samples. Each hash mark corresponds to a single inferred
mutational step. Codes refer to individuals chosen to represent haplotypes.
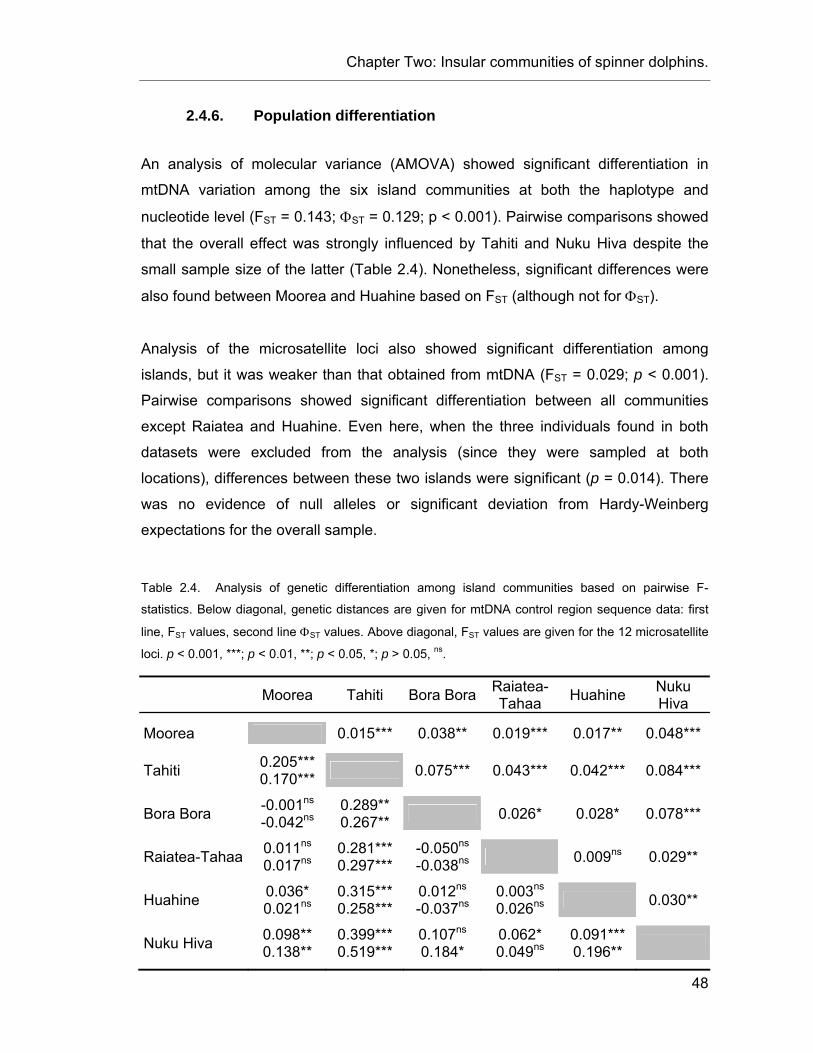
Chapter Two: Insular communities of spinner dolphins.
48
2.4.6. Population differentiation
An analysis of molecular variance (AMOVA) showed significant differentiation in
mtDNA variation among the six island communities at both the haplotype and
nucleotide level (FST = 0.143; ΦST = 0.129; p < 0.001). Pairwise comparisons showed
that the overall effect was strongly influenced by Tahiti and Nuku Hiva despite the
small sample size of the latter (Table 2.4). Nonetheless, significant differences were
also found between Moorea and Huahine based on FST (although not for ΦST).
Analysis of the microsatellite loci also showed significant differentiation among
islands, but it was weaker than that obtained from mtDNA (FST = 0.029; p < 0.001).
Pairwise comparisons showed significant differentiation between all communities
except Raiatea and Huahine. Even here, when the three individuals found in both
datasets were excluded from the analysis (since they were sampled at both
locations), differences between these two islands were significant (p = 0.014). There
was no evidence of null alleles or significant deviation from Hardy-Weinberg
expectations for the overall sample.
Table 2.4. Analysis of genetic differentiation among island communities based on pairwise F-
statistics. Below diagonal, genetic distances are given for mtDNA control region sequence data: first
line, FST values, second line ΦST values. Above diagonal, FST values are given for the 12 microsatellite
loci. p < 0.001, ***; p < 0.01, **; p < 0.05, *; p > 0.05, ns.
Moorea Tahiti Bora Bora Raiatea-Tahaa Huahine Nuku
Hiva
Moorea 0.015*** 0.038** 0.019*** 0.017** 0.048***
0.205*** Tahiti 0.170*** 0.075*** 0.043*** 0.042*** 0.084***
-0.001ns 0.289** Bora Bora -0.042ns 0.267** 0.026* 0.028* 0.078***
0.011ns 0.281*** -0.050ns Raiatea-Tahaa 0.017ns 0.297*** -0.038ns 0.009ns 0.029**
0.036* 0.315*** 0.012ns 0.003ns Huahine 0.021ns 0.258*** -0.037ns 0.026ns 0.030**
0.098** 0.399*** 0.107ns 0.062* 0.091*** Nuku Hiva 0.138** 0.519*** 0.184* 0.049ns 0.196**

Chapter Two: Insular communities of spinner dolphins.
49
2.4.7. Sex-biased dispersal
Sex-specific AMOVAs showed significant population differentiation for males and
females at both nuclear and mitochondrial level, discounting the null hypothesis of
panmixia for either sex (Table 2.5). However, these analyses showed a trend toward
larger FST values for females at both mtDNA control region and microsatellite loci,
suggesting greater female philopatry and some male biased dispersal, although the
effect was not significant given our sample size. This trend was confirmed by the test
of variance of the corrected assignment index (νAIc), which was significant
regardless of whether or not the four replicate samples were included (Table 2.5).
Table 2.5. Differences in sex-specific FST values and variance of corrected assignment index (νAIc),
based on mtDNA control region and microsatellite loci. Results are reported for tests including (w/
repli) or not including (no repli) the replicate samples obtained from different islands (p-values in bold).
Significance levels of genetic differentiation, estimated with Arlequin v.3.01, are also indicated for FST
values. p < 0.001, ***; p < 0.05, *; p > 0.05, ns.
mtDNA control region Microsatellite loci
All locations Society Islands All locations Society Islands
w/ repli no repli w/ repli no repli w/ repli no repli w/ repli no repli
FST (Males) 0.109*** 0.109 0.105*** 0.104 0.021*** 0.023 0.017*** 0.018 FST (Females) 0.167*** 0.175 0.173*** 0.182 0.035*** 0.036 0.035*** 0.036 p-value 0.187ns 0.142ns 0.149ns 0.110ns 0.163ns 0.161ns 0.077ns 0.082ns
νAIc (Males) - - - - 18.89 20.15 19.27 20.65 νAIc (Females) - - - - 11.17 11.60 11.79 12.26 p-value - - - - 0.049* 0.032* 0.069ns 0.047*
To evaluate sex-bias dispersal on a smaller geographical scale, I carried out the
same tests considering only samples from the Society Islands (Table 2.5). The same
trend of larger FST for females and larger νAIc for males were observed within this
dataset (i.e., supporting dispersal biased toward males). In this case, νAIc tests were
only significant when the four replicate samples from different islands were excluded
(Table 2.5).

Chapter Two: Insular communities of spinner dolphins.
50
2.4.8. Genetic signature of community bottleneck
Various tests based on mtDNA control region and microsatellite loci failed to detect
the signature of a recent bottleneck effect in the islands’ communities. Tajima’s and
Fu’s tests for mtDNA did not differ significantly from expected under a neutral model
of evolution for any of the data sets, except Tahiti which showed a significantly
positive Fu’s FS value (Table 2.6). Similarly, the three tests for a bottleneck using
allele frequencies of microsatellite loci showed no evidence of a recent population
decline or colonization event. No significant heterozygosity excess was found after
correcting for multiple comparisons (Table 2.6) and the distribution of allelic
frequencies did not show significant departure from a standard L-shape in the mode-
shift test, indicating no loss of rare alleles in any of the communities (results not
shown). Finally, applying the approach of Garza & Williamson (2001), observed M
values (Table 2.6) were consistent with the null distribution (p > 0.05) under the
expectation of equilibrium for all the islands and at the different θ values considered.
Table 2.6. Summary statistics of various tests to detect a recent bottleneck effect, based on mtDNA
control region and microsatellite loci. p < 0.05, *; p > 0.05, ns. The Wilcoxon test found no significant
heterozygosity excess after Bonferroni correction (pcrit = 0.008). SMM: stepwise mutation model. TPM:
two-phased model
mtDNA Microsatellites
Tajima's D Fu's F Wilcoxon test (p-value) M Ratio
SMM TPM Moorea 0.066ns 0.417ns 0.998 0.117 0.840ns Tahiti -0.820ns 5.331* 0.912 0.604 0.741ns Bora Bora -0.461ns 0.703ns 0.979 0.924 0.735ns Raiatea-Tahaa -0.283ns -1.638ns 0.849 0.396 0.796ns Huahine -0.298ns -0.542ns 0.339 0.021 0.758ns Nuku Hiva -0.110ns 1.826ns 0.515 0.032 0.729ns

Chapter Two: Insular communities of spinner dolphins.
51
2.5. Discussion
2.5.1. Demographic closure of Moorea community
The photo-identification surveys conducted at Moorea in 2002-2003 support Poole’s
(1995) previous observation that, on an intra-generational time scale, spinner
dolphins using the nearshore waters of this island form a small and relatively closed
community. The re-sightings in 2002 of five DMIs previously known as members of
the community between 1987 and 1992 (Poole 1995), coupled with Poole’s
unpublished re-sightings of these individuals in the intervening years, suggest a life-
time site fidelity for at least some individuals (life-span is not precisely known for
Gray’s spinner dolphins but is likely to be around 20-25 years old). A similar level of
site fidelity has been reported from intermittent re-sights data at Oahu, Hawaii
(Marten & Psarakos 1999), but Moorea is, to my knowledge, the only location where
individual spinner dolphins have been re-sighted regularly over such a long period of
time.
Although observations also indicate some level of social openness, notably to
dolphins from Tahiti, overall the level of interchange appears to be low. In the present
study, no evidence of permanent immigration was found, while Poole (1995)
recorded only two cases of long-term immigrants across the five years of his surveys.
Contrary to Midway Atoll (Karczmarski et al. 2005), Moorea is not geographically
isolated from any other island, Tahiti being just 17km distant (the closest island to
Midway is Kure Atoll, 96km to the east). Despite this proximity, our photo-
identification and genetic results clearly indicate that a distinct community of spinner
dolphins use the nearshore waters of Tahiti. Note that interchanges with the
neighbour community also occur in the form of temporary ‘visits’, as recorded in
August 2002.
2.5.2. Demographic community trends in the Society Archipelago
Compared to what is known at Moorea from photo-identification, demographic
information from the other islands is incomplete. However, from similarities in habitat
use, group size and behaviour among the different islands, it seems reasonable to

Chapter Two: Insular communities of spinner dolphins.
52
assume that the general demographic pattern described here (i.e., a small and
relatively closed community on an intra-generational time scale) also holds for the
other spinner dolphin communities, at least in the Society Archipelago. This pattern of
island fidelity is also supported by the re-sighting of similar DMIs on two consecutive
years at Tahiti and Raiatea. Indeed, four of the five DMIs identified at Tahiti in 2003
were re-sighted in 2004, while three of the four DMIs identified at Raiatea in 2003
were re-sighted in 2004 (Table 2.1).
Based on contrasting results from the Big Island in Hawaii (Norris et al. 1994),
Karczmarski et al. (2005) suggested that small population size and social stability at
Midway Atoll are driven by habitat variation and geographic isolation. This does not
seem entirely true in the Society Islands. Stable demography at Moorea (based on
photo-identification data) and significant genetic structure in the archipelago (see
below) indicate that small and closed communities can occur in groups of islands that
are not geographically isolated. Therefore, benefits resulting from habitat fidelity (e.g.,
social interactions, local knowledge), or ecological constraints other than geographic
isolation (e.g., competition for habitat), seem to influence the demographic closure of
insular communities.
2.5.3. Population genetic structure and sex-biased dispersal
Although island fidelity is likely to represent the norm in the Society Archipelago,
evolutionary history and current connectivity between communities would remain
unknown without the support of molecular data. The molecular analyses presented
here reveal a fine-scale genetic structure in these insular communities of spinner
dolphins. Although recent population divergence could explain low level genetic
differentiation, demographic data suggest that, for these islands, on-going gene flow
is more likely to be responsible for such a pattern.
A surprising result was the genetic isolation and low diversity at Tahiti. This difference
was evident even when compared to the neighbouring community at Moorea,
indicating low level gene flow between the two islands’ communities, particularly
female gene flow (i.e., mtDNA). This differentiation with other island samples was
also illustrated by a comparatively low level of mtDNA genetic diversity at Tahiti.

Chapter Two: Insular communities of spinner dolphins.
53
Although this genetic pattern could be explained by a recent demographic bottleneck
followed by population expansion (as suggested by a significant Fu’s FS), this
scenario is not supported by the bottleneck tests based on microsatellites. An
alternate explanation would be a fairly strict closure to immigration (at least
concerning females) driven by social and/or demographic forces. Note that the
southwest coastline of Tahiti (opposite side of the island from Moorea) was not
surveyed during this study. Therefore, the existence of another community of spinner
dolphins within this unexplored area cannot be excluded.
Although only a small number of samples were collected at Nuku Hiva (n = 8), a high
level of genetic differentiation between this community and those at all other islands
was found. Unlike the differences among the Society Islands, the differentiation of
Nuku Hiva is most likely due to the geographic isolation between the two
archipelagos (1500 km). However, the absence of phylogeographic structure
between samples and the finding of one common haplotype between both
archipelagos suggest a recent isolation or low levels of on-going gene flow.
Overall, gene flow appeared to be biased toward males, showing agreement with the
predominate mating system in mammals (Greenwood 1980), and that of other
delphinid species (Escorza-Trevino & Dizon 2000, Möller & Beheregaray 2004).
Although the degree of bias is difficult to judge, the greater effect apparent in the sex-
specific νAIc, compared to the sex-specific FST, suggests that dispersal rate is low
overall (less than 10% per generation, Goudet et al. 2002). A trend in male-biased
dispersal was also supported by the observation of three males at Raiatea
(established by genotypes matches), who were initially sampled at Huahine.
However, dispersal is not totally restricted to males, as one female was successively
sampled at Moorea and Bora Bora, and female gene flow was indicated by numerous
shared mtDNA haplotype, and low levels of mtDNA differentiation between some
island samples. Taken together, these results suggest two distinct mechanisms of
gene flow in insular communities of spinner dolphins: gene flow resulting from
overlapping home-range and temporary ‘visits’ (possibly biased toward males), and
gene flow resulting from occasional long-term immigration, by females as well as

Chapter Two: Insular communities of spinner dolphins.
54
males, perhaps travelling in groups. Males might also disperse but achieve little or no
reproductive success as immigrants. Such demographic trends could explain our field
observations and the actual genetic pattern of mitochondrial and nuclear DNA.
2.5.4. Pelagic colonisation or island metapopulation?
A striking characteristic of my results was the high level of mitochondrial genetic
diversity (as illustrated by estimates of Nef) in contrast to the relative demographic
isolation of small communities. Note that Nef estimates are subject to considerable
uncertainty due to the method used to estimate µ and θ, and must be interpreted
cautiously (Waples 2002). However, even lower values of the 95% confidence
intervals are still indicating very large Nef.
Observed levels of genetic diversity could reflect the effect of founder events, due to
recent colonisation of insular habitats. In such a case, the diversity would simply be
the signal of the historical polymorphisms contained in a large parental population,
potentially from a pelagic source, such as the Eastern Tropical Pacific. Long-term Ne
can indeed reflect, for a few generations at least, a population’s pre-bottleneck
history rather than its current demography (e.g., Storz et al. 2002). However, in the
data, no indirect evidence was found for such a colonisation scenario in the
frequencies of mtDNA haplotypes or microsatellite alleles using various tests for a
bottleneck. Furthermore, dedicated boat surveys (Gannier 2000) and aerial surveys
(Poole 1995) in the inshore and offshore waters of the Society Archipelago found no
evidence for the existence of an offshore population of spinner dolphins in this area.
Thus it appears unlikely that current connectivity with a large pelagic population can
explain the high genetic diversity in spinner dolphins of the Society Islands.
Instead, I consider that current levels of mitochondrial diversity in insular communities
of the Society Archipelago are more likely the result of a metapopulation dynamic. In
the classical metapopulation model, the environment consists of spatially isolated
patches of suitable habitat positioned within a continuum of unsuitable habitat that
individuals can traverse but within which cannot breed (Levins 1969). The
demographic pattern described here and the significant genetic differences between
these insular communities suggest that spinner dolphins from the Society
Chapter Two: Insular communities of spinner dolphins.
55
Archipelago, follow this model. In a metapopulation dynamic, the observed
discrepancy between the high level of genetic diversity and census size is not
unexpected. Indeed, it has been shown that long-term Ne often exceeds the
instantaneous census number of populations that are subdivided into a network of
socially defined breeding groups (e.g., Sugg et al. 1996). Moreover, with sufficient
dispersal between patches, Ne of subpopulations can approach Ne of the whole
metapopulation (Hedrick & Gilpin 1997). My results support this pattern, with Nef
estimated for the Society Archipelago islands being comparable to Nef estimated for
single islands.
Note that even under a metapopulation dynamic, my estimates of Nef are so large
that they suggest an overall population that must extend beyond the boundaries of
the Society Archipelago. Several evolutionary histories could explain this pattern: (1)
spinner dolphins are commonly distributed throughout the insular habitats of the
tropical and sub-tropical Pacific (SPWRC 2004), which include more than 20,000
islands, more or less remote from one another. The extent of this habitat could thus
support a very large metapopulation (following the model described here for the
Society Archipelago) and would explain the current high levels of genetic diversity.
However, the results here suggest that geographic distance can represent a limit to
gene flow. (2) Current gene flow occurs between insular spinner dolphins and large
pelagic populations found in the ETP. The distributional limit of the whitebelly spinner
dolphin is fairly close to the Marquesas Archipelago (Figure 2.1a) and could
represent a zone of interchange with the insular spinner dolphins of the Central and
West Pacific. In this case, the metapopulation would follow a mainland-island model
(Harrison 1991), where the mainland is represented by pelagic populations. In a
worldwide study of spinner dolphin genetic diversity, Galver (2002) found no obvious
phylogeographic structuring in mtDNA haplotypes, even between sub-species of
spinner dolphins (although no samples from French Polynesia were available in this
study). Current gene flow between sub-species is thus a possibility. Finally (3),
Galver (2002) suggested a recent worldwide demographic expansion of spinner
dolphins to explain a lack of phylogeographic structure. Such a global event could
also have influenced the current genetic diversity found in the population, although
Chapter Two: Insular communities of spinner dolphins.
56
such diversity could not persist in the small island communities without additional
influence.
By combining a demographic approach with molecular tools, this study provides
valuable insights into the structure and dynamics of insular spinner dolphins’
communities. This work showed that these communities are based on a complex
equilibrium between isolation and interchange. While social stability and site fidelity
represent strong components, genetic diversity reveals that communities are still
evolutionary connected through gene flow. However, further studies covering a larger
geographical scale are still needed to clarify the extent of the metapopulation and the
influence of historical events as well as proximate social reproductive barriers on
current patterns of genetic diversity. From a conservation perspective, the complex
population dynamic described here shows that geographically isolated communities
of insular spinner dolphins are likely to represent separate management units on an
ecological time scale. Considering the regular use of inshore habitat by this species,
a detailed assessment of the degree of connectivity (intra- and inter-generation) of
communities that are particularly exposed to human activity is recommended in order
to ensure proper management for their long-term viability and equilibrium of the
metapopulation dynamic.
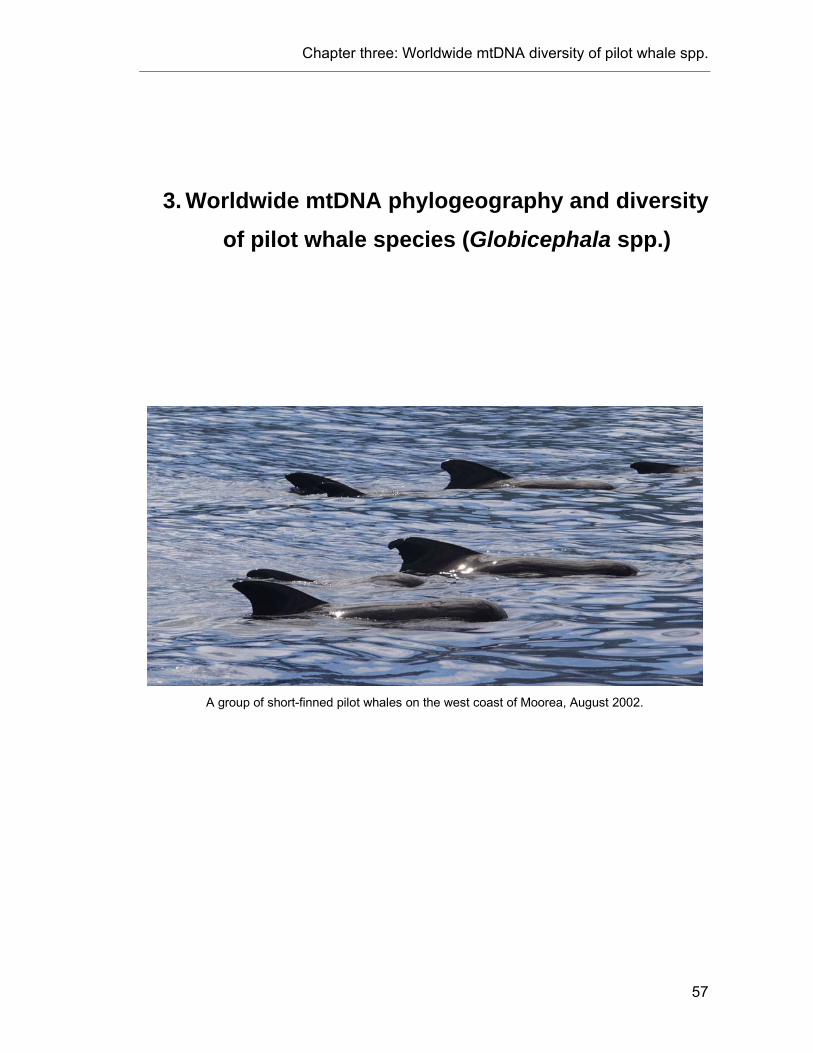
Chapter three: Worldwide mtDNA diversity of pilot whale spp.
57
3. Worldwide mtDNA phylogeography and diversity of pilot whale species (Globicephala spp.)
A group of short-finned pilot whales on the west coast of Moorea, August 2002.

Chapter three: Worldwide mtDNA diversity of pilot whale spp.
58
3.1. Abstract
Pilot whales (Globicephala melas and G. macrorhynchus) provide an interesting
example of recent complex evolutionary history in a pelagic environment. Both
species have very wide ranges but are largely parapatric: G. melas (long-finned pilot
whale) is anti-tropical except in the North Pacific, while G. macrorhynchus (short-
finned pilot whale) has a circum-global distribution, mainly in the tropics and
subtropics. To investigate pilot whale evolution and biogeography, we analysed
worldwide population structure for the mitochondrial (mt) DNA control region (335 bp)
using newly generated and previously published and unpublished sequences from a
variety of sources (long-finned pilot whale = 434; short-finned pilot whale = 134),
including strandings in New Zealand and surveys of whalemeat markets in Japan
and Korea. Both species had very low worldwide mtDNA diversity compared to other
widespread cetaceans (long-finned pilot whale, π = 0.31%; short-finned pilot whale,
π = 0.87%). Six fixed diagnostic nucleotide substitutions (synapomorphies)
distinguish these sister taxa. However, phylogenetic reconstruction suggested that
the short-finned pilot whale was paraphyletic with respect to long-finned pilot whale; a
result which could be due to incomplete lineage sorting. Long-finned pilot whale
showed strong differentiation between ocean basins (FST = 0.468, p < 0.001), but the
presence of shared haplotypes between the North Atlantic “edwardii” and Southern
Ocean “melas” forms suggests that current subspecies designations may require
revision. Overall, long-finned pilot whale phylogeography seems best explained by a
recent worldwide demographic expansion. For short-finned pilot whale, Japanese
waters appear to represent an important centre of diversity. Assuming locations of
purchases generally reflected locations of hunting, analyses strongly support the
genetic distinctiveness of the “Northern” and “Southern” forms previously described
from this region (FST = 0.413, p < 0.001). Based on results from a worldwide
haplotype network, a third population also occurs in these waters, products from
which are also sold on the Japanese market. Overall, higher diversity observed in
south Japan and phylogenetic evidence suggests that the “Southern” form represents
an ancestral, but now genetically isolated population.

Chapter three: Worldwide mtDNA diversity of pilot whale spp.
59
3.2. Introduction
Genetic boundaries among populations in the marine environment are particularly
difficult to describe, as the physical and biological factors that determine gene flow
patterns are often poorly understood (Palumbi et al. 1997). Although the high
dispersal potential of marine species can result in low genetic differentiation across
large areas (Hellberg 1994, Graves 1996), there are also many examples of fine-
scale population structure (Palumbi 1994). Among cetaceans, limits to gene flow are
complex and thought to be the result of behavioural specialisations for resources,
social organisation, and historical environmental changes (Hoelzel 1998). However,
because studies of free-swimming cetaceans are challenging (particularly for pelagic
species), the demography and evolutionary history of most species remains unclear
or unknown. In the family Delphinidae (including pilot whales), these issues are
further obscured by the relatively recent evolution of this group. The Delphinidae are
thought to have arisen about 11 million years ago (Barnes 1985), and subsequently
have undergone a rapid radiation, such that there has been comparatively little time
for the evolution and fixation of diagnostic morphological and genetic characters
among species.
The two recognised species of the genus Globicephala provide an interesting
example of a recent and probably complex evolutionary history. The long-finned pilot
whale (G. melas, Traill 1809) and the short-finned pilot whale (G. macrorhynchus,
Gray 1846) are widely-distributed and abundant species of large dolphins (up to
seven meters for the males) (Figure 3.1). Although their similar appearance and
morphology has resulted in some confusion, a number of features, in particular the
shape of the skull, validate the distinctiveness of the two species (van Bree 1971).
Phylogenetic analyses of mitochondrial DNA (mtDNA) cytochrome b sequences also
supported the distinctiveness of these species (LeDuc et al. 1999, May-Collado &
Agnarsson 2006), although only 1 – 2 individuals were used to represent each taxon
in these studies. The two species are wide ranging but also largely parapatric. There
are no global estimates of abundance for either species, but several regional
estimates are available (see Olson & Reilly 2002 for a review), suggesting that they

Chapter three: Worldwide mtDNA diversity of pilot whale spp.
60
are relatively abundant worldwide.
Figure 3.1. Lateral view of a female short-finned pilot whale (Globicephala macrorhynchus) (top) and
a female long-finned pilot whale (Globicephala melas) (bottom). Drawings by P. Folkens. Location of
the main morphological differences between the two species are indicated by arrows: the skull shape
(s), the number of teeth (t) and the length of the flippers (f).
Pilot whales are amongst the most gregarious of cetaceans, forming groups of up to
several hundred individuals. Their social system is thought to be matrilineal, with
groups comprising of several generations of maternally-related individuals (Amos et
al. 1993, Heimlich-Boran 1993). They are well-known for their highly cohesive
behaviour, which allows them to be herded by a small number of boats and exploited
by “drive-kill” fisheries. This strong social cohesion is also thought to be the reason
behind their propensity for mass stranding. As with other matrilineal odontocetes
(toothed whales), such as the killer whale and the sperm whale, Globicephala spp.
seem to have low genetic diversity at the maternally-inherited mtDNA (Siemann
1994, Whitehead 1998). The reasons for this pattern of low diversity remain subject
to debate; some authors have argued in favour of demographic processes
influencing the mtDNA genome (e.g., Mesnick et al. 1999), while Whitehead (1998,
2005) proposed a form of “cultural hitchhiking”, where mtDNA diversity is reduced by
parallel selection on maternally-transmitted cultural traits. A genetic bottleneck has
also been suggested as potential factor in reducing the worldwide diversity of the
sperm whale and killer whale (Lyrholm et al. 1996, Hoelzel et al. 2002b). Such a
scenario could apply to pilot whales but until now their mtDNA diversity has only
been investigated in the North Atlantic (Siemann 1994).

Chapter three: Worldwide mtDNA diversity of pilot whale spp.
61
Figure 3.2. Global distribution of Globicephala spp., with number and source locations of sequences
used in this study (n = full dataset/corrected dataset, see section 3.3.4 for explanation). Stripped area
shows the range of the long-finned pilot whale (Globicephala melas), while dark grey shows the range
of the short-finned pilot whale (G. macrorhynchus). The black area is the range of overlapping
distribution between the two species.
Long-finned pilot whales (G. melas) inhabit the cold temperate waters of the North
Atlantic and the Southern Hemisphere, such that two widely-separated populations
are apparently isolated by equatorial waters (Figure 3.2). Based on some differences
in colour pattern, populations in the Northern Atlantic and Southern Hemispheres
were described as different species by Rayner (1939), but Davies (1960) reduced
them to sub-species rank: G. melas melas in the North Atlantic and G. melas
edwardii in the Southern Hemisphere. Davies (1960) argued that the last contact
between the two current subspecies would have occurred about 10,000 years ago
during the last Pleistocene glaciation, when equatorial waters were substantially
cooler. No study has yet explored the genetic relationship between the North Atlantic
and Southern Ocean subspecies of long-finned pilot whales. Although long-finned
pilot whales are now absent in the North Pacific, skulls identified as this species have
also been recovered at several archaeological sites in Japan (dating from the 8th to
Chapter three: Worldwide mtDNA diversity of pilot whale spp.
62
12th centuries, Kasuya 1975) and Alaska (dating from the 3,500 to 2,500 BP, Frey et
al. 2005), suggesting a recent extinction in this ocean.
Short-finned pilot whales (G. macrorhynchus) range across the tropical and warm-
temperate waters of the Atlantic, Pacific and Indian Ocean (Figure 3.2). Off the coast
of Japan, a “Southern” form and a “Northern” form of short-finned pilot whales have
been described on the basis of morphological, genetic and ecological differences
(Kasuya 1986, Kasuya et al. 1988, Wada 1988, Kage 1999, Figure 3.3). The
Northern form appears to be larger (Kasuya 1986), possibly an adaptation to colder
waters, and has a more distinct saddle mark, and rounder contour to the head
(Kasuya et al. 1988). The geographical ranges of the two forms occasionally overlap
(seasonally), but mixed groups are thought to be very rare (Kasuya et al. 1988). A
similar segregation of northern and southern forms might exists among short-finned
pilot whales in the eastern North Pacific, with the larger form again found in the
cooler temperate waters (Polisini 1980).
Here, we use sequences of the mtDNA control region to examine genetic population
structure of long-finned (n = 434) and short-finned (n = 134) pilot whales worldwide.
The aim was to provide new information on the evolutionary history of this genus by
investigating the phylogenetic relationships and inter- and intra-species genetic
diversity. Studies of cetacean phylogeography often assume that the species under
consideration represent independent lineages. However, it has been shown that
paraphyly and polyphyly of mtDNA lineages is not uncommon in the family
Delphinidae (LeDuc et al. 1999, Reeves et al. 2004). Therefore, among closely
related taxa, it is important to test monophyly through comprehensive surveys of
population-level sequence variation. Here we test the hypothesis of species-level
monophyly of mtDNA lineages for these taxa. Diversity and phylogeography of both
species were then investigated, with particular focus on two issues: (1) for long-
finned pilot whales - the level of genetic diversity and relationships between the two
subspecies; and, (2) for short-finned pilot whales - the evolutionary history of
Northern and Southern forms around Japan in relation to those in other regions.

Chapter three: Worldwide mtDNA diversity of pilot whale spp.
63
Table 3.1. Sample data for all pilot whale specimens used in this study.
Code Type of
sampling event
# individuals per event
Collection Date* Location* Haplotypes¥ Source
Long-finned pilot whale (Globicephala melas) New Zealand Glo001-004 and Glo023-047 MS 27 07 Dec 1993 Long Bay Auckland O(13), P(14) (1)
Glo005-007 MS 3 21 Oct 1995 Cape Palliser P(3) (1) Glo008 IS 1 26 Oct 1995 Muriwai P (1) Glo015 IS 1 22 Nov 1996 Rumati P (1) Glo016 IS 1 30 Oct 1997 Kawakawa Bay P (1) Glo017 IS 1 ? ? R (1) Glo018 IS 1 1997 Opotiki P (1) Glo019 IS 1 28 Oct 1998 Hokitika P (1) Glo020-022 MS 3 30 Nov 1998 Chatham Island P(3) (1) Glo049 IS 1 18 Nov 1998 Bay of Penty P (1) Glo050 IS 1 22 July 1999 Sandfly Bay, Otago P (1) Glo051-061 MS 11 24 Oct 1999 Pitt Island P(10), T(1) (1) Glo062 IS 1 ? New Plymouth P (1) Glo063 IS 1 22 Apr 1998 New Plymouth R (1) Glo064 IS 1 30 nov 1999 Westland P (1) Glo065 IS 1 30 nov 2000 Chatham Island Q (1)
Glo066-085 MS 20 21-22 Dec 2000 Stewart Island P(19), U(1) (1)
Glo086 IS 1 11 Nov 2002 Jackson Bay U (1) Glo087-089 MS 3 17-18 Oct 2002 Sponge Bay, Gisborne P(3) (1) Glo090-213 MS 124 08 Jan 2003 Stewart Island P(124) (1) Glo214 IS 1 27 Dec 2002 Haast, Jackson Bay P (1) Glo215-217 MS 3 21 Dec 2003 Sponge Bay, Gisborne S(3) (1) Glo218 IS 1 Jan 2004 Manaia P (1) Glo219 IS 1 29 May 2004 Poutawa Stream Mouth P (1) Glo220-230 MS 11 04 Jul 2004 Mahurangi Peninsula P(11) (1) Glo231 IS 1 04 Jul 2004 Mahia, Opoutama P (1) Glo234-284 MS 51 29 Nov 2004 Opoutere Beach O(1), P(50) (1) Glo285 IS 1 18 Dec 2004 Muriwai Beach P (1)
Glo286-318 MS 33 28-30 Dec 1992 Golden Bay P(15), Q(2),
U(15), V(1) (1)
Glo320-330 MS 11 09 Nov 1993 Golden Bay P(11) (1) Glo333-337 MS 5 14 Feb 1995 Otago, Waianakarua P(5) (1) Glo338-342 MS 5 21 Oct 1995 Wellington P(5) (1) Glo343-348 MS 6 15 Feb 1996 Golden Bay P(6) (1) Glo349-351 MS 3 17 Nov 1993 Golden Bay P(3) (1) Australia 11b IS 1 14 Sep 2002 Sisters Beach - Rocky Cape Q (2) 20c-24c MS 5 28 Nov 2004 King Island. Q(2), R(2), W(1) (2) 29c-33c MS 5 19 Nov 2003 Point Hibbs, West Coast Q(5) (2) 48a-66a MS 16 29 Nov 2004 Darlington, Maria Island P(15), U(1) (2) North Atlantic Siemann01-02 BC 2 ? Western North Atlantic S(2) (3) Siemann03-06 BC 4 1989 Western North Atlantic S(4) (3) Siemann07-09 BC 3 09 Mar 1990 3932N/7246W S(3) (3) Siemann10 BC 1 05 Apr 1990 3900N/7300W S (3) Siemann11-12 BC 2 06 Apr 1990 3954N/7157W S(2) (3) Siemann13-15 BC 3 16 Apr 1990 4014N/7055W S(3) (3) Siemann16-21 BC 6 Apr 1990 4010N/7001W S(6) (3) Siemann22-24 BC 3 1992 Western North Atlantic S(3) (3) Siemann25-37 MS 13 11 Dec 1990 Hyannis, USA S(13) (3) Siemann38-42 MS 5 Sep 1991 Dennis/Sandwich/Truro,USA S(5) (3) Siemann43 IS 1 Sep 1991 Wellfleet/Brewster, USA S (3) Siemann44-48 MS 5 Sep 1991 Eastham, USA S(5) (3) Siemann49-51 MS 3 07 Jul 1991 Sable Island, Nova Scotia X(3) (3) Siemann52 IS 1 ? Gros Morin, Newfoundland P (3) Siemann53-54 MS 2 1976 The Wash, eastern England S(2) (3) Siemann55 IS 1 1990 Liverpool, England S (3) Siemann56-59 MS 4 1992 Western Scotland S(4) (3) Dizon01 ? 1 ? Faeroe Islands S (4) Dizon02-11 ? 10 ? Faeroe Islands P (10) (4)
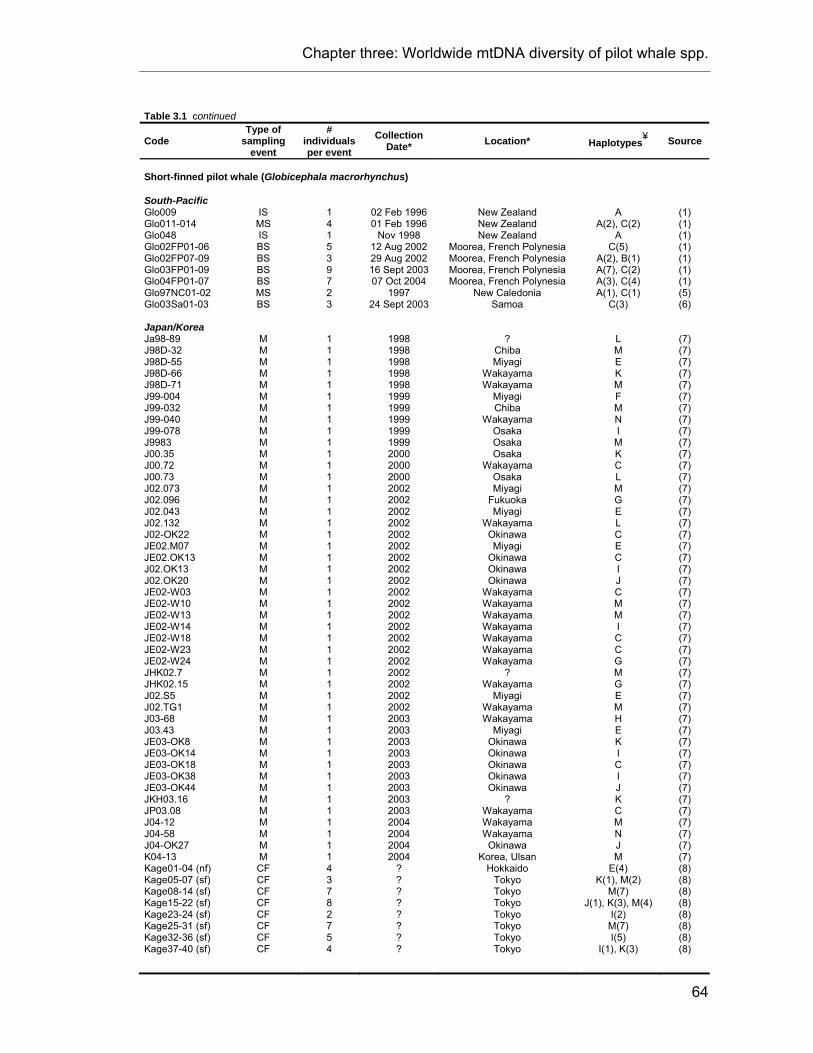
Chapter three: Worldwide mtDNA diversity of pilot whale spp.
64
Table 3.1 continued
Code Type of
sampling event
# individuals per event
Collection Date* Location* Haplotypes
¥ Source
Short-finned pilot whale (Globicephala macrorhynchus) South-Pacific Glo009 IS 1 02 Feb 1996 New Zealand A (1) Glo011-014 MS 4 01 Feb 1996 New Zealand A(2), C(2) (1) Glo048 IS 1 Nov 1998 New Zealand A (1) Glo02FP01-06 BS 5 12 Aug 2002 Moorea, French Polynesia C(5) (1) Glo02FP07-09 BS 3 29 Aug 2002 Moorea, French Polynesia A(2), B(1) (1) Glo03FP01-09 BS 9 16 Sept 2003 Moorea, French Polynesia A(7), C(2) (1) Glo04FP01-07 BS 7 07 Oct 2004 Moorea, French Polynesia A(3), C(4) (1) Glo97NC01-02 MS 2 1997 New Caledonia A(1), C(1) (5) Glo03Sa01-03 BS 3 24 Sept 2003 Samoa C(3) (6) Japan/Korea Ja98-89 M 1 1998 ? L (7) J98D-32 M 1 1998 Chiba M (7) J98D-55 M 1 1998 Miyagi E (7) J98D-66 M 1 1998 Wakayama K (7) J98D-71 M 1 1998 Wakayama M (7) J99-004 M 1 1999 Miyagi F (7) J99-032 M 1 1999 Chiba M (7) J99-040 M 1 1999 Wakayama N (7) J99-078 M 1 1999 Osaka I (7) J9983 M 1 1999 Osaka M (7) J00.35 M 1 2000 Osaka K (7) J00.72 M 1 2000 Wakayama C (7) J00.73 M 1 2000 Osaka L (7) J02.073 M 1 2002 Miyagi M (7) J02.096 M 1 2002 Fukuoka G (7) J02.043 M 1 2002 Miyagi E (7) J02.132 M 1 2002 Wakayama L (7) J02-OK22 M 1 2002 Okinawa C (7) JE02.M07 M 1 2002 Miyagi E (7) JE02.OK13 M 1 2002 Okinawa C (7) J02.OK13 M 1 2002 Okinawa I (7) J02.OK20 M 1 2002 Okinawa J (7) JE02-W03 M 1 2002 Wakayama C (7) JE02-W10 M 1 2002 Wakayama M (7) JE02-W13 M 1 2002 Wakayama M (7) JE02-W14 M 1 2002 Wakayama I (7) JE02-W18 M 1 2002 Wakayama C (7) JE02-W23 M 1 2002 Wakayama C (7) JE02-W24 M 1 2002 Wakayama G (7) JHK02.7 M 1 2002 ? M (7) JHK02.15 M 1 2002 Wakayama G (7) J02.S5 M 1 2002 Miyagi E (7) J02.TG1 M 1 2002 Wakayama M (7) J03-68 M 1 2003 Wakayama H (7) J03.43 M 1 2003 Miyagi E (7) JE03-OK8 M 1 2003 Okinawa K (7) JE03-OK14 M 1 2003 Okinawa I (7) JE03-OK18 M 1 2003 Okinawa C (7) JE03-OK38 M 1 2003 Okinawa I (7) JE03-OK44 M 1 2003 Okinawa J (7) JKH03.16 M 1 2003 ? K (7) JP03.08 M 1 2003 Wakayama C (7) J04-12 M 1 2004 Wakayama M (7) J04-58 M 1 2004 Wakayama N (7) J04-OK27 M 1 2004 Okinawa J (7) K04-13 M 1 2004 Korea, Ulsan M (7) Kage01-04 (nf) CF 4 ? Hokkaido E(4) (8) Kage05-07 (sf) CF 3 ? Tokyo K(1), M(2) (8) Kage08-14 (sf) CF 7 ? Tokyo M(7) (8) Kage15-22 (sf) CF 8 ? Tokyo J(1), K(3), M(4) (8) Kage23-24 (sf) CF 2 ? Tokyo I(2) (8) Kage25-31 (sf) CF 7 ? Tokyo M(7) (8) Kage32-36 (sf) CF 5 ? Tokyo I(5) (8) Kage37-40 (sf) CF 4 ? Tokyo I(1), K(3) (8)

Chapter three: Worldwide mtDNA diversity of pilot whale spp.
65
Table 3.1 continued
Code Type of
sampling event
# individuals per event
Collection Date* Location* Haplotypes
¥ Source
eastern North Pacific Siemann60 BC 1 27 Sep 1990 East Tropical Pacific E (3) Siemann61 BC 1 28 Jul 1992 Southern California A (3) Atlantic NEPST637 IS 1 Porto Rico A (9) Siemann62 IS 1 07 Apr 1978 North Carolina, USA D (3) Siemann63 IS 1 12 Apr 1978 North Carolina, USA D (3) Siemann64 IS 1 18 May 1983 North Carolina, USA D (3) Siemann65 IS 1 11 Nov 1991 Delaware, USA D (3) Siemann66-69 BC 4 8 Nov 1990 Western North Atlantic D(4) (3) Siemann70 BC 1 17 Nov 1990 Western North Atlantic D (3) Siemann71-72 BC 2 18 Oct 1992 Western North Atlantic D(2) (3)
‡ Mass strandings with (nf) and (sf) refer to “Northern” form and “Southern” form of Japanese short-
fined pilot whale, respectively, as reported by Kage (1999). ¥ Numbers in brackets in the haplotype
column indicate the number of individuals sharing the haplotype within the sampling event. * For
market products, collection date and location refer to the year and prefecture where the products were
purchased. Codes for sampling events: MS (Mass Stranding), IS (Individual Stranding), BC (By-
Catch), BS (Biopsy Sample), MP (‘whale-meat’ Market Product) and CF (Coastal Fisheries).
Sample sources:
(1) University of Auckland, New Zealand cetacean molecular archive, and courtesy Department of Conservation.
(2) Department of Primaries Industries and Waters, Tasmania, Australia.
(3) Siemann (1994): GenBank accession numbers U20921 to U20923 (short-finned pilot whale), and U20926 to U20928 (long-finned pilot whale).
(4) Dizon et al. (1993), as reported in Siemann (1994)
(5) Claire Garrigue, Opération Cétacés, New Caledonia.
(6) Olavarría et al. (2003).
(7) University of Auckland whale meat market surveys.
(8) Kage (1999), PhD thesis.
(9) Red Caribeña de Varamientos, Caribbean Stranding Network.
3.3. Materials & Methods
3.3.1. Sample collection and additional sequences
Long-finned pilot whales - A total of 364 tissue samples of long-finned pilot whales
were collected from 19 single and 19 mass strandings around New Zealand and
Tasmania, Australia (Table 3.1). In addition, sequences of three mtDNA control
region haplotypes were available from GenBank, representing a total of 70
individuals sampled in the North Atlantic. The relative numbers of individuals with
Chapter three: Worldwide mtDNA diversity of pilot whale spp.
66
each haplotype were deduced from the haplotype frequencies reported in Siemann
(1994) (Table 3.1). Siemann’s (1994) samples came from stranding events and
incidental fisheries takes (by-catch).
Short-finned pilot whales – A total of 36 tissue samples of short-finned pilot whales
were collected in the South Pacific (New Zealand, n = 6; French Polynesia, n = 24;
New Caledonia, n = 2; and Samoa, n = 3) and in the North Atlantic (Puerto Rico, n =
1); nine of these samples came from stranded animals (three single and two mass
strandings), while 27 samples were collected from five groups at sea using a small
stainless-steel biopsy dart fired from a modified veterinary capture rifle equipped with
a variable pressure valve (Krützen et al. 2002, Table 3.1). Three additional haplotype
sequences of short-finned pilot whale mtDNA control regions were available from
GenBank, representing 13 individuals as reported in Siemann (1994) (see Table 3.1).
These samples came from strandings and by-catch.
Sequences of short-finned pilot whales from Japan and Korea were obtained from
two distinct sources: the study by Kage (1999) based on data from the Japanese
coastal drive-kill fisheries; and “whale-meat” products purchased in the commercial
markets of Japan and Korea as reported in Dalebout et al. (2004b) and/or archived
by C. S. Baker at the University of Auckland (Table 3.1). Sequences from Kage
(1999) represent a total of 40 individuals from Japanese coastal hunts. These
sequences were reported to belong to either the “Northern” (n = 4) or “Southern” form
(n = 36) of the Japanese short-finned pilot whale (Table 3.1). Sequences reported in
Dalebout et al. (2004b) and/or archived by C. S. Baker represent a total of 45
individuals from Japan, plus one individual from South Korea. Although no
information was available on what regional form these ‘whale-meat’ market products
represented, products from small cetaceans are generally assumed to originate from
coastal hunting or by-catch near the prefecture of sale (Endo et al. 2005). This
information was available for all market products but three (Table 3.1, Figure 3.3).
The final sample sizes were 434 long-finned and 134 short-finned pilot whales
sequences.
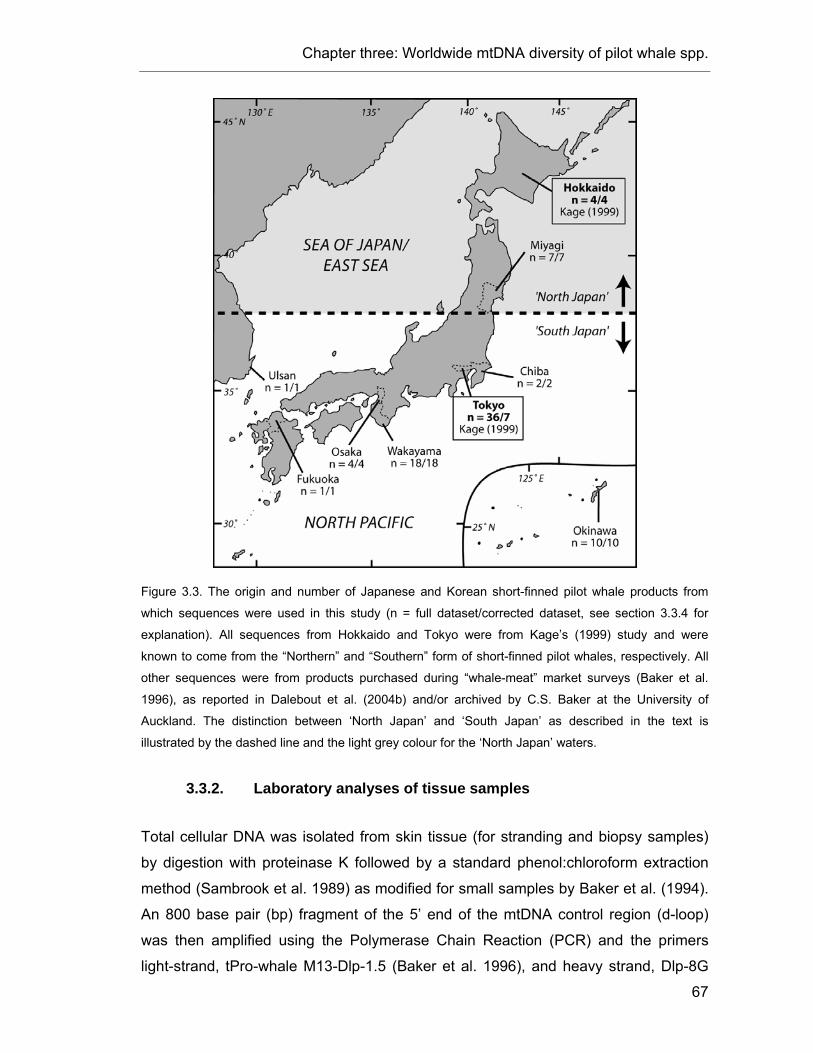
Chapter three: Worldwide mtDNA diversity of pilot whale spp.
67
Figure 3.3. The origin and number of Japanese and Korean short-finned pilot whale products from
which sequences were used in this study (n = full dataset/corrected dataset, see section 3.3.4 for
explanation). All sequences from Hokkaido and Tokyo were from Kage’s (1999) study and were
known to come from the “Northern” and “Southern” form of short-finned pilot whales, respectively. All
other sequences were from products purchased during “whale-meat” market surveys (Baker et al.
1996), as reported in Dalebout et al. (2004b) and/or archived by C.S. Baker at the University of
Auckland. The distinction between ‘North Japan’ and ‘South Japan’ as described in the text is
illustrated by the dashed line and the light grey colour for the ‘North Japan’ waters.
3.3.2. Laboratory analyses of tissue samples
Total cellular DNA was isolated from skin tissue (for stranding and biopsy samples)
by digestion with proteinase K followed by a standard phenol:chloroform extraction
method (Sambrook et al. 1989) as modified for small samples by Baker et al. (1994).
An 800 base pair (bp) fragment of the 5’ end of the mtDNA control region (d-loop)
was then amplified using the Polymerase Chain Reaction (PCR) and the primers
light-strand, tPro-whale M13-Dlp-1.5 (Baker et al. 1996), and heavy strand, Dlp-8G
Chapter three: Worldwide mtDNA diversity of pilot whale spp.
68
(designed by G. Lento as reported in Dalebout et al. 2005). Primer sequences are
reported in Chapter 2, section 2.3.4. All amplification reactions were carried out in a
total volume of 20 µL with 1 x Ampli-Taq buffer, 2.5 mM MgCl2, 0.4 µM of each
primer, 0.2 mM dNTPs and 0.5 U of Ampli-Taq® DNA polymerase. The PCR
temperature profile was as follows: a preliminary denaturing period of 2 min at 94°C
followed by 35 cycles of denaturation for 30 sec at 94°C, primer annealing for 45 sec
at 55°C and polymerase extension for 40 sec at 72°C. A final extension period of 10
min at 72°C was included at the end of the cycle. PCR products were purified for
sequencing with ExoSAP-IT (USB) and sequenced in both directions with BigDye™
terminator chemistry v.3.1 on an ABI3100 DNA sequencer (Applied Biosystems Inc.).
New sequences and previously published or reported sequences were aligned using
SequencherTM v. 4.1.2 (Genes Codes Co.) and edited manually. These were trimmed
to a consensus length of 345 bp. Variable sites and unique haplotypes were
identified using MacClade v. 4.0 (Maddison & Maddison 2000).
3.3.3. Phylogenetic reconstruction
The phylogenetic relationship of the mtDNA haplotypes was reconstructed using
neighbour joining (NJ), maximum-parsimony (MP), and maximum likelihood (ML)
methods, as implemented in PAUP* v. 4.0b10 (Swofford 2000), and Bayesian
analyses (BA), as implemented in MrBayes v. 3.1.2 (Huelsenbeck & Ronquist 2001,
Ronquist & Huelsenbeck 2003). Following the recommendations of Nei & Kumar
(2000), a simple p-distance (or uncorrected ‘p’) model of nucleotide substitution was
used for the NJ reconstruction, considering the low number of nucleotide
substitutions per site (< 0.05). The heuristic search conditions for MP used starting
trees obtained by stepwise addition with 10 random sequence addition replicates and
tree-bisection-reconnection (TBR) branch swapping. For ML, heuristic search
conditions were similar, and the model of sequence evolution recommended by
Modeltest v. 3.7 (Posada & Crandall 1998) was used (HKY+G, with estimated
nucleotide frequencies A = 0.3102, C = 0.2193, G = 0.1050, T = 0.3655,
transition/transversion ratio = 14.8107, and gamma shape parameter G = 0.0157).
The BA was also run based on an HKY+G model; that is, with two substitution types
(“nst” = 2), base frequencies set to the empirically observed values (“basefreq” =

Chapter three: Worldwide mtDNA diversity of pilot whale spp.
69
empirical), and rate variation across sites modelled using a gamma distribution
(“rates” = gamma). Further, six chains were used for phylogeny estimation. Analysis
was started with a random tree, and was run for 2,000,000 generations (every
1,000th tree was sampled). Using the ‘sumt’ command of MrBayes, the initial 5,000
trees were discarded as burn-in. Homologous sequences of one or two closely
related species, melon-headed dolphin (Peponocephala electra) and/or Risso’s
dolphin (Grampus griseus), were used as outgroups. The robustness of phylogenetic
groupings was assessed by bootstrap re-sampling (replicates: NJ-5,000; MP-1,000;
ML-200) and, for the BA, using the Bayesian posterior probabilities obtained from the
50% majority-rule consensus of all trees sampled after trees from the initial burn-in
stage had been removed. Clades with bootstrap values > 70% were considered
robust (Hillis & Bull 1993).
3.3.4. Geographical areas and adjusted sampling
To investigate phylogeographic structure, the specimens from each species were
grouped in different geographical units. Three units were considered for long-finned
pilot whales: North Atlantic (n = 70), Tasmania (n = 27) and New Zealand (n = 337);
and four areas were considered for short-finned pilot whales: Japan/Korea (n = 85),
South Pacific (n = 35), North-East Pacific (n = 2) and Atlantic (n = 12) (Figure 3.2).
For subsequent analyses, some of these areas were grouped together, subdivided
further (Japan/Korea) or excluded, depending on the question addressed.
Given the assumed matrilineal social system of pilot whales (Amos et al. 1993,
however see Chapter 4), animals in the same mass stranding event or forming part
of the same group at sea (represented here by samples from by-catch or biopsies)
are likely to have a close maternal relationship. In order to avoid a bias towards
related individuals, only one representative of each unique matriline (i.e., of each
mtDNA haplotype) was selected per ‘sampling event’, where a sampling event was
considered to be either: a single stranding, a mass stranding, a by-catch event (all
animals caught in the same area, over a short period of time), a market sampling
event (all samples purchased on one day or consecutive days in the same
prefecture) or biopsy sampling from a group at sea (Table 3.1, Figure 3.2). Note that
the use of such an “adjusted dataset” greatly reduces the sample size (long-finned

Chapter three: Worldwide mtDNA diversity of pilot whale spp.
70
pilot whales, n = 66, short-finned pilot whales, n = 83). As a consequence, it is likely
to be highly conservative, and could potentially result in a bias in the opposite
direction (due to exclusion of non-kin individuals sharing the same common
haplotype by chance), and potential overestimation of diversity and underestimation
of genetic structure. For comparison, some analyses were also run using the full
dataset (results are presented in Appendix 4).
3.3.5. Genetic diversity and population structure
Standard indices of genetic variation, including nucleotide diversity (π) and haplotype
diversity (h), were calculated for each species and for each geographic unit, using
Arlequin v. 3.01 (Excoffier et al. 2005).
To test for genetic differentiation between geographic units, analyses of molecular
variance (AMOVA) were conducted independently for each species, using FST and
ΦST as implemented in Arlequin (see Chapter 2 for details on FST and ΦST). Statistical
significance was tested over 20,000 permutations of the data. For long-finned pilot
whales, the analysis was conducted by considering the three geographical units
described in the section above. For short-finned pilot whales, the AMOVA was
conducted by considering samples from South Pacific, Atlantic and Japan/Korea; the
samples from eastern North Pacific were not considered here because of the small
sample size (n = 2). The samples from Japan/Korea were further sub-divided in two
distinct sub-units, in order to address the question of genetic differentiation between
the “Northern” and “Southern” form of Japanese short-finned pilot whales (as
described in Section 3.2). However, since there was no information on the form from
which the market products originated, samples were allocated to their sub-unit based
on the prefectures of sale (for “whale-meat” market samples) and prefecture of
collection (for Kage’s (1999) samples). To avoid confusion with the “Northern” form
and “Southern” form as identified from morphology, here the two sub-units were
referred to as ‘North Japan’ and ‘South Japan’. ‘North Japan’ encompassed samples
from the prefectures of Miyagi and Hokkaido, while the ‘South Japan’ encompassed
samples from the prefectures south of Miyagi; i.e., the prefectures of Chiba, Tokyo,
Wakayama, Osaka, Fukuoka, Okinawa, as well as the sample from Ulsan, South
Korea (Figure 3.3). This boundary between ‘North Japan’ and ‘South Japan’ was
Chapter three: Worldwide mtDNA diversity of pilot whale spp.
71
determined by considering the distributions of the “Northern” and “Southern” forms of
Japanese pilot whales described by Kasuya et al. (1988). As these distributions are
known to overlap depending on the seasons (Kasuya et al. 1988), the categorisation
of the prefectures is probably not a completely accurate representation of the two
forms. However, this overlap is sufficiently small to anticipate that the effects of mis-
categorisation should be small. The three market products with unknown prefecture
of origin were not included in the analyses segregating ‘North Japan’ and ‘South
Japan’ (Table 3.1).
3.3.6. Demographic history
To investigate the demographic history of the two species, departure from mutation-
drift equilibrium was tested within each area by estimating the D values of Tajima
(1989b) and the FS values of Fu (1997). In addition to providing a test of neutrality for
the locus under investigation, these statistics can also detect the occurrence of
particular demographic events, such as a population expansion or a recent
bottleneck event (Rand 1996, Fu 1997, see Chapter 2 for details on these methods).
Their significance was inferred by randomisation (10,000 steps) using a coalescent
simulation algorithm (Hudson 1990).
Within-species phylogeography was further inferred using haplotype network
reconstruction. Here, two different methods of reconstruction were used to assure
consistency between algorithms (Cassens et al. 2003): the median-joining algorithm
(MJ) implemented in the program Network v. 4.2.0.0 (Bandelt et al. 1999), and
statistical parsimony algorithm implemented in TCS v. 1.21 (Clement et al. 2000). In
addition to the network reconstruction, the program TCS also estimates the
haplotype outgroup probabilities, in order to identify the most-likely ancestral
haplotype in the network (Clement et al. 2000). Ancestral haplotypes were identified
by their internal position in the network, by the number of lineages that arise from
them, and by their occurrence (Castelloe & Templeton 1994).
As an alternative approach to traditional population genetic methods, a nested-clade
analysis (NCA, Templeton et al. 1995, Templeton 1998) was also conducted. NCA
contrasts gene frequency and genealogical data with geographic distance within a

Chapter three: Worldwide mtDNA diversity of pilot whale spp.
72
hierarchical nested-clade structure and can be used to infer spatial and temporal
processes (Templeton et al. 1995, Templeton 1998). First, the set of rules proposed
by Templeton and Sing (1993) was used to produce a nested series of haplotypes
and clades, based on the underlying genealogy estimated with TCS. Ambiguities
(loops or homoplasies) in resulting networks were resolved following methods
proposed by Crandall and Templeton (1993). NCA was then conducted using the
program Geodis v.2.5 (Posada et al. 2000), which performs various tests based on
the clade distance (Dc) and nested-clade distance (Dn) statistics, including the
randomised Chi-squared test for association between haplotypes/clades and
geographic sampling locations.
3.4. Results
3.4.1. Phylogenetic reconstruction and sequence variation
A total of 568 sequences of the mtDNA control region were available for the two
species of pilot whales. A maximum sequence length of 620 bp was available for a
subset of 261 samples from New Zealand strandings. However, to allow comparison
to all available sequences (including sequences from GenBank and market samples),
the length was reduced to a consensus fragment of 345 bp. This consensus fragment
showed a total of 24 variable sites (Table 3.2); eight sites were variable among long-
finned pilot whales (six transitions and one 2 bp deletion), while 13 were variable
among short-finned pilot whales (12 transitions and one transversion). Three sites
were found to be polymorphic in both species. Six fixed differences were found
between the two species (five transitions and one transversion).
Comparison of the consensus length sequence to the maximum length sequence
(ranging between 345 bp and 620 bp) suggested that the former encompasses most
of the variable sites. Only two additional variable sites were found in the full-length
sequence beyond position 345 (one site variable in short-finned and long-finned pilot
whales, and one fixed difference between the two species); one new haplotype was
defined for each species using this maximum length (M’ and P’; Table 3.2). This is in
agreement with the pattern of lower diversity within the central domain of the control
region that has been observed in some other cetacean species (Hoelzel et al. 1991,
Dalebout et al. 2004a).
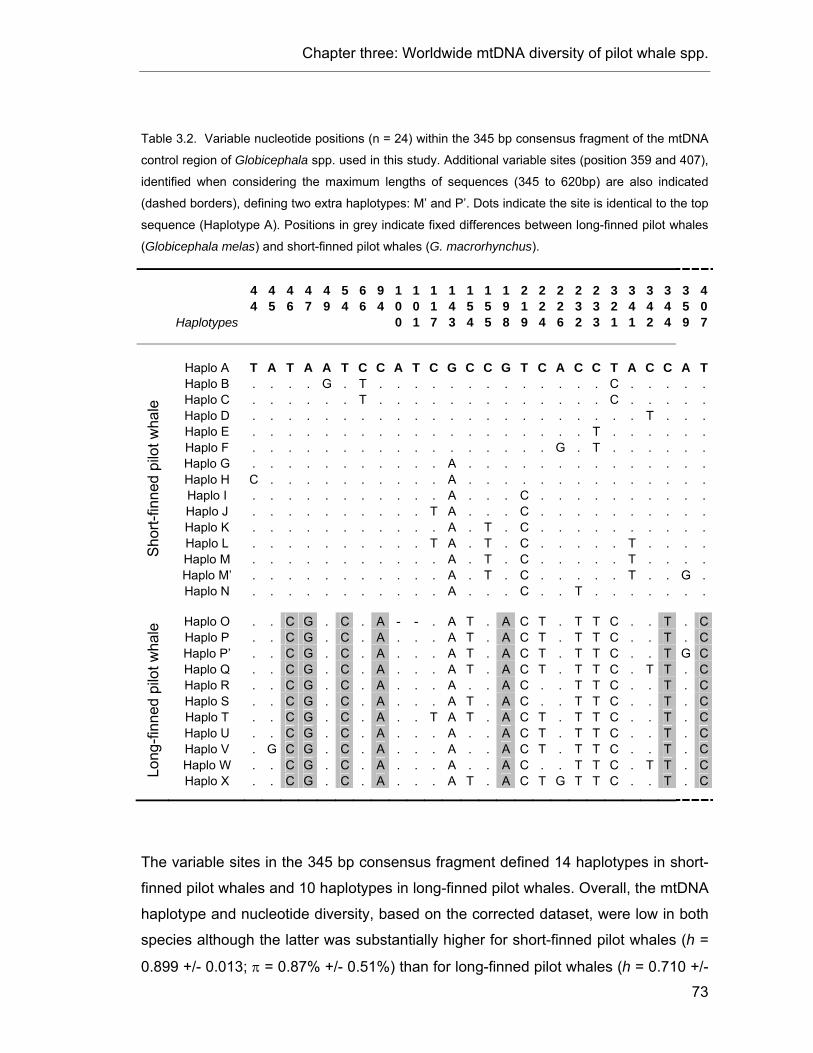
Chapter three: Worldwide mtDNA diversity of pilot whale spp.
73
Table 3.2. Variable nucleotide positions (n = 24) within the 345 bp consensus fragment of the mtDNA
control region of Globicephala spp. used in this study. Additional variable sites (position 359 and 407),
identified when considering the maximum lengths of sequences (345 to 620bp) are also indicated
(dashed borders), defining two extra haplotypes: M’ and P’. Dots indicate the site is identical to the top
sequence (Haplotype A). Positions in grey indicate fixed differences between long-finned pilot whales
(Globicephala melas) and short-finned pilot whales (G. macrorhynchus).
4 4 4 4 4 5 6 9 1 1 1 1 1 1 1 2 2 2 2 2 3 3 3 3 3 4 4 5 6 7 9 4 6 4 0 0 1 4 5 5 9 1 2 2 3 3 2 4 4 4 5 0 Haplotypes 0 1 7 3 4 5 8 9 4 6 2 3 1 1 2 4 9 7
Haplo A T A T A A T C C A T C G C C G T C A C C T A C C A THaplo B . . . . G . T . . . . . . . . . . . . . C . . . . .Haplo C . . . . . . T . . . . . . . . . . . . . C . . . . .Haplo D . . . . . . . . . . . . . . . . . . . . . . T . . .Haplo E . . . . . . . . . . . . . . . . . . . T . . . . . .Haplo F . . . . . . . . . . . . . . . . . G . T . . . . . .Haplo G . . . . . . . . . . . A . . . . . . . . . . . . . .Haplo H C . . . . . . . . . . A . . . . . . . . . . . . . .Haplo I . . . . . . . . . . . A . . . C . . . . . . . . . .Haplo J . . . . . . . . . . T A . . . C . . . . . . . . . .Haplo K . . . . . . . . . . . A . T . C . . . . . . . . . .Haplo L . . . . . . . . . . T A . T . C . . . . . T . . . .Haplo M . . . . . . . . . . . A . T . C . . . . . T . . . .Haplo M’ . . . . . . . . . . . A . T . C . . . . . T . . G .
Sho
rt-fin
ned
pilo
t wha
le
Haplo N . . . . . . . . . . . A . . . C . . T . . . . . . .
Haplo O . . C G . C . A - - . A T . A C T . T T C . . T . CHaplo P . . C G . C . A . . . A T . A C T . T T C . . T . CHaplo P’ . . C G . C . A . . . A T . A C T . T T C . . T G CHaplo Q . . C G . C . A . . . A T . A C T . T T C . T T . CHaplo R . . C G . C . A . . . A . . A C . . T T C . . T . CHaplo S . . C G . C . A . . . A T . A C . . T T C . . T . CHaplo T . . C G . C . A . . T A T . A C T . T T C . . T . CHaplo U . . C G . C . A . . . A . . A C T . T T C . . T . CHaplo V . G C G . C . A . . . A . . A C T . T T C . . T . CHaplo W . . C G . C . A . . . A . . A C . . T T C . T T . CLo
ng-fi
nned
pilo
t wha
le
Haplo X . . C G . C . A . . . A T . A C T G T T C . . T . C
The variable sites in the 345 bp consensus fragment defined 14 haplotypes in short-
finned pilot whales and 10 haplotypes in long-finned pilot whales. Overall, the mtDNA
haplotype and nucleotide diversity, based on the corrected dataset, were low in both
species although the latter was substantially higher for short-finned pilot whales (h =
0.899 +/- 0.013; π = 0.87% +/- 0.51%) than for long-finned pilot whales (h = 0.710 +/-
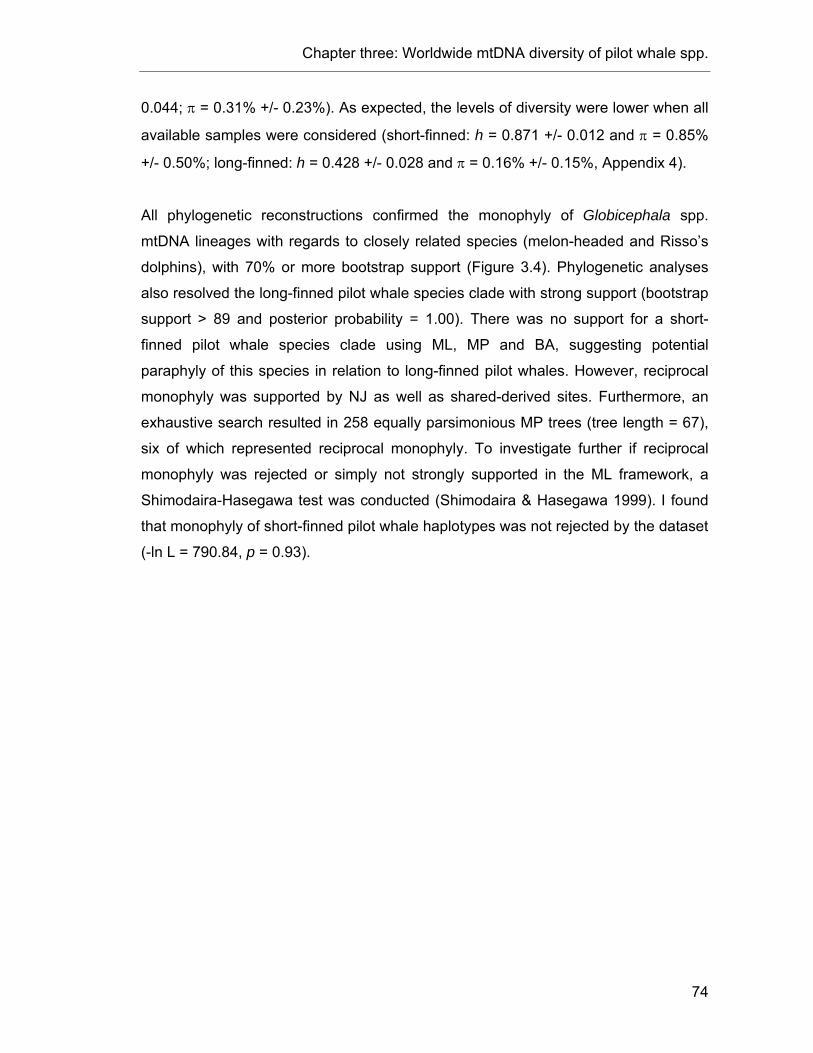
Chapter three: Worldwide mtDNA diversity of pilot whale spp.
74
0.044; π = 0.31% +/- 0.23%). As expected, the levels of diversity were lower when all
available samples were considered (short-finned: h = 0.871 +/- 0.012 and π = 0.85%
+/- 0.50%; long-finned: h = 0.428 +/- 0.028 and π = 0.16% +/- 0.15%, Appendix 4).
All phylogenetic reconstructions confirmed the monophyly of Globicephala spp.
mtDNA lineages with regards to closely related species (melon-headed and Risso’s
dolphins), with 70% or more bootstrap support (Figure 3.4). Phylogenetic analyses
also resolved the long-finned pilot whale species clade with strong support (bootstrap
support > 89 and posterior probability = 1.00). There was no support for a short-
finned pilot whale species clade using ML, MP and BA, suggesting potential
paraphyly of this species in relation to long-finned pilot whales. However, reciprocal
monophyly was supported by NJ as well as shared-derived sites. Furthermore, an
exhaustive search resulted in 258 equally parsimonious MP trees (tree length = 67),
six of which represented reciprocal monophyly. To investigate further if reciprocal
monophyly was rejected or simply not strongly supported in the ML framework, a
Shimodaira-Hasegawa test was conducted (Shimodaira & Hasegawa 1999). I found
that monophyly of short-finned pilot whale haplotypes was not rejected by the dataset
(-ln L = 790.84, p = 0.93).
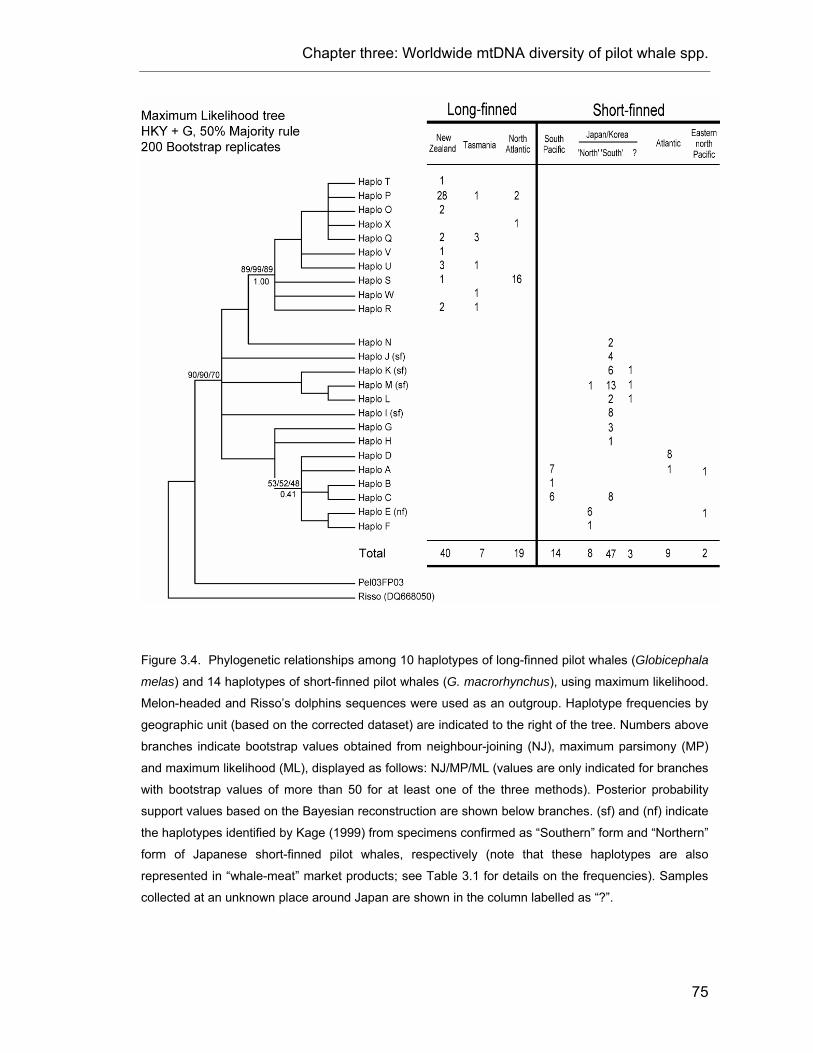
Chapter three: Worldwide mtDNA diversity of pilot whale spp.
75
Figure 3.4. Phylogenetic relationships among 10 haplotypes of long-finned pilot whales (Globicephala
melas) and 14 haplotypes of short-finned pilot whales (G. macrorhynchus), using maximum likelihood.
Melon-headed and Risso’s dolphins sequences were used as an outgroup. Haplotype frequencies by
geographic unit (based on the corrected dataset) are indicated to the right of the tree. Numbers above
branches indicate bootstrap values obtained from neighbour-joining (NJ), maximum parsimony (MP)
and maximum likelihood (ML), displayed as follows: NJ/MP/ML (values are only indicated for branches
with bootstrap values of more than 50 for at least one of the three methods). Posterior probability
support values based on the Bayesian reconstruction are shown below branches. (sf) and (nf) indicate
the haplotypes identified by Kage (1999) from specimens confirmed as “Southern” form and “Northern”
form of Japanese short-finned pilot whales, respectively (note that these haplotypes are also
represented in “whale-meat” market products; see Table 3.1 for details on the frequencies). Samples
collected at an unknown place around Japan are shown in the column labelled as “?”.

Chapter three: Worldwide mtDNA diversity of pilot whale spp.
76
3.4.2. Long-finned pilot whales (Globicephala melas)
3.4.2.1. Genetic diversity
The levels of mtDNA diversity were low in each of the three geographic units (New
Zealand, Tasmania and North Atlantic), although there were substantial differences
in diversity (Table 3.3). The largest number of haplotypes was found in New Zealand
(n = 8), although the largest sample size was also from this area. However, the
highest level of mtDNA diversity, both at the haplotype and nucleotide level, was
actually found in Tasmania which showed five different haplotypes among four
sampling events (Table 3.3). Samples from the North Atlantic displayed a lower
diversity than samples from Tasmania or New Zealand, with only three haplotypes
from 19 sampling events. As expected, when New Zealand and Tasmania were
grouped together for comparison between G. m. edwardii (Southern Hemisphere)
and G. m. melas (North Atlantic), the samples from Southern Hemisphere showed a
higher level of diversity than the samples from the North Atlantic (Table 3.3). Trends
in genetic diversity between areas were similar across the full dataset (Appendix 4).
Table 3.3. Summary of the genetic diversity statistics and neutrality tests for the mtDNA control region
of long-finned pilot whales (Globicephala melas), based on the corrected dataset. h is the haplotype
diversity and π is the nucleotide diversity. * represents significant p-values for neutrality tests (p <
0.05), and ‘# ind. adjusted’ indicates the sample size when considering only one representative of
each unique haplotype per sampling event. The column for the Southern Hemisphere encompasses
data from New Zealand and Tasmania.
New Zealand Tasmania Southern
Hemisphere North Atlantic Overall
# individuals 337 27 364 70 434 # ind. corrected 40 7 47 19 66 # sampling events 34 4 38 19 57 # haplotypes 8 5 9 3 10 h 0.508 +/- 0.095 0.857 +/- 0.137 0.573 +/- 0.083 0.292 +/- 0.127 0.710 +/- 0.044 π (%) 0.23 +/- 0.19 0.47 +/- 0.36 0.26 +/- 0.20 0.11 +/- 0.12 0.31 +/- 0.23 Tajima’s D -1.243 -0.093 -0.915 -0.778 -0.617 p-value 0.097 0.948 0.206 0.239 0.294 Fu’s FS -4.402 -2.019 -4.932 -0.725 -4.471 p-value 0.003* 0.032* 0.005* 0.200 0.011*
Chapter three: Worldwide mtDNA diversity of pilot whale spp.
77
3.4.2.2. Phylogeography
Haplotype distribution, AMOVA and neutrality tests – Of the three haplotypes found
in the North Atlantic (P, S, and X), two haplotypes (haplotype P and S) were also
found in the Southern Hemisphere (Figure 3.5). However, the frequencies of the
haplotypes within these two subsets showed strong phylogeographic patterns.
Among the North Atlantic specimens, haplotype S was the most common (84% and
80% of the whales, based on the corrected and full dataset, respectively), while in the
Southern Hemisphere, haplotype P was the most common (62% and 85% of the
whales, based on the corrected and full dataset, respectively). The shared
haplotypes between G. m. melas and G. m. edwardii were thus also the most
common haplotypes represented in the North Atlantic or Southern Hemisphere. Apart
from these two common haplotypes, all other haplotypes were only found in five or
less sampling events within the Southern Hemisphere or North Atlantic sample,
representing a maximum of 3% of the whales based on the full dataset (Table 3.1,
Figure 3.4).
Within the Southern Hemisphere, the distribution of haplotype frequencies showed
an interesting pattern, although the adjusted sample size was small in Tasmania.
Based on the corrected dataset, haplotype P was the most common in New Zealand,
while haplotype Q was the most common in Tasmania, where it was identified in
three of the four sampling events from this area. Also, haplotype W was unique to
Tasmania, and not found in New Zealand despite a large sample size. Note that
when considering the full dataset, haplotype P became the most common haplotype
found in the Tasmanian samples (n = 15, but all these samples originate from a
single mass stranding).
As expected from this haplotype distribution, the AMOVA showed strong population
genetic structure, both at the haplotype and nucleotide level (FST = 0.468, p < 0.001;
ΦST = 0.420, p < 0.001). Similar results were obtained with the full dataset (Appendix
4). Pairwise comparisons confirmed that all three geographic units were significantly
different from one another (Table 3.4). Overall genetic differentiation was mainly
driven by the North Atlantic samples. All units showed negative Tajima’s D values,
although none were significant. Fu’s FS values were significantly negative for New

Chapter three: Worldwide mtDNA diversity of pilot whale spp.
78
Zealand and Tasmania but not for the North Atlantic. When grouping New Zealand
and Tasmania, FS was also significant, while D was negative but not significantly
(Table 3.3).
Table 3.4. Analysis of genetic differentiation between subsets of long-finned pilot whales
(Globicephala melas) samples. FST values are given below diagonal and ΦST values are given above
diagonal. p < 0.001, ***; p < 0.01, **; p < 0.05, *; p > 0.05, ns.
New Zealand N = 40
Tasmania n = 7
North Atlantic n = 19
New Zealand 0.264* 0.472*** Tasmania 0.265* 0.521*** North Atlantic 0.533*** 0.502***
Network reconstruction - The two methods of network reconstruction recovered a
similar relationship between long-finned pilot whale haplotypes (Figure 3.5). There
was no inference of a missing ancestral haplotype and no more than one mutational
step between closest haplotypes. One loop was inferred in the network, but it was
unambiguously resolved following Crandall & Templeton’s rules (1993). The
algorithm implemented in TCS designated haplotype P as the ancestral haplotype.
This designation was consistent whether or not the sequences were collapsed into
unique haplotypes (i.e., ignoring frequencies). However, haplotype R was the most
closely related to G. macrorhynchus haplotypes suggesting that it could be the most
ancestral (Figure 3.5). The low level of haplotype diversity resulted in only one
nested level in the network, limiting the power of a NCA. However, the nested
contingency analysis showed a significant relationship among the spatial distribution
of haplotypes for clade 1-3, indicating a continuous range expansion (Figure 3.5).
This clade included haplotypes from all three regions and both ocean basins
considered here, including all G. m. melas haplotypes.
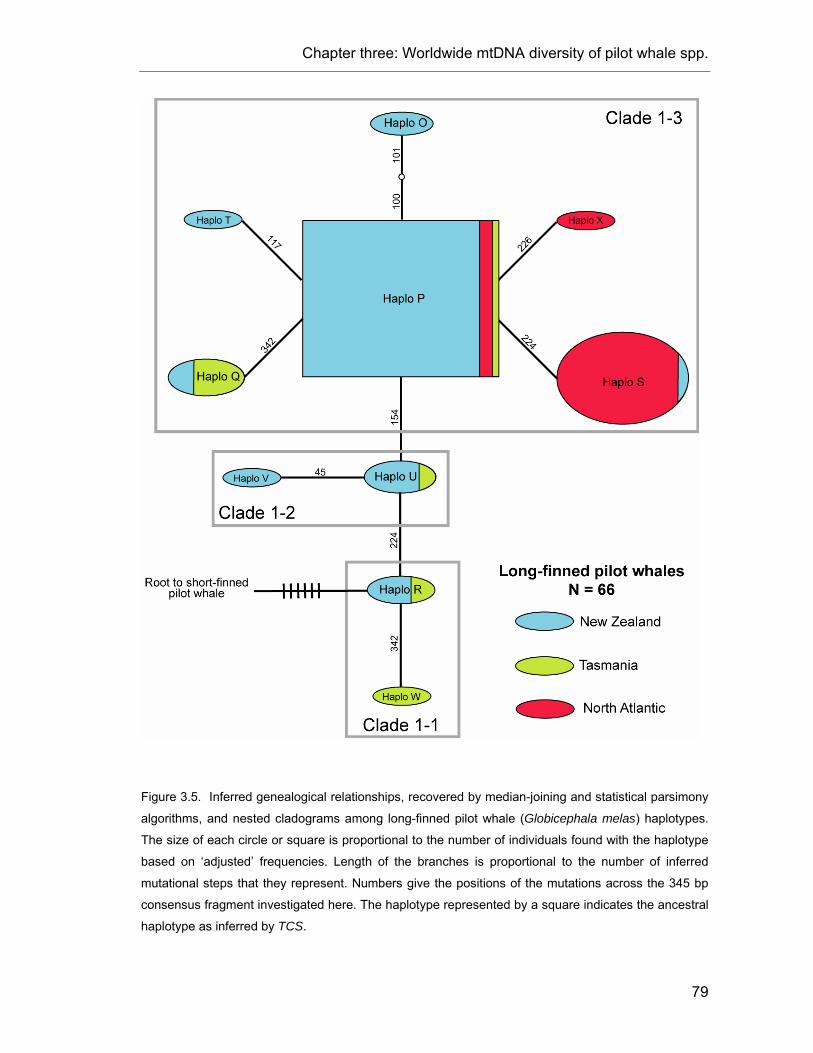
Chapter three: Worldwide mtDNA diversity of pilot whale spp.
79
Figure 3.5. Inferred genealogical relationships, recovered by median-joining and statistical parsimony
algorithms, and nested cladograms among long-finned pilot whale (Globicephala melas) haplotypes.
The size of each circle or square is proportional to the number of individuals found with the haplotype
based on ‘adjusted’ frequencies. Length of the branches is proportional to the number of inferred
mutational steps that they represent. Numbers give the positions of the mutations across the 345 bp
consensus fragment investigated here. The haplotype represented by a square indicates the ancestral
haplotype as inferred by TCS.
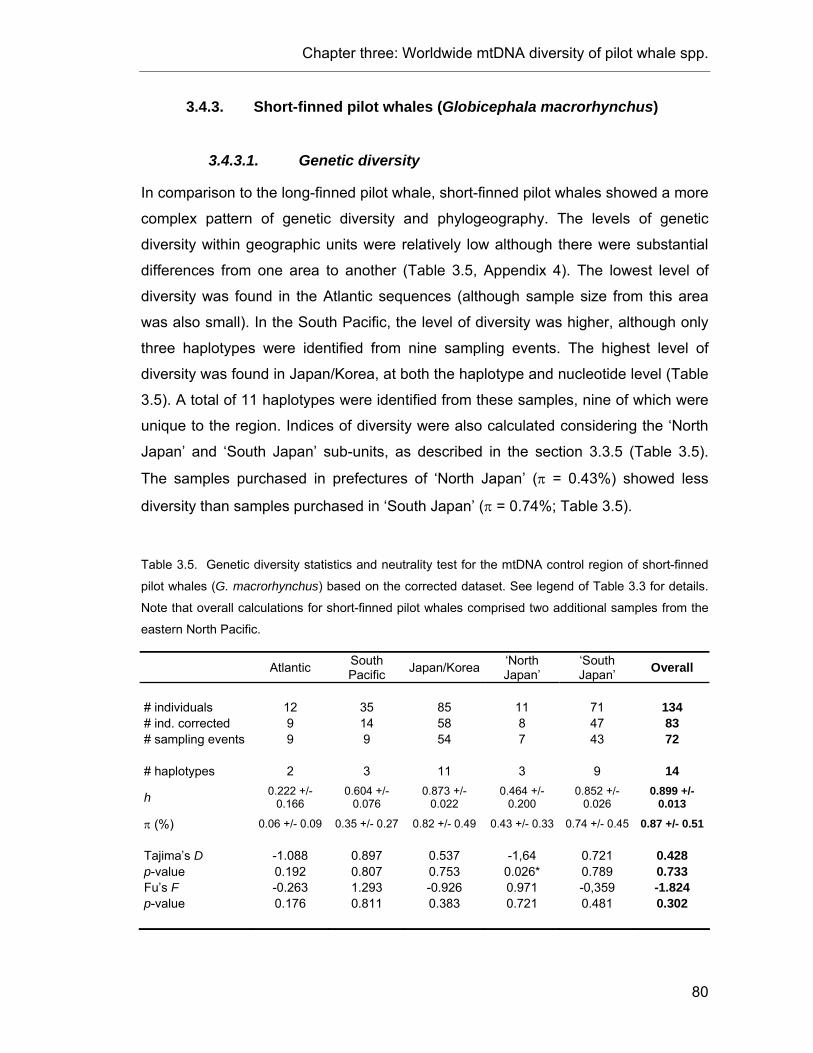
Chapter three: Worldwide mtDNA diversity of pilot whale spp.
80
3.4.3. Short-finned pilot whales (Globicephala macrorhynchus)
3.4.3.1. Genetic diversity
In comparison to the long-finned pilot whale, short-finned pilot whales showed a more
complex pattern of genetic diversity and phylogeography. The levels of genetic
diversity within geographic units were relatively low although there were substantial
differences from one area to another (Table 3.5, Appendix 4). The lowest level of
diversity was found in the Atlantic sequences (although sample size from this area
was also small). In the South Pacific, the level of diversity was higher, although only
three haplotypes were identified from nine sampling events. The highest level of
diversity was found in Japan/Korea, at both the haplotype and nucleotide level (Table
3.5). A total of 11 haplotypes were identified from these samples, nine of which were
unique to the region. Indices of diversity were also calculated considering the ‘North
Japan’ and ‘South Japan’ sub-units, as described in the section 3.3.5 (Table 3.5).
The samples purchased in prefectures of ‘North Japan’ (π = 0.43%) showed less
diversity than samples purchased in ‘South Japan’ (π = 0.74%; Table 3.5).
Table 3.5. Genetic diversity statistics and neutrality test for the mtDNA control region of short-finned
pilot whales (G. macrorhynchus) based on the corrected dataset. See legend of Table 3.3 for details.
Note that overall calculations for short-finned pilot whales comprised two additional samples from the
eastern North Pacific.
Atlantic South Pacific Japan/Korea ‘North
Japan’ ‘South Japan’ Overall
# individuals 12 35 85 11 71 134 # ind. corrected 9 14 58 8 47 83 # sampling events 9 9 54 7 43 72 # haplotypes 2 3 11 3 9 14
h 0.222 +/- 0.166
0.604 +/- 0.076
0.873 +/- 0.022
0.464 +/- 0.200
0.852 +/- 0.026
0.899 +/- 0.013
π (%) 0.06 +/- 0.09 0.35 +/- 0.27 0.82 +/- 0.49 0.43 +/- 0.33 0.74 +/- 0.45 0.87 +/- 0.51 Tajima’s D -1.088 0.897 0.537 -1,64 0.721 0.428 p-value 0.192 0.807 0.753 0.026* 0.789 0.733 Fu’s F -0.263 1.293 -0.926 0.971 -0,359 -1.824 p-value 0.176 0.811 0.383 0.721 0.481 0.302
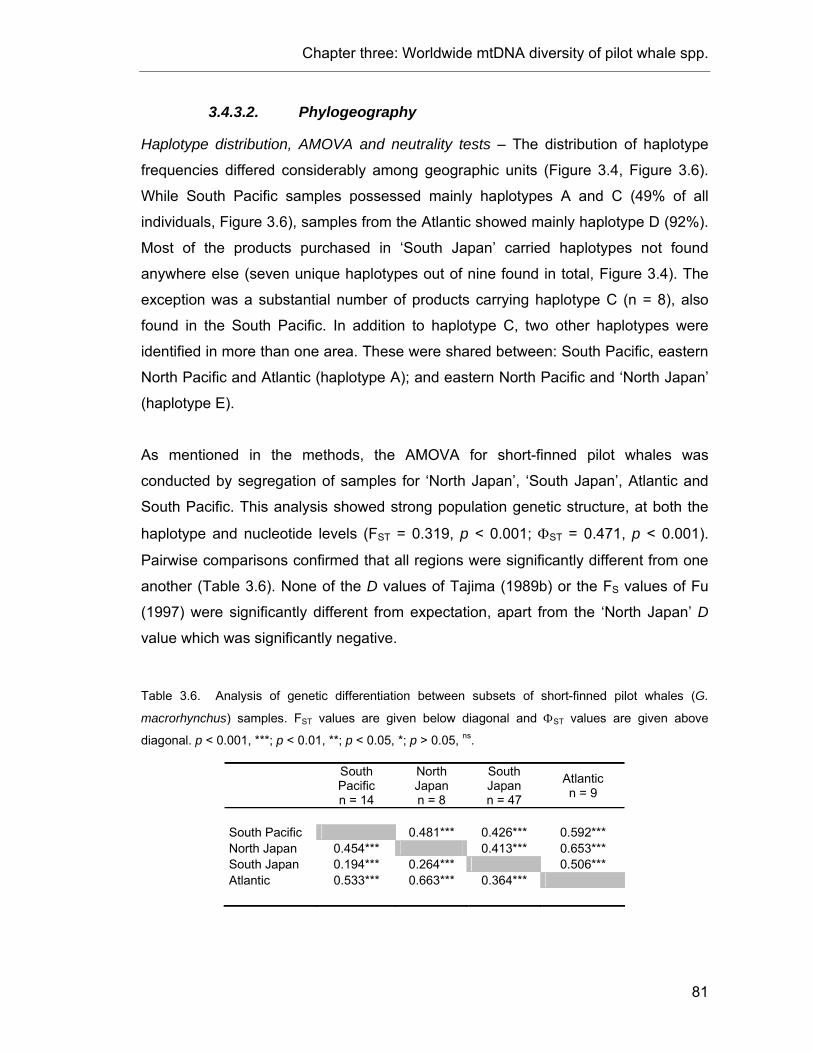
Chapter three: Worldwide mtDNA diversity of pilot whale spp.
81
3.4.3.2. Phylogeography
Haplotype distribution, AMOVA and neutrality tests – The distribution of haplotype
frequencies differed considerably among geographic units (Figure 3.4, Figure 3.6).
While South Pacific samples possessed mainly haplotypes A and C (49% of all
individuals, Figure 3.6), samples from the Atlantic showed mainly haplotype D (92%).
Most of the products purchased in ‘South Japan’ carried haplotypes not found
anywhere else (seven unique haplotypes out of nine found in total, Figure 3.4). The
exception was a substantial number of products carrying haplotype C (n = 8), also
found in the South Pacific. In addition to haplotype C, two other haplotypes were
identified in more than one area. These were shared between: South Pacific, eastern
North Pacific and Atlantic (haplotype A); and eastern North Pacific and ‘North Japan’
(haplotype E).
As mentioned in the methods, the AMOVA for short-finned pilot whales was
conducted by segregation of samples for ‘North Japan’, ‘South Japan’, Atlantic and
South Pacific. This analysis showed strong population genetic structure, at both the
haplotype and nucleotide levels (FST = 0.319, p < 0.001; ΦST = 0.471, p < 0.001).
Pairwise comparisons confirmed that all regions were significantly different from one
another (Table 3.6). None of the D values of Tajima (1989b) or the FS values of Fu
(1997) were significantly different from expectation, apart from the ‘North Japan’ D
value which was significantly negative.
Table 3.6. Analysis of genetic differentiation between subsets of short-finned pilot whales (G.
macrorhynchus) samples. FST values are given below diagonal and ΦST values are given above
diagonal. p < 0.001, ***; p < 0.01, **; p < 0.05, *; p > 0.05, ns.
South Pacific n = 14
North Japan n = 8
South Japan n = 47
Atlantic n = 9
South Pacific 0.481*** 0.426*** 0.592*** North Japan 0.454*** 0.413*** 0.653*** South Japan 0.194*** 0.264*** 0.506*** Atlantic 0.533*** 0.663*** 0.364***

Chapter three: Worldwide mtDNA diversity of pilot whale spp.
82
Network reconstruction - Similar haplotype networks were inferred by the median-
joining and statistical parsimony algorithms, revealing an interesting phylogeographic
pattern (Figure 3.6). After following the usual rules of haplotype nesting (Templeton &
Sing 1993), two main clusters of haplotypes were found: clade 2-1 and clade 2-2.
Clade 2-1 included all the samples from the South Pacific, Atlantic, eastern North
Pacific (Figure 3.6). It also included all the products or samples from ‘North Japan’,
except one product purchased in Miyagi and representing haplotype M. Clade 2-2, at
the other end of the network, contained only samples collected in ‘South Japan’,
except for the one sample collected at Miyagi (‘North Japan’). Only one haplotype
identified in samples from ‘South Japan’ was represented in clade 2-1 (haplotype C).
The nesting rules resulted in the clustering of haplotypes I, J, K, L, M and N into the
clade 2-2, but haplotypes G and H remained in the clade 1-6. This clade was
equidistant to its nesting alternatives (clade 2-1 and clade 2-2) which had almost
equal sample sizes (40 and 39, respectively). Therefore, Templeton and Sing’s
(1993) set of rules were theoretically not applicable to this particular case. However,
considering the phylogeographic pattern of the network, clade 1-6 was included with
clade 2-2 (both clades comprising only samples from Japan/Korea).
Japanese “Northern” and “Southern” forms – In his PhD thesis, Kage (1999)
identified one haplotype among the “Northern” form (haplotype E) and four
haplotypes among the “Southern” form (haplotypes I, J, K and M). This is largely
consistent with information from the market samples. Indeed, all market samples
possessing haplotype E were purchased in ‘North Japan’, while all but one of the
samples possessing haplotypes I, J, K or M were purchased in ‘South Japan’.
However, six haplotypes identified among market products were not reported in Kage
(1999). One was from a sample collected in ‘North Japan’ (haplotype F). This
haplotype was only one base-pair different from the haplotype represented by the
“Northern form” of Kage (haplotype E). Four haplotypes (haplotype G, H, L and N)
were found at low frequencies from samples collected in markets from ‘South Japan’.
These haplotypes were no more than one or two base-pairs different from at least
one of the haplotypes found in the “Southern” form” by Kage (Figure 3.6). Finally, the
last and most interesting haplotype of these six haplotypes not reported in Kage
(1999) was haplotype C (n = 8, 17% of the market products from ‘South Japan’), also

Chapter three: Worldwide mtDNA diversity of pilot whale spp.
83
mentioned above. This haplotype was found at a relatively high frequency among
market products purchased in the prefectures of Okinawa and Wakayama (‘South
Japan’). They were also common in samples from the South Pacific. There were
three mutational steps between haplotype C and the next most closely related
haplotypes found among market samples (haplotypes E and G).
The exact root probabilities calculated by TCS indicated haplotype K as an ancestral
haplotype in the network (Figure 3.6). However, this method is sensitive to the
relative proportion of the haplotypes, and after collapsing sequences into one
representative for each unique haplotypes, the inferred ancestral haplotype was
found to be haplotype I. Note also that haplotype N was found to be the root to long-
finned pilot whale haplotypes, making it another potential candidate for the ancestral
haplotype. Therefore, inference of the ancestral haplotype must be interpreted with
caution. The uncertainty linked to the origin and relationships among
Japanese/Korean samples prevented a NCA for the short-finned pilot whales.
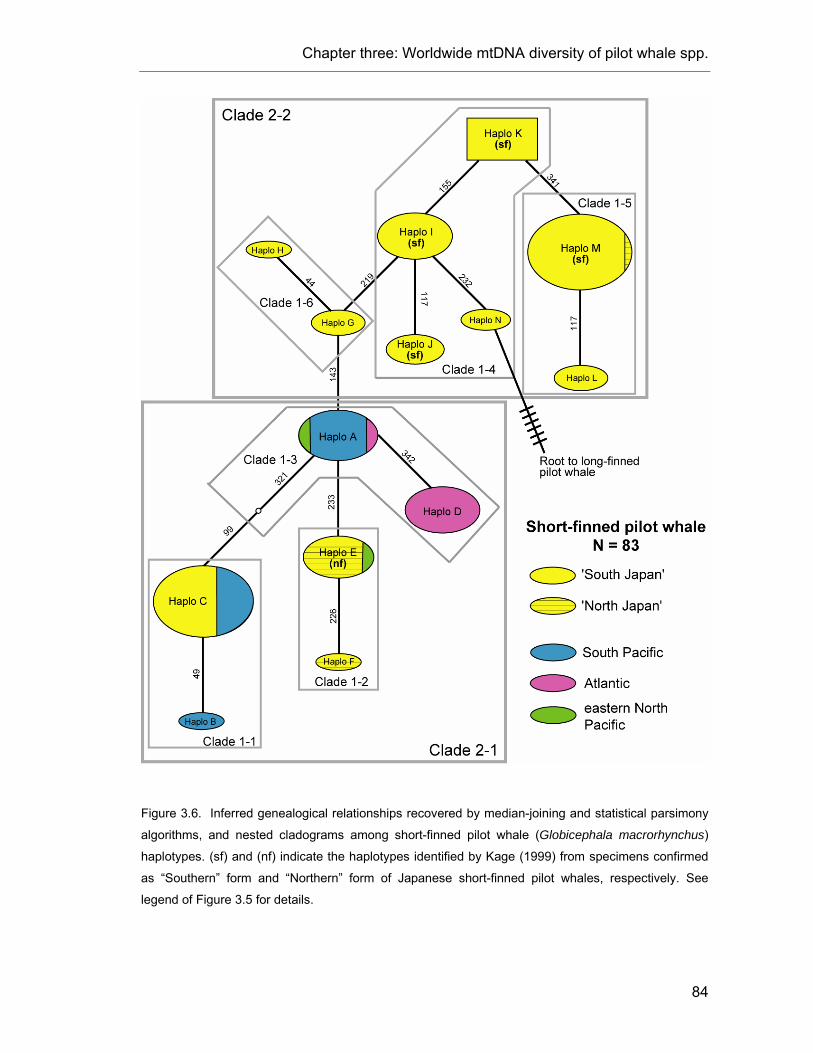
Chapter three: Worldwide mtDNA diversity of pilot whale spp.
84
Figure 3.6. Inferred genealogical relationships recovered by median-joining and statistical parsimony
algorithms, and nested cladograms among short-finned pilot whale (Globicephala macrorhynchus)
haplotypes. (sf) and (nf) indicate the haplotypes identified by Kage (1999) from specimens confirmed
as “Southern” form and “Northern” form of Japanese short-finned pilot whales, respectively. See
legend of Figure 3.5 for details.

Chapter three: Worldwide mtDNA diversity of pilot whale spp.
85
3.5. Discussion
3.5.1. Pilot whale species and sub-species
The examination of inter-species and intra-species mtDNA variation, based on large-
scale population sampling, confirmed that the two recognised species of pilot whales
can be distinguished by several fixed nucleotide differences. However, divergence
between the species was low and reciprocal monophyly of the mtDNA control region
was not well supported (although not conclusively rejected).
Such a phylogenetic pattern is not uncommon in delphinids with many uncertainties
existing in the genera Stenella, Tursiops and Delphinus (Reeves et al. 2004). Several
explanations of this pattern are possible, such as inadequate phylogenetic
information, for example, a mutation rate too slow relative to the rate of speciation, or
not enough information in the gene marker per se (Funk & Omland 2003). Incomplete
lineage sorting is also a common source of paraphyly, although it is generally less of
a problem for mitochondrial markers compared with nuclear genes (Funk & Omland
2003). However, considering that some of the potential reasons behind low mtDNA
diversity in pilot whales involve selective processes, such as cultural hitchhiking
(Whitehead 1998), it would be interesting to further investigate the phylogeny of
these two species using the whole mitochondrial genome and nuclear markers.
The control region of the two Globicephala species differed from each other by 3.7%
(or 2.9% after adjustment for within species diversity). Within the family Delphinidae,
such a level of divergence appears to be comparatively low, illustrating a relatively
recent divergence. It is lower than the level of divergence between Lagenorhynchus
species (5.17 - 13.02%, Cipriano 1997) but higher than that observed between
Delphinus delphis and D. capiensis in the Pacific (1.11%, Rosel et al. 1994). It can be
compared to the levels found in allopatric groups with recent radiations such as the
Cephalorhynchus species (2.5 - 4.0%, Pichler et al. 2001). Within the
Cephalorhynchus genus, Pichler et al. (2001) found good support for the monophyly
of the four species, based on 442 bp of the mtDNA control region.
Chapter three: Worldwide mtDNA diversity of pilot whale spp.
86
3.5.2. Long-finned pilot whale phylogeography
3.5.2.1. Recent history of anti-tropical distribution
Anti-tropical distribution patterns with sister species being distributed on one side or
the other of the warm tropical belt around the equator are relatively common among
cetaceans (Davis 1963). However, the long-finned pilot whale represents a special
case among the Odontocetes. It is the only recognised species that is anti-tropically
distributed in temperate waters in both hemispheres*. In all other cases, anti-
tropicality refers to closely related species distributed in one hemisphere or the other.
Comparison of morphological characters shows few differences between the two
populations of long-finned pilot whales, which led taxonomists to consider them
separate only at the sub-species level (Davis 1960). Here, the comparisons of
mtDNA genetic structure between specimens from both hemispheres are consistent
with the morphological similarity and assumed recent evolutionary history of these
populations, confirming that historical species-level ranking was inappropriate. In
fact, the sharing of two out of the three haplotypes from the North Atlantic (G. melas
melas) with haplotypes from the Southern hemisphere (G. m. edwardii) fails to
support the sub-species status currently recognized. Only the apparent allopatry of
the two populations supports this ranking. In the absence of any supporting evidence
(such as morphological and genetic data), geographic distribution alone is
considered insufficient for sub-species ranking in cetaceans (Reeves et al. 2004).
However, haplotype frequencies between the two populations of long-finned pilot
whales were very different, suggesting strong restrictions on current gene flow. Two
alternative hypotheses have been proposed to explain anti-tropical cetacean
distributions: the equatorial transgression and subsequent isolation hypothesis (Davis
1963), and the vicariance hypothesis, which assumes that anti-tropical organisms
abandoned low latitudes in response to a warming event (White 1986). Hare et al.
(2002) suggested vicariant isolation as being responsible for the anti-tropical
distribution of Lagenorhynchus obliquidens and L. obscurus based on a history of
large population sizes for both species (no evidence of a bottleneck effect). In the
*This could also be the case for the true beaked whale (Mesoplodon mirus), but data on this
species are scarcer (Dalebout et al. in press).
Chapter three: Worldwide mtDNA diversity of pilot whale spp.
87
long-finned pilot whale, the level of mtDNA genetic diversity in the North Atlantic was
already known to be very low (Siemann 1994), and one of the proposed scenarios to
explain this unusual level of diversity was that the North Atlantic population originated
from a colonisation event by the Southern population(s) (Fullard 2000). Although this
was consistent with the higher level of mtDNA diversity found in the Southern
Hemisphere, any conclusion at this stage would be premature. Indeed, despite being
relatively higher, mtDNA diversity in the South Pacific was also low, and there was no
clear evidence of a bottleneck event for the North Atlantic based on the results of
Tajima’s D test and Fu’s FS test. Additional genetic markers and samples from the
South Atlantic should be investigated to clarify this point.
3.5.2.2. Population structure in the Southern Hemisphere
Population structure of the long-finned pilot whale in the North Atlantic has been
investigated by Fullard et al. (2000) based on microsatellite loci. For these nuclear
loci, FST was low but significant between the Faroe Islands, West Greenland and
Cape Cod, the average distance between these areas being 3197 km. However,
population structure in the North Atlantic seems to be influenced by sea temperatures
rather than isolation-by-distance (Fullard et al. 2000). This indicates that although
long-finned pilot whales are nomadic and known to travel relatively long distances
(Mate et al. 2005), barriers are maintained between populations. Here, analyses of
mtDNA diversity indicated that population structure also exists in the Southern
distribution of this species at a scale even finer than that reported in the North
Atlantic: a significant difference between the samples from New Zealand and
Tasmania was found, with these areas only being about 1200 km apart. Interestingly,
one haplotype identified in Tasmania (n = 27) could not be found in New Zealand (n
= 337). At this stage, it is difficult to say if sea temperature is also an important factor
driving population structure in the Southern Hemisphere, but it is a likely scenario
and examination of a larger sample size, as well as other genetic markers, should
allow this prediction to be tested.
3.5.2.3. Recent worldwide expansion
The star-like haplotype network and low levels of sequence divergence in long-finned
pilot whales is similar to the pattern observed in coconut-crabs (Lavery et al. 1996),
and suggests a recent worldwide population expansion. This conclusion was further

Chapter three: Worldwide mtDNA diversity of pilot whale spp.
88
supported by negative Fu’s FS values and the result of the NCA for the main clade
(clade 1-3; Figure 3.5). On the other hand, there was little evidence of a bottleneck,
apart from the low level of haplotype diversity. Unlike to killer whales, for which a
bottleneck has been suggested (Hoelzel et al. 2002b), there were no missing sister
haplotypes in the network reconstruction and almost no variation which could be
considered ancestral, in the central ‘conserved’ domain of the control region.
Further, phylogenetic comparisons suggest that the long-finned pilot whale does not
have a slower mtDNA control region substitution rate than other species of dolphins
(Alexander 2006). Such a network of low worldwide haplotype diversity could thus be
the sign of a recent evolutionary origin or population expansion. However, the
influence of matrilineal social organisation on mtDNA diversity is still debated and the
influence of selective processes such as cultural hitchhiking could interfere in an
unknown way on the genetic characteristics of this species.
3.5.3. Short-finned pilot whales phylogeography
3.5.3.1. How many populations in the Japanese waters?
The pattern of mtDNA diversity in short-finned pilot whales was complex and
obscured by the uncertainty about the two distinct forms present in the waters around
Japan. While no information was available on the form of pilot whales from which
“whale-meat” market samples originate, a clear phylogeographic pattern was found
by combining data from Kage (1999) and the location of the prefectures where the
market products were purchased. These data strongly suggest that the haplotypes of
the clade 2-2 (haplotype I, J, K, L, M and N; Figure 3.6) were represented by
individuals of the “Southern” form. The only exception was one sample possessing
haplotype M obtained in a prefecture classified as ‘North Japan’ (prefecture of
Miyagi). However, this is not inconsistent with the seasonally overlapping
distributions of the two forms (Kasuya et al. 1988); therefore, it is possible that an
individual of the “Southern” form was hunted on the coast of Miyagi.
More puzzling was the substantial number of samples possessing haplotype C and
collected only in the ‘South Japan’ (prefectures of Wakayama and Okinawa), where
there are no reports of the “Northern” form of pilot whale, regardless of the season

Chapter three: Worldwide mtDNA diversity of pilot whale spp.
89
(Kasuya et al. 1988). Indeed, while the locations of purchase strongly argued that
these samples belonged to the “Southern” form, genetic data suggests that they
could originate from a distinct population more closely related to the population(s) of
the South Pacific (which also showed a high frequency of haplotype C). Haplotype C
was also the only haplotype found in high frequency in market products but not
represented in Kage’s (1999) samples of the “Southern” form. Finally, this haplotype
was four mutational steps distant from the closest haplotype confirmed as coming
from a “Southern” form by Kage (1999), that is, haplotype I. Therefore, together these
results support Kasuya et al’s (1988) hypothesis of a ‘third stock’ of short-finned pilot
whales in the southern waters of Japan. As supporting evidence for this, Kasuya et al
(1988) noticed a density hiatus in the distribution of pilot whales between coastal
area and offshore Kuroshio Current area. However, field studies are still needed to
confirm existence of this ‘third stock’.
An alternative explanation for the C haplotype on the market is that the products
originated from outside Japanese coastal waters. Such exploitation would potentially
represent a violation of the CITES (Convention on International Trade in Endangered
Species), similar to that already suggested in Japan/Korea for other species of
cetaceans (Baker & Palumbi 1994, Baker et al. 2000, Dalebout et al. 2005). Note that
in the South Pacific where haplotype C is frequently represented, haplotype A is also
equally represented (49% of the individuals each). Therefore, it is puzzling to find
representatives of haplotype C among the “whale-meat” market products but no
representatives of haplotype A. This suggests that the market product
representatives of haplotype C came from a population genetically distinct from the
‘South Pacific’ population described here (i.e., with equal proportions of haplotype A
and C representatives).
Smaller numbers of samples were collected from the markets of ‘North Japan’ but
they also showed a fairly clear phylogeographic pattern, consistent with the
information from Kage (1999), who identified haplotype E from his samples of the
“Northern” form. The high frequency of this haplotype in market samples from ‘North
Japan’ and no occurrence in ‘South Japan’ suggest that it is a haplotype specific to
the “Northern” form. Given this information, and considering its genetic relationship to
haplotype E, it is also likely that haplotype F belongs to the “Northern” form of the
Chapter three: Worldwide mtDNA diversity of pilot whale spp.
90
short-finned pilot whale (Figure 3.6).
Although uncertainties remain about the exact origin of the market samples, the
patterns described here strongly suggest that: (1) the “Southern” form was
represented by the clade 2-2, (2) the “Northern” form was represented by the clade
1-2, and (3) the market products carrying haplotype C represented specimens of a
third population from around Japan or an importation from outside Japanese coastal
waters (Figure 3.6).
3.5.3.2. Origin of the “Northern” form
Low levels of mtDNA diversity were found in the ‘North Japan’ samples, in
comparison to those from ‘South Japan’, which probably illustrates a true difference
between the “Northern” and “Southern” forms. Population size of the “Southern” form
is thought to be larger than the population of the “Northern” form (estimated at 20,300
and 5,000 individuals respectively, Kasuya 2007). This is consistent with a lower
level of genetic diversity within the latter. However, there is no reliable information on
the demographic and genetic boundaries of the “Northern” form population.
Therefore, the observed level of genetic diversity could illustrate current demography
as well as recent evolutionary history. Note that the “Northern” form is the only
population of short-finned pilot whale currently considered at risk by the IUCN (The
World Conservation Union).
As mentioned earlier, a larger form of the short-finned pilot whale also exists in the
eastern North Pacific (Polisini 1980). Unfortunately, little information from this region
was available to infer relatedness with the Japanese samples. It is worth noting,
however, that from the two sequences available (Siemann 1994), one was haplotype
E, that is the haplotype thought to be specific to the larger “Northern” form of the
Japanese short-finned pilot whale. Further genetic investigation of eastern North
Pacific samples are needed to clarify the relationship with the “Northern” form of
Japan. However, this result suggests recent gene flow between these two regions.
Uncertainty remains on the origin of northern population(s) of short-finned pilot
whales from the North Pacific. However, available evidence suggests that the
“Northern” form of short-finned pilot whales around Japan are more closely related to
Chapter three: Worldwide mtDNA diversity of pilot whale spp.
91
the population found in the South Pacific than the “Southern” form of Japan. Indeed,
the closest haplotype in proximity clade 1-2 (presumably representing the “Northern”
form; Figure 3.6) is haplotype A, which is commonly found in the South Pacific (and
also in the eastern North Pacific and Atlantic) but is apparently absent around Japan.
3.5.3.3. Origin of the “Southern form”
While it is unclear if the distribution of the “Northern” form extends further east in the
Pacific, it seems that the “Southern” form is confined to the waters surrounding
Japan. This is illustrated by the numerous haplotypes apparently unique to ‘South
Japan’, while haplotypes of the other regions are shared across oceans and
hemispheres. The genetic isolation observed here raises new concerns about the
conservation status of the “Southern” form of Japanese short-finned pilot whales; this
population is still an important target of small coastal whaling stations and drive-kill
fisheries, and several hundred individuals are caught annually (Kasuya 2007). To
date there is no model to evaluate if the current annual takes are sustainable in the
long-term. This is now further complicated by the potential existence of a third
population of short-finned pilot whales around Japan (Section 3.5.3.1). Indeed, if
such population has been confused with the real “Southern” form, it could have
biased previous census estimates, leading to an over-estimate of population size of
the “Southern form”.
Dall’s porpoises (Phocoenoides dalli) also exist in different geographic forms around
Japan. As in the “Southern” form of short-finned pilot whales, one of these forms, the
Sea of Japan-Okhotsk dalli-type, shows a distribution restricted to the coast of the
country (although in this case it is the north-east coast), providing an interesting
parallel between the two species. Hayano et al. (2003) suggested that the Sea of
Japan-Okhotsk dalli-type could have originated from a small founding population that
colonized the Sea of Japan during an interglacial period in the Late Pleistocene, or
that this population underwent a size reduction when this Sea was isolated from the
North Pacific in the last glacial period. A similar scenario was also proposed for the
Pacific white-sided dolphin (Lagenorhynchus obliquidens) off the coast of Japan,
which appears to have restricted gene flow with offshore population(s) of the North
Atlantic (Hayano et al. 2004).
Chapter three: Worldwide mtDNA diversity of pilot whale spp.
92
It is possible that the “Southern” form of Japanese short-finned pilot whales went
through a similar evolutionary history to that of the Dall’s porpoise and Pacific white-
sided dolphin, which would explain why the population is restricted to the coast of
Japan. However, one major difference was found when comparing Japanese short-
finned pilot whales to these two species. The populations of Dall’s porpoise and
Pacific white-sided dolphin thought to originate from the Sea of Japan, have a lower
level of mtDNA diversity than other populations of the same species in the North
Pacific, which is an indication of a potential founder event or bottleneck effect*
(Hayano et al. 2003, Hayano et al. 2004). In short-finned pilot whales, the opposite
pattern was found, with a higher diversity in the “Southern” form of pilot whales than
in any other region around the world.
In fact, several lines of evidence suggest that the “Southern” form could represent the
ancestral population of the short-finned pilot whale (and potentially all Globicephala if
the paraphyly as described previously was confirmed). Firstly, this is supported by a
higher level of mtDNA diversity than anywhere else in the world; secondly, the
ancestral haplotypes inferred by the program TCS (haplotype K or I) were identified
among specimens of the “Southern” form (Kage 1999); finally, phylogenetic and
network reconstructions showed that the short-finned pilot whale haplotype most
closely related to the long-finned pilot whale haplotypes is presumably a haplotype of
the “Southern” form (haplotype N). Therefore, these results suggest that a different
scenario must explain the current phylogeography of short-finned pilot whales in
comparison to Dall’s porpoises and Pacific white-sided dolphins.
3.5.3.4. Worldwide phylogeography of short-finned pilot whales
Although the short-finned pilot whale shows more diversity than the long-finned pilot
whale (which is mostly explained by short-finned samples from ‘South Japan’), the
overall mitochondrial variability observed remains relatively low in comparison to
other species of dolphins with wide distributions, such as spinner dolphins (Chapter
2). As with the long-finned pilot whale, no obvious signature supporting a recent
genetic bottleneck was found in the populations of short-finned pilot whales, aside
* It must be noted that short-finned pilot whales seem to be uncommon in the Sea of Japan and
that there are no data to indicate which forms are distributed there (Kasuya et al. 1988).

Chapter three: Worldwide mtDNA diversity of pilot whale spp.
93
from the low mtDNA diversity. Contrary to the long-finned pilot whale, however, the
haplotype network does not seem to support a recent worldwide demographic
expansion. Thus, the low level of worldwide mtDNA diversity in short-finned pilot
whales remains open to alternative scenarios such as cultural hitchhiking (Whitehead
1998, 2005).

Chapter four: Kinship in long-finned pilot whale mass strandings
94
4. Patterns of kinship and mtDNA lineage within mass strandings of long-finned pilot whales
around New Zealand
Mass stranding of long-finned pilot whales at Stewart Island, New Zealand in 2000. Photo courtesy of
Helen Kettles, Department of Conservation.

Chapter four: Kinship in long-finned pilot whale mass strandings
95
4.1. Abstract
Microsatellite genetic studies of kinship in the North Atlantic suggested that both male
and female long-finned pilot whales (Globicephala melas) present some degree of
natal group philopatry, a pattern so far observed in only one other mammalian
species, the killer whale. While this is generally accepted, it remains unclear if groups
of long-finned pilot whales at sea are strictly composed of maternally related
individuals (i.e., representing extended matrilineal units) or if they are sometimes
composed of several unrelated matrilineal units. The frequent mass strandings of this
largely pelagic species and the use of maternally and bi-parentally inherited genetic
markers offer the opportunity to address this question in more detail. Here, genetic
variability within mtDNA control region sequences (365 bp) and 14 microsatellite loci
genotypes was investigated within and between seven mass strandings (nTOT = 275)
from around New Zealand. Analysis of mtDNA variation discounted the scenario of a
strictly matrilineal social structure of stranded groups. Representatives of different
mtDNA haplotypes were found within the same mass stranding in five of the seven
strandings examined. The presence of multiple maternal lineages is consistent with a
photo-identification study on long-finned pilot whales in Nova Scotia showing fluidity
in group composition, but is in contradiction with previous microsatellite genetic
studies on long-finned pilot whales caught in drive-fisheries in the Faroe Islands. This
could be explained by different social systems between studied areas, however,
kinship analyses based on microsatellite loci suggest similarities in the genetic
pattern from mass strandings in New Zealand and the Faroe Islands groups. Notably,
parentage inference confirms that at least some mature males and females remain in
their natal group. These results show that the long-finned pilot whale matrilineal
social system has both similarities and differences to ‘resident’ killer whales of the
eastern North Pacific and sperm whales.

Chapter four: Kinship in long-finned pilot whale mass strandings
96
4.2. Introduction
Kinship is thought to play an important role in the evolution of social systems and
group living, in part through the benefits of inclusive fitness (Hamilton 1964a, b). So
far our understanding of the influence of kinship in group formation primarily benefits
from the studies on terrestrial species, primates in particular. Less attention has been
devoted toward cetaceans, as their aquatic environment and high dispersal ability
make them difficult to study for such a topic. However, most species of odontocetes
(or toothed whales; i.e., dolphins, sperm whales, porpoises and beaked whales) are
known for their gregarious behaviour, and an increasing number of studies are
revealing the complexity and diversity of their social systems (Connor et al. 1998,
Connor 2007).
One of the most fascinating patterns of group living so far described for mammals is
found in two species of delphinid: the killer whale (Orcinus orca) and long-finned pilot
whale (Globicephala melas). Amongst ‘resident’ populations of killer whales off the
British Columbia and Washington State, long-term photo-identification surveys
showed that adult males and females remain in close social contact with their mother,
presumably for life (e.g., Bigg et al. 1990). Amongst mammals, this social system
represents the best-documented case of natal group philopatry for both sexes (in the
case of cetaceans, which do not show any territoriality, natal philopatry must be
interpreted as the absence of social dispersal from the natal group).
Less direct evidence also suggests natal group fidelity for both sexes in long-finned
pilot whales. Unlike the killer whales described above, they live in social groups that
can range from a few individuals to several hundred (see Ottensmeyer 2001 for a
review of average group size). They are also thought to be nomadic and pelagic.
Perhaps the most notable characteristic of long-finned pilot whales’ natural history is
their high propensity to mass strand, much higher than any other species of
cetacean. Although the reasons behind mass stranding remain unknown, strong
social bonds within groups are thought to be an important factor (Perrin & Geraci
2002).

Chapter four: Kinship in long-finned pilot whale mass strandings
97
Although long-finned pilot whales are distributed in two distinct areas located in the
North Atlantic and the Southern Hemisphere (Figure 3.2), they have been studied
primarily in the North Atlantic. To date, genetic analyses have focused mainly on
samples from traditional drive-kill fisheries in the Faroe Islands, where entire groups
of whales (called “grinds” by the Faroese) are herded and driven to the shore before
being killed for their meat (Bloch et al. 1993). Analyses of nuclear DNA ‘fingerprints’
suggested that long-finned pilot whales have a matrilineal social structure, where
individuals of both sexes remain with their maternal group (Amos et al. 1991). This
was further supported by pedigree inference from extensive microsatellite analyses,
which showed that the groups contain multigenerational sets of maternally related
males and females, and that mating between maternally related individuals is rare or
non-existent (Amos et al. 1993, Fullard 2000).
While these analyses provide compelling evidence for some degree of natal
philopatry in both sexes, the overall social structure of long-finned pilot whale groups
remains controversial. Indeed, two opposing scenarios of group structure have been
proposed, based on different methodologies; here, they were called the “extended
matrilineal group” scenario and the “unrelated matrilineal group” scenario (Figure
4.1). In the “extended matrilineal group” scenario, groups are thought to be strictly
composed of individuals originating from the same ancestral female. This scenario is
based on various analyses of genetic relatedness on samples from the Faroese’s
drive-kill fisheries (Andersen 1988, Amos et al. 1993, Fullard 2000). It suggests that
groups observed at sea (that sometimes comprise more than 100 individuals)
represent persistent behavioural units, somewhat similar to the “pods” described for
‘resident’ killer whales of the eastern North Pacific (members of which spend more
than 50% of their time together, Bigg et al. 1990). This scenario also found some
support in results from studies using alternative data such as metal traces and
pollutant concentration, which showed significant differences between some of the
groups investigated (Aguilar et al. 1993, Caurant et al. 1993). In the alternate
scenario of “unrelated matrilineal group”, large groups of long-finned pilot whales are
thought to represent temporary social units composed of smaller, stable entities of
approximately 11-12 individuals, which represent the real matrilineal groups
(Ottensmeyer & Whitehead 2003). This scenario was derived from a behavioural
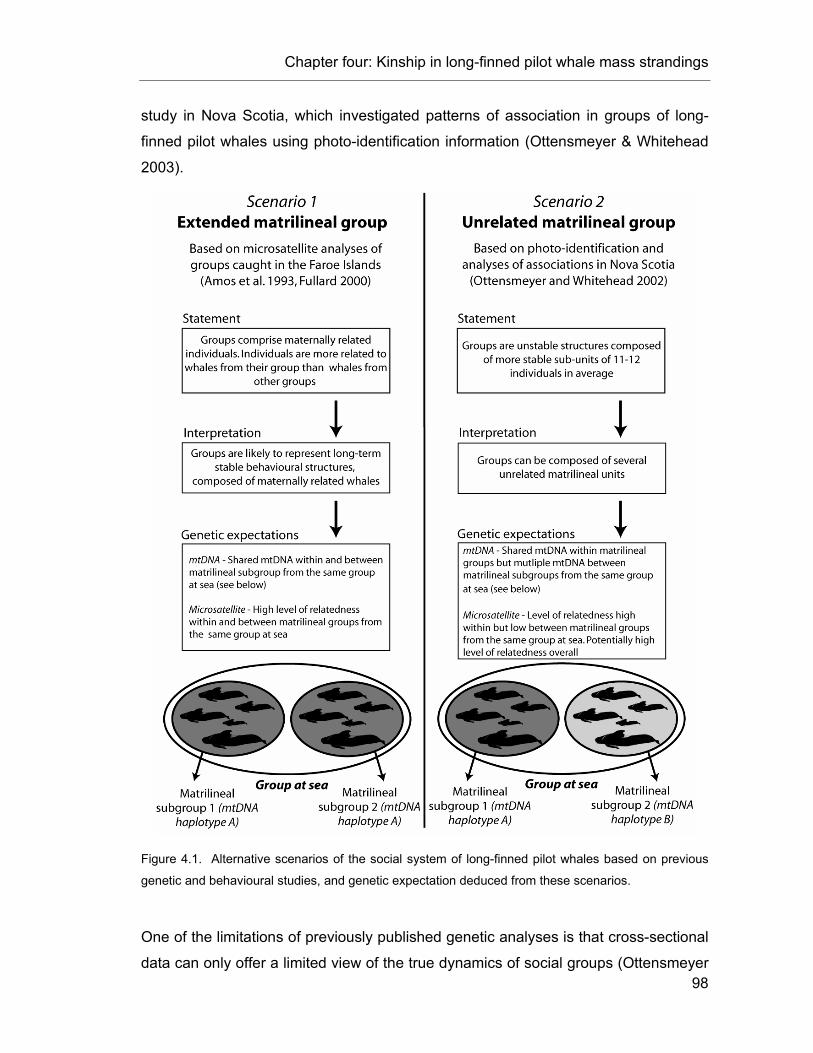
Chapter four: Kinship in long-finned pilot whale mass strandings
98
study in Nova Scotia, which investigated patterns of association in groups of long-
finned pilot whales using photo-identification information (Ottensmeyer & Whitehead
2003).
Figure 4.1. Alternative scenarios of the social system of long-finned pilot whales based on previous
genetic and behavioural studies, and genetic expectation deduced from these scenarios.
One of the limitations of previously published genetic analyses is that cross-sectional
data can only offer a limited view of the true dynamics of social groups (Ottensmeyer
Chapter four: Kinship in long-finned pilot whale mass strandings
99
& Whitehead 2003). Another limitation of this work, that has not been raised
previously, is the absence of mitochondrial DNA (mtDNA) analysis to complement bi-
parental (i.e., nuclear) markers. Indeed, the clonal and strictly maternal inheritance of
mtDNA in mammals provides the perfect candidate to trace maternal lineages within
social groups (e.g., Avise 2004). Among cetaceans, it has been widely used to
address these issues in other species thought to have matrilineal social structure,
notably in sperm whales and killer whales (e.g., Richards et al. 1996, Barrett-Lennard
2000).
Here I report the first study of long-finned pilot whales social system from the
Southern Hemisphere, based on genetic analyses of mass strandings from around
New Zealand. Firstly, the distribution of distinct maternal lineages within and between
mass strandings was investigated using mtDNA control region sequences in order to
test the prediction stated in Figure 4.1; under the hypothesis of “extended matrilineal
group”, only one mtDNA haplotype should be found per mass stranding, while under
“unrelated matrilineal group”, some groups, at least, should have more than one
haplotype. Relatedness estimates, based on microsatellite loci polymorphism, were
used to support mtDNA results by testing the prediction that a shared mtDNA
haplotype within mass strandings should reflect higher level of kinship. Additional
relatedness and parentage analyses were also conducted to allow comparison with
previous studies of long-finned pilot whales from North Atlantic. This comparison was
performed to investigate if a higher level of microsatellite relatedness than expected
by chance was found within the groups (mass strandings in this case), and if
parentage inferences supported some level of philopatry to the maternal group in
adult long-finned pilot whales of both sexes. For parentage analyses, the principal
expectation within groups was to find first-order relatives for mature females amongst
every class of individual (males and female, mature and immature), and to find first-
order relatives of mature males only amongst mature females (supposedly their
mother). Considering that mass strandings should be seen as an “unusual” event in
the life of pilot whales, the ability of such a dataset to provide information on social
systems is discussed, as well as the implications of the results in terms of mass
stranding social dynamics.

Chapter four: Kinship in long-finned pilot whale mass strandings
100
Several terms have been used in the literature to refer to an aggregation of long-
finned pilot whales, and in particular the term “pod” (e.g., Amos et al. 1991).
However, and as mentioned above, “pods” were initially defined as long-term stable
entities as observed in killer whales (Bigg et al. 1990). Therefore, in this chapter (and
elsewhere in the thesis), I preferred to use the term “group” for long-finned pilot
whales, which I think is more general than the term “pod”; indeed, many uncertainties
remain on the social system of this species and drawing a parallel with killer whale
“pods” would be premature at this stage. A distinction was also made between
“matrilineal group” and “maternal lineage”. A “matrilineal group” refers to a social
group of individuals related by mother-offspring bonds, which originated no more than
a few generations ago and that represents the basis of the matrilineal social system.
A “maternal lineage” refers to individuals sharing the same mtDNA haplotype, which
can reflect relationships across hundreds or thousands of generations (depending on
mutation rates). Thus, although members of a “matrilineal grou”p must also share a
“maternal lineage”, not all individuals of a given lineage are close relatives.
4.3. Materials & Methods
4.3.1. Data collection
Skin samples were collected from 275 long-finned pilot whales from seven mass
strandings around New Zealand, by the Department of Conservation staff (DoC, New
Zealand), between 1992 and 2004 (Table 4.1). These were subsequently transferred
to the University of Auckland cetacean molecular archive. Information on the total
length of the whales (from the tip of the upper jaw to the deepest part of fluke notch)
was available for all strandings except for Long Bay and Pitt Island. The number of
whales involved in each of the strandings ranged from 11 to 159 but data were
generally obtained from only a subset of individuals (Table 4.1). In the case of
Mahurangi (11 whales), all the beached individuals were sampled. However, it is
known that the night before the stranding, 100 to 200 pilot whales were roving off the
same reef (DoC, debrief report). These 11 individuals could thus represent only a
small subset of a much larger group. At Golden Bay, Stewart Island 2003 and
Opoutere, more than 50% of the whales involved were sampled, representing a good
coverage of these events (Table 4.1).
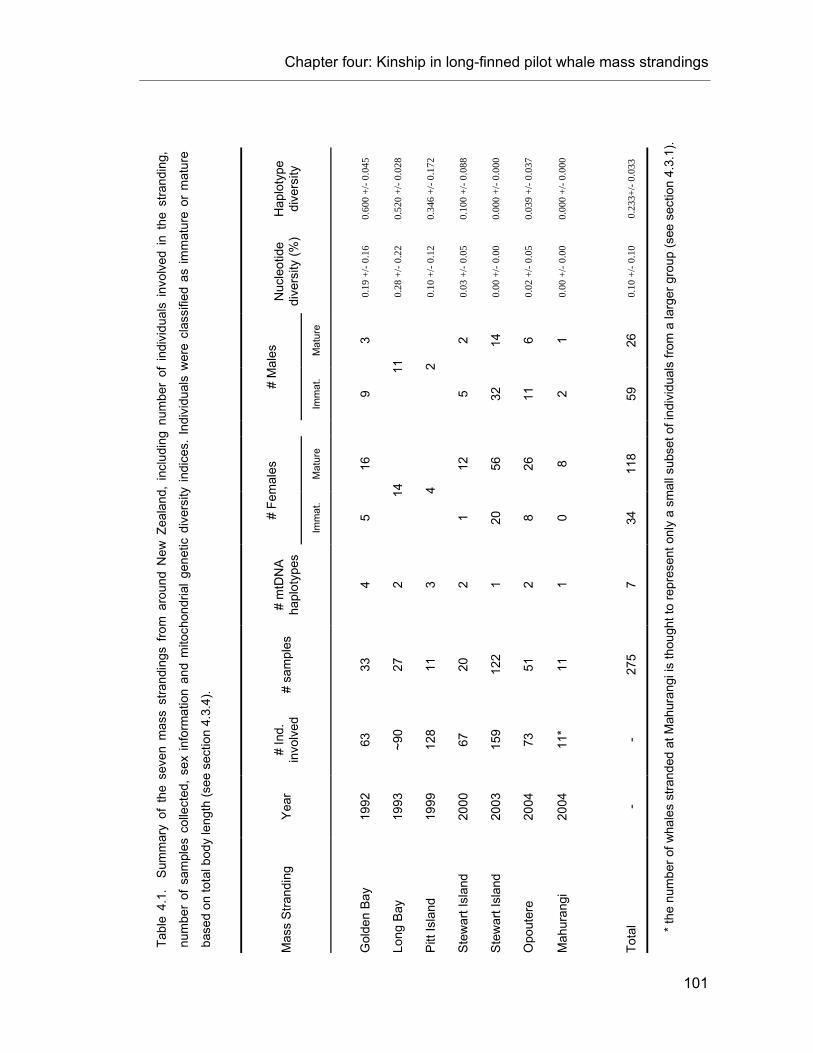
Chapter four: Kinship in long-finned pilot whale mass strandings
101
Hap
loty
pe
dive
rsity
0.60
0 +/
- 0.0
45
0.52
0 +/
- 0.0
28
0.34
6 +/
- 0.1
72
0.10
0 +/
- 0.0
88
0.00
0 +/
- 0.0
00
0.03
9 +/
- 0.0
37
0.00
0 +/
- 0.0
00
0.23
3+/-
0.03
3
Nuc
leot
ide
dive
rsity
(%)
0.19
+/-
0.16
0.28
+/-
0.22
0.10
+/-
0.12
0.03
+/-
0.05
0.00
+/-
0.00
0.02
+/-
0.05
0.00
+/-
0.00
0.10
+/-
0.10
Mat
ure
3 2 14
6 1 26
# M
ales
Imm
at.
9
11
2
5 32
11
2 59
Mat
ure
16
12
56
26
8
118
# Fe
mal
es
Imm
at.
5
14
4
1 20
8 0 34
# m
tDN
A ha
plot
ypes
4 2 3 2 1 2 1 7
# sa
mpl
es
33
27
11
20
122
51
11
275
# In
d.
invo
lved
63
~90
128
67
159
73
11* -
Yea
r
1992
1993
1999
2000
2003
2004
2004
-
Mas
s St
rand
ing
Gol
den
Bay
Long
Bay
Pitt
Isla
nd
Ste
war
t Isl
and
Ste
war
t Isl
and
Opo
uter
e
Mah
uran
gi
Tota
l
Tabl
e 4.
1.
Sum
mar
y of
the
sev
en m
ass
stra
ndin
gs f
rom
aro
und
New
Zea
land
, in
clud
ing
num
ber
of i
ndiv
idua
ls i
nvol
ved
in t
he s
trand
ing,
num
ber
of s
ampl
es c
olle
cted
, se
x in
form
atio
n an
d m
itoch
ondr
ial g
enet
ic d
iver
sity
indi
ces.
Ind
ivid
uals
wer
e cl
assi
fied
as im
mat
ure
or m
atur
e
base
d on
tota
l bod
y le
ngth
(see
sec
tion
4.3.
4).
* the
num
ber o
f wha
les
stra
nded
at M
ahur
angi
is th
ough
t to
repr
esen
t onl
y a
smal
l sub
set o
f ind
ivid
uals
from
a la
rger
gro
up (s
ee s
ectio
n 4.
3.1)
.
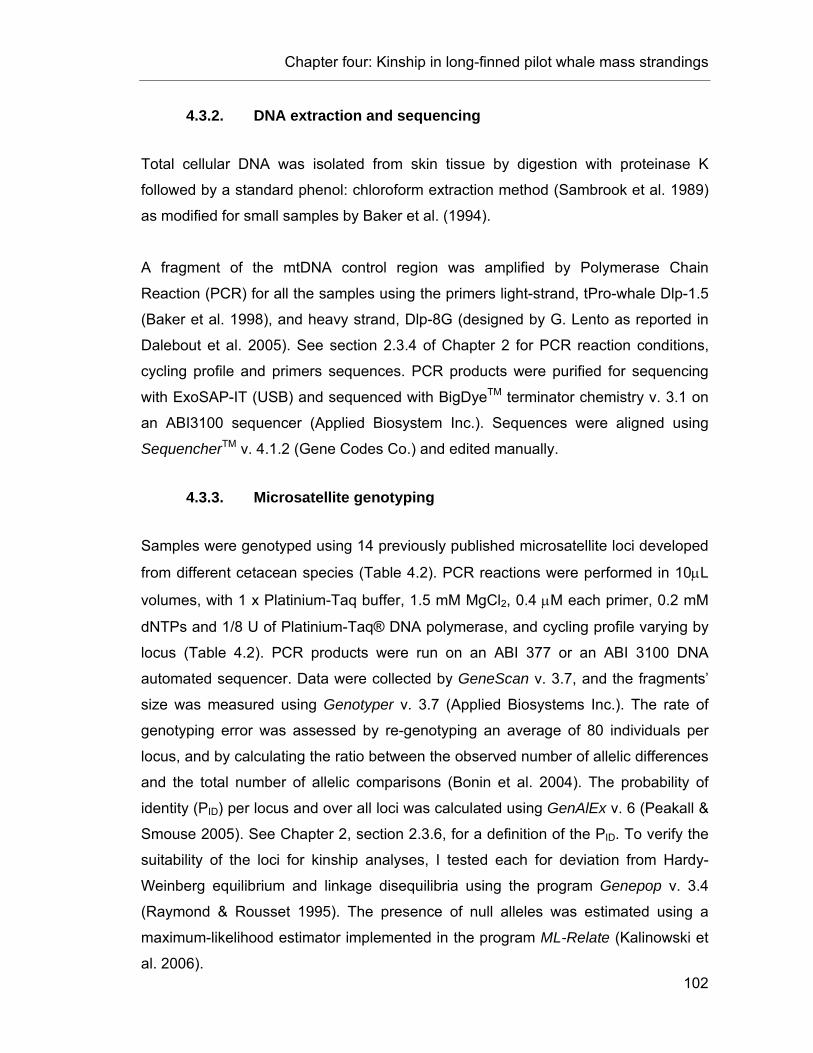
Chapter four: Kinship in long-finned pilot whale mass strandings
102
4.3.2. DNA extraction and sequencing
Total cellular DNA was isolated from skin tissue by digestion with proteinase K
followed by a standard phenol: chloroform extraction method (Sambrook et al. 1989)
as modified for small samples by Baker et al. (1994).
A fragment of the mtDNA control region was amplified by Polymerase Chain
Reaction (PCR) for all the samples using the primers light-strand, tPro-whale Dlp-1.5
(Baker et al. 1998), and heavy strand, Dlp-8G (designed by G. Lento as reported in
Dalebout et al. 2005). See section 2.3.4 of Chapter 2 for PCR reaction conditions,
cycling profile and primers sequences. PCR products were purified for sequencing
with ExoSAP-IT (USB) and sequenced with BigDyeTM terminator chemistry v. 3.1 on
an ABI3100 sequencer (Applied Biosystem Inc.). Sequences were aligned using
SequencherTM v. 4.1.2 (Gene Codes Co.) and edited manually.
4.3.3. Microsatellite genotyping
Samples were genotyped using 14 previously published microsatellite loci developed
from different cetacean species (Table 4.2). PCR reactions were performed in 10µL
volumes, with 1 x Platinium-Taq buffer, 1.5 mM MgCl2, 0.4 µM each primer, 0.2 mM
dNTPs and 1/8 U of Platinium-Taq® DNA polymerase, and cycling profile varying by
locus (Table 4.2). PCR products were run on an ABI 377 or an ABI 3100 DNA
automated sequencer. Data were collected by GeneScan v. 3.7, and the fragments’
size was measured using Genotyper v. 3.7 (Applied Biosystems Inc.). The rate of
genotyping error was assessed by re-genotyping an average of 80 individuals per
locus, and by calculating the ratio between the observed number of allelic differences
and the total number of allelic comparisons (Bonin et al. 2004). The probability of
identity (PID) per locus and over all loci was calculated using GenAlEx v. 6 (Peakall &
Smouse 2005). See Chapter 2, section 2.3.6, for a definition of the PID. To verify the
suitability of the loci for kinship analyses, I tested each for deviation from Hardy-
Weinberg equilibrium and linkage disequilibria using the program Genepop v. 3.4
(Raymond & Rousset 1995). The presence of null alleles was estimated using a
maximum-likelihood estimator implemented in the program ML-Relate (Kalinowski et
al. 2006).

Chapter four: Kinship in long-finned pilot whale mass strandings
103
Table 4.2. Summary statistics of the 14 microsatellite loci. n is the number of screened chromosomes
(2x the individuals), T°A is the annealing temperature applied during polymerase chain reactions and k
is the number of alleles found. HO is the observed heterozygosity, HE is the expected heterozygosity
and PID is the probability of identity per locus. HWE p-value refers to the results of the exact tests for
deviation of Hardy-Weinberg equilibrium.
Locus n T°A k HO HE PID HWE p-value
Null Allele Frequency Source
409/470 254 45 12 0.878 0.825 0.050 0.955 0.000 Amos et al. (1993) 415/416 266 45 9 0.793 0.794 0.073 0.016 0.016 Amos et al. (1993) 464/465 261 45 9 0.682 0.693 0.118 0.177 0.008 Amos et al. (1993) DlrFCB1 267 50 15 0.715 0.760 0.093 0.294 0.005 Buchanan (1996) DlrFCB6 262 62 7 0.691 0.677 0.162 0.740 0.000 Buchanan (1996) EV1 266 45 14 0.726 0.757 0.084 0.136 0.011 Valsecchi & Amos (1996)EV37 267 50 9 0.794 0.768 0.089 0.282 0.003 Valsecchi & Amos (1996)EV94 265 55 6 0.600 0.616 0.204 0.450 0.000 Valsecchi & Amos (1996)GATA53 240 55 8 0.825 0.830 0.053 0.081 0.007 Pasbøll et al. (1997) GT23 267 55 5 0.528 0.483 0.334 0.968 0.000 Berube et al. (2000) GT51 261 60 3 0.337 0.325 0.501 0.665 0.000 Caldwell et al. (2002) GT575 265 50 11 0.819 0.833 0.049 0.461 0.000 Bérubé et al (2000) MK8 228 50 13 0.833 0.813 0.060 0.214 0.000 Krützen et al. (2001) Ppho131 267 60 11 0.727 0.740 0.107 0.679 0.000 Rosel et al. (1999)
The PCR cycling profile was [93°-2', (92°-30", T°A-45", 72°-50") 15x, (89°-30", T°A-45", 72°-50") 20x,
72°-3'], except for GT51, which was amplified using the profile reported by the original paper.
4.3.4. Age/sex classes
The sex of each whale was identified by amplification of a fragment of the sry gene
multiplexed with a ZFX positive control, as described by Gilson et al. (1998). Based
on total length measurement, each sex was classified as likely mature or likely
immature. It has been shown that sexual maturity in long-finned pilot whales from the
Faroe Islands is closely related to body size (rather than age), with all males less
than 480 cm and all females less than 375 cm being immature individuals (Block et
al. 1993). Given that long-finned pilot whales from around New Zealand appear to
have similar parameters of growth and reproductive status to those off the Faroe
Islands (Schröder & Castle 1998), these thresholds were considered appropriate for
this dataset.
Chapter four: Kinship in long-finned pilot whale mass strandings
104
4.3.5. mtDNA control region
Variable sites and unique haplotypes of the mtDNA control region sequences were
identified using MEGA v. 3.1 (Kumar et al. 2004). Overall haplotype and nucleotide
diversity were estimated using a Kimura 2-parameter, as implemented in Arlequin v.
3.01 (Excoffier et al. 2005). The frequencies of mtDNA haplotypes was used to infer
the presence, or not, of unrelated maternal lineages within mass strandings of long-
finned pilot whales.
4.3.6. Patterns of relatedness
Monte-Carlo simulations were run to select a relatedness estimator that performed
best for the dataset of 14 microsatellites typed for all individuals (as suggested by
Van de Casteele et al. 2001). Three commonly used method-of-moment estimators
and one maximum-likelihood estimator were compared. They are referred to as: rLR
(Lynch & Ritland 1999), rQG (Queller & Goodnight 1989), rW (Wang 2002) and rML
(Milligan 2003), respectively. First, four datasets; of 1,000 pairs of genotypes each,
were generated using a Matlab program written by Russello & Amato (2004). Each
dataset simulated one of four possible types of relationship; unrelated individuals
(UR), half-sibling (HS), full-sibling (FS) and parent-offspring (PO). Expected
relatedness for each of these is: UR, r = 0; HS, r = 0.25; FS, r = 0.5; and PO, r = 0.5.
Genotypes were simulated based on the observed allele frequencies of the
population. Relatedness was then estimated for each simulated pair using the
program Identix (Belkhir et al. 2002) for rLR and rQG, Mer (Wang 2002) for rW, and ML-
Relate for rML. The sampling variance of the different estimators was calculated as
the standard deviation of the relatedness estimates for each dataset, while bias was
quantified as the deviation of the mean from the expected relatedness value (UR, 0;
HS, 0.25; FS, 0.5; PO, 0.5). The root mean-square error (RMSE) was also calculated
to integrate both variance and bias of the estimators. The choice among the different
estimators was made by comparing their statistical behaviour for these three
parameters (Milligan 2003). Note that contrary to the maximum-likelihood estimator
(rML), the method-of-moments estimators are not constrained within the biologically
relevant range of [0,1]. Therefore, to account for the effect of different ranges,
method-of-moments estimates were re-examined after truncating the r-value
Chapter four: Kinship in long-finned pilot whale mass strandings
105
distributions to fit between [0,1], i.e., with negative values of r being replaced by
zeros (Milligan 2003).
Using the best estimator, pairwise relatedness was calculated between all individuals
of the dataset. To test if the level of observed relatedness within mass strandings
was higher than expected by chance, a null distribution of mean relatedness between
any two individuals per mass stranding was generated using re-sampling simulations.
Each mass stranding event was recreated 10,000 times by randomly selecting
individuals of the dataset, keeping the sample size and sex-ratio consistent with the
original strandings. The mean value of r was then calculated for each of the 10,000
replicates to create the null distribution of each mass strandings. To be more
conservative, the analysis was also run after excluding immature individuals from the
dataset. Indeed, even if groups of long-finned pilot whales were composed of random
individuals, pairs of mothers and young calves would still be represented, inducing an
positive bias in the mean level of relatedness within the group.
To investigate whether shared mtDNA haplotypes within a stranding predicted a
higher level of microsatellite relatedness, values of r were compared within mass
stranding between pairs of individuals with the same mtDNA haplotype and pairs of
individuals with different haplotypes. A Mantel test of matrix correlation was used to
investigate this hypothesis for each of the strandings with more than one mtDNA
haplotype, i.e., pairwise mtDNA information was compared to pairwise r. In the matrix
containing mitochondrial information, pairs representing a shared haplotype were
assigned a one, while pairs representing different haplotypes were assigned a zero.
Significant correlation between the two matrices was assessed using Monte-Carlo
randomisation (10,000 replicates), as implemented in GenAlEx. As above, the test
was also run after excluding immature individuals of the dataset in order to be more
conservative.
4.3.7. Parentage analyses
The analyses of parentage were restricted to the three mass strandings with good
sampling coverage (nTOT = 206): Golden Bay 1992, Stewart Islands 2003 and
Opoutere 2004. Two sets of candidate parents were considered for all three
Chapter four: Kinship in long-finned pilot whale mass strandings
106
strandings considered here: mature females (n = 98) and mature males (n = 23).
Both sets were compared to all immature (n = 85) and all mature whales (n = 120),
searching for potential parentage.
Parentages were inferred using the likelihood-based approach implemented in the
program Cervus v. 2.0 (Marshall et al. 1998). This program calculates and compares
the likelihood ratio of each candidate parent based on population allele frequencies
(that is, the likelihood of parentage of that candidate parent relative to the likelihood
of parentage of an arbitrary unrelated candidate parent). The confidence of each
parentage inference is assessed by calculating the difference between the LOD
score (that is, the sum of the log-likelihood ratios at each locus) of the most-likely
candidate parent and the second most-likely parent in the sample (i.e., with the next
highest LOD score). The critical value of this difference, referred to as the ∆-value, is
generated through simulation, taking into account allele frequencies in the
population, the number of possible candidate parents, the proportion of candidate
parents sampled, and the percentage of missing genetic data and genotyping errors.
Here, the input parameters were set as follows: 10,000 candidate parents, 25% of the
parents sampled, 99.8% of the loci typed and genotyping error of 0.01. Furthermore,
considering that mass strandings are likely to be composed of numerous maternally
related members, simulations were run allowing the presence of relatives in the
dataset (set as three relatives at r = 0.25 for the candidate parents). Rather
conservative settings were chosen (several simulations with different input
parameters were performed) to compensate for the absence of biological basis for
some of the parameters required by Cervus. A 95% confidence level for the ∆-value
was used in order to reduce the potential of false inclusion. However, it must be
noted that with this criterion, Cervus is likely to omit a substantial number of true
parentages, i.e., false exclusion (in particular with cases where neither parent is
known). Therefore, for comparison, the results based on a strict-exclusion approach
were also reported. In this approach, all pairs sharing at least one allele at each locus
are considered to be potential first-order relatives. Contrary to the likelihood-based
approach, strict-exclusion is likely to give false parentage connections (or false
positives), especially when there is not enough genetic variability. This method is also
sensitive to genotyping error, which in this case, could result in false exclusion.

Chapter four: Kinship in long-finned pilot whale mass strandings
107
In the case of parentage assignment between two mature whales, it was not possible
to determine which individual was the parent and which one was the offspring.
Therefore, they were simply refered to as first-order relatives.
4.4. Results
4.4.1. Molecular sexing and age/sex classes
Sex was identified for a total of 98 males and 170 females, giving a sex ratio of
1:1.72, significantly different from a theoretical 1:1 sex ratio (χ² = 19.2, p < 0.005) but
similar to that previously found for drive-kill fisheries and strandings in the North
Atlantic (e.g., Bloch et al. 1993, Sigurjónsson et al. 1993). The sex could not be
determined for seven samples. Based on total length of each individual, overall mass
stranding composition was as follows: 40.3% mature females, 13.4% mature males,
20.2% immature females and 26.1% immature males (see Table 4.1 for details of
each mass strandings). The proportion of age/sex classes also showed close
agreement with studies from the drive-kill fisheries in the North Atlantic (Bloch et al.
1993).
4.4.2. Overall mtDNA diversity
The length of mtDNA control region sequences obtained varied amongst samples,
ranging from 389 to 620 bp. Comparison of these sequences revealed a total of
seven variable sites (five transition substitutions and one 2 bp insertion-deletion)
defining seven unique haplotypes. The largest consensus sequence available for all
275 samples was 365 bp long and encompassed all variable sites resolved in the
dataset. Examination of longer sequences (590 bp) for 194 samples did not detect
additional variable sites (see also Chapter 3). The overall level of mitochondrial
diversity was very low, with haplotype diversity, h, of 0.233 +/- 0.033 and nucleotide
diversity, π, of 0.10% +/- 0.10% (Table 4.1).

Chapter four: Kinship in long-finned pilot whale mass strandings
108
4.4.3. mtDNA haplotype distribution
Although the overall mtDNA diversity was low, haplotype distribution within mass
strandings confirmed cases of multiple maternal lineages. One haplotype (haplotype
a) was shared by a large majority of whales (88%; n = 253) and was found in all
seven mass strandings*. In five of these mass strandings, representatives of more
than one mtDNA haplotype were found, thus indicating the presence of individuals
from unrelated maternal lineages (Figure 4.2). Mixed haplotypes within the same
stranding included individuals from both sexes.
At Opoutere and Stewart Island 2000, all whales but one shared haplotype a; a
mature female had haplotype b at Opoutere and an immature male had haplotype g
at Stewart Island (Figure 4.2). The most striking cases of multiple maternal lineages
were at Long Bay and Golden Bay. In each of these two strandings, several
individuals were found to share one of the less common haplotype (haplotype b and
g, respectively) while the rest of the group mainly shared haplotype a (Figure 4.2).
Only one haplotype was found in the mass strandings at Stewart Island 2003 and
Mahurangi. In both cases it was haplotype a. A chi-squared test of independence
indicated that the distribution of haplotypes among the mass strandings was not
homogenous (χ² = 295, p < 0.005). Note, however, that the assumptions for this test
were not fulfilled following Cochran’s set of rules (several frequencies used for the
test were equal to 0 or 1).
*Note that the haplotype names given in this chapter are independent of the names given for
long-finned pilot whales mtDNA sequences in Chapter 3. This is because of a difference in the
length of the consensus fragment used in the two chapters.

Chapter four: Kinship in long-finned pilot whale mass strandings
109
Figure 4.2. Distribution and size of the mass strandings around New Zealand, and frequencies of the
seven mtDNA haplotypes. N indicates samples sizes. Sex composition per mass stranding per
haplotype is given, with F, M and “?” representing the number of females, males and individuals of
unknown sex, respectively.

Chapter four: Kinship in long-finned pilot whale mass strandings
110
4.4.4. Microsatellite statistics
The mean number of alleles per locus was 9.07 (ranging from 3 to 14) and mean
observed heterozygosity, HO, was 0.708 (ranging from 0.337 to 0.878). Over the 14
loci, the PID was 2.7 x 10⁻¹⁴. There was no evidence of linkage disequilibrium (results
not shown) and no locus but 415/416 was found to deviate from the Hardy-Weinberg
equilibrium in the pooled sample (Table 4.2). The frequency estimate of null alleles at
the locus 415/416 was 1.6%. Despite this result, this locus was not excluded from
subsequent analyses since the parentage and relatedness methods used later can
take into account such a bias (Kalinowski & Taper 2006). A total of seven errors (one
binning error and six allelic dropout, spread over four loci) were found after re-
genotyping 2,400 alleles, giving an estimated error rate of 0.0031 per allele, i.e., less
than the 1% recommended for parentage analyses (Taberlet & Luikart 1999).
Some samples repeatedly failed to amplify for several microsatellite loci, probably as
a result of degraded tissue. In order to limit the bias that this could cause to kinship
analyses, 12 samples with less than 10 microsatellite loci successfully screened were
excluded from analyses: seven were from the Long Bay mass stranding and five
were from the Pitt Island mass stranding. The remaining 263 samples were
genotyped at 10 to 14 loci each with an average of 13.65 loci per sample.
4.4.5. Relatedness estimator
The statistical behaviour of the four relatedness estimators, inferred from Monte-
Carlo simulations, showed close agreement with Milligan’s (2003) previous results.
The rML gave the lowest standard deviation for all relationships except UR, for which
the rLR appeared to perform better (Table 4.3). The rLR, however, performed poorly for
all other categories of relatedness. These results were consistent whether or not the
distribution was truncated for the method-of-moment estimators (Table 4.3). Although
rML showed the largest bias for HS and PO, the related measures of RMSE were still
found to be the lowest of all estimators, indicating that the bias was of little biological
consequence (Milligan 2003). Therefore, the rML performed better overall and was
chosen to calculate pairwise relatedness between all individuals.

Chapter four: Kinship in long-finned pilot whale mass strandings
111
4.4.6. Within-stranding mean relatedness
Mean relatedness within each strandings ranged from 0.04 +/- 0.01 to 0.11 +/- 0.03
(Figure 4.3). Given the different sampling coverage of each stranding, direct
comparison of these means should be considered with caution. However, a few
features are still worth noting. Firstly, comparisons to the null distribution revealed
that the overall levels of relatedness at Stewart Island 2003 and Opoutere were
higher than expected by chance. Interestingly, these two events represent large
strandings (over 50 individuals involved) with the best sampling coverage in the
dataset (Table 4.1). Relatedness within these two strandings was still significantly
higher than expected after excluding immature individuals (results not shown). On the
other hand, the mean relatedness at Mahurangi appeared to be relatively low
(although not significantly different from expectation based on null distribution)
despite the fact that all the stranded whales were sampled (Figure 4.3). However, it is
believed that the 11 whales stranded at Mahurangi were part of a larger group, most
of which did not strand, as mentioned in the section 4.3.1.

Chapter four: Kinship in long-finned pilot whale mass strandings
112
RM
SE
0.05
3
0.17
1
0.09
5
0.07
8
0.17
1
0.09
5
0.07
8
Bia
s
0.02
6
0.00
5
0.00
6
0.00
1
0.00
5
0.00
6
0.00
1
PO
Mea
n +
SD
0.52
6+/-
0.04
5
0.50
5+/-
0.17
1
0.50
6+/-
0.09
5
0.50
0+/-
0.07
8
0.50
5+/-
0.17
1
0.50
6+/-
0.09
5
0.50
0+/-
0.07
8
RM
SE
0.12
9
0.19
3
0.13
9
0.13
9
0.19
3
0.13
9
0.13
9
Bia
s
0.00
2
0.00
8
0.00
1
-0.0
01
0.00
8
0.00
1
-0.0
01
FS
Mea
n +
SD
0.50
2+/-
0.12
9
0.50
8+/-
0.19
3
0.50
0+/-
0.13
9
0.49
9+/-
0.13
9
0.50
8+/-
0.19
3
0.50
0+/-
0.13
9
0.49
9+/-
0.13
9
RM
SE
0.14
1
0.18
0.15
3
0.14
9
0.17
7
0.14
5
0.14
2
Bia
s
0.01
2
-0.0
05
-0.0
01
-0.0
04
-0.0
03
0.00
2
-0.0
01
HS
Mea
n +
SD
0.26
2+/-
0.14
1
0.24
5+/-
0.18
0
0.24
9+/-
0.15
3
0.24
5+/-
0.14
9
0.24
7+/-
0.17
7
0.25
2+/-
0.14
6
0.24
9+/-
0.14
2
RM
SE
0.09
6
0.1
0.15
7
0.16
5
0.07
9
0.11
5
0.11
4
Bia
s
0.05
1
-0.0
05
-0.0
01
-0.0
07
0.03
5
0.06
2
0.06
1
UR
Mea
n +
SD
0.05
1+/-
0.08
2
-0.0
05+/
-0.
100
-0.0
01+/
-0.
157
-0.0
05+/
-0.
165
0.03
5+/-
0.07
1
0.06
2+/-
0.09
7
0.06
1+/-
0.09
6
Estim
ator
Stat
istic
s
r ML
Unt
runc
ated
r LR
r QG
r W
Trun
cate
d
r LR
r QG
r W
Tabl
e 4.
3. S
tatis
tical
beh
avio
ur o
f fou
r rel
ated
ness
est
imat
ors
base
d on
sim
ulat
ed p
opul
atio
ns c
onsi
stin
g of
100
0 pa
irs o
f unr
elat
ed
(UR
), ha
lf-si
b (H
S),
full-
sib
(FS
) or
par
ent-o
ffspr
ing
(PO
) in
divi
dual
s. M
ean
and
stan
dard
dev
iatio
n (S
D)
from
the
thre
e m
etho
d-of
-
mom
ent
estim
ator
s w
ere
calc
ulat
ed f
rom
unt
runc
ated
(ra
ngin
g fro
m -
1 to
1)
and
trunc
ated
(ra
ngin
g fro
m 0
to
1) p
airw
ise
rela
tedn
ess
estim
ates
. Th
e be
st s
tatis
tics
are
give
n in
bol
d, w
hile
the
wor
st a
re g
iven
in it
alic
s (o
ne o
f ea
ch f
or e
ach
sim
ulat
ed
cate
gory
).
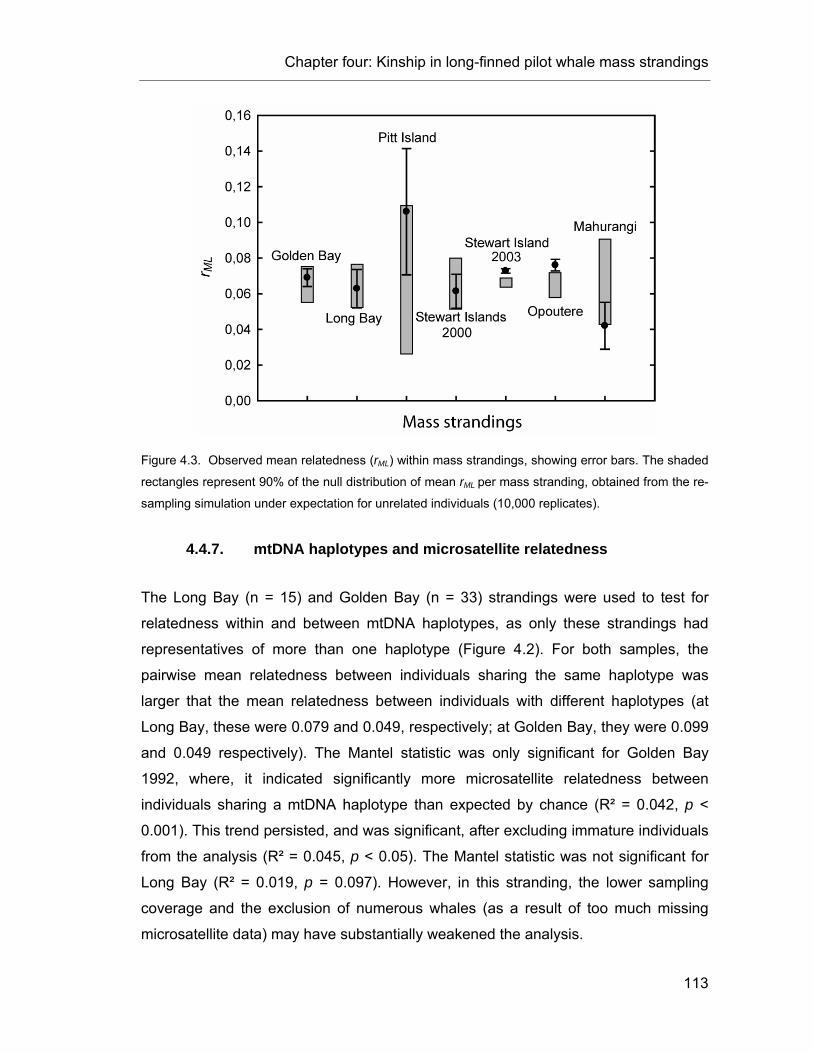
Chapter four: Kinship in long-finned pilot whale mass strandings
113
Figure 4.3. Observed mean relatedness (rML) within mass strandings, showing error bars. The shaded
rectangles represent 90% of the null distribution of mean rML per mass stranding, obtained from the re-
sampling simulation under expectation for unrelated individuals (10,000 replicates).
4.4.7. mtDNA haplotypes and microsatellite relatedness
The Long Bay (n = 15) and Golden Bay (n = 33) strandings were used to test for
relatedness within and between mtDNA haplotypes, as only these strandings had
representatives of more than one haplotype (Figure 4.2). For both samples, the
pairwise mean relatedness between individuals sharing the same haplotype was
larger that the mean relatedness between individuals with different haplotypes (at
Long Bay, these were 0.079 and 0.049, respectively; at Golden Bay, they were 0.099
and 0.049 respectively). The Mantel statistic was only significant for Golden Bay
1992, where, it indicated significantly more microsatellite relatedness between
individuals sharing a mtDNA haplotype than expected by chance (R² = 0.042, p <
0.001). This trend persisted, and was significant, after excluding immature individuals
from the analysis (R² = 0.045, p < 0.05). The Mantel statistic was not significant for
Long Bay (R² = 0.019, p = 0.097). However, in this stranding, the lower sampling
coverage and the exclusion of numerous whales (as a result of too much missing
microsatellite data) may have substantially weakened the analysis.

Chapter four: Kinship in long-finned pilot whale mass strandings
114
4.4.8. Parentage inference
The number and percentage of mature females and mature males with at least one
assigned parentage among immature and mature whales of their mass stranding
were reported in Table 4.4, for the likelihood-based approach and the strict-exclusion
approach. As expected, the likelihood-based approach was found to be more
conservative than the strict-exclusion approach, with fewer parentage assignments in
the former. This was also illustrated by a larger number of between stranding
assignments when using strict-exclusion (see Table 4.5 for results of parentage
inferences between stranding and further discussion on this point). The strict-
exclusion approach was not conservative enough to elucidate true parentage
relationships based on this dataset. However, although the likelihood-based and
strict-exclusion approach yielded different frequencies of assignment, the comparison
of the percentages of assigned individuals for each category showed similar
tendencies (Table 4.4). These were: (1) a substantial proportion of mature females
were assigned as potential mothers to immature whales; (2) rare assignments of
parentage were found between mature males and immature whales; (3) and, similar
proportions of parentage assignment to mature individuals were observed for mature
males and mature females.
Based on the likelihood-based approach, all the mature individuals assigned as a
first-order relative of a mature male were females, presumably their mother.
However, based on strict-exclusion approach, three mature males were identified as
potential first-order relatives of other mature males (two of these pairs were
confirmed based on 20 loci, results not shown). Note that one mature male (Glo118)
was identified as a potential father of an immature from his group (Glo131, male),
based on the likelihood-based approach (i.e., the method thought to be over-
conservative). This result was confirmed after screening a total of 20 microsatellite
loci (results not shown, see Chapter 5). See Appendix 5 for more details on this
particular case.

Chapter four: Kinship in long-finned pilot whale mass strandings
115
Table 4.4. Results of parentage analyses within three mass strandings using likelihood-based
approach and strict-exclusion approach. Numbers indicate the frequencies (and the proportion, %) of
mature females and mature males that were assigned at least one first-order relative in their mass
stranding. Distinction was made between assignments to at least one immature individual (Vs.
immatures) and assignments to at least one mature individual (Vs. matures). * indicates an
assignment between two individuals mismatching at one locus.
Mature females Mature males Mass strandings
Vs. immatures Vs. matures Vs.
immatures Vs. matures
Stewart Island 2003 8 (14%) 10 (18%) 1 (7%) 3 (21%)
Opoutere 3 (12%) 7 (27%) 0 (0%) 1 (17%)
Golden Bay 1 (6%) 0 (0%) 0 (0%) 1* (33%)
Like
lihoo
d
Total 12 (12%) 17 (17%) 1 (4%) 5 (21%)
Stewart Island 2003 33 (59%) 43 (77%) 1 (7%) 13 (93%)
Opoutere 12 (46%) 18 (69%) 0 (0%) 2 (33%)
Golden Bay 2 (13%) 2 (13%) 0 (0%) 0 (0%)
Stric
t-exc
lusi
on
Total 47 (48%) 63 (64%) 1 (4%) 15 (65%)
4.5. Discussion
4.5.1. Unrelated maternal lineages in mass strandings
Many hypotheses have been proposed to explain mass strandings but none, so far,
have reached a global consensus. Although the results presented here do not offer a
final answer, they indicate that kinship, which is thought to be the basis of social
cohesion in the case of long-finned pilot whales, is not the only factor which compels
the whales to follow their counterparts to their death. The analysis of mtDNA revealed
that more than one haplotype was found in five of seven mass strandings from New
Zealand, indicating that long-finned pilot whales involved in the same stranding event
are not always descendent from the same female ancestor. It is unlikely that the
presence of different haplotypes is a sole consequence of mutations, since two of the
rare haplotypes (haplotypes b and g) were found in more than one stranding. This

Chapter four: Kinship in long-finned pilot whale mass strandings
116
result is similar to findings in mass strandings of sperm whales, where multiple
haplotypes were found in three different events (Mesnick 2001). Only one of the four
strandings examined by Mesnick (2001) showed a single haplotype, which was the
most common haplotype in sperm whales. This was the case in the long-finned pilot
whale mass strandings of Stewart Island 2003 and Mahurangi, where all individuals
shared the same most-common haplotype (i.e., haplotype a). Considering the low
mtDNA diversity in long-finned pilot whales from New Zealand (as well as worldwide,
see Chapter 3), the showing of a common haplotype will be expected by chance
alone, as well as by recent descent. In fact, analysis of microsatellite variability
indicates a surprisingly low average level of relatedness between the 11 stranded
individuals at Mahurangi (which is the only stranding from which all individuals were
sampled). This rather suggests that these individuals were largely unrelated,
although they shared the same mtDNA haplotype.
Table 4.5. Results of parentage inferences between individuals from three mass strandings
comparing a conservative likelihood-based approach to a less-conservative strict-exclusion approach.
Numbers indicate the frequencies of mature males or females with at least one assignment among
immature and mature candidate first-order relatives. * indicates an assignment between two
individuals mismatching at one locus.
Mature females Mature males Mass strandings to
immatures to all
matures to
immatures to all
matures
Stewart Island 2003 0 0 0 0
Opoutere 0 0 0 1*
Like
lihoo
d
Golden Bay 0 0 0 0
Stewart Island 2003 5 5 2 2
Opoutere 5 6 1 2
Stric
t-ex
clus
ion
Golden Bay 3 3 0 0
Note: This analysis indicates than many between-stranding first-order parentages were assigned based on strict-exclusion approach (n = 34), while only one was found using the likelihood-based approach. Considering that the total number of individuals used in this analysis is thought to represent only a very small fraction of the total population of long-finned pilot whales around (although no population abundance estimate is available), and that these individuals have been sampled from independent strandings over the last 15 years, it seems unlikely that these between-stranding parentage assignments represent true pairs of first-order relatives (at least for the majority of them). Therefore, these results illustrate the fact the likelihood-based approach provides more conservative results than strict-exclusion approach for this dataset.

Chapter four: Kinship in long-finned pilot whale mass strandings
117
4.5.2. Using mass stranding data to infer social structure
Mass strandings offer a particular type of data since they represent an “unusual”
event. Therefore, these data must be considered carefully before using them to
address questions on social systems. Here, two lines of evidence suggest that the
main result described above was not biased by the nature of mass stranding events,
and thus, that it applies to groups of long-finned pilot whales at sea. First, the
sex/age class composition of the mass stranded groups investigated here closely
matches the composition of the groups caught in the Faroe Islands and
Newfoundland (Sergeant 1962, Bloch et al. 1993). These similarities in group
structure suggest thus that mass strandings offer a fairly good demographic picture of
the groups at sea. Second, it is likely that, if biased, mass stranding data would be
skewed toward higher relatedness rather than to the contrary. No current hypothesis
on the cause(s) of mass stranding suggests a skew toward lower relatedness than in
living groups. Therefore, even if mass stranding data are biased, it should not alter
the conclusions presented in the following section. Note also that in her study of
relatedness with groups of sperm whales, Mesnick (2001) found similar genetic
patterns in mass strandings and in groups at sea.
4.5.3. A scenario of “unrelated matrilineal groups”
The presence of several mtDNA lineages found within mass strandings is
inconsistent with to the scenario of “extended matrilineal groups” proposed from
microsatellite analyses on the Faroe Islands’ long-finned pilot whales (Amos et al.
1993, Fullard 2000, Figure 4.1). However, information from the mtDNA is limited in its
ability to test for the alternate scenario of “unrelated matrilineal groups”, which also
implies some level of matrilineal social structure. Indeed, the mtDNA pattern
observed here does not provide strong evidence of philopatry due to the over-
representation of haplotype a, which obscures the relationship between individuals or
matrilineal groups. At Stewart Island 2003 for instance, no strong conclusion could be
made based on mtDNA, since all the whales shared a single haplotype (haplotype a).
This haplotype is so common that some of these whales could originate from largely
unrelated matrilineal groups and still share the same mitochondrial haplotype by
chance. However, that the distribution of haplotypes b and g (Figure 4.2), which

Chapter four: Kinship in long-finned pilot whale mass strandings
118
show numerous representatives in one stranding (Long Bay and Golden Bay,
respectively) but almost none in the others, is consistent with a matrilineal subgroup
(this is also supported by result of the chi-square test on the homogeneity of
haplotype distribution, see Section 4.4.3).
The analyses of microsatellite loci variation conducted here complement the analyses
of mtDNA to show that there was some level of matrilineal social structure amongst
long-finned pilot whales from New Zealand mass strandings. The level of
microsatellite relatedness was found to be significantly higher between individuals
sharing the same mtDNA haplotype than individuals with different haplotypes within
the same stranding. This is in agreement with the prediction from the “unrelated
matrilineal group” scenario (Figure 4.1), where large groups of long-finned pilot
whales are likely to be unstable associations composed of several stable entities of a
smaller size. Furthermore, the parentage analyses confirmed that at least some
individuals, males and females, remained with their mother after reaching sexual
maturity. It also showed that mature males were rarely found to breed within their
group (although this might happen occasionally, Table 4.4 and Appendix 5), and that
their only first-order relative is likely to be their mother. Such a pattern represents the
basis of a matrilineal social system with some degree of natal philopatry for both
sexes.
4.5.4. A similar social system to the North Atlantic
Ottensmeyer and Whitehead (2003) suggested that different social systems between
studied areas could potentially explain the conflicting group structure scenarios
resulting from the genetic and behavioural studies from the North Atlantic. Intra-
specific variations in social systems are not unusual for cetaceans, notably among
species thought to be matrilineal in their group structure (e.g., killer whale, Baird &
Whitehead 2000). However, since the data used in both studies were different,
Ottensmeyer and Whitehead (2003) could not properly investigate whether or not
there are differences between the social systems of Nova Scotia and Faroese long-
finned pilot whales. The study presented here is the first investigation of long-finned
pilot whales social structure in their Southern Hemisphere range and therefore, it was
important to consider the possibility of different social systems to other studied areas.

Chapter four: Kinship in long-finned pilot whale mass strandings
119
Here, the use of microsatellite markers allowed comparison, to some extent, to the
previous genetic studies in the Faroe Islands showing that, overall, patterns of
parentage relationships and level of relatedness amongst individuals from mass
strandings were similar to that of groups caught by drive-kill fisheries.
First, and as described in the previous section, it was shown that at least some
individuals (of both sexes) stayed with their mother after reaching maturity, and that
mature males were unlikely to father within their own matrilineal group. This is similar
to results described by Fullard (2000) in the Faroe Islands. Analyses based on
relatedness also offered the opportunity to compare results from the present
analyses to previous studies in the Faroe Islands. Unfortunately, as a consequence
of incomplete sampling coverage of the mass strandings and the lack of detailed age
information, it was not possible to repeat accurately the analyses conducted by Amos
(1993) and Fullard (2000): Amos (1993) searched for a correlation between the age
of females and the probability of finding the alleles carried by these females within
their ‘grind’ (testing significance through simulations); Fullard (2000) compared the
mean relatedness of “old” females (aged ≥ 25 years) within and between grinds using
a randomisation procedure. Here, only the comparison of within mass stranding
mean relatedness to null distributions provided an analysis close to what these
authors reported. This analysis showed that mean relatedness was higher than
expected by chance was found at Stewart Island 2003 and Opoutere. The question
is: do these results support a scenario of “extended matrilineal unit”, as proposed by
studies from the Faroes? I believe this is unlikely given the counter-evidence from the
distribution of mtDNA haplotypes among mass strandings. High mean relatedness
would also be expected in groups composed of several matrilineal units (Figure 4.1)
and the significant difference observed here with the null distribution is more likely to
be the result of good sampling coverage in these two mass strandings.
Overall, I concur with Ottensmeyer and Whitehead (2003) on questioning the validity
of the “extended matrilineal group” scenario and suggest that additional
investigations of mtDNA for the Faroes’ groups could reveal the presence of more
than one maternal lineages per “grind”.
Chapter four: Kinship in long-finned pilot whale mass strandings
120
4.5.5. Comparison to other matrilineal species of odontocetes
Signs of matrilineal social structure have been proposed in four species of
odontocetes to date (Whitehead 1998); killer whales (Bigg et al. 1990), short-finned
pilot whales (Heimlich-Boran 1993), long-finned pilot whales (Amos et al. 1993) and
sperm whales (Richards et al. 1996). Studies on killer whales and sperm whales
have benefited from additional long-term behavioural data which, in both cases,
revealed several hierarchical levels of social organisation (Bigg et al. 1990,
Whitehead & Weilgart 2000). Such information is still unavailable in long-finned pilot
whales and will be required to describe their social system in detail. However, the
increasing knowledge from independent genetic and short-term behavioural studies
now provides a better framework for comparison to these two better-known species.
Fullard (2000) suggested that groups of long-finned pilot whales caught in the Faroe
Islands are similar to the “pods” of resident killer whales from British Columbia and
Washington State. These pods are composed of several matrilineal groups travelling
together more than 50% of their time (Bigg et al. 1990), they have an average size of
twelve individuals (ranging from three to 59 individuals (Barrett-Lennard 2000)), and
they are thought to include only genetically related individuals, as illustrated by the
systematic mtDNA haplotype sharing between the members (Barrett-Lennard 2000,
Hoelzel 1998). The finding of several mtDNA haplotypes in the group of long-finned
pilot whales stranded around New Zealand clearly stands against this comparison. It
is, on the other hand, similar to results described for sperm whales (Christal 1998,
Mesnick 2001). Indeed, genetic studies have shown that “groups” and even “units” of
sperm whales (the most stable behavioural entity in the social organisation of this
species) do not necessarily represent strict matrilineal groups as originally thought.
However, this does not mean, that long-finned pilot whales follow the same social
system as sperm whales. It is known that in sperm whales, mature males disperse
from their maternal groups (Whitehead & Weilgart 2000). Contrary to this, my results
confirmed some natal philopatry for both-sexes in long-finned pilot whales, similar to
that observed in killer whales. Therefore, at this stage, a reasonable statement would
be that long-finned pilot whales social structure is situated somewhere between those
which are known for ‘resident’ killer whales of the eastern North Pacific and sperm

Chapter four: Kinship in long-finned pilot whale mass strandings
121
whales. Further studies combining behavioural and genetic information from
strandings and free-ranging groups will help to refine our view of long-finned pilot
whale social system(s).
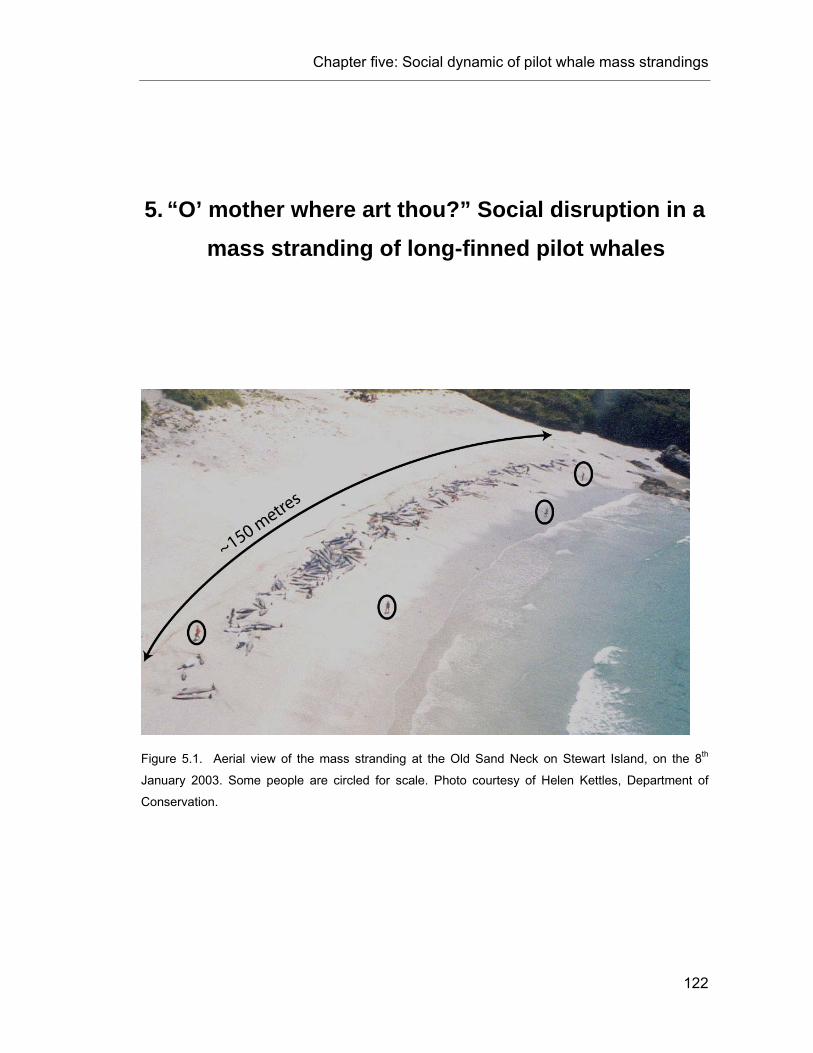
Chapter five: Social dynamic of pilot whale mass strandings
122
5. “O’ mother where art thou?” Social disruption in a mass stranding of long-finned pilot whales
Figure 5.1. Aerial view of the mass stranding at the Old Sand Neck on Stewart Island, on the 8th
January 2003. Some people are circled for scale. Photo courtesy of Helen Kettles, Department of
Conservation.
Chapter five: Social dynamic of pilot whale mass strandings
123
5.1. Abstract
The proximate causes of cetacean mass strandings remain unclear. Social bonds
between the individuals that strand together are assumed to play a critical role but, to
date, this assumption has received little direct investigation. The long-finned pilot
whale (Globicephala melas) is the most common species involved in mass
strandings, often comprising more than a hundred individuals in a single event. Here,
the assumption that social bonds are maintained during these traumatic events was
investigated. To do so, advantage was taken of a unique dataset from a large mass
stranding of this species (n = 122) in 2003 at Stewart Island, New Zealand. The
position and age/sex class of each stranded whale was mapped along the beach,
and samples were taken for genetic analyses. Kinship was estimated (based on 20
microsatellite loci) by conducting relatedness and parentage analyses. Contrary to
the expectation that close kin would be closely associated during these last moments
of life, various analyses failed to detect a correlation of kinship with the spatial
distribution of stranded individuals. Even inferred mother-and-calf pairs were often
found widely separated along the beach. Although the observed separation of close
kin could either be a cause or a consequence of the stranding event, this disruption
of kinship bonds could help to explain the behavioural distress of stranded individuals
and the tendency of many whales to re-strand after being re-floated.

Chapter five: Social dynamic of pilot whale mass strandings
124
5.2. Introduction
The phenomenon of cetaceans mass stranding has been a source of interest and
puzzlement since Aristotle, 350 BCE (Historia Animalia, Book IX, Ch. 48). Mass
strandings frequently involve over a hundred animals at a time, providing a
compelling problem for animal welfare and human management. Despite centuries
of questioning, this phenomenon is still subject to controversies regarding its causes.
In some cases, pathology suggests direct causal mechanism (Geraci et al. 1989,
Jepson et al. 2003), but for most mass strandings, the animals appear to be in
perfect health.
Among the many hypotheses proposed to explain mass strandings, one of the most
popular has been that social cohesion drives the whales to follow their kin aground
(Odell et al. 1980, Cordes 1982). Support for this hypothesis comes from several
observations: 1) only species of cetaceans thought to form long-term social bonds
(and belonging to the sub-order of toothed-whales, or Odontoceti) are affected by
mass strandings; 2) several studies have reported cases whereby healthy cetaceans
have mass stranded, apparently because they remained in the vicinity of a sick
individual or an individual in difficulty (Porter 1977, Robson 1984, Rogan et al.
1997); 3) the re-stranding of healthy animals, after being re-floated and driven
offshore, has been interpreted as a social response to individuals that remained
ashore (Porter 1977, Robson 1984).
Although typically listed in the potential causes, the hypothesis that social bonds
play a role in the dynamics of these events has received little direct investigation.
Instead, studies have focused on testing hypotheses about the factors influencing
the distribution of strandings in space and time: for example, currents and coastal
topography (Brabyn & McLean 1992, Sundaram et al. 2006), geomagnetic
disturbance (Klinowska 1986), and climate events (Evans et al. 2005). It has been
recently pointed out that studies based on the distribution of mass strandings give
little insight into the mechanisms driving such behaviour but rather indicate where or
when strandings are more likely to occur (Bradshaw et al. 2005). Contrary to these
hypotheses, the influence of social bonds on mass strandings lacks data for

Chapter five: Social dynamic of pilot whale mass strandings
125
statistical testing or modelling. For instance, it is particularly difficult to infer strength
of social bonds in cetaceans, and in general, long-term studies are required to reach
this aim (Bigg et al. 1990).
However, in long-finned pilot whales (Globicephala melas), which is the primary
species involved in mass strandings around the world, some assumptions can be
made about their social bonds. Because of their propensity to mass strand, but also
because of their herding behaviour when they are hunted by whalers, long-finned
pilot whales have long been thought to be highly social in nature (Kritzler 1952).
Genetic studies, initially conducted on the groups caught in the drive-kill fisheries of
the Faroe Islands (Amos et al. 1991, Amos et al. 1993, Fullard 2000), and now on
mass strandings from around New Zealand (Chapter 4), have started to provide
explanations of these behaviours. These studies indicate some level of philopatry to
the natal group for both males and females after reaching sexual maturity (a pattern
thought to be rare in mammals). Therefore, although a lot remains to be explained
on their social system, it appears that sociality in long-finned pilot whales is at least
in part driven by kinship.
In New Zealand, where mass strandings of long-finned pilot whales are common
(Baker 1981), pioneering descriptions by naturalist Frank D. Robson have largely
influenced the public views on these events. They have also helped to develop
successful prevention and rescue techniques to save stranded whales (techniques
which were notably taken up by Project Jonah, a non-profit organisation devoted to
whale rescue, S. Gibney pers. comm.). Robson put particular emphasis on
describing the behaviour of the whales just before and during a stranding (Robson
1984). Based on 16 years of field experience, he noticed that the species
responsible for large mass strandings, such as long-finned pilot whales, exhibit a
typical pre-stranding behavioural pattern. This can be summarized as follows: the
herd (as referred to by Robson) stops its normal travelling behaviour and alters its
swimming style to engage in a vigorous milling on the surface (circling in a tight
group); within minutes (although apparently this behaviour can last much longer,
Geraci & Lounsbury 1993), an individual, the ‘key whale’, detaches from the herd
and swims toward the shallows; once grounded, this ‘key whale’ begins to emit
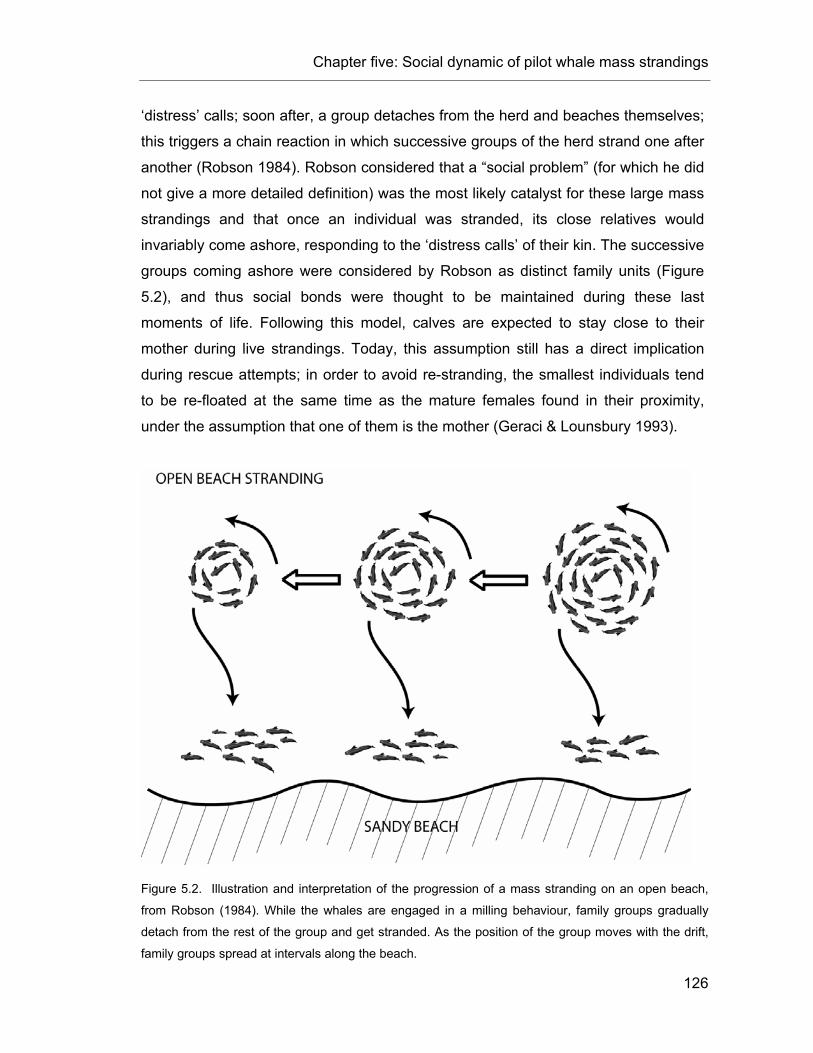
Chapter five: Social dynamic of pilot whale mass strandings
126
‘distress’ calls; soon after, a group detaches from the herd and beaches themselves;
this triggers a chain reaction in which successive groups of the herd strand one after
another (Robson 1984). Robson considered that a “social problem” (for which he did
not give a more detailed definition) was the most likely catalyst for these large mass
strandings and that once an individual was stranded, its close relatives would
invariably come ashore, responding to the ‘distress calls’ of their kin. The successive
groups coming ashore were considered by Robson as distinct family units (Figure
5.2), and thus social bonds were thought to be maintained during these last
moments of life. Following this model, calves are expected to stay close to their
mother during live strandings. Today, this assumption still has a direct implication
during rescue attempts; in order to avoid re-stranding, the smallest individuals tend
to be re-floated at the same time as the mature females found in their proximity,
under the assumption that one of them is the mother (Geraci & Lounsbury 1993).
Figure 5.2. Illustration and interpretation of the progression of a mass stranding on an open beach,
from Robson (1984). While the whales are engaged in a milling behaviour, family groups gradually
detach from the rest of the group and get stranded. As the position of the group moves with the drift,
family groups spread at intervals along the beach.

Chapter five: Social dynamic of pilot whale mass strandings
127
As Robson’s hypotheses were empirical, not experimental, G.S. Saayman noted in
the forewords of Robson’s book, published in 1984, that some of his theories were
likely to “raise eyebrows in ‘scientific’ circles”. However, 20 years later and after
thousands of whales have been re-floated, Robson’s observations still constitute the
most complete published observations on the behaviour of whales before and during
mass strandings, providing an interesting framework to test hypotheses on the social
dynamics of these events.
In this chapter, a large mass stranding of long-finned pilot whales on a beach of
Stewart Island, New Zealand in January 2003, was investigated in order to explore
the assumption that social bonds were maintained throughout the stranding. To do
so, advantage was taken of molecular techniques (based on microsatellite loci
variability) to estimate kinship and infer parentage. First, spatial autocorrelation
analyses and Mantel tests of matrix correlation were used to test the hypothesis that
genetically related individuals were more likely to have stranded in geographic
proximity than expected by chance. Then, pairs of mother-and-calf were searched to
test the hypothesis that these bonds (likely to represent the strongest social
connections in the group) were preserved during the stranding.
5.3. Materials & Methods
5.3.1. Circumstances of the stranding
On January 8 2003, 159 long-finned pilot whales were reported to have live-stranded
on a sandy beach at the Old Sand Neck on Stewart Island, New Zealand (46° 58’ S,
168° 11’ E, Figure 5.3). The whales were lying on the high tide line, suggesting that
the stranding happened around 6:30 in the morning. About 60% of the whales were
already dead by the time a rescue team from the Department of Conservation (DoC)
arrived on site, around midday. Deaths were thought to be mainly due to overheating
(DoC, Debrief notes and recommendations). A total of 37 whales were refloated and
herded out to sea. The re-floating effort was apparently a success with no sign of re-
stranding on the following days (although two whales, with healing skin damage, live-
stranded at a different location of the island on January 25).

Chapter five: Social dynamic of pilot whale mass strandings
128
Figure 5.3. Geographical location of the mass stranding of long-finned pilot whales at Stewart Island
(indicated by the astericks), in 2003, with a larger perspective of the position of New Zealand in the
South Pacific.
5.3.2. Data collection
Data were collected from the 122 whales that died on the beach (i.e., 77% of the
whales initially stranded); this included total length measurements (from tip of upper
jaw to deepest part of fluke notch), sex identification (from mammary slits
observation) and collection of skin samples. All samples were transferred to the
laboratory of Molecular Ecology and Evolution at the University of Auckland, where
they were preserved in 70% ethanol and stored at -20°C for subsequent analyses.

Chapter five: Social dynamic of pilot whale mass strandings
129
In addition to these data, the distribution of the whales on the beach was manually
mapped by Helen Kettles, DoC Southland. The resulting map is not precise in terms
of distances, but give an accurate picture of the position of the whales relative to
each other, as confirmed by aerial and beachside photographs (Figure 5.1). A high
tide occurred between the stranding and the time of data collection, slightly modifying
the initial positions where the whales beached, but this was not more than a few
meters (H. Kettles, pers. comm.). Thus these positions were thought to be
representative of the location where the whales initially beached themselves. The
carcasses were spread out along 150 meters, with no clear cluster of individuals
(Figure 5.1). Based on the map, Y-axis and X-axis coordinates were allocated to
each individual using an arbitrary linear scale.
5.3.3. DNA extraction and microsatellite genotyping
Total cellular DNA was extracted from skin samples using methods reported in
Chapter 2. Samples were genotyped using polymerase chain reaction (PCR) with a
panel of 20 previously published microsatellite loci developed from different cetacean
species (Table 5.1, Appendix 1). PCR products were sized using an ABI 377 or ABI
3100 DNA automated sequencer, and analysed with the softwares GeneScan v. 3.7
and Genotyper v. 3.7 (Applied Biosystems Inc.). The average probability of identity,
PID, was calculated from the formula of Paetkau & Strobeck (1994), using GenAlEx v.
6 (Peakall & Smouse 2005). See Chapter 2, section 2.3.6, for a definition of the PID.
To verify the suitability of the 20 loci for kinship analyses, I tested for deviation from
Hardy-Weinberg equilibrium and linkage disequilibrium using the program Genepop
v. 3.4 (Raymond & Rousset 1995). The potential frequency of null alleles was
estimated using ML-Relate (Kalinowski et al. 2006). The rate of genotyping error was
estimated by re-genotyping an average of 73 individuals per loci, calculating the ratio
between the observed number of allelic differences and the total number of allelic
comparisons (Bonin et al. 2004).

Chapter five: Social dynamic of pilot whale mass strandings
130
Table 5.1. Microsatellite diversity of long-finned pilot whales from the mass stranding of Stewart Island
2003.
Locus n T°A k HO HE HWE p-value
Null Allele Frequency References
409/470 122 45 10 0.885 0.822 0.513 0.000 Amos et al. (1993) 415/416 122 45 9 0.795 0.795 0.150 0.023 Amos et al. (1993) 464/465 122 45 9 0.648 0.681 0.699 0.017 Amos et al. (1993) DlrFCB1 122 50 11 0.672 0.754 0.295 0.024 Buchanan et al. (1996) DlrFCB6 122 62 7 0.656 0.658 0.170 0.000 Buchanan et al. (1996) EV1 122 45 11 0.713 0.718 0.958 0.000 Valsecchi & Amos (1996) EV37 122 50 8 0.795 0.740 0.521 0.000 Valsecchi & Amos (1996) EV94 120 50 5 0.667 0.654 0.604 0.000 Valsecchi & Amos (1996) GATA53 122 55 8 0.869 0.838 0.662 0.001 Palsbøll et al (1997) GT6 122 60 7 0.221 0.227 0.819 0.000 Caldwell et al. (2002) GT23 122 55 4 0.500 0.452 0.527 0.000 Bérubé et al. (2000) GT39 121 62 4 0.537 0.504 0.345 0.000 Caldwell et al. (2002) GT51 122 60 3 0.336 0.321 0.632 0.000 Caldwell et al. (2002) GT575 122 50 10 0.787 0.822 0.282 0.009 Bérubé et al. (2000) MK5 122 55 7 0.516 0.465 0.826 0.000 Krützen et al. (2001) MK6 122 55 3 0.082 0.079 1.000 0.000 Krützen et al. (2001) MK8 122 50 11 0.877 0.815 0.614 0.000 Krützen et al. (2001) MK9 120 50 4 0.625 0.618 0.774 0.000 Krützen et al. (2001) Ppho110 122 50 5 0.164 0.163 0.607 0.000 Rosel et al. (1999) Ppho131 122 50 10 0.811 0.767 0.224 0.000 Rosel et al. (1999) Average - - 7 0.608 0.595 - 0.004 - n is the number of screened individuals, T°A is the annealing temperature applied during polymerase
chain reactions and k is the number of alleles found. HO is the observed heterozygosity and HE is the
expected heterozygosity. HWE p-value refers to the results of the exact tests for deviation of Hardy-
Weinberg equilibrium. The PCR cycling profile was [93°-2', (92°-30", T°A-45", 72°-50") 15x, (89°-30",
T°A-45", 72°-50") 20x, 72°-3'], except for GT6 and GT51, which were amplified using the profile
reported by the original paper.
5.3.4. Age/sex class
The whales were classified into four categories (female mature, male mature, female
immature and male immature) based on sex and length measurement information, as
described in Chapter 4. A fifth category was considered here to represent the
youngest calves thought to be un-weaned, i.e., still dependent on their mothers for
lactation; they were referred to as ‘un-weaned calves’. Growth and reproduction
parameters estimated from studies of long-finned pilot whales in the Faroe Islands
were also used to confirm the length threshold for this fifth category. The mean
duration of lactation in long-finned pilot whale has been estimated at 3.4 years

Chapter five: Social dynamic of pilot whale mass strandings
131
(Martin & Rothery 1993). The average length of female and male calves just before
this age, i.e., 3 years old, has been estimated at 309 cm (SE = 1.9) and 317 cm (SE
= 2.6), respectively (Block et al. 1993). Therefore, based on these estimates, all the
immature whales measuring 300 cm or less were classified as ‘un-weaned calves’. In
order to confirm field observations, sex of the whales was genetically identified by
amplification of a fragment of the sry gene multiplexed with ZFX positive control,
following the protocol of Gilson et al. (1998). Sex PCRs were conducted twice to
confirm the results (which did not yield any inconsistencies).
5.3.5. Spatial autocorrelation analyses
To investigate the hypothesis that related individuals were more likely to be found
closer to each other on the beach than expected by chance, analysis of global spatial
auto-correlation was conducted (following the term used by Anselin 1995). This
analysis requires pairwise geographic and pairwise squared genetic distance
matrices individuals. Genetic distances were calculated as outlined in Peakall et al.
(1995) and Smouse & Peakall (1999). The program GenAlEx was used to generate
these matrices based on individual spatial coordinates and genotypic information.
The method developed by Smouse and Peakall (1999), also implemented in
GenAlEx, was used. It employs a multivariate approach to simultaneously assess the
spatial signal generated by multiple genetic loci. This analysis generates an
autocorrelation coefficient R for each distance class, providing a measure of the
genetic similarity between pairs of individuals whose geographic separation falls
within the specified distance class. Here, the data were analysed for several sizes of
distance class, ranging from 25 to 200 units (arbitrary scale). By varying distance
class size, the presence of spatial genetic structure was investigated using different
average number of individuals per distance class. Statistical significance was tested
by 10,000 random permutations.
5.3.6. Relatedness analyses
Autocorrelation coefficients such as R are closely related with estimates of
relatedness (Banks et al. 2005). However, they do not provide a surrogate measure

Chapter five: Social dynamic of pilot whale mass strandings
132
of genealogical relationships. In order to test further for a correlation between kinship
and spatial distribution, the pairwise relatedness (rML) was calculated between all
individuals of the mass stranding, using Milligan’s (2003) maximum-likelihood
estimator (values of this estimator range from 0 to 1, see Chapter 4 for details), as
implemented in the program ML-Relate. To detect a potential correlation, the
obtained matrix of relatedness indices was compared to the matrix of geographic
distances using a Mantel test of matrix correlation (Mantel 1967) with Monte-Carlo
simulation (10,000 permutations), as implemented in GenAlEx. Since Mantel tests
can be affected by extreme values (Dietz 1983), a similar test was conducted using a
different method to estimate pairwise coefficients of relatedness where the values
can range from -1 to 1; the estimator rQG, developed by Queller & Goodnight (1989)
was chosen. A comparison between the two estimators illustrate the effect of extreme
negative values on the Mantel test results (see Results section).
5.3.7. Parentage analyses
The maintenance of social bonds during the mass stranding was investigated using
parentage analyses. Here, I focused on inferring the mother of immature individuals,
assuming that the mother-and-calf pairs were likely to represent the strongest social
bonds in the group. Distinction was made between the ‘un-weaned calves’ and the
other immature whales.
Maternity of all immature whales was inferred using the strict-exclusion approach and
the likelihood-based approach implemented in the program Cervus v. 2.0 (Marshall et
al. 1998). See Chapter 4 for details on the methods. For the strict-exclusion
approach, any mature females showing no mis-matching locus with the genotype of
an offspring were considered as a ‘potential mother’. This approach is likely to avoid
false negative (i.e., excluding a female that really is the mother) if genotyping error is
low. On the other hand, several putative mothers can potentially be assigned to the
same offspring. An important strength of this approach is to provide information on
the number of calves found to have no ‘potential mother’ in the dataset.
The likelihood-based approach offers complementary results as it is more
conservative than the strict-exclusion method. To limit type I errors (i.e, false positive

Chapter five: Social dynamic of pilot whale mass strandings
133
parentage), I applied conservative parameters to run the simulation used by Cervus
to address statistical significance. These parameters were set as follows: 10,000
candidate parents (the maximum allowed by Cervus); 10% of the parents sampled;
99.8% of the loci typed; genotyping error of 0.005; and presence of five relatives at r
= 0.5 for each candidate parent. I report the pairs with 80 and 95% confidence levels
for ∆-values.
A Mantel test of matrix correlation with Monte-Carlo simulation (10,000 permutations)
was used to test for a non-random relationship between mother-and-calf bonds and
position on the beach (Mantel 1967). The matrices were restricted to mature females
and immature whales involved in a pair of mother-and-calf inferred from parentage
analysis. For the kinship matrix, pairs of mother-and-calf were denoted as ‘one’, while
all other pairs were denoted as ‘zero’. The test was conducted with the program
GenAlEx.
5.4. Results
5.4.1. Sex/age class information
Field observations (confirmed by molecular analyses) revealed that 76 females and
46 males were present among the beached whales. All individuals except two were
allocated concordant sex information from the examination of mammary slits in the
field and the sex PCR in the laboratory (Glo097 and Glo162 were judged to be
females in the field but males by PCR). It was chosen to give the priority to the
molecular sexing for conflicting results but the possibility that these sample tubes
were mislabelled, and thus that the initial sex identification was correct, cannot be
discounted. However, it is unlikely that the potential mix-up of two samples had a
substantial effect on the general tendency of the results.
The sex/age group composition was as follows: 56 mature females (46%), 14 mature
males (11.5%), 20 immature females (16%) and 32 immature males (26.5%). Among
immature whales, eight females and nine males were classified as ‘un-weaned
calves’ (i.e., ‘un-weaned calves’ represented 14% of the total dead stranded).

Chapter five: Social dynamic of pilot whale mass strandings
134
5.4.2. Microsatellite analyses
The 122 whales were genotyped for 18 to 20 loci, providing an average PID of 5.48 x
10-16. The number of alleles per locus varied from 3 to 11 (7.3 on average) and the
level of heterozygosity ranged from 0.082 to 0.881 (average 0.608; Table 5.1). No
significant deviation from the Hardy-Weinberg equilibrium (Table 5.1) or evidence of
linkage disequilibrium was found for the 20 loci (results not shown). Estimates of null
alleles were low for all loci (Table 5.1). A total of 10 errors (spread over seven loci)
were found after re-genotyping 3541 alleles (six allelic dropouts and four human
errors), giving an estimated error rate of 0.0028 per allele.
5.4.3. Spatial autocorrelation analyses
Based on the arbitrary linear scale, the whales were spread out on a range of about
1400 units on the X-axis and 60 units on the Y-axis, where 1400 units represent
approximately 150 metres. Average distance between two individuals was 415 units
(~ 45 m), ranging from 5 to 1391 units. The results of the global autocorrelation
analyses found no significantly positive R within any of the distance class sizes
considered here. These results for distance class sizes of 50 and 200 are
summarised by a correlogram where the autocorrelation coefficients R are plotted as
a function of distance (Figure 5.4). All R were found to fall between the upper and
lower 95% confidence limits (correlograms are not shown for 25 and 100 distance
class sizes but results were similar to correlograms shown in Figure 5.4).
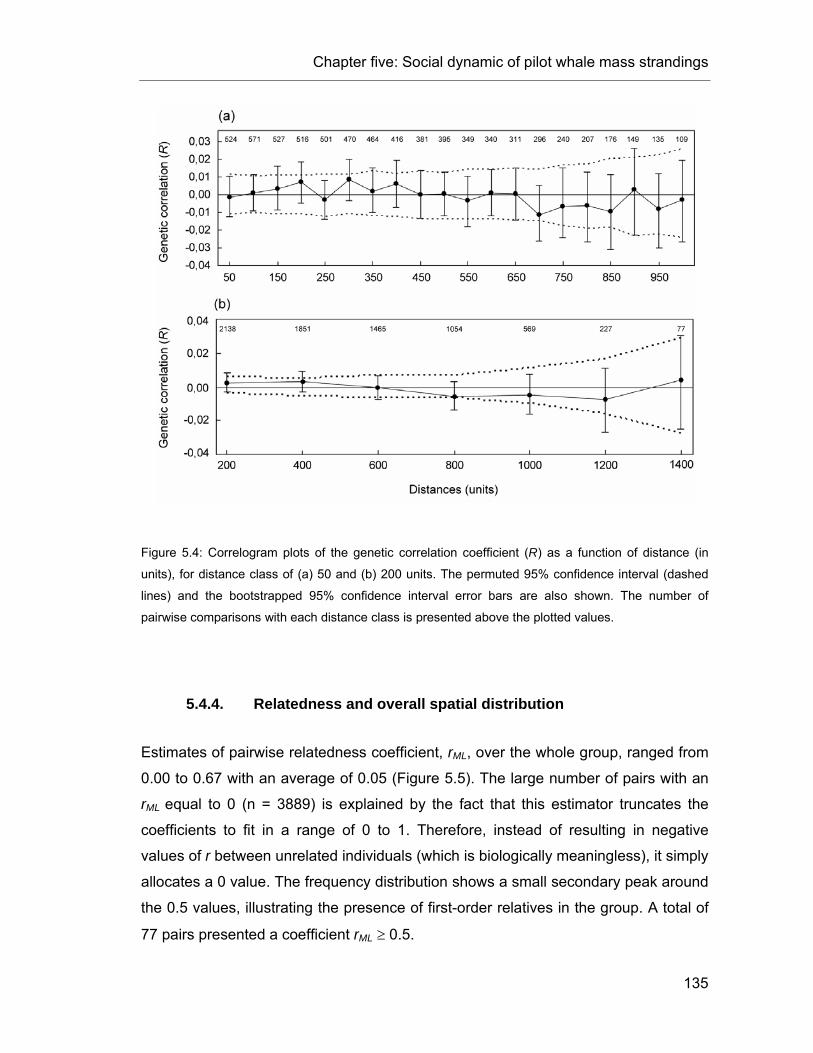
Chapter five: Social dynamic of pilot whale mass strandings
135
Figure 5.4: Correlogram plots of the genetic correlation coefficient (R) as a function of distance (in
units), for distance class of (a) 50 and (b) 200 units. The permuted 95% confidence interval (dashed
lines) and the bootstrapped 95% confidence interval error bars are also shown. The number of
pairwise comparisons with each distance class is presented above the plotted values.
5.4.4. Relatedness and overall spatial distribution
Estimates of pairwise relatedness coefficient, rML, over the whole group, ranged from
0.00 to 0.67 with an average of 0.05 (Figure 5.5). The large number of pairs with an
rML equal to 0 (n = 3889) is explained by the fact that this estimator truncates the
coefficients to fit in a range of 0 to 1. Therefore, instead of resulting in negative
values of r between unrelated individuals (which is biologically meaningless), it simply
allocates a 0 value. The frequency distribution shows a small secondary peak around
the 0.5 values, illustrating the presence of first-order relatives in the group. A total of
77 pairs presented a coefficient rML ≥ 0.5.
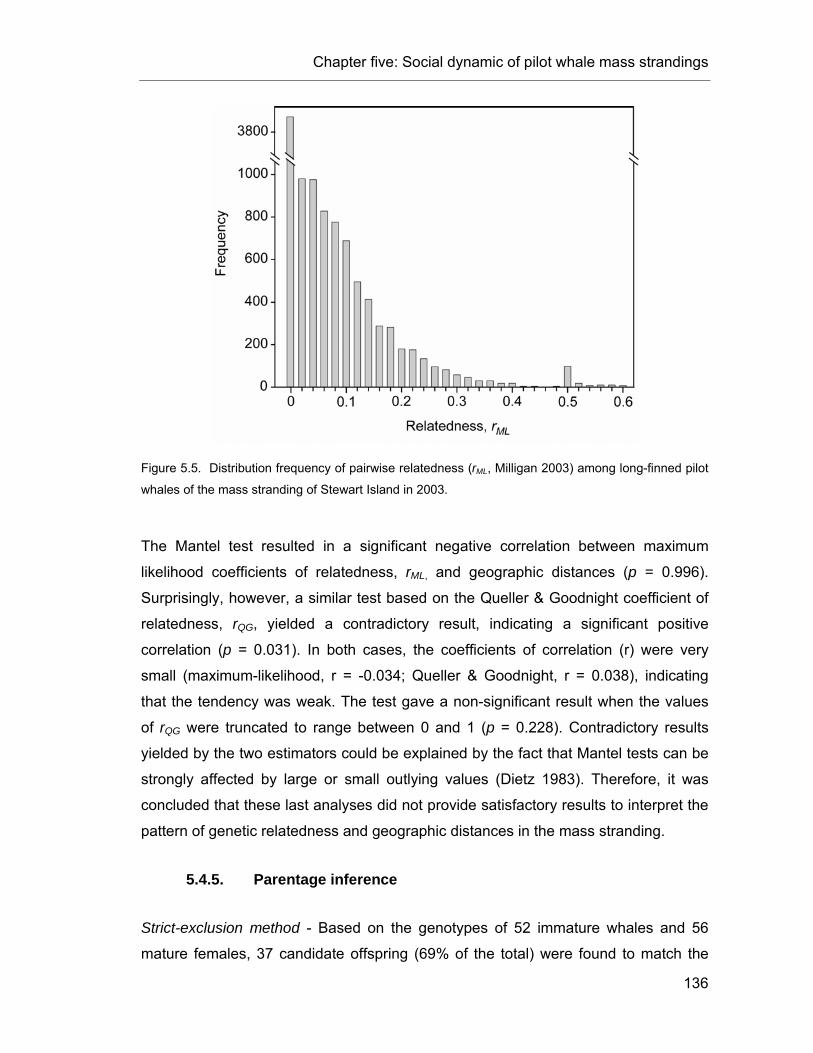
Chapter five: Social dynamic of pilot whale mass strandings
136
Figure 5.5. Distribution frequency of pairwise relatedness (rML, Milligan 2003) among long-finned pilot
whales of the mass stranding of Stewart Island in 2003.
The Mantel test resulted in a significant negative correlation between maximum
likelihood coefficients of relatedness, rML, and geographic distances (p = 0.996).
Surprisingly, however, a similar test based on the Queller & Goodnight coefficient of
relatedness, rQG, yielded a contradictory result, indicating a significant positive
correlation (p = 0.031). In both cases, the coefficients of correlation (r) were very
small (maximum-likelihood, r = -0.034; Queller & Goodnight, r = 0.038), indicating
that the tendency was weak. The test gave a non-significant result when the values
of rQG were truncated to range between 0 and 1 (p = 0.228). Contradictory results
yielded by the two estimators could be explained by the fact that Mantel tests can be
strongly affected by large or small outlying values (Dietz 1983). Therefore, it was
concluded that these last analyses did not provide satisfactory results to interpret the
pattern of genetic relatedness and geographic distances in the mass stranding.
5.4.5. Parentage inference
Strict-exclusion method - Based on the genotypes of 52 immature whales and 56
mature females, 37 candidate offspring (69% of the total) were found to match the

Chapter five: Social dynamic of pilot whale mass strandings
137
genotype of candidate mothers with a minimum of one allele at each locus, that is,
under the strict exclusion method (Table 5.2). Among them, three were found to
match more than one mature female (Glo110; Glo131; Glo211). For the remaining
34, all except one mature female were excluded as potential mothers. No potential
mother could be found based on strict-exclusion for 15 candidate offspring, including
six ‘un-weaned calves’.
Likelihood-based method - The likelihood-based approach gave more conservative
results with 17 and 11 assignments of offspring to a most-likely mother at 80 and
95% confidence level, respectively (Table 5.2). Although a genotyping error of 0.005
was allowed for the simulation (i.e., a value above the estimated genotyping error),
none of the pairs proposed by Cervus showed mismatching locus (i.e., all agreed
with results of the strict-exclusion method). Five ‘un-weaned calves’ were assigned a
most-likely mother at 80% confidence level, and three at 95% confidence level (Table
5.2). Therefore, nine ‘un-weaned calves’ were unassigned based on likelihood.
Spatial distribution of mother-and-calf pairs - The distribution on the beach of mother-
and-calf pairs inferred by Cervus showed no obvious pattern of geographic
association, regardless of the level of confidence considered for parentage inference
(Figure 5.6). There was no pattern either when only considering the pairs of mothers
and ‘un-weaned calves’ (Figure 5.6A). The average distance between assigned
mother-and-calf pairs showed little difference from the overall average distance
between any two individuals from the mass stranding (i.e, d = 415 units). Indeed,
average distance between any mother-and-calf was 404 or 433 when considering
pairs assigned using strict-exclusion or likelihood 80% confidence, respectively
(Mann-Whitney U test; p = 0.75 and p = 0.86, respectively). Interestingly, when
considering pairs assigned using likelihood 95% confidence, the average distance
was even higher (615 units) than the average distance between any two individuals
(Mann-Whitney U test; p = 0.03). A Mantel test showed no relationship between
kinship (mother-and-calf against others) and distance between individuals on the
beach, and this was consistent when considering pairs inferred by strict-exclusion (p
= 0.636), likelihood 80% confidence (p = 0.551) and likelihood 95% confidence (p =
0.071).
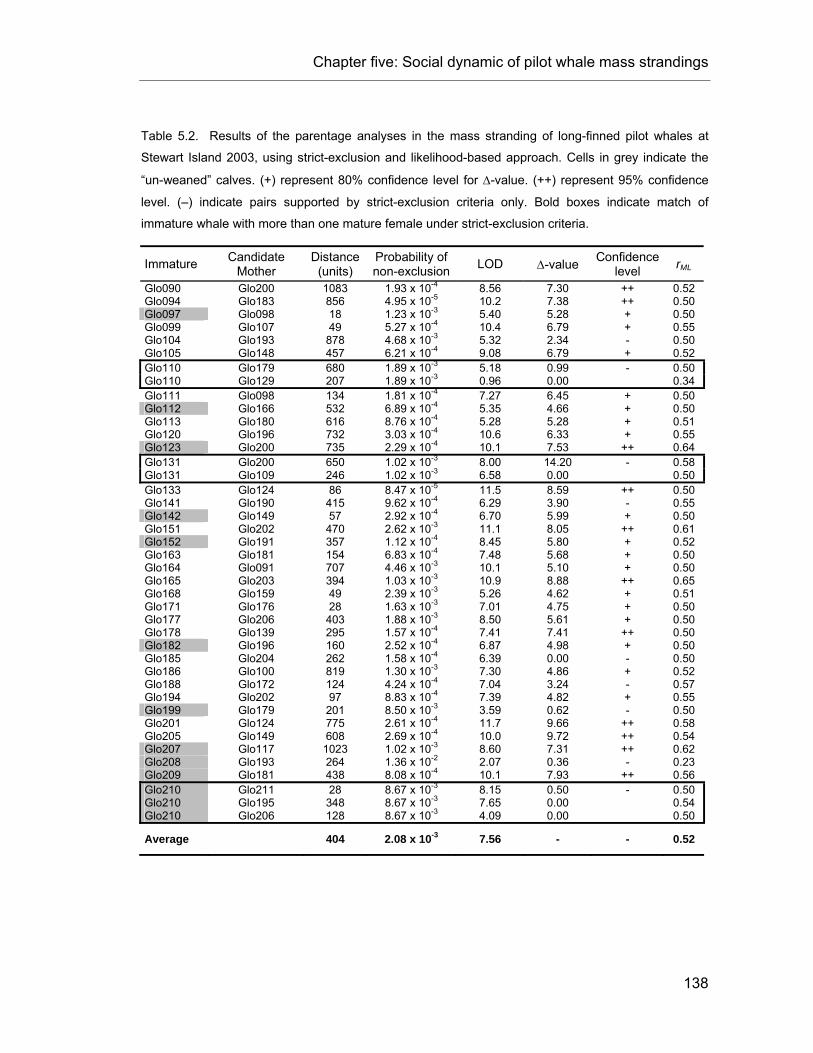
Chapter five: Social dynamic of pilot whale mass strandings
138
Table 5.2. Results of the parentage analyses in the mass stranding of long-finned pilot whales at
Stewart Island 2003, using strict-exclusion and likelihood-based approach. Cells in grey indicate the
“un-weaned” calves. (+) represent 80% confidence level for ∆-value. (++) represent 95% confidence
level. (–) indicate pairs supported by strict-exclusion criteria only. Bold boxes indicate match of
immature whale with more than one mature female under strict-exclusion criteria.
Immature Candidate Mother
Distance (units)
Probability of non-exclusion LOD ∆-value Confidence
level rML
Glo090 Glo200 1083 1.93 x 10⁻⁴ 8.56 7.30 ++ 0.52 Glo094 Glo183 856 4.95 x 10⁻⁵ 10.2 7.38 ++ 0.50 Glo097 Glo098 18 1.23 x 10⁻³ 5.40 5.28 + 0.50 Glo099 Glo107 49 5.27 x 10⁻⁴ 10.4 6.79 + 0.55 Glo104 Glo193 878 4.68 x 10⁻³ 5.32 2.34 - 0.50 Glo105 Glo148 457 6.21 x 10⁻⁴ 9.08 6.79 + 0.52 Glo110 Glo179 680 1.89 x 10⁻³ 5.18 0.99 - 0.50 Glo110 Glo129 207 1.89 x 10⁻³ 0.96 0.00 0.34 Glo111 Glo098 134 1.81 x 10⁻⁴ 7.27 6.45 + 0.50 Glo112 Glo166 532 6.89 x 10⁻⁴ 5.35 4.66 + 0.50 Glo113 Glo180 616 8.76 x 10⁻⁴ 5.28 5.28 + 0.51 Glo120 Glo196 732 3.03 x 10⁻⁴ 10.6 6.33 + 0.55 Glo123 Glo200 735 2.29 x 10⁻⁴ 10.1 7.53 ++ 0.64 Glo131 Glo200 650 1.02 x 10⁻³ 8.00 14.20 - 0.58 Glo131 Glo109 246 1.02 x 10⁻³ 6.58 0.00 0.50 Glo133 Glo124 86 8.47 x 10⁻⁵ 11.5 8.59 ++ 0.50 Glo141 Glo190 415 9.62 x 10⁻⁴ 6.29 3.90 - 0.55 Glo142 Glo149 57 2.92 x 10⁻⁴ 6.70 5.99 + 0.50 Glo151 Glo202 470 2.62 x 10⁻³ 11.1 8.05 ++ 0.61 Glo152 Glo191 357 1.12 x 10⁻⁴ 8.45 5.80 + 0.52 Glo163 Glo181 154 6.83 x 10⁻⁴ 7.48 5.68 + 0.50 Glo164 Glo091 707 4.46 x 10⁻³ 10.1 5.10 + 0.50 Glo165 Glo203 394 1.03 x 10⁻³ 10.9 8.88 ++ 0.65 Glo168 Glo159 49 2.39 x 10⁻³ 5.26 4.62 + 0.51 Glo171 Glo176 28 1.63 x 10⁻³ 7.01 4.75 + 0.50 Glo177 Glo206 403 1.88 x 10⁻³ 8.50 5.61 + 0.50 Glo178 Glo139 295 1.57 x 10⁻⁴ 7.41 7.41 ++ 0.50 Glo182 Glo196 160 2.52 x 10⁻⁴ 6.87 4.98 + 0.50 Glo185 Glo204 262 1.58 x 10⁻⁴ 6.39 0.00 - 0.50 Glo186 Glo100 819 1.30 x 10⁻³ 7.30 4.86 + 0.52 Glo188 Glo172 124 4.24 x 10⁻⁴ 7.04 3.24 - 0.57 Glo194 Glo202 97 8.83 x 10⁻⁴ 7.39 4.82 + 0.55 Glo199 Glo179 201 8.50 x 10⁻³ 3.59 0.62 - 0.50 Glo201 Glo124 775 2.61 x 10⁻⁴ 11.7 9.66 ++ 0.58 Glo205 Glo149 608 2.69 x 10⁻⁴ 10.0 9.72 ++ 0.54 Glo207 Glo117 1023 1.02 x 10⁻³ 8.60 7.31 ++ 0.62 Glo208 Glo193 264 1.36 x 10⁻² 2.07 0.36 - 0.23 Glo209 Glo181 438 8.08 x 10⁻⁴ 10.1 7.93 ++ 0.56 Glo210 Glo211 28 8.67 x 10⁻³ 8.15 0.50 - 0.50 Glo210 Glo195 348 8.67 x 10⁻³ 7.65 0.00 0.54 Glo210 Glo206 128 8.67 x 10⁻³ 4.09 0.00 0.50 Average 404 2.08 x 10⁻³ 7.56 - - 0.52
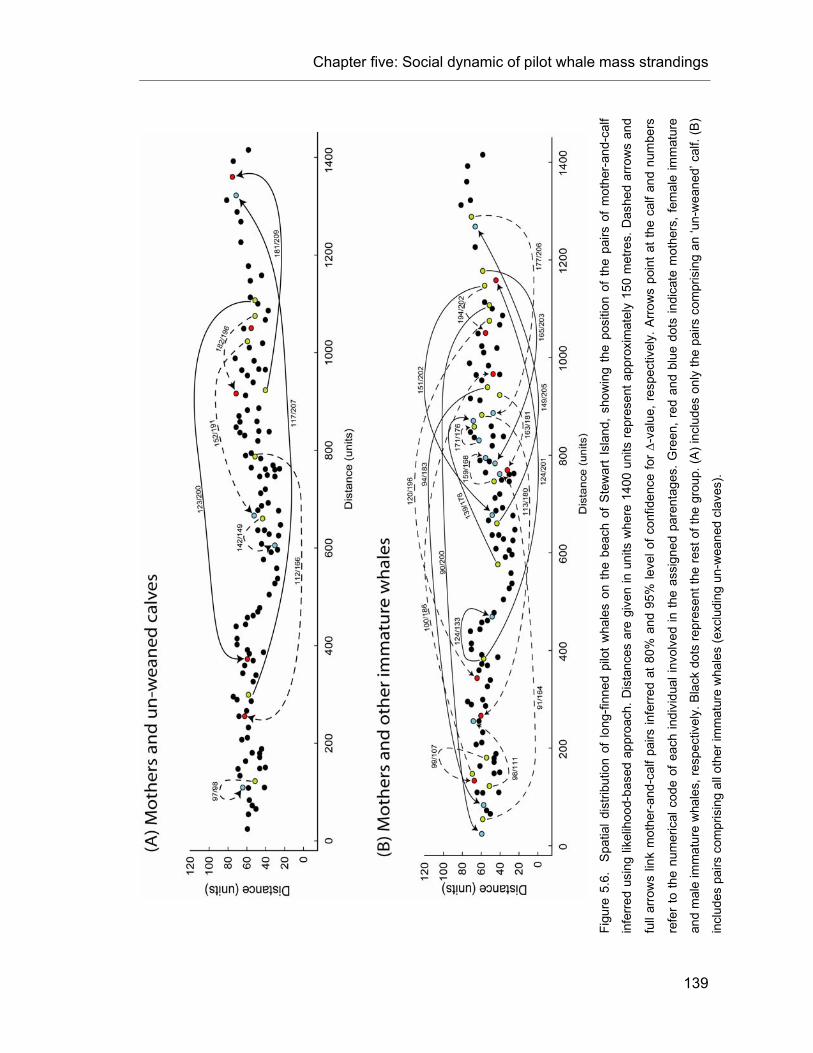
Chapter five: Social dynamic of pilot whale mass strandings
139
Figu
re 5
.6.
Spa
tial d
istri
butio
n of
long
-finn
ed p
ilot
wha
les
on t
he b
each
of
Ste
war
t Is
land
, sh
owin
g th
e po
sitio
n of
the
pai
rs o
f m
othe
r-an
d-ca
lf
infe
rred
usin
g lik
elih
ood-
base
d ap
proa
ch. D
ista
nces
are
giv
en in
uni
ts w
here
140
0 un
its re
pres
ent a
ppro
xim
atel
y 15
0 m
etre
s. D
ashe
d ar
row
s an
d
full
arro
ws
link
mot
her-
and-
calf
pairs
infe
rred
at 8
0% a
nd 9
5% le
vel o
f con
fiden
ce fo
r ∆-
valu
e, r
espe
ctiv
ely.
Arro
ws
poin
t at t
he c
alf a
nd n
umbe
rs
refe
r to
the
num
eric
al c
ode
of e
ach
indi
vidu
al in
volv
ed in
the
assi
gned
par
enta
ges.
Gre
en, r
ed a
nd b
lue
dots
indi
cate
mot
hers
, fem
ale
imm
atur
e
and
mal
e im
mat
ure
wha
les,
resp
ectiv
ely.
Bla
ck d
ots
repr
esen
t the
rest
of t
he g
roup
. (A
) inc
lude
s on
ly th
e pa
irs c
ompr
isin
g an
‘un-
wea
ned’
cal
f. (B
)
incl
udes
pai
rs c
ompr
isin
g al
l oth
er im
mat
ure
wha
les
(exc
ludi
ng u
n-w
eane
d cl
aves
).
Chapter five: Social dynamic of pilot whale mass strandings
140
5.5. Discussion
The analyses of spatial auto-correlation presented here showed that there was no
correlation between position of the whales on the beach and genetic distances in the
stranding event of Stewart Island 2003. This is contrary to the assumption that
kinship bonds are maintained during mass strandings. The pattern of social
disruption was further confirmed by a striking separation of the pairs of mother-and-
calf along the beach. In most cases, even the younger calves (‘un-weaned calves’),
thought to be highly dependant on lactation, were not found close to their mother
(Figure 5.6).
5.5.1. Missing mothers
Interestingly, no potential mother was found for a substantial number of immature
whales (including six ‘un-weaned calves’) that died during this mass stranding, even
when considering the less conservative method of parentage assignment (i.e., strict-
exclusion). The absence of some candidate mothers could be explained by
genotyping errors when using strict-exclusion. However, my estimate of genotyping
error rate was low enough to suggest that it is probably not the primary explanation.
The true mothers could also have simply been absent from the group which mass
stranded. Indeed, many uncertainties remain on the social organisation of long-finned
pilot whales (see Chapter 4). Dispersal of juveniles from the matrilineal group when
they approach maturity, could be more frequent than previously thought, as observed
in transient killer whales of the eastern North Pacific (Baird & Whitehead 2000). In
this case, some juveniles from the Stewart Island mass stranding could have been
immigrant which had recently joined the group, explaining the absence of their
mother among the stranded whales. However, this is unlikely to explain the absence
of mothers for the ‘un-weaned calves’. Another potential explanation is that several of
these ‘mothers’ were successfully re-floated while their calves died on the beach. If
this is confirmed, it would suggest that re-floated whales do not always restrand to
remain with close kin. Finally, some of these mothers may simply not have stranded
despite being initially in the same group as their calves. This could be the
consequence of a pre-stranding social disruption as described above, resulting in a
separation of kinship bonds before the stranding. An exhaustive sampling of the
Chapter five: Social dynamic of pilot whale mass strandings
141
whales involved in the stranding (including re-floated whales) is critical in explaining
these missing mothers.
5.5.2. Potential scenarios explaining social disruption
The unexpected pattern of social disruption obversed in the stranding raises an
interesting question; why were these whales separated from their kin during these
last moments of life, since they are assumed to form tight kinship bonds in the wild?
The answer to this question is not yet known but several scenarios could help explain
the observed pattern. The simpliest explanation would be that there is only weak
spatial autocorrelation with relatedness within free ranging groups of pilot whales and
thus, questioning the assumption of tight kinship bonds in the wild. In this case, the
social disruption observed on the shore would simply be a reflexion of the structure of
a normal group at sea. Such scenario can potentially explain the separation for some
of the mother and calf pairs. For instance, killer whale calves rarely leave their
mothers’ side during the first 6 months of life, but later may be accompanied by a few
other particular members of the social group in the absence of the mother (Haenel
1986). At time, calves of sperm whales are also known to be separated from their
mother, staying with other adults (babysitting), in particular during foraging bouts
(Whitehead 1996). Unfortunately, the strength and temporal pattern of mother and
calf associations is not well known in long-finned pilot whales, leaving this question
opened. Conversaly and assuming that kinship bonds are indeed tightly maintained
in the wild, alternate scenarios could explain this pattern of social disruption in which
the stranding would be a cause or a consequence of the disruption of kinship bonds.
Consequence of the stranding in a restricted area - The spatial distribution of
cetaceans after a mass stranding can show various configurations depending on the
event and where it takes place (Robson 1984). Sometimes the animals are
discontinuously distributed along the shore with obvious clusters of individuals
(Fehring & Wells 1976). In the case of Stewart Island, the whales were linearly
spread out over a fairly long section of the beach (150 meters) but with only subtle
clusters of individuals (Figure 5.1). This distribution suggests that if several groups
had stranded successively (i.e., following a typical mass stranding dynamic), they did
it close to each other and perhaps, on top of each other. Individuals from different
Chapter five: Social dynamic of pilot whale mass strandings
142
groups could thus have mixed together in the final stages of the stranding; therefore,
the pattern of distance-kinship investigated here might not offer a proper reflection of
the social dynamic of the event. It is unlikely, however, that this effect alone explains
why some mothers and calves were found at opposite ends of the stranding.
Consequence of the stranding of the ‘key whale’ - One potential explanation is that
the initial stranding of the ‘key whale’ was what provoked the social disruption in the
group. The stranding of this individual could have induced a panic reaction, followed
by the disorganised stranding of the rest of the group explaining the disruption of
kinship bonds. Various factors have been suggested as causes of stranding events;
for example, sick individual, disorientation, inshore feeding, and predator
harassment. Any of these, depending on the cases, could explain the initial stranding
of the ‘key whale’.
Cause of social interactions pre-stranding - Relatively little consideration has been
given to aggressive or competitive behaviours as causes of strandings. Yet, these
interactions could potentially be at the origin of the social disruption observed among
the whales of Stewart Island and, ultimately, a cause of stranding. Indeed, another
possible scenario is that social disruption occurs before any stranding event (even
before the stranding of the ‘key whale’) and that instead of being a consequence it
was the cause of the stranding. Although the analyses presented here failed to detect
the clustering of “family groups” suggested by Robson, this scenario concurs with his
observations of mass strandings as well as with some of his interpretations. Robson
wrote that the first individual to leave the milling herd, or ‘key whale’, “is usually
driven off by two or three adult females which do so by harassment rather than by
physical attack” (Robson did not propose any explanation for this behaviour).
Heading to the shore, the ‘key whale’ then strands possibly due to emotional
disorientation, inattention to its surroundings and reduced echolocation efficiency.
These interpretations suggest thus that strong social interactions (harassment) occur
before any stranding.
In agreement with this scenario, previous studies suggest that it is within these large
groups that reproductive behaviours, and thus competition to access mating, are

Chapter five: Social dynamic of pilot whale mass strandings
143
more likely to occur. Indeed, it has been emphasized in Chapter 4 that large stranded
groups are composed of multiple unrelated matrilines rather than one extended
matrilineal group. Since mature males seem to rarely mate with their kin, sexual
activity must occur mostly when several matrilineal groups travel together, that is, in
large groups. Note that studies on long-finned pilot whales in the North Atlantic have
found two peaks in the mating (or conception) season of long-finned pilot whales;
one in early summer and one in autumn (Sergeant 1962, Martin & Rothery 1993).
Interestingly, these periods of the year (inverted in the Southern Hemisphere) also
correspond to the peaks of pilot whale mass strandings around New Zealand (Baker
1981). Unfortunately, it was not possible, in the mass stranding of Stewart Island, to
confirm the presence of unrelated matrilines based on mitochondrial DNA analyses,
as all the whales shared the same and most common haplotype in long-finned pilot
whales from around New Zealand (see Chapter 3 & 4). However, this pattern was
probably the result of the very low mitochondrial genetic diversity (which obscures the
differences between unrelated matrilineal groups) rather than the expression of an
extended matrilineal group. On the other hand, a pattern of unrelated matrilineal
groups was supported by the large number of rML = 0 kinship pairs.
5.5.3. Management of future strandings and animal welfare
My results indicate that proximity on the beach is not a reliable way to identify the
mother of a calf during a rescue attempt and should not be used as a basis to re-float
them simultaneously. This mistaken assumption could help to explain the tendency of
many whales to re-strand even after being re-floated. Note, however, that many re-
stranding events may simply be explained with disorientation and weakness of the
whales resulting from the initial stranding event (Geraci & Lounsbury 1993). Further
studies, with improved data collection and more detailed observations of behaviour,
could provide a better understanding of mass strandings and recommendations for
improved efficiency of rescue efforts and animal welfare practices (e.g., reduced
distress of mothers and dependent young) during stranding events.
First, pre-stranding studies are required. Behavioural studies of long-finned pilot
whale groups in the wild are still lacking. A better understanding of their social
structure and mating system could provide new insights to the phenomenon of mass

Chapter five: Social dynamic of pilot whale mass strandings
144
stranding. This would allow comparisons of the behaviour of groups just before they
strand, helping to answer some critical questions. For instance, does milling
behaviour (typically observed before mass strandings) always result in a mass
stranding? Or is it just a normal behavioural state like others (such as travelling or
feeding), but which is sometimes followed by a mass stranding? Whenever possible,
behavioural and temporal information should also be recorded during the stranding
as this could be extremely valuable in investigating social dynamics of each event. In
particular, it would be interesting to know which whale stranded when and with which
other whale. Are these individuals adult or juvenile, male or female? Do these
individuals that strand at the same time and/or the same place, share close kinship
bonds?
Post-stranding, it would be highly beneficial to collect tissue samples on every animal
involved in the stranding, including individuals still alive. This would greatly improve
the outcome of subsequent molecular studies, giving a complete genetic picture of
the group. An appreciable benefit would be the possibility to re-identify stranded
whales (using highly variable markers such as microsatellites) in cases of re-
stranding in the following days, months or years. This could provide information on
the success of the re-floating effort, which is still a subject of debate regarding the
welfare of the animals. On a long-term basis, such data could help to confirm and
refine the pattern of social organisation as described in Chapter 4. It could also offer
valuable information on the home range of these pelagic species subject to mass
stranding. Finally, the deployment of satellite radio-tagging on multiple rescued
whales would also provide much information on the success of the re-floating effort,
the social organisation (to determine whether the animals remain associated within
the same group after being re-floated), and population structure.
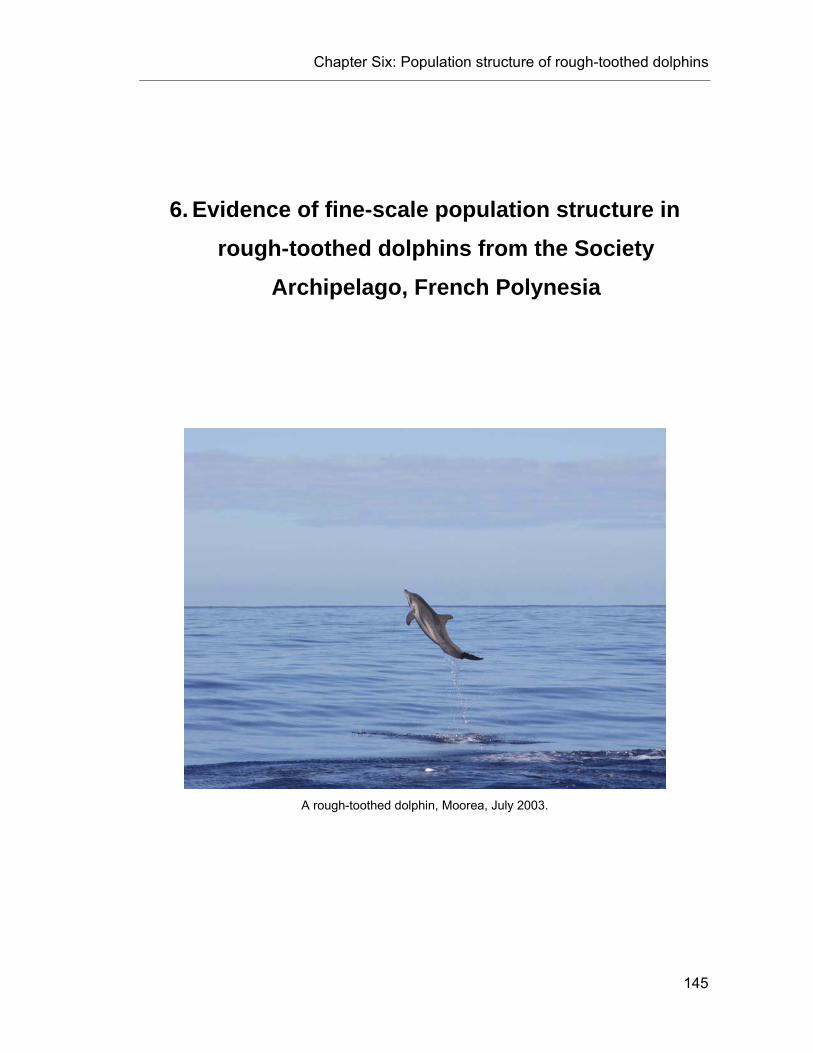
Chapter Six: Population structure of rough-toothed dolphins
145
6. Evidence of fine-scale population structure in rough-toothed dolphins from the Society
Archipelago, French Polynesia
A rough-toothed dolphin, Moorea, July 2003.

Chapter Six: Population structure of rough-toothed dolphins
146
6.1. Abstract
Rough-toothed dolphins (Steno bredanensis) are widespread in tropical and
subtropical waters around the globe and yet little is known about their population
structure, mating strategies or social organisation. Preliminary analyses of the
population structure and level of genetic diversity of rough-toothed dolphins in the
nearshore waters of the Society Archipelago, French Polynesia, were conducted.
Biopsy samples (n = 65) and dorsal fin photographs (n = 582) were collected
opportunistically during 189 non-dedicated small-boat surveys around the islands of
Moorea and Raiatea over three years (2002-04). Samples were sequenced for the
mitochondrial DNA (mtDNA) control region (450 base pairs consensus) and
genotyped for 15 microsatellite loci. Photographic and genetic recaptures around the
same island over different years indicate some level of site fidelity. Furthermore,
significant genetic differentiation was found between the two islands’ samples, at
both mitochondrial (FST = 0.60, p < 0.001) and nuclear levels (FST = 0.06, p < 0.005),
suggesting a local and relatively closed community structure, somewhat similar to
insular spinner dolphins. However, the level of mtDNA haplotype diversity within each
island sample was found to be surprisingly low (Moorea, h = 0.457; Raiatea, h =
0.167). This could be explained by a highly stable social structure, as observed in
matrilineal cetacean species such as long-finned pilot whales.

Chapter Six: Population structure of rough-toothed dolphins
147
6.2. Introduction
Rough-toothed dolphins, Steno bredanensis, are distributed in tropical to warm-
temperate waters around the world (Miyazaki & Perrin 1994). They are generally
found in depths > 500 m, where they seem to feed on a variety of fishes and
cephalopods. Usually described as an open-ocean species (Miyazaki & Perrin 1994),
recent studies in certain areas indicate that they are also found around ocean islands
and that they are not necessarily nomadic. Off La Gomera (Canary Islands), around
Utila in Honduras and in the Hawaiian Archipelago, photographic individual
recognition surveys (or photo-identification) have shown a high level of individual re-
sightings, suggesting the presence of resident populations (Mayr & Ritter 2005,
Kuczaj & Yeiter 2007, Baird et al. in press). In the Society Archipelago, French
Polynesia, previous studies have shown that rough-toothed dolphins are commonly
observed in nearshore waters (Nekoba-Dutertre et al. 1999, Gannier & West 2005),
which are defined here as waters between 500 m and 10 km from the barrier reef (<
500 m is considered here as inshore waters). Sightings also occur in offshore waters
(> 10 km from the barrier reef) but the rate of encounters is lower than in nearshore
waters (Gannier & West 2005). Thus, although not considered a coastal species,
sensu stricto, Steno bredanensis appears not to be strictly pelagic, and in some
areas around the world shows a predominantly nearshore distribution.
Essentially nothing is known about the social organisation of rough-toothed dolphins.
They are found in moderate-sized groups, most commonly of 10 to 20 dolphins, with
for instance, a mean of 12.5 dolphins/group in Hawaii (Webster et al. 2005) and 10.8
in Tahiti and Moorea, French Polynesia (Gannier & West 2005). The nature of these
groups is poorly understood, although Mayr & Ritter (2005) reported that off La
Gomera they show some fluidity in group composition, but a high coefficient of
association between some individuals of different age class. Baird et al. (in press)
have recently shown that there are some significant preferred/avoided associations
between rough toothed dolphins in the Hawaiian Archipelago. Similar patterns are
reported for bottlenose dolphins, which are known to have a complex social
organisation with strong social bonds (Connor et al. 2000b).

Chapter Six: Population structure of rough-toothed dolphins
148
Studies from different parts of the world suggest that rough-toothed dolphins are not
particularly abundant (Jefferson 2002): for instance, in the Eastern Tropical Pacific
(Wade & Gerrodette 1993), the western Indian Ocean (Ballance & Pitman 1998) or
the Gulf of Mexico (Waring et al. 2006). However, in the Society Archipelago, they
are the second most frequently observed species after spinner dolphins, Stenella
longirostris, which could suggest an unusual local abundance of this species (34% of
dolphin sightings, Gannier 2000). Despite being widely distributed, rough-toothed
dolphins have proven difficult to study in the wild. Consequently, little is known about
their ecology and population status, and the species is listed as data deficient on the
IUCN red list. Potential threats for this species are direct fisheries and by-catch,
which have been reported at many different places (Miyazaki & Perrin 1994 and
references therein). Rough-toothed dolphins are also one of the few species of
Odontocetes which are subject to frequent mass strandings (e.g. Miyazaki & Perrin
1994, Maigret 1995).
The high frequency of encounters around the islands of the Society Archipelago
provided an opportunity to investigate their population dynamics in that region of the
South Pacific. Here, I report the results of a study on the genetic diversity of rough-
toothed dolphins from around two islands of this Archipelago, Moorea and Raiatea,
based on microsatellite genotyping and mitochondrial (mt) DNA sequences obtained
from biopsy samples. To test the hypothesis of island-specific populations in the
Society Archipelago, levels of diversity and genetic differentiation were investigated
between dolphins observed at the two islands. The results from mitochondrial and
nuclear DNA were also compared to address population dynamics and to test for a
recent bottleneck. To better understand the phylogeographic structure of rough-
toothed dolphins, mtDNA sequences from different areas around the world were
compared to the Society Islands dataset. Genetic analyses were supported by
photographic sighting – re-sighting data of distinctively marked individuals.

Chapter Six: Population structure of rough-toothed dolphins
149
6.3. Materials and Methods
6.3.1. Study site and sample collection
Small-boat surveys (n = 189) were conducted over three years (2002-2004) around
six islands of the Society Archipelago, French Polynesia. The island of Moorea was
the primary study site (n = 139), while additional surveys were conducted at Tahiti (n
= 16), Huahine (n = 7), Raiatea-Tahaa (n = 21) and Bora Bora (n = 6) (Figure 2.1).
The targeted species during these surveys was the spinner dolphin (Stenella
longirostris) and, therefore, efforts were primarily concentrated in inshore water, i.e.,
within 500 m from the barrier reef and within the lagoon (see Chapter 2). At Tahiti
and Moorea, rough-toothed dolphins are most often distributed 1.8 to 5.5 km from the
barrier reef (Gannier & West 2005), although their distribution ranges from 100 m
from the barrier reef to over 30 km offshore (Nekoba-Dutertre et al. 1999, Gannier &
West 2005). Therefore, it must be noted that search efforts were not optimal for
observations of this species.
After a group of rough-toothed dolphins was spotted, priority was given to the
collection of skin samples for genetic analyses. The Paxarms system© was
employed to collect biopsy samples (Krützen et al. 2002). It uses a small biopsy dart
fired from a modified 22-caliber veterinary capture rifle equipped with variable
pressure valve. This system was especially developed to assure minimal impact on
small cetaceans. Biopsies were only collected on individuals presumed to be mature,
i.e., dolphins with body length > 2 m (Miyazaki & Perrin 1994). Short-term
behavioural responses to biopsy attempts were recorded and are reported in
Appendix 3. Samples were preserved in 70% ethanol and stored at -20°C for
subsequent analyses.
In addition to biopsy samples, dorsal fin photographs were taken for the purpose of
individual identification using a digital Olympus E10 (4 megapixel CCD) equipped
with a 200 mm lens, and a Canon Digital Rebel (6.3 megapixel CMOS) equipped with
a 300 mm lens. Photographs were graded for quality (only photographs of Q ≥ 3 were
used, see section 2.3.2 of Chapter 2 and Appendix) and dolphins with deep
distinctive nicks or deformations on the edge of the dorsal fin were assigned

Chapter Six: Population structure of rough-toothed dolphins
150
identification codes (referred to as ‘Distinctively Marked Individuals’ or DMIs, see
Chapter 2). Each photograph could include more than one dorsal fin. Based on the
images of DMIs collected during the surveys, a photo-identification catalogue was
created for each island. These catalogues were compared to find re-sights within and
between islands.
In this study, I defined a “group” as a spatial aggregation of animals that appears to
be involved in a similar activity (e.g., foraging, socialising, resting or travelling,
(Shane et al. 1986)). However, as with observations off La Gomera (Ritter 2002),
groups of rough-toothed dolphins observed in the Society Archipelago were often
found to be dispersed over a fairly large area, making estimation of group sizes
difficult (especially with sea states of Beaufort scale > 3). On the other hand, large
groups or aggregations were sometimes composed of distinct subgroups showing
coordinated swimming (as described by Ritter 2002), for which the size could be
more accurately estimated.
6.3.2. Laboratory procedures
Total DNA was isolated from skin tissue by digestion with proteinase K followed by a
standard phenol: chloroform extraction method (Sambrook et al. 1989) as modified
for small samples by Baker et al. (1994). A fragment of the 5’ end of the mtDNA
control region (d-loop) was amplified using the primers and protocol described in
Chapter 2.
Samples were genotyped at 15 microsatellite loci isolated from other cetacean
species (Table 6.1). The PCR reaction conditions were as reported in Chapter 2. The
annealing temperature varied depending on the locus (Table 6.1). PCR products
were run on an ABI 3100 DNA automated sequencer. Data were collected by
GeneScan v. 3.7, and the fragment size was measure using Genotyper v. 2.5
(Applied Biosystems Inc.).
Sex was identified by co-amplification of the male-specific sry gene and the ZFX
positive control gene, as described by Gilson et al. (1998).

Chapter Six: Population structure of rough-toothed dolphins
151
Table 6.1. Microsatellite diversity of rough-toothed dolphins from the Society Archipelago.
Locus n T°A k HO HE HWE p-value
Null Allele Frequency References
415/416 50 45 8 0.700 0.726 0.084 0.019 Amos et al. (1993) DlrFCB1 53 45 8 0.925 0.743 0.999 0.000 Buchanan (1996) EV1 56 45 5 0.714 0.737 0.303 0.009 Valsecchi & Amos (1996) EV37 49 50 16 0.878 0.919 0.119 0.013 Valsecchi & Amos (1996) EV94 43 55 13 0.814 0.882 0.107 0.015 Valsecchi & Amos (1996) GATA98 55 50 3 0.145 0.139 0.131 0.000 Pasbøll et al. (1997) GT6 51 61* 10 0.804 0.856 0.172 0.015 Caldwell et al. (2002) GT23 55 55 3 0.345 0.344 0.320 0.000 Bérubé et al. (2000) GT39 51 62 10 0.667 0.797 0.000 0.104 Caldwell et al. (2002) MK5 54 55 9 0.907 0.807 0.920 0.000 Krützen et al. (2001) MK6 54 50* 4 0.556 0.534 0.529 0.000 Kürtzen et al. (2001) MK8 53 50 9 0.755 0.838 0.164 0.025 Kürtzen et al. (2001) MK9 55 50 10 0.818 0.815 0.547 0.000 Kürtzen et al. (2001) Ppho110 52 60 3 0.365 0.359 0.255 0.000 Rosel et al. (1999) Ppho131 52 60 8 0.788 0.808 0.640 0.000 Rosel et al. (1999)
n is the number of screened chromosomes, T°A is the annealing temperature applied during PCR and
k is the number of alleles found. HO is the observed heterozygosity and HE is the expected
heterozygosity. HWE p-values refer to the results of the exact tests for deviation of Hardy-Weinberg
equilibrium. The PCR cycling profile was [93°-2', (92°-30", T°A -45", 72°-50") 15x, (89°-30", T°A -45",
72°-50") 20x, 72°-3'], except for GT6 and GT51, which were amplified using the profile reported by the
original paper.
6.3.3. Microsatellite loci statistics
Replicate samples were identified by comparison of genotypes using the program
Cervus v. 2.0 (Marshall et al. 1998), allowing for two loci with inexact matches. The
probability of identity (PID) per locus and over all loci was calculated using GenAlEx v.
6 (Peakall & Smouse 2005), from the formula of Paetkau & Strobeck (1994). See
Chapter 2, section 2.3.6, for a definition of the PID. Based on the low PID (see results),
samples with matching genotypes were assumed to be replicates and were removed
from subsequent analyses.
The exact test based on Markov chain iterations implemented in the software
Arlequin v. 3.01 (Excoffier et al. 2005) was used to test for deviations from Hardy-
Weinberg equilibrium (HWE) for each locus by population (Guo & Thompson 1992).
The program Genepop v. 3.4 was used to test for linkage disequilibrium between loci

Chapter Six: Population structure of rough-toothed dolphins
152
within population (Raymond & Rousset 1995). To detect the presence of null alleles
and estimate frequencies, the maximum-likelihood approach implemented in ML-
Relate was used (Kalinowski et al. 2006). Bonferroni corrections (Rice 1989) were
applied to all pairwise test results to adjust for multiple comparisons.
The level of microsatellite loci diversity was estimated for each population and overall
as, observed heterozygosity (HO), expected heterozygosity (HE), inbreeding
coefficient (FIS), mean number of alleles per locus (K) and allelic richness, using the
program FSTAT v. 2.9.3.2 (Goudet 2001). Allelic richness takes into account unequal
sample size using the rarefaction method.
6.3.4. Mitochondrial DNA diversity and haplotype network
Mitochondrial control region sequences were aligned using SequencherTM v. 4.1.2,
(Genes Codes Co.) and edited manually. Variable sites and unique haplotypes were
identified using MacClade v. 4.0 (Maddison & Maddison 2000). The software Arlequin
was used to estimate standard indices of genetic variation, i.e., nucleotide diversity,
π, and haplotype diversity, h.
Table 6.2. Information on samples of rough-toothed dolphins collected outside French Polynesia.
Code Type of sampling Collection date Location Haplotype
code Source
Sbr03Sa01 Biopsy 24/09/2003 Samoa Sbr03FP12 (1) Sbr03Sa02 Biopsy 25/09/2003 Samoa Sbr03FP12 (1) Sbr03Sa03 Biopsy 25/09/2003 Samoa Sbr03FP12 (1) Sbr03Sa04 Biopsy 25/09/2003 Samoa h6 (1) J02OK01 Market sample January 2002 Japan Sbr00FP02 (2) JE03OK13 Market sample March 2003 Japan h7 (2) Sbre10936 Stranding 01/10/1998 eastern Pacific h8 (3) Sbre138 Stranding 14/01/1991 eastern Pacific h9 (3) Sbre18431 Biopsy 02/11/2000 eastern Pacific h10 (3) Sbre18126 Biopsy 23/08/2000 eastern Pacific h11 (3) Sbre9838 Stranding 03/05/1996 Atlantic h12 (3) Sbre11192 Stranding 14/12/1997 Atlantic h13 (3) Sbre11193 Stranding 14/12/1997 Atlantic h14 (3) Sbre461 Stranding 15/10/1976 Atlantic h15 (3)
Sources:
(1): Olavarría et al. (2003)
(2): ‘Whale-meat’ market surveys, C.S. Baker, The University of Auckland
(3): Southwest Fisheries Science Center (La Jolla, CA, U.S.A)

Chapter Six: Population structure of rough-toothed dolphins
153
A median-joining network was generated to infer phylogenetic relationships among
the mtDNA haplotypes, using the program Network v. 4.2 (Bandelt et al. 1999).
Sequences from four other areas around the world (Japan, Samoa, eastern Pacific
Ocean and Atlantic Ocean) were added into the network to provide a worldwide
perspective of rough-toothed dolphin mtDNA diversity in the Society Archipelago.
Source and origin of these additional samples are listed in the Table 6.2. Note that
samples from Japan (n = 2) were obtained from ‘whale-meat’ market surveys, and,
as such, their exact origin is uncertain.
6.3.5. Kinship and population structure
In general, more than one individual was sampled from each group of rough-toothed
dolphins encountered during this study. Depending on the social structure of the
species under investigation, such a sampling design can result in an over-
representation of closely related individuals in each sample of the dataset, in
particular if a limited number of groups are represented. Subsequently, this bias can
lead to an over-estimation of population differentiation (Hansen et al. 1997). To take
this potential bias into account, the pairs of individuals with a high coefficient of
relatedness were identified in each island sample. Pairwise coefficients of
relatedness (rML) were calculated using the maximum-likelihood estimate derived
from the software ML-Relate (Kalinowski et al. 2006). A cut-off value of r ≥ 0.5 was
used to identify closely related pairs (i.e., first-order relatives). Analyses of population
genetic differentiation were conducted independently, using all individuals and with
kin removed.
Genetic differentiation among island samples was then estimated using analysis of
molecular variance (AMOVA) as implemented in Arlequin. For mtDNA sequences,
the differentiation was estimated using conventional FST (based on haplotype
frequencies) and its nucleotide equivalent, ΦST, which incorporates information on the
genetic distance between haplotypes. Kimura 2-parameter corrected distance was
used for ΦST analysis. For microsatellites, subdivision was assessed employing allele
frequencies (FST) and Slatkin’s microsatellite-specific FST analogue, RST. Significance
was tested by 20,000 permutations of the original datasets.

Chapter Six: Population structure of rough-toothed dolphins
154
6.3.6. Testing for recent genetic bottleneck
MtDNA and microsatellite variation were investigated to detect the signs of a recent
bottleneck event. For mtDNA, I used neutrality tests implemented in Arlequin, while
for microsatellite loci, I used two different methods implemented in the program
Bottleneck v. 1.2.02 (Cornuet & Luikart 1996) and M_P_Val and Critical_M (Garza &
Williamson 2001). See Chapter 2 for details on these methods and parameters used.
6.4. Results
6.4.1. Data collection
Rough-toothed dolphins were encountered on 23 occasions during this study: 19
encounters at Moorea, two encounters at Raiatea, and one encounter each at
Huahine and Bora Bora. Group size ranged from four to more than 50 individuals per
group. The average group size was not calculated, since the visual estimates were
often unreliable (uncertainties existed for 12 of the 23 encounters). However, the size
of 20 sub-groups was estimated with accuracy, resulting in an average 5.6 +/- 1.9
individuals per sub-group. On five occasions, the dolphins were observed within 500
m of the barrier reef (three times at Moorea; one time each at Raiatea and Huahine).
A total of 65 biopsy samples were collected (51 at Moorea, 13 at Raiatea and 1 at
Huahine) and 406 photographs of Q ≥ 3 were taken (for a total of 582 dorsal fins).
Inclement weather prevented pictures being taken of the groups observed at Bora
Bora and Huahine.
6.4.2. Photo-identification
From 2002 to 2004, 55 DMIs were identified at Moorea, while in 2004, eight DMIs
were identified at Raiatea. There were no matches of DMIs between the two islands.
An additional 45 individuals were distinguished from marks on their dorsal fins but
either these marks were minor (requiring excellent quality photographs to re-identify
the individual with certainty) or the photograph was of poor quality. Overall, 45% of
the dorsal fins showed highly distinctive marks (based on Q ≥ 3 photographs).

Chapter Six: Population structure of rough-toothed dolphins
155
Although it was difficult to distinguish between adults and juveniles based on
photographs, it appears that most of the largest individuals in the population
(approximately 90%) present some level of unique marking on their dorsal fin.
At Moorea, the rate of re-sighting per DMI, based on photographic data, ranged from
1 to 4 sightings across the 16 encounters. A total of 14 DMIs were seen on more than
one occasion. Among them, 12 were re-sighted in different years but none were seen
in all three years. A discovery curve was plotted based on the cumulative number of
newly identified DMIs across these 16 surveys (Figure 6.1). It showed no sign of an
asymptote, with new DMIs still being identified toward the end of the study. For
example, 13 new DMIs were identified in the last group observed in 2004.
Figure 6.1. Discovery curve based on the cumulative number of new Distinctively Marked Individuals
(DMIs) identified at Moorea from 2002 to 2004 (line), and number of DMIs identified per survey (bars).
6.4.3. Microsatellite diversity and sex identification
Samples were genotyped at 8 to 15 loci each. For all 15 loci, the PID was 1.2 x 10⁻¹⁵.
Genotype comparison revealed that six pairs of samples were identical matches and
one pair had a single mismatching locus. The six pairs were compared for at least 12
loci, providing a low average PID (Table 6.3) and, therefore, were considered re-
samples of the same individual. Similarly, the pair with one mismatching locus had a

Chapter Six: Population structure of rough-toothed dolphins
156
very low PID across 14 shared loci, indicating that the mismatching locus was
probably due to a genotyping error. These two samples were also assumed to come
from the same individual, and information at the mismatching loci was not considered
for subsequent analyses. As expected, all seven sample pairs also matched for
mtDNA haplotype and sex. Thus, a total of 58 individuals were represented in the
sample set, five of which were sampled two times and one was sampled three times.
Three of these re-samplings occurred in different years: two at Moorea, and one with
initial sampling at Huahine and re-sampling at Raiatea the following year. The
individual sampled three times was sampled on three different days during the same
year at Moorea. Sex-based PCR revealed that 23 females and 35 males were
sampled in total (Table 6.4). This was not significantly different from a theoretical 1:1
sex ratio (χ² = 2.48, p > 0.05).
Table 6.3. List of samples identified as genetic re-sampling through comparison of microsatellite
genotypes. PID refers to the probability of identity.
Sample 1 Sample 2 # Matching loci
# Mismatching loci PID
Sbr03FP12 Sbr04FP40 12 0 6,78139E-11 Sbr03FP17 Sbr04FP05 13 0 3,32552E-13 Sbr03FP18 Sbr04FP04 15 0 1,21758E-15 Sbr04FP06 Sbr04FP17 13 0 6,38918E-13 Sbr04FP06 Sbr04FP21 12 0 1,33927E-12 Sbr04FP17 Sbr04FP21 15 0 1,21758E-15 Sbr04FP31 Sbr04FP35 14 1 -
Two island samples, or ‘populations’, were considered for subsequent analyses:
Moorea (n = 46) and Raiatea (n = 12). All loci were polymorphic (three to 16 alleles),
overall (Table 6.1) and within population, except GATA98 which was monomorphic at
Raiatea (not shown). Presence of null alleles was detected for some loci; however,
frequencies were low (> 0.025; Table 6.1), except for GT39 (null allele frequency =
0.104) which also showed deviation from HWE. This locus was not considered for
subsequent analyses. All other loci did not deviate from HWE, and, after adjustment
for multiple comparisons, there was no evidence of linkage disequilibrium between
pairs of loci within and across populations.

Chapter Six: Population structure of rough-toothed dolphins
157
Table 6.4. Sex identification and genetic diversity for mitochondrial (mt) DNA control region and
microsatellite loci.
Microsatellite mtDNA
n Male/ Female HO FIS K Allelic
richness#
haplotypes h π (%)
Moorea 46 25/21 0.681 -0.023 7.87 4.995 4 0.457 +/- 0.078
0.88 +/- 0.50
Raiatea 12 10/2 0.723 -0.057 4.47 4.171 2 0.167 +/- 0.134
0.30 +/- 0.22
Overall 61 35/21 0.678 0.012 7.93 4.985 5 0.624 +/- 0.056
1.10 +/- 0.60
n is the number of individuals. For microsatellite, HO is the observed heterozygosity, FIS is the
coefficient of inbreeding and K is the mean number of alleles per locus across 15 loci. For mtDNA, h is
the haplotype diversity and π is the nucleotide diversity.
Levels of microsatellite diversity were similar for the two populations with an average
observed heterozygosity of 0.678 (Table 6.4). Allelic richness, based on a minimal
sample size of seven individuals, was slightly higher for Moorea than Raiatea.
However, due to the small sample size at Raiatea, the mean number of alleles per
locus K was larger at Moorea (Table 6.4). The overall FIS values were negative for
both island samples, but not significantly different from expectation.
6.4.4. Mitochondrial DNA diversity
All samples were sequenced for a 450 bp consensus fragment of the mtDNA control
region. Among samples from the Society Archipelago, a total of 15 variable sites
were identified (all transition substitutions), which defined five unique haplotypes
(Table 6.5). Overall, haplotype diversity was 0.624 +/- 0.056 and nucleotide diversity
was 1.10% +/- 0.60%. The level of mtDNA diversity was higher at Moorea than
Raiatea (Table 6.4). The most-common haplotype for Moorea was haplotype
Sbr02FP03 which was represented by 72% of the individual samples. At Raiatea, the
most-common haplotype was haplotype Sbr03FP12, representing 92% of the
samples. Neither haplotype Sbr02FP03 nor haplotype Sbr03FP12 were found in
Raiatea or Moorea, respectively.

Chapter Six: Population structure of rough-toothed dolphins
158
Table 6.5. Mitochondrial DNA haplotypes (L-strand control region, 5’ to 3’ sequence) in rough-toothed
dolphins of the Society Archipelago, showing variable sites with reference to haplotype Sbr00FP01.
Haplotype frequencies of the samples collected around Moorea and Raiatea are indicated on the right;
the frequencies of males and females for each haplotype are given in brackets.
2 8 1 2 2 2 2 2 2 3 3 3 4 4 4 4 4 0 4 4 7 7 7 8 6 7 7 3 3 3
Haplotype frequencies
6 3 7 1 2 9 1 9 0 1 1 3 5 Moorea Raiatea (male+female) (male+female)
haplotypes
Sbr00FP01 C C C A T T C T A C T T C G C 8 (5+3) - Sbr00FP02 T T T G C . . . G T C . T A T 4 (2+2) 1 (1+0) Sbr02FP02 T . . G . C T C G . C C T A T 1 (0+1) - Sbr02FP03 T T T G C C . . G T C . T A T 33 (17+14) - Sbr03FP12 . . . G . . . . . . C . . A . - 11 (9+2)
Ten more haplotypes were found when sequences from other locations around the
world were included (Table 6.2), for a total of 30 variable sites. The median-joining
network showed no obvious phylogeographic structuring (Figure 6.2). However,
Atlantic samples were very different. Overall, haplotypes from the Society
Archipelago were found to be largely distant from one another (with the exception of
haplotypes Sbr00FP02 and Sbr02FP03), within and between island samples, with an
average of 7.5 mutational steps between them. Matching haplotypes were found
between Samoa and French Polynesia (Sbr03FP12) and Japanese ‘whale-meat’
market and French Polynesia (Sbr00FP02).
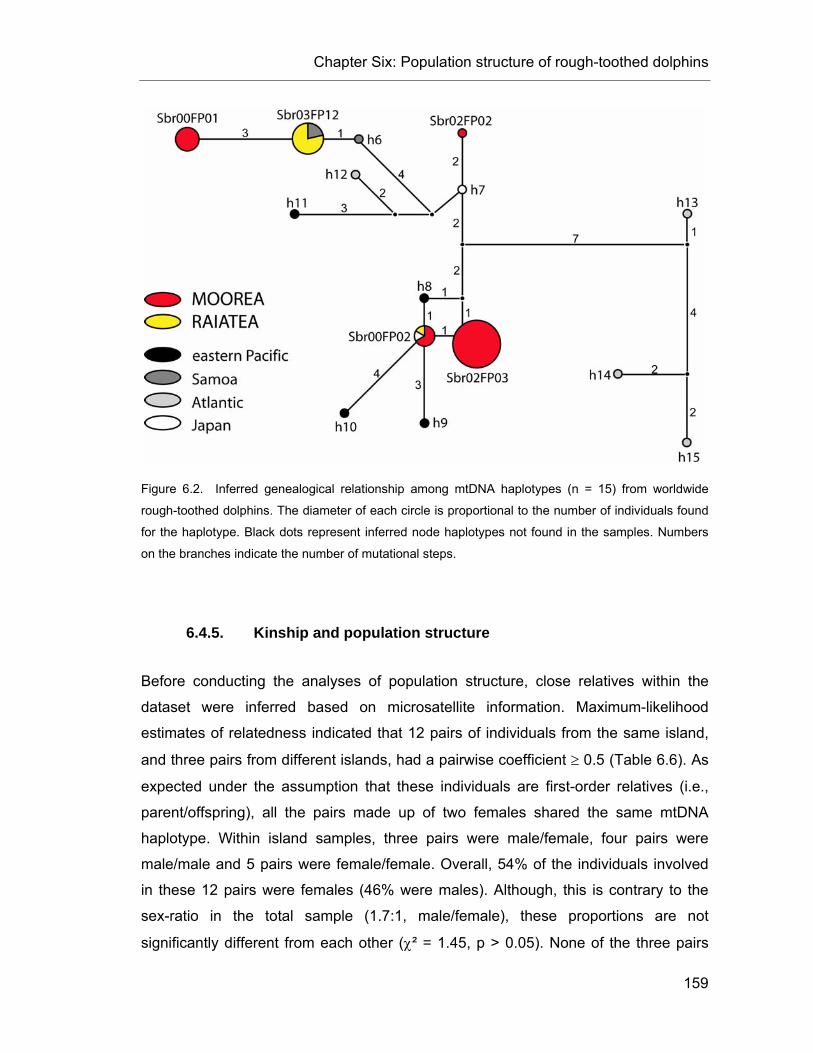
Chapter Six: Population structure of rough-toothed dolphins
159
Figure 6.2. Inferred genealogical relationship among mtDNA haplotypes (n = 15) from worldwide
rough-toothed dolphins. The diameter of each circle is proportional to the number of individuals found
for the haplotype. Black dots represent inferred node haplotypes not found in the samples. Numbers
on the branches indicate the number of mutational steps.
6.4.5. Kinship and population structure
Before conducting the analyses of population structure, close relatives within the
dataset were inferred based on microsatellite information. Maximum-likelihood
estimates of relatedness indicated that 12 pairs of individuals from the same island,
and three pairs from different islands, had a pairwise coefficient ≥ 0.5 (Table 6.6). As
expected under the assumption that these individuals are first-order relatives (i.e.,
parent/offspring), all the pairs made up of two females shared the same mtDNA
haplotype. Within island samples, three pairs were male/female, four pairs were
male/male and 5 pairs were female/female. Overall, 54% of the individuals involved
in these 12 pairs were females (46% were males). Although, this is contrary to the
sex-ratio in the total sample (1.7:1, male/female), these proportions are not
significantly different from each other (χ² = 1.45, p > 0.05). None of the three pairs

Chapter Six: Population structure of rough-toothed dolphins
160
between islands were composed of two females (one pair of female-male and two
pairs of male-male, Table 6.6). In order to eliminate one individual from each of these
pairs, I had to remove seven samples from Moorea and two samples from Raiatea,
giving a new sample size of 39 and 10, respectively.
Table 6.6. List of the pairs of individuals showing a high-level of microsatellite relatedness, including
information on sex class and mtDNA haplotype. rML stand for the maximum-likelihood coefficient of
relatedness. Cells in grey indicate individuals sampled at Raiatea, while the others represent the
individuals sampled at Moorea.
Individual 1 Sex mtDNA haplotype Individual 2 Sex mtDNA
haplotype rML
Sbr04FP10 Male Sbr02FP03 Sbr04Ra33 Male Sbr03FP12 0.61 Sbr04FP34 Female Sbr03FP12 Sbr04Ra36 Male Sbr03FP12 0.60 Sbr04FP07 Male Sbr02FP03 Sbr04Mo17 Female Sbr02FP03 0.55 Sbr04FP16 Female Sbr02FP03 Sbr04Mo17 Female Sbr02FP03 0.52 Sbr04FP36 Male Sbr03FP12 Sbr04Ra41 Male Sbr03FP12 0.50 Sbr02FP04 Male Sbr00FP02 Sbr04Mo05 Male Sbr02FP03 0.50 Sbr02FP05 Male Sbr00FP01 Sbr03Mo16 Male Sbr00FP01 0.50 Sbr03FP08 Female Sbr02FP03 Sbr04Ra36 Male Sbr03FP12 0.50 Sbr03FP10 Male Sbr02FP03 Sbr04Mo11 Male Sbr02FP03 0.50 Sbr04FP01 Female Sbr02FP03 Sbr04Mo02 Female Sbr02FP03 0.50 Sbr04FP08 Female Sbr02FP03 Sbr04Mo17 Female Sbr02FP03 0.50 Sbr04FP11 Male Sbr02FP03 Sbr04Ra33 Male Sbr03FP12 0.50 Sbr04FP15 Female Sbr02FP03 Sbr04Mo23 Female Sbr02FP03 0.50 Sbr04FP19 Female Sbr00FP01 Sbr04Mo20 Female Sbr00FP01 0.50 Sbr04FP33 Male Sbr03FP12 Sbr04Ra37 Female Sbr03FP12 0.50
Based on this reduced dataset, the AMOVA showed highly significant differentiation
in mtDNA (FST = 0.60, p < 0.001; ΦST = 0.56, p < 0.001) and microsatellite (FST =
0.06, p < 0.005; RST = 0.07, p < 0.05) variation among the two island samples. The
complete dataset yielded similar results (not shown). Unfortunately, too few females
were sampled at Raiatea (n = 2) to allow tests for sex-bias dispersal detection, such
as the ones implemented in the program FSTAT (see section 2.3.7, Chapter 2).
Similarly, the maximum-likelihood coalescent approach to estimate migration rates
(using the software Lamarc, Kuhner 2006) did not yield satisfactory results because
of the small number of haplotypes and samples (results not shown).
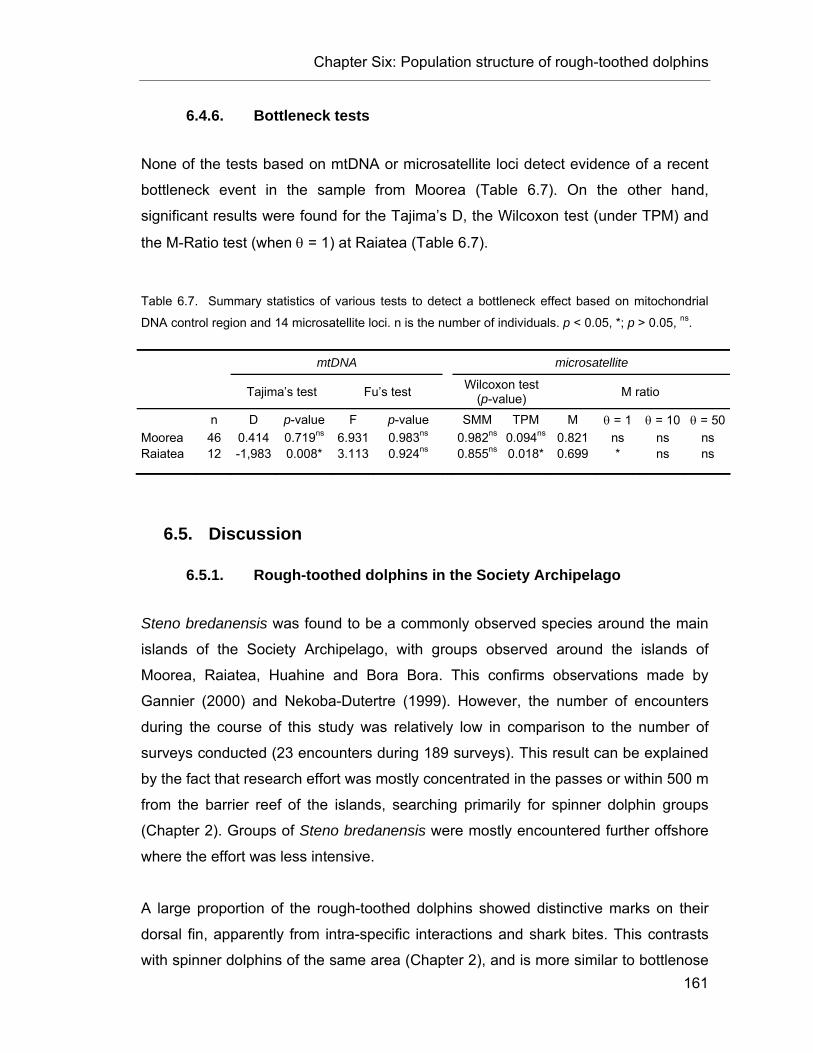
Chapter Six: Population structure of rough-toothed dolphins
161
6.4.6. Bottleneck tests
None of the tests based on mtDNA or microsatellite loci detect evidence of a recent
bottleneck event in the sample from Moorea (Table 6.7). On the other hand,
significant results were found for the Tajima’s D, the Wilcoxon test (under TPM) and
the M-Ratio test (when θ = 1) at Raiatea (Table 6.7).
Table 6.7. Summary statistics of various tests to detect a bottleneck effect based on mitochondrial
DNA control region and 14 microsatellite loci. n is the number of individuals. p < 0.05, *; p > 0.05, ns.
6.5. Discussion
6.5.1. Rough-toothed dolphins in the Society Archipelago
Steno bredanensis was found to be a commonly observed species around the main
islands of the Society Archipelago, with groups observed around the islands of
Moorea, Raiatea, Huahine and Bora Bora. This confirms observations made by
Gannier (2000) and Nekoba-Dutertre (1999). However, the number of encounters
during the course of this study was relatively low in comparison to the number of
surveys conducted (23 encounters during 189 surveys). This result can be explained
by the fact that research effort was mostly concentrated in the passes or within 500 m
from the barrier reef of the islands, searching primarily for spinner dolphin groups
(Chapter 2). Groups of Steno bredanensis were mostly encountered further offshore
where the effort was less intensive.
A large proportion of the rough-toothed dolphins showed distinctive marks on their
dorsal fin, apparently from intra-specific interactions and shark bites. This contrasts
with spinner dolphins of the same area (Chapter 2), and is more similar to bottlenose
mtDNA microsatellite
Tajima’s test Fu’s test Wilcoxon test (p-value) M ratio
n D p-value F p-value SMM TPM M θ = 1 θ = 10 θ = 50Moorea 46 0.414 0.719ns 6.931 0.983ns 0.982ns 0.094ns 0.821 ns ns ns Raiatea 12 -1,983 0.008* 3.113 0.924ns 0.855ns 0.018* 0.699 * ns ns

Chapter Six: Population structure of rough-toothed dolphins
162
dolphins in general (Scott et al. 1990). A similar proportion of marked individuals was
found in rough-toothed dolphins of the Hawaiian Archipelago (Baird et al. 2003),
illustrating the strong potential of photo-identification surveys on this species.
In the Society Archipelago, rough-toothed dolphins seem to show preferences for
coastal insular waters (Nekoba-Dutertre et al. 1999, Gannier & West 2005),
contrasting with the usual description made of their primary habitat, i.e., pelagic
waters (Jefferson 2002). In other species of delphinids, such a pattern of preference
for nearshore habitat is thought to have led to fine-scale population structuring,
underlying, in some cases, conservation issues (e.g., Hoelzel et al. 1998b, Pichler et
al. 1998, Sellas et al. 2005). Although the conservation of Steno bredanensis is
currently not of concern on a species-wide level, limited knowledge of its status and
ecology make it necessary to investigate the populations from around these islands
in further detail.
6.5.2. Fine-scale population structure
The analyses of mtDNA and microsatellite loci presented here reveal strong genetic
differentiation between rough-toothed dolphins sampled around two islands
separated by only 150 km, Moorea and Raiatea, rejecting the hypothesis of panmixia.
One potential concern with this result was that the detected population differentiation
reflected a high degree of relatedness among the sampled animals rather than a true
population structure. However, that genetic differentiation was found to persist after
closely related individuals were removed from the analysis, although the sample size
was relatively small for Raiatea. Furthermore, tests for significant FIS values did not
reveal evidence for inbreeding in any of the samples.
Differentiation at both maternal and biparentally inherited markers indicates that the
restricted gene flow is not due solely to female philopatry. This fine-scale population
structure could suggest that rough-toothed dolphins from around these islands form
stable resident populations or “communities”. Results from photo-identification
surveys and genetic re-sampling events support this pattern since several individuals
were “recaptured” across the years. This is concordant with high site-fidelity reported
in the Canary Islands and Hawaiian Islands based on photo-identification data (Mayr
Chapter Six: Population structure of rough-toothed dolphins
163
& Ritter 2005, Webster et al. 2005). Inter-annual re-sighting of DMIs at Moorea was
also previously reported by Nekoba-Dutertre et al. (1999). Although the discovery
curve based on the cumulative number of DMIs identified at Moorea during the
current study did not asymptote, this can simply be due to the limited number of
encounters (n = 19) rather than the demographic openness of the population. In
comparison, the discovery curve for the small community of spinner dolphins around
the same island reached asymptote after only 25 encounters (Chapter 2). Additional
surveys are necessary to determine with certainty if the population/community of
rough-toothed dolphins sampled around Moorea is geographically closed, and if so,
of what size. At this stage, the real boundaries of the populations investigated here
remain unknown. The dataset was too limited to do an abundance estimate for these
communities but the relatively high level of re-sighting at Moorea (25% of the DMIs)
compared to the low number of encounters suggest that this community of rough-
toothed dolphins might be relatively small (in the order of a few hundred individuals at
most).
6.5.3. Sex-biased dispersal
The level of mtDNA differentiation between Moorea and Raiatea was surprisingly
high, illustrating a very low rate of recent female gene flow. In comparison,
microsatellite differentiation was not as marked, although still significant. Such a
pattern has often been interpreted as a consequence of male biased gene flow in
cetacean populations (e.g., Escorza-Trevino & Dizon 2000). Although this is a
possibility, it could also be explained by the difference in mutation rates between
mtDNA and microsatellite loci (Hedrick 1999). Furthermore, estimates of effective
migration rate based on F-statistics are subject to uncertainties in non-equilibrium
populations, and caution is required before inferring demographic trends from these
values (Whitlock & McCauley 1999). However, male-biased dispersal appears to be a
common feature in cetacean populations (e.g., Möller & Beheregaray 2004, Cassens
et al. 2005) and in mammals in general (Greenwood 1980). Therefore, it would be
interesting to examine more samples from Raiatea’s rough-toothed dolphins and
conduct marker-specific tests (e.g., Goudet et al. 2002) to assess this (see Chapter
2).

Chapter Six: Population structure of rough-toothed dolphins
164
6.5.4. A spinner dolphin community structure with a pilot whales social organisation?
The fine-scale population structure described here in rough-toothed dolphins from the
Society Archipelago provides an interesting parallel to the communities of spinner
dolphins investigated in Chapter 2. For the latter, genetic differentiation was also
observed between island samples while gene flow was biased toward males. I was
unable to determine if rough-toothed dolphins form island-specific communities
regardless of the distances between islands, as observed for spinner dolphins
(Chapter 2). However, the re-sampling at Raiatea of an individual initially sampled at
Huahine could illustrate a pattern of regional communities rather than insular
communities. It can be noted that the two species appear to take advantage of
inshore and nearshore insular waters for different reasons: spinner dolphins use
them as safe resting areas (mainly in the shallow inshore and lagoon waters), while
rough-toothed dolphins are more likely to be there for increased levels of food
resources along the shelf (i.e., in the deepest nearshore waters).
One striking difference between communities of the two species was the level of
mitochondrial haplotype diversity: 18 and 12 unique haplotypes were found among
59 and 16 individuals in the spinner dolphins’ communities at Moorea and Raiatea,
while only four and two unique haplotypes were identified among 46 and 12 rough-
toothed dolphins sampled around the same islands, respectively. Several scenarios
could potentially explain the low level of mtDNA haplotype diversity observed in
rough-toothed dolphins: (1) a greater demographic isolation than that of spinner
dolphins; (2) a bottleneck effect; or, (3) a matrilineal social organisation.
(1) Greater demographic isolation – In such a case, a low level of immigration as a
source of variability would lead to a greater effect of genetic drift within each
community of rough-toothed dolphins. However, rough-toothed dolphins, like spinner
dolphins, have a high potential for long distance movements, and it seems unlikely
that environmental factors, solely, could reduce gene flow in one of these species
and not the other.

Chapter Six: Population structure of rough-toothed dolphins
165
(2) Bottleneck effect – Low mtDNA diversity could also be the result of a bottleneck
event, due to recent colonisation of an insular habitat. The absence of
phylogeographic pattern and the large genetic distance between mtDNA haplotypes
indicate that the structuring in the studied area is probably fairly recent. However, no
significant evidence for a bottleneck was found within Moorea sample. At Raiatea,
signs of a potential bottleneck were detected at the mtDNA and microsatellite level,
but the sample size was small (n = 12). I do not know if the presence of a few close
relatives in such a small sample could affect the results of these tests. Examination of
more individuals is probably required before drawing any conclusion on this point.
(3) Social organisation - An alternative explanation is that the small scale genetic
structure and low mtDNA diversity described here are the result of a highly stable
social organisation. It has been shown that social organisation can have a profound
impact on population genetic structure (e.g., Storz 1999). Notably, socially defined
population structure has the general effect of increasing the importance of genetic
drift relative to other evolutionary forces. In cetaceans, unexpectedly low levels of
mtDNA diversity were described amongst species thought to have a matrilineal social
organisation (Whitehead 1998); this is, for instance, the case for long-finned pilot
whales (see Chapters 4 and 5). Further demographic and genetic studies could help
clarify if rough-toothed dolphin’s social organisation is also matrilineal or if it follows a
fission/fusion model with males forming stable alliances, as observed in some
populations of bottlenose dolphins (Connor et al. 2000b). It is worth noting that
rough-toothed dolphins show a propensity to mass strand (Jefferson 2002); and
although the reasons for mass strandings are probably multiple, it is largely accepted
that they somehow involve tight social bonds among individuals (Perrin & Geraci
2002). Interestingly, the primary species involved in mass strandings (sperm whales
and long-finned pilot whales) are thought to be matrilineal.
6.5.5. Conclusions
This study has revealed a surprising degree of local site fidelity suggesting a
community structure among rough-toothed dolphins sampled in the Society
Archipelago. Most importantly, the detection of this fine-scale population structure
raises new concerns for the conservation and management of these populations.
Chapter Six: Population structure of rough-toothed dolphins
166
Indeed, although the limits of the two communities/populations sampled at Moorea
and Raiatea are still unclear, my results indicate that they should be considered as
distinct management units. Rough-toothed dolphins are known in some places to be
caught in drive fisheries (for example in Japan) and to be victims of by-catch
(Miyazaki & Perrin 1994, Monteiro et al. 2000). In the South Pacific, studies on rough-
toothed dolphins have only been conducted in the Society Archipelago of French
Polynesia, which was referred to as a hotspot for this species (e.g., Baird et al. 2003).
However, the tropical Pacific is still an under-studied area and further surveys in
other archipelagos could reveal that rough-toothed dolphins are common throughout
the nearshore shore waters of these islands.

Chapter Seven: General Discussion and Future Work
167
7. General Discussion and Future Work
7.1. Overview
This thesis has provided new insights into the evolutionary history, population
structure and social system of spinner dolphins, short-finned pilot whales, long-finned
pilot whales and rough-toothed dolphins. Although intensive research efforts were
previously dedicated to some of these species (e.g., Bloch et al. 1993, Heimlich-
Boran 1993, Norris et al. 1994), they remain relatively unknown in comparison to
most species of large terrestrial mammals as well as to some other cetaceans, i.e.,
bottlenose dolphin and killer whale. Here, to overcome some of difficulties typically
encountered when studying cetaceans, I have combined demographic and molecular
approaches, and I also took advantage of previous studies and data collections. In
Chapter 2, I used molecular and photo-identification data together, to understand the
community dynamic of insular spinner dolphins on a demographic and evolutionary
time scale. Chapter 3 used pilot whales mitochondrial DNA obtained from many
different sources (e.g., biopsy samples, mass strandings, ‘whale-meat’ market
products, GenBank sequences), and allowed me to address questions on a
worldwide geographical scale. Chapters 4 and 5 combined kinship information
(based on molecular analyses) and observational/behavioural data from mass
strandings to investigate the social system of long-finned pilot whales. It also allowed
the testing for the first time, of a hypothesis on the social dynamics of mass
strandings. Finally, in Chapter 6, I used data similar to Chapter 2 to investigate
communities of rough-toothed dolphins, although given the opportunistic nature of
data collection the analyses did not reach the same level of detail as the former
chapter. It is therefore very promising for future research that substantial information
was obtained from this study, especially considering the status usually given to
rough-toothed dolphin of a pelagic and difficult to study dolphin species.
As discussed in Chapter 1, this thesis project was part of a larger research program
aimed at investigating the genetic diversity and population structure among
Chapter Seven: General Discussion and Future Work
168
communities of species of dolphins with contrasting social systems and habitat use.
While I focused my work on four species, the overall program included studies on 12
species or subspecies. At this stage, it is useful to consider if the results of this thesis
have offered new insights to answer the objectives presented at the beginning of the
manuscript.
- Objective 1 and Objective 2: Investigate comparative genetic structure of dolphin societies with different life history attributes and habitat specialisation, and in relation to predictions concerning the genetic consequences of social systems on the structure of local communities. Although none of the previous
chapters directly aimed at comparing the four species under investigation between
each other, several findings have shown interesting parallels and discrepancies. For
example, insular genetic structure was observed in spinner dolphins as well as, and
less expectedly, in rough-toothed dolphins; however, spinner dolphins showed a
much higher level of mtDNA diversity than rough-toothed dolphins, suggesting
different social systems (Table 7.1). I also found genetic evidence that social
organisation of long-finned pilot whales is more complex than previously assumed,
involving multiple matrilineal groups associating in mass strandings. This supports
findings in Nova Scotia where groups of long-finned pilot whales are observed to
change in composition over days, as observed in spinner dolphins. Note, however,
that the two species show very different habitat preferences and, probably, social
structure. Another interesting parallel was found, with the possible matrilineal social
structure of rough-toothed dolphins as suggested by low mtDNA variability and
comparable to the genetic diversity of other matrilineal species such as pilot whales.
The results presented in this thesis have provided new information on the genetic
structure of the four species, contributing to the ongoing research aiming at
understanding the evolutionary forces responsible for contemporary genetic structure
of dolphins’ communities.
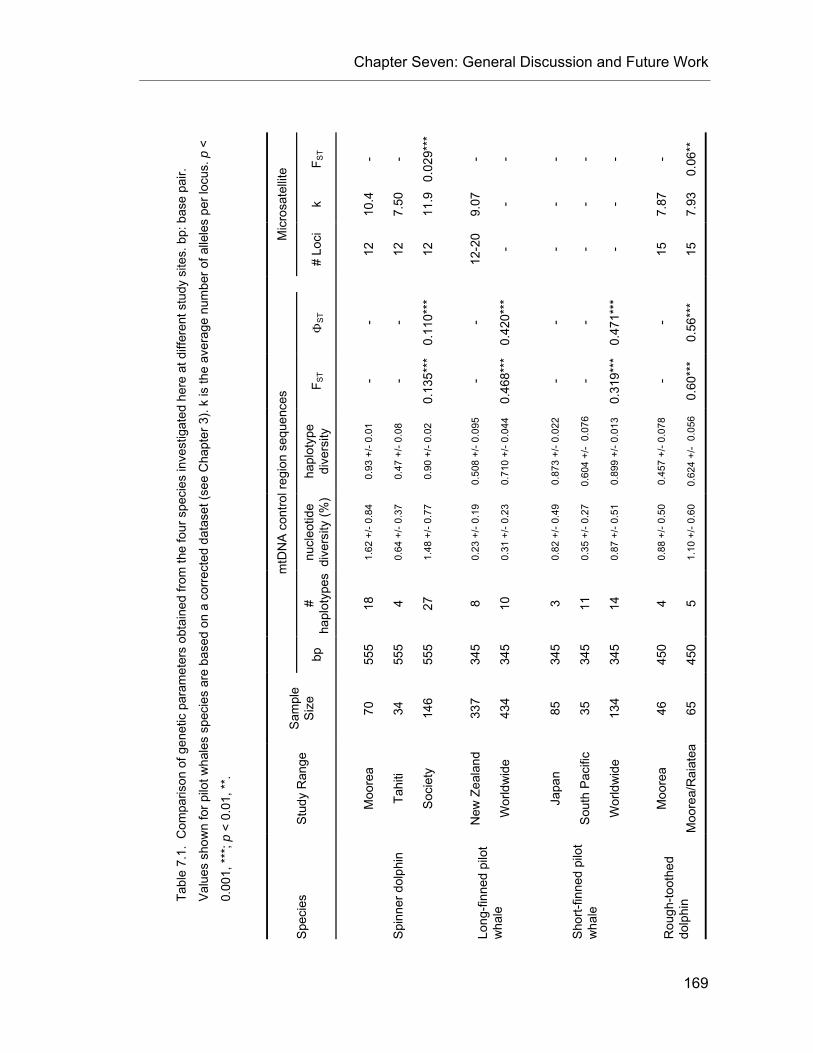
Chapter Seven: General Discussion and Future Work
169
F ST - -
0.02
9***
- - - - - -
0.06
**
k
10.4
7.50
11.9
9.07
- - - -
7.87
7.93
Mic
rosa
telli
te
# Lo
ci
12
12
12
12-2
0
- - - - 15
15
ΦST
- -
0.11
0***
-
0.42
0***
- -
0.47
1***
-
0.56
***
F ST - -
0.13
5***
-
0.46
8***
- -
0.31
9***
-
0.60
***
hapl
otyp
e di
vers
ity
0.93
+/-
0.01
0.47
+/-
0.08
0.90
+/-
0.02
0.50
8 +/
- 0.0
95
0.71
0 +/
- 0.0
44
0.87
3 +/
- 0.0
22
0.60
4 +/
- 0.
076
0.89
9 +/
- 0.0
13
0.45
7 +/
- 0.0
78
0.62
4 +/
- 0.
056
nucl
eotid
e di
vers
ity (%
)
1.62
+/-
0.84
0.64
+/-
0.37
1.48
+/-
0.77
0.23
+/-
0.19
0.31
+/-
0.23
0.82
+/-
0.49
0.35
+/-
0.27
0.87
+/-
0.51
0.88
+/-
0.50
1.10
+/-
0.60
# ha
plot
ypes
18
4 27 8 10 3 11
14 4 5
mtD
NA
cont
rol r
egio
n se
quen
ces
bp
555
555
555
345
345
345
345
345
450
450
Sam
ple
Siz
e 70
34
146
337
434 85
35
134 46
65
Stu
dy R
ange
Moo
rea
Tahi
ti
Soc
iety
New
Zea
land
Wor
ldw
ide
Japa
n
Sou
th P
acifi
c
Wor
ldw
ide
Moo
rea
Moo
rea/
Rai
atea
Spe
cies
Spi
nner
dol
phin
Long
-finn
ed p
ilot
wha
le
Sho
rt-fin
ned
pilo
t w
hale
Rou
gh-to
othe
d do
lphi
n
Tabl
e 7.
1. C
ompa
rison
of g
enet
ic p
aram
eter
s ob
tain
ed fr
om th
e fo
ur s
peci
es in
vest
igat
ed h
ere
at d
iffer
ent s
tudy
site
s. b
p: b
ase
pair.
Val
ues
show
n fo
r pilo
t wha
les
spec
ies
are
base
d on
a c
orre
cted
dat
aset
(see
Cha
pter
3).
k is
the
aver
age
num
ber o
f alle
les
per l
ocus
. p <
0.00
1, *
**; p
< 0
.01,
**.
Chapter Seven: General Discussion and Future Work
170
- Objective 3: Investigate whether dolphin groups and communities are structured strictly along a single maternal lineage or whether the social groups include multiple maternal lineages. Results have shown that none of the species
investigated here are strictly matrilineal in their social structure. While this was
expected for spinner dolphins (Chapter 2), it was not expected for long-finned pilot
whales based on results from previous genetic studies (Chapter 4). However,
parentage and relatedness analyses conducted here confirmed that a least some
females as well as males of this species remain with their mother after reaching
maturity. Therefore, matrilineality, although not strict, represents a strong component
of long-finned pilot whales social system. There was no obvious expectation for
rough-toothed dolphins in regards to this question. However, while the analyses
revealed the presence of multiple maternal lineages within groups, the mtDNA
diversity potentially suggested, as mentioned above, some level of matrilineal social
structure in this species.
- Objective 4: Investigate whether mating is directed outside of matrilineal groups through permanent emigration of males, as characteristic of most mammals, or whether mating occurs by temporary social fusion or interchange. I found that neighbouring communities of spinner dolphins were
genetically different from each other at the mitochondrial and nuclear level. This
suggests that spinner dolphins are more likely to mate with members of their own
community. The pattern of fission/fusion observed in group composition further
suggests that mating probably occurs during temporary fusion. However, much
remains to be learned about the social system of this species within the community.
Notably, the nature of long-term association observed between individuals of the
same sex and individuals of different sexes still needs to be explained. Although
mating is thought to occur largely within an island community, my analyses indicated
some male-biased dispersal between communities of spinner dolphins, as typically
observed in other species of mammals, including other cetaceans (see Chapter 1).
Parentage analyses within mass strandings of long-finned pilot whales confirmed that
mature males rarely mate with females of their own group. The detection of several
maternal lineages within the mass strandings further suggests that groups at sea
Chapter Seven: General Discussion and Future Work
171
(and especially the large ones) do not represent stable behavioural units. Therefore,
mating in this species is more likely to occur during temporary social interchange.
Here again, much work remains to be done on the social system of pilot whales. For
example, there is no clear evidence so far to discount some level of male and female
dispersal from their maternal group, even though this is expected to be low.
- Objective 5: Investigate whether some dolphins have adapted to inbreeding as a strategy for maintaining social cohesion or because of geographic isolation. Chapter 2 and 6 on spinner dolphins and rough-toothed dolphins have
made interesting contribution to this subject. It was shown that neighbouring
communities could be distinct genetically and demographically although being in
close geographical proximity. This was especially obvious for the communities of
spinner dolphins from Moorea and Tahiti. Social components are thus likely to
maintain boundaries between these communities. However, it is also likely that
geographical isolation still plays a role, but at a larger geographical scale. The extent
to which sociality and spatial isolation have contributed to shape contemporary
genetic structure probably varies between communities. This study also confirmed
that genetic diversity can vary considerably between communities (even within the
same species), and that it can be independent of local community size (Table 7.1).
However, it is still not clear if this is specifically related to inbreeding avoidance or
not. Further investigations might help to describe a general model of genetic structure
in this environment, but at this stage the status of insular communities still needs to
be assessed case by case.
To conclude this thesis, I briefly revisit some of the primary findings and provide
further discussion in the context of future research interests.
7.2. Metapopulation of spinner dolphins
In the Chapter 2, I described a contrasting pattern of demographic closure and
evolutionary openness in insular communities of spinner dolphins from the Society
Archipelago, French Polynesia. In order to explain the large female effective
population size observed, I proposed that the spinner dolphins of this region live in a
metapopulation composed of insular communities inter-connected through male and

Chapter Seven: General Discussion and Future Work
172
female gene flow. Such a model of population structure seems surprising for a
species capable of long-range movements and living in an environment lacking of
obvious geographical barriers. However, the open ocean appears to be an unsuitable
habitat for spinner dolphins in this region (as suggested by the absence of sightings
offshore during plane and boat surveys), and thus it can be considered that overall
their habitat is highly fragmented, i.e., favourable to metapopulation structure. The
size of this metapopulation remains unknown, but it could extend beyond the
boundaries of the Society Islands. Further studies including samples from
surrounding areas are thus needed to investigate this question. To begin, additional
samples should be collected in the South west Pacific where spinner dolphins appear
to be commonly observed in the nearshore waters of the tropical islands. This
includes Cook Islands, Samoa, Tonga, New Caledonia, Tuvalu and others (Reeves
et al. 1999, South Pacific Whale Research Consortium, pers. comm.).
The reasons behind habitat fidelity of insular spinner dolphins are still unclear.
Although geographic isolation might, in some cases, play a role (Karczmarski et al.
2005), the strong genetic differentiation observed between the neighbouring
communities of Moorea and Tahiti indicated that additional factors are involved.
These could, for instance, imply social mechanisms, food competition and/or
competition for suitable resting areas. At this stage, only the abundance of Moorea’s
community was estimated in the Society Archipelago but it would be interesting to
estimate abundance from communities around smaller and larger islands, in order to
test hypotheses on island carrying capacity. At the Big Island, in Hawaii, Würsig et al.
(1994) suggested that the insular habitat has an approximate carrying capacity of
spinner dolphins that could be determined by the size and distribution of useable
resting areas. A similar tendency is possible in the Society Archipelago, since the
frequencies of encountered with groups of spinner dolphins appear to be higher
around islands with more passes (i.e., more resting areas for spinner dolphins). If
confirmed, this would suggest a model of density dependence, in which the size of
insular communities is regulated by daytime resting areas rather than food availability
(since spinner dolphins feed offshore, on mesopelagic preys).

Chapter Seven: General Discussion and Future Work
173
A metapopulation structure for the communities of spinner dolphins from the Society
Archipelago raises some concerns from a conservation and management point of
view. Although spinner dolphins from French Polynesia appear to be relatively safe
from fisheries impact (e.g., no directed take or report of by-catch) they might not be
safe from tourism pressures and habitat degradation. The coastal environment
appears to be crucial for these animals and no studies have been undertaken in
French Polynesia to investigate anthropogenic impact. The consequences of local
displacement or extinction on metapopulation structure are unknown but such event
could potentially have deleterious effects on surrounding communities too (for
example, by severing links within the network of communities). Application of the
metapopulation theory on insular spinner dolphins could result in a much better
understanding of their population dynamics and thus better tools to predict and
prevent local disturbance and extinctions. Whether or not this theory can be applied
efficiently is still debated (Baguette 2004, Hanski 2004), especially for large
mammals (Elmhagen & Angerbjörn 2001), but the usefulness of this approach for
spinner dolphin (and maybe rough-toothed dolphin) communities should be explored.
7.3. Pilot whales evolutionary history
Results from Chapter 3 confirmed low levels of worldwide mtDNA diversity in the two
species of pilot whales (Table 7.1), as previously suspected from studies in the North
Atlantic (Siemann 1994). There was no evidence for a bottleneck effect to explain this
pattern, but a recent worldwide expansion could have played a role, in particular for
the long-finned pilot whale. It would be interesting to investigate the level of diversity
throughout the range of the species as it could help to identify the centre of
dispersion. Interestingly, phylogenetic reconstructions presented in Chapter 3
suggest that the “Southern” form of short-finned pilot whale in Japan could potentially
represent the ancestral population of the genus Globicephala. If this is confirmed by
further analyses, one expectation would be to find higher genetic diversity in long-
finned pilot whale populations ranging close to Japan (that is, in the southwest
Pacific) than in populations distributed further away (for example, South Atlantic and
North Atlantic).
Chapter Seven: General Discussion and Future Work
174
Analyses of mtDNA diversity confirmed a strong population differentiation between
long-finned pilot whales from the North Atlantic and Southern Hemisphere. However,
the presence of shared haplotypes does not support the current status of sub-
species for these two populations. The mtDNA diversity appears to be lower in the
North Atlantic than in samples from the Southern Hemisphere, which could potentially
illustrate a recent founder event. The separation between the North Atlantic and the
Southern Hemisphere long-finned pilot whales could date from one of the recent
glaciation periods. However, any attempt to estimate the time of this event will also
require samples from the South Atlantic where the migrants would be more likely to
originate. South Atlantic populations could be genetically very different from the
populations in New Zealand and Tasmania, and more similar to the populations in the
North Atlantic. If this was the case, then it would imply that the colonization of the
North Atlantic was more recent than the estimates given using samples of the
southwest Pacific. The alternative scenario of current gene flow through unknown
corridors also remains a possibility, although it seems very unlikely considering the
obvious geographical segregation. Investigation of these questions would also
benefit from analyses of nuclear markers.
Long-finned pilot whales are distributed throughout the temperate waters of the
Southern Hemisphere oceans but the population structure and abundance across
this range is unknown. Unexpectedly, fine-scale population structure was observed
between long-finned pilot whales stranded in Tasmania and New Zealand, although
examination of additional samples from Australia is needed to confirm this pattern. It
would be interesting to investigate the potential impact of sea surface temperature on
the population structure, since this factor is known to play an important role in the
ecology of pilot whales (Kasuya et al. 1988, Fullard et al. 2000).
Finally, results from Chapter 3 revealed a complex pattern of mtDNA diversity in
short-finned pilot whales, in particular through the inclusion of the samples from
around Japan. The relatively high level of mtDNA diversity in this region contrasts
with the low diversity observed in the South Pacific and Atlantic Ocean. This was
particularly true for samples thought to represent essentially the “Southern” form of
Japanese pilot whales. Unfortunately, uncertainties remain on the form of origin of

Chapter Seven: General Discussion and Future Work
175
the Japanese whale-meat market samples (“Northern” or “Southern” form), limiting
the interpretations of the patterns of phylogeography. Future studies should integrate
this information in order to investigate some of the hypotheses formulated in this
thesis. For instance, it could help to confirm the presence of two or three distinct
populations of short-finned pilot whales in the waters of Japan. It could also help to
clarify the origin of the “Northern” form population. Examination of samples from the
eastern North Pacific would also be extremely valuable in determining this. Indeed,
the limited data available here suggest recent or current gene flow between the
“Northern” form of Japan and the eastern North Pacific. This could indicate that these
populations emerged from the same common ancestor, providing an explanation for
larger body sizes observed in animals of these two regions. On the other hand, it
would discount a scenario of independent morphological convergence toward larger
size, such as the one recently suggested for common dolphins (Natoli et al. 2006).
The low level of mtDNA diversity inferred in the “Northern” form could further suggest
a recent and rapid demographic expansion of the larger form of short-finned pilot
whale throughout the North Pacific. This is consistent with the absence of short-
finned pilot whales in the fossil record from this area (Kasuya 1975). Such a rapid
demographic expansion could have played a role in the recent extinction of long-
finned pilot whales in the North Pacific. Indeed, Kasuya (1975), although he did not
name short-finned pilot whales as a potential competitor of long-finned pilot whales,
suggested that inter-specific competition could have been the cause of this
extinction.
7.4. Social systems and matrilineality
In most species of cetaceans, investigation of social systems (i.e., social
organisation, social structure and mating system) is extremely difficult, due to
offshore distribution and absence of residency which prevent from conducting
longitudinal studies. Results of Chapter 4 showed that data from long-finned pilot
whales mass strandings can provide valuable information as an alternative to long-
term studies. Notably, it has been possible to bring new insights into a controversial
hypothesis, that large groups of long-finned pilot whales at sea are not necessarily
composed of related matrilineal groups (Amos et al. 1993, Fullard 2000, Ottensmeyer

Chapter Seven: General Discussion and Future Work
176
& Whitehead 2003). However, parentage analyses confirm that some level of
philopatry to maternal group exists for both sexes, recalling the society of “resident”
killer whales described in the eastern North Pacific (Bigg et al. 1990). Unfortunately,
too many uncertainties remain around pilot whales social organisation to conduct a
thorough comparison to killer whales. For instance, some level of philopatry does not
imply that all individuals remain in the vicinity of their mother for life. On this,
“transient” killer whales differ from “resident” killer whales (Baird & Whitehead 2000).
It is not known if the social organisation of long-finned pilot whales from New Zealand
is closer to the “transient” or “resident” populations of killer whales. Different levels of
association could also exist beyond the simple matrilineal group, related or not to
kinship. In sperm whales for instance, Christal (1998) showed that long-term social
units sometimes include non-kin members.
Further analyses could be conducted with an exhaustive sampling of mass
strandings, including sampling of the whale returned to sea. However, cross-sectional
information, such as the one obtained from mass strandings, will always be limited for
the prospect of investigating social systems. In his conceptual framework, Hinde
(1976) described social structure as the content, quality and patterning of
relationships. The temporal aspect included in this definition can not be covered
when working on mass strandings. Therefore, research at sea is still necessary. It is
only from such studies that sufficient knowledge will be acquired to allow comparison
of pilot whales social systems to the patterns observed in killer whales and other
species. One major obstacle will be to find a population accessible enough to
investigation on a long-term basis. For such purpose, more opportunities might be
found among short-finned pilot whales, since several resident populations have been
described, notably around tropical and sub-tropical islands (e.g., Heimlich-Boran
1993).
Although showing a high level of fluidity, the social organisation of spinner dolphins
from Moorea (Chapter 2) is also characterized by some long-term associations
between individuals of both sexes (result not shown), as observed among long-finned
pilot whales of Nova Scotia (Ottensmeyer & Whitehead 2003) and short-finned pilot
whales of Canary Islands (Heimlich-Boran 1993). I do not know if spinner dolphins
Chapter Seven: General Discussion and Future Work
177
present some level of matrilineal philopatry in their social structure, but this is a
possibility. It can be noted that a matrilineal structure was suggested in bottlenose
dolphins from Sarasota Bay (which form small coastal and resident communities
similar in many ways to insular spinner dolphins), even though it is clearly not as
strict as “resident” killer whale matrilineal structure (Duffield & Wells 1991).
Unfortunately, during the course of my fieldwork, I was rarely able to obtain
photographs of the individual spinner dolphins from which I collected genetic samples
(due to the lack of an experienced photographer on the boat during sampling).
Therefore, I only have confirmation of genetic sampling for a few DMIs (Distinctively
Marked Individuals) of my photo-identification catalogue, preventing me from testing
for patterns of high relatedness or shared mtDNA haplotype in relation to long-term
association. Further studies should be conducted on this subject, in order to offer a
clearer description of spinner dolphin social system. This would provide valuable
material for comparison to other species of dolphins, notably to bottlenose dolphins
which also follow (in most case at least) a fission/fusion model of social organisation.
Among the four species investigated in this thesis, rough-toothed dolphins are by far
the least known, particularly in terms of social system (Chapter 6). The low level of
mtDNA diversity observed in the communities of this species could indicate
matrilineal structure, as described for other matrilineal species of odontocetes
(Whitehead 1998). I do not have at this stage direct evidence to support this
hypothesis, although long-term associations seem to occur among rough-toothed
dolphins at Moorea (Results not shown). Once again, this highlights the need for
long-term studies in support to molecular information. So far, most of the genetic
studies looking at the role of kinship in the patterns of dolphins’ social systems have
focused on Tursiops sp. (e.g., Krützen et al. 2003, Parsons et al. 2003, Möller et al.
2006). Although populations of spinner and rough-toothed dolphins are generally
harder to investigate than populations of bottlenose dolphins, they still represent
good candidates for such a purpose. Comparative studies combining complementary
tools, such as molecular markers and observational data, should provide further
fascinating results and help explain the striking differences observed within and
between different species of dolphin.

Appendices
178
8. Appendices
Biopsy sampling of rough-toothed at Moorea, August 2004

Appendices
179
Appendix 1: List of microsatellite loci used in this thesis, including the number of
individuals screened for each species (n), the number of alleles found (k), and the
alleles’ size ranges (range).
Spinner dolphin Rough-toothed dolphin Long-finned pilot
whale Locus Sources Motif n k (range) n k (range) n k (range)
409/470 (1) ? - - 33 4 (167-173) 254 12 (168-202) 415/416 (1) GT23 132 12 (216-238) 50 8 (216-232) 266 9 (210-238) 464/465 (1) GT3CTGT20 - - - - 261 9 (136-154) AAT44 (2) AAT12 136 10 (82-109) 6 2 (82-84) 7 1 (76) DlrFCB1 (3) AC16 62 13 (106-150) 53 8 (101-117) 267 15 (95-137) DlrFCB6 (3) TG28 - - - - 262 7 (161-179) EV1 (4) AC13TC8 136 15 (123-175) 56 5 (114-122) 266 14 (139-167) EV37 (4) AC24 8 4 (179-185) 49 16 (194-232) 267 9 (172-194) EV94 (4) TC6…AC20 136 20 (230-270) 43 13 (213-239) 265 6 (267-277) GATA53 (5) GATAn - - - - 240 8 (266-294) GATA98 (5) GATAn 137 9 (84-116) 55 3 (79-87) 34 1 (86) GT23 (6) GTn - - 55 3 (64-70) 267 5 (72-80) GT39 (2) AC21 - - 51 10 (152-176) 121 4 (139-155) GT48 (2) CT17N9CA18 48 17 (180-232) - - 118 18 (192-240) GT51 (2) GT16 93 9 (194-228) 6 2 (200-202) 261 3 (101-105) GT142 (2) TG20 96 8 (180-198) 6 1 (178) 7 1 (182) GT575 (6) GTn 135 8 (138-152) 6 1 (132) 265 11 (143-167) GT6 (2) CA18 135 10 (186-204) 51 10 (200-228) 122 7 (190-212) KWM12a (7) ? 136 11 (157-183) - - 38 2 (154-156) MK5 (8) # 137 12 (202-230) 54 9 (209-229) 122 7 (215-227) MK6 (8) GT17 136 19 (143-183) 54 4 (118-132) 122 3 (134-140) MK8 (8) CA23 61 7 (76-102) 53 9 (94-110) 228 13 (92-114) MK9 (8) CA17 113 8(159-181) 55 10 (156-176) 120 4 (157-163) Ppho110 (9) CA22 - - 52 3 (112-118) 122 5 (105-113) Ppho131 (9) CA13 137 14 (162-202) 52 8 (183-205) 267 11 (183-205) Ppho142 (9) CA22 132 10 (131-153) - - 7 1 (174) Values in bold indicate that the locus was used for the thesis analyses. Otherwise, the locus was
rejected for analyses. The reasons for rejecting a locus were either: low variability, unclear peaks,
detection of null allele or detection of linkage disequilibrium. Empty cells stand for the loci which failed
to amplify from polymerase chain reaction or the loci providing messy peaks preventing accurate allele
calling. Sources: (1) (Amos et al. 1993); (2) (Caldwell et al. 2002); (3) (Buchanan et al. 1996); (4)
(Valsecchi & Amos 1996); (5) (Palsbøll et al. 1997); (6) (Bérubé et al. 2000); (7) (Hoelzel et al. 1998b);
(8) (Krützen et al. 2001); (9) (Rosel et al. 1999). #(TG)13CT(TG)2CA(TG)2(TA)2(TG)4.

Appendices
180
Appendix 2: Spinner dolphin photographs quality assessment based on Q-values
categories.
The quality of the dorsal fin photographs used in Chapter 2 was assessed on the
basis of five criteria, also used in previous cetacean photo-identification studies
(Arnborn 1987, Ottensmeyer 2001). These are: focus, size of the dorsal fin on the
image, exposure, orientation and percentage visible. For each criterion, the
photographs were assigned a grade from 1 to 5 (Table 8.1). The final Q-value of
each dorsal fin was calculated as the average grade over the five criteria. Therefore,
the Q-values also ranged from 1 to 5. All photographs ranking 1 for at least one
criterion were excluded from the analysis of community size estimate, along with the
dorsal fin images that rated Q < 3. Size of the dorsal fins on the images were
measured based on the “actual size” of the image on the computer screen.
Table 8.1 Description of the criteria used to assess the quality of dorsal fin images
Criterion Grade Description
FOCUS 1 Very blurry 2 Blurry but general outline visible 3 Reasonable, but small nicks not visible 4 Reasonable, small nicks visible 5 Excellent, everything in focus
SIZE 1 Less than 2 cm 2 Between 2 and 4 cm 3 Between 4 and 6 cm 4 Between 6 and 10 cm 5 More than 10 cm
EXPOSURE 1 Over or under exposed, only silhouette is visible 2 Too light or dark and some details are not seen 3 A little light or dark but all details are thought to be seen 4 A little light or dark but all details are clearly seen 5 Excellent
ORIENTATION 1 Perpendicular 2 > 45 degrees 3 About 45 degrees 4 < 45 degrees 5 Parallel
PERCENTAGE VISIBLE 1 < 60% visible 2 Between 60 and 80% visible 3 About 80% visible 4 Between 80 and 100% visible 5 100% visible

Appendices
181
Appendix 3: Dolphin behavioural responses to biopsy sampling
Skin samples were collected from free-ranging dolphins for three of the four species
investigated in this thesis: spinner dolphin, rough-toothed dolphin and short-finned
pilot whale. Biopsy samples were obtained with lightweight darts fired by a variable-
pressure PAXARMS© biopsy rifle (Krützen et al. 2002). The cutting tip of the dart
measured 4mm in diameter and 6mm in length.
Sampling was only undertaken in sea state up to Beaufort scale three. Following
each biopsy sampling attempt, the behavioural response of the targeted dolphin was
recorded by the biopsier. Each shot was classified as ‘hit’ or ‘miss’; shots where the
dart touched the dolphin were considered a ‘hit’, regardless of the success in getting
a tissue sample in the tip. Responses were classified in five categories, following
Krützen et al. (2002):
- (0): no visible reaction, dolphin continued pre-biopsy behaviour;
- (1): “startle” response, dolphin moved away (flinch) but stayed in the
immediate vicinity of the boat;
- (2): splashing during moving away and/or tail slap, with or without return to
the boat;
- (3): single leap or porpoise;
- (4): multiple leaps or porpoises.
Frequencies of responses for each of the three species are compiled in Table 8.2.
Table 8.2: Summary of the behavioural responses shown to biopsy sampling by three species of
dolphins.
Spinner dolphin Rough-toothed dolphin Short-finned pilot
whale Response Hit Miss Total Hit Miss Total Hit Miss Total
(0) 4 4 8 0 5 5 0 4 4 (1) 30 25 55 7 10 17 26 2 28 (2) 91 59 150 34 10 44 13 0 13 (3) 16 16 32 16 0 17 0 0 0 (4) 1 1 2 14 0 14 0 0 0
total 142 105 247 71 25 97 39 6 45

Appendices
182
Interestingly, proportional frequencies revealed different patterns of responses
between these species (Figure 8.1). For instance, spinner dolphins showed no
significant differences in behavioural responses for hit or miss shots; on the other
hand, rough-toothed dolphins appeared to react more to hit shots (results not
shown). Another interesting tendency was the lower level of reaction shown by short-
finned pilot whales to hit shots compared to the level of reaction by spinner and
rough-toothed dolphins.
Figure 8.1: Patterns of behavioural reactions to biopsy sampling for three species of dolphins. Results
are shown for hit and miss shots.
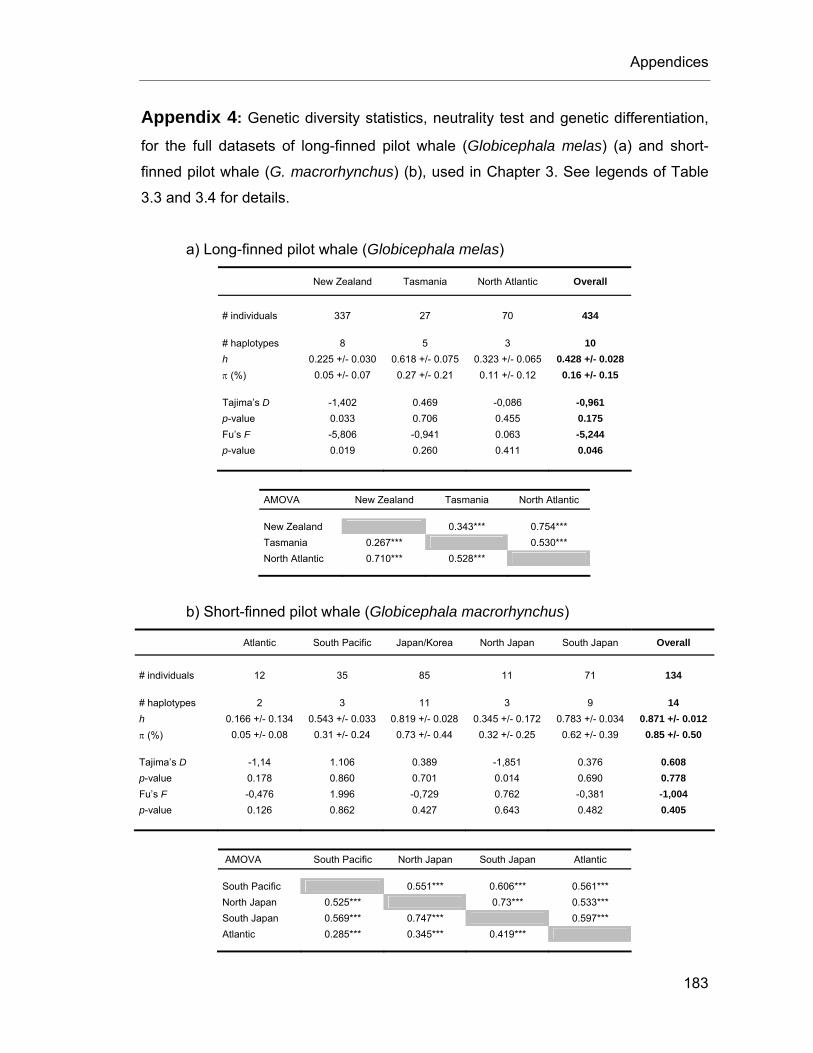
Appendices
183
Appendix 4: Genetic diversity statistics, neutrality test and genetic differentiation,
for the full datasets of long-finned pilot whale (Globicephala melas) (a) and short-
finned pilot whale (G. macrorhynchus) (b), used in Chapter 3. See legends of Table
3.3 and 3.4 for details. a) Long-finned pilot whale (Globicephala melas)
New Zealand Tasmania North Atlantic Overall
# individuals 337 27 70 434 # haplotypes 8 5 3 10 h 0.225 +/- 0.030 0.618 +/- 0.075 0.323 +/- 0.065 0.428 +/- 0.028 π (%) 0.05 +/- 0.07 0.27 +/- 0.21 0.11 +/- 0.12 0.16 +/- 0.15 Tajima’s D -1,402 0.469 -0,086 -0,961 p-value 0.033 0.706 0.455 0.175 Fu’s F -5,806 -0,941 0.063 -5,244 p-value 0.019 0.260 0.411 0.046
AMOVA New Zealand Tasmania North Atlantic
New Zealand 0.343*** 0.754*** Tasmania 0.267*** 0.530*** North Atlantic 0.710*** 0.528***
b) Short-finned pilot whale (Globicephala macrorhynchus) Atlantic South Pacific Japan/Korea North Japan South Japan Overall
# individuals 12 35 85 11 71 134 # haplotypes 2 3 11 3 9 14 h 0.166 +/- 0.134 0.543 +/- 0.033 0.819 +/- 0.028 0.345 +/- 0.172 0.783 +/- 0.034 0.871 +/- 0.012 π (%) 0.05 +/- 0.08 0.31 +/- 0.24 0.73 +/- 0.44 0.32 +/- 0.25 0.62 +/- 0.39 0.85 +/- 0.50 Tajima’s D -1,14 1.106 0.389 -1,851 0.376 0.608 p-value 0.178 0.860 0.701 0.014 0.690 0.778 Fu’s F -0,476 1.996 -0,729 0.762 -0,381 -1,004 p-value 0.126 0.862 0.427 0.643 0.482 0.405
AMOVA South Pacific North Japan South Japan Atlantic
South Pacific 0.551*** 0.606*** 0.561*** North Japan 0.525*** 0.73*** 0.533*** South Japan 0.569*** 0.747*** 0.597*** Atlantic 0.285*** 0.345*** 0.419***

Appendices
184
Appendix 5: Case of potential paternity within a matrilineal group of long-finned
pilot whales
Parentage analyses of the long-finned pilot whale mass strandings from New
Zealand have confirmed that, overall, mature males do not reproduce with mature
females of their own group (Chapter 4), as suggested by previous genetic studies in
the Faroe Islands (Amos et al. 1993, Fullard 2000). However, I found one exception
within the mass stranding of Stewart Island 2003, where a mature male (Glo118) was
found to be the potential father of an immature whale from the same mass stranding
(Glo131, male). This assignment was supported by 95% confidence based on the
Cervus likelihood-based approach (14 microsatellite loci, see section 4.3.7 for details
on the method). It was further confirmed by the analyses of 6 additional loci screened
for the purpose of Chapter 5 (20 loci total, Table 8.3). Directionality of this
relationship was assumed based on body size of the two individuals, Glo118 = 550
cm and Glo131 = 370 cm.
Analyses to identify the mother of the offspring among mature females of the mass
stranding revealed two potential mothers with no mismatches at 20 loci (Glo109 and
Glo200, Table 8.3). Unfortunately, Cervus was not able to designate, with 95% or
80% confidence, one of the two females as the most-likely mother. Assuming that
Glo118 was the real father of Glo131 (as supported by the likelihood statistic), I
compared genotypes of all four individuals to determine if at least one of the two
potential mothers carried the alleles complementary to the alleles of Glo118 which
could resolve the full genotype of offspring Glo131 (i.e., a female carrying all alleles
found in the offspring which could not come from its father). Glo109 had such
complementary alleles, while Glo200 was missing several of them (Table 8.3).
Therefore, this gives support to the pair Glo118 and Glo109 as being the parents of
Glo131, and it fully discounts the scenario where Glo118 and Glo200 are the two
parents.

Appendices
185
Table 8.3: Genotypes for 20 microsatellite loci of: the offspring, Glo131; its most-likely father, Glo118;
and its two potential mothers, Glo109 and Glo200. * indicates the loci excluding Glo200 as a potential
mother of Glo131 under the assumption that Glo118 is the real father.
Offspring Most-likely father Potential mothers
Code Glo131 Glo118 Glo109 Glo200
Size 370 550 390 430 Sex male male female female
EV37 188 192 180 192 188 192 180 192 * Ppho131 195 197 189 195 197 205 195 197 415/416 226 228 224 228 210 226 226 228 MK9 161 163 161 161 161 163 157 161 * EV94 271 275 271 275 275 275 275 275 GT575 151 151 151 151 151 153 151 153 GT51 201 203 203 203 201 203 203 203 * MK5 217 219 215 219 217 219 217 219 GT23 72 76 72 76 72 76 72 76 Ppho110 109 109 109 109 109 109 109 109 DlrFCB1 125 125 125 125 125 127 125 127 DlrFCB6 175 177 175 177 175 175 169 175 409/470 184 186 184 194 186 198 184 186 464/465 140 140 140 148 140 148 140 140 EV1 149 151 149 151 149 149 149 149 GT6 190 204 190 204 190 190 190 190 MK6 138 138 138 138 138 140 138 138 GATA53 278 286 278 286 282 286 282 286 MK8 104 106 102 106 96 104 96 106 * GT39 139 139 139 151 139 151 139 139
Interestingly, parentage analyses among mature individuals (results not shown)
revealed that Glo200 was the most-likely mother (95% confidence) of both Glo118
and Glo109 (Figure 8.2). Indeed, the body length of Glo200 was 430cm while the
body length of Glo109 was 390cm, indicating that the former was the oldest (i.e., the
mother and not the daughter of Glo109). Note that it can not be ruled out that Glo118
was the father of Glo200 (and thus the grand-father of Glo109) but this is unlikely in
regards to the overall trends in social structure of this species (see Chapter 4).
Glo118 and Glo109 were thus most-likely half-siblings. This relationship indicates
that mating between close relatives in long-finned pilot whales is likely to occur on
some occasions although it clearly represents a small percentage of parentages (see
Chapter 4). Further analyses should help estimate the true frequency of such mating
events in long-finned pilot whales.

Appendices
186
Figure 8.2: Parental connexions and inferred genealogy between four individuals of Stewart Island
2003 mass stranding based on strict exclusion (no mismatch at 20 loci). Information on the level of
confidence in parentage relationships as derived from likelihood-based approach is also given; full
lines indicate 95% confidence while dotted lines indicate no support at 80% confidence. White box:
female; grey box: male. The total body length of each individual is also given.
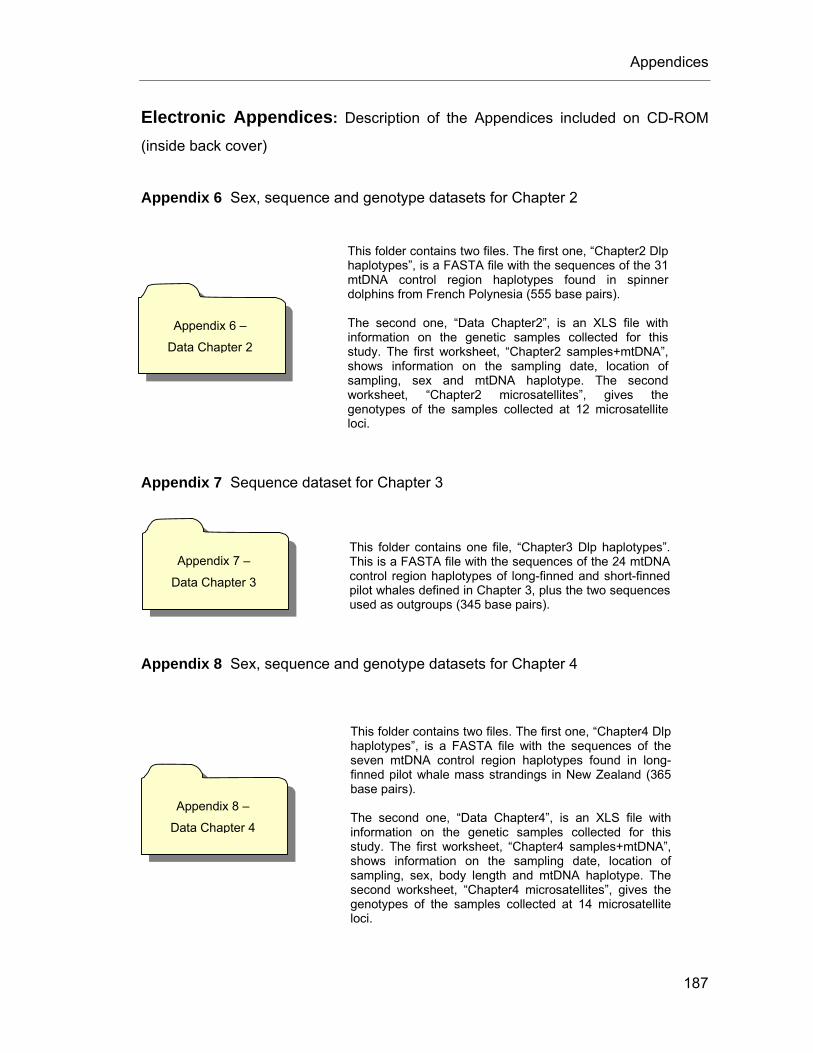
Appendices
187
Electronic Appendices: Description of the Appendices included on CD-ROM
(inside back cover)
Appendix 6 Sex, sequence and genotype datasets for Chapter 2
Appendix 7 Sequence dataset for Chapter 3
Appendix 8 Sex, sequence and genotype datasets for Chapter 4
Appendix 6 –
Data Chapter 2
This folder contains two files. The first one, “Chapter2 Dlp haplotypes”, is a FASTA file with the sequences of the 31 mtDNA control region haplotypes found in spinner dolphins from French Polynesia (555 base pairs). The second one, “Data Chapter2”, is an XLS file with information on the genetic samples collected for this study. The first worksheet, “Chapter2 samples+mtDNA”, shows information on the sampling date, location of sampling, sex and mtDNA haplotype. The second worksheet, “Chapter2 microsatellites”, gives the genotypes of the samples collected at 12 microsatellite loci.
Appendix 7 –
Data Chapter 3
This folder contains one file, “Chapter3 Dlp haplotypes”. This is a FASTA file with the sequences of the 24 mtDNA control region haplotypes of long-finned and short-finned pilot whales defined in Chapter 3, plus the two sequences used as outgroups (345 base pairs).
Appendix 8 –
Data Chapter 4
This folder contains two files. The first one, “Chapter4 Dlp haplotypes”, is a FASTA file with the sequences of the seven mtDNA control region haplotypes found in long-finned pilot whale mass strandings in New Zealand (365 base pairs). The second one, “Data Chapter4”, is an XLS file with information on the genetic samples collected for this study. The first worksheet, “Chapter4 samples+mtDNA”, shows information on the sampling date, location of sampling, sex, body length and mtDNA haplotype. The second worksheet, “Chapter4 microsatellites”, gives the genotypes of the samples collected at 14 microsatellite loci.
Appendices
188
Appendix 9 Genotype dataset for Chapter 5
Appendix 10 Sex, sequence and genotype datasets for Chapter 6
Appendix 9 –
Data Chapter 5
This folder contains one file, “Data Chapter5”. This is an XLS file with the genotypes, at 20 microsatellite loci, of the 122 long-finned pilot whales from the mass stranding of Stewart Island in 2003.
Appendix 10 –
Data Chapter 6
This folder contains two files. The first one, “Chapter6 Dlp haplotypes”, is a FASTA file with the sequences of the five mtDNA control region haplotypes found in rough-toothed dolphins from French Polynesia (450 base pairs). The second one, “Data Chapter6”, is an XLS file with information on the genetic samples collected for this chapter. The first worksheet, “Chapter6 samples +mtDNA”, shows information on the sampling date, location of sampling, sex and mtDNA haplotype. The second worksheet, “Chapter6 microsatellites”, gives the genotypes of the samples collected at 15 microsatellite loci.

189
9. References
Adams LD, Rosel PE (2006) Population differentiation of the Atlantic spotted dolphin
(Stenella frontalis) in the western North Atlantic, including the Gulf of Mexico.
Mar Biol 148:671-681
Aguilar A, Jover L, Borrell A (1993) Heterogeneities in organochlorine profiles of
Faroese long-finned pilot whales: indication of segregation between pods?
Rep Int Whal Comm Special issue 14:359-367
Alexander AM (2006) “Oh mother, when art thou?” Low mtDNA diversity in long-
finned pilot whales (Globicephala melas). MSc thesis, The University of
Auckland
Alexander RD (1974) The evolution of social behaviour. Annu Rev Ecol Syst 5:325-
383
Amos B, Barrett J, Dover GA (1991) Breeding behaviour of pilot whales revealed by
DNA fingerprinting. Heredity 67:49-55
Amos B, Schlötterer C, Tautz D (1993) Social structure of pilot whales revealed by
analytical DNA profiling. Science 30:670-672
Andersen LW (1988) Electrophoretic differentiation among local populations of the
long-finned pilot whale, Globicephala melaena, at the Faroe Islands. Can J
Zool/Rev Can Zool 66:1884-1892
Anselin L (1995) Local indicator of spatial association - LISA. Geographical Analysis
27:93-115
Aris-Brosou S, Excoffier L (1996) The impact of population expansion and mutation
rate heterogeneity on DNA sequence polymorphism. Mol Biol Evol 13:494-504
Arnason U, Gullberg A, Janke A (2004) Mitogenomic analyses provide new insights
into cetacean origin and evolution. Gene 333:27-34
Arnborn T (1987) Individual identification of sperm whales. Rep Int Whal Comm
37:201-204
Avise JC (2004) Molecular markers, natural history, and evolution, Vol. Sinauer
Associates, Sunderland, Massachusetts

190
Baguette M (2004) The classical metapopulation theory and the real, natural world: A
critical appraisal. Basic and Applied Ecology 5:213-224
Baird RW (2000) The killer whale: foraging specializations and group hunting. In:
Mann J, Connor RC, Tyack PL, Whitehead H (eds) Cetacean Societies: Field
Studies of Whales and Dolphins. University of Chicago Press, Chicago, p 127-
153
Baird RW, Dill LM (1995) Occurrence and behaviour of transient killer whales:
seasonal and pod-specific variability, foraging behaviour, and prey handling.
Can J Zool/Rev Can Zool 73:1300-1311
Baird RW, McSweeney DJ, Webster DL, Gorgone AM, Ligon AD (2003) Studies of
odontocete population structure in hawaiian waters: results of a survey
through the main hawaiian islands in May and June 2003. Report No. Report
prepared under Contract No. AB133F-02-CN-0106 from the National Oceanic
and Atmospheric Administration, Western Administrative Support Center
Baird RW, Webster DL, Mahaffy SD, McSweeney DJ, Ligon AD (in press) Site fidelity
and association patterns in a deep-water dolphin: rough-toothed dolphins
(Steno bredanensis) in the Hawaiian Archipelago. Mar Mamm Sci
Baird RW, Whitehead H (2000) Social organization of mammal-eating killer whales:
group stability and dispersal patterns. Can J Zool/Rev Can Zool 78:2096-2105
Baker AN (1981) Strandings of cetaceans on the New Zealand coast 1862-1981.
Report No. Wildlife Society NZVA Publication no. 1, Wildlife Society NZVA
Publication no. 1
Baker CS, Cipriano F, Palumbi SR (1996) Molecular genetic identification of whale
and dolphin products from commercial markets in Korea and Japan. Mol Ecol
5:671-685
Baker CS, Lento GM, Cipriano F, Dalebout ML, Palumbi SR (2000) Scientific
whaling: source of illegal products for markets? Science 290:1695
Baker CS, Medrano-Gonzales L, Calambokidis J, Perry A, Pichler FB, Rosenbaum
HC, Straley JM, Urban-Ramirez J, Yamaguchi M, Von Ziegesar O (1998)
Population structure of nuclear and mitochondrial DNA variation among
humpback whales in the North Pacific. Mol Ecol 7:695-707
Baker CS, Palumbi SR (1994) Which whales are hunted? A molecular genetic
approach to monitoring whaling. Science 265:1538-1539
191
Baker CS, Palumbi SR (1995) Population structure, molecular systematics and
forensic identification of whales and dolphins. In: Avise JC, Hamrick JL (eds)
Conservation genetics: Case histories from nature. Chapman and Hall, New
York, p 10-49
Baker CS, Perry A, Bannister JL, Weinrich MT, Abernethy B, Calambokidis J, Lien J,
Lambertsen RH, Urban-R. J, Vasquez O, Clapham PJ, Alling A, O'Brien SJ,
Palumbi SR (1993) Abundant mitochondrial DNA variation and world-wide
population structure in humpback whales. Proc Natl Acad Sci USA 90:8239-
8243
Baker CS, Slade RW, Bannister JL, Abernethy RB, Weinrich MT, Lien J, Urban-R. J,
Corkeron P, Calambokidis J, Vasquez O, Palumbi SR (1994) Hierarchical
structure of mitochondrial DNA gene flow among humpback whales,
Megaptera novaeangliae, world-wide. Mol Ecol 3:313-327
Ballance LT, Pitman RL (1998) Cetaceans of the western tropical Indian Ocean:
distribution, relative abundance, and comparisons with cetacean communities
of two other tropical ecosystems. Mar Mamm Sci 14:429-459
Ballard JWO, Rand DM (2005) The population biology of mitochondrial DNA and its
phylogenetic implications. Annu Rev Ecol, Evol Syst 36:621-642
Bandelt H, Forster P, Rohl A (1999) Median-joining networks for inferring intraspecific
phylogenies. Mol Biol Evol 16:37-48
Banks SC, Lindenmayer DB, Ward SJ, Taylor AC (2005) The effects of habitat
fragmentation via forestry plantation establishment on spatial genotypic
structure in the small marsupial carnivore, Antechinus agilis. Mol Ecol
14:1667-1680
Barnes LG (1985) Evolution, taxonomy and anti-tropical distributions of the porpoises
(Phocoenidae, Mammalia). Mar Mamm Sci 1:149-165
Barnes LG (2002) Delphinoids, evolution of the modern families. In: Perrin WF,
Würsig B, Thewissen JGM (eds) Encyclopedia of marine mammals. Academy
Press, San Diego, CA, p 314-316
Barnes LG, Domning DP, Clayton ER (1985) Status of studies on fossil marine
mammals. Mar Mamm Sci 1:15-53
192
Barrett-Lennard LG (2000) Population structure and mating patterns of killer whales
(Orcinus orca) as revealed by DNA analysis. PhD thesis, The University of
British Columbia
Barrett-Lennard LG, Smith TG, Ellis GM (1996) A cetacean biopsy system using
lightweight pneumatic darts, and its effect on the behavior of killer whales. Mar
Mamm Sci 12:14-27
Barton RA (1996) Neocortex size and behavioural ecology in primates. Proc R Soc
Lond B 263:173-177
Beasley I, Robertson KM, Arnold P (2005) Description of a new dolphin, the
Australian Snubfin dolphin Orcaella heinsohni sp. n. (Cetacea, Delphinidae).
Mar Mamm Sci 21:365-400
Belkhir K, V. C, Bonhomme F (2002) IDENTIX, a software to test for relatedness in a
population using permutation methods. Mol Ecol Notes 2:611-614
Bérubé M, Jørgensen H, McEwing R, Palsbøll PJ (2000) Polymorphic di-nucleotide
microsatellite loci isolated from the humpback whale, Megaptera
novaeangliae. Mol Ecol 9:2155-2234
Best PB (1979) Social organization of sperm whales, Physeter macrocephalus. In:
Winn HE, Olla BL (eds) Behavior in marine mammals: current perspective in
research. Plenum Press, New York
Bigg MA, Olesuik PF, Ellis GM, Ford JKB, Balcomb KC (1990) Social organization
and genealogy of resident killer whales (Orcinus orca) in the coastal waters of
British Columbia and Washington State. Rep Int Whal Comm Special issue
12:383-405
Bilgmann K, Griffiths OJ, Allen SJ, Möller LM (2007) A biopsy pole system for bow-
riding dolphins: sampling success, behavioral responses, and test for sampling
bias. Mar Mamm Sci 23:218-225
Bloch D, Desportes G, Mouritsen R, Skaaning S, Stefansson E (1993) An
introduction to studies of the ecology and status of the long-finned pilot whale
(Globicephala melas) off the Faroe Islands, 1986 - 1988. Rep Int Whal Comm
Special issue 14:1-32
Block D, Lockyer C, Zachariassen M (1993) Age and growth parameters of the long-
finned pilot whale off the Faroe Islands. Rep Int Whal Comm Special issue
14:163-207

193
Bonin A, Bellemain E, Bronken Eidesen P, Pompanon F, Brochmann C, Taberlet P
(2004) How to track and assess genotyping errors in population genetics
studies. Mol Ecol 13:3261-3273
Bowden DC, Kufeld RC (1995) Generalized mark-resight population size estimation
applied to Colorado moose. J Wildl Manage 59:840-851
Brabyn MW, McLean IG (1992) Oceanography and coastal topography of herd-
stranding sites for whales in New Zealand. Journal of Mammalogy 73:469-476
Bradshaw CJA, Evans K, Hindell MA (2005) Mass cetacean strandings - a plea for
empiricism. Conserv Biol 20:584-586
Brown SG (1978) Whale marking techniques. In: Stonehouse B (ed) Recognition
marking of animals in research. University Park Press, Baltimore
Buchanan FC, Friesen MK, Littlejohn RP, Clayton JW (1996) Microsatellites from the
beluga whales (Delphinapterus leucas). Mol Ecol 5:571-575
Caballero S, Trujillo F, Vianna JA, Barrios-Garrido H, Montiel MG, Beltrán-Pedreros
S, Marmontel M, Santos MCO, Rossi-Santos M, Santos FR, Baker CS (2007)
Taxonomic status of the genus Sotalia: species level ranking for “tucuxi”
(Sotalia fluviatilis) and “costero” dolphins (Sotalia guianensis). Mar Mamm Sci
23:358-386
Caldwell M, Gaines M, Hughes CR (2002) Eight polymorphic microsatellite loci for
bottlenose dolphin and other cetacean species. Mol Ecol Notes 2:393-395
Cassens I, Van Waerebeek K, Best PB, Crespo EA, Reyes J, Milinkovitch MC (2003)
The phylogeography of dusky dolphins (Lagenorhynchus obscurus): a critical
examination of network methods and rooting procedures. Mol Ecol 12:1781-
1792
Cassens I, Van Waerebeek K, Best PB, Tzika A, Van Helden AL, Crespo EA,
Milinkovitch MC (2005) Evidence for male dispersal along the coasts but no
migration in pelagic waters in dusky dolphins (Lagenorhynchus obscurus). Mol
Ecol 14:107-121
Castelloe J, Templeton AR (1994) Root probabilities for intraspecific gene trees
under neutral coalescent theory. Mol Phylogen Evol 3:102–113
Caughley G (1977) Analysis of vertebrate populations, Vol. Wiley, London; New York
194
Caurant F, Amiard-Triquet C, Amiard J-C (1993) Factors influencing the
accumulation of metals in pilot whales (Globicephala melas) off the Faroe
Islands. Rep Int Whal Comm Special issue 14:369-390
Chambers GK, MacAvoy ES (2000) Microsatellites: consensus and controversy.
Comp Biochem Physiol B: Biochem Mol Biol 126B:455-476
Christal J (1998) An analysis of sperm whale social structure: patterns of association
and genetic relatedness. PhD thesis, Dalhousie University
Cipriano F (1997) Antitropical distribution and speciation in dolphins of the genus
Lagenorhynchus: a preleminary analysis. In: Dizon AE, Chivers SJ, Perrin WF
(eds) Molecular genetics of marine mammals. Society for Marine Mammalogy,
Lawrence, KC, p 305-316
Clement M, Posada D, Crandall KA (2000) TCS: a computer program to estimate
gene genealogies. Mol Ecol 9:1657-1659
Connor RC (2000) Group living in whales and dolphins. In: Mann J, Connor RC,
Tyack PL, Whitehead H (eds) Cetacean Societies: Field Studies of Whales
and Dolphins. University of Chicago Press, Chicago, p 199-218
Connor RC (2007) Dolphin social intelligence: complex alliance relationships in
bottlenose dolphins and a consideration of selective environments for extreme
brain size evolution in mammals. Proc R Soc Lond B 362:587-602
Connor RC, Heithaus MR, Barré LM (1999) Superalliance of bottlenose dolphins.
Nature 397:571-572
Connor RC, Mann J, Tyack PL, Whitehead H (1998) Social evolution in toothed
whales. Trends Ecol Evol 13:228-232
Connor RC, Read A, Wrangham R (2000a) Male reproductive strategies and social
bonds. In: Mann J, Connor RC, Tyack PL, Whitehead H (eds) Cetacean
Societies: Field Studies of Whales and Dolphins. University of Chicago Press.,
Chicago, p 247-269
Connor RC, Smolker RA, Richards AF (1992) Two levels of alliance formation among
male bottlenose dolphins (Tursiops sp.). Proc Natl Acad Sci USA 89:987-990
Connor RC, Wells RS, Mann J, Read A (2000b) The bottlenose dolphin: social
relationships in a fission-fusion society. In: Mann J, Connor RC, Tyack PL,
Whitehead H (eds) Cetacean Societies: Field Studies of Whales and Dolphins.
University of Chicago Press, Chicago, p 91-126
195
Constantine R (2002) The behavioural ecology of the bottlenose dolphins (Tursiops
truncatus) of Northeastern New Zealand: a population exposed to tourism.
PhD thesis, University of Auckland
Cordes DO (1982) The causes of mass strandings. New Zealand Veterinary Journal
30:21-24
Cornuet JM, Luikart G (1996) Description and power analysis of two tests for
detecting recent population bottlenecks from allele frequency data. Genetics
144:2001-2014
Crandall KA, Templeton AR (1993) Empirical tests of some predictions from
coalescent theory with applications to intraspecific phylogeny reconstruction.
Genetics 134:959-969
Cunha HA, da Silva VMF, Lailson-Brito Jr J, Santos MCO, Flores PAC, Martin AR,
Azevedo AF, Fragoso ABL, Zanelatto RC, Solé-Cava AM (2005) Riverine and
marine ecotypes of Sotalia dolphins are different species. Mar Biol 148:449-
457
Dalebout ML, Baker CS, Mead JG, Cockcroft VG, Yamada TK (2004a) A
comprehensive and validated molecular taxonomy of beaked whales, Family
Ziphiidae. J Hered 95:459-473
Dalebout ML, Baker CS, Steel D, Robertson KM, Chivers SJ, Perrin WF, Mead JG,
Grace RV, Schofield TDJ (in press) A divergent mtDNA lineage among
Mesoplodon beaked whales: molecular evidence for a new species in the
tropical Pacific? Mar Mamm Sci
Dalebout ML, Lavery S, Funahashi N, Ma YU, Endo T, Haraguchi K, Olavarría C,
Baker CS (2004b) Molecular identification of small cetacean species from
Japanese and Korean markets, 1993 – 2003. Report No. Report to the
scientific committee of the International Whaling Commission. SC/56/BC5
Dalebout ML, Robertson KM, Frantzis A, Engelhaupt D, Mignucci-Giannoni AA,
Rosario-Delestre RJ, Baker CS (2005) Worldwide structure of mtDNA diversity
among Cuvier's beaked whales (Ziphius cavirostris): implications for
threatened populations. Mol Ecol 14:3353-3371
Dalebout ML, Ruzzante DE, Whitehead H, Øien NI (2006) Nuclear and mitochondrial
markers reveal distinctiveness of a small population of bottlenose whales
(Hyperoodon ampulatus) in the western North Atlantic. Mol Ecol 15:3115-3129

196
Dalebout ML, Van Helden A, Van Waerebeek K, Baker CS (1998) Molecular genetic
identification of Southern Hemisphere beaked whales (Cetacea: Ziphiidae).
Mol Ecol 7:687-695
Davis JL (1960) The southern form of pilot whale. Journal of Mammalogy 41:29-34
Davis JL (1963) The antitropical factor in cetacean speciation. Evolution 17:107-116
Dawson SM, Slooten E (1993) Conservation of Hector's dolphins: the case and
process which led to establishment of the Bank Peninsula marine mammal
sanctuary. Aquat Conserv: Mar Freshwat Ecosyst 3:207-221
Dietz EJ (1983) Permutation tests for association between two distance matrices.
Syst Zool 32:21-26
Dizon AE, Anderson L, Smith T (1993) MtDNA sequences of long-finned pilot whales
(Globicephala melanea) from the Farae Islands and the western North
Atlantic. Report No. WP-3 submitted to the ICES Study Group on Pilot
Whales, Copenhagen, 30 August-3 September 1993
Dizon AE, Southern SO, Perrin WF (1991) Molecular analysis of mtDNA types in
exploited populations of spinner dolphins (Stenella longirostris). Rep Int Whal
Comm Special Issue 13:183-202
Duffield DA, Ridgway SH, Cornell LH (1983) Hematology distinguishes coastal and
offshore forms of dolphins (Tursiops). Can J Zool/Rev Can Zool 61:930-933
Duffield DA, Wells RS (1991) The combined application of chromosome, protein and
molecular data for the investigation of social unit structure and dynamics in
Tursiops truncatus. In: Hoelzel AR (ed) The ecology of whales and dolphins,
Vol 13. International Whaling Commission, Cambridge, U.K., p 155-169
Duffield DA, Wells RS (2002) The molecular profile of a resident community of
bottlenose dolphins, Tursiops truncatus. In: Pfeiffer CJ (ed) Cell and molecular
biology of marine mammals. Krieger Publishing Co., Inc, Melbourne, FL, p 3-
11
Elmhagen B, Angerbjörn A (2001) The applicability of metapopulation theory to large
mammals. Oikos 94:89-100
Endo T, Haraguchi K, Hotta Y, Hisamichi Y, Lavery S, Dalebout ML, Baker CS (2005)
Total mercury, methyl mercury, and selenium levels in the red meat of small
cetaceans sold for human consumption in Japan. Environ Sci Technol
39:5703-5708
197
Escorza-Trevino S, Dizon AE (2000) Phylogeography, intraspecific structure and sex-
biased dispersal of Dall's porpoise, Phocoenoides dalli, revealed by
mitochondrial and microsatellite DNA analyses. Mol Ecol 9:1049-1060
Evans K, Thresher R, Warneke RM, Bradshaw CJA, Pook M, Thiele D, Hindell MA
(2005) Periodic variability in cetacean strandings: links to large-scale climate
events. Biology letters 1:147-150
Excoffier L, Laval LG, Schneider S (2005) Arlequin ver. 3.0: An integrated software
package for population genetics data analysis. Evol Bio On 1:47-50
Excoffier L, Smouse PE, Quattro JM (1992) Analysis of molecular variance inferred
from metric distances among DNA haplotypes: application to human
mitochondrial DNA restriction data. Genetics 131:479-491
Fehring WK, Wells RS (1976) A series of strandings by a single herd of pilot whales
on the west coast of Florida. Journal of Mammalogy 57:191-194
Frankham R, Ballou JD, Briscoe DA (2002) Introduction to conservation genetics,
Vol. Cambridge University Press
Frey A, Crockford SJ, Meyer M, O'Corry-Crowe GM (2005) Genetic analysis of
prehistoric marine mammal bones from an ancient aleut village in the
southeastern Bering Sea 16th Biennial Conference on the Biology of Marine
Mammals, San Diego, California, December 12-16, 2005
Fu XY (1997) Statistical tests of neutrality of mutations against population growth,
hitchhiking and background selection. Genetics 147:915-925
Fullard KJ (2000) Microsatellite analysis of long-finned pilot whales. PhD thesis,
Cambridge University
Fullard KJ, Early G, Heide-Jørgensen MP, Bloch D, Rosing-Asvid A, Amos W (2000)
Population structure of long-finned pilot whales in the North Atlantic: a
correlation with sea surface temperature? Mol Ecol 9:949-958
Funk DJ, Omland KE (2003) Species-level paraphyly and polyphyly: frequency,
causes, and consequences, with insights for animal mitochondrial DNA. Annu
Rev Ecol, Evol Syst 34:397-423
Galver L (2002) The molecular ecology of spinner dolphins, Stenella longirostris:
genetic diversity and population structure. PhD thesis, University of California,
San Diego

198
Gannier A (2000) Distribution of cetaceans off the Society Islands (French Polynesia)
as obtained from dedicated survey. Aquat Mamm 26:111-126
Gannier A, West KL (2005) Distribution of the rough-toothed dolphin (Steno
bredanensis) around the Windward Islands (French Polynesia). Pac Sci 59:17-
24
Gannon DP, Waples DM (2004) Diets of coastal bottlenose dolphins from the US
mid-Atlantic coast differ by habitat. Mar Mamm Sci 20:527-545
García-Martínez J, Moya A, Raga JA, Latorre A (1999) Genetic differentiation of the
striped dolphin Stenella coeruleoalba from European waters according to
mitochondrial DNA (mtDNA) restriction analysis. Mol Ecol 8:1069-1073
Garza JC, Williamson EG (2001) Detection of reduction in population size using data
from microsatellite loci. Mol Ecol 10:305-318
Geraci JR, Anderson DM, Timperi RJ, Early GA, Prescott JH, Mayo CA (1989)
Humpback whales (Megaptera novaeangliae) fatally poisoned by
dinoflagellate toxin. Can J Fish Aquat Sci 46:1895-1898
Geraci JR, Lounsbury VJ (1993) Marine mammals ashore: a field guide for
strandings, Vol. Texas A&M Sea Grant Publication
Gilson A, Syvanen M, Levine K, Banks J (1998) Deer gender determination by
polymerase chain reaction: validation study and application to tissues,
bloodstains, and hair forensic samples from California. Calif Fish Game
84:159-169
Goldstein DB, Schlötterer C (1999) Microsatellites: Evolution and applications, Vol.
Oxford University Press, Oxford
Goudet J (2001) FSTAT, a program to estimate and test gene diversities and fixation
indices (version 2.9.3). Available from
http://www.unil.ch/izea/softwares/fstat.html.
Goudet J, Perrin N, Waser P (2002) Tests for sex-biased dispersal using bi-parentally
inherited genetic markers. Mol Ecol 11:1103-1114
Graves JE (1996) Conservation genetics of fishes in the pelagic realm. In: Avise JC,
Hamrick JL (eds) Conserv Genet. Chapman & Hall, London, UK, p 335-366
Greenwood PJ (1980) Mating systems, philopatry and dispersal in birds and
mammals. Anim Behav 28:1140-1162

199
Griffin AS, Pemberton JM, Brotherton PNM, McIlrath G, Gaynor D, Kansky R, O’Riain
J, Clutton-Brock TH (2003) A genetic analysis of breeding success in the
cooperative meerkat (Suricata suricatta). Behav Ecol 14:472-480
Griffin AS, West SA (2002) Kin selection: fact and fiction. Trends Ecol Evol 17:15-21
Guo SW, Thompson EA (1992) Performing the exact test of Hardy-Weinberg
proportion for multiple alleles. Biometrics 48:361-372
Haenel NJ (1986) General notes on the behavioral ontogeny of Puget Sound killer
whales and the occurence of allomaternal behavior. In: Kirkevold B, Lockard
JS (eds) Behavioral biology of killer whales, New York: Alan R. Liss
Hamilton WD (1964a) The genetical evolution of social behaviour, I. J Theor Biol 7:1-
16
Hamilton WD (1964b) The genetical evolution of social behaviour, II. J Theor Biol
7:17-52
Hansen MM, Nielsen EE, Mensberg K-LD (1997) The problem of sampling families
rather than populations: relatedness among individuals in samples of juvenile
brown trout Salmo trutta L. Mol Ecol 6:469-474
Hanski I (2004) Metapopulation theory, its use and misuse. Basic and Applied
Ecology 5:225-229
Hare MP, Cipriano F, Palumbi SR (2002) Genetic evidence on the demography of
speciation in allopatric dolphin species. Evolution 56:804-816
Harlin-Cognato AD, Honeycutt RL (2006) Multi-locus phylogeny of dolphins in the
subfamily Lissodelphininae: Character synergy improves phylogenetic
resolution. BMC Evol Biol 6:87
Harlin A, Würsig B, Baker CS, Markowitz TM (1999) Skin swabbing for genetic
analysis: application to dusky dolphins (Lagenorhynchus obscurus). Mar
Mamm Sci 15:409-425
Harrison S (1991) Local extinction in a metapopulation context: an empirical
evaluation. Biol J Linn Soc 42:73-88
Hastie GD, Wilson B, Wilson LJ, Parsons KM, Thompson PM (2004) Functional
mechanisms underlying cetacean distribution patterns: hotspots for bottlenose
dolphins are linked to foraging. Mar Biol 144:397-403

200
Hayano A, Amano M, Miyazaki N (2003) Phylogeography and population structure of
the Dall's porpoise, Phocoenoides dalli, in Japanese waters revealed by
mitochondrial DNA. Genes Genet Syst 78:81-91
Hayano A, Yoshioka M, Tanaka M, Amano M (2004) Population differentiation in the
Pacific white-sided dolphin Lagenorhynchus obliquidens inferred from
mitochondrial DNA and microsatellite analyses. Zool Sci 21:989-999
Healy SD, Rowe C (2007) A critic of comparative studies of brain size. Proc R Soc
Lond B 274:453-464
Hedrick PW (1999) Perspective: highly variable loci and their interpretation in
evolution and conservation. Evolution 53:313-318
Hedrick PW, Gilpin ME (1997) Genetic effective size of a metapopulation. In: Hanski
I, Gilpin ME (eds) Metapopulation biology: ecology, genetics and evolution.
Academic Press, San Diego, p 165-181
Heimlich-Boran JR (1993) Social organization of the short-finned pilot whale,
Globicephala macrorhynchus, with special reference to the comparative social
ecology of delphinids. PhD thesis, Cambridge University
Hellberg ME (1994) Relationships between inferred levels of gene flow and
geographic distance in a philopatric coral. Balanophyllia elegans. Evolution
48:1829-1854
Hillis DM, Bull JJ (1993) An empirical test of bootstrapping as a method for assessing
confidence in phylogenetic analysis. Syst Biol 42:182-192
Hinde RA (1976) Interactions, relationships and social structure. Man 11:1-17
Hoelzel AR (1994) Genetics and ecology of whales and dolphins. Annu Rev Ecol
Syst 25:377-399
Hoelzel AR (1998) Genetic structure of cetacean populations in sympatry, parapatry,
and mixed assemblages: implications for conservation policy. J Hered 89:451-
458
Hoelzel AR, Dahlheim M, Stern SJ (1998a) Low genetic variation among killer whales
(Orcinus orca) in the eastern North Pacific, and genetic differentiation between
foraging specialists. J Hered 89:121-128
Hoelzel AR, Dover GA (1991) Genetic differentiation between sympatric killer whale
populations. Heredity 66:191-196

201
Hoelzel AR, Goldsworthy SD, Fleischer RC (2002a) Population genetics. In: Hoelzel
AR (ed) Marine Mammal Biology: An Evolutionary Approach. Blackwell
Science, Oxford
Hoelzel AR, Hancock JM, Dover GA (1991) Evolution of the cetacean mitochondrial
d-loop region. Mol Biol Evol 8:475-493
Hoelzel AR, Natoli A, Dalhheim ME, Olavarría C, Baird RW, Black NA (2002b) Low
worldwide genetic diversity in the killer whale (Orcinus orca): implications for
demographic history. Proc R Soc Lond B 269:1467-1473
Hoelzel AR, Potter CW, Best PB (1998b) Genetic differentiation between parapatric
'nearshore' and 'offshore' populations of the bottlenose dolphin. Proc R Soc
Lond B 265:1177-1183
Hudson RR (1990) Gene genealogies and the coalescent process. In: Futuyama F,
Antonovics JD (eds) Oxford Surveys in Evolutionary Biology. Oxford University
Press, New York, p 1-44
Huelsenbeck JP, Ronquist F (2001) MrBayes: Bayesian inference of phylogenetic
trees. Bioinformatics 17:754-755
Jefferson TA (2002) Rough-toothed dolphin. In: Perrin WF, Würsig B, Thewissen
JGM (eds) Encyclopedia of marine mammals. Academy Press, San Diego,
CA, p 1055-1059
Jepson PD, Arbelo M, Deaville R, Patterson IAP, Castro P, Baker JR, Degollada E,
Ross HM, P.Herráez, Pocknell AM, Rodríguez F, Howie FE, Espinosa A, Reid
RJ, Jaber JR, Martin V, Cunningham AA, Fernández A (2003) Gas-bubble
lesions in stranded cetaceans. Nature 425:575-576
Kage T (1999) Study on population structure analysis of short-finned pilot whale
using multiple DNA markers. PhD thesis, Mie University
Kalinowski ST, Taper ML (2006) Maximum likelihood estimation of the frequency of
null alleles at microsatellite loci. Conserv Genet 7:991-995
Kalinowski ST, Wagner AP, Taper ML (2006) ML-RELATE: a computer program for
maximum likelihood estimation of relatedness and relationship. Mol Ecol Notes
6:576-579
Kappeler PM, van Schaik CP (2002) Evolution of primates social systems. Int J
Primatol 23:707-740
202
Karczmarski L, Würsig B, Gailey G, Larson KW, Vanderlip C (2005) Spinner dolphins
in a remote Hawaiian atoll: social grouping and population structure. Behav
Ecol 16:675-685
Kasuya T (1975) Past occurence of Globicephala melanea in the western North
Pacific. Sci Rep Whales Res Inst 27:95-110
Kasuya T (1986) Comparison of life history parameters between two stocks of short-
finned pilot whales off the Pacific coast of Japan. Report No. IWC/SC38/SM10
Kasuya T (2007) Japanese whaling and other cetacean fisheries. Environ Sci Pollut
Res Int 14:39-48
Kasuya T, Miyashita T, Kasamatsu F (1988) Segregation of two forms of short-finned
pilot whales off the Pacific coast of Japan. Sci Rep Whales Res Inst 39:77-90
Klinowska M (1986) Cetacean live stranding dates related to geomagnetic
disturbances. Aquat Mamm 11:109-119
Kritzler H (1952) Observations on the pilot whale in captivity. Journal of Mammalogy
33:321-334
Krützen M, Barré LM, Connor RC, Mann J, Sherwin WB (2004a) ‘O father: where art
thou?’ - Paternity assessment in an open fission–fusion society of wild
bottlenose dolphins (Tursiops sp.) in Shark Bay, Western Australia. Mol Ecol
13:1975-1990
Krützen M, Barré LM, Möller LM, Heithaus MR, Simmer C, Sherwin WB (2002) A
biopsy system for small cetaceans: darting success and wound healing in
Tursiops spp. Mar Mamm Sci 18:863-878
Krützen M, Mann J, Heithaus MR, Connor RC, Bejder L, Sherwin WB (2005) Cultural
transmission of tool use in bottlenose dolphins. Proc Natl Acad Sci USA
102:8939-8943
Krützen M, Sherwin WB, Berggren P, Gales N (2004b) Population structure in an
inshore cetacean revealed by microsatellite and mtDNA analysis: bottlenose
dolphins (Tursiops sp.) in Shark Bay, Western Australia. Mar Mamm Sci
20:28-47
Krützen M, Sherwin WB, Connor RC, Barré LM, Casteele TVd, Mann J, Brooks R
(2003) Contrasting relatedness patterns in bottlenose dolphins (Tursiops sp.)
with different alliance strategies. Proc R Soc Lond B 270:497-502

203
Krützen M, Valsecchi E, Connor RC, Sherwin WB (2001) Characterization of
microsatellite loci in Tursiops aduncus. Mol Ecol Notes 1:170-172
Kuczaj SA, Yeiter DB (2007) Observations of rough-toothed dolphins (Steno
bredanensis) off the coast of Utila, Honduras. J Mar Biol Assoc UK 87:141-148
Kuhner MK (2006) LAMARC 2.0: maximum likelihood and bayesian estimation of
population parameters. Bioinformatics 22:768-770
Kumar S, Tamura K, Nei M (2004) MEGA3: Integrated software for Molecular
Evolutionary Genetics Analysis and sequence alignment. Briefings in
Bioinformatics 5:150-163
Lambertsen RH (1987) A biopsy system for large whales and its uses for
cytogenetics. Journal of Mammalogy 68:443-445
Lammers MO (2004) Occurrence and behavior of hawaiian spinner dolphins
(Stenella longirostris) along Oahu’s leeward and south shores. Aquat Mamm
30:237-250
Lande R (1988) Genetics and demography in biological conservation. Science
241:1455-1460
Lande R, Barrowclough GF (1987) Effective population size, genetic variation, and
their use in population management. In: Soulé ME (ed) Viable Populations for
Conservation. Cambridge University Press, Cambridge, p 87-123
Lavery S, Moritz C, Fielder DR (1996) Genetic patterns suggest exponential
population growth in a declining species. Mol Biol Evol 13:1106-1113
LeDuc RG (2002) Delphinids, Overview. In: Perrin WF, Würsig B, Thewissen JGM
(eds) Encyclopedia of marine mammals. Academy Press, San Diego, CA, p
311-314
LeDuc RG, Perrin WF, Dizon AE (1999) Phylogenetic relationships among the
delphinid cetaceans based on full cytochrome b sequences. Mar Mamm Sci
15:619-648
Lefebvre L, Marino L, Sol D, Lemieux-Lefebvre S, Arshad S, Baird RW (2006) Large
brains and lengthened life history periods in odontocetes. Brain Behav Evol
68:218-228
Levins R (1969) Evolution in changing environments: some theoretical explorations,
Vol. Princeton University Press, Princeton, NJ

204
Lockley RM, Russell R (1953) Bird-ringing : the art of bird study by individual
marking, Vol. C. Lockwood, London
Luikart GH, Allendorf FW, Cornuet J-M, Sherwin WB (1998) Distortion of allele
frequency distributions provides a test for recent population bottlenecks. J
Hered 89:238-247
Lusseau D, Schneider K, Boisseau OJ, Haase P, Slooten E, Dawson SM (2003) The
bottlenose dolphin community of Doubtful Sound features a large proportion of
long-lasting associations. Can geographic isolation explain this unique trait?
Behav Ecol Sociobiol 54:396-405
Lynch M, Ritland K (1999) Estimation of pairwise relatedness with molecular
markers. Genetics 152:1753-1766
Lyrholm T, Leimar O, Gyllensten U (1996) Low diversity and biased substitution
patterns in the mitochondrial DNA control region of sperm whales: implications
for estimates of time since common ancestry. Mol Biol Evol 13:1318-1326
Maddison DR, Maddison WP (2000) MacClade 4: Analysis of phylogeny and
character evolution. Sinauer Associates, Sunderland, Massachusetts
Maigret J (1995) Steno Bredanensis - Rauhzahndelphin. In: Neithammer J, Krapp F
(eds) Handbuch der Säugetiere Europas Band 6: Meeressäuger Teil 1A: Wale
and Delphine, Aula-Verlag, Weisbaden, Germany, p 269-280
Mann J (2000) Unraveling the dynamics of social life. In: Mann J, Connor RC, Tyack
PL, Whitehead H (eds) Cetacean societies: field studies of dolphins and
whales. The University of Chicago Press
Mann J, Connor RC, Tyack PL, Whitehead H (eds) (2000) Cetacean societies: field
studies of dolphins and whales, Vol. University of Chicago Press, Chicago
Mantel N (1967) The detection of disease clustering and a generalized regression
approach. Cancer Research 27:209-220
Marino L (2002) Convergence of complex cognitive abilities in cetaceans and
primates. Brain Behav Evol 59:21-32
Marshall TC, Slate J, Kruuk LEB, Pemberton JM (1998) Statistical confidence for
likelihood-based paternity inference in natural populations. Mol Ecol 7:639-655
Marten K, Psarakos S (1999) Long-term site fidelity and possible long-term
associations of wild spinner dolphins (Stenella longirostris) seen off Oahu,
Hawaii. Mar Mamm Sci 15:1329-1336

205
Martin AR, Rothery P (1993) Reproductive parameters of female long-finned pilot
whales (Globicephala melas) around the Faroe Islands. Rep Int Whal Comm
Special issue 14
Mate BR, Lagerquist BA, Winsor M, Geraci JR, Prescott JH (2005) Movements and
dive habits of a satellite-monitored long-finned pilot whale (Globicephala
melas) in the Northwest Atlantic. Mar Mamm Sci 21:136-144
May-Collado L, Agnarsson I (2006) Cytochrome b and Bayesian inference of whale
phylogeny. Mol Phylogen Evol 38:344-354
Mayr I, Ritter F (2005) Photo-identification of rough-toothed dolphins (Steno
bredanensis) off La Gomera (Canary Islands) with new insights into social
organisation. 19th Annual Conference of the European Cetacean Society, La
Rochelle, 2–7 April 2005
Mead JG, Potter CW (1995) Recognizing two populations of the bottlenose dolphin
(Tursiops truncatus) off the Atlantic coast of North America: Morphologic and
ecologic considerations. IBI Report 5:31-44
Mesnick SL (2001) Genetic relatedness in sperm whales: evidence and cultural
implications. Behavioral and brain sciences 24:346-347
Mesnick SL, Taylor BL, LeDuc RG, Escorza-Trevino S, O'Corry-Crowe GM, Dizon
AE (1999) Culture and genetic evolution in whales. Science 284:2055
Milinkovitch MC (1997) The phylogeny of whales: a molecular approach. In: Dizon
AE, Chivers SJ, Perrin WF (eds) Molecular genetics of marine mammals,
Lawrence, KC, p 317-338
Miller CR, Joyce P, Waits LP (2005) A new method for estimating the size of small
populations from genetic mark-recapture data. Mol Ecol 14:1991-2005
Milligan BG (2003) Maximum-likelihood estimation of relatedness. Genetics
163:1153-1167
Miyazaki N, Perrin WF (1994) Rough-toothed dolphin Steno bredanensis (Lesson,
1928). In: Ridgway SH, Harrison R (eds) Handbook of Marine Mammals, Vol
5. Academic Press, San Diego, CA, p 1-21
Möller LM, Beheregaray LB (2004) Genetic evidence for sex-biased dispersal in
resident bottlenose dolphins (Tursiops aduncus). Mol Ecol 13:1607-1612
206
Möller LM, Beheregaray LB, Allen SJ, Harcourt RG (2006) Association patterns and
kinship in female Indo-Pacific bottlenose dolphins (Tursiops aduncus) of
southeastern Australia. Behav Ecol Sociobiol 61:109-117
Möller LM, Beheregaray LB, Harcourt RG, Krützen M (2001) Alliance membership
and kinship in wild male bottlenose dolphins (Tursiops aduncus) of
southeastern Australia. Proc R Soc Lond B 268:1941-1947
Monteiro NC, Alves JTT, Avila FJC, Campos AA, Costa AF, Silva CPN, Furtado
NMAA (2000) Impact of fisheries on the tucuxi (Sotalia fluviatilis) and rough-
toothed dolphin (Steno bredanensis) populations off Ceara state, northeastern
Brazil. Aquat Mamm 26:49-56
Mourão F (2006) Patterns of association among bottlenose dolphins in the Bay of
Islands, New Zealand. MSc thesis, University of Auckland
Myers JP (1983) Space, time and the pattern of individual associations in a group-
living species: sanderlings have no friends. Behav Ecol Sociobiol 12:129-134
Natoli A, Birkun A, Aguilar A, Lopez A, Hoelzel AR (2005) Habitat structure and the
dispersal of male and female bottlenose dolphins (Tursiops truncatus). Proc R
Soc Lond B 272:1217-1226
Natoli A, Cañadas A, Peddemors VM, Aguilar A, Vaquero C, Fernández-Piqueras P,
Hoelzel AR (2006) Phylogeography and alpha taxonomy of the common
dolphin (Delphinus sp.). J Evol Biol 19:943-954
Natoli A, Peddemors VM, Hoelzel R (2004) Population structure and speciation in the
genus Tursiops based on microsatellite and mitochondrial DNA analyses. J
Evol Biol 17:363-375
Nei M (1987) Molecular evolutionary genetics, Vol. Columbia University Press, New
York
Nei M, Kumar S (2000) Molecular evolution and phylogenetics, Vol. Oxford University
Press
Nekoba-Dutertre N, Poole MM, Bilgre B (1999) Rough-tooth dolphins (Steno
bredanensis) in French Polynesia. 13th Biennial Conference on the Biology of
Marine Mammals, Maui, Hawaii, 28 Nov-3 Dec, 1999
Norris KS (1967) Some observations on the migration and orientation of marine
mammals. In: Storm RM (ed) Animal orientation and navigation. Oregon State
University Press, Corvallis, p 101-125
207
Norris KS, Schilt CR (1988) Cooperative societies in three-dimensional space: on the
origins of aggregations, flocks, and schools, with special reference to dolphins
and fish. Etho Sociobiol 9:149-179
Norris KS, Würsig B, Wells RS, Würsig M (1994) The Hawaiian spinner dolphin, Vol.
University of California Press, Berkeley
Odell DK, Asper ED, Baucom J, Cornell LH (1980) A recurrent mass stranding of the
false killer whale, Pseudorca crassidens, in Florida. Fish Bull 78:171-177
Olavarría C, Oremus M, de Tezanos Pinto G, Baker CS (2003) Genetic analysis of
cetacean skin samples collected in Samoa. Report No. Report for the Ministry
of Natural Resources and Environment, Samoa
Olson PA, Reilly SB (2002) Pilot whales. In: Perrin WF, Würsig B, Thewissen JGM
(eds) Encyclopedia of marine mammals. Academy Press, San Diego, CA, p
898-903
Oremus M, Kettles H, Schroeder C, Gales R, Steel D, Baker CS (2005) "O mother,
where art thou?": genetic investigation into mass strandings of long-finned
pilot whales Conference of the biology of marine mammals, San Diedo, US
Oremus M, Poole MM, Steel D, Baker CS (2007) Isolation and interchange among
insular spinner dolphin communities in the South Pacific revealed by individual
identification and genetic diversity. Mar Ecol Prog Ser 336:275-289
Ottensmeyer CA (2001) Social structure of long-finned pilot whales from photo-
identification techniques. MSc, Dalhousie University
Ottensmeyer CA, Whitehead H (2003) Behavioural evidence for social units in long-
finned pilot whales. Can J Zool/Rev Can Zool 81:1327-1338
Packer C, Gilbert DA, Pusey AE, O'Brien SJ (1991) A molecular genetic analysis of
kinship and cooperation in African Lions. Nature 351:562-565
Paetkau D, Strobeck C (1994) Microsatellite analysis of genetic variation in black
bear populations. Mol Ecol 3:489-495
Palsbøll PJ, Bérubé M, Larsen AH, Jørgensen H (1997) Primers for the amplification
of tri- and tetramer microsatellite loci in baleen whales. Mol Ecol 6:893-895
Palumbi SR (1994) Reproductive isolation, genetic divergence, and speciation in the
sea. Annu Rev Ecol Syst 25:547-572

208
Palumbi SR, Grabowski G, Duda T, Geyer L, Tachino N (1997) Speciation and
population genetic structure in tropical Pacific sea urchins. Evolution 51:1506-
1517
Parra GJ, Corkeron PJ, Marsh H (2006) Population sizes, site fidelity and residence
patterns of Australian snubfin and Indo-Pacific humpback dolphins:
Implications for conservation. Biol Conserv 129:167-180
Parsons KM, Dallas JF, Claridge DE, Durban JW, Balcomb KC, Thompson PM,
Noble LR (1999) Amplifying dolphin mitochondrial DNA from faecal plumes.
Mol Ecol 8:1766–1768
Parsons KM, Durban JW, Claridge DE, Balcomb KC, Noble LR, Thompson PM
(2003) Kinship as a basis for alliance formation between male bottlenose
dolphins, Tursiops truncatus, in the Bahamas. Anim Behav 66:185-194
Parsons KM, Noble LR, Reid RJ, Thompson PM (2002) Mitochondrial genetic
diversity and population structuring of UK bottlenose dolphins (Tursiops
truncatus): is the NE Scotland population demographically and geographically
isolated? Biol Conserv 108:175-182
Peakall R, Smouse PE (2005) GenAlEx 6: Genetic Analysis in Excel. Population
genetic software for teaching and research. Australian National University,
Canberra, Australia.
Peakall R, Smouse PE, Huff DR (1995) Evolutionary implications of allozyme and
RAPD variation in diploid populations of dioecious buffalograss Buchloë
dactyloides. Mol Ecol 4:135-147
Perrin WF (1990) Subspecies of Stenella longirostris (Mammalia: Cetacea:
Delphinidae). Proc Biol Soc Wash 103:453-463
Perrin WF, Dolar LL, Robineau D (1999) Spinner dolphins (Stenella longirostris) of
the Western Pacific and Southeast Asia: Pelagic and shallow-water forms. Mar
Mamm Sci 15:1029-1053
Perrin WF, Geraci JR (2002) Stranding. In: Perrin WF, Würsig B, Thewissen JGM
(eds) Encyclopedia of marine mammals. Academy Press, San Diego, CA, p
1192-1197
Perrin WF, Gilpatrick JWJ (1994) Spinner dolphin Stenella longirstris (Gray, 1828).
In: Ridgway SH, Harrison R (eds) Handbook of Marine Mammals, Vol 5.
Academic Press, London, p 99-128

209
Perrin WF, Henderson JR (1984) Growth and reproductive rates in two populations of
spinner dolphins, Stenella longirostris, with different histories of exploitation.
Report No. Special Issue 6, Cambridge, England
Perrin WF, Mesnick SL (2003) Sexual ecology of the spinner dolphin, Stenella
longirostris: geographic variation in mating system. Mar Mamm Sci 19:462-483
Perrin WF, Mitchell ED, van Bree PJH (1978) Historical zoogeography of the tropical
pelagic dolphins. In: Obrtel R, Folk C, Pellantová J (eds) Congressus
Theriologicus Internationalis June 20-27, 1978 (Abstracts of papers) Brno,
Czechoslovakia, pp 73
Pichler FB, Baker CS (2000) Loss of genetic diversity in the endemic Hector's dolphin
due to fisheries-related mortality. Proc R Soc Lond B 267:97-102
Pichler FB, Dawson SM, Slooten E, Baker CS (1998) Geographic isolation of
Hector's dolphin populations described by mitochondrial DNA sequences.
Conserv Biol 12:676-682
Pichler FB, Robineau D, Goodall RNP, Meÿer MA, Olavarría C, Baker CS (2001)
Origin and radiation of Southern Hemisphere coastal dolphins (genus
Cephalorhynchus). Mol Ecol 10:2215-2223
Polisini JM (1980) A comparison of Globicephala macrorhyncha (Gray, 1846) with the
pilot whale of the North Pacific Ocean: an analysis of the skull of the broad-
rostrum pilot whales of the genus Globicephala. PhD thesis, University of
Southern California
Poole MM (1995) Aspects of the behavioral ecology of spinner dolphins (Stenella
longirostris) in the nearshore waters of Mo'orea, French Polynesia. PhD
thesis, University of California, Santa Cruz
Porter JW (1977) Pseudorca stranding. Oceans 10:8-16
Posada D, Crandall KA (1998) MODELTEST: testing the model of DNA substitution.
Bioinformatics 14:817-818
Posada D, Crandall KA, Templeton AR (2000) GEODIS: a program for the cladistic
nested analysis of the geographical distribution of genetic haplotypes. Mol
Ecol 9:487-488
Pryor K, Norris KS (1991) Dolphin Societies: Discoveries and Puzzles, Vol. University
of California press, Berkeley and Los Angeles

210
Queller DC, Goodnight KF (1989) Estimating relatedness using genetic markers.
Evolution 43:258-275
Rand DM (1996) Neutrality tests of molecular markers and the connection between
DNA polymorphism, demography and conservation biology. Conserv Biol
10:665-671
Rand DM, Kann LM (1996) Excess amino acid polymorphism in mitochondrial DNA:
contrasts among genes from Drosophila, mice, and humans. Mol Biol Evol
13:735-748
Raymond M, Rousset F (1995) GENEPOP (version 1.2): population genetics
software for exact test and ecumenicism. J Hered 86:248-249
Rayner GW (1939) Globicephala leucosagmaphora, a new species of the genus
Globicephala. Annals of the magazine of natural history 11:543-544
Reeves RR, Leatherwood S, Stone GS, Eldredge LG (1999) Marine mammals in the
area served by the South Pacific Environment Programme (SPREP), South
Pacific Environmental Programme: Apia, Samoa
Reeves RR, Perrin WF, Taylor BL, Baker CS, Mesnick SL (2004) Report of the
workshop on shortcomings of cetacean taxonomy in relation to needs of
conservation and management, April 30 - May 2, 2004 La Jolla, California.
Report No. NOAA-TM-NMFS-SWFSC-363
Rice DW (1998) Marine mammals of the world systematics and distribution, Vol.
Allen Press, Inc., Lawrence, KS.
Rice WR (1989) Analyzing tables of statistical tests. Evolution 43:223-225
Richards AF (1996) Life history and behavior of female dolphins (Tursiops sp.) in
Shark Bay, Western Australia. PhD thesis, The University of Michigan, Ann
Arbor, MI
Richards KR, Dillon MC, Whitehead H, Wright JM (1996) Patterns of kinship in
groups of free-living sperm whales (Physeter macrocephalus) revealed by
multiple molecular genetic analyses. Proc Natl Acad Sci USA 93:8792-8795
Ritter F (2002) Behavioural observations of rough-toothed dolphins (Steno
bredanensis) off La Gomera (Canary Islands), with a special reference to their
interactions with humans. Aquat Mamm 28:46-59
Robson FD (1984) Strandings: ways to save whales, Vol. The Science Press (PTY)
LTD

211
Rogan E, Baker JR, Jepson PD, Berrow S, Kiely O (1997) A mass stranding of white-
sided dolphins (Lagenorhynchus acutus) in Ireland: biological and pathological
studies. J Zool (Ser A 242:217-227
Rokas A, Laboukakis E, Zouros E (2003) Animal mitochondrial DNA recombination
revisited. Trends Ecol Evol 18:411-417
Ronquist F, Huelsenbeck JP (2003) MrBayes 3: Bayesian phylogenetic inference
under mixed models. Bioinformatics 19:1572-1574
Rosel PE, Dizon AE, Heyning JE (1994) Genetic analysis of the sympatric
morphotypes of common dolphins (genus Delphinus). Mar Biol 119:159-167
Rosel PE, France SC, Wang JY, Kocher TD (1999) Genetic structure of harbour
porpoise Phocoena phocoena populations in the northwest Atlantic based on
mitochondrial and nuclear markers. Mol Ecol 8:S41–S54
Rossbach KA, Herzing DL (1998) Inshore and offshore bottlenose dolphin (Tursiops
truncatus) communities distinguished by association patterns near Grand
Bahama Island, Bahamas. Can J Zool/Rev Can Zool 77:581-592
Russello MA, Amato G (2004) Ex situ population management in the absence of
pedigree information. Mol Ecol 13:2829-2840
Sambrook J, Fritsch EF, Maniatis T (1989) Molecular cloning: A laboratory manual,
Vol. Cold Spring Harbor Laboratory Press, New York
Schlötterer C, Tautz D (1992) Slippage synthesis of simple sequence DNA. Nucleic
Acids Res 7:211-215
Schröder C, Castle P (1998) Life-history parameters and polychlorinated biphenyls
(PCBs) in long-finned pilot whales (Globicephala melas) from New Zealand
strandings. Report No. A report to WWF-New-Zealand, June 1998
Scott MD, Wells RS, Irvine AB (1990) A long-term study of bottlenose dolphins on the
West Coast of Florida. In: Leatherwood S, Reeves RR (eds) The Bottlenose
dolphin. Academic Press, San Diego, CA, p 235-244
Sellas AB, Wells RS, Rosel PE (2005) Mitochondrial and nuclear DNA analyses
reveal fine scale geographic structure in bottlenose dolphins (Tursiops
truncatus) in the Gulf of Mexico. Conserv Genet 6:715-728
Sergeant DE (1962) The biology of the pilot or pothead whale Globicephala melaena
(Traill) in Newfoundland waters. Bulletin of Fisheries Research Board of
Canada 132:1-84

212
Shane S, Wells RS, Würsig B (1986) Ecology, behavior and social organization of the
bottlenose dolphin: a review. Mar Mamm Sci 2:34-63
Shimodaira H, Hasegawa M (1999) Multiple comparisons of log-likelihoods with
applications to phylogenetic inference. Mol Biol Evol 16:1114-1116
Siemann LA (1994) Mitochondrial DNA sequence variation in North Atlantic long-
finned pilot whales, Globicephala melas. PhD thesis, Massachusetts Institute
of Technology, Cambridge
Sigurjónsson J, Víkingsson G, Lockyer C (1993) On two mass strandings of pilot
whales Globicephala melas on the west and southwest coast of Iceland. Rep
Int Whal Comm Special issue 14:407-423
Silva-Jr JM, Silva FJL, Sazima I (2005) Rest, nurture, sex, release, and play: diurnal
underwater behaviour of the spinner dolphin at Fernando de Noronha
Archipelago, SW Atlantic. J Ichthyol Aqua Bio 9:161-176
Smolker R, Richards AF (1992) Sex differences in patterns of association among
Indian Ocean bottlenose dolphins. Behaviour 123:39-69
Smolker RA, Richards AF, Connor RC, Pepper JW (1992) Sex-differences in patterns
of association among Indian Ocean bottle-nosed dolphins. Behaviour 123:38-
69
Smouse PE, Peakall R (1999) Spatial autocorrelation analysis of individual multiallele
and multilocus genetic structure. Heredity 82:561-573
Smuts BB, Cheney DL, Seyfarth RL, Wrangham R, Struhsaker TT (1987) Primate
societies, Vol. University of Chicago Press, Chicago
SPWRC (2004) Report of the annual meeting of the South Pacific Whale Research
Consortium: 2-6 April 2004, Byron Bay, NSW, Australia. Report No. Report to
the scientific committee of the International Whaling Commission. SC/55/SH7
Stevens TA, Duffield DA, Asper ED, Hewlett KG, Bolz A, Gage LJ, Bossart GD
(1989) Preliminary findings of restriction fragment differences in mitochondrial
DNA among killer whales (Orcinus orca). Can J Zool/Rev Can Zool 67:2592-
2595
Storz JF (1999) Genetic consequences of mammalian social structure. Journal of
Mammalogy 80:553-569

213
Storz JF, Ramakrishnan U, Alberts SC (2002) Genetic effective size of a wild primate
population: influence of current and historical demography. Evolution 56:817-
829
Struhsaker TT (1969) Correlates of ecology and social organization among African
cercopithecines. Folia Primatol 11:80-118
Sugg DW, Chesser RK, Dobson FS, Hoogland. JL (1996) Population genetics meets
behavioral ecology. Trends Ecol Evol 11:338–342
Sundaram B, Poje AC, Veit RR, Nganguia H (2006) Acoustical dead zone and the
spatial aggregation of whale strandings. J Theor Biol 238:764-770
Swofford DL (2000) PAUP*: Phylogenetic Analysis Using Parsimony (*and Other
Methods). Sinauer Associates, Sunderland, MA
Taberlet P, Luikart G (1999) Non-invasive genetic sampling and individual
identification. Biol J Linn Soc 68:41-55
Tajima F (1989a) The effect of change in population size on DNA polymorphism.
Genetics 123:597-601
Tajima F (1989b) Statistical method for testing the neutral mutation hypothesis by
DNA polymorphism. Genetics 123:585-595
Tayler CK, Saayman GS (1972) The social organisation and behaviour of dolphins
(Tursiops aduncus) and baboons (Papio ursinus): some comparisons and
assessments. Ann Cape Prov Mus Nat Hist 9:11-49
Taylor BL, Dizon AE (1999) First policy then science: why a management unit based
solely on genetic criteria cannot work. Mol Ecol 8:S11-S16
Templeton AR (1998) Nested clade analyses of phylogeographic data: testing
hypotheses about gene flow and population history. Mol Ecol 7:381-397
Templeton AR, Routman E, Phillips CA (1995) Separating population structure from
population history: A cladistic analysis of the geographical distribution of
mitochondrial DNA haplotypes in the tiger salamander, Ambystoma tigrinurn.
Genetics 140:767-782
Templeton AR, Sing CF (1993) A cladistic analysis of phenotypic associations with
haplotypes inferred from restriction endonuclease mapping. IV. Nested
analysis with cladogram uncertainty and recombination. Genetics 134:659-669
Tiedemann R, Milinkovitch MC (1999) Culture and genetic evolution in whale.
Science 284:2055a
214
Valsecchi E, Amos W (1996) Microsatellite markers for the study of cetacean
populations. Mol Ecol 5:151-156
van Bree PJH (1971) On Globicephala seiboldi Gray, 1846, and other species of pilot
whales (Notes on Cetacea, Delphinioidae III). Beaufortia 19:79-87
Van de Casteele T, Galbusera P, Mattyesen E (2001) A comparison of microsatellite-
based pairwise relatedness estimators. Mol Ecol 10:1539-1549
van Schaik CP (1983) Why are diurnal primates living in groups? Behaviour 87:120-
144
Wada S (1988) Genetic differentiation between two forms of short-finned pilot whales
off the Pacific coast of Japan. Sci Rep Whales Res Inst 39:91-101
Wade PR, Gerrodette T (1993) Estimates of cetacean abundance and distribution in
the eastern tropical Pacific. Rep Int Whal Comm 43:477-493
Wang J (2002) An estimator for pairwise relatedness using molecular markers.
Genetics 160:1203-1215
Waples RS (2002) Definition and estimation of effective population size in the
conservation of endangered species. In: Beissinger SR, McCullough DR (eds)
Population Viability Analysis. The University of Chicago Press, Chicago
Waples RS, Gaggiotti OE (2006) What is a population? An empirical evaluation of
some genetic methods for identifying the number of gene pools and their
degree of connectivity. Mol Ecol 15:1419–1439
Waring GT, Josephson E, Fairfield CP, Maze-Foley K (2006) U.S. Atlantic and Gulf of
Mexico marine mammals stock assessments -- 2005. Report No. NOAA
technical memorandum NMFS-NE-194
Webster DL, Baird RW, McSweeney DJ, Ligon AD, Schorr GS (2005) High site-
fidelity of a deep-water dolphin: rough-toothed dolphins in the Hawaiian
Archipelago 16th Biennial Conference on the Biology of Marine Mammals, San
Diego
Weilgart L, Whitehead H, Payne K (1996) A colossal convergence. Am Sci 84:278-
287
Weller DW, Cockcroft VG, Würsig B, Lynn SK, Fertl D (1997) Behavioral responses
of bottlenose dolphins to remote biopsy sampling and observations of surgical
biopsy wound healing. Aquat Mamm 23:49-58

215
Wells RS (1986) Structural aspects of dolphins societies. PhD thesis, University of
California
Wells RS (2003) Dolphin social complexity: lessons from long-term study and life
history. In: de Waal FBM, Tyack PL (eds) Animal social complexity:
intelligence, culture, and individualized societies. Harvard University Press,
Cambridge
Wells RS, Scott MD, Irvine AB (1987) The social structure of free-ranging bottlenose
dolphins. In: Genoways H (ed) Current mammalogy. Plenum Press, New York
White BN (1986) The isthmian link, antitropicality and American biogeography:
distributional history of the Atherinopsinae (Pisces: Atherinidae). Syst Zool
35:176-194
White GC (1996a) NOREMARK: Population estimation from mark-resight surveys.
Wildl Soc Bull 24:50-52
White GC (1996b) Program NOREMARK software reference manual, Department of
Fisheries and Wildlife. Colorado State University, Fort Collins, Colorado, USA
Whitehead H (1996) Babysitting, dive synchrony, and indications of alloparental care
in sperm whales. Behav Ecol Sociobiol 38:237-244
Whitehead H (1997) Analysing animal social structure. Anim Behav 53:1053-1067
Whitehead H (1998) Cultural selection and genetic diversity in matrilineal whales.
Science 282:1708-1711
Whitehead H (2001) Analysis of animal movement using opportunistic individual
identifications: application to sperm whales. Ecology 82:1417-1432
Whitehead H (2005) Genetic diversity in matrilineal whales: models of cultural
hitchihiking and group-specific non-heritable demographic variation. Mar
Mamm Sci 21:58-79
Whitehead H, Christal J, Tyack PL (2000) Studying cetacean social structure in
space and time. In: Mann J, Connor RC, Tyack PL, Whitehead H (eds)
Cetacean Societies: Field Studies of Whales and Dolphins. University of
Chicago Press, Chicago, p 65-87
Whitehead H, Gordon J, Mathews EA, Richards KR (1990) Obtaining skin samples
from living sperm whales. Mar Mamm Sci 6:316-326

216
Whitehead H, Weilgart L (2000) The sperm whale: social females and roving males.
In: Mann J, Connor RC, Tyack PL (eds) Cetacean Societies: Field Studies of
Whales and Dolphins. University of Chicago Press, Chicago
Whitlock M, McCauley DE (1999) Indirect estimation of gene flow and migration: FST
= 1/ (4Nm + 1). Heredity 82:117-125
Wilkinson GS, Chapman AM (1991) Length and sequence variation in evening bat D-
loop mtDNA. Genetics 128:607-617
Williams GC (1966) Adaptation and natural selection, Vol. Princeton University Press,
Princeton, NJ
Wilson B (1995) The ecology of bottlenose dolphins in the Moray Firth, Scotland: a
population at the northern extreme of the species' range. PhD thesis,
University of Aberdeen, Scotland
Wilson B, Hammond PS, Thompson PM (1999) Estimating size and assessing trends
in a coastal bottlenose dolphin population. Ecol Appl 9:288-300
Wrangham R (1980) An ecological model of female-bonded primate groups.
Behaviour 75:262-292
Wrangham R (1982) Mutualism, kinship, and social evolution. In: Group KCS (ed)
Current problems in Sociobiology. Cambridge University Press, Cambridge
Wrangham R, Rubenstein DI (1986) Social evolution in birds and mammals. In:
Rubenstein DI, Wrangham R (eds) Ecological aspects of social evolution.
Princeton University Press, Princeton, NJ
Würsig B (1978) Occurrence and group organization of Atlantic bottlenose dolphin
porpoises (Tursiops truncatus) in an Argentine bay. Biological Bulletin
154:348-359
Würsig B (1989) Cetaceans. Science 244:1550-1557
Würsig B, Jefferson TA (1990) Methods of photo-identification for small cetaceans.
Rep Int Whal Comm Special Issue 12:43-52
Würsig B, Wells RS, Würsig M, Norris KS (1994) Population structure. In: Norris KS,
Würsig B, Wells RS, Würsig M (eds) The Hawaiian spinner dolphin. University
of California Press, Berkeley, p 122-140
Würsig B, Würsig M (1977) The photographic determination of group size,
composition and stability of coastal porpoises (Tursiops truncatus). Science
198:755-756
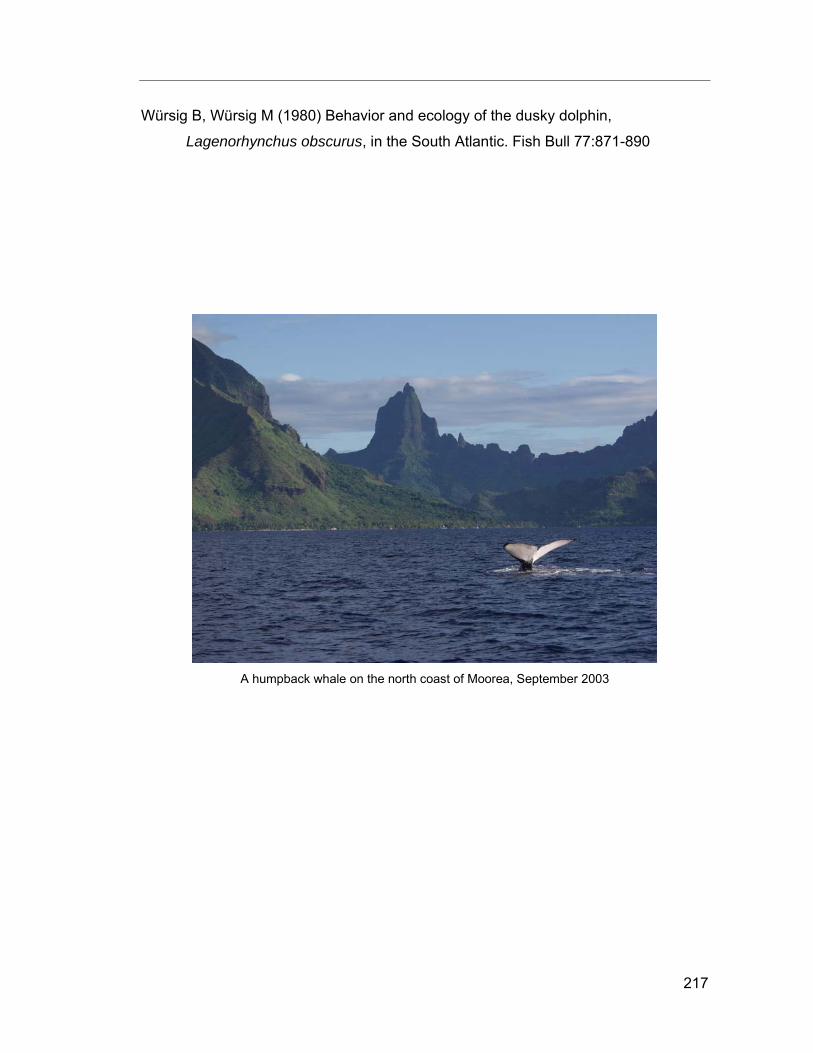
217
Würsig B, Würsig M (1980) Behavior and ecology of the dusky dolphin,
Lagenorhynchus obscurus, in the South Atlantic. Fish Bull 77:871-890
A humpback whale on the north coast of Moorea, September 2003
APPENDIX 6 – DATA CHAPTER 2 Chapter 2 Dlp Haplotypes >Haplotype Slo02FP01 ACACCACAGTACTATGTCAGTATTAAAAGTAATTTGTTTTAAAAACATTTTACCATACACATTACATACACATACACGTGTGCATGCTAATATTT-AGTCT-CTCCTTGTAAATATTCATATATACATGCTATGTATTATTGTGCATTCATTTATTTTCCATACGATAAGTTAAAGCTCGTATTAATTATCATTAATTTTACATATTACATAATATGCATACTCTTACATATTATATATCCCCTATCAATTTTATCTCCATTATATTCTATGGTCGCTCCATTAGATCACGAGCTTAATCACCATGCCGCGTGAAACCAGCAACCCGCTCGGCAGGGATCCCTCTTCTCGCACCGGGCCCATATCTCGTGGGGGTAGCTAAATAATGATCTTTATAAGACATCTGGTTCTTACTTCAGGACCATTTTAACTTAAAATCGCCCACTCGTTCCTCTTAAATAAGACATCTCGATGGATTCATGACTAATCAGCCCATGCCTAACATAACTGAGGTTTCATACATTTGGTATTTTTTAATTTTTGGGGGGGAGCTTGC >Haplotype Slo02FP02 ACACCACAGTACTATGTCAGTATTAAAAGTAATTTGTTTTAAAAACATTTTACTGTACACATTACATACACATACACGTGTGCATGCTAATATTT-AGTCTTCTCCTTGTAAATATTCATATATACATGCTATGTATTATTGTGCATTCATTTATTTTCCATACGATAAGTTAAAGCTCGTATTAATTATCATTAATTTTACATATTACATAATATGTATACTCTTACATATTATATATCCCCTATCAATTTTATTTCCATTATACCCTATGGTCGCTCCATTAGATCACGAGCTTAGTCACCATGCCGCGTGAAACCAGCAACCCGCTTGGCAGGGATCCCCCTCCTCGCACCGGGCCCATACATCGTGGGGGTAGCTAAATAATGATCTTTATAAGACATCTGGTTCTTACTTCAGGACCATTTTAACTTAAAATCGCCCACTCGTTCCTCTTAAATAAGACATCTCGATGGACTCATGACTAATCAGCCCATGCCTAACATAACTGAGGTTTCATACATTTGGTATCTTTTAATTTTTGGGGGGGAGCTTGC >Haplotype Slo02FP03 ACACCACAGTACTATGTCAGTATTAAAAGTAATTTGTTTTAAAAACATTTTACTGTACACATTACATACATATACACATGTGCATGCTAATATTT-AGTCT-CTCCTTGTAAATATTCATATATACATGCTATGTATTATTGTGCATTCATTTATTTTCCATACGATAAGTTAAAGCTCGTATTAATTATCATTAATTTTACATATTACATAATATGTATACTCTTACATATTATATATCCCCTATCAATTTTATCTCCATTATACCCTATGGCCACTCCATTAGATCACGAGCTTAATCACCATGCCGCGTGAAACCAGCAACCCGCTTGGCAGGGATCCCCCTCCTCGCACCGGGCCCATACATCGTGGGGGTAGCTAAATAATGATCTTTATAAGACATCTGGTTCTTACTTCAGGACCATTTTAACTTAAAATCGCCCACTCGTTCCTCTTAAATAAGACATCTCGATGGACTCATGACTAATCAGCCCATGCCTAACATAACTGAGGTTTCATACATTTGGTATTTTTTAATTTTTGGGGGGGAGCTTGC >Haplotype Slo02FP04 ACACCACAGTACTATGTCAGTATTAAAAGTAATTTGTTTTAAAAACATTTTACTGTACACATTACATACATATACACATGTGCATGCTAATATTT-AGTCT-CTCCTTGTAAATATTCATATATACATGCTATGTATTATTGTGCATTCATTTATTTTCCATACGATAAGTTAAAGCTCGTATTAATTATCATTAATTTTACATATTACATAATATGTATACTCTTACATATTATATATCCCCTATCAATTTTATCTCCATTATACTCTATGGCCACTCCATTAGATCACGAGCTTAATCACCATGCCGCGTGAAACCAGCAACCCGCTTGGCAGGGATCCCCCTCCTCGCACCGGGCCCATACATCGTGGGGGTAGCTAAATAATGATCTTTATAAGACATCTGGTTCTTACTTCAGGACCATTTTAACTTAAAATCGCCCACTCGTTCCTCTTAAATAAGACATCTCGATGGACTCATGACTAATCAGCCCATGCCTAACATAACTGAGGTTTCATACATTTGGTATTTTTTAATTTTTGGGGGGGAGCTTGC >Haplotype Slo02FP05 ACACCACAGTACTATGTCAGTATTAAAAGTAATTTGTTTTAAAAACATTTTACTGTACACATTACATACACATACACGTGTACATGCTAATATTT-AGTCT-CTCCTTGTAAATATTCATATATACATGCTATGTATTATTGTGCATTCATTTATTTTCCATACGATAAGTTAAAGCTCGTATTAATTATCATTAATTTTACATATTACATAATATGTATACTCTTACATATTATATATCCCCTATCAATTTTATCTCCATTATACTCTATGGCCGCTCCATTAGATCACGAGCTTAATCACCATGCCGCGTGAAACCAGCAACCCGCTTGGCAGGGATCCCCCTTCTCGCACCGGGCCCATACATCGTGGGGGTAGCTAAATAATGATCTTTATAAGACATCTGGTTCTTACTTCAGGACCATTTTAACTTAAAATCGCCCACTCGTTCCTCTTAAATAAGACATCTCGATGGACTTATGACTAATCAGCCCATGCCTAACATAACTGAGGTTTCATACATTTGGTATTTTTTAATTTTTGGGGGGGAGCTTGC >Haplotype Slo02FP06 ACACCACAGTACTATGTCAGTATTAAAAGTAATTTGTTTTAAAAACATTTTACTGTACACATTACATACACATACACGTGTGCATGCTAATATTT-AGTCT-CTCCTTGTAAATATTCATATATACATGCTATGTATTATTGTGCATTCATTTATTTTCCATACGATAAGTTAAAGCTCGTATTAATTATCATTAATTTTACATATTACATAATATGTATACTCTTACATATTATATAT
CCCCTATCAATTTTATCTCCATTATACTCTATGGTCGCTCCATTAGATCACGAGCTTAATCACCATGCCGCGTGAAACCAGCAACCCGCTTGGCAGGGATCCCCCTCCTCGCACCGGGCCCATATATCGTGGGGGTAGCTAAATAATGATCTTTATAAGACATCTGGTTCTTACTTCAGGACCATTTTAACTTAAAATCGCCCACTCGTTCCTCTTAAATAAGACATCTCGATGGACTCATGACTAATCAGCCCATGCCTAACATAACTGAGGTTTCATACATTTGGTATCTTTTAATTTTTGGGGGGGAGCTTGC >Haplotype Slo02FP07 ACACCACAGTACTATGTCAGTATTAAAAGTAATTTGTTTTAAAAACATTTTACTGTACACATTACATACACATACACATGTGCATGCTAATATTT-AGTCT-CTCCTTGTAAATATTCATATATACATGCTATGTATTATTGTGCATTCATTTATTTTCCATACGATAAGTTAAAGCTCGTATTAATTATCATTAATTTTACATATTACATAATATGTATACTCTTACATATTATATATCCCCTATCAATTTTATCTCCATTATACCCTATGGCCGCTCCATTAGATCACGAGCTTAATCACCATGCCGCGTGAAACCAGCAACCCGCTTGGCAGGGATCCCCCTCCTCGCACCGGGCCCATACATCGTGGGGGTAGCTAAATAATGATCTTTATAAGACATCTGGTTCTTACTTCAGGACCATTTTAACTTAAAATCGCCCACTCGTTCCTCTTAAATAAGACATCTCGATGGACTCATGACTAATCAGCCCATGCCTAACATAACTGAGGTTTCATACATTTGGTATTTTTTAATTTTTGGGGGGGAGCTTGC >Haplotype Slo02FP08 ACACCACAGTACTATGTCAGTATTAAAAGTAATTTGTTTTAAAAACATTTTACTGTACACATTACATACACATACACGTGTGCATGCTAATATTT-AGTCTTCTCCTTGTAAATATTCATATATACATGCTATGTATTATTGTGCATTCATTTATTTTCCATACGATAAGTTAAAGCTCGTATTAATTATCATTAATTTTACATATTACATAATATGTATACTCTTACATATTATATATCCTCTATCAATTTTATCTCCATTATACCCTATGGTCGCTCCATTAGATCACGAGCTTAATCACCATGCCGCGTGAAACCAGCAACCCGCTTGGCAGGGATCCCCCTCCTCGCACCGGGCCCATACATCGTGGGGGTAGCTAAATAATGATCTTTATAAGACATCTGGTTCTTACTTCAGGACCATTTTAACTTAAAATCGCCCACTCGTTCCTCTTAAATAAGACATCTCGATGGACTCATGACTAATCAGCCCATGCCTAACATAACTGAGGTTTCATACATTTGGTATCTTTTAATTTTTGGGGGGGAGCTTGC >Haplotype Slo02FP09 ACACCACAGTACTATGTCAGTATTAAAAGTAATTTGTTTTAAAAACATTTTACTGTACACATTACATACACATACACGTGTGCATGCTAATATTT-AGTCT-CTCCTTGTAAATATTCATATATACATGCTATGTATTATTGTGCATTCATTTATTTTCCATACGATAAGTTAAAGCTCGTATTAATTATCATTAATTTTACATATTACATAATATGTATGCTTTTACATATTATATATCCCCTATCAATTTTATCTCCCTTATACTCTATGGTCTCTCCATTAGATCACGAGCTTAATCACCATGCCGCGTGAAACCAGCAACCCGCTCGGCAGGGATCCCTCTTCTCGCACCGGGCCCATATCTCGTGGGGGTAGCTAAGTAATGATCTTTATAAGACATCTGGTTCTTACTTCAGGACCATTTTAACTTAAAATCGCCCACTCGTTCCTCTTAAATAAGACATCTCGATGGATTCATGACTAATCAGCCCATGCCTAACATAACTGAGGTTTCATACATTTGGTATTTTTTAATTTTTGGGGGGGAGCTTGC >Haplotype Slo02FP11 ACACCACAGTACTATGTCAGTATTAAAAGTAATTTGTTTTAAAAACATTTTACTGTACATATTACATACACATACACGTGTGCATGCTAATATTT-AGTCT-CTCCTCGTAAATATTCATATATACATGCTATGTATTATTGTGCATTCATTTATTTTCCATACGATAAGTTAAAGCTCGTATTAATTATCATTAATTTTACATATTACATAATATGTATACTCTTACATATTATATATCCCCTATCAATTTTATCCCCATTATACCCTATGGCCGCTCCATTAGATCACGAGCTTAATCACCATGCCGCGTGAAACCAGCAACCCGCTTGGCAGGGATCCCCCTCCTCGCACCGGGCCCATATATCGTGGGGGTAGCTAAATAATGATCTTTATAAGACATCTGGTTCTTACTTCAGGACCATTTTAACTTAAAATCGCCCACTCGTTCCTCTTAAATAAGACATCTCGATGGACTCATGACTAATCAGCCCATGCCTAACATAACTGAGGTTTCATACATTTGGTATTTTTTAATTTTTGGGGGGGAGCTTGC >Haplotype Slo02FP15 ACACCACAGTACTATGTCAGTATTAAAAATAATTTGTTTTAAAAACATTTTACTGTACACATTACATACACATACACGTGTGCATGCTAATATTT-AGTCT-CTCCTTGTAAATATTCATATATACATGCTATGTATTATTGTGCATTCATTTATTTTCCATACGATAAGTTAAAGCTCGTATTAATTATCATTAATTTTACATATTACATAATATGTATACTCTTACATATTATATATCCTCTATCAATTTTATCTCCATTATACCCTATGGCCGCTCCATTAGATCACGAGCTTAATCACCATGCCGCGTGAAACCAGCAACCCGCTCGGCAGGGATCCCCCTTCTCGCACCGGGCCCATACATCGTGGGGGTAGCTAAATAATGATCTTTATAAGACATCTGGTTCTTACTTCAGGACCATTTTAACTTAAAATCGCCCACTCGTTCCTCTTAAATAAGACATCTCGATGGACTCATGACTAATCAGCCCATGCCCAACATAACTGAGGTTTCATACATTTGGTATTTTTTAATTTTTGGGGGGGAGCTTGC >Haplotype Slo02FP20 ACACCACAGTACTATGTCAGTATTAAAAGTAATTTGTTTTAAAAACATTTTACTGTACACATTACATACACATACACGTGTGCATGCTAATATTT-AGTCT-CTCCTTGTAAATATTCATATATACATGCTATGTATTATTGTGCATTCATTTATTTTCCATACGATAAGTTAAAGCTCGTATTAATTATCATTAATTTTACATATTACATAATATGTATACTCTTACATATTATATAT
CCCCTATCAATTTTATCTCCATTATACTCTATGGTCGCTCCATTAGATCACGAGCTTAATCACCATGCCGCGTGAAACCAGCAACCCGCTCGGCAGGGATCCCCCTCCTCGCACCGGGCCCATATATCGTGGGGGTAGCTAGATAATGATCTTTATAAGACATCTGGTTCTTACTTCAGGACCATTTTAACTTAAAATCGCCCACTCGTTCCTCTTAAATAAGACATCTCGATGGACTCATGACTAATCAGCCCATGCCCAACATAACTGAGGTTTCATACATTTGGTATCTTTTAATTTTTGGGGGGGAGCTTGC >Haplotype Slo02FP22 ACACCACAGTACTATGTCAGTATTAAAAGTAATTTGTTTTAAAAACATTTTACTGTACACATTACATACACATACGCGTGTGCATGCTAATATTT-AGTCT-CTCCTTGTAAATATTCATATATACATGCTATGTATTATTGTGCATTCATTTATTTTCCATACGATAAGTTAAAGCTCGTATTAATTATCATTAATTTTACATATTACATAATATGTATACTCTTACATATTATATATCCCCTATCAATTTTATCTCCATTATACCCTATGGTCGCTCCATCAGATCACGAGCTTAATCACCATGCCGCGTGAAACCAGCAACCCGCTCGGCAGGGATCCCCCTCCTCGCACCGGGCCCATATATCGTGGGGGTAGCTAAATAATGATCTTTATAAGACATCTGGTTCTTACTTCAGGACCATTTTAACTTAAAATCGCCCACTCGTTCCTCTTAAATAAGACATCTCGATGGACTTATGACTAATCAGCCCATGCCTAACATAACTGAGGTTTCATACATTTGGTATCTTTTAATTTTTGGGGGGGAGCTTGC >Haplotype Slo02FP27 ACACCACAGTACTATGTCAGTATTAAAAGTAATTTATTTTAAAAACATTTTACTGTACACATTACATACACATACACGTGTGCATGCTAATATTT-AGTCT-CTCCTTGTAAATATTCATATATACATGCTATGTATTATTGTGCATTCATTTATTTTCCATACGATAAGTTAAAGCTCGTATTAATTATCATTAATTTTACATATTACATAATATGTATACTCTTACATATTATATATCCCCTATCAATTTTATTTCCATTATACCCTATGGTCGCTCCATTAGATCACGAGCTTAATCACCATGCCGCGTGAAACCAGCAACCCGCTTGGCAGGGATCCCCCTCCTCGCACCGGGCCCATATATCGTGGGGGTAGCTAAATAATGATCTTTATAAGACATCTGGTTCTTACTTCAGGACCATTTTAACTTAAAATCGCCCACTCGTTCCTCTTAAATAAGACATCTCGATGGACTCATGACTAATCAGCCCATGCCTAACATAACTGAGGTTTCATACATTTGGTATCTTTTAATTTTTGGGGGGGAGCTTGC >Haplotype Slo02FP36 ACACCACAGTACTATGTCAGTATTAAAAGTAATTTGTTTTAAAAACATTTTACTGTACACATTACATACACATACATGTGTGCATGCTAATATTT-AGTCT-CTCCTTGTAAATATTCATATATACATGCTATGTATTATTGTGCATTCATTTATTTTCCATACGATAAGTTAAAGCTCGTATTAATTATCATTAATTTTACATATTACATAATATGTATACTCTTACATATTATATATCCCCTATCAATTTTATCTCCATTATACCCTATGGTCGCTCCATTAGATCACGAGCTTAATCACCATGCCGCGTGAAACCAGCAACCCGCTTGGCAGGGATCCCTCTTCTCGCACCGGGCCCATATCTCGTGGGGGTAGCTAAATAATGATCTTTATAAGACATCTGGTTCTTACTTCAGGACCATTTTAACTTAAAATCGCCCACTCGTTCCTCTTAAATAAGACATCTCGATGGATTCGTGACTAATCAGCCCATGCCTAACATAACTGAGGTTTCATACATTTGGTATCTTTTAATTTTTGGGGGGGAGCTTGC >Haplotype Slo02FP38 ACACCACAGTACTATGTCAGTATTAAAAGTAATTTGTTTTAAAAACATTTTACTGTACATATTACATACACATATACATGTACATGCTAATATTT-AGTCT-CTCCTTGTAAATATTCATATATACATGCTATGTATTATTGTGCATTCATTTATTTTCCATACGATAAGTTAAAGCCCGTATTAATTATCATTAATTTTACATATTACATAATATGCATACTCTTACATATTATATATCCCCTATCAATTTTATCTCCATTATACCCTATGGCCGCTCCATTAGATCACGAGCTTAATCACCATGCCGCGTGAAACCAGCAACCCGCTCGGCAGGGATCCCCCTTCTCGCACCGGGCCCATATCTCGTGGGGGTAGCTAAATAATGATCTTTATAAGACATCTGGTTCTTACTTCAGGACCATTTCAACTTAAAATCGCCCACTCGTTCCTCTTAAATAAGACATCTCGATGGATTCGTGACTAATCAGCCCATGCCTAACATAACTGAGGTTTCATACATTTGGTATTTTTTAATTTTTGGGGGGGAGCTTGC >Haplotype Slo02FP45 ACACCACAGTACTATGTCAGTATTAAAAGTAATTTGTTTTAAAAACATTTTACTGTACATATTACATACACATACACGTGTGCATGCTAATATTT-AGTCT-CTCCTCGTAAATATTCATATATACATGCTATGTATTATTGTGCATTCATTTATTTTCCATACGATAAGTTAAAGCTCGTATTAATTATCATTAATTTTACATATTACATAATATGTATACTCTTACATATTATATATCCCCTATCAATTTTATCCCCATTATACCCTATGGTCGCTCCATTAGATCACGAGCTTAATCACCATGCCGCGTGAAACCAGCAACCCGCTTGGCAGGGATCCCCCTCCTCGCACCGGGCCCATATATCGTGGGGGTAGCTAAATAATGATCTTTATAAGACATCTGGTTCTTACTTCAGGACCATTTTAACTTAAAATCGCCCACTCGTTCCTCTTAAATAAGACATCTCGATGGACTTATGACTAATCAGCCCATGCCCAACATAACTGAGGTTTCATACATTTGGTATTTTTTAATTTTTGGGGGGGAGCTTGC >Haplotype Slo02FP49 ACACCACAGTACTATGTCAGTATTAAAAGTAATTTGTTTTAAAAACATTTTACTGTACACATTACATACACATACACGTGTGCATGCTAATATTT-AGTCT-CTCCTTGTAAATATTCATATATACATGCTATGTATTATTGTGCATTCATTTATTTTCCATACGATAAGTTAAAGCTCGTATTAATTATCATTAATTTTACATATTACATAATATGTATACTCTTACATATTATATAT

CCCCTATCAATTTTATCTCCATTATACTCTATGGTCGCTCCATTAGATCACGAGCTTAATCACCATGCCGCGTGAAACCAGCAACCCGCTCGGCAGGGATCCCTCTTCTCGCACCGGGCCCATATCTCGTGGGGGTAGCTAAATAATGATCTTTATAAGACATCTGGTTCTTACTTCAGGACCATTTTAACTTAAAATCGCCCACTCGTTCCTCTTAAATAAGACATCTCGATGGGTTCATGACTAATCAGCCCATGCCTAACATAACTGAGGTTTCATACATTTGGTATCTTTTAATTTTTGGGGGGGAGCTTGC >Haplotype Slo03FP18 ACACCACAGTACTATGTCAGTATTAAAAGTAATTTGTTTTAAAAACATTTTACTGTACACATTACATACACATACACATGTGCATGCTAATACTT-AGTCT-CTCCTTGTAAATATTCATATATACATGCTATGTATTATTGTGCATTCATTTATTTTCCATACGATAAGTTAAAGCTCGTATTAATTATCATTAATTTTACATATTACATAATATGTATACTCTTACATATTATATATCCCCTATCAATTTTATCCCCATTATACCCTATGGTCACTCCATTAGATCACGAGCTTAATCACCATGCCGCGTGAAACCAGCAACCCGCTTGGCAGGGATCCCCCTCCTCGCACCGGGCCCATATATCGTGGGGGTAGCTAAATAATGATCTTTATAAGACATCTGGTTCTTACTTCAGGACCATTTTAACTTAAAATCGCCCACTCGTTCCTCTTAAATAAGACATCTCGATGGACTTATGACTAATCAGCCCATGCCTAACATAACTGAGGTTTCATACATTTGGTATCTTTTAATTTTTGGGGGGGAGCTTGC >Haplotype Slo03FP26 ACACCACAGTACTATGTCAGTATTAAAAGTAATTTGTTTTAAAAACATTTTACTGTACACATTACATACACATACATGTGTGCATACTAATATTTTAGTCT-CTCCTTGTAAATATTCATATATACATGCTATGTATTATTGTGCATTCATTTATTTTCCATACGATAAGTTAAAGCTCGTATTAATTATCATTAATTTTACATATTACATAATATGTATACTCTTACATATTATATATCCCCTATCAATTTTATCTCCATTATACCCTATGGTCGCTCCATTAGATCACGAGCTTAATCACCATGCCGCGTGAAACCAGCAACCCGCTTGGCAGGGATCCCTCTTCTCGCACCGGGCCCATATCTCGTGGGGGTAGCTAAATAATGATCTTTATAAGACATCTGGTTCTTACTTCAGGACCATTTTAACTTAAAATCGCCCACTCGTTCCTCTTAAATAAGACATCTCGATGGATTCGTGACTAATCAGCCCATGCCTAACATAACTGAGGTTTCATACATTTGGTATCTTTTAATTTTTGGGGGGGAGCTTGC >Haplotype Slo03FP32 ACACCACAGTACTATGTCAGTATTAAAAGTAATTTGTTTTAAAAACATTTTACTGTACACATTACATACACATACACGTGTGCATGCTAGTATTT-AGTCT-CTCCTTGTAAATATTCATATATACATGCTATGTATTATTGTGCATTCATTTATTTTCCATACGATAAGTTAAAGCTCGTATTAATTATCATTAATTTTACATATTACATAATATGTATACTCTTACATATTATATATCCCCTATCAATTTTATCTCCATTATACCCTATGGCCGCTCCATTAGATCACGAGCTTAATCACCATGCCGCGTGAAACCAGCAACCCGCTTGGCAGGGATCCCCCTCCTCGCACCGGGCCCATATATCGTGGGGGTAGCTAAATAATGATCTTTATAAGACATCTGGTTCTTACTTCAGGACCATTTTAACTTAAAATCGCCCACTCGTTCCTCTTAAATAAGACATCTCGATGGACTCATGACTAATCAGCCCATGCCTAACATAACTGAGGTTTCATACATTTGGTATCTTTTAATTTTTGGGGGGGAGCTTGC >Haplotype Slo03FP33 ACACCACAGTACTATGTCAGTATTAAAAGTAATTTGTTTTAAAAACATTTTACTGTACATATTACATACACATACACGTGTGCATGCTAATATTT-AGTCT-CTCCTCGTAAATATTCATATATACATGCTATGTATTATTGTGCATTCATTTATTTTCCATACGATAAGTTAAAGCTCGTATTAATTATCATTAATTTTACATATTACATAATATGTATACTCTTACATATTATATATCCCCTATCAATTTTATCCCCATTATACCCTATGGTCGCTCCATTAGATCACGAGCTTAATCACCATGCCGCGTGAAACCAGCAACCCGCTTGGCAGGGATCCCCCTCCTCGCACCGGGCCCATATATCGTGGGGGTAGCTAAATAATGATCTTTATAAGACATCTGGTTCTTACTTCAGGACCATTTTAACTTAAAATCGCCCACTCGTTCCTCTTAAATAAGACATCTCGATGGACTCATGACTAATCAGCCCATGCCCAACATAACTGAGGTTTCATACATTTGGTATTTTTTAATTTTTGGGGGGGAGCTTGC >Haplotype Slo03FP34 ACACCACAGTACTATGTCAGTATTAAAAGTAATTTGTTTTAAAAACATTTTACTGTATACATTACATACACATACATGTGTGCATGCTAATATTT-AGTCT-CTCCTTGTAAATATTCATATATACATGCTATGTATTATTGTGCATTCATTTATTTTCCATACGATAAGTTAAAGCTCGTATTAATTATCATTAATTTTACATATTACATAATATGTATACTCTTACATATTATATGTCCCCTATCAATTTTACCTCCATTATACCCTATGGTCACTCCATTAGATCACGAGCTTAATCACCATGCCGCGTGAAACCAGCAACCCGCTCGGCAGGGATCCCTCTTCTCGCACCGGGCCCATATCTCGTGGGGGTAGCTAAATAATGATCTTTATAAGACATCTGGTTCTTACTTCAGGACCATTTTAATTTAAAATCGCCCACTCGTTCCTCTTAAATAAGACATCTCGATGGGTTCATGACTAATCAGCCCATGCCTAACATAACTGAGGTTTCATACATTTGGTATTTTTTAATTTTTGGGGGGGAGCTTGC >Haplotype Slo03FP37 ACACCACAGTACTATGTCAGTATTAAAAGTAATTTGTTTTAAAAACATTTTACTGTACACATTACATACACATACACGTGTGCATGCTAATATTT-AGTCT-CTCCTTGTAAATATTCATATATACATGCTATGTATTATTGTGCATTCATTTATTTTCCATACGATAAGTTAAAGCTCGTATTAATTATCATTAATTTTACATATTACATAATATGCATACTCTTACATATTATATAT
CCCCTATCAATTTTATCTCCATTATACCCTATGGTCGCTCCATTAGATCACGAGCTTAATCACCATGCCGCGTGAAACCAGCAACCCGCTTGGCAGGGATCCCCCTCCTCGCACCGGGCCCATACATCGTGGGGGTAGCTAAATAATGATCTTTATAAGACATCTGGTTCTTACTTCAGGACCATTTTAACTTAAAATCGCCCACTCGTTCCTCTTAAATAAGACATCTCGATGGATTCGTGACTAATCAGCCCATGCCTAACATAACTGAGGTTTCATACATTTGGTATCTTTTAATTTTTGGGGGGGAGCTTGC >Haplotype Slo03FP41 ACACCACAGTACTATGTCAGTATTAAAAGTAATTTGTTTTAAAAACATTTTACTGTACACATTACATACACATACACATGTGCATGCTAATATTT-AGTCT-CTCCTTGTAAATATTCATATATACATGCTATGTATTATTGTGCATTCATTTATTTTCCATACGATAAGTTAAAGCTCGTATTAATTATCATTAATTTTACATATTACATAATATGTATACTCTTACATATTATATATCCCCTATCAATTTTATTTCCATTATACTCTATGGCCGCTCCATTAGATCACGAGCTTAATCACCATGCCGCGTGAAACCAGCAACCCGCTTGGCAGGGATCCCCCTTCTCGCACCGGGCCCATATATCGTGGGGGTAGCTAAATAATGATCTTTATAAGACATCTGGTTCTTACTTCAGGACCATTTTAACTTAAAATCGCCCACTCGTTCCTCTTAAATAAGACATCTCGATGGACTCATGACTAATCAGCCCATGCCTAACATAACTGAGGTTTCATACATTTGGTATCTTTTAATTTTTGGGGGGGAGCTTGC >Haplotype Slo04FP59 ACACCACAGTACTATGTCAGTATTAAAAGTAATTTGTTTTAAAAACATTTTACTGTACACATTACATACACATACACGTGTGCATGCTAATATTT-AGTCT-CTCCTTGTAAATATTCATATGTACATGCTATGTATTATTGTGCATTCATTTATTTTCCATACGATAAGTTAAAGCTCGTATTAATTATCATTAATTTTACATATTACATAATATGTATACTCTTACATATTATATATCCCCTATCAATTTTACTTCCATTATACTCTATGGTCGCTCCATTAGATCACGAGCTTAATCACCATGCCGCGTGAAACCAGCAACCCGCTTGGCAGGGATCCCCCTCCTCGCACCGGGCCCATATATCGTGGGGGTAGCTAAATAATGATCTTTATAAGACATCTGGTTCTTACTTCAGGACCATTTTAACTTAAAATCGCCCACTCGTTCCTCTTAAATAAGACATCTCGATGGACTCATGACTAATCAGCCCATGCCTAACATAACTGAGGTTTCATACATTTGGTATCTTTTAATTTTTGGGGGGGAGCTTGC >Haplotype Slo04FP70 ACACCACAGTACTATGTCAGTATTAAAAGTAATTTGTTTTAAAAACATTTTACCGTACACATTACATACACATACACGTGTGCATGCTAATATTT-AGTCT-CTCCTTGTAAATATTCATATATACATGCTATGTATTATTGTGCATTCATTTATTTTCCATACGATAAGTTAAAGCTCGTATTAATTATCATTAATTTTACATATTACATAATATGCATACTCTTACATATTATATATCCCCTATCAATTTTATCTCCATTATATTCTATGGTCGCTCCATTAGATCACGAGCTTAATCACCATGCCGCGTGAAACCAGCAACCCGCTCGGCAGGGATCCCTCTTCTCGCACCGGGCCCATATCTCGTGGGGGTAGCTAAATAATGATCTTTATAAGACATCTGGTTCTTACTTCAGGACCATTTTAACTTAAAATCGCCCACTCGTTCCTCTTAAATAAGACATCTCGATGGACTCATGACTAATCAGCCCATGCCTAACATAACTGAGGTTTCATACATTTGGTATTTTTTAATTTTTGGGGGGGAGCTTGC >Haplotype Slo04FP78 ACACCACAGTACTATGTCAGTATTAAAAGTAATTTGTTTTAAAAACATTTTACTGTACACATTACATACACATACACGTGTACATGCTAATATTT-AGTCT-CTCCTTGTAAATATTCATATATACATGCTATGTATTATTGTGCATTCATTTATTTTCCATACGATAAGTTAAAGCTCGTATTAATTATCATTAATTTTACATATTACATAATATGTATACTCTTACATATTATATATCCCCTATCAATTTTATCTCCATTATACCCTATGGTCGCTCCATTAGATCACGAGCTTAATCACCATGCCGCGTGAAACCAGCAACCCGCTCGGCAGGGATCCCCCTCCTCGCACCGGGCCCATACATCGTGGGGGTAGCTAAATAATGATCTTTATAAGACATCTGGTTCTTACTTCAGGACCATTTTAACTTAAAATCGCCCACTCGTTCCTCTTAAATAAGACATCTCGATGGACTTATGACTAATCAGCCCATGCCTAACATAACTGAGGTTTCATACATTTGGTATCTTTTAATTTTTGGGGGGGAGCTTGC >Haplotype Slo04FP79 ACACCACAGTACTATGTCAGTATTAAAAGTAATTTGTTTTAAAAACATTTTACTGTACACATTACATACACATACACGTGTGCATGCTAATATTT-AGTCT-CTCCTTGTAAATATTCATATATACATGCTATGTATTATTGTGCATTCATTTATTTTCCATACGATAAGTTAAAGCTCGTATTAATTATCATTAATTTTACATATTACATAATATGTATACTCTTACATATTATATATCCCCTATCAATTTTATCTCCATTATACCCTATGGCCGCTCCATTAGATCACGAGCTTAATCACCATGCCGCGTGAAACCAGCAACCCGCTTGGCAGGGATCCCCCTTCTCGCACCGGGCCCATACATCGTGGGGGTAGCTAAGTAATGATCTTTATAAGACATCTGGTTCTTACTTCAGGACCATTTTAACTTAAAATCGCCCACTCGTTCCTCTTAAATAAGACATCTCGATGGACTCATGACTAATCAGCCCATGCCTAACATAACTGAGGTTTCATACATTTGGTATCTTTTAATTTTTGGGGGGGAGCTTGC >Haplotype Slo04FP82 ACACCACAGTACTATGTCAGTATTAAAAGTAATTTGTTTTAAAAACATTTTACTGTACACATTACATACACATACATGTGTGCATGCTAATATTT-AGTCT-CTCCTTGTAAATATTCATATATACATGCTATGTATTATTGTGCATTCATTTATTTTCCATACGATAAGTTAAAGCTCGTATTAATTATCATTAATTTTACATATTACATAATATGTATACTCTTACATATTATATAT
CCCCTATCAATTCTATCTCCATTATATTCTATGGTCGCTCCATTAGATCACGAGCTTAATCACCATGCCGCGTGAAACCAGCAACCCGCTCGGCAGGGATCCCCCTTCTCGCACCGGGCCCATATCTTGTGGGGGTAGCTAAATAATGATCTTTATAAGACATCTGGTTCTTACTTCAGGACCATTTTAACTTAAAATCGCCCACTCGTTCCTCTTAAATAAGACATCTCGATGGATTCGTGACTAATCAGCCCATGCCTAACATAACTGAGGTTTCATACATTTGGTATTTTTTAATTTTTGGGGGGGAGCTTGC >Haplotype Slo04FP83 ACACCACAGTACTATGTCAGTATTAAAAGTAATTTGTTTTAAAAACATTTTACTGTACACATTACATACACATACACGTGTGCATGCTAATATTT-AGTCT-CTCCTTGTAAATATTCATATATACATGCTATGTATTATTGTGCATTCATTTATTTTCCATACGATAAGTTAAAGCTCGTATTAATTATCATTAATTTTACATATTACATAATATGTATACTCTTACATATTATATATCCCCTATCAATTTTATCTCCATTATACTCTATGGTCGCTCCATTAGATCACGAGCTTAATCACCATGCCGCGTGAAACCAGCAACCCGCTCGGCAGGGATCCCTCTTCTCGCACCGGGCCCATATCTCGTGGGGGTAGCTAGATAATGATCTTTATAAGACATCTGGTTCTTACTTCAGGACCATTTTAACTTAAAATCGCCCACTCGTTCCTCTTAAATAAGACATCTCGATGGGTTCATGACTAATCAGCCCATGCCTAACATAACTGAGGTTTCATACATTTGGTATCTTTTAATTTTTGGGGGGGAGCTTGC

Spinner dolphin’s samples used in Chapter 2 (?) indicate missing data
Code Sampling date Type of sample Location Sex mtDNA haplotype
555bp 1 Slo02FP01 08/04/2002 biopsy Moorea Male Slo02FP01 2 Slo02FP02 08/04/2002 biopsy Moorea Female Slo02FP02 3 Slo02FP03 29/04/2002 biopsy Moorea Male Slo02FP03 4 Slo02FP04 29/04/2002 biopsy Moorea Male Slo02FP04 5 Slo02FP05 29/04/2002 biopsy Moorea Female Slo02FP05 6 Slo02FP06 08/05/2002 biopsy Moorea Male Slo02FP06 7 Slo02FP07 13/05/2002 biopsy Moorea Female Slo02FP07 8 Slo02FP08 18/05/2002 biopsy Moorea Male Slo02FP08 9 Slo02FP09 18/05/2002 biopsy Moorea Male Slo02FP09
10 Slo02FP10 24/05/2002 biopsy Moorea Female Slo02FP01 11 Slo02FP11 24/05/2002 biopsy Moorea Female Slo02FP11 12 Slo02FP12 26/05/2002 biopsy Moorea Male Slo02FP04 13 Slo02FP13 26/05/2002 biopsy Moorea Male Slo02FP09 14 Slo02FP14 26/05/2002 biopsy Moorea Male Slo02FP07 15 Slo02FP15 28/05/2002 biopsy Moorea Male Slo02FP15 16 Slo02FP16 28/05/2002 biopsy Moorea Male Slo02FP15 17 Slo02FP17 29/05/2002 biopsy Moorea Male Slo02FP02 18 Slo02FP18 29/05/2002 biopsy Moorea Female Slo02FP01 19 Slo02FP19 11/06/2002 biopsy Moorea Female Slo02FP11 20 Slo02FP20 25/06/2002 biopsy Moorea Male Slo02FP20 21 Slo02FP21 25/06/2002 biopsy Moorea Male Slo02FP20 22 Slo02FP22 27/06/2002 biopsy Moorea Male Slo02FP22 23 Slo02FP23 07/07/2002 biopsy Moorea Male Slo02FP11 24 Slo02FP24 08/07/2002 biopsy Moorea Female Slo02FP04 25 Slo02FP25 08/07/2002 biopsy Moorea Female Slo02FP20 26 Slo02FP26 09/07/2002 biopsy Moorea Male Slo02FP22 27 Slo02FP27 15/07/2002 biopsy Moorea Male Slo02FP27 28 Slo02FP28 23/07/2002 biopsy Moorea Male Slo02FP27 29 Slo02FP29 24/07/2002 biopsy Moorea Male Slo02FP27 30 Slo02FP30 24/07/2002 biopsy Moorea Male Slo02FP07 31 Slo02FP31 27/07/2002 biopsy Moorea Male Slo02FP15 32 Slo02FP32 30/07/2002 biopsy Moorea Male Slo02FP15 33 Slo02FP33 30/07/2002 biopsy Moorea Male Slo02FP22 34 Slo02FP34 30/07/2002 biopsy Moorea Female Slo02FP02 35 Slo02FP35 31/07/2002 biopsy Moorea Female Slo02FP01 36 Slo02FP36 05/08/2002 biopsy Moorea Male Slo02FP36 37 Slo02FP37 07/08/2002 biopsy Moorea Male Slo02FP01 38 Slo02FP38 07/08/2002 biopsy Moorea Male Slo02FP38 39 Slo02FP39 07/08/2002 biopsy Moorea Male Slo02FP22 40 Slo02FP40 09/08/2002 biopsy Moorea Male Slo02FP22 41 Slo02FP41 12/08/2002 biopsy Moorea Male Slo02FP22 42 Slo02FP42 14/08/2002 biopsy Moorea Male Slo02FP22 43 Slo02FP43 14/08/2002 biopsy Moorea Female Slo02FP22 44 Slo02FP44 14/08/2002 biopsy Moorea Male Slo02FP38 45 Slo02FP45 14/08/2002 biopsy Moorea Female Slo02FP45 46 Slo02FP46 28/08/2002 biopsy Moorea Male Slo02FP15

47 Slo02FP47 29/08/2002 biopsy Moorea Male Slo02FP20 48 Slo02FP48 27/10/2002 biopsy Moorea Male Slo02FP20 49 Slo02FP49 28/10/2002 biopsy Moorea Male Slo02FP49 50 Slo02FP50 28/10/2002 biopsy Moorea Male Slo02FP22 51 Slo02FP51 28/10/2002 biopsy Moorea Male Slo02FP01 52 Slo02FP52 29/10/2002 biopsy Moorea Male Slo02FP06 53 Slo02FP53 03/11/2002 biopsy Moorea Male Slo02FP09 54 Slo02FP54 03/11/2002 biopsy Moorea Female Slo02FP22 55 Slo02FP55 05/11/2002 biopsy Moorea Female Slo02FP15 56 Slo02FP56 05/11/2002 biopsy Moorea Male Slo02FP07 57 Slo02FP57 16/11/2002 biopsy Moorea Male Slo02FP02 58 Slo02FP58 18/11/2002 biopsy Moorea Male Slo02FP15 59 Slo02FP59 20/11/2002 biopsy Moorea Male Slo02FP27 60 Slo02FP60 20/11/2002 biopsy Moorea Male Slo02FP07 61 Slo02FP61 janvier 2002 stranding Moorea Male Slo02FP22 62 Slo02FP62 janvier 2002 stranding Moorea Male Slo02FP11 63 Slo03FP08 03/09/2003 biopsy Moorea Female Slo02FP27 64 Slo03FP09 05/09/2003 biopsy Moorea Female Slo02FP02 65 Slo03FP10 05/09/2003 biopsy Moorea Female Slo02FP27 66 Slo03FP11 05/09/2003 biopsy Moorea Female Slo02FP27 67 Slo03FP12 13/09/2003 biopsy Moorea Male Slo02FP04 68 Slo03FP13 13/09/2003 biopsy Moorea Male Slo02FP20 69 Slo03FP14 13/09/2003 biopsy Moorea Female Slo02FP04 70 Slo03FP15 13/09/2003 biopsy Moorea Female Slo02FP01 71 Slo03FP16 19/10/2003 biopsy BoraBora Male Slo02FP27 72 Slo03FP17 28/10/2003 biopsy BoraBora Female Slo02FP09 73 Slo03FP18 28/10/2003 biopsy BoraBora Female Slo03FP18 74 Slo03FP19 29/10/2003 biopsy BoraBora Female Slo02FP07 75 Slo03FP20 29/10/2003 biopsy BoraBora Male Slo02FP15 76 Slo03FP21 29/10/2003 biopsy BoraBora Male Slo02FP07
77 Slo03FP22 30/10/2003 biopsy Tahaa-Raiatea Female Slo02FP09
78 Slo03FP23 31/10/2003 biopsy Tahaa-Raiatea Female Slo02FP15
79 Slo03FP24 31/10/2003 biopsy Tahaa-Raiatea Female Slo02FP15
80 Slo03FP25 31/10/2003 biopsy Tahaa-Raiatea Female Slo02FP15
81 Slo03FP26 05/11/2003 biopsy Huahine Female Slo03FP26 82 Slo03FP27 05/11/2003 biopsy Huahine Male Slo02FP07 83 Slo03FP28 05/11/2003 biopsy Huahine Male Slo03FP26 84 Slo03FP29 05/11/2003 biopsy Huahine Female Slo02FP04 85 Slo03FP30 05/11/2003 biopsy Huahine Male Slo02FP05 86 Slo03FP31 05/11/2003 biopsy Huahine Male Slo02FP11 87 Slo03FP32 05/11/2003 biopsy Huahine Male Slo03FP32 88 Slo03FP33 05/11/2003 biopsy Huahine Male Slo03FP33 89 Slo03FP34 06/11/2003 biopsy Huahine Male Slo03FP34 90 Slo03FP35 06/11/2003 biopsy Huahine Male Slo02FP07 91 Slo03FP36 06/11/2003 biopsy Huahine Male Slo03FP32 92 Slo03FP37 06/11/2003 biopsy Huahine Male Slo03FP37 93 Slo03FP38 06/11/2003 biopsy Huahine Male Slo03FP34 94 Slo03FP39 08/11/2003 biopsy Huahine Male Slo03FP32 95 Slo03FP40 08/11/2003 biopsy Huahine Male Slo02FP05
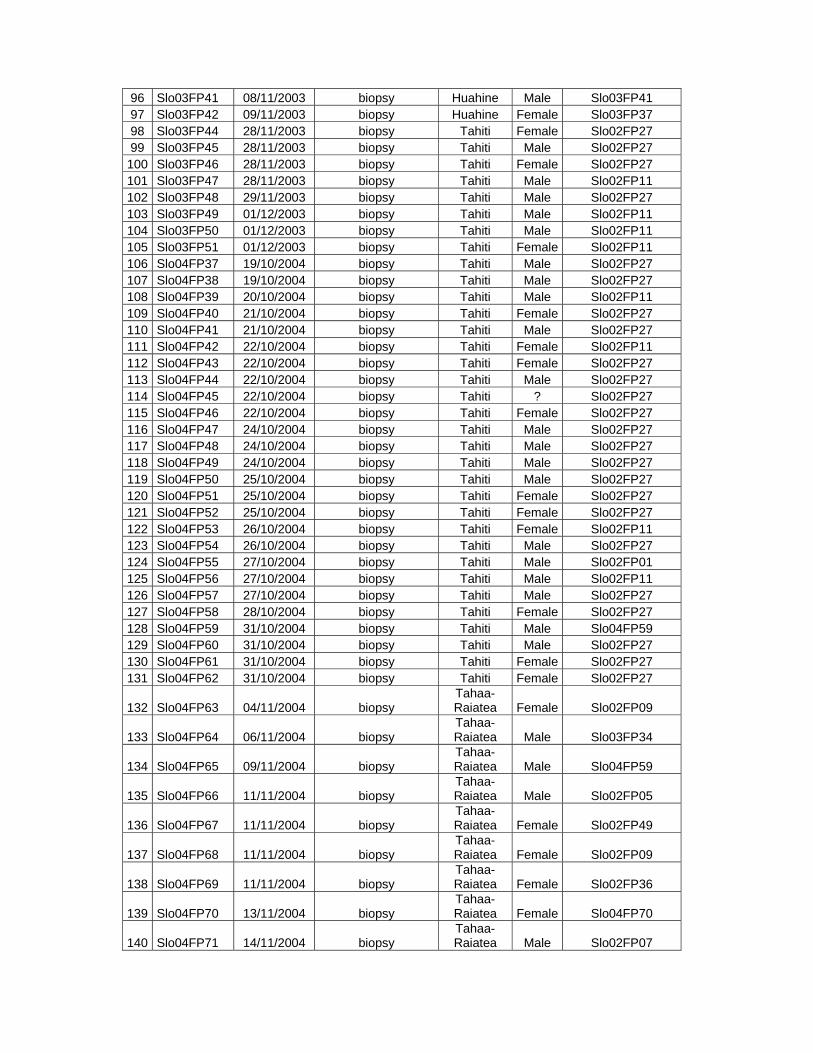
96 Slo03FP41 08/11/2003 biopsy Huahine Male Slo03FP41 97 Slo03FP42 09/11/2003 biopsy Huahine Female Slo03FP37 98 Slo03FP44 28/11/2003 biopsy Tahiti Female Slo02FP27 99 Slo03FP45 28/11/2003 biopsy Tahiti Male Slo02FP27
100 Slo03FP46 28/11/2003 biopsy Tahiti Female Slo02FP27 101 Slo03FP47 28/11/2003 biopsy Tahiti Male Slo02FP11 102 Slo03FP48 29/11/2003 biopsy Tahiti Male Slo02FP27 103 Slo03FP49 01/12/2003 biopsy Tahiti Male Slo02FP11 104 Slo03FP50 01/12/2003 biopsy Tahiti Male Slo02FP11 105 Slo03FP51 01/12/2003 biopsy Tahiti Female Slo02FP11 106 Slo04FP37 19/10/2004 biopsy Tahiti Male Slo02FP27 107 Slo04FP38 19/10/2004 biopsy Tahiti Male Slo02FP27 108 Slo04FP39 20/10/2004 biopsy Tahiti Male Slo02FP11 109 Slo04FP40 21/10/2004 biopsy Tahiti Female Slo02FP27 110 Slo04FP41 21/10/2004 biopsy Tahiti Male Slo02FP27 111 Slo04FP42 22/10/2004 biopsy Tahiti Female Slo02FP11 112 Slo04FP43 22/10/2004 biopsy Tahiti Female Slo02FP27 113 Slo04FP44 22/10/2004 biopsy Tahiti Male Slo02FP27 114 Slo04FP45 22/10/2004 biopsy Tahiti ? Slo02FP27 115 Slo04FP46 22/10/2004 biopsy Tahiti Female Slo02FP27 116 Slo04FP47 24/10/2004 biopsy Tahiti Male Slo02FP27 117 Slo04FP48 24/10/2004 biopsy Tahiti Male Slo02FP27 118 Slo04FP49 24/10/2004 biopsy Tahiti Male Slo02FP27 119 Slo04FP50 25/10/2004 biopsy Tahiti Male Slo02FP27 120 Slo04FP51 25/10/2004 biopsy Tahiti Female Slo02FP27 121 Slo04FP52 25/10/2004 biopsy Tahiti Female Slo02FP27 122 Slo04FP53 26/10/2004 biopsy Tahiti Female Slo02FP11 123 Slo04FP54 26/10/2004 biopsy Tahiti Male Slo02FP27 124 Slo04FP55 27/10/2004 biopsy Tahiti Male Slo02FP01 125 Slo04FP56 27/10/2004 biopsy Tahiti Male Slo02FP11 126 Slo04FP57 27/10/2004 biopsy Tahiti Male Slo02FP27 127 Slo04FP58 28/10/2004 biopsy Tahiti Female Slo02FP27 128 Slo04FP59 31/10/2004 biopsy Tahiti Male Slo04FP59 129 Slo04FP60 31/10/2004 biopsy Tahiti Male Slo02FP27 130 Slo04FP61 31/10/2004 biopsy Tahiti Female Slo02FP27 131 Slo04FP62 31/10/2004 biopsy Tahiti Female Slo02FP27
132 Slo04FP63 04/11/2004 biopsy Tahaa-Raiatea Female Slo02FP09
133 Slo04FP64 06/11/2004 biopsy Tahaa-Raiatea Male Slo03FP34
134 Slo04FP65 09/11/2004 biopsy Tahaa-Raiatea Male Slo04FP59
135 Slo04FP66 11/11/2004 biopsy Tahaa-Raiatea Male Slo02FP05
136 Slo04FP67 11/11/2004 biopsy Tahaa-Raiatea Female Slo02FP49
137 Slo04FP68 11/11/2004 biopsy Tahaa-Raiatea Female Slo02FP09
138 Slo04FP69 11/11/2004 biopsy Tahaa-Raiatea Female Slo02FP36
139 Slo04FP70 13/11/2004 biopsy Tahaa-Raiatea Female Slo04FP70
140 Slo04FP71 14/11/2004 biopsy Tahaa-Raiatea Male Slo02FP07

141 Slo04FP72 14/11/2004 biopsy Tahaa-Raiatea Male Slo03FP41
142 Slo04FP73 14/11/2004 biopsy Tahaa-Raiatea Female Slo02FP15
143 Slo04FP74 14/11/2004 biopsy Tahaa-Raiatea Male Slo02FP27
144 Slo04FP75 15/11/2004 biopsy Tahaa-Raiatea Female Slo02FP20
145 Slo04FP76 15/11/2004 biopsy Tahaa-Raiatea Male Slo02FP07
146 Slo04FP77 15/11/2004 biopsy Tahaa-Raiatea Male Slo03FP41
147 Slo04FP78 22/11/2004 biopsy Nuku Hiva Female Slo03FP01 148 Slo04FP79 23/11/2004 biopsy Nuku Hiva Male Slo04FP79 149 Slo04FP80 23/11/2004 biopsy Nuku Hiva Male Slo04FP70 150 Slo04FP81 23/11/2004 biopsy Nuku Hiva Male Slo04FP70 151 Slo04FP82 23/11/2004 biopsy Nuku Hiva Male Slo04FP82 152 Slo04FP83 24/11/2004 biopsy Nuku Hiva Female Slo04FP83 153 Slo04FP84 27/11/2004 biopsy Nuku Hiva Female Slo04FP70 154 Slo04FP85 27/11/2004 biopsy Nuku Hiva Male Slo04FP83
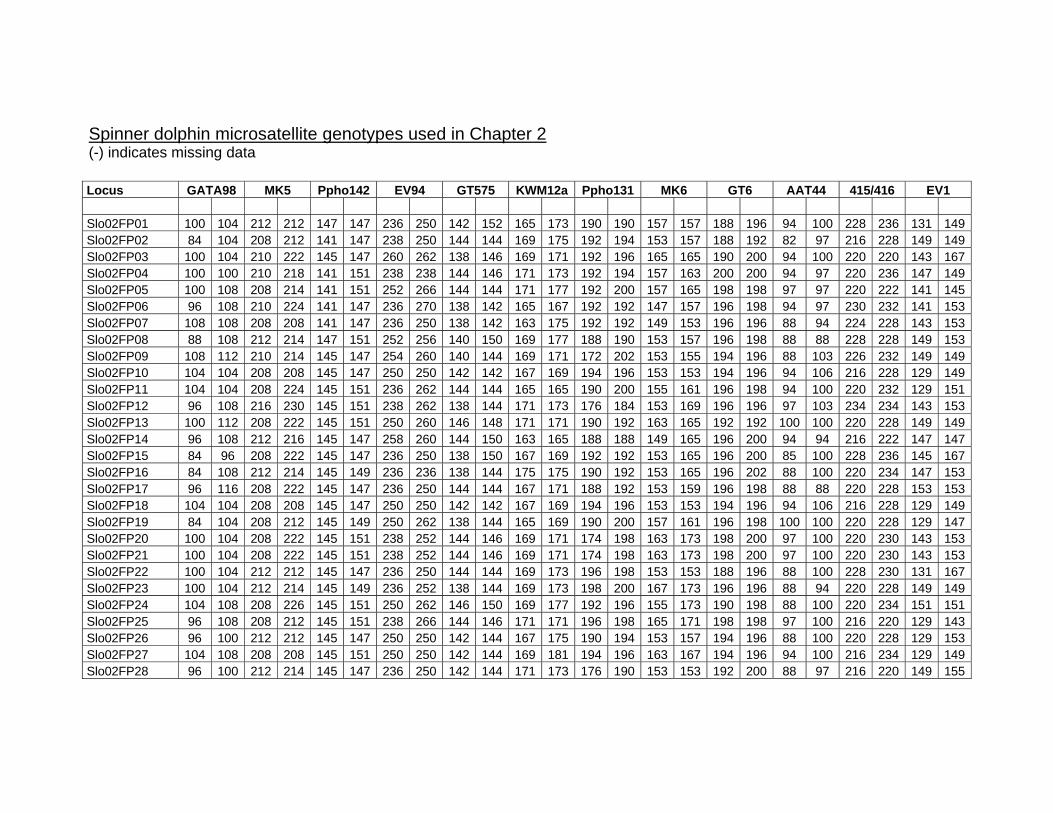
Spinner dolphin microsatellite genotypes used in Chapter 2 (-) indicates missing data Locus GATA98 MK5 Ppho142 EV94 GT575 KWM12a Ppho131 MK6 GT6 AAT44 415/416 EV1 Slo02FP01 100 104 212 212 147 147 236 250 142 152 165 173 190 190 157 157 188 196 94 100 228 236 131 149Slo02FP02 84 104 208 212 141 147 238 250 144 144 169 175 192 194 153 157 188 192 82 97 216 228 149 149Slo02FP03 100 104 210 222 145 147 260 262 138 146 169 171 192 196 165 165 190 200 94 100 220 220 143 167Slo02FP04 100 100 210 218 141 151 238 238 144 146 171 173 192 194 157 163 200 200 94 97 220 236 147 149Slo02FP05 100 108 208 214 141 151 252 266 144 144 171 177 192 200 157 165 198 198 97 97 220 222 141 145Slo02FP06 96 108 210 224 141 147 236 270 138 142 165 167 192 192 147 157 196 198 94 97 230 232 141 153Slo02FP07 108 108 208 208 141 147 236 250 138 142 163 175 192 192 149 153 196 196 88 94 224 228 143 153Slo02FP08 88 108 212 214 147 151 252 256 140 150 169 177 188 190 153 157 196 198 88 88 228 228 149 153Slo02FP09 108 112 210 214 145 147 254 260 140 144 169 171 172 202 153 155 194 196 88 103 226 232 149 149Slo02FP10 104 104 208 208 145 147 250 250 142 142 167 169 194 196 153 153 194 196 94 106 216 228 129 149Slo02FP11 104 104 208 224 145 151 236 262 144 144 165 165 190 200 155 161 196 198 94 100 220 232 129 151Slo02FP12 96 108 216 230 145 151 238 262 138 144 171 173 176 184 153 169 196 196 97 103 234 234 143 153Slo02FP13 100 112 208 222 145 151 250 260 146 148 171 171 190 192 163 165 192 192 100 100 220 228 149 149Slo02FP14 96 108 212 216 145 147 258 260 144 150 163 165 188 188 149 165 196 200 94 94 216 222 147 147Slo02FP15 84 96 208 222 145 147 236 250 138 150 167 169 192 192 153 165 196 200 85 100 228 236 145 167Slo02FP16 84 108 212 214 145 149 236 236 138 144 175 175 190 192 153 165 196 202 88 100 220 234 147 153Slo02FP17 96 116 208 222 145 147 236 250 144 144 167 171 188 192 153 159 196 198 88 88 220 228 153 153Slo02FP18 104 104 208 208 145 147 250 250 142 142 167 169 194 196 153 153 194 196 94 106 216 228 129 149Slo02FP19 84 104 208 212 145 149 250 262 138 144 165 169 190 200 157 161 196 198 100 100 220 228 129 147Slo02FP20 100 104 208 222 145 151 238 252 144 146 169 171 174 198 163 173 198 200 97 100 220 230 143 153Slo02FP21 100 104 208 222 145 151 238 252 144 146 169 171 174 198 163 173 198 200 97 100 220 230 143 153Slo02FP22 100 104 212 212 145 147 236 250 144 144 169 173 196 198 153 153 188 196 88 100 228 230 131 167Slo02FP23 100 104 212 214 145 149 236 252 138 144 169 173 198 200 167 173 196 196 88 94 220 228 149 149Slo02FP24 104 108 208 226 145 151 250 262 146 150 169 177 192 196 155 173 190 198 88 100 220 234 151 151Slo02FP25 96 108 208 212 145 151 238 266 144 146 171 171 196 198 165 171 198 198 97 100 216 220 129 143Slo02FP26 96 100 212 212 145 147 250 250 142 144 167 175 190 194 153 157 194 196 88 100 220 228 129 153Slo02FP27 104 108 208 208 145 151 250 250 142 144 169 181 194 196 163 167 194 196 94 100 216 234 129 149Slo02FP28 96 100 212 214 145 147 236 250 142 144 171 173 176 190 153 153 192 200 88 97 216 220 149 155

Slo02FP29 100 108 212 218 145 147 236 256 144 150 167 173 190 192 153 153 - - 88 97 228 228 149 151Slo02FP30 100 112 212 216 145 151 238 262 138 144 167 175 198 198 165 165 192 198 94 100 216 228 143 149Slo02FP31 104 104 212 212 145 141 236 262 - - 169 173 176 192 149 167 186 196 94 100 - - - - Slo02FP32 84 96 208 222 145 147 236 250 138 150 167 169 192 192 153 165 196 200 85 100 228 236 145 167Slo02FP33 100 108 208 212 145 147 250 252 144 144 169 169 190 198 149 157 188 194 85 88 230 236 129 155Slo02FP34 104 116 212 222 145 147 236 250 138 140 167 169 190 200 157 159 196 198 88 94 220 236 131 153Slo02FP35 84 108 210 212 145 149 246 264 144 144 173 175 184 190 157 165 188 196 88 88 228 230 145 155Slo02FP36 104 112 210 212 145 151 236 252 146 146 171 175 192 192 161 169 196 196 88 97 230 234 143 151Slo02FP37 96 104 208 224 145 151 236 238 144 144 171 171 198 200 167 169 196 196 100 109 236 236 147 151Slo02FP38 84 104 208 214 145 147 236 250 142 144 169 171 176 192 159 177 196 196 85 106 216 228 151 151Slo02FP39 100 108 212 212 145 147 250 262 142 152 167 173 196 198 149 153 188 188 94 100 228 228 155 155Slo02FP40 96 104 212 212 145 147 250 250 146 146 167 169 190 190 149 153 194 198 97 100 228 230 129 151Slo02FP41 100 108 212 212 145 147 250 262 142 152 167 173 196 198 149 153 188 188 94 100 228 228 155 155Slo02FP42 96 104 208 212 145 147 236 262 144 150 167 173 190 192 149 153 196 198 85 100 228 236 155 155Slo02FP43 100 104 208 216 145 147 236 250 142 144 165 171 196 198 157 163 194 198 100 100 216 234 129 149Slo02FP44 104 108 212 224 145 147 246 262 138 142 169 173 190 196 153 163 196 196 94 106 216 216 149 149Slo02FP45 104 108 210 212 145 147 262 262 138 138 167 171 192 192 163 165 196 200 85 94 220 220 149 149Slo02FP46 104 108 208 210 145 151 250 262 138 144 171 175 192 198 157 173 192 198 94 94 220 228 149 155Slo02FP47 84 104 208 222 145 147 234 254 138 146 169 173 192 194 155 165 196 198 94 94 228 234 149 151Slo02FP48 84 104 208 222 145 147 234 254 138 146 169 173 192 194 155 165 196 198 94 94 228 234 149 151Slo02FP49 96 108 208 212 145 147 236 250 140 152 169 177 190 196 149 153 - - 88 100 - - 151 153Slo02FP50 100 108 208 212 145 147 250 252 144 144 169 169 190 198 149 157 188 194 85 88 230 236 129 155Slo02FP51 100 112 208 212 145 147 236 262 142 142 169 169 190 190 153 153 188 196 - - 228 228 129 149Slo02FP52 84 104 208 222 145 147 234 254 138 146 169 173 192 194 155 165 196 198 94 94 228 234 149 151Slo02FP53 108 112 210 214 145 147 254 260 140 144 169 171 172 202 153 155 194 196 88 103 226 232 149 149Slo02FP54 104 108 212 224 145 147 236 238 138 152 165 169 190 200 149 149 196 196 94 109 236 236 131 147Slo02FP55 84 100 208 224 145 149 250 262 138 138 165 169 190 192 149 165 196 200 88 100 220 220 147 149Slo02FP56 100 108 212 212 145 141 236 266 144 144 169 181 194 198 149 149 196 196 88 97 228 230 149 155Slo02FP57 96 108 208 222 145 147 250 250 142 144 167 173 190 194 157 169 188 198 82 94 220 230 129 149Slo02FP58 104 108 208 210 145 151 250 262 138 144 171 175 192 198 157 173 192 198 94 94 220 228 149 155Slo02FP59 96 104 208 216 145 147 236 250 144 144 165 169 196 198 157 167 194 196 88 88 216 216 129 129Slo02FP60 104 112 208 210 145 147 250 250 138 144 163 175 192 192 149 157 196 196 97 100 228 232 149 153Slo02FP61 100 108 208 212 145 147 250 252 144 144 169 169 190 198 149 157 188 194 85 88 230 236 129 155Slo02FP62 100 104 212 214 145 149 236 252 138 144 169 173 198 200 167 173 196 196 88 94 220 228 149 149

Slo03FP08 84 100 210 212 145 147 250 262 138 142 169 175 198 200 153 165 192 194 94 100 228 236 129 149Slo03FP09 104 104 208 212 145 151 250 262 142 144 167 171 188 190 159 163 188 196 97 106 228 234 149 153Slo03FP10 84 100 214 222 145 151 236 250 142 146 169 171 192 194 163 169 196 198 88 100 228 228 149 149Slo03FP11 96 100 212 212 145 147 250 266 144 144 171 171 190 194 153 153 188 198 97 100 228 228 149 151Slo03FP12 108 108 208 216 145 151 250 256 146 150 171 173 190 196 153 173 198 198 88 100 220 234 129 149Slo03FP13 96 112 208 222 145 147 250 262 138 144 167 175 190 198 153 165 194 198 94 97 220 234 123 145Slo03FP14 100 104 212 222 145 151 234 250 144 150 167 171 192 198 153 155 190 194 85 88 230 234 149 151Slo03FP15 96 100 208 226 145 147 242 252 144 144 169 171 184 198 173 173 196 200 88 88 216 220 151 153Slo03FP16 96 108 212 212 145 147 250 266 142 144 167 175 176 196 165 169 196 196 94 97 220 220 149 149Slo03FP17 108 112 208 224 145 147 242 250 142 144 171 171 172 198 155 163 198 198 94 103 222 230 149 149Slo03FP18 100 108 208 210 145 145 248 250 138 148 169 171 190 192 157 165 192 196 94 100 220 224 149 149Slo03FP19 108 108 208 208 145 147 236 250 138 142 163 175 192 192 149 153 196 196 88 94 224 228 143 153Slo03FP20 108 108 216 218 145 147 252 266 138 144 171 173 192 198 153 155 196 200 94 100 220 220 143 149Slo03FP21 108 108 208 210 145 141 236 260 138 150 169 169 192 200 151 165 194 196 94 94 224 230 147 149Slo03FP22 104 104 214 222 145 141 246 252 144 150 169 173 176 196 153 165 196 196 88 88 220 234 153 153Slo03FP23 108 112 208 216 145 145 246 252 138 148 169 173 176 198 159 173 198 198 97 97 220 228 149 157Slo03FP24 108 112 208 216 145 145 246 252 138 148 169 173 176 198 159 173 198 198 97 97 220 228 149 157Slo03FP25 108 108 218 222 145 145 242 246 138 146 169 169 196 198 153 159 188 198 82 94 220 220 153 157Slo03FP26 108 108 212 218 145 145 254 256 142 144 157 169 188 202 151 161 194 198 88 97 226 228 149 149Slo03FP27 96 104 214 222 145 147 236 250 138 138 163 175 194 198 149 169 196 198 88 94 220 222 149 149Slo03FP28 96 96 210 216 145 141 254 256 140 146 167 169 192 196 157 163 196 198 88 100 230 236 143 143Slo03FP29 96 100 210 214 145 147 248 252 144 146 163 173 176 194 157 163 196 196 94 97 228 234 149 153Slo03FP30 104 112 210 216 145 147 246 266 144 144 167 171 192 192 179 179 196 200 88 103 220 236 143 167Slo03FP31 100 108 208 214 145 147 236 256 144 150 167 173 192 198 153 169 192 202 88 88 226 232 143 143Slo03FP32 100 108 214 218 145 145 248 248 144 146 171 175 190 190 163 183 196 198 88 106 220 230 127 143Slo03FP33 100 100 208 208 - - 236 246 150 150 169 173 192 194 173 179 188 202 88 97 226 228 143 149Slo03FP34 104 104 214 226 145 147 236 242 138 142 169 171 192 194 153 163 188 196 88 106 216 230 149 151Slo03FP35 88 104 210 222 145 147 242 250 142 144 163 169 190 192 157 163 196 196 94 94 226 230 149 149Slo03FP36 96 100 212 216 145 147 234 248 146 152 169 171 190 192 163 183 198 198 91 94 - - 143 143Slo03FP37 84 92 210 224 145 147 262 268 142 144 169 169 162 176 151 163 194 196 94 94 230 236 143 145Slo03FP38 104 104 214 226 145 147 236 242 138 142 169 171 192 194 153 163 188 196 88 106 216 230 149 151Slo03FP39 100 108 214 218 145 145 248 248 144 146 171 175 190 190 163 183 196 198 88 106 220 230 127 143Slo03FP40 84 96 212 212 145 145 250 260 144 144 173 175 188 194 165 181 196 202 100 100 220 224 141 145Slo03FP41 108 112 208 222 145 147 250 256 140 146 171 175 194 202 153 179 198 200 94 100 220 228 145 149
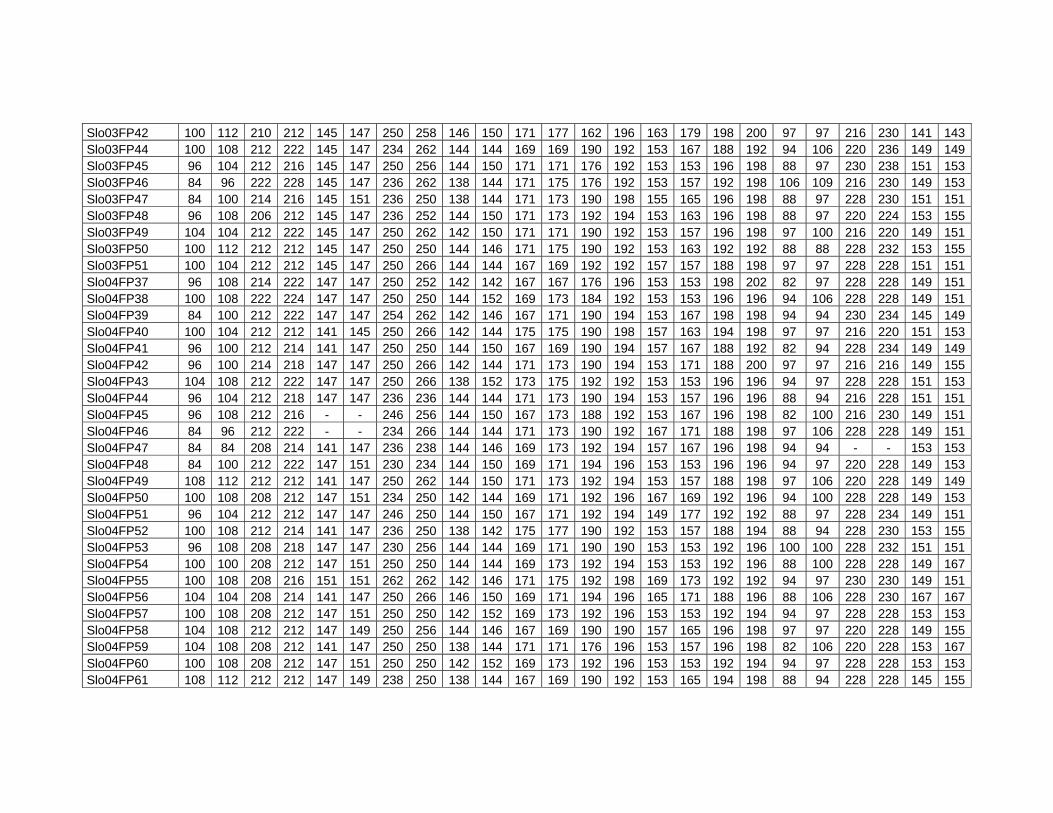
Slo03FP42 100 112 210 212 145 147 250 258 146 150 171 177 162 196 163 179 198 200 97 97 216 230 141 143Slo03FP44 100 108 212 222 145 147 234 262 144 144 169 169 190 192 153 167 188 192 94 106 220 236 149 149Slo03FP45 96 104 212 216 145 147 250 256 144 150 171 171 176 192 153 153 196 198 88 97 230 238 151 153Slo03FP46 84 96 222 228 145 147 236 262 138 144 171 175 176 192 153 157 192 198 106 109 216 230 149 153Slo03FP47 84 100 214 216 145 151 236 250 138 144 171 173 190 198 155 165 196 198 88 97 228 230 151 151Slo03FP48 96 108 206 212 145 147 236 252 144 150 171 173 192 194 153 163 196 198 88 97 220 224 153 155Slo03FP49 104 104 212 222 145 147 250 262 142 150 171 171 190 192 153 157 196 198 97 100 216 220 149 151Slo03FP50 100 112 212 212 145 147 250 250 144 146 171 175 190 192 153 163 192 192 88 88 228 232 153 155Slo03FP51 100 104 212 212 145 147 250 266 144 144 167 169 192 192 157 157 188 198 97 97 228 228 151 151Slo04FP37 96 108 214 222 147 147 250 252 142 142 167 167 176 196 153 153 198 202 82 97 228 228 149 151Slo04FP38 100 108 222 224 147 147 250 250 144 152 169 173 184 192 153 153 196 196 94 106 228 228 149 151Slo04FP39 84 100 212 222 147 147 254 262 142 146 167 171 190 194 153 167 198 198 94 94 230 234 145 149Slo04FP40 100 104 212 212 141 145 250 266 142 144 175 175 190 198 157 163 194 198 97 97 216 220 151 153Slo04FP41 96 100 212 214 141 147 250 250 144 150 167 169 190 194 157 167 188 192 82 94 228 234 149 149Slo04FP42 96 100 214 218 147 147 250 266 142 144 171 173 190 194 153 171 188 200 97 97 216 216 149 155Slo04FP43 104 108 212 222 147 147 250 266 138 152 173 175 192 192 153 153 196 196 94 97 228 228 151 153Slo04FP44 96 104 212 218 147 147 236 236 144 144 171 173 190 194 153 157 196 196 88 94 216 228 151 151Slo04FP45 96 108 212 216 - - 246 256 144 150 167 173 188 192 153 167 196 198 82 100 216 230 149 151Slo04FP46 84 96 212 222 - - 234 266 144 144 171 173 190 192 167 171 188 198 97 106 228 228 149 151Slo04FP47 84 84 208 214 141 147 236 238 144 146 169 173 192 194 157 167 196 198 94 94 - - 153 153Slo04FP48 84 100 212 222 147 151 230 234 144 150 169 171 194 196 153 153 196 196 94 97 220 228 149 153Slo04FP49 108 112 212 212 141 147 250 262 144 150 171 173 192 194 153 157 188 198 97 106 220 228 149 149Slo04FP50 100 108 208 212 147 151 234 250 142 144 169 171 192 196 167 169 192 196 94 100 228 228 149 153Slo04FP51 96 104 212 212 147 147 246 250 144 150 167 171 192 194 149 177 192 192 88 97 228 234 149 151Slo04FP52 100 108 212 214 141 147 236 250 138 142 175 177 190 192 153 157 188 194 88 94 228 230 153 155Slo04FP53 96 108 208 218 147 147 230 256 144 144 169 171 190 190 153 153 192 196 100 100 228 232 151 151Slo04FP54 100 100 208 212 147 151 250 250 144 144 169 173 192 194 153 153 192 196 88 100 228 228 149 167Slo04FP55 100 108 208 216 151 151 262 262 142 146 171 175 192 198 169 173 192 192 94 97 230 230 149 151Slo04FP56 104 104 208 214 141 147 250 266 146 150 169 171 194 196 165 171 188 196 88 106 228 230 167 167Slo04FP57 100 108 208 212 147 151 250 250 142 152 169 173 192 196 153 153 192 194 94 97 228 228 153 153Slo04FP58 104 108 212 212 147 149 250 256 144 146 167 169 190 190 157 165 196 198 97 97 220 228 149 155Slo04FP59 104 108 208 212 141 147 250 250 138 144 171 171 176 196 153 157 196 198 82 106 220 228 153 167Slo04FP60 100 108 208 212 147 151 250 250 142 152 169 173 192 196 153 153 192 194 94 97 228 228 153 153Slo04FP61 108 112 212 212 147 149 238 250 138 144 167 169 190 192 153 165 194 198 88 94 228 228 145 155
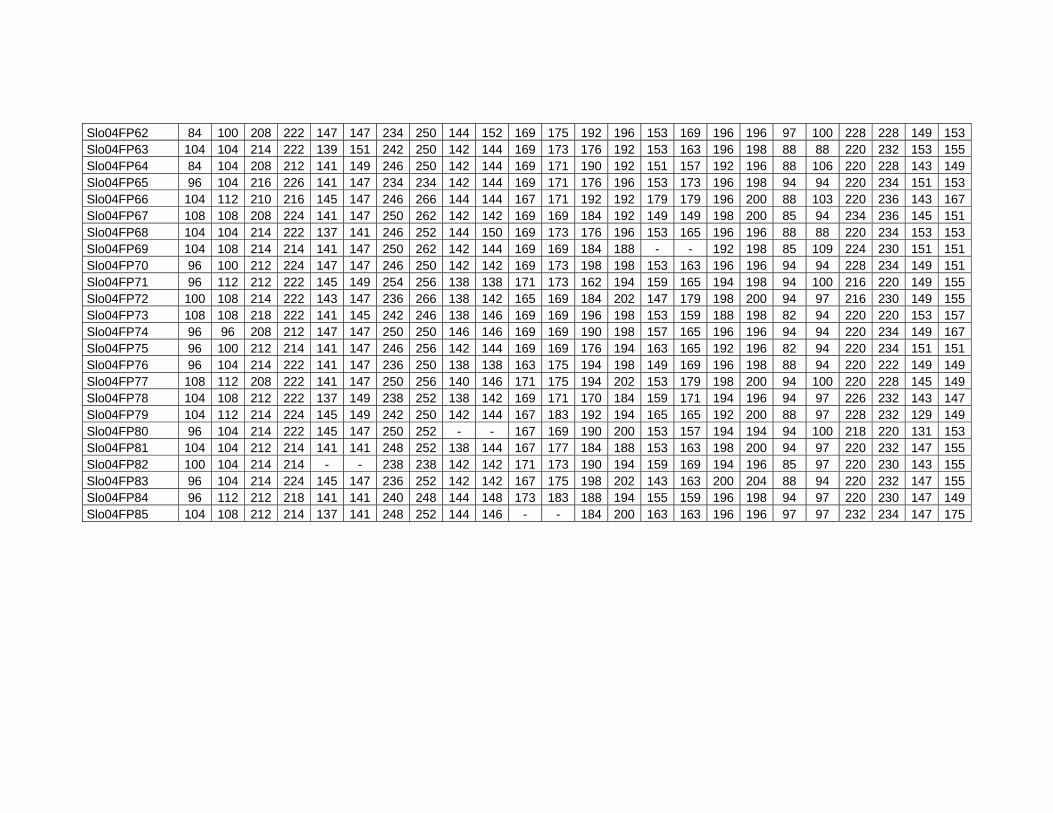
Slo04FP62 84 100 208 222 147 147 234 250 144 152 169 175 192 196 153 169 196 196 97 100 228 228 149 153Slo04FP63 104 104 214 222 139 151 242 250 142 144 169 173 176 192 153 163 196 198 88 88 220 232 153 155Slo04FP64 84 104 208 212 141 149 246 250 142 144 169 171 190 192 151 157 192 196 88 106 220 228 143 149Slo04FP65 96 104 216 226 141 147 234 234 142 144 169 171 176 196 153 173 196 198 94 94 220 234 151 153Slo04FP66 104 112 210 216 145 147 246 266 144 144 167 171 192 192 179 179 196 200 88 103 220 236 143 167Slo04FP67 108 108 208 224 141 147 250 262 142 142 169 169 184 192 149 149 198 200 85 94 234 236 145 151Slo04FP68 104 104 214 222 137 141 246 252 144 150 169 173 176 196 153 165 196 196 88 88 220 234 153 153Slo04FP69 104 108 214 214 141 147 250 262 142 144 169 169 184 188 - - 192 198 85 109 224 230 151 151Slo04FP70 96 100 212 224 147 147 246 250 142 142 169 173 198 198 153 163 196 196 94 94 228 234 149 151Slo04FP71 96 112 212 222 145 149 254 256 138 138 171 173 162 194 159 165 194 198 94 100 216 220 149 155Slo04FP72 100 108 214 222 143 147 236 266 138 142 165 169 184 202 147 179 198 200 94 97 216 230 149 155Slo04FP73 108 108 218 222 141 145 242 246 138 146 169 169 196 198 153 159 188 198 82 94 220 220 153 157Slo04FP74 96 96 208 212 147 147 250 250 146 146 169 169 190 198 157 165 196 196 94 94 220 234 149 167Slo04FP75 96 100 212 214 141 147 246 256 142 144 169 169 176 194 163 165 192 196 82 94 220 234 151 151Slo04FP76 96 104 214 222 141 147 236 250 138 138 163 175 194 198 149 169 196 198 88 94 220 222 149 149Slo04FP77 108 112 208 222 141 147 250 256 140 146 171 175 194 202 153 179 198 200 94 100 220 228 145 149Slo04FP78 104 108 212 222 137 149 238 252 138 142 169 171 170 184 159 171 194 196 94 97 226 232 143 147Slo04FP79 104 112 214 224 145 149 242 250 142 144 167 183 192 194 165 165 192 200 88 97 228 232 129 149Slo04FP80 96 104 214 222 145 147 250 252 - - 167 169 190 200 153 157 194 194 94 100 218 220 131 153Slo04FP81 104 104 212 214 141 141 248 252 138 144 167 177 184 188 153 163 198 200 94 97 220 232 147 155Slo04FP82 100 104 214 214 - - 238 238 142 142 171 173 190 194 159 169 194 196 85 97 220 230 143 155Slo04FP83 96 104 214 224 145 147 236 252 142 142 167 175 198 202 143 163 200 204 88 94 220 232 147 155Slo04FP84 96 112 212 218 141 141 240 248 144 148 173 183 188 194 155 159 196 198 94 97 220 230 147 149Slo04FP85 104 108 212 214 137 141 248 252 144 146 - - 184 200 163 163 196 196 97 97 232 234 147 175

APPENDIX 7 – DATA CHAPTER 3 Chapter 3 Dlp Haplotypes >Haplotype A TAAAAGTAATTTATTTTAAAAACATTTTACTGTACACATCACATATATATATATACGTACACATACCAATATC-TAGTCTTTCCTTATAAATATCTATATATACATGCTATGTATTACTGTGCATTCATTTATTTTCCATACGGTAAGTTAAAGCCCGTATTAATTATCATTAATTTTACATATTACATAATATGTATGCTCTTACATATTATATATCCTCTAACAATTTTACCTCCATTATATCCTATGGTCGCTT-ATATTAGACCACGAGCTTTATCACCATGCCGCGTGAAACCAGCAACCCGCTCGGCAGGGATCCCTCTTCTCGCACCGGGCCCATACACC >Haplotype B TAAAAGTAATTTATTTTAAAAACATTTTACTGTACACATCACATATATGTATATACGTACACATATCAATATC-TAGTCTTTCCTTATAAATATCTATATATACATGCTATGTATTACTGTGCATTCATTTATTTTCCATACGGTAAGTTAAAGCCCGTATTAATTATCATTAATTTTACATATTACATAATATGTATGCTCTTACATATTATATATCCTCTAACAATTTTACCTCCATTATATCCTATGGTCGCTT-ATATTAGACCACGAGCTTTATCACCATGCCGCGTGAAACCAGCAACCCGCTCGGCAGGGATCCCCCTTCTCGCACCGGGCCCATACACC >Haplotype C TAAAAGTAATTTATTTTAAAAACATTTTACTGTACACATCACATATATATATATACGTACACATATCAATATC-TAGTCTTTCCTTATAAATATCTATATATACATGCTATGTATTACTGTGCATTCATTTATTTTCCATACGGTAAGTTAAAGCCCGTATTAATTATCATTAATTTTACATATTACATAATATGTATGCTCTTACATATTATATATCCTCTAACAATTTTACCTCCATTATATCCTATGGTCGCTT-ATATTAGACCACGAGCTTTATCACCATGCCGCGTGAAACCAGCAACCCGCTCGGCAGGGATCCCCCTTCTCGCACCGGGCCCATACACC >Haplotype D TAAAAGTAATTTATTTTAAAAACATTTTACTGTACACATCACATATATATATATACGTACACATACCAATATC-TAGTCTTTCCTTATAAATATCTATATATACATGCTATGTATTACTGTGCATTCATTTATTTTCCATACGGTAAGTTAAAGCCCGTATTAATTATCATTAATTTTACATATTACATAATATGTATGCTCTTACATATTATATATCCTCTAACAATTTTACCTCCATTATATCCTATGGTCGCTT-ATATTAGACCACGAGCTTTATCACCATGCCGCGTGAAACCAGCAACCCGCTCGGCAGGGATCCCTCTTCTCGCACCGGGCCCATATACC >Haplotype E TAAAAGTAATTTATTTTAAAAACATTTTACTGTACACATCACATATATATATATACGTACACATACCAATATC-TAGTCTTTCCTTATAAATATCTATATATACATGCTATGTATTACTGTGCATTCATTTATTTTCCATACGGTAAGTTAAAGCCCGTATTAATTATCATTAATTTTACATATTACATAATATGTATGCTCTTACATATTATATATCCTCTAACAATTTTACTTCCATTATATCCTATGGTCGCTT-ATATTAGACCACGAGCTTTATCACCATGCCGCGTGAAACCAGCAACCCGCTCGGCAGGGATCCCTCTTCTCGCACCGGGCCCATACACC >Haplotype F TAAAAGTAATTTATTTTAAAAACATTTTACTGTACACATCACATATATATATATACGTACACATACCAATATC-TAGTCTTTCCTTATAAATATCTATATATACATGCTATGTATTACTGTGCATTCATTTATTTTCCATACGGTAAGTTAAAGCCCGTATTAATTATCATTAATTTTACATATTACATAATATGTATGCTCTTACATATTATATATCCTCTAACAGTTTTACTTCCATTATATCCTATGGTCGCTT-ATATTAGACCACGAGCTTTATCACCATGCCGCGTGAAACCAGCAACCCGCTCGGCAGGGATCCCTCTTCTCGCACCGGGCCCATACACC >Haplotype G TAAAAGTAATTTATTTTAAAAACATTTTACTGTACACATCACATATATATATATACGTACACATACCAATATC-TAGTCTTTCCTTATAAATATCTATATATACATGCTATGTATTACTGTGCATTCATTTATTTTCCATACGATAAGTTAAAGCCCGTATTAATTATCATTAATTTTACATATTACATAATATGTATGCTCTTACATATTATATATCCTCTAACAATTTTACCTCCATTATATCCTATGGTCGCTT-

ATATTAGACCACGAGCTTTATCACCATGCCGCGTGAAACCAGCAACCCGCTCGGCAGGGATCCCTCTTCTCGCACCGGGCCCATACACC >Haplotype H TAAAAGTAATTTATTTTAAAAACATTTTACTGTACACATCACACATATATATATACGTACACATACCAATATC-TAGTCTTTCCTTATAAATATCTATATATACATGCTATGTATTACTGTGCATTCATTTATTTTCCATACGATAAGTTAAAGCCCGTATTAATTATCATTAATTTTACATATTACATAATATGTATGCTCTTACATATTATATATCCTCTAACAATTTTACCTCCATTATATCCTATGGTCGCTT-ATATTAGACCACGAGCTTTATCACCATGCCGCGTGAAACCAGCAACCCGCTCGGCAGGGATCCCTCTTCTCGCACCGGGCCCATACACC >Haplotype I TAAAAGTAATTTATTTTAAAAACATTTTACTGTACACATCACATATATATATATACGTACACATACCAATATC-TAGTCTTTCCTTATAAATATCTATATATACATGCTATGTATTACTGTGCATTCATTTATTTTCCATACGATAAGTTAAAGCCCGTATTAATTATCATTAATTTTACATATTACATAATATGTATGCTCTTACATATTATATATCCCCTAACAATTTTACCTCCATTATATCCTATGGTCGCTT-ATATTAGACCACGAGCTTTATCACCATGCCGCGTGAAACCAGCAACCCGCTCGGCAGGGATCCCTCTTCTCGCACCGGGCCCATACACC >Haplotype J TAAAAGTAATTTATTTTAAAAACATTTTACTGTACACATCACATATATATATATACGTACACATACCAATATC-TAGTCTTTCCTTATAAATATCTATATATACATGCTATGTATTATTGTGCATTCATTTATTTTCCATACGATAAGTTAAAGCCCGTATTAATTATCATTAATTTTACATATTACATAATATGTATGCTCTTACATATTATATATCCCCTAACAATTTTACCTCCATTATATCCTATGGTCGCTT-ATATTAGACCACGAGCTTTATCACCATGCCGCGTGAAACCAGCAACCCGCTCGGCAGGGATCCCTCTTCTCGCACCGGGCCCATACACC >Haplotype K TAAAAGTAATTTATTTTAAAAACATTTTACTGTACACATCACATATATATATATACGTACACATACCAATATC-TAGTCTTTCCTTATAAATATCTATATATACATGCTATGTATTACTGTGCATTCATTTATTTTCCATACGATAAGTTAAAGCTCGTATTAATTATCATTAATTTTACATATTACATAATATGTATGCTCTTACATATTATATATCCCCTAACAATTTTACCTCCATTATATCCTATGGTCGCTT-ATATTAGACCACGAGCTTTATCACCATGCCGCGTGAAACCAGCAACCCGCTCGGCAGGGATCCCTCTTCTCGCACCGGGCCCATACACC >Haplotype L TAAAAGTAATTTATTTTAAAAACATTTTACTGTACACATCACATATATATATATACGTACACATACCAATATC-TAGTCTTTCCTTATAAATATCTATATATACATGCTATGTATTATTGTGCATTCATTTATTTTCCATACGATAAGTTAAAGCTCGTATTAATTATCATTAATTTTACATATTACATAATATGTATGCTCTTACATATTATATATCCCCTAACAATTTTACCTCCATTATATCCTATGGTCGCTT-ATATTAGACCACGAGCTTTATCACCATGCCGCGTGAAACCAGCAACCCGCTCGGCAGGGATCCCTCTTCTCGCACCGGGCCCATTCACC >Haplotype M TAAAAGTAATTTATTTTAAAAACATTTTACTGTACACATCACATATATATATATACGTACACATACCAATATC-TAGTCTTTCCTTATAAATATCTATATATACATGCTATGTATTACTGTGCATTCATTTATTTTCCATACGATAAGTTAAAGCTCGTATTAATTATCATTAATTTTACATATTACATAATATGTATGCTCTTACATATTATATATCCCCTAACAATTTTACCTCCATTATATCCTATGGTCGCTT-ATATTAGACCACGAGCTTTATCACCATGCCGCGTGAAACCAGCAACCCGCTCGGCAGGGATCCCTCTTCTCGCACCGGGCCCATTCACC >Haplotype N TAAAAGTAATTTATTTTAAAAACATTTTACTGTACACATCACATATATATATATACGTACACATACCAATATC-TAGTCTTTCCTTATAAATATCTATATATACATGCTATGTATTACTGTGCATTCATTTATTTTCCATACGATAAGTTAAAGCCCGTATTAATTATCATTAATTTTACATATTACATAATATGTATGCTCTTACATATTATATATCCCCTAACAATTTTATCTCCATTATATCCTATGGTCGCTT-ATATTAGACCACGAGCTTTATCACCATGCCGCGTGAAACCAGCAACCCGCTCGGCAGGGATCCCTCTTCTCGCACCGGGCCCATACACC >Haplotype O
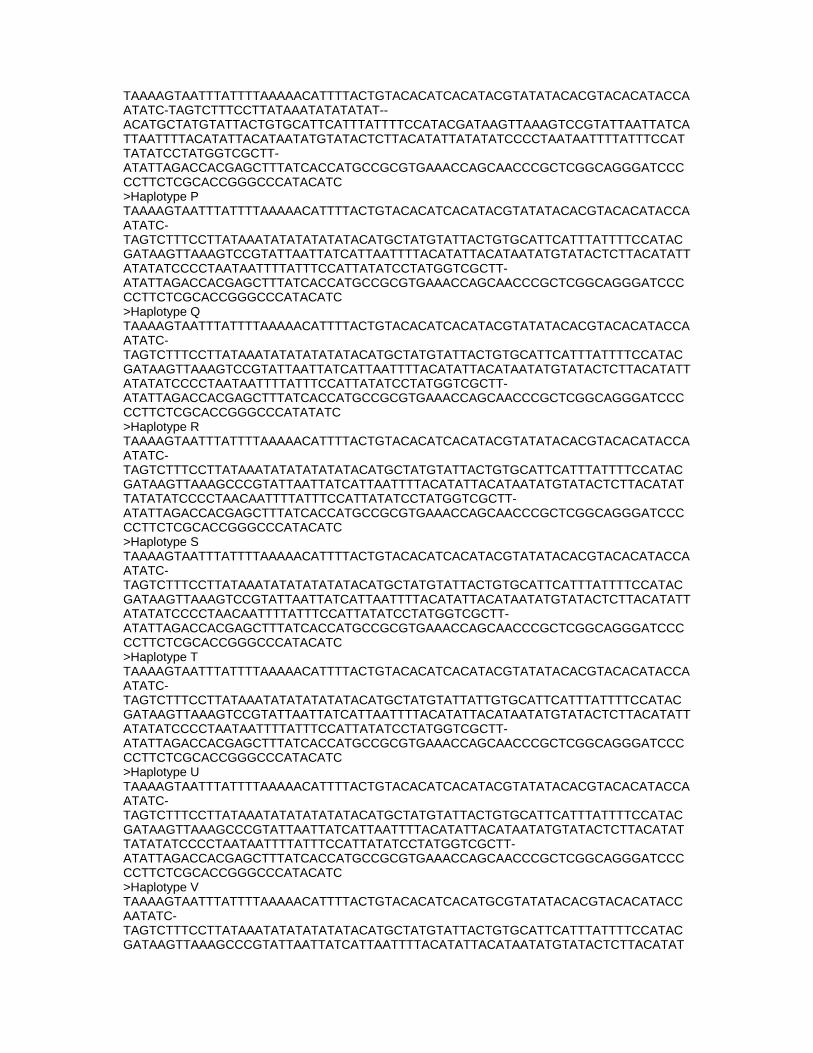
TAAAAGTAATTTATTTTAAAAACATTTTACTGTACACATCACATACGTATATACACGTACACATACCAATATC-TAGTCTTTCCTTATAAATATATATAT--ACATGCTATGTATTACTGTGCATTCATTTATTTTCCATACGATAAGTTAAAGTCCGTATTAATTATCATTAATTTTACATATTACATAATATGTATACTCTTACATATTATATATCCCCTAATAATTTTATTTCCATTATATCCTATGGTCGCTT-ATATTAGACCACGAGCTTTATCACCATGCCGCGTGAAACCAGCAACCCGCTCGGCAGGGATCCCCCTTCTCGCACCGGGCCCATACATC >Haplotype P TAAAAGTAATTTATTTTAAAAACATTTTACTGTACACATCACATACGTATATACACGTACACATACCAATATC-TAGTCTTTCCTTATAAATATATATATATACATGCTATGTATTACTGTGCATTCATTTATTTTCCATACGATAAGTTAAAGTCCGTATTAATTATCATTAATTTTACATATTACATAATATGTATACTCTTACATATTATATATCCCCTAATAATTTTATTTCCATTATATCCTATGGTCGCTT-ATATTAGACCACGAGCTTTATCACCATGCCGCGTGAAACCAGCAACCCGCTCGGCAGGGATCCCCCTTCTCGCACCGGGCCCATACATC >Haplotype Q TAAAAGTAATTTATTTTAAAAACATTTTACTGTACACATCACATACGTATATACACGTACACATACCAATATC-TAGTCTTTCCTTATAAATATATATATATACATGCTATGTATTACTGTGCATTCATTTATTTTCCATACGATAAGTTAAAGTCCGTATTAATTATCATTAATTTTACATATTACATAATATGTATACTCTTACATATTATATATCCCCTAATAATTTTATTTCCATTATATCCTATGGTCGCTT-ATATTAGACCACGAGCTTTATCACCATGCCGCGTGAAACCAGCAACCCGCTCGGCAGGGATCCCCCTTCTCGCACCGGGCCCATATATC >Haplotype R TAAAAGTAATTTATTTTAAAAACATTTTACTGTACACATCACATACGTATATACACGTACACATACCAATATC-TAGTCTTTCCTTATAAATATATATATATACATGCTATGTATTACTGTGCATTCATTTATTTTCCATACGATAAGTTAAAGCCCGTATTAATTATCATTAATTTTACATATTACATAATATGTATACTCTTACATATTATATATCCCCTAACAATTTTATTTCCATTATATCCTATGGTCGCTT-ATATTAGACCACGAGCTTTATCACCATGCCGCGTGAAACCAGCAACCCGCTCGGCAGGGATCCCCCTTCTCGCACCGGGCCCATACATC >Haplotype S TAAAAGTAATTTATTTTAAAAACATTTTACTGTACACATCACATACGTATATACACGTACACATACCAATATC-TAGTCTTTCCTTATAAATATATATATATACATGCTATGTATTACTGTGCATTCATTTATTTTCCATACGATAAGTTAAAGTCCGTATTAATTATCATTAATTTTACATATTACATAATATGTATACTCTTACATATTATATATCCCCTAACAATTTTATTTCCATTATATCCTATGGTCGCTT-ATATTAGACCACGAGCTTTATCACCATGCCGCGTGAAACCAGCAACCCGCTCGGCAGGGATCCCCCTTCTCGCACCGGGCCCATACATC >Haplotype T TAAAAGTAATTTATTTTAAAAACATTTTACTGTACACATCACATACGTATATACACGTACACATACCAATATC-TAGTCTTTCCTTATAAATATATATATATACATGCTATGTATTATTGTGCATTCATTTATTTTCCATACGATAAGTTAAAGTCCGTATTAATTATCATTAATTTTACATATTACATAATATGTATACTCTTACATATTATATATCCCCTAATAATTTTATTTCCATTATATCCTATGGTCGCTT-ATATTAGACCACGAGCTTTATCACCATGCCGCGTGAAACCAGCAACCCGCTCGGCAGGGATCCCCCTTCTCGCACCGGGCCCATACATC >Haplotype U TAAAAGTAATTTATTTTAAAAACATTTTACTGTACACATCACATACGTATATACACGTACACATACCAATATC-TAGTCTTTCCTTATAAATATATATATATACATGCTATGTATTACTGTGCATTCATTTATTTTCCATACGATAAGTTAAAGCCCGTATTAATTATCATTAATTTTACATATTACATAATATGTATACTCTTACATATTATATATCCCCTAATAATTTTATTTCCATTATATCCTATGGTCGCTT-ATATTAGACCACGAGCTTTATCACCATGCCGCGTGAAACCAGCAACCCGCTCGGCAGGGATCCCCCTTCTCGCACCGGGCCCATACATC >Haplotype V TAAAAGTAATTTATTTTAAAAACATTTTACTGTACACATCACATGCGTATATACACGTACACATACCAATATC-TAGTCTTTCCTTATAAATATATATATATACATGCTATGTATTACTGTGCATTCATTTATTTTCCATACGATAAGTTAAAGCCCGTATTAATTATCATTAATTTTACATATTACATAATATGTATACTCTTACATAT
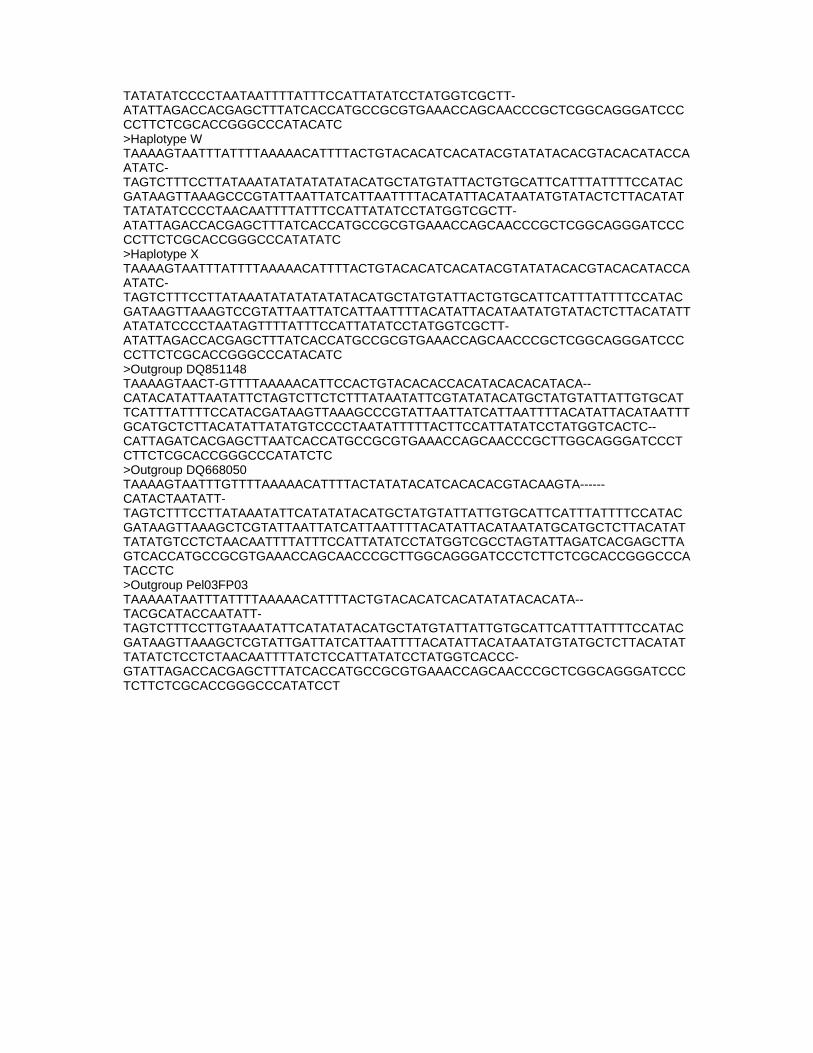
TATATATCCCCTAATAATTTTATTTCCATTATATCCTATGGTCGCTT-ATATTAGACCACGAGCTTTATCACCATGCCGCGTGAAACCAGCAACCCGCTCGGCAGGGATCCCCCTTCTCGCACCGGGCCCATACATC >Haplotype W TAAAAGTAATTTATTTTAAAAACATTTTACTGTACACATCACATACGTATATACACGTACACATACCAATATC-TAGTCTTTCCTTATAAATATATATATATACATGCTATGTATTACTGTGCATTCATTTATTTTCCATACGATAAGTTAAAGCCCGTATTAATTATCATTAATTTTACATATTACATAATATGTATACTCTTACATATTATATATCCCCTAACAATTTTATTTCCATTATATCCTATGGTCGCTT-ATATTAGACCACGAGCTTTATCACCATGCCGCGTGAAACCAGCAACCCGCTCGGCAGGGATCCCCCTTCTCGCACCGGGCCCATATATC >Haplotype X TAAAAGTAATTTATTTTAAAAACATTTTACTGTACACATCACATACGTATATACACGTACACATACCAATATC-TAGTCTTTCCTTATAAATATATATATATACATGCTATGTATTACTGTGCATTCATTTATTTTCCATACGATAAGTTAAAGTCCGTATTAATTATCATTAATTTTACATATTACATAATATGTATACTCTTACATATTATATATCCCCTAATAGTTTTATTTCCATTATATCCTATGGTCGCTT-ATATTAGACCACGAGCTTTATCACCATGCCGCGTGAAACCAGCAACCCGCTCGGCAGGGATCCCCCTTCTCGCACCGGGCCCATACATC >Outgroup DQ851148 TAAAAGTAACT-GTTTTAAAAACATTCCACTGTACACACCACATACACACATACA--CATACATATTAATATTCTAGTCTTCTCTTTATAATATTCGTATATACATGCTATGTATTATTGTGCATTCATTTATTTTCCATACGATAAGTTAAAGCCCGTATTAATTATCATTAATTTTACATATTACATAATTTGCATGCTCTTACATATTATATGTCCCCTAATATTTTTACTTCCATTATATCCTATGGTCACTC--CATTAGATCACGAGCTTAATCACCATGCCGCGTGAAACCAGCAACCCGCTTGGCAGGGATCCCTCTTCTCGCACCGGGCCCATATCTC >Outgroup DQ668050 TAAAAGTAATTTGTTTTAAAAACATTTTACTATATACATCACACACGTACAAGTA------CATACTAATATT-TAGTCTTTCCTTATAAATATTCATATATACATGCTATGTATTATTGTGCATTCATTTATTTTCCATACGATAAGTTAAAGCTCGTATTAATTATCATTAATTTTACATATTACATAATATGCATGCTCTTACATATTATATGTCCTCTAACAATTTTATTTCCATTATATCCTATGGTCGCCTAGTATTAGATCACGAGCTTAGTCACCATGCCGCGTGAAACCAGCAACCCGCTTGGCAGGGATCCCTCTTCTCGCACCGGGCCCATACCTC >Outgroup Pel03FP03 TAAAAATAATTTATTTTAAAAACATTTTACTGTACACATCACATATATACACATA--TACGCATACCAATATT-TAGTCTTTCCTTGTAAATATTCATATATACATGCTATGTATTATTGTGCATTCATTTATTTTCCATACGATAAGTTAAAGCTCGTATTGATTATCATTAATTTTACATATTACATAATATGTATGCTCTTACATATTATATCTCCTCTAACAATTTTATCTCCATTATATCCTATGGTCACCC-GTATTAGACCACGAGCTTTATCACCATGCCGCGTGAAACCAGCAACCCGCTCGGCAGGGATCCCTCTTCTCGCACCGGGCCCATATCCT
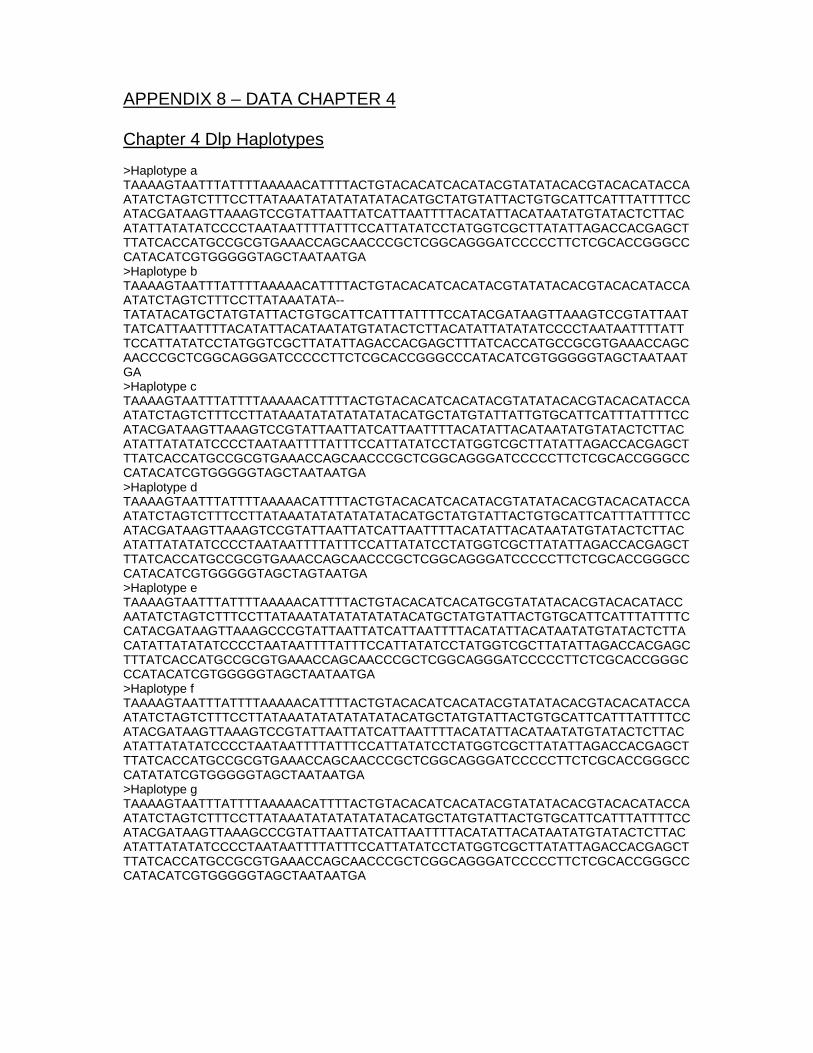
APPENDIX 8 – DATA CHAPTER 4 Chapter 4 Dlp Haplotypes >Haplotype a TAAAAGTAATTTATTTTAAAAACATTTTACTGTACACATCACATACGTATATACACGTACACATACCAATATCTAGTCTTTCCTTATAAATATATATATATACATGCTATGTATTACTGTGCATTCATTTATTTTCCATACGATAAGTTAAAGTCCGTATTAATTATCATTAATTTTACATATTACATAATATGTATACTCTTACATATTATATATCCCCTAATAATTTTATTTCCATTATATCCTATGGTCGCTTATATTAGACCACGAGCTTTATCACCATGCCGCGTGAAACCAGCAACCCGCTCGGCAGGGATCCCCCTTCTCGCACCGGGCCCATACATCGTGGGGGTAGCTAATAATGA >Haplotype b TAAAAGTAATTTATTTTAAAAACATTTTACTGTACACATCACATACGTATATACACGTACACATACCAATATCTAGTCTTTCCTTATAAATATA--TATATACATGCTATGTATTACTGTGCATTCATTTATTTTCCATACGATAAGTTAAAGTCCGTATTAATTATCATTAATTTTACATATTACATAATATGTATACTCTTACATATTATATATCCCCTAATAATTTTATTTCCATTATATCCTATGGTCGCTTATATTAGACCACGAGCTTTATCACCATGCCGCGTGAAACCAGCAACCCGCTCGGCAGGGATCCCCCTTCTCGCACCGGGCCCATACATCGTGGGGGTAGCTAATAATGA >Haplotype c TAAAAGTAATTTATTTTAAAAACATTTTACTGTACACATCACATACGTATATACACGTACACATACCAATATCTAGTCTTTCCTTATAAATATATATATATACATGCTATGTATTATTGTGCATTCATTTATTTTCCATACGATAAGTTAAAGTCCGTATTAATTATCATTAATTTTACATATTACATAATATGTATACTCTTACATATTATATATCCCCTAATAATTTTATTTCCATTATATCCTATGGTCGCTTATATTAGACCACGAGCTTTATCACCATGCCGCGTGAAACCAGCAACCCGCTCGGCAGGGATCCCCCTTCTCGCACCGGGCCCATACATCGTGGGGGTAGCTAATAATGA >Haplotype d TAAAAGTAATTTATTTTAAAAACATTTTACTGTACACATCACATACGTATATACACGTACACATACCAATATCTAGTCTTTCCTTATAAATATATATATATACATGCTATGTATTACTGTGCATTCATTTATTTTCCATACGATAAGTTAAAGTCCGTATTAATTATCATTAATTTTACATATTACATAATATGTATACTCTTACATATTATATATCCCCTAATAATTTTATTTCCATTATATCCTATGGTCGCTTATATTAGACCACGAGCTTTATCACCATGCCGCGTGAAACCAGCAACCCGCTCGGCAGGGATCCCCCTTCTCGCACCGGGCCCATACATCGTGGGGGTAGCTAGTAATGA >Haplotype e TAAAAGTAATTTATTTTAAAAACATTTTACTGTACACATCACATGCGTATATACACGTACACATACCAATATCTAGTCTTTCCTTATAAATATATATATATACATGCTATGTATTACTGTGCATTCATTTATTTTCCATACGATAAGTTAAAGCCCGTATTAATTATCATTAATTTTACATATTACATAATATGTATACTCTTACATATTATATATCCCCTAATAATTTTATTTCCATTATATCCTATGGTCGCTTATATTAGACCACGAGCTTTATCACCATGCCGCGTGAAACCAGCAACCCGCTCGGCAGGGATCCCCCTTCTCGCACCGGGCCCATACATCGTGGGGGTAGCTAATAATGA >Haplotype f TAAAAGTAATTTATTTTAAAAACATTTTACTGTACACATCACATACGTATATACACGTACACATACCAATATCTAGTCTTTCCTTATAAATATATATATATACATGCTATGTATTACTGTGCATTCATTTATTTTCCATACGATAAGTTAAAGTCCGTATTAATTATCATTAATTTTACATATTACATAATATGTATACTCTTACATATTATATATCCCCTAATAATTTTATTTCCATTATATCCTATGGTCGCTTATATTAGACCACGAGCTTTATCACCATGCCGCGTGAAACCAGCAACCCGCTCGGCAGGGATCCCCCTTCTCGCACCGGGCCCATATATCGTGGGGGTAGCTAATAATGA >Haplotype g TAAAAGTAATTTATTTTAAAAACATTTTACTGTACACATCACATACGTATATACACGTACACATACCAATATCTAGTCTTTCCTTATAAATATATATATATACATGCTATGTATTACTGTGCATTCATTTATTTTCCATACGATAAGTTAAAGCCCGTATTAATTATCATTAATTTTACATATTACATAATATGTATACTCTTACATATTATATATCCCCTAATAATTTTATTTCCATTATATCCTATGGTCGCTTATATTAGACCACGAGCTTTATCACCATGCCGCGTGAAACCAGCAACCCGCTCGGCAGGGATCCCCCTTCTCGCACCGGGCCCATACATCGTGGGGGTAGCTAATAATGA
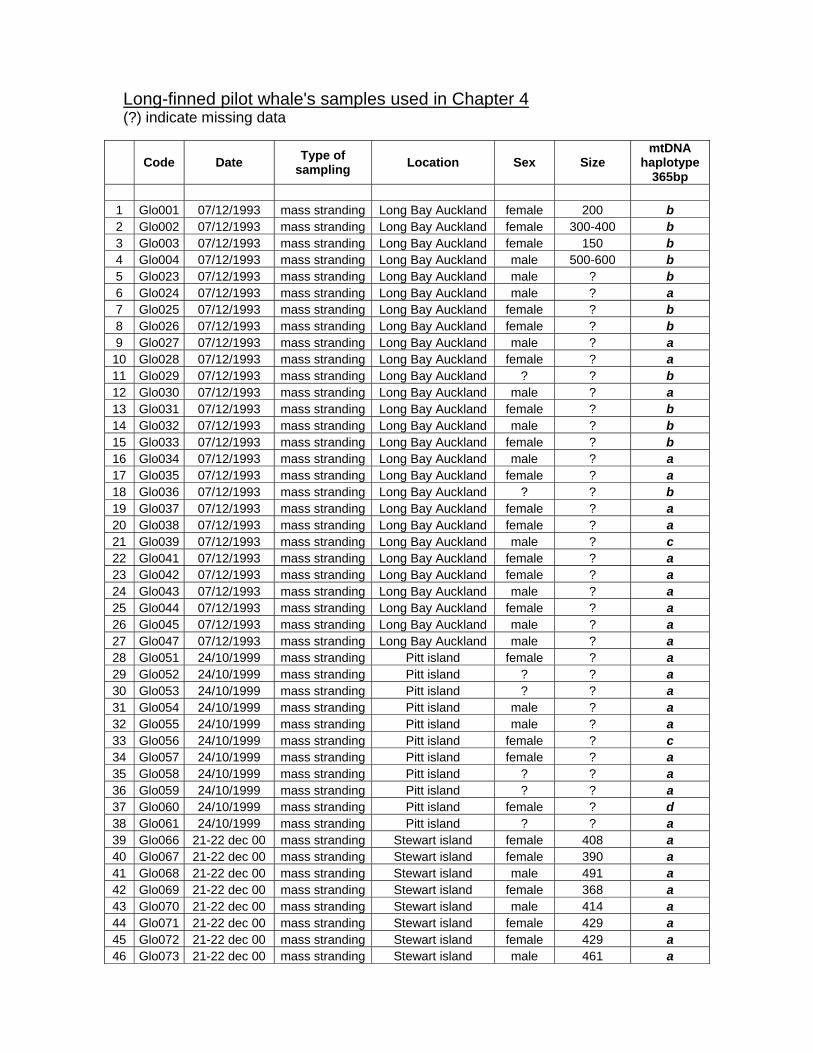
Long-finned pilot whale's samples used in Chapter 4 (?) indicate missing data
Code Date Type of sampling Location Sex Size
mtDNA haplotype
365bp 1 Glo001 07/12/1993 mass stranding Long Bay Auckland female 200 b 2 Glo002 07/12/1993 mass stranding Long Bay Auckland female 300-400 b 3 Glo003 07/12/1993 mass stranding Long Bay Auckland female 150 b 4 Glo004 07/12/1993 mass stranding Long Bay Auckland male 500-600 b 5 Glo023 07/12/1993 mass stranding Long Bay Auckland male ? b 6 Glo024 07/12/1993 mass stranding Long Bay Auckland male ? a 7 Glo025 07/12/1993 mass stranding Long Bay Auckland female ? b 8 Glo026 07/12/1993 mass stranding Long Bay Auckland female ? b 9 Glo027 07/12/1993 mass stranding Long Bay Auckland male ? a 10 Glo028 07/12/1993 mass stranding Long Bay Auckland female ? a 11 Glo029 07/12/1993 mass stranding Long Bay Auckland ? ? b 12 Glo030 07/12/1993 mass stranding Long Bay Auckland male ? a 13 Glo031 07/12/1993 mass stranding Long Bay Auckland female ? b 14 Glo032 07/12/1993 mass stranding Long Bay Auckland male ? b 15 Glo033 07/12/1993 mass stranding Long Bay Auckland female ? b 16 Glo034 07/12/1993 mass stranding Long Bay Auckland male ? a 17 Glo035 07/12/1993 mass stranding Long Bay Auckland female ? a 18 Glo036 07/12/1993 mass stranding Long Bay Auckland ? ? b 19 Glo037 07/12/1993 mass stranding Long Bay Auckland female ? a 20 Glo038 07/12/1993 mass stranding Long Bay Auckland female ? a 21 Glo039 07/12/1993 mass stranding Long Bay Auckland male ? c 22 Glo041 07/12/1993 mass stranding Long Bay Auckland female ? a 23 Glo042 07/12/1993 mass stranding Long Bay Auckland female ? a 24 Glo043 07/12/1993 mass stranding Long Bay Auckland male ? a 25 Glo044 07/12/1993 mass stranding Long Bay Auckland female ? a 26 Glo045 07/12/1993 mass stranding Long Bay Auckland male ? a 27 Glo047 07/12/1993 mass stranding Long Bay Auckland male ? a 28 Glo051 24/10/1999 mass stranding Pitt island female ? a 29 Glo052 24/10/1999 mass stranding Pitt island ? ? a 30 Glo053 24/10/1999 mass stranding Pitt island ? ? a 31 Glo054 24/10/1999 mass stranding Pitt island male ? a 32 Glo055 24/10/1999 mass stranding Pitt island male ? a 33 Glo056 24/10/1999 mass stranding Pitt island female ? c 34 Glo057 24/10/1999 mass stranding Pitt island female ? a 35 Glo058 24/10/1999 mass stranding Pitt island ? ? a 36 Glo059 24/10/1999 mass stranding Pitt island ? ? a 37 Glo060 24/10/1999 mass stranding Pitt island female ? d 38 Glo061 24/10/1999 mass stranding Pitt island ? ? a 39 Glo066 21-22 dec 00 mass stranding Stewart island female 408 a 40 Glo067 21-22 dec 00 mass stranding Stewart island female 390 a 41 Glo068 21-22 dec 00 mass stranding Stewart island male 491 a 42 Glo069 21-22 dec 00 mass stranding Stewart island female 368 a 43 Glo070 21-22 dec 00 mass stranding Stewart island male 414 a 44 Glo071 21-22 dec 00 mass stranding Stewart island female 429 a 45 Glo072 21-22 dec 00 mass stranding Stewart island female 429 a 46 Glo073 21-22 dec 00 mass stranding Stewart island male 461 a

47 Glo074 21-22 dec 00 mass stranding Stewart island female 433 a 48 Glo075 21-22 dec 00 mass stranding Stewart island female 440 a 49 Glo076 21-22 dec 00 mass stranding Stewart island male 443 g 50 Glo077 21-22 dec 00 mass stranding Stewart island female 420 a 51 Glo078 21-22 dec 00 mass stranding Stewart island female 437 a 52 Glo079 21-22 dec 00 mass stranding Stewart island male 529 a 53 Glo080 21-22 dec 00 mass stranding Stewart island male 476 a 54 Glo081 21-22 dec 00 mass stranding Stewart island female 430 a 55 Glo082 21-22 dec 00 mass stranding Stewart island female 447 a 56 Glo083 21-22 dec 00 mass stranding Stewart island female 403 a 57 Glo084 21-22 dec 00 mass stranding Stewart island female 385 a 58 Glo085 21-22 dec 00 mass stranding Stewart island male 448 a 59 Glo090 08/01/2003 mass stranding Stewart island male 380 a 60 Glo091 08/01/2003 mass stranding Stewart island female 420 a 61 Glo092 08/01/2003 mass stranding Stewart island female 420 a 62 Glo093 08/01/2003 mass stranding Stewart island male 370 a 63 Glo094 08/01/2003 mass stranding Stewart island male 410 a 64 Glo095 08/01/2003 mass stranding Stewart island female 430 a 65 Glo096 08/01/2003 mass stranding Stewart island male 520 a 66 Glo097 08/01/2003 mass stranding Stewart island male 150 a 67 Glo098 08/01/2003 mass stranding Stewart island female 430 a 68 Glo099 08/01/2003 mass stranding Stewart island female 370 a 69 Glo100 08/01/2003 mass stranding Stewart island female 410 a 70 Glo101 08/01/2003 mass stranding Stewart island female 390 a 71 Glo102 08/01/2003 mass stranding Stewart island male 480 a 72 Glo103 08/01/2003 mass stranding Stewart island female 380 a 73 Glo104 08/01/2003 mass stranding Stewart island male 420 a 74 Glo105 08/01/2003 mass stranding Stewart island male 420 a 75 Glo106 08/01/2003 mass stranding Stewart island female 190 a 76 Glo107 08/01/2003 mass stranding Stewart island female 420 a 77 Glo108 08/01/2003 mass stranding Stewart island female 420 a 78 Glo109 08/01/2003 mass stranding Stewart island female 390 a 79 Glo110 08/01/2003 mass stranding Stewart island male 380 a 80 Glo111 08/01/2003 mass stranding Stewart island male 330 a 81 Glo112 08/01/2003 mass stranding Stewart island female 270 a 82 Glo113 08/01/2003 mass stranding Stewart island female 330 a 83 Glo114 08/01/2003 mass stranding Stewart island male 550 a 84 Glo115 08/01/2003 mass stranding Stewart island female 220 a 85 Glo116 08/01/2003 mass stranding Stewart island female 280 a 86 Glo117 08/01/2003 mass stranding Stewart island female 430 a 87 Glo118 08/01/2003 mass stranding Stewart island male 550 a 88 Glo119 08/01/2003 mass stranding Stewart island male 490 a 89 Glo120 08/01/2003 mass stranding Stewart island female 330 a 90 Glo121 08/01/2003 mass stranding Stewart island male 540 a 91 Glo122 08/01/2003 mass stranding Stewart island male 500 a 92 Glo123 08/01/2003 mass stranding Stewart island female ? a 93 Glo124 08/01/2003 mass stranding Stewart island female 440 a 94 Glo125 08/01/2003 mass stranding Stewart island male 260 a 95 Glo126 08/01/2003 mass stranding Stewart island female 450 a 96 Glo127 08/01/2003 mass stranding Stewart island male 310 a 97 Glo128 08/01/2003 mass stranding Stewart island female 450 a 98 Glo129 08/01/2003 mass stranding Stewart island female 410 a
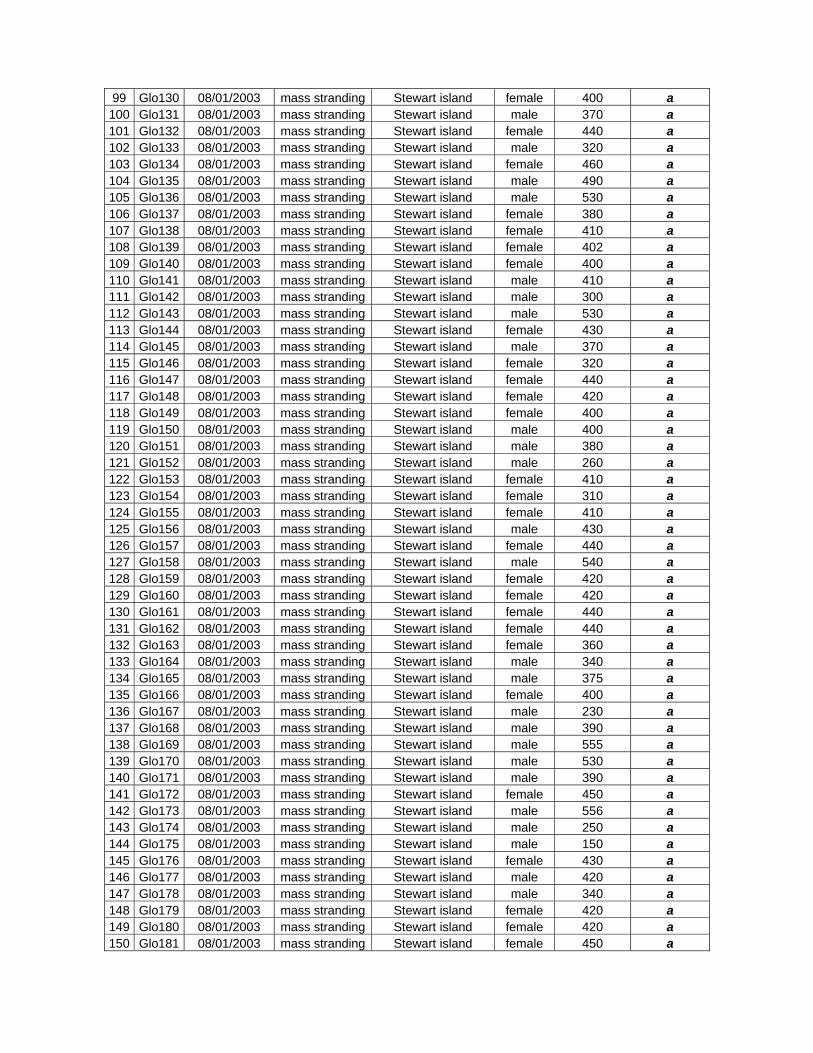
99 Glo130 08/01/2003 mass stranding Stewart island female 400 a 100 Glo131 08/01/2003 mass stranding Stewart island male 370 a 101 Glo132 08/01/2003 mass stranding Stewart island female 440 a 102 Glo133 08/01/2003 mass stranding Stewart island male 320 a 103 Glo134 08/01/2003 mass stranding Stewart island female 460 a 104 Glo135 08/01/2003 mass stranding Stewart island male 490 a 105 Glo136 08/01/2003 mass stranding Stewart island male 530 a 106 Glo137 08/01/2003 mass stranding Stewart island female 380 a 107 Glo138 08/01/2003 mass stranding Stewart island female 410 a 108 Glo139 08/01/2003 mass stranding Stewart island female 402 a 109 Glo140 08/01/2003 mass stranding Stewart island female 400 a 110 Glo141 08/01/2003 mass stranding Stewart island male 410 a 111 Glo142 08/01/2003 mass stranding Stewart island male 300 a 112 Glo143 08/01/2003 mass stranding Stewart island male 530 a 113 Glo144 08/01/2003 mass stranding Stewart island female 430 a 114 Glo145 08/01/2003 mass stranding Stewart island male 370 a 115 Glo146 08/01/2003 mass stranding Stewart island female 320 a 116 Glo147 08/01/2003 mass stranding Stewart island female 440 a 117 Glo148 08/01/2003 mass stranding Stewart island female 420 a 118 Glo149 08/01/2003 mass stranding Stewart island female 400 a 119 Glo150 08/01/2003 mass stranding Stewart island male 400 a 120 Glo151 08/01/2003 mass stranding Stewart island male 380 a 121 Glo152 08/01/2003 mass stranding Stewart island male 260 a 122 Glo153 08/01/2003 mass stranding Stewart island female 410 a 123 Glo154 08/01/2003 mass stranding Stewart island female 310 a 124 Glo155 08/01/2003 mass stranding Stewart island female 410 a 125 Glo156 08/01/2003 mass stranding Stewart island male 430 a 126 Glo157 08/01/2003 mass stranding Stewart island female 440 a 127 Glo158 08/01/2003 mass stranding Stewart island male 540 a 128 Glo159 08/01/2003 mass stranding Stewart island female 420 a 129 Glo160 08/01/2003 mass stranding Stewart island female 420 a 130 Glo161 08/01/2003 mass stranding Stewart island female 440 a 131 Glo162 08/01/2003 mass stranding Stewart island female 440 a 132 Glo163 08/01/2003 mass stranding Stewart island female 360 a 133 Glo164 08/01/2003 mass stranding Stewart island male 340 a 134 Glo165 08/01/2003 mass stranding Stewart island male 375 a 135 Glo166 08/01/2003 mass stranding Stewart island female 400 a 136 Glo167 08/01/2003 mass stranding Stewart island male 230 a 137 Glo168 08/01/2003 mass stranding Stewart island male 390 a 138 Glo169 08/01/2003 mass stranding Stewart island male 555 a 139 Glo170 08/01/2003 mass stranding Stewart island male 530 a 140 Glo171 08/01/2003 mass stranding Stewart island male 390 a 141 Glo172 08/01/2003 mass stranding Stewart island female 450 a 142 Glo173 08/01/2003 mass stranding Stewart island male 556 a 143 Glo174 08/01/2003 mass stranding Stewart island male 250 a 144 Glo175 08/01/2003 mass stranding Stewart island male 150 a 145 Glo176 08/01/2003 mass stranding Stewart island female 430 a 146 Glo177 08/01/2003 mass stranding Stewart island male 420 a 147 Glo178 08/01/2003 mass stranding Stewart island male 340 a 148 Glo179 08/01/2003 mass stranding Stewart island female 420 a 149 Glo180 08/01/2003 mass stranding Stewart island female 420 a 150 Glo181 08/01/2003 mass stranding Stewart island female 450 a

151 Glo182 08/01/2003 mass stranding Stewart island female 160 a 152 Glo183 08/01/2003 mass stranding Stewart island female 400 a 153 Glo184 08/01/2003 mass stranding Stewart island female 410 a 154 Glo185 08/01/2003 mass stranding Stewart island female 370 a 155 Glo186 08/01/2003 mass stranding Stewart island female 370 a 156 Glo187 08/01/2003 mass stranding Stewart island female 380 a 157 Glo188 08/01/2003 mass stranding Stewart island male 410 a 158 Glo189 08/01/2003 mass stranding Stewart island female 360 a 159 Glo190 08/01/2003 mass stranding Stewart island female 440 a 160 Glo191 08/01/2003 mass stranding Stewart island female 440 a 161 Glo192 08/01/2003 mass stranding Stewart island female 450 a 162 Glo193 08/01/2003 mass stranding Stewart island female 430 a 163 Glo194 08/01/2003 mass stranding Stewart island female 320 a 164 Glo195 08/01/2003 mass stranding Stewart island female 430 a 165 Glo196 08/01/2003 mass stranding Stewart island female 450 a 166 Glo197 08/01/2003 mass stranding Stewart island female 380 a 167 Glo198 08/01/2003 mass stranding Stewart island female 410 a 168 Glo199 08/01/2003 mass stranding Stewart island female 180 a 169 Glo200 08/01/2003 mass stranding Stewart island female 430 a 170 Glo201 08/01/2003 mass stranding Stewart island female 370 a 171 Glo202 08/01/2003 mass stranding Stewart island female 420 a 172 Glo203 08/01/2003 mass stranding Stewart island female 430 a 173 Glo204 08/01/2003 mass stranding Stewart island female 430 a 174 Glo205 08/01/2003 mass stranding Stewart island male 410 a 175 Glo206 08/01/2003 mass stranding Stewart island female 400 a 176 Glo207 08/01/2003 mass stranding Stewart island male 220 a 177 Glo208 08/01/2003 mass stranding Stewart island female 250 a 178 Glo209 08/01/2003 mass stranding Stewart island female 180 a 179 Glo210 08/01/2003 mass stranding Stewart island male 290 a 180 Glo211 08/01/2003 mass stranding Stewart island female 390 a
181 Glo220 04/07/2004 mass strandingMahurangi Peninsula male 475 a
182 Glo221 04/07/2004 mass strandingMahurangi Peninsula female 420 a
183 Glo222 04/07/2004 mass strandingMahurangi Peninsula female 419 a
184 Glo223 04/07/2004 mass strandingMahurangi Peninsula female 440 a
185 Glo224 04/07/2004 mass strandingMahurangi Peninsula female 421 a
186 Glo225 04/07/2004 mass strandingMahurangi Peninsula female 416 a
187 Glo226 04/07/2004 mass strandingMahurangi Peninsula female 419 a
188 Glo227 04/07/2004 mass strandingMahurangi Peninsula female 419 a
189 Glo228 04/07/2004 mass strandingMahurangi Peninsula male 535 a
190 Glo229 04/07/2004 mass strandingMahurangi Peninsula female 433 a
191 Glo230 04/07/2004 mass strandingMahurangi Peninsula male 358 a
192 Glo234 29/11/2004 mass stranding Opoutere Beach male 473 a 193 Glo235 29/11/2004 mass stranding Opoutere Beach female 315 a 194 Glo236 29/11/2004 mass stranding Opoutere Beach female 191 a

195 Glo237 29/11/2004 mass stranding Opoutere Beach male 214 a 196 Glo238 29/11/2004 mass stranding Opoutere Beach male 404 a 197 Glo239 29/11/2004 mass stranding Opoutere Beach female 390 a 198 Glo240 29/11/2004 mass stranding Opoutere Beach female 337 a 199 Glo241 29/11/2004 mass stranding Opoutere Beach female 442 a 200 Glo242 29/11/2004 mass stranding Opoutere Beach female 454 a 201 Glo243 29/11/2004 mass stranding Opoutere Beach male 547 a 202 Glo244 29/11/2004 mass stranding Opoutere Beach male 458 a 203 Glo245 29/11/2004 mass stranding Opoutere Beach male 539 a 204 Glo246 29/11/2004 mass stranding Opoutere Beach female 453 a 205 Glo247 29/11/2004 mass stranding Opoutere Beach female 411 a 206 Glo248 29/11/2004 mass stranding Opoutere Beach female 421 a 207 Glo249 29/11/2004 mass stranding Opoutere Beach female 293 a 208 Glo250 29/11/2004 mass stranding Opoutere Beach female 438 a 209 Glo251 29/11/2004 mass stranding Opoutere Beach female 429 a 210 Glo252 29/11/2004 mass stranding Opoutere Beach male 381 a 211 Glo253 29/11/2004 mass stranding Opoutere Beach female 403 a 212 Glo254 29/11/2004 mass stranding Opoutere Beach female 451 a 213 Glo255 29/11/2004 mass stranding Opoutere Beach female 380 b 214 Glo256 29/11/2004 mass stranding Opoutere Beach female 435 a 215 Glo257 29/11/2004 mass stranding Opoutere Beach female 439 a 216 Glo258 29/11/2004 mass stranding Opoutere Beach female 451 a 217 Glo259 29/11/2004 mass stranding Opoutere Beach male 535 a 218 Glo260 29/11/2004 mass stranding Opoutere Beach female 448 a 219 Glo261 29/11/2004 mass stranding Opoutere Beach male 552 a 220 Glo262 29/11/2004 mass stranding Opoutere Beach female 453 a 221 Glo263 29/11/2004 mass stranding Opoutere Beach female 363 a 222 Glo264 29/11/2004 mass stranding Opoutere Beach female 307 a 223 Glo265 29/11/2004 mass stranding Opoutere Beach female 433 a 224 Glo266 29/11/2004 mass stranding Opoutere Beach female 279 a 225 Glo267 29/11/2004 mass stranding Opoutere Beach male 178 a 226 Glo268 29/11/2004 mass stranding Opoutere Beach male 562 a 227 Glo269 29/11/2004 mass stranding Opoutere Beach male 261 a 228 Glo270 29/11/2004 mass stranding Opoutere Beach female 422 a 229 Glo271 29/11/2004 mass stranding Opoutere Beach male 320 a 230 Glo272 29/11/2004 mass stranding Opoutere Beach female 447 a 231 Glo273 29/11/2004 mass stranding Opoutere Beach female 402 a 232 Glo274 29/11/2004 mass stranding Opoutere Beach female 429 a 233 Glo275 29/11/2004 mass stranding Opoutere Beach female 444 a 234 Glo276 29/11/2004 mass stranding Opoutere Beach male 378 a 235 Glo277 29/11/2004 mass stranding Opoutere Beach male 538 a 236 Glo278 29/11/2004 mass stranding Opoutere Beach female 398 a 237 Glo279 29/11/2004 mass stranding Opoutere Beach female 441 a 238 Glo280 29/11/2004 mass stranding Opoutere Beach female 425 a 239 Glo281 29/11/2004 mass stranding Opoutere Beach female 374 a 240 Glo282 29/11/2004 mass stranding Opoutere Beach female 412 a 241 Glo283 29/11/2004 mass stranding Opoutere Beach male 298 a 242 Glo284 29/11/2004 mass stranding Opoutere Beach male 317 a 243 Glo286 28/12/1992 mass stranding Golden Bay female 426 a 244 Glo287 28/12/1992 mass stranding Golden Bay male 466 a 245 Glo288 28/12/1992 mass stranding Golden Bay female 433 g 246 Glo289 28/12/1992 mass stranding Golden Bay female 450 a
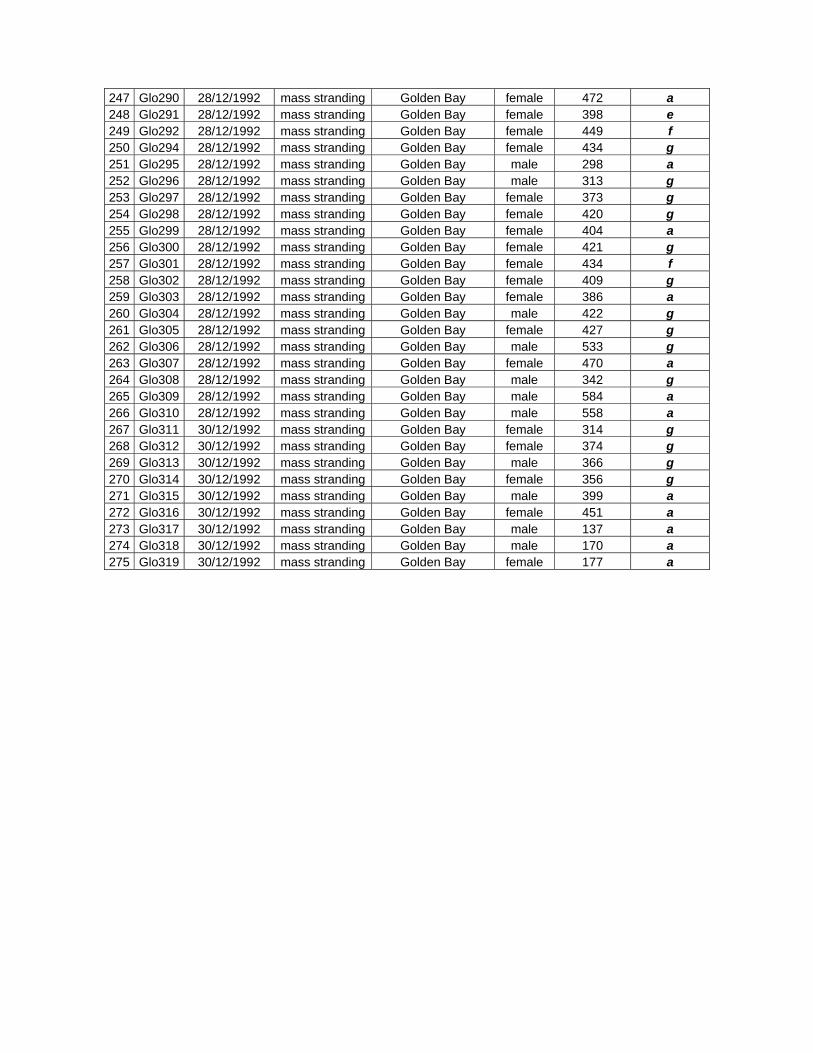
247 Glo290 28/12/1992 mass stranding Golden Bay female 472 a 248 Glo291 28/12/1992 mass stranding Golden Bay female 398 e 249 Glo292 28/12/1992 mass stranding Golden Bay female 449 f 250 Glo294 28/12/1992 mass stranding Golden Bay female 434 g 251 Glo295 28/12/1992 mass stranding Golden Bay male 298 a 252 Glo296 28/12/1992 mass stranding Golden Bay male 313 g 253 Glo297 28/12/1992 mass stranding Golden Bay female 373 g 254 Glo298 28/12/1992 mass stranding Golden Bay female 420 g 255 Glo299 28/12/1992 mass stranding Golden Bay female 404 a 256 Glo300 28/12/1992 mass stranding Golden Bay female 421 g 257 Glo301 28/12/1992 mass stranding Golden Bay female 434 f 258 Glo302 28/12/1992 mass stranding Golden Bay female 409 g 259 Glo303 28/12/1992 mass stranding Golden Bay female 386 a 260 Glo304 28/12/1992 mass stranding Golden Bay male 422 g 261 Glo305 28/12/1992 mass stranding Golden Bay female 427 g 262 Glo306 28/12/1992 mass stranding Golden Bay male 533 g 263 Glo307 28/12/1992 mass stranding Golden Bay female 470 a 264 Glo308 28/12/1992 mass stranding Golden Bay male 342 g 265 Glo309 28/12/1992 mass stranding Golden Bay male 584 a 266 Glo310 28/12/1992 mass stranding Golden Bay male 558 a 267 Glo311 30/12/1992 mass stranding Golden Bay female 314 g 268 Glo312 30/12/1992 mass stranding Golden Bay female 374 g 269 Glo313 30/12/1992 mass stranding Golden Bay male 366 g 270 Glo314 30/12/1992 mass stranding Golden Bay female 356 g 271 Glo315 30/12/1992 mass stranding Golden Bay male 399 a 272 Glo316 30/12/1992 mass stranding Golden Bay female 451 a 273 Glo317 30/12/1992 mass stranding Golden Bay male 137 a 274 Glo318 30/12/1992 mass stranding Golden Bay male 170 a 275 Glo319 30/12/1992 mass stranding Golden Bay female 177 a

Long-finned pilot whales microsatellite genotypes used in Chapter 4 (-) indicates missing data
CODE EV37 Ppho131 415/416 EV94 GT575 GT51
GT23
DlrFCB1 DlrFCB6 409/470 464/465 EV1 GATA53 MK8
Glo001 178 182 197 199 210 210 275 275 159 159 203 203 72 76 121 129 175 177 194 196 148 148 145 145 274 290 104 104 Glo002 182 182 195 199 224 232 271 273 153 159 201 203 72 76 121 121 169 169 186 196 148 150 139 157 286 290 96 106 Glo003 182 182 199 205 224 226 275 275 161 165 203 203 76 78 125 127 169 177 186 194 148 150 149 149 282 290 104 106 Glo004 172 188 195 197 210 224 271 275 153 161 203 203 76 76 121 123 169 177 188 198 138 138 155 157 278 278 104 106 Glo023 180 188 197 201 210 224 271 275 159 159 201 203 74 76 125 127 177 177 - - - - 149 149 282 286 106 106 Glo025 182 182 195 197 224 238 273 275 151 159 203 203 76 76 109 123 177 177 186 190 148 152 155 161 270 278 102 104 Glo027 172 182 197 197 210 210 275 275 153 161 - - 76 76 125 127 169 177 - - 138 148 147 149 278 290 99 104 Glo028 180 180 197 197 224 224 273 275 157 167 201 203 72 72 125 125 173 177 186 192 138 148 149 155 282 290 94 104 Glo030 172 188 195 197 210 224 275 275 153 161 203 203 76 76 121 123 - - - - - - 155 157 278 278 98 104 Glo031 182 182 195 197 224 238 269 273 151 159 203 203 76 76 109 123 177 177 - - 148 152 155 161 270 278 94 102 Glo032 172 188 191 199 210 224 271 273 159 161 203 203 72 76 119 125 169 177 186 190 148 148 145 149 274 286 102 104 Glo033 180 188 195 203 224 232 273 275 153 165 203 203 72 76 123 127 169 169 - - - - 147 159 274 282 98 106 Glo034 172 180 195 195 226 232 275 275 157 159 203 203 72 78 123 123 169 177 188 190 148 148 147 149 - - 96 104 Glo035 180 188 197 199 210 210 273 275 - - 203 203 76 76 123 125 - - - - - - 149 149 274 278 94 104 Glo037 178 182 195 197 224 226 269 273 151 165 201 203 72 72 109 123 169 177 190 196 146 150 147 149 270 282 102 106 Glo038 180 180 195 195 224 228 269 275 155 165 201 203 72 76 123 125 175 177 186 196 148 150 149 151 282 286 102 110 Glo039 180 182 195 199 224 228 271 275 151 159 201 203 76 76 127 127 175 177 - - 148 152 149 153 286 290 108 108 Glo041 180 188 197 201 224 232 273 273 161 165 201 203 76 78 123 123 169 169 186 190 148 148 149 151 286 290 96 106 Glo042 182 188 197 197 224 224 273 273 - - - - 72 76 123 125 - - - - - - 147 149 278 278 102 102 Glo043 180 182 195 195 210 230 271 275 151 153 203 203 76 76 119 123 173 175 188 202 148 148 149 149 270 274 104 108 Glo045 188 194 195 197 224 228 275 275 153 157 203 203 72 76 123 127 169 169 - - - - 145 149 274 290 102 104 Glo047 178 192 199 199 224 226 273 275 153 153 201 203 72 76 109 127 169 177 186 198 148 148 151 157 274 278 102 102 Glo051 172 192 193 195 224 224 275 275 159 159 201 203 72 80 121 127 169 177 - - 148 148 147 153 - - - - Glo054 184 192 195 195 224 228 275 275 151 155 203 203 72 76 125 125 169 177 184 186 148 150 149 151 - - - - Glo055 182 188 185 197 226 226 273 275 151 155 201 203 72 76 119 123 169 177 186 194 148 148 155 163 - - - - Glo056 180 180 195 195 224 228 275 275 159 163 201 201 72 76 123 123 169 177 194 196 148 148 147 147 - - - - Glo057 180 182 195 199 210 226 271 275 151 151 203 203 76 78 125 129 169 173 194 198 148 152 149 151 - - - - Glo060 182 182 195 195 224 228 275 275 153 163 201 203 76 76 125 133 169 177 190 192 148 148 147 147 - - - - Glo066 180 188 195 195 226 228 273 275 161 161 201 203 72 76 123 123 169 177 190 196 148 148 139 151 - - - -
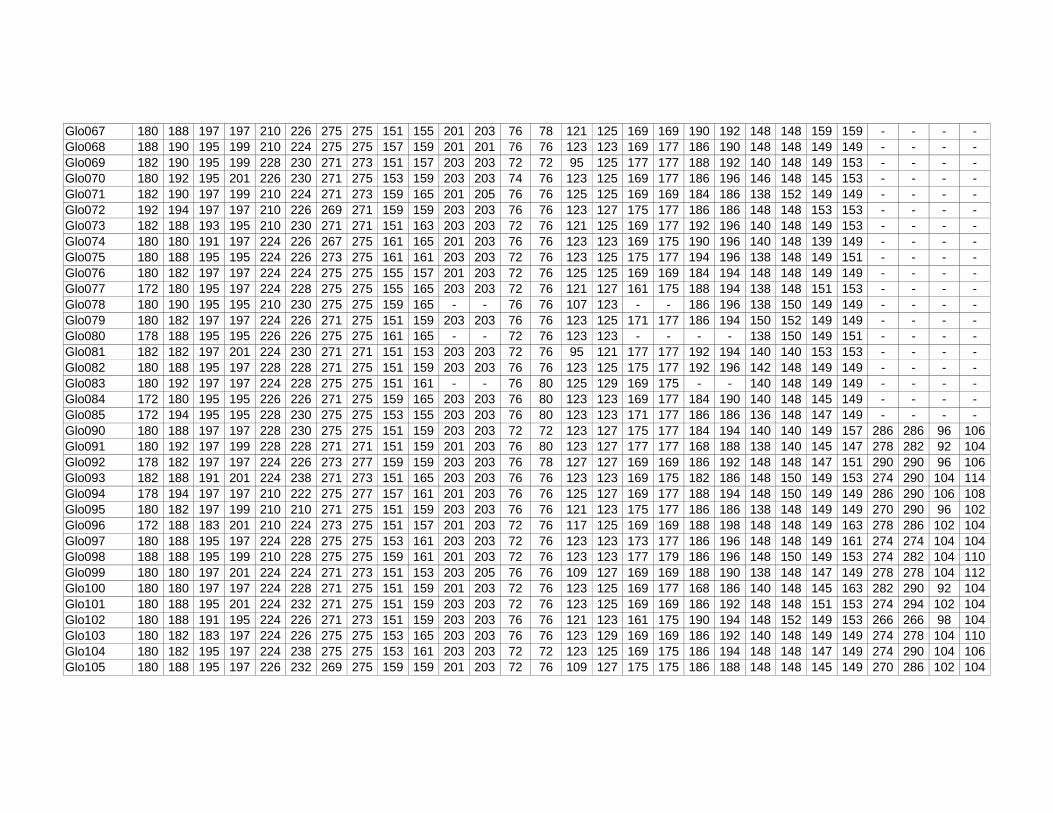
Glo067 180 188 197 197 210 226 275 275 151 155 201 203 76 78 121 125 169 169 190 192 148 148 159 159 - - - - Glo068 188 190 195 199 210 224 275 275 157 159 201 201 76 76 123 123 169 177 186 190 148 148 149 149 - - - - Glo069 182 190 195 199 228 230 271 273 151 157 203 203 72 72 95 125 177 177 188 192 140 148 149 153 - - - - Glo070 180 192 195 201 226 230 271 275 153 159 203 203 74 76 123 125 169 177 186 196 146 148 145 153 - - - - Glo071 182 190 197 199 210 224 271 273 159 165 201 205 76 76 125 125 169 169 184 186 138 152 149 149 - - - - Glo072 192 194 197 197 210 226 269 271 159 159 203 203 76 76 123 127 175 177 186 186 148 148 153 153 - - - - Glo073 182 188 193 195 210 230 271 271 151 163 203 203 72 76 121 125 169 177 192 196 140 148 149 153 - - - - Glo074 180 180 191 197 224 226 267 275 161 165 201 203 76 76 123 123 169 175 190 196 140 148 139 149 - - - - Glo075 180 188 195 195 224 226 273 275 161 161 203 203 72 76 123 125 175 177 194 196 138 148 149 151 - - - - Glo076 180 182 197 197 224 224 275 275 155 157 201 203 72 76 125 125 169 169 184 194 148 148 149 149 - - - - Glo077 172 180 195 197 224 228 275 275 155 165 203 203 72 76 121 127 161 175 188 194 138 148 151 153 - - - - Glo078 180 190 195 195 210 230 275 275 159 165 - - 76 76 107 123 - - 186 196 138 150 149 149 - - - - Glo079 180 182 197 197 224 226 271 275 151 159 203 203 76 76 123 125 171 177 186 194 150 152 149 149 - - - - Glo080 178 188 195 195 226 226 275 275 161 165 - - 72 76 123 123 - - - - 138 150 149 151 - - - - Glo081 182 182 197 201 224 230 271 271 151 153 203 203 72 76 95 121 177 177 192 194 140 140 153 153 - - - - Glo082 180 188 195 197 228 228 271 275 151 159 203 203 76 76 123 125 175 177 192 196 142 148 149 149 - - - - Glo083 180 192 197 197 224 228 275 275 151 161 - - 76 80 125 129 169 175 - - 140 148 149 149 - - - - Glo084 172 180 195 195 226 226 271 275 159 165 203 203 76 80 123 123 169 177 184 190 140 148 145 149 - - - - Glo085 172 194 195 195 228 230 275 275 153 155 203 203 76 80 123 123 171 177 186 186 136 148 147 149 - - - - Glo090 180 188 197 197 228 230 275 275 151 159 203 203 72 72 123 127 175 177 184 194 140 140 149 157 286 286 96 106 Glo091 180 192 197 199 228 228 271 271 151 159 201 203 76 80 123 127 177 177 168 188 138 140 145 147 278 282 92 104 Glo092 178 182 197 197 224 226 273 277 159 159 203 203 76 78 127 127 169 169 186 192 148 148 147 151 290 290 96 106 Glo093 182 188 191 201 224 238 271 273 151 165 203 203 76 76 123 123 169 175 182 186 148 150 149 153 274 290 104 114 Glo094 178 194 197 197 210 222 275 277 157 161 201 203 76 76 125 127 169 177 188 194 148 150 149 149 286 290 106 108 Glo095 180 182 197 199 210 210 271 275 151 159 203 203 76 76 121 123 175 177 186 186 138 148 149 149 270 290 96 102 Glo096 172 188 183 201 210 224 273 275 151 157 201 203 72 76 117 125 169 169 188 198 148 148 149 163 278 286 102 104 Glo097 180 188 195 197 224 228 275 275 153 161 203 203 72 76 123 123 173 177 186 196 148 148 149 161 274 274 104 104 Glo098 188 188 195 199 210 228 275 275 159 161 201 203 72 76 123 123 177 179 186 196 148 150 149 153 274 282 104 110 Glo099 180 180 197 201 224 224 271 273 151 153 203 205 76 76 109 127 169 169 188 190 138 148 147 149 278 278 104 112 Glo100 180 180 197 197 224 228 271 275 151 159 201 203 72 76 123 125 169 177 168 186 140 148 145 163 282 290 92 104 Glo101 180 188 195 201 224 232 271 275 151 159 203 203 72 76 123 125 169 169 186 192 148 148 151 153 274 294 102 104 Glo102 180 188 191 195 224 226 271 273 151 159 203 203 76 76 121 123 161 175 190 194 148 152 149 153 266 266 98 104 Glo103 180 182 183 197 224 226 275 275 153 165 203 203 76 76 123 129 169 169 186 192 140 148 149 149 274 278 104 110 Glo104 180 182 195 197 224 238 275 275 153 161 203 203 72 72 123 125 169 175 186 194 148 148 147 149 274 290 104 106 Glo105 180 188 195 197 226 232 269 275 159 159 201 203 72 76 109 127 175 175 186 188 148 148 145 149 270 286 102 104
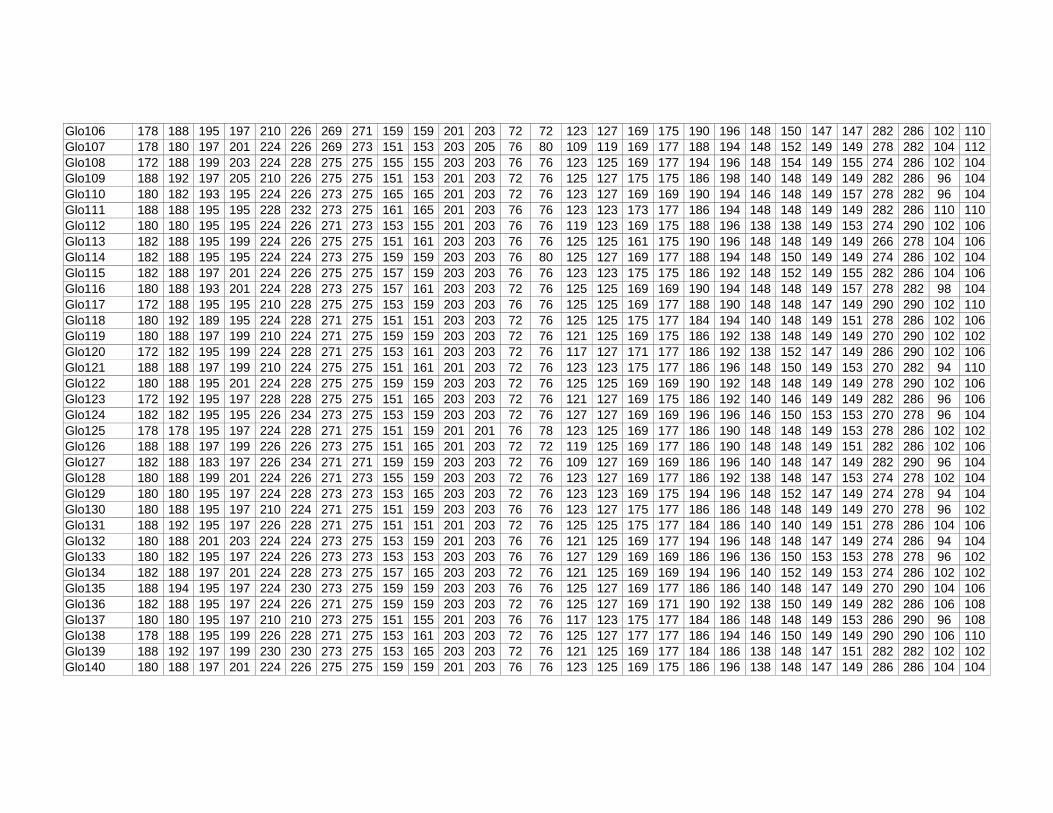
Glo106 178 188 195 197 210 226 269 271 159 159 201 203 72 72 123 127 169 175 190 196 148 150 147 147 282 286 102 110 Glo107 178 180 197 201 224 226 269 273 151 153 203 205 76 80 109 119 169 177 188 194 148 152 149 149 278 282 104 112 Glo108 172 188 199 203 224 228 275 275 155 155 203 203 76 76 123 125 169 177 194 196 148 154 149 155 274 286 102 104 Glo109 188 192 197 205 210 226 275 275 151 153 201 203 72 76 125 127 175 175 186 198 140 148 149 149 282 286 96 104 Glo110 180 182 193 195 224 226 273 275 165 165 201 203 72 76 123 127 169 169 190 194 146 148 149 157 278 282 96 104 Glo111 188 188 195 195 228 232 273 275 161 165 201 203 76 76 123 123 173 177 186 194 148 148 149 149 282 286 110 110 Glo112 180 180 195 195 224 226 271 273 153 155 201 203 76 76 119 123 169 175 188 196 138 138 149 153 274 290 102 106 Glo113 182 188 195 199 224 226 275 275 151 161 203 203 76 76 125 125 161 175 190 196 148 148 149 149 266 278 104 106 Glo114 182 188 195 195 224 224 273 275 159 159 203 203 76 80 125 127 169 177 188 194 148 150 149 149 274 286 102 104 Glo115 182 188 197 201 224 226 275 275 157 159 203 203 76 76 123 123 175 175 186 192 148 152 149 155 282 286 104 106 Glo116 180 188 193 201 224 228 273 275 157 161 203 203 72 76 125 125 169 169 190 194 148 148 149 157 278 282 98 104 Glo117 172 188 195 195 210 228 275 275 153 159 203 203 76 76 125 125 169 177 188 190 148 148 147 149 290 290 102 110 Glo118 180 192 189 195 224 228 271 275 151 151 203 203 72 76 125 125 175 177 184 194 140 148 149 151 278 286 102 106 Glo119 180 188 197 199 210 224 271 275 159 159 203 203 72 76 121 125 169 175 186 192 138 148 149 149 270 290 102 102 Glo120 172 182 195 199 224 228 271 275 153 161 203 203 72 76 117 127 171 177 186 192 138 152 147 149 286 290 102 106 Glo121 188 188 197 199 210 224 275 275 151 161 201 203 72 76 123 123 175 177 186 196 148 150 149 153 270 282 94 110 Glo122 180 188 195 201 224 228 275 275 159 159 203 203 72 76 125 125 169 169 190 192 148 148 149 149 278 290 102 106 Glo123 172 192 195 197 228 228 275 275 151 165 203 203 72 76 121 127 169 175 186 192 140 146 149 149 282 286 96 106 Glo124 182 182 195 195 226 234 273 275 153 159 203 203 72 76 127 127 169 169 196 196 146 150 153 153 270 278 96 104 Glo125 178 178 195 197 224 228 271 275 151 159 201 201 76 78 123 125 169 177 186 190 148 148 149 153 278 286 102 102 Glo126 188 188 197 199 226 226 273 275 151 165 201 203 72 72 119 125 169 177 186 190 148 148 149 151 282 286 102 106 Glo127 182 188 183 197 226 234 271 271 159 159 203 203 72 76 109 127 169 169 186 196 140 148 147 149 282 290 96 104 Glo128 180 188 199 201 224 226 271 273 155 159 203 203 72 76 123 127 169 177 186 192 138 148 147 153 274 278 102 104 Glo129 180 180 195 197 224 228 273 273 153 165 203 203 72 76 123 123 169 175 194 196 148 152 147 149 274 278 94 104 Glo130 180 188 195 197 210 224 271 275 151 159 203 203 76 76 123 127 175 177 186 186 148 148 149 149 270 278 96 102 Glo131 188 192 195 197 226 228 271 275 151 151 201 203 72 76 125 125 175 177 184 186 140 140 149 151 278 286 104 106 Glo132 180 188 201 203 224 224 273 275 153 159 201 203 76 76 121 125 169 177 194 196 148 148 147 149 274 286 94 104 Glo133 180 182 195 197 224 226 273 273 153 153 203 203 76 76 127 129 169 169 186 196 136 150 153 153 278 278 96 102 Glo134 182 188 197 201 224 228 273 275 157 165 203 203 72 76 121 125 169 169 194 196 140 152 149 153 274 286 102 102 Glo135 188 194 195 197 224 230 273 275 159 159 203 203 76 76 125 127 169 177 186 186 140 148 147 149 270 290 104 106 Glo136 182 188 195 197 224 226 271 275 159 159 203 203 72 76 125 127 169 171 190 192 138 150 149 149 282 286 106 108 Glo137 180 180 195 197 210 210 273 275 151 155 201 203 76 76 117 123 175 177 184 186 148 148 149 153 286 290 96 108 Glo138 178 188 195 199 226 228 271 275 153 161 203 203 72 76 125 127 177 177 186 194 146 150 149 149 290 290 106 110 Glo139 188 192 197 199 230 230 273 275 153 165 203 203 72 76 121 125 169 177 184 186 138 148 147 151 282 282 102 102 Glo140 180 188 197 201 224 226 275 275 159 159 201 203 76 76 123 125 169 175 186 196 138 148 147 149 286 286 104 104

Glo141 180 180 191 195 210 226 273 273 159 165 201 201 72 76 123 125 169 177 194 196 148 154 147 153 270 290 102 106 Glo142 180 188 197 199 224 224 271 275 153 165 203 203 76 76 127 127 169 175 186 190 148 148 147 147 266 274 96 98 Glo143 188 194 193 203 210 210 275 275 151 161 203 203 76 76 125 125 169 169 184 188 148 150 149 157 282 290 102 104 Glo144 182 188 195 195 224 230 275 275 159 165 203 203 76 76 119 125 169 169 186 196 140 148 149 149 270 270 102 104 Glo145 180 180 195 197 210 224 275 275 151 153 201 203 76 76 123 123 169 177 184 194 148 148 149 153 282 286 102 106 Glo146 180 182 191 197 226 230 273 275 151 157 201 203 72 76 109 123 175 175 186 186 136 148 147 149 282 286 102 104 Glo147 188 188 195 197 224 226 271 273 159 161 201 203 76 76 125 125 169 169 188 190 138 148 149 149 274 286 102 108 Glo148 180 182 195 197 226 232 269 275 159 161 203 203 72 76 109 125 169 175 188 196 136 148 145 149 286 290 98 104 Glo149 180 180 191 199 224 228 273 275 151 165 203 203 72 76 125 127 169 169 186 196 148 148 147 149 266 282 98 102 Glo150 180 188 195 195 210 226 271 275 155 159 201 203 72 72 123 123 169 175 192 196 150 152 149 153 278 290 106 108 Glo151 180 188 195 197 226 228 271 275 159 159 203 203 76 80 95 127 169 175 196 196 138 148 145 149 270 274 102 102 Glo152 188 188 195 197 210 226 273 275 153 167 201 203 72 76 123 123 169 177 184 186 148 148 139 161 282 286 102 108 Glo153 188 192 195 195 224 226 271 275 153 159 203 203 76 76 121 127 169 177 184 186 148 150 147 159 282 290 102 104 Glo154 180 182 197 201 224 226 271 273 157 165 203 203 76 76 123 125 169 173 184 186 148 148 149 149 270 286 102 110 Glo155 180 188 195 195 224 224 271 273 147 151 203 203 76 76 117 123 169 177 168 192 138 148 147 151 278 278 96 102 Glo156 180 188 195 197 224 226 273 275 151 159 203 203 76 76 123 123 175 175 186 186 148 148 147 147 274 286 102 104 Glo157 180 180 197 199 210 210 271 273 151 161 203 203 76 76 123 125 169 175 184 186 148 148 147 149 286 290 96 102 Glo158 180 192 195 197 226 232 275 275 159 167 203 203 72 80 95 115 169 175 194 198 136 148 139 149 270 278 102 106 Glo159 178 182 195 201 226 226 273 275 159 161 203 203 72 76 123 127 169 177 186 192 148 148 145 153 278 286 102 106 Glo160 180 182 195 199 226 226 269 275 155 159 203 205 76 76 123 125 169 177 186 196 140 148 153 155 274 286 102 106 Glo161 178 188 197 201 210 226 271 273 151 153 203 203 76 76 109 125 169 175 188 192 148 148 147 149 278 290 96 104 Glo162 178 182 191 197 224 226 273 275 159 165 203 203 76 76 125 125 169 169 192 194 150 152 147 147 270 286 102 102 Glo163 178 188 191 195 224 226 273 275 151 161 201 203 76 76 123 123 169 169 194 196 142 150 145 149 274 282 102 106 Glo164 172 180 195 197 224 228 271 273 151 165 201 203 76 76 123 123 169 177 168 186 140 148 147 153 278 286 92 102 Glo165 188 188 191 197 224 228 275 275 151 165 201 205 76 80 123 127 169 177 194 196 140 150 149 153 274 282 102 104 Glo166 180 188 193 195 224 228 273 275 151 153 201 203 76 76 119 125 171 175 196 196 138 148 149 159 278 290 102 108 Glo167 180 192 197 197 224 224 271 273 153 159 203 203 72 76 119 125 169 169 186 186 148 148 147 147 282 290 102 102 Glo168 182 188 197 201 224 226 271 275 159 161 201 203 76 76 125 127 169 177 186 188 140 148 145 153 274 286 106 106 Glo169 172 188 195 203 210 228 273 275 153 161 201 203 72 76 117 125 169 169 184 196 146 148 153 157 282 282 102 110 Glo170 180 180 191 193 224 228 271 271 151 159 203 203 72 76 125 127 169 177 186 196 138 140 149 159 278 278 102 102 Glo171 182 188 197 199 228 232 269 275 153 165 203 203 76 76 125 125 177 179 194 196 136 148 149 153 278 286 102 106 Glo172 172 180 197 199 210 228 271 275 155 159 203 203 72 76 123 125 173 177 184 196 148 154 147 149 274 278 102 104 Glo173 188 188 195 201 210 224 273 273 159 161 203 203 76 80 125 129 169 177 186 194 148 148 149 153 286 290 102 104 Glo174 180 182 195 201 226 226 271 273 151 165 201 203 76 76 123 123 169 169 168 184 138 148 149 151 278 286 96 106 Glo175 188 188 197 197 228 234 - - 159 161 203 203 76 76 125 127 169 177 184 192 138 146 149 153 282 286 98 106

Glo176 182 188 197 199 232 232 271 275 153 157 203 203 72 76 123 125 169 177 186 194 136 136 149 149 270 278 102 106 Glo177 180 188 191 193 224 224 271 273 151 153 201 203 76 76 121 123 169 177 184 186 140 148 149 149 282 290 98 106 Glo178 182 192 199 199 224 230 273 275 155 165 201 203 72 76 125 135 169 169 184 198 148 148 147 149 282 290 102 108 Glo179 180 180 191 195 224 228 275 275 159 165 203 203 76 76 123 123 169 175 194 194 146 148 149 149 278 282 96 102 Glo180 180 188 191 195 224 228 271 275 151 159 201 203 76 76 121 125 161 177 168 190 138 148 149 149 266 278 104 106 Glo181 178 180 195 197 226 226 275 275 159 161 203 203 72 76 123 123 169 177 192 196 142 148 145 149 278 282 98 106 Glo182 180 188 197 199 210 228 273 275 153 163 203 203 72 72 125 127 177 177 186 196 150 150 149 149 278 290 98 102 Glo183 178 188 183 197 222 226 275 277 157 159 203 203 76 78 127 127 169 177 188 192 148 148 147 149 278 290 106 106 Glo184 178 192 191 195 226 226 273 273 165 165 203 203 76 76 125 127 169 177 186 192 136 152 145 147 278 286 102 106 Glo185 180 188 195 197 210 226 273 275 153 155 203 203 76 76 121 125 177 177 184 190 138 138 145 153 286 290 106 108 Glo186 180 182 197 201 226 228 271 273 151 151 201 203 72 76 125 127 169 177 186 186 140 148 153 163 282 290 98 104 Glo187 180 182 197 199 224 228 271 273 159 159 203 203 76 76 123 125 169 177 186 196 140 148 149 149 274 286 94 102 Glo188 172 190 197 199 228 234 275 275 155 159 203 203 76 76 123 125 173 177 186 196 148 148 147 153 274 282 102 104 Glo189 180 192 191 195 224 226 273 275 161 165 203 203 72 76 127 127 173 177 186 190 148 152 147 147 278 282 98 104 Glo190 180 188 195 195 210 226 271 273 159 165 201 203 76 76 125 127 169 169 186 196 148 150 147 153 270 282 94 102 Glo191 188 188 197 199 210 226 275 275 163 167 201 203 76 76 123 123 177 177 184 194 148 148 139 153 278 286 102 104 Glo192 180 188 193 197 228 230 271 275 153 159 203 203 76 76 125 125 169 175 192 196 138 146 149 159 270 278 96 102 Glo193 182 188 197 205 210 224 275 275 151 161 203 203 72 76 121 123 169 175 186 194 148 148 147 149 270 290 102 104 Glo194 180 188 195 195 226 228 271 275 159 159 203 203 76 80 125 129 169 169 186 196 148 148 139 157 274 290 98 102 Glo195 180 188 193 197 228 230 275 275 153 153 203 203 76 76 123 125 169 175 186 186 140 148 149 149 282 286 96 98 Glo196 172 188 199 199 224 228 271 273 153 153 203 203 72 76 125 127 177 177 186 192 150 152 149 149 274 290 102 106 Glo197 188 188 195 195 224 232 271 273 153 165 203 203 72 76 125 127 169 177 186 196 140 146 147 149 278 290 104 106 Glo198 182 188 195 197 224 224 271 273 147 157 201 203 72 76 123 125 169 169 168 186 148 150 145 151 278 278 102 102 Glo199 180 180 195 197 224 228 - - 159 161 201 203 76 76 123 125 169 169 190 194 138 148 145 149 278 286 96 104 Glo200 180 192 195 197 226 228 275 275 151 153 203 203 72 76 125 127 169 175 184 186 140 140 149 149 282 286 96 106 Glo201 182 188 195 197 234 234 271 275 153 159 203 203 72 76 127 127 169 169 186 196 146 148 147 153 270 282 96 104 Glo202 180 188 195 195 226 230 275 275 159 159 203 203 76 80 95 125 169 175 196 198 138 148 139 145 270 274 98 102 Glo203 180 188 191 197 210 224 275 275 151 165 203 205 76 76 123 123 177 177 186 196 140 150 149 153 274 282 104 112 Glo204 180 188 195 195 226 232 273 273 153 165 203 203 72 76 125 125 169 177 184 186 138 148 145 149 278 290 96 106 Glo205 180 182 199 203 210 228 269 275 151 151 203 203 72 76 127 127 169 169 186 186 148 152 147 149 266 282 98 104 Glo206 180 188 193 197 224 230 271 275 153 153 203 203 76 76 121 123 169 169 186 196 140 148 149 153 286 290 98 104 Glo207 188 190 195 197 228 228 275 275 153 159 203 203 76 76 125 125 169 177 188 196 148 148 147 151 290 290 102 110 Glo208 182 188 197 201 210 224 271 275 151 161 203 203 76 76 123 125 169 177 186 192 148 148 147 149 278 290 104 106 Glo209 180 188 197 197 226 238 275 275 159 161 203 203 72 76 123 123 169 169 186 192 140 142 145 149 270 278 98 102 Glo210 180 188 195 197 224 228 273 275 151 153 203 203 72 76 123 123 169 173 186 194 148 148 149 149 278 286 96 98

Glo211 180 188 193 195 228 228 275 275 153 153 203 203 76 76 123 125 169 171 186 186 140 148 147 149 286 290 98 98 Glo212 180 188 195 197 226 228 275 275 159 159 201 203 76 80 95 127 169 175 186 198 148 148 145 149 270 274 98 104 Glo213 182 188 197 197 226 228 271 275 151 159 203 203 72 76 125 127 175 177 186 196 146 148 145 153 270 286 104 106 Glo220 180 182 195 197 228 228 273 273 151 161 203 203 76 76 125 127 169 177 190 198 152 152 149 153 282 286 - - Glo221 180 188 197 197 224 230 271 277 157 159 201 203 72 76 119 121 169 177 184 186 148 152 147 155 278 286 - - Glo222 180 188 197 199 224 228 269 275 157 161 203 203 72 76 123 123 169 173 168 198 136 150 155 159 278 278 - - Glo223 180 180 195 195 210 224 273 275 159 161 - - 72 72 123 127 173 175 168 186 136 148 145 147 278 282 - - Glo224 188 190 195 201 210 224 271 271 151 167 201 203 76 78 121 123 175 177 192 196 138 146 149 153 290 290 - - Glo225 178 194 193 203 210 224 275 275 153 161 203 203 76 76 125 125 177 177 186 186 138 148 147 149 278 282 - - Glo226 188 190 195 197 224 224 267 271 161 165 203 203 72 76 123 123 169 169 186 194 148 148 147 161 282 290 - - Glo227 180 180 195 195 226 228 273 275 151 161 203 203 76 76 121 127 169 177 186 190 148 152 149 153 282 286 - - Glo228 178 182 195 197 210 228 275 275 157 159 203 203 72 76 125 125 175 177 186 196 148 148 147 157 286 290 - - Glo229 184 192 197 199 226 238 271 275 151 153 203 203 76 76 109 123 169 173 186 194 140 148 149 149 274 286 - - Glo230 178 180 193 199 226 228 271 275 161 165 203 203 72 76 123 125 169 169 184 196 138 148 143 151 282 290 - - Glo234 180 182 195 195 224 224 275 275 161 165 203 203 72 76 121 127 169 175 194 196 148 148 153 155 274 286 98 104 Glo235 180 182 195 197 224 230 275 275 153 161 203 203 76 76 125 125 169 169 190 192 150 152 149 153 286 286 104 106 Glo236 172 188 195 199 210 228 275 275 153 159 203 203 72 76 119 123 169 173 186 188 148 148 153 153 274 294 102 104 Glo237 182 188 195 199 210 210 275 275 153 157 203 203 72 76 123 127 177 177 188 194 146 148 147 149 290 294 102 104 Glo238 188 190 195 197 224 224 273 275 159 163 201 203 76 76 109 125 169 175 186 196 136 148 149 149 282 286 94 102 Glo239 172 188 195 195 224 226 275 275 155 165 203 203 72 76 123 127 177 177 186 194 148 152 147 151 282 290 - - Glo240 172 192 193 195 210 226 271 275 153 161 203 203 76 76 123 125 177 177 186 194 148 148 149 149 278 286 106 106 Glo241 188 188 195 197 210 224 275 275 151 163 203 203 76 76 125 125 169 173 186 198 136 148 149 151 278 282 102 104 Glo242 180 188 195 195 210 224 275 275 161 163 203 203 76 76 117 125 169 177 194 198 136 148 149 155 274 282 96 102 Glo243 182 192 197 197 224 230 271 275 151 159 201 203 76 76 127 127 169 169 186 196 140 148 147 155 278 282 104 110 Glo244 188 188 197 197 224 230 275 275 159 167 203 203 76 78 119 125 169 169 186 186 146 150 147 149 290 290 102 106 Glo245 178 192 197 205 228 230 275 275 159 161 203 203 76 76 117 125 169 175 186 194 140 148 151 155 278 290 98 104 Glo246 188 194 191 197 210 230 273 275 165 167 203 203 72 78 119 123 169 169 186 190 146 148 147 149 266 290 96 106 Glo247 180 188 201 203 224 226 275 275 153 165 203 203 72 76 123 125 175 175 186 186 148 148 159 167 286 294 102 104 Glo248 182 188 195 195 226 232 275 275 159 165 201 203 72 72 123 123 169 175 188 194 138 148 139 149 282 282 104 106 Glo249 180 182 201 203 224 226 275 275 165 165 203 203 72 76 123 125 169 175 186 196 138 148 149 159 278 286 104 108 Glo250 188 188 191 195 210 228 275 275 151 153 203 203 76 76 123 125 175 179 194 196 140 148 149 149 286 290 102 104 Glo251 180 188 195 195 224 230 275 275 153 161 201 201 76 76 119 123 169 175 184 186 140 148 149 149 282 286 102 102 Glo252 180 188 191 195 230 230 273 275 153 159 201 203 76 76 123 125 169 175 192 194 146 148 153 153 266 282 104 112 Glo253 172 188 195 197 210 226 275 275 159 159 203 203 72 80 117 125 169 169 186 186 138 148 145 149 278 282 104 112 Glo254 188 192 195 195 226 226 271 275 159 159 201 203 72 76 119 127 169 177 196 198 138 140 153 165 282 282 102 106
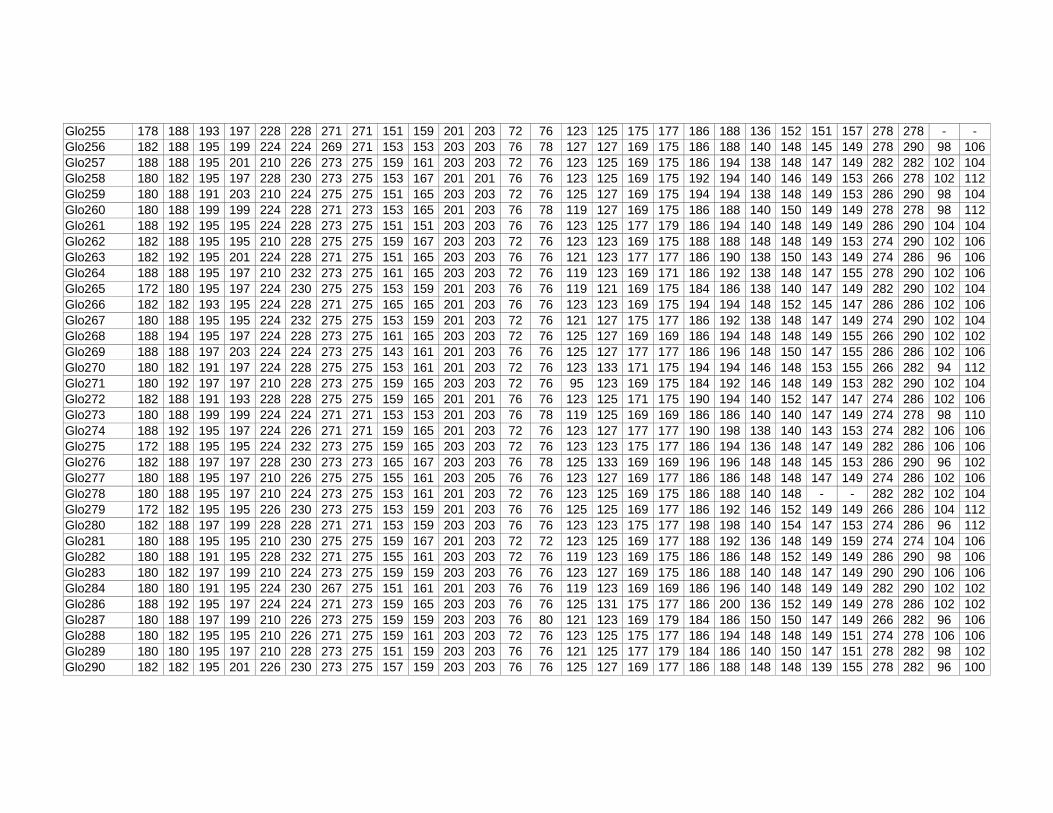
Glo255 178 188 193 197 228 228 271 271 151 159 201 203 72 76 123 125 175 177 186 188 136 152 151 157 278 278 - - Glo256 182 188 195 199 224 224 269 271 153 153 203 203 76 78 127 127 169 175 186 188 140 148 145 149 278 290 98 106 Glo257 188 188 195 201 210 226 273 275 159 161 203 203 72 76 123 125 169 175 186 194 138 148 147 149 282 282 102 104 Glo258 180 182 195 197 228 230 273 275 153 167 201 201 76 76 123 125 169 175 192 194 140 146 149 153 266 278 102 112 Glo259 180 188 191 203 210 224 275 275 151 165 203 203 72 76 125 127 169 175 194 194 138 148 149 153 286 290 98 104 Glo260 180 188 199 199 224 228 271 273 153 165 201 203 76 78 119 127 169 175 186 188 140 150 149 149 278 278 98 112 Glo261 188 192 195 195 224 228 273 275 151 151 203 203 76 76 123 125 177 179 186 194 140 148 149 149 286 290 104 104 Glo262 182 188 195 195 210 228 275 275 159 167 203 203 72 76 123 123 169 175 188 188 148 148 149 153 274 290 102 106 Glo263 182 192 195 201 224 228 271 275 151 165 203 203 76 76 121 123 177 177 186 190 138 150 143 149 274 286 96 106 Glo264 188 188 195 197 210 232 273 275 161 165 203 203 72 76 119 123 169 171 186 192 138 148 147 155 278 290 102 106 Glo265 172 180 195 197 224 230 275 275 153 159 201 203 76 76 119 121 169 175 184 186 138 140 147 149 282 290 102 104 Glo266 182 182 193 195 224 228 271 275 165 165 201 203 76 76 123 123 169 175 194 194 148 152 145 147 286 286 102 106 Glo267 180 188 195 195 224 232 275 275 153 159 201 203 72 76 121 127 175 177 186 192 138 148 147 149 274 290 102 104 Glo268 188 194 195 197 224 228 273 275 161 165 203 203 72 76 125 127 169 169 186 194 148 148 149 155 266 290 102 102 Glo269 188 188 197 203 224 224 273 275 143 161 201 203 76 76 125 127 177 177 186 196 148 150 147 155 286 286 102 106 Glo270 180 182 191 197 224 228 275 275 153 161 201 203 72 76 123 133 171 175 194 194 146 148 153 155 266 282 94 112 Glo271 180 192 197 197 210 228 273 275 159 165 203 203 72 76 95 123 169 175 184 192 146 148 149 153 282 290 102 104 Glo272 182 188 191 193 228 228 275 275 159 165 201 201 76 76 123 125 171 175 190 194 140 152 147 147 274 286 102 106 Glo273 180 188 199 199 224 224 271 271 153 153 201 203 76 78 119 125 169 169 186 186 140 140 147 149 274 278 98 110 Glo274 188 192 195 197 224 226 271 271 159 165 201 203 72 76 123 127 177 177 190 198 138 140 143 153 274 282 106 106 Glo275 172 188 195 195 224 232 273 275 159 165 203 203 72 76 123 123 175 177 186 194 136 148 147 149 282 286 106 106 Glo276 182 188 197 197 228 230 273 273 165 167 203 203 76 78 125 133 169 169 196 196 148 148 145 153 286 290 96 102 Glo277 180 188 195 197 210 226 275 275 155 161 203 205 76 76 123 127 169 177 186 186 148 148 147 149 274 286 102 106 Glo278 180 188 195 197 210 224 273 275 153 161 201 203 72 76 123 125 169 175 186 188 140 148 - - 282 282 102 104 Glo279 172 182 195 195 226 230 273 275 153 159 201 203 76 76 125 125 169 177 186 192 146 152 149 149 266 286 104 112 Glo280 182 188 197 199 228 228 271 271 153 159 203 203 76 76 123 123 175 177 198 198 140 154 147 153 274 286 96 112 Glo281 180 188 195 195 210 230 275 275 159 167 201 203 72 72 123 125 169 177 188 192 136 148 149 159 274 274 104 106 Glo282 180 188 191 195 228 232 271 275 155 161 203 203 72 76 119 123 169 175 186 186 148 152 149 149 286 290 98 106 Glo283 180 182 197 199 210 224 273 275 159 159 203 203 76 76 123 127 169 175 186 188 140 148 147 149 290 290 106 106 Glo284 180 180 191 195 224 230 267 275 151 161 201 203 76 76 119 123 169 169 186 196 140 148 149 149 282 290 102 102 Glo286 188 192 195 197 224 224 271 273 159 165 203 203 76 76 125 131 175 177 186 200 136 152 149 149 278 286 102 102 Glo287 180 188 197 199 210 226 273 275 159 159 203 203 76 80 121 123 169 179 184 186 150 150 147 149 266 282 96 106 Glo288 180 182 195 195 210 226 271 275 159 161 203 203 72 76 123 125 175 177 186 194 148 148 149 151 274 278 106 106 Glo289 180 180 195 197 210 228 273 275 151 159 203 203 76 76 121 125 177 179 184 186 140 150 147 151 278 282 98 102 Glo290 182 182 195 201 226 230 273 275 157 159 203 203 76 76 125 127 169 177 186 188 148 148 139 155 278 282 96 100

Glo291 178 188 195 199 210 232 269 271 161 165 203 203 72 76 123 129 169 171 188 194 148 148 153 153 278 286 102 112 Glo292 180 182 197 203 224 226 273 273 153 159 201 203 72 76 125 125 177 177 190 194 136 148 149 149 282 282 106 112 Glo294 180 194 195 195 226 228 275 275 151 159 201 203 72 76 125 127 177 177 186 192 136 150 151 151 282 286 104 104 Glo295 182 188 191 195 226 226 273 275 159 165 201 203 72 76 123 123 177 177 190 196 148 152 145 153 282 282 104 106 Glo296 180 188 197 199 226 228 271 275 157 159 201 203 72 76 123 125 169 177 188 194 136 146 147 147 290 290 102 102 Glo297 180 188 197 199 226 228 275 275 159 165 201 203 72 74 123 125 175 177 - - 136 140 149 153 282 290 106 106 Glo298 172 182 195 195 224 226 271 273 159 161 203 203 72 76 123 123 169 175 188 192 148 148 149 151 282 290 98 102 Glo299 194 194 193 195 224 228 273 273 151 153 201 203 76 76 123 125 169 177 194 196 148 154 149 149 286 286 102 106 Glo300 182 188 195 195 - - 273 275 157 159 203 203 76 76 123 125 175 177 188 198 148 148 147 149 278 282 104 106 Glo301 182 188 195 203 224 228 273 275 165 167 201 203 76 76 123 137 175 175 186 196 148 150 149 153 274 282 98 106 Glo302 180 182 195 197 224 226 271 275 157 161 203 203 72 76 123 123 169 175 188 192 146 148 147 149 286 290 106 106 Glo303 188 188 191 203 210 226 275 275 161 161 203 203 76 76 123 127 169 175 168 190 138 148 147 157 282 286 102 106 Glo304 180 180 195 197 224 224 273 275 155 161 203 203 72 72 123 127 169 175 186 198 148 152 149 149 286 286 98 104 Glo305 180 188 195 201 210 210 271 275 161 165 203 203 72 76 123 125 169 169 184 198 140 148 151 157 282 286 104 104 Glo306 180 180 195 201 210 224 271 275 153 165 203 203 72 72 125 131 169 177 184 192 138 140 153 157 274 282 102 110 Glo307 180 188 191 197 210 228 271 273 151 161 203 203 76 76 123 125 177 177 186 192 140 148 147 153 274 282 96 98 Glo308 188 188 195 195 224 224 275 275 155 157 203 203 72 76 119 123 169 177 186 192 142 152 149 157 274 290 102 108 Glo309 180 194 193 197 210 230 273 275 153 161 203 203 76 76 123 125 177 177 186 192 148 148 147 153 282 290 100 102 Glo310 178 188 193 197 224 228 275 275 151 151 203 203 76 76 127 129 169 177 186 196 146 148 149 155 282 282 98 102 Glo311 180 188 195 199 226 228 273 275 155 159 201 203 76 76 109 125 169 177 188 188 148 150 147 149 282 286 102 106 Glo312 182 188 195 203 210 224 273 275 151 159 203 203 72 72 123 125 169 169 186 196 138 148 149 151 270 274 102 102 Glo313 194 194 195 197 224 228 273 275 151 153 203 203 72 76 121 125 175 177 186 194 148 148 139 145 270 278 102 102 Glo314 182 182 195 197 226 226 275 275 151 159 203 203 72 78 125 125 169 177 194 196 136 148 147 149 274 274 96 114 Glo315 188 188 191 195 228 230 273 275 151 159 201 203 72 76 123 123 169 177 188 190 148 148 159 161 282 282 102 102 Glo316 180 188 197 197 224 228 273 275 159 159 203 203 76 76 121 123 169 173 186 190 148 150 147 149 278 282 104 106 Glo317 178 188 193 197 224 228 275 275 159 159 203 203 76 76 119 121 169 173 186 192 140 150 149 149 282 282 102 106 Glo318 180 182 197 197 224 232 275 275 159 161 203 203 72 76 121 123 169 177 186 190 136 136 147 149 274 290 98 106 Glo319 182 188 195 197 226 228 275 275 153 159 203 203 76 76 123 123 169 177 186 186 138 140 153 157 278 290 102 112
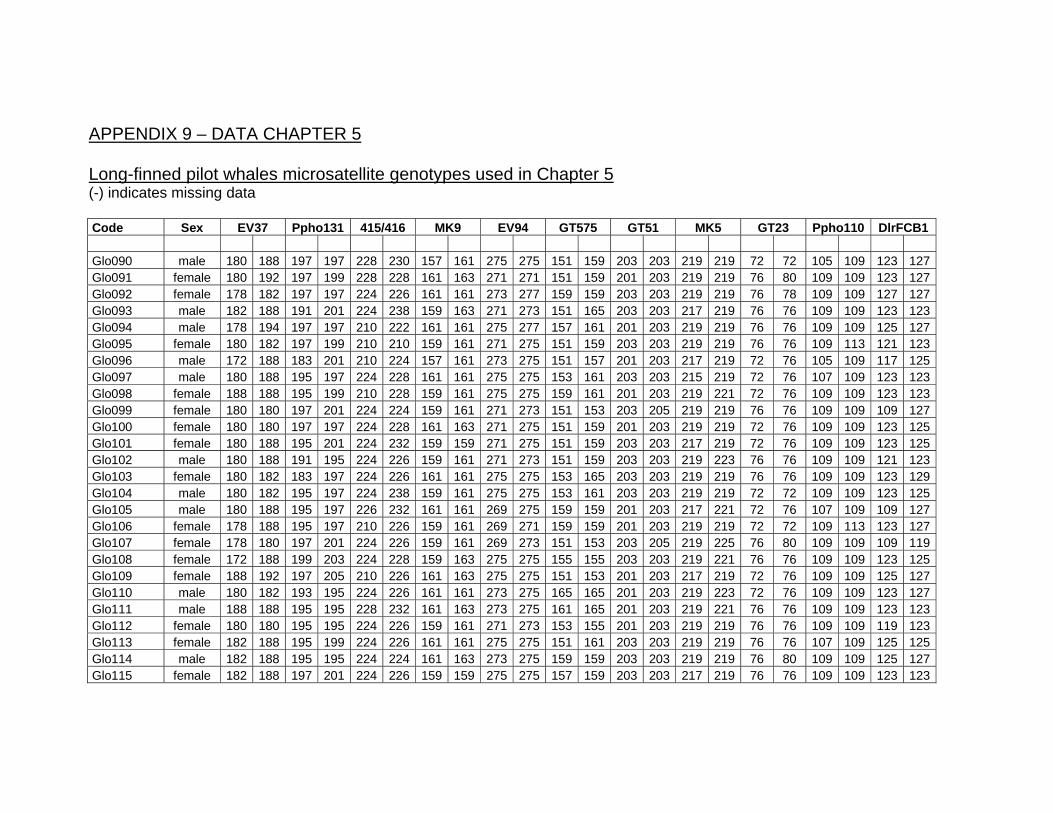
APPENDIX 9 – DATA CHAPTER 5 Long-finned pilot whales microsatellite genotypes used in Chapter 5 (-) indicates missing data Code Sex EV37 Ppho131 415/416 MK9 EV94 GT575 GT51 MK5 GT23 Ppho110 DlrFCB1 Glo090 male 180 188 197 197 228 230 157 161 275 275 151 159 203 203 219 219 72 72 105 109 123 127Glo091 female 180 192 197 199 228 228 161 163 271 271 151 159 201 203 219 219 76 80 109 109 123 127Glo092 female 178 182 197 197 224 226 161 161 273 277 159 159 203 203 219 219 76 78 109 109 127 127Glo093 male 182 188 191 201 224 238 159 163 271 273 151 165 203 203 217 219 76 76 109 109 123 123Glo094 male 178 194 197 197 210 222 161 161 275 277 157 161 201 203 219 219 76 76 109 109 125 127Glo095 female 180 182 197 199 210 210 159 161 271 275 151 159 203 203 219 219 76 76 109 113 121 123Glo096 male 172 188 183 201 210 224 157 161 273 275 151 157 201 203 217 219 72 76 105 109 117 125Glo097 male 180 188 195 197 224 228 161 161 275 275 153 161 203 203 215 219 72 76 107 109 123 123Glo098 female 188 188 195 199 210 228 159 161 275 275 159 161 201 203 219 221 72 76 109 109 123 123Glo099 female 180 180 197 201 224 224 159 161 271 273 151 153 203 205 219 219 76 76 109 109 109 127Glo100 female 180 180 197 197 224 228 161 163 271 275 151 159 201 203 219 219 72 76 109 109 123 125Glo101 female 180 188 195 201 224 232 159 159 271 275 151 159 203 203 217 219 72 76 109 109 123 125Glo102 male 180 188 191 195 224 226 159 161 271 273 151 159 203 203 219 223 76 76 109 109 121 123Glo103 female 180 182 183 197 224 226 161 161 275 275 153 165 203 203 219 219 76 76 109 109 123 129Glo104 male 180 182 195 197 224 238 159 161 275 275 153 161 203 203 219 219 72 72 109 109 123 125Glo105 male 180 188 195 197 226 232 161 161 269 275 159 159 201 203 217 221 72 76 107 109 109 127Glo106 female 178 188 195 197 210 226 159 161 269 271 159 159 201 203 219 219 72 72 109 113 123 127Glo107 female 178 180 197 201 224 226 159 161 269 273 151 153 203 205 219 225 76 80 109 109 109 119Glo108 female 172 188 199 203 224 228 159 163 275 275 155 155 203 203 219 221 76 76 109 109 123 125Glo109 female 188 192 197 205 210 226 161 163 275 275 151 153 201 203 217 219 72 76 109 109 125 127Glo110 male 180 182 193 195 224 226 161 161 273 275 165 165 201 203 219 223 72 76 109 109 123 127Glo111 male 188 188 195 195 228 232 161 163 273 275 161 165 201 203 219 221 76 76 109 109 123 123Glo112 female 180 180 195 195 224 226 159 161 271 273 153 155 201 203 219 219 76 76 109 109 119 123Glo113 female 182 188 195 199 224 226 161 161 275 275 151 161 203 203 219 219 76 76 107 109 125 125Glo114 male 182 188 195 195 224 224 161 163 273 275 159 159 203 203 219 219 76 80 109 109 125 127Glo115 female 182 188 197 201 224 226 159 159 275 275 157 159 203 203 217 219 76 76 109 109 123 123

Glo116 female 180 188 193 201 224 228 159 161 273 275 157 161 203 203 219 219 72 76 109 109 125 125Glo117 female 172 188 195 195 210 228 159 159 275 275 153 159 203 203 217 219 76 76 109 111 125 125Glo118 male 180 192 189 195 224 228 161 161 271 275 151 151 203 203 215 219 72 76 109 109 125 125Glo119 male 180 188 197 199 210 224 159 161 271 275 159 159 203 203 219 219 72 76 109 109 121 125Glo120 female 172 182 195 199 224 228 159 159 271 275 153 161 203 203 219 219 72 76 109 109 117 127Glo121 male 188 188 197 199 210 224 161 163 275 275 151 161 201 203 217 219 72 76 107 109 123 123Glo122 male 180 188 195 201 224 228 159 161 275 275 159 159 203 203 217 217 72 76 111 113 125 125Glo123 female 172 192 195 197 228 228 157 161 275 275 151 165 203 203 219 219 72 76 109 109 121 127Glo124 female 182 182 195 195 226 234 159 161 273 275 153 159 203 203 219 223 72 76 109 109 127 127Glo125 male 178 178 195 197 224 228 159 161 271 275 151 159 201 201 219 219 76 78 109 109 123 125Glo126 female 188 188 197 199 226 226 159 161 273 275 151 165 201 203 217 219 72 72 109 109 119 125Glo127 male 182 188 183 197 226 234 159 161 271 271 159 159 203 203 217 219 72 76 109 109 109 127Glo128 female 180 188 199 201 224 226 161 161 271 273 155 159 203 203 219 219 72 76 109 109 123 127Glo129 female 180 180 195 197 224 228 159 161 273 273 153 165 203 203 217 219 72 76 109 109 123 123Glo130 female 180 188 195 197 210 224 161 161 271 275 151 159 203 203 217 219 76 76 109 113 123 127Glo131 male 188 192 195 197 226 228 161 163 271 275 151 151 201 203 217 219 72 76 109 109 125 125Glo132 female 180 188 201 203 224 224 159 163 273 275 153 159 201 203 217 219 76 76 109 109 121 125Glo133 male 180 182 195 197 224 226 159 159 273 273 153 153 203 203 219 223 76 76 109 109 127 129Glo134 female 182 188 197 201 224 228 161 163 273 275 157 165 203 203 219 219 72 76 109 109 121 125Glo135 male 188 194 195 197 224 230 159 163 273 275 159 159 203 203 219 219 76 76 109 111 125 127Glo136 male 182 188 195 197 224 226 161 163 271 275 159 159 203 203 219 219 72 76 109 109 125 127Glo137 female 180 180 195 197 210 210 161 161 273 275 151 155 201 203 219 219 76 76 109 109 117 123Glo138 female 178 188 195 199 226 228 159 159 271 275 153 161 203 203 217 219 72 76 109 109 125 127Glo139 female 188 192 197 199 230 230 161 161 273 275 153 165 203 203 219 219 72 76 109 109 121 125Glo140 female 180 188 197 201 224 226 163 163 275 275 159 159 201 203 219 219 76 76 109 109 123 125Glo141 male 180 180 191 195 210 226 159 161 273 273 159 165 201 201 219 219 72 76 109 109 123 125Glo142 male 180 188 197 199 224 224 159 159 271 275 153 165 203 203 217 219 76 76 109 109 127 127Glo143 male 188 194 193 203 210 210 159 161 275 275 151 161 203 203 219 219 76 76 109 109 125 125Glo144 female 182 188 195 195 224 230 161 163 275 275 159 165 203 203 219 219 76 76 109 111 119 125Glo145 male 180 180 195 197 210 224 159 161 275 275 151 153 201 203 219 223 76 76 109 109 123 123Glo146 female 180 182 191 197 226 230 161 163 273 275 151 157 201 203 219 221 72 76 109 109 109 123Glo147 female 188 188 195 197 224 226 161 163 271 273 159 161 201 203 217 219 76 76 109 109 125 125Glo148 female 180 182 195 197 226 232 159 161 269 275 159 161 203 203 217 219 72 76 109 109 109 125Glo149 female 180 180 191 199 224 228 159 159 273 275 151 165 203 203 217 219 72 76 109 111 125 127
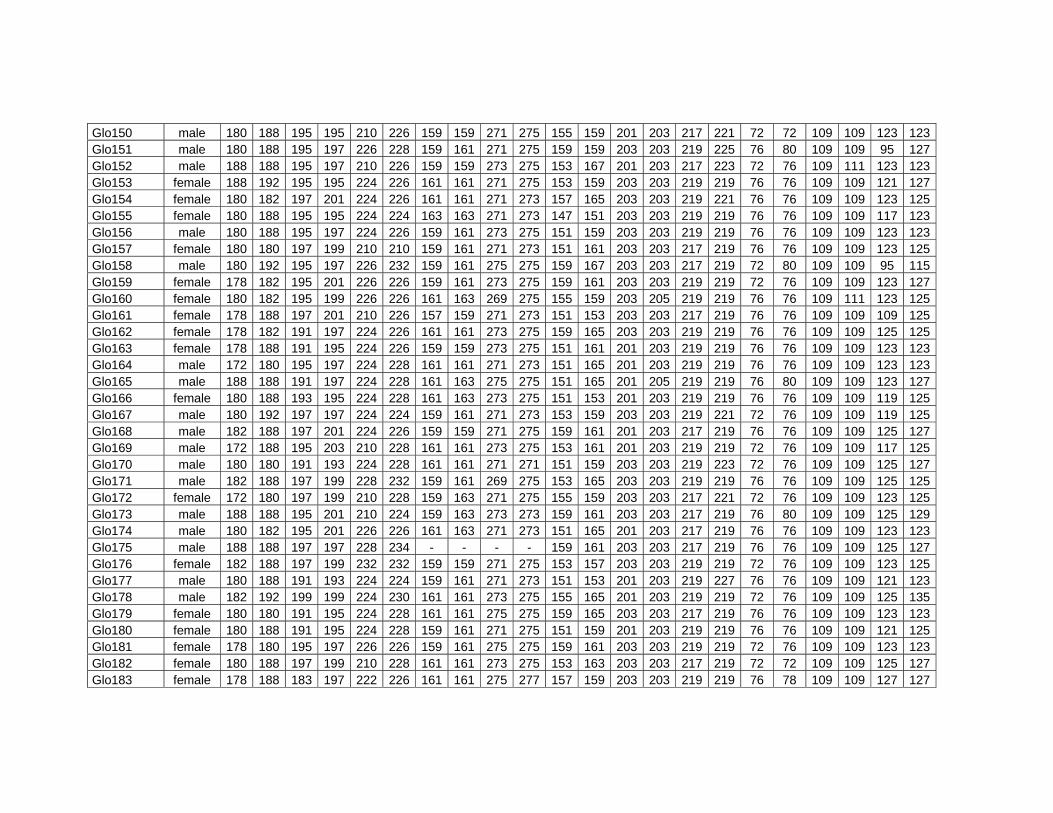
Glo150 male 180 188 195 195 210 226 159 159 271 275 155 159 201 203 217 221 72 72 109 109 123 123Glo151 male 180 188 195 197 226 228 159 161 271 275 159 159 203 203 219 225 76 80 109 109 95 127Glo152 male 188 188 195 197 210 226 159 159 273 275 153 167 201 203 217 223 72 76 109 111 123 123Glo153 female 188 192 195 195 224 226 161 161 271 275 153 159 203 203 219 219 76 76 109 109 121 127Glo154 female 180 182 197 201 224 226 161 161 271 273 157 165 203 203 219 221 76 76 109 109 123 125Glo155 female 180 188 195 195 224 224 163 163 271 273 147 151 203 203 219 219 76 76 109 109 117 123Glo156 male 180 188 195 197 224 226 159 161 273 275 151 159 203 203 219 219 76 76 109 109 123 123Glo157 female 180 180 197 199 210 210 159 161 271 273 151 161 203 203 217 219 76 76 109 109 123 125Glo158 male 180 192 195 197 226 232 159 161 275 275 159 167 203 203 217 219 72 80 109 109 95 115Glo159 female 178 182 195 201 226 226 159 161 273 275 159 161 203 203 219 219 72 76 109 109 123 127Glo160 female 180 182 195 199 226 226 161 163 269 275 155 159 203 205 219 219 76 76 109 111 123 125Glo161 female 178 188 197 201 210 226 157 159 271 273 151 153 203 203 217 219 76 76 109 109 109 125Glo162 female 178 182 191 197 224 226 161 161 273 275 159 165 203 203 219 219 76 76 109 109 125 125Glo163 female 178 188 191 195 224 226 159 159 273 275 151 161 201 203 219 219 76 76 109 109 123 123Glo164 male 172 180 195 197 224 228 161 161 271 273 151 165 201 203 219 219 76 76 109 109 123 123Glo165 male 188 188 191 197 224 228 161 163 275 275 151 165 201 205 219 219 76 80 109 109 123 127Glo166 female 180 188 193 195 224 228 161 163 273 275 151 153 201 203 219 219 76 76 109 109 119 125Glo167 male 180 192 197 197 224 224 159 161 271 273 153 159 203 203 219 221 72 76 109 109 119 125Glo168 male 182 188 197 201 224 226 159 159 271 275 159 161 201 203 217 219 76 76 109 109 125 127Glo169 male 172 188 195 203 210 228 161 161 273 275 153 161 201 203 219 219 72 76 109 109 117 125Glo170 male 180 180 191 193 224 228 161 161 271 271 151 159 203 203 219 223 72 76 109 109 125 127Glo171 male 182 188 197 199 228 232 159 161 269 275 153 165 203 203 219 219 76 76 109 109 125 125Glo172 female 172 180 197 199 210 228 159 163 271 275 155 159 203 203 217 221 72 76 109 109 123 125Glo173 male 188 188 195 201 210 224 159 163 273 273 159 161 203 203 217 219 76 80 109 109 125 129Glo174 male 180 182 195 201 226 226 161 163 271 273 151 165 201 203 217 219 76 76 109 109 123 123Glo175 male 188 188 197 197 228 234 - - - - 159 161 203 203 217 219 76 76 109 109 125 127Glo176 female 182 188 197 199 232 232 159 159 271 275 153 157 203 203 219 219 72 76 109 109 123 125Glo177 male 180 188 191 193 224 224 159 161 271 273 151 153 201 203 219 227 76 76 109 109 121 123Glo178 male 182 192 199 199 224 230 161 161 273 275 155 165 201 203 219 219 72 76 109 109 125 135Glo179 female 180 180 191 195 224 228 161 161 275 275 159 165 203 203 217 219 76 76 109 109 123 123Glo180 female 180 188 191 195 224 228 159 161 271 275 151 159 201 203 219 219 76 76 109 109 121 125Glo181 female 178 180 195 197 226 226 159 161 275 275 159 161 203 203 219 219 72 76 109 109 123 123Glo182 female 180 188 197 199 210 228 161 161 273 275 153 163 203 203 217 219 72 72 109 109 125 127Glo183 female 178 188 183 197 222 226 161 161 275 277 157 159 203 203 219 219 76 78 109 109 127 127

Glo184 female 178 192 191 195 226 226 159 161 273 273 165 165 203 203 219 219 76 76 109 109 125 127Glo185 female 180 188 195 197 210 226 159 161 273 275 153 155 203 203 219 219 76 76 109 109 121 125Glo186 female 180 182 197 201 226 228 161 161 271 273 151 151 201 203 219 219 72 76 109 109 125 127Glo187 female 180 182 197 199 224 228 161 163 271 273 159 159 203 203 219 221 76 76 109 109 123 125Glo188 male 172 190 197 199 228 234 159 161 275 275 155 159 203 203 217 219 76 76 109 109 123 125Glo189 female 180 192 191 195 224 226 161 161 273 275 161 165 203 203 217 219 72 76 109 109 127 127Glo190 female 180 188 195 195 210 226 159 161 271 273 159 165 201 203 219 219 76 76 109 109 125 127Glo191 female 188 188 197 199 210 226 159 161 275 275 163 167 201 203 217 221 76 76 109 111 123 123Glo192 female 180 188 193 197 228 230 161 161 271 275 153 159 203 203 217 219 76 76 109 109 125 125Glo193 female 182 188 197 205 210 224 161 161 275 275 151 161 203 203 217 219 72 76 109 113 121 123Glo194 female 180 188 195 195 226 228 159 161 271 275 159 159 203 203 217 219 76 80 109 109 125 129Glo195 female 180 188 193 197 228 230 159 163 275 275 153 153 203 203 219 223 76 76 109 109 123 125Glo196 female 172 188 199 199 224 228 159 161 271 273 153 153 203 203 219 219 72 76 109 109 125 127Glo197 female 188 188 195 195 224 232 159 161 271 273 153 165 203 203 217 219 72 76 109 109 125 127Glo198 female 182 188 195 197 224 224 159 163 271 273 147 157 201 203 219 219 72 76 109 109 123 125Glo199 female 180 180 195 197 224 228 - - - - 159 161 201 203 219 219 76 76 109 109 123 125Glo200 female 180 192 195 197 226 228 157 161 275 275 151 153 203 203 217 219 72 76 109 109 125 127Glo201 female 182 188 195 197 234 234 157 161 271 275 153 159 203 203 219 223 72 76 109 113 127 127Glo202 female 180 188 195 195 226 230 159 159 275 275 159 159 203 203 219 219 76 80 109 109 95 125Glo203 female 180 188 191 197 210 224 161 163 275 275 151 165 203 205 219 219 76 76 109 109 123 123Glo204 female 180 188 195 195 226 232 157 159 273 273 153 165 203 203 219 219 72 76 109 109 125 125Glo205 male 180 182 199 203 210 228 159 161 269 275 151 151 203 203 217 219 72 76 109 111 127 127Glo206 female 180 188 193 197 224 230 159 159 271 275 153 153 203 203 219 219 76 76 109 109 121 123Glo207 male 188 190 195 197 228 228 159 161 275 275 153 159 203 203 219 219 76 76 109 109 125 125Glo208 female 182 188 197 201 210 224 161 161 271 275 151 161 203 203 215 219 76 76 109 109 123 125Glo209 female 180 188 197 197 226 238 159 159 275 275 159 161 203 203 219 219 72 76 109 109 123 123Glo210 male 180 188 195 197 224 228 159 161 273 275 151 153 203 203 219 223 72 76 109 109 123 123Glo211 female 180 188 193 195 228 228 159 161 275 275 153 153 203 203 219 223 76 76 109 109 123 125 DlrFCB6 409/470 464/465 EV1 GT6 MK6 GATA53 MK8 GT39 X Y
175 177 184 194 140 140 149 157 190 190 134 138 286 286 96 106 139 151 25.00 59.00 177 177 168 188 138 140 145 147 190 194 138 138 278 282 92 104 139 151 55.00 58.00

169 169 186 192 148 148 147 151 190 190 138 138 290 290 96 106 139 151 66.00 50.00 169 175 182 186 148 150 149 153 190 204 138 138 274 290 104 114 139 155 73.00 54.00 169 177 188 194 148 150 149 149 190 190 138 138 286 290 106 108 139 139 84.00 57.00 175 177 186 186 138 148 149 149 190 190 138 138 270 290 96 102 139 151 110.00 41.00 169 169 188 198 148 148 149 163 190 190 138 138 278 286 102 104 139 151 109.00 58.00 173 177 186 196 148 148 149 161 190 190 138 140 274 274 104 104 151 151 110.00 64.00 177 179 186 196 148 150 149 153 190 190 138 140 274 282 104 110 151 153 123.00 51.00 169 169 188 190 138 148 147 149 190 204 138 138 278 278 104 112 139 151 134.00 67.00 169 177 168 186 140 148 145 163 190 190 138 138 282 290 92 104 151 151 148.00 69.00 169 169 186 192 148 148 151 153 204 204 138 138 274 294 102 104 151 151 164.00 61.00 161 175 190 194 148 152 149 153 190 204 138 138 266 266 98 104 151 151 149.00 46.00 169 169 186 192 140 148 149 149 190 190 138 138 274 278 104 110 151 153 151.00 40.00 169 175 186 194 148 148 147 149 190 190 138 138 274 290 104 106 151 151 172.00 46.00 175 175 186 188 148 148 145 149 190 190 138 138 270 286 102 104 151 151 180.00 46.00 169 175 190 196 148 150 147 147 190 190 138 138 282 286 102 110 139 153 189.00 44.00 169 177 188 194 148 152 149 149 190 204 138 138 278 282 104 112 139 139 181.00 54.00 169 177 194 196 148 154 149 155 190 204 138 140 274 286 102 104 139 151 208.00 65.00 175 175 186 198 140 148 149 149 190 190 138 140 282 286 96 104 139 151 212.00 59.00 169 169 190 194 146 148 149 157 190 190 138 138 278 282 96 104 139 151 233.00 58.00 173 177 186 194 148 148 149 149 190 190 138 138 282 286 110 110 151 153 256.00 68.00 169 175 188 196 138 138 149 153 190 190 138 138 274 290 102 106 139 151 256.00 62.00 161 175 190 196 148 148 149 149 190 190 138 138 266 278 104 106 151 151 267.00 60.00 169 177 188 194 148 150 149 149 190 190 138 140 274 286 102 104 139 151 287.00 55.00 175 175 186 192 148 152 149 155 190 190 138 138 282 286 104 106 151 151 296.00 74.00 169 169 190 194 148 148 149 157 190 190 138 138 278 282 98 104 151 153 290.00 70.00 169 177 188 190 148 148 147 149 190 190 138 138 290 290 102 110 139 151 300.00 58.00 175 177 184 194 140 148 149 151 190 204 138 138 278 286 102 106 139 151 327.00 53.00 169 175 186 192 138 148 149 149 190 190 138 138 270 290 102 102 139 139 340.00 50.00 171 177 186 192 138 152 147 149 190 190 138 138 286 290 102 106 139 139 344.00 64.00 175 177 186 196 148 150 149 153 190 190 138 138 270 282 94 110 151 153 360.00 62.00 169 169 190 192 148 148 149 149 190 190 138 138 278 290 102 106 139 139 370.00 53.00 169 175 186 192 140 146 149 149 190 190 138 138 282 286 96 106 139 151 373.00 59.00 169 169 196 196 146 150 153 153 190 190 138 138 270 278 96 104 151 151 384.00 57.00 169 177 186 190 148 148 149 153 190 204 138 138 278 286 102 102 139 151 390.00 59.00

169 177 186 190 148 148 149 151 190 190 138 138 282 286 102 106 151 151 403.00 70.00 169 169 186 196 140 148 147 149 190 190 138 140 282 290 96 104 151 151 387.00 42.00 169 177 186 192 138 148 147 153 190 204 138 138 274 278 102 104 151 151 415.00 70.00 169 175 194 196 148 152 147 149 190 190 138 138 274 278 94 104 151 151 440.00 71.00 175 177 186 186 148 148 149 149 190 190 138 138 270 278 96 102 151 151 444.00 61.00 175 177 184 186 140 140 149 151 190 204 138 138 278 286 104 106 139 139 458.00 59.00 169 177 194 196 148 148 147 149 190 190 138 138 274 286 94 104 139 151 462.00 53.00 169 169 186 196 136 150 153 153 190 190 138 138 278 278 96 102 151 151 470.00 48.00 169 169 194 196 140 152 149 153 190 190 138 138 274 286 102 102 139 151 478.00 46.00 169 177 186 186 140 148 147 149 190 190 138 138 270 290 104 106 139 139 505.00 36.00 169 171 190 192 138 150 149 149 190 204 138 140 282 286 106 108 139 151 528.00 30.00 175 177 184 186 148 148 149 153 190 190 138 138 286 290 96 108 151 151 538.00 27.00 177 177 186 194 146 150 149 149 190 212 138 138 290 290 106 110 139 151 559.00 28.00 169 177 184 186 138 148 147 151 190 190 138 138 282 282 102 102 151 151 577.00 42.00 169 175 186 196 138 148 147 149 190 190 138 138 286 286 104 104 139 151 592.00 34.00 169 177 194 196 148 154 147 153 190 190 138 138 270 290 102 106 139 151 597.00 27.00 169 175 186 190 148 148 147 147 190 190 138 138 266 274 96 98 151 151 606.00 30.00 169 169 184 188 148 150 149 157 190 190 138 138 282 290 102 104 139 151 629.00 36.00 169 169 186 196 140 148 149 149 190 190 138 140 270 270 102 104 139 151 626.00 26.00 169 177 184 194 148 148 149 153 190 190 138 138 282 286 102 106 151 151 648.00 24.00 175 175 186 186 136 148 147 149 190 190 138 138 282 286 102 104 139 151 609.00 44.00 169 169 188 190 138 148 149 149 190 204 138 140 274 286 102 108 139 139 637.00 48.00 169 175 188 196 136 148 145 149 190 190 138 138 286 290 98 104 139 151 637.00 41.00 169 169 186 196 148 148 147 149 190 190 138 138 266 282 98 102 139 151 661.00 43.00 169 175 192 196 150 152 149 153 190 190 138 138 278 290 106 108 139 151 677.00 26.00 169 175 196 196 138 148 145 149 190 190 138 138 270 274 102 102 139 151 678.00 48.00 169 177 184 186 148 148 139 161 190 190 138 138 282 286 102 108 139 151 667.00 52.00 169 177 184 186 148 150 147 159 190 190 138 138 282 290 102 104 151 151 687.00 44.00 169 173 184 186 148 148 149 149 190 190 138 138 270 286 102 110 151 153 693.00 37.00 169 177 168 192 138 148 147 151 190 190 138 138 278 278 96 102 139 151 713.00 45.00 175 175 186 186 148 148 147 147 190 190 138 138 274 286 102 104 139 151 721.00 40.00 169 175 184 186 148 148 147 149 190 190 138 138 286 290 96 102 151 151 747.00 30.00 169 175 194 198 136 148 139 149 190 190 138 138 270 278 102 106 139 151 750.00 38.00 169 177 186 192 148 148 145 153 190 190 138 138 278 286 102 106 151 151 747.00 46.00

169 177 186 196 140 148 153 155 190 190 138 138 274 286 102 106 151 153 765.00 55.00 169 175 188 192 148 148 147 149 190 204 138 138 278 290 96 104 139 151 763.00 25.00 169 169 192 194 150 152 147 147 190 190 138 138 270 286 102 102 151 151 761.00 30.00 169 169 194 196 142 150 145 149 190 190 138 138 274 282 102 106 151 151 770.00 32.00 169 177 168 186 140 148 147 153 190 194 138 138 278 286 92 102 139 151 762.00 40.00 169 177 194 196 140 150 149 153 190 212 138 138 274 282 102 104 151 151 784.00 45.00 171 175 196 196 138 148 149 159 190 190 138 138 278 290 102 108 151 151 788.00 51.00 169 169 186 186 148 148 147 147 190 190 138 138 282 290 102 102 - - 790.00 61.00 169 177 186 188 140 148 145 153 190 190 138 138 274 286 106 106 151 151 795.00 55.00 169 169 184 196 146 148 153 157 190 202 138 138 282 282 102 110 139 151 820.00 48.00 169 177 186 196 138 140 149 159 190 190 138 138 278 278 102 102 139 151 840.00 47.00 177 179 194 196 136 148 149 153 190 190 138 138 278 286 102 106 139 139 831.00 62.00 173 177 184 196 148 154 147 149 190 190 138 138 274 278 102 104 151 151 860.00 49.00 169 177 186 194 148 148 149 153 190 190 138 138 286 290 102 104 151 153 839.00 36.00 169 169 168 184 138 148 149 151 190 190 138 138 278 286 96 106 139 151 837.00 67.00 169 177 184 192 138 146 149 153 190 190 138 138 282 286 98 106 151 151 848.00 71.00 169 177 186 194 136 136 149 149 190 190 138 138 270 278 102 106 139 151 859.00 67.00 169 177 184 186 140 148 149 149 190 202 138 138 282 290 98 106 139 151 887.00 47.00 169 169 184 198 148 148 147 149 190 190 138 138 282 290 102 108 139 151 871.00 68.00 169 175 194 194 146 148 149 149 190 190 138 138 278 282 96 102 151 151 913.00 61.00 161 177 168 190 138 148 149 149 190 190 138 138 266 278 104 106 139 151 883.00 59.00 169 177 192 196 142 148 145 149 190 190 138 138 278 282 98 106 139 151 924.00 40.00 177 177 186 196 150 150 149 149 190 190 138 138 278 290 98 102 139 139 917.00 71.00 169 177 188 192 148 148 147 149 190 190 138 138 278 290 106 106 139 151 940.00 53.00 169 177 186 192 136 152 145 147 190 204 138 138 278 286 102 106 151 151 954.00 59.00 177 177 184 190 138 138 145 153 190 190 138 138 286 290 106 108 151 151 965.00 65.00 169 177 186 186 140 148 153 163 190 190 138 138 282 290 98 104 151 151 967.00 47.00 169 177 186 196 140 148 149 149 190 190 138 138 274 286 94 102 139 151 966.00 40.00 173 177 186 196 148 148 147 153 190 204 138 138 274 282 102 104 151 151 984.00 52.00 173 177 186 190 148 152 147 147 190 190 138 138 278 282 98 104 139 151 989.00 72.00 169 169 186 196 148 150 147 153 190 190 138 138 270 282 94 102 139 151 1011.00 57.00 177 177 184 194 148 148 139 153 190 190 138 138 278 286 102 104 139 151 1024.00 59.00 169 175 192 196 138 146 149 159 190 192 138 138 270 278 96 102 139 151 1020.00 43.00 169 175 186 194 148 148 147 149 190 190 138 138 270 290 102 104 151 151 1050.00 63.00
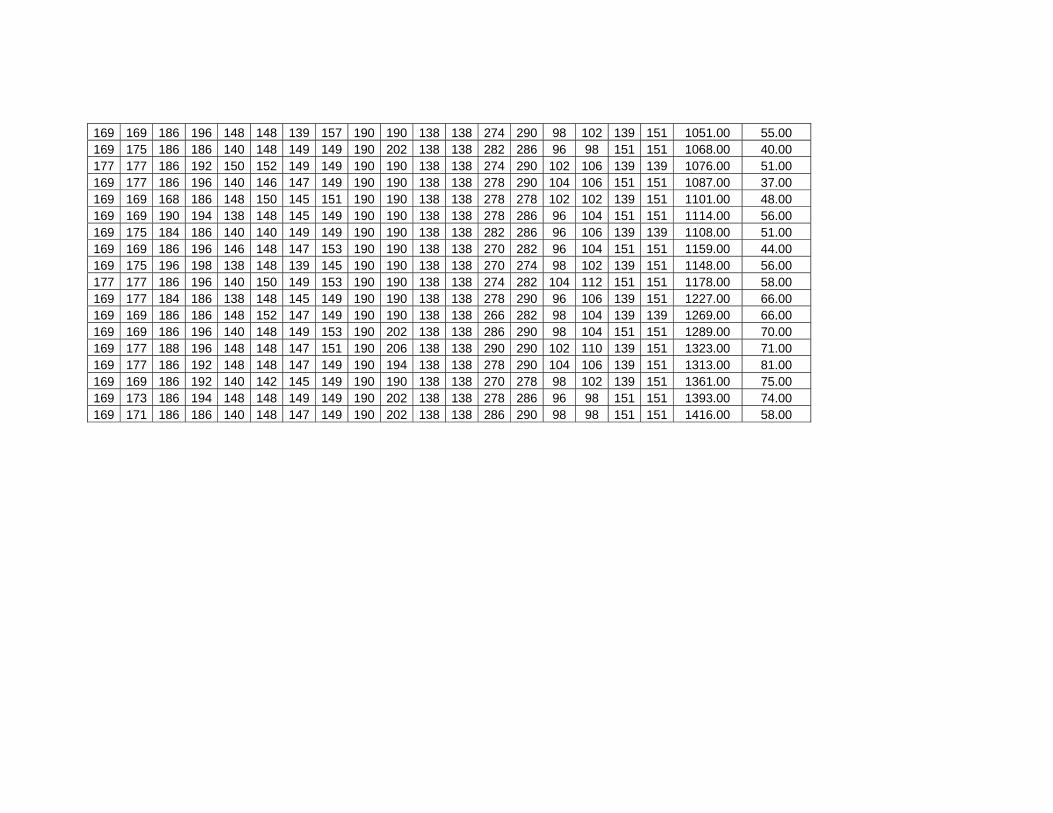
169 169 186 196 148 148 139 157 190 190 138 138 274 290 98 102 139 151 1051.00 55.00 169 175 186 186 140 148 149 149 190 202 138 138 282 286 96 98 151 151 1068.00 40.00 177 177 186 192 150 152 149 149 190 190 138 138 274 290 102 106 139 139 1076.00 51.00 169 177 186 196 140 146 147 149 190 190 138 138 278 290 104 106 151 151 1087.00 37.00 169 169 168 186 148 150 145 151 190 190 138 138 278 278 102 102 139 151 1101.00 48.00 169 169 190 194 138 148 145 149 190 190 138 138 278 286 96 104 151 151 1114.00 56.00 169 175 184 186 140 140 149 149 190 190 138 138 282 286 96 106 139 139 1108.00 51.00 169 169 186 196 146 148 147 153 190 190 138 138 270 282 96 104 151 151 1159.00 44.00 169 175 196 198 138 148 139 145 190 190 138 138 270 274 98 102 139 151 1148.00 56.00 177 177 186 196 140 150 149 153 190 190 138 138 274 282 104 112 151 151 1178.00 58.00 169 177 184 186 138 148 145 149 190 190 138 138 278 290 96 106 139 151 1227.00 66.00 169 169 186 186 148 152 147 149 190 190 138 138 266 282 98 104 139 139 1269.00 66.00 169 169 186 196 140 148 149 153 190 202 138 138 286 290 98 104 151 151 1289.00 70.00 169 177 188 196 148 148 147 151 190 206 138 138 290 290 102 110 139 151 1323.00 71.00 169 177 186 192 148 148 147 149 190 194 138 138 278 290 104 106 139 151 1313.00 81.00 169 169 186 192 140 142 145 149 190 190 138 138 270 278 98 102 139 151 1361.00 75.00 169 173 186 194 148 148 149 149 190 202 138 138 278 286 96 98 151 151 1393.00 74.00 169 171 186 186 140 148 147 149 190 202 138 138 286 290 98 98 151 151 1416.00 58.00
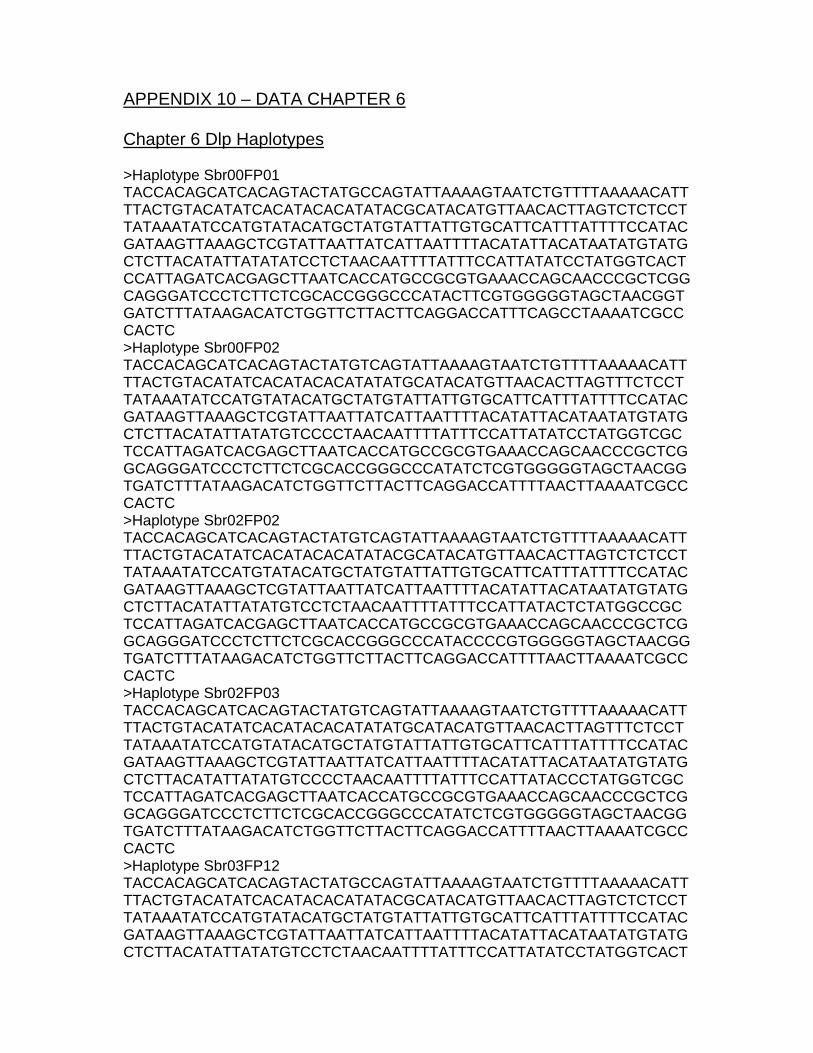
APPENDIX 10 – DATA CHAPTER 6 Chapter 6 Dlp Haplotypes >Haplotype Sbr00FP01 TACCACAGCATCACAGTACTATGCCAGTATTAAAAGTAATCTGTTTTAAAAACATTTTACTGTACATATCACATACACATATACGCATACATGTTAACACTTAGTCTCTCCTTATAAATATCCATGTATACATGCTATGTATTATTGTGCATTCATTTATTTTCCATACGATAAGTTAAAGCTCGTATTAATTATCATTAATTTTACATATTACATAATATGTATGCTCTTACATATTATATATCCTCTAACAATTTTATTTCCATTATATCCTATGGTCACTCCATTAGATCACGAGCTTAATCACCATGCCGCGTGAAACCAGCAACCCGCTCGGCAGGGATCCCTCTTCTCGCACCGGGCCCATACTTCGTGGGGGTAGCTAACGGTGATCTTTATAAGACATCTGGTTCTTACTTCAGGACCATTTCAGCCTAAAATCGCCCACTC >Haplotype Sbr00FP02 TACCACAGCATCACAGTACTATGTCAGTATTAAAAGTAATCTGTTTTAAAAACATTTTACTGTACATATCACATACACATATATGCATACATGTTAACACTTAGTTTCTCCTTATAAATATCCATGTATACATGCTATGTATTATTGTGCATTCATTTATTTTCCATACGATAAGTTAAAGCTCGTATTAATTATCATTAATTTTACATATTACATAATATGTATGCTCTTACATATTATATGTCCCCTAACAATTTTATTTCCATTATATCCTATGGTCGCTCCATTAGATCACGAGCTTAATCACCATGCCGCGTGAAACCAGCAACCCGCTCGGCAGGGATCCCTCTTCTCGCACCGGGCCCATATCTCGTGGGGGTAGCTAACGGTGATCTTTATAAGACATCTGGTTCTTACTTCAGGACCATTTTAACTTAAAATCGCCCACTC >Haplotype Sbr02FP02 TACCACAGCATCACAGTACTATGTCAGTATTAAAAGTAATCTGTTTTAAAAACATTTTACTGTACATATCACATACACATATACGCATACATGTTAACACTTAGTCTCTCCTTATAAATATCCATGTATACATGCTATGTATTATTGTGCATTCATTTATTTTCCATACGATAAGTTAAAGCTCGTATTAATTATCATTAATTTTACATATTACATAATATGTATGCTCTTACATATTATATGTCCTCTAACAATTTTATTTCCATTATACTCTATGGCCGCTCCATTAGATCACGAGCTTAATCACCATGCCGCGTGAAACCAGCAACCCGCTCGGCAGGGATCCCTCTTCTCGCACCGGGCCCATACCCCGTGGGGGTAGCTAACGGTGATCTTTATAAGACATCTGGTTCTTACTTCAGGACCATTTTAACTTAAAATCGCCCACTC >Haplotype Sbr02FP03 TACCACAGCATCACAGTACTATGTCAGTATTAAAAGTAATCTGTTTTAAAAACATTTTACTGTACATATCACATACACATATATGCATACATGTTAACACTTAGTTTCTCCTTATAAATATCCATGTATACATGCTATGTATTATTGTGCATTCATTTATTTTCCATACGATAAGTTAAAGCTCGTATTAATTATCATTAATTTTACATATTACATAATATGTATGCTCTTACATATTATATGTCCCCTAACAATTTTATTTCCATTATACCCTATGGTCGCTCCATTAGATCACGAGCTTAATCACCATGCCGCGTGAAACCAGCAACCCGCTCGGCAGGGATCCCTCTTCTCGCACCGGGCCCATATCTCGTGGGGGTAGCTAACGGTGATCTTTATAAGACATCTGGTTCTTACTTCAGGACCATTTTAACTTAAAATCGCCCACTC >Haplotype Sbr03FP12 TACCACAGCATCACAGTACTATGCCAGTATTAAAAGTAATCTGTTTTAAAAACATTTTACTGTACATATCACATACACATATACGCATACATGTTAACACTTAGTCTCTCCTTATAAATATCCATGTATACATGCTATGTATTATTGTGCATTCATTTATTTTCCATACGATAAGTTAAAGCTCGTATTAATTATCATTAATTTTACATATTACATAATATGTATGCTCTTACATATTATATGTCCTCTAACAATTTTATTTCCATTATATCCTATGGTCACT

CCATTAGATCACGAGCTTAATCACCATGCCGCGTGAAACCAGCAACCCGCTCGGCAGGGATCCCTCTTCTCGCACCGGGCCCATACCTCGTGGGGGTAGCTAACGGTGATCTTTATAAGACATCTGGTTCTTACTTCAGGACCATTTCAACCTAAAATCGCCCACTC >Haplotype h6 TACCACAGCATCACAGTACTATGCCAGTATTAAAAGTAATCTGTTTTAAAAACATTTTACTGTACATATCACATACACATATACGCATACATGTTAACACTTAGTCTCTCCTTATAAATATCCATGTATACATGCTATGTATTATTGTGCATTCATTTATTTTCCATACGATAAGTTAAAGCTCGTATTAATTATCATTAATTTTACATATTACATAATATGTATGCTCTTACATATTATATGTCCTCTAACAATTTTATTTCCATTATATCCTATGGTCACTCCATTAGATCACGAGCTTAATCACCATGCCGCGTGAAACCAGCAACCCGCTCGGCAGGGATCCCTCTTCTCGCACCGGGCCCATACCTCGTGGGGGTAGCTAACGGTGATCTTTATAAGACATCTGGTTCTTACTTCAGGACCATTTCAACTTAAAATCGCCCACTC >Haplotype h7 TACCACAGCATCACAGTACTATGTCAGTATTAAAAGTAATCTGTTTTAAAAACATTTTACTGTACATATCACATACACATATACGCATACATGTTAACACTTAGTCTCTCCTTATAAATATCCATGTATACATGCTATGTATTATTGTGCATTCATTTATTTTCCATACGATAAGTTAAAGCTCGTATTAATTATCATTAATTTTACATATTACATAATATGTATGCTCTTACATATTATATGTCCTCTAACAATTTTATTTCCATTATACCCTATGGTCGCTCCATTAGATCACGAGCTTAATCACCATGCCGCGTGAAACCAGCAACCCGCTCGGCAGGGATCCCTCTTCTCGCACCGGGCCCATACCCCGTGGGGGTAGCTAACGGTGATCTTTATAAGACATCTGGTTCTTACTTCAGGACCATTTTAACTTAAAATCGCCCACTC >Haplotype h8 TACCACAGCATCACAGTACTATGTCAGTATTAAAAGTAATCTGTTTTAAAAACATTTTACTGTACATATCACATACACATATATGCATACATGTTAACACTTAGTTTCTCCTTATAAATATCCATGTATACATGCTATGTATTATTGTGCATTCATTTATTTTCCATACGATAAGTTAAAGCTCGTATTAATTATCATTAATTTTACATATTACATAATATGTATGCTCTTACATATTATATGTCCCCTAACAATTTTATTTCCATTATATCCTATGGTCGCTCCATTAGATCACGAGCTTAATCACCATGCCGCGTGAAACCAGCAACCCGCTCGGCAGGGATCCCTCTTCTCGCACCGGGCCCATATCCCGTGGGGGTAGCTAACGGTGATCTTTATAAGACATCTGGTTCTTACTTCAGG??????????????????????????? >Haplotype h9 TACCACAGCATCACAGTACTATGTCAGTATTAAAAGTAATCTGTTTTAAAAACATTTTACTGTACATATCACATACACATATACGCATACATGTTAACACTTAGTTTCTCCTTATAAATATCCATGTATACATGCTATGTATTATTGTGCATTCATTTATTTTCCATACGATAAGTTAAAGCTCGTATTAATTATCATTAATTTTACATATTACATAATATGTATGCTCTTACATATTATATATCCTCTAACAATTTTATTTCCATTATATCCTATGGTCACTCCATTAGATCACGAGCTTAATCACCATGCCGCGTGAAACCAGCAACCCGCTCGGCAGGGATCCCTCTTCTCGCACCGGGCCCATATCTCGTGGGGGTAGCTAACGGTGATCTTTATAAGACATCTGGTTCTTACTTCAGG??????????????????????????? >Haplotype h10 TACCACAGCATCACAGTACTATGTCAGTATTAAAAGTAATCTGTTTTAAAAACATTTTACTGTACATATCACATACACATATACGCATACATGTTAATACTTAGTTTCTCCTTATAAATATCCATATATACATGCTATGTATTATTGTGCATTCATTTATTTTCCATACGATAAGTTAAAGCTCGTATTAATTATCATTAATTTTACATATTACATAATATGTATGCTCTTACATATTATATGTCCCCTAACAATTTTATTTCCATTATATCCTATGGTCGCTCCATTAGATCACGAGCTTAATCACCATGCCGCGTGAAACCAGCAACCCGCTCG

GCAGGGATCCCTCTTCTCGCACCGGGCCCATATCTTGTGGGGGTAGCTAACGGTGATCTTTATAAGACATCTGGTTCTTACTTCAGG??????????????????????????? >Haplotype h11 CACCACAGCATCACAGTACTATGTCAGTATTAAAAGTAATCTGTTTTAAAAACATTTTACTGTACATATCACATACACATATACGCATACATGTTAACACTTAGTCTCTCCTTATAAATATCCATGTATACATGCTATGTATTATTGTGCATTCATTTATTTTCCATACGATAAGTTAAAGCTCGTATTAATTATCATTAATTTTACATATTACATAATATGTATGCTCTTACATATTATATGTCCTCTAACAATTTTATTTCCATTATACCCTATGGTCACTCCATTAGATCACGAGCTTAATCACCATGCCGCGTGAAACCAGCAACCCGCTCGGCAGGGATCCCCCTTCTCGCACCGGGCCCATATCCCGTGGGGGTAGCTAACGGTGGTCTTTATAAGACATCTGGTTCTTACTTCAGG??????????????????????????? >Haplotype h12 CACCACAGCATCACAGTACTATGTCAGTATTAAAAGTAATCTGTTTTAAAAACATTTTACTGTACATATCACATACACATATACGCATACATGTTAACACTTAGTCTCTCCTTATAAATATCCATGTATACATGCTATGTATTATTGTGCATTCATTTATTTTCCATACGATAAGTTAAAGCTCGTATTAATTATCATTAATTTTACATATTACATAATATGCATGCTCTTACATATTATATGTCCTCTAACAATTTTATTTCCATTATACCCTATGGTCACTCCATTAGATCACGAGCTTAATCACCATGCCGCGTGAAACCAACAACCCGCTCGGCAGGGATCCCTCTTCTCGCACCGGGCCCATACCCCGTGGGGGTAGCTAACGGTGATCTTTATAAGACATCTGGTTCTTACTTCAGG??????????????????????????? >Haplotype h13 TACCACAGCATCACAGTACTATGCCAGTATTAAAAGTAATCTGTTTTAAAAGCATTTTACTGTACACATCACATACACATATACACATACATGTTAATACTTAGTCTCTCCTTATAAATATCCATGTATACATGCTATGTATTATTGTGCATTCATTTATTTTCCATACGATAAGTTAAAGCTCGTATTAATTATCATTAATTTTACATATTACATAATATGTATGCTCTTACATATTATATGTCCCCTAATAATTTTATTTCCATTATACCCTATGGTCGCCCCATTAGATCACGAGCTTAATCACCATGCCGCGTGAAACCAGCAACCCGCTCGGCAGGGATCCCTCTTCTCGCACCGGGCCCATATCCCGTGGGGGTAGCTAACGGTGGTCTTTATAAGACATCTGGTTCTTACTTCAGG??????????????????????????? >Haplotype h14 TACCACAGCATCACAGTACTATGTCAGTATTAAAAGTAATCTGTTTTAAAAGCATTTTACTGTACACATCACATACACATATACACATACATGTTAATACTTAGTCTCTCCTTATAAATATCCATATATACATGCTATGTATTATTGTGCATTCATTTATTTTCCATACGATAAGTTAAAGCCCGTATTAATTATCATTAATTTTACATATTACATAATATGTATGCTCTTACATATTATATGTCCCCTAATAATTTTATTTCCATTATACCCTATGGTCGCCCCATTAGATCACGAGCTTAATCACCATGCCGCGTGAAACCAGCAACCCGCTCGGCAGGGATCCCTCTTCTCGCACCGGGCCCATACTCCGTGGGGGTAGCTAACGGTGATCTTTATAAGACATCTGGTTCTTACTTCAGG??????????????????????????? >Haplotype h15 TACCACAGCATCACAGTACTATGTCAGTATTAAAAGTAATCTGTTTTAAAAGCATTTTACTGTACACATCACATACACATATACACATACATGTTAATACTTAGTCTCTCCTTATAAATATCCATATATACATGCTATGTATTATTGTGCATTCATTTATTTTCCATACGATAAGTTAAAGCTCGTATTAATTATCATTAATTTTACATATTACATAATATGTATGCTCTTACATATTATATGTCCCCTAATAATTTTATTTCCATTATATCCTATGGTCGCCCCATTAGATCACGAGCTTAATCACCATGCCGCGTGAAACCAGCAACCCGCTCGGCAGGGATCCCTCTTCTCGCACCGGGCCCATGCTCCGTGGGGGTAGCTAACGG

TGGTCTTTATAAGACATCTGGTTCTTACTTCAGG???????????????????????????
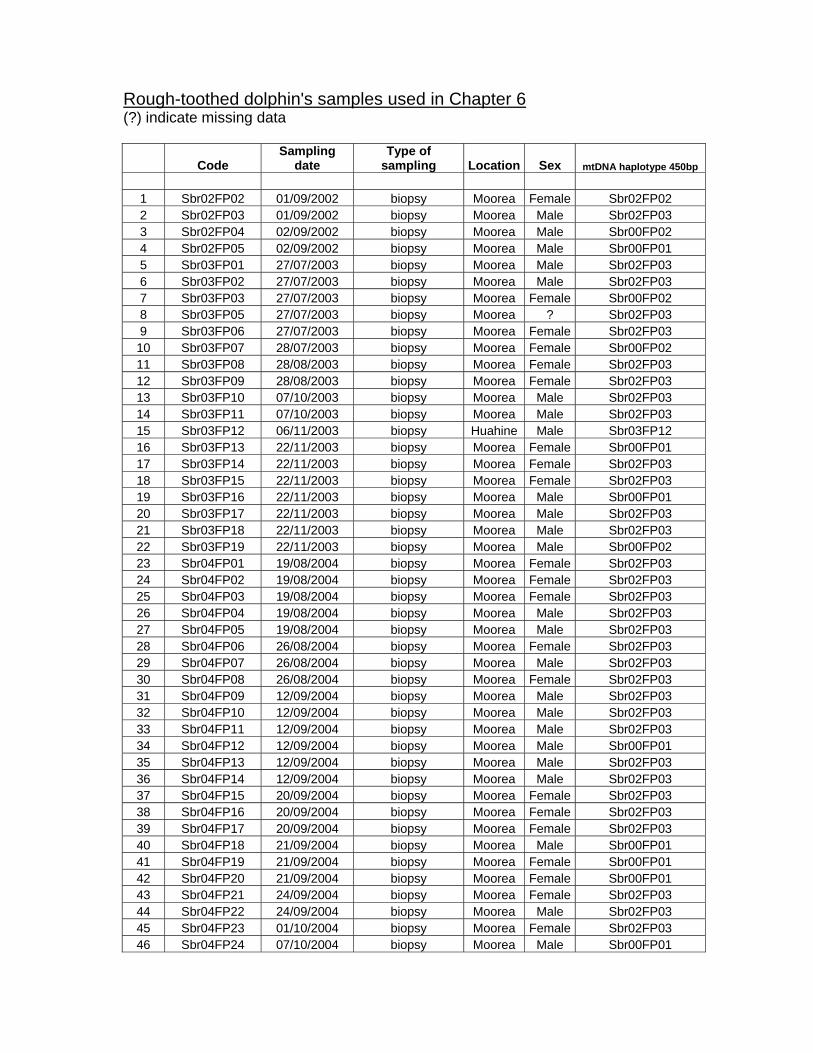
Rough-toothed dolphin's samples used in Chapter 6 (?) indicate missing data
Code Sampling
date Type of
sampling Location Sex mtDNA haplotype 450bp 1 Sbr02FP02 01/09/2002 biopsy Moorea Female Sbr02FP02 2 Sbr02FP03 01/09/2002 biopsy Moorea Male Sbr02FP03 3 Sbr02FP04 02/09/2002 biopsy Moorea Male Sbr00FP02 4 Sbr02FP05 02/09/2002 biopsy Moorea Male Sbr00FP01 5 Sbr03FP01 27/07/2003 biopsy Moorea Male Sbr02FP03 6 Sbr03FP02 27/07/2003 biopsy Moorea Male Sbr02FP03 7 Sbr03FP03 27/07/2003 biopsy Moorea Female Sbr00FP02 8 Sbr03FP05 27/07/2003 biopsy Moorea ? Sbr02FP03 9 Sbr03FP06 27/07/2003 biopsy Moorea Female Sbr02FP03 10 Sbr03FP07 28/07/2003 biopsy Moorea Female Sbr00FP02 11 Sbr03FP08 28/08/2003 biopsy Moorea Female Sbr02FP03 12 Sbr03FP09 28/08/2003 biopsy Moorea Female Sbr02FP03 13 Sbr03FP10 07/10/2003 biopsy Moorea Male Sbr02FP03 14 Sbr03FP11 07/10/2003 biopsy Moorea Male Sbr02FP03 15 Sbr03FP12 06/11/2003 biopsy Huahine Male Sbr03FP12 16 Sbr03FP13 22/11/2003 biopsy Moorea Female Sbr00FP01 17 Sbr03FP14 22/11/2003 biopsy Moorea Female Sbr02FP03 18 Sbr03FP15 22/11/2003 biopsy Moorea Female Sbr02FP03 19 Sbr03FP16 22/11/2003 biopsy Moorea Male Sbr00FP01 20 Sbr03FP17 22/11/2003 biopsy Moorea Male Sbr02FP03 21 Sbr03FP18 22/11/2003 biopsy Moorea Male Sbr02FP03 22 Sbr03FP19 22/11/2003 biopsy Moorea Male Sbr00FP02 23 Sbr04FP01 19/08/2004 biopsy Moorea Female Sbr02FP03 24 Sbr04FP02 19/08/2004 biopsy Moorea Female Sbr02FP03 25 Sbr04FP03 19/08/2004 biopsy Moorea Female Sbr02FP03 26 Sbr04FP04 19/08/2004 biopsy Moorea Male Sbr02FP03 27 Sbr04FP05 19/08/2004 biopsy Moorea Male Sbr02FP03 28 Sbr04FP06 26/08/2004 biopsy Moorea Female Sbr02FP03 29 Sbr04FP07 26/08/2004 biopsy Moorea Male Sbr02FP03 30 Sbr04FP08 26/08/2004 biopsy Moorea Female Sbr02FP03 31 Sbr04FP09 12/09/2004 biopsy Moorea Male Sbr02FP03 32 Sbr04FP10 12/09/2004 biopsy Moorea Male Sbr02FP03 33 Sbr04FP11 12/09/2004 biopsy Moorea Male Sbr02FP03 34 Sbr04FP12 12/09/2004 biopsy Moorea Male Sbr00FP01 35 Sbr04FP13 12/09/2004 biopsy Moorea Male Sbr02FP03 36 Sbr04FP14 12/09/2004 biopsy Moorea Male Sbr02FP03 37 Sbr04FP15 20/09/2004 biopsy Moorea Female Sbr02FP03 38 Sbr04FP16 20/09/2004 biopsy Moorea Female Sbr02FP03 39 Sbr04FP17 20/09/2004 biopsy Moorea Female Sbr02FP03 40 Sbr04FP18 21/09/2004 biopsy Moorea Male Sbr00FP01 41 Sbr04FP19 21/09/2004 biopsy Moorea Female Sbr00FP01 42 Sbr04FP20 21/09/2004 biopsy Moorea Female Sbr00FP01 43 Sbr04FP21 24/09/2004 biopsy Moorea Female Sbr02FP03 44 Sbr04FP22 24/09/2004 biopsy Moorea Male Sbr02FP03 45 Sbr04FP23 01/10/2004 biopsy Moorea Female Sbr02FP03 46 Sbr04FP24 07/10/2004 biopsy Moorea Male Sbr00FP01
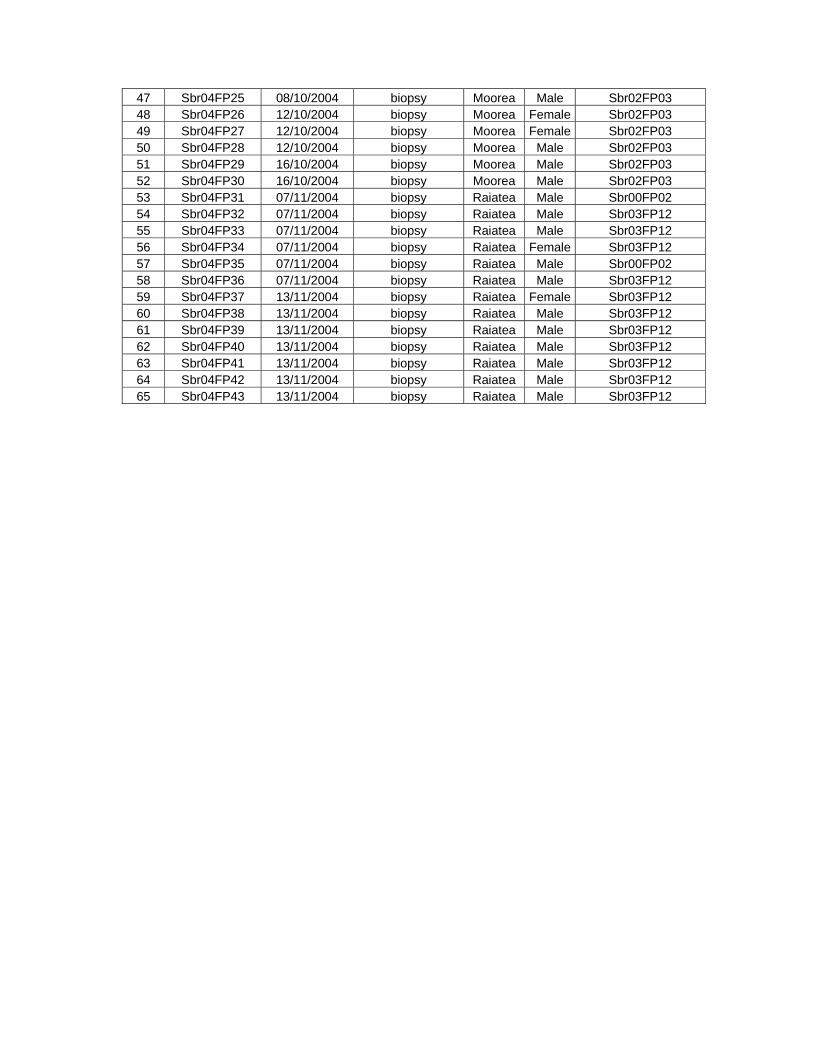
47 Sbr04FP25 08/10/2004 biopsy Moorea Male Sbr02FP03 48 Sbr04FP26 12/10/2004 biopsy Moorea Female Sbr02FP03 49 Sbr04FP27 12/10/2004 biopsy Moorea Female Sbr02FP03 50 Sbr04FP28 12/10/2004 biopsy Moorea Male Sbr02FP03 51 Sbr04FP29 16/10/2004 biopsy Moorea Male Sbr02FP03 52 Sbr04FP30 16/10/2004 biopsy Moorea Male Sbr02FP03 53 Sbr04FP31 07/11/2004 biopsy Raiatea Male Sbr00FP02 54 Sbr04FP32 07/11/2004 biopsy Raiatea Male Sbr03FP12 55 Sbr04FP33 07/11/2004 biopsy Raiatea Male Sbr03FP12 56 Sbr04FP34 07/11/2004 biopsy Raiatea Female Sbr03FP12 57 Sbr04FP35 07/11/2004 biopsy Raiatea Male Sbr00FP02 58 Sbr04FP36 07/11/2004 biopsy Raiatea Male Sbr03FP12 59 Sbr04FP37 13/11/2004 biopsy Raiatea Female Sbr03FP12 60 Sbr04FP38 13/11/2004 biopsy Raiatea Male Sbr03FP12 61 Sbr04FP39 13/11/2004 biopsy Raiatea Male Sbr03FP12 62 Sbr04FP40 13/11/2004 biopsy Raiatea Male Sbr03FP12 63 Sbr04FP41 13/11/2004 biopsy Raiatea Male Sbr03FP12 64 Sbr04FP42 13/11/2004 biopsy Raiatea Male Sbr03FP12 65 Sbr04FP43 13/11/2004 biopsy Raiatea Male Sbr03FP12
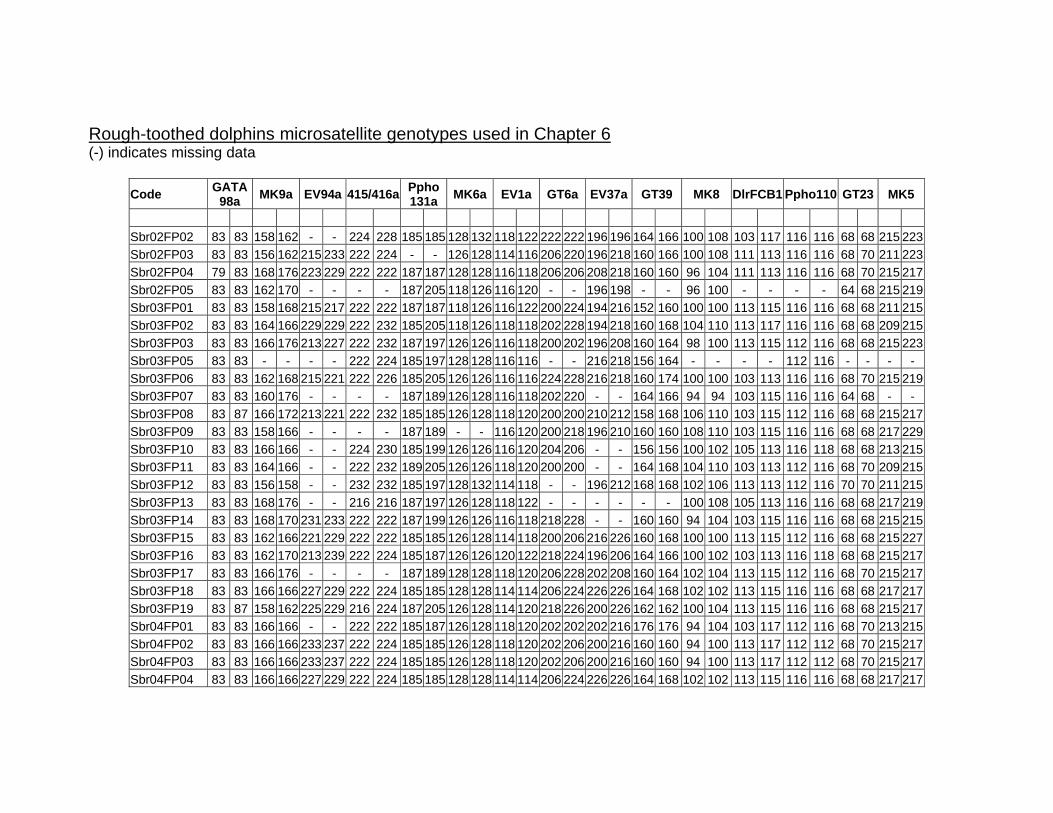
Rough-toothed dolphins microsatellite genotypes used in Chapter 6 (-) indicates missing data
Code GATA 98a MK9a EV94a 415/416a Ppho
131a MK6a EV1a GT6a EV37a GT39 MK8 DlrFCB1 Ppho110 GT23 MK5
Sbr02FP02 83 83 158 162 - - 224 228 185 185 128 132 118 122 222 222 196 196 164 166 100 108 103 117 116 116 68 68 215 223Sbr02FP03 83 83 156 162 215 233 222 224 - - 126 128 114 116 206 220 196 218 160 166 100 108 111 113 116 116 68 70 211 223Sbr02FP04 79 83 168 176 223 229 222 222 187 187 128 128 116 118 206 206 208 218 160 160 96 104 111 113 116 116 68 70 215 217Sbr02FP05 83 83 162 170 - - - - 187 205 118 126 116 120 - - 196 198 - - 96 100 - - - - 64 68 215 219Sbr03FP01 83 83 158 168 215 217 222 222 187 187 118 126 116 122 200 224 194 216 152 160 100 100 113 115 116 116 68 68 211 215Sbr03FP02 83 83 164 166 229 229 222 232 185 205 118 126 118 118 202 228 194 218 160 168 104 110 113 117 116 116 68 68 209 215Sbr03FP03 83 83 166 176 213 227 222 232 187 197 126 126 116 118 200 202 196 208 160 164 98 100 113 115 112 116 68 68 215 223Sbr03FP05 83 83 - - - - 222 224 185 197 128 128 116 116 - - 216 218 156 164 - - - - 112 116 - - - - Sbr03FP06 83 83 162 168 215 221 222 226 185 205 126 126 116 116 224 228 216 218 160 174 100 100 103 113 116 116 68 70 215 219Sbr03FP07 83 83 160 176 - - - - 187 189 126 128 116 118 202 220 - - 164 166 94 94 103 115 116 116 64 68 - - Sbr03FP08 83 87 166 172 213 221 222 232 185 185 126 128 118 120 200 200 210 212 158 168 106 110 103 115 112 116 68 68 215 217Sbr03FP09 83 83 158 166 - - - - 187 189 - - 116 120 200 218 196 210 160 160 108 110 103 115 116 116 68 68 217 229Sbr03FP10 83 83 166 166 - - 224 230 185 199 126 126 116 120 204 206 - - 156 156 100 102 105 113 116 118 68 68 213 215Sbr03FP11 83 83 164 166 - - 222 232 189 205 126 126 118 120 200 200 - - 164 168 104 110 103 113 112 116 68 70 209 215Sbr03FP12 83 83 156 158 - - 232 232 185 197 128 132 114 118 - - 196 212 168 168 102 106 113 113 112 116 70 70 211 215Sbr03FP13 83 83 168 176 - - 216 216 187 197 126 128 118 122 - - - - - - 100 108 105 113 116 116 68 68 217 219Sbr03FP14 83 83 168 170 231 233 222 222 187 199 126 126 116 118 218 228 - - 160 160 94 104 103 115 116 116 68 68 215 215Sbr03FP15 83 83 162 166 221 229 222 222 185 185 126 128 114 118 200 206 216 226 160 168 100 100 113 115 112 116 68 68 215 227Sbr03FP16 83 83 162 170 213 239 222 224 185 187 126 126 120 122 218 224 196 206 164 166 100 102 103 113 116 118 68 68 215 217Sbr03FP17 83 83 166 176 - - - - 187 189 128 128 118 120 206 228 202 208 160 164 102 104 113 115 112 116 68 70 215 217Sbr03FP18 83 83 166 166 227 229 222 224 185 185 128 128 114 114 206 224 226 226 164 168 102 102 113 115 116 116 68 68 217 217Sbr03FP19 83 87 158 162 225 229 216 224 187 205 126 128 114 120 218 226 200 226 162 162 100 104 113 115 116 116 68 68 215 217Sbr04FP01 83 83 166 166 - - 222 222 185 187 126 128 118 120 202 202 202 216 176 176 94 104 103 117 112 116 68 70 213 215Sbr04FP02 83 83 166 166 233 237 222 224 185 185 126 128 118 120 202 206 200 216 160 160 94 100 113 117 112 112 68 70 215 217Sbr04FP03 83 83 166 166 233 237 222 224 185 185 126 128 118 120 202 206 200 216 160 160 94 100 113 117 112 112 68 70 215 217Sbr04FP04 83 83 166 166 227 229 222 224 185 185 128 128 114 114 206 224 226 226 164 168 102 102 113 115 116 116 68 68 217 217

Sbr04FP05 83 83 166 176 229 229 222 224 187 189 128 128 118 120 206 228 202 208 160 164 102 104 113 115 112 116 68 70 215 217Sbr04FP06 79 83 166 166 215 229 - - 185 195 126 126 116 116 202 206 - - 160 164 100 100 103 113 116 116 68 68 219 223Sbr04FP07 83 83 164 166 229 229 222 232 187 195 126 126 116 116 202 206 194 204 164 164 100 110 103 113 116 116 68 68 211 223Sbr04FP08 83 83 166 168 - - 222 232 185 185 126 128 116 118 200 206 196 218 160 168 100 100 103 115 116 116 68 68 219 219Sbr04FP09 83 83 158 166 213 233 - - - - 118 126 116 116 218 228 204 208 - - 104 106 113 115 116 116 68 68 213 219Sbr04FP10 83 83 156 162 - - 224 232 187 199 126 128 116 116 206 206 208 214 - - 104 104 113 115 116 116 68 68 211 215Sbr04FP11 83 83 162 166 233 239 224 232 199 205 126 126 116 120 200 206 218 218 166 166 100 100 101 113 116 116 68 70 215 217Sbr04FP12 83 83 162 168 213 215 216 222 183 185 126 128 120 120 202 206 198 204 158 164 104 110 105 111 116 116 68 70 211 215Sbr04FP13 83 83 168 168 215 221 222 222 185 197 128 128 114 120 200 222 216 232 160 160 98 106 103 115 112 116 68 68 215 217Sbr04FP14 83 83 162 166 213 223 222 222 197 205 118 126 116 118 222 222 196 228 160 166 94 102 107 113 116 116 64 68 213 217Sbr04FP15 83 83 162 166 229 237 222 232 185 205 126 128 120 120 222 224 194 194 160 164 104 104 103 115 112 116 68 68 215 219Sbr04FP16 83 83 162 166 215 221 222 232 185 185 126 126 116 118 200 202 204 218 164 166 100 106 113 117 116 116 68 68 211 223Sbr04FP17 79 83 166 166 215 229 222 232 185 195 126 126 116 116 202 206 204 218 160 164 100 100 103 113 116 116 68 68 219 223Sbr04FP18 83 83 168 170 213 225 216 222 185 197 126 126 114 116 200 206 194 194 160 160 94 100 105 113 116 116 68 70 219 223Sbr04FP19 83 87 158 170 213 227 224 232 185 205 126 126 118 120 200 228 202 228 160 176 94 102 113 115 116 118 68 68 217 219Sbr04FP20 83 87 158 168 227 235 222 224 187 205 126 126 116 120 200 220 218 228 160 160 100 102 103 113 116 116 68 68 217 217Sbr04FP21 79 83 166 166 215 229 222 232 185 195 126 126 116 116 202 206 204 218 160 164 100 100 103 113 116 116 - - 219 223Sbr04FP22 79 83 166 168 213 227 224 232 183 189 126 126 114 120 206 224 194 202 158 164 100 100 103 105 116 116 68 70 217 219Sbr04FP23 83 83 162 166 227 229 232 232 189 205 126 128 116 120 202 222 194 196 158 160 104 110 103 115 112 116 68 68 209 219Sbr04FP24 79 83 162 166 229 229 226 228 197 205 126 126 118 120 200 224 202 228 166 166 94 94 103 113 116 116 68 68 215 217Sbr04FP25 83 83 162 166 213 235 222 224 183 189 126 126 116 116 206 206 196 204 162 168 106 108 113 115 112 116 68 68 217 223Sbr04FP26 83 83 162 168 213 215 222 228 199 205 126 128 116 118 202 206 216 228 164 164 94 100 105 113 116 116 68 68 213 215Sbr04FP27 83 83 166 172 227 239 222 222 189 197 126 126 114 118 202 218 202 228 160 164 100 100 113 115 116 116 68 68 217 223Sbr04FP28 83 83 162 162 215 229 222 224 185 185 126 128 116 118 202 220 198 216 160 160 96 100 103 113 116 116 68 68 213 215Sbr04FP29 83 83 166 166 225 229 222 224 197 205 126 126 116 122 222 228 194 228 158 160 96 102 103 113 116 116 68 68 215 219Sbr04FP30 83 83 162 166 229 233 222 232 185 187 128 128 118 120 206 226 198 206 160 164 96 104 103 105 116 116 68 68 215 219Sbr04FP31 83 83 162 166 215 227 228 232 185 185 126 128 118 118 206 220 196 218 158 168 94 108 103 115 112 116 68 70 219 223Sbr04FP32 83 83 156 168 215 227 224 232 185 199 126 128 116 120 206 206 198 202 160 164 98 106 103 113 116 116 68 68 223 223Sbr04FP33 83 83 162 162 - - - - - - 126 128 116 116 - - - - 158 158 - - 113 115 - - 68 70 215 223Sbr04FP34 - - 156 166 227 227 - - 189 205 - - 118 118 200 200 198 214 - - 100 106 113 113 - - 68 68 215 217Sbr04FP35 83 83 162 166 215 227 228 232 185 185 126 128 118 118 206 220 196 218 158 168 94 108 113 113 112 116 68 70 219 223Sbr04FP36 83 83 156 166 - - 232 232 - - 126 128 118 118 - - - - 160 168 - - 113 115 - - 68 70 213 217

Sbr04FP37 83 83 156 162 233 233 232 232 185 197 126 128 116 118 206 226 194 202 158 166 100 106 113 113 112 116 68 70 215 219Sbr04FP38 83 83 156 168 233 233 218 232 185 197 126 128 116 120 206 224 196 206 160 166 98 100 103 113 112 116 68 70 215 217Sbr04FP39 83 83 162 168 215 215 232 232 195 199 126 128 116 118 200 206 198 202 160 168 94 108 113 113 112 116 68 68 217 219Sbr04FP40 83 83 156 158 217 227 232 232 185 197 128 132 114 118 222 226 - - 168 168 102 106 113 113 112 116 70 70 211 215Sbr04FP41 83 83 156 156 227 235 232 232 185 197 126 128 118 118 222 226 194 194 160 168 102 106 103 117 112 112 70 70 215 219