social and economic impacts of space weather in the … · final report social and economic impacts...
TRANSCRIPT

FINAL REPORT
Social and Economic Impacts of
Space Weather in the United
States
September 2017
Abt Associates
Bethesda, Maryland
Written under contract for the
NOAA National Weather Service

Abt Associates Inc.
Abt Associates is a mission-driven, global leader in research, evaluation and program implementation in the fields of
health, social and environmental policy, and international development. Known for its rigorous approach to solving
complex challenges, Abt Associates is regularly ranked as one of the top 20 global research firms and one of the top 40
international development innovators. The company has multiple offices in the U.S. and program offices in more than
40 countries. Learn more at www.abtassociates.com
NOAA's National Weather Service
NOAA's National Weather Service is the US Government official and definitive source of civilian space weather
watches, warnings, and alerts to the general public, industry, and government agencies. NOAA provides real-time
monitoring and forecasting of solar and geophysical events, which impact satellites, power grids, communications,
navigation, and other technological systems.

Table of Contents
1. Introduction 1
1.1 References 2
2. Approach 4
2.1. References 8
3. Electric Power 10
3.1 Impact Mechanisms 10
3.2 Stakeholder Perspective on Impacts 11
3.3 Cost Estimates 16
3.4. Power References 24
4. Satellites 26
4.1 Impact Mechanisms 26
4.2 Stakeholder Perspectives on Impacts 27
4.3 Cost Estimates 32
4.4 Satellite References 37
5. Global Navigation Satellite Systems (GNSS) Users 39
5.1 Impact Mechanisms 39
5.2 Stakeholder Perspectives on Impacts 40
5.3 Cost Estimates 46
5.4 GNSS References 51
6. Aviation 53
6.1 Impact Mechanisms 53
6.2 Stakeholder Perspectives on Impacts 54
6.3 Cost Estimates 59
6.4 Aviation References 64
7. Key Findings and Conclusions 65
8. Recommended Next Steps 68
8.1 References 70

Acknowledgements
We would like to thank the individuals who contributed their time, knowledge, and expertise to this effort. In addition
to anonymous contributors, these individuals included (listed in alphabetical order): Dan Baker, Paul Cripwell, Geoff
Crowley, Mark Dickinson, Gary Edwards, Kevin Forbes, Joaquim Fortuny-Guasch, Trevor Gaunt, Greg Ginrich, Mark
Gunzelman, Ewan Haggarty, Tom Helms, Frank Koza, Elisabeth Krausmann, Justin Likar, Jeffrey J. Love, Yahya
Memarzadeh, Pat Murphy, Paul O’Brien, Dr. Sten Odenwald, Antti Pulkkinen, Graham Rennie, Klaus Sievers, Mike
Steckelberg, Mike Stills, and Hans Visser.

1
1. Introduction
Space weather broadly refers to time-variable conditions in the near-Earth space environment including the sun,
solar wind, magnetosphere, ionosphere, and thermosphere. It represents a natural hazard that is known to interrupt and
damage technologies critical to modern society such as electric power grids, airlines, trains, pipelines, and Global
Navigation Satellite Systems (GNSS) [National Research Council, 2008; Baker and Lanzerotti, 2016]. Despite such
risks and our growing dependencies on these technologies for almost all aspects of daily life, there have been a limited
number of studies on space weather’s social and economic impacts [National Research Council, 2008; Eastwood et al.,
2017]. In order to address this significant knowledge gap, this report represents a first attempt to systematically identify,
describe, and quantify the impacts of space weather events within the United States (U.S.). Since better understanding
these impacts is essential for enhancing our preparedness and strategically reducing our risks, this report also establishes
the comprehensive foundation and analytical framework necessary for stimulating timely discussions and advancing this
frontier. We furthermore hope our initial study helps enable the proliferation of careful research that is necessary for
addressing the impacts of space weather with the same rigor and attention paid to other natural hazards where our
collective understanding is comparatively more mature (e.g. hurricanes, tornadoes, tsunamis, wildfires, droughts).
It is now well recognized that space weather presents significant risks to the U.S. economy and to the safety of
its citizens. Space weather has been identified by the federal government as one of the grand challenges for disaster risk
reduction [National Science and Technology, 2015], and most recently, it has been addressed in a National Space
Weather Strategy [Executive Office of the President, 2015a] and National Space Weather Action Plan (SWAP)
[Executive Office of the President, 2015b]. Our study was in part initiated in response to the SWAP (see Action Item
4.5.2), a much larger U.S. effort for addressing potential vulnerabilities and increasing resilience by setting detailed
national goals and promoting enhanced coordination and cooperation across public and private sectors [Executive Office
of the President, 2015b]. Furthermore, NOAA recognizes that underlying the national effort to enhance the preparedness
for space weather events is the need to improve our understanding of the social and economic impacts. NOAA also
understands that there is a recurring need for this type of analysis and supports the full documentation of methods,
procedures, data sources, and lessons learned to encourage the consistency of future efforts. Although the growing
national and international recognition of this important topic has led to a handful of other socioeconomic impact studies
that were recently finished or are concurrently underway in Europe, we were unable to draw upon such efforts for this
study since they differ somewhat in scope [e.g. Oughton, 2017], are not yet published [e.g. Biffis and Burnett, 2017], or
are publically unavailable [e.g. Luntama et al., 2017].
One of our study goals was to capture and synthesize what is known about space weather impacts across four
technological sectors of prime concern: electric power, satellites, GNSS users, and aviation. Another goal involved
translating our findings into quantitative estimates monetizing the potential impacts associated with different sized space
weather storms including both a “moderate” and more “extreme” event. Analyzing two different sized events is an
essential first step towards better understanding how impacts may change as storm size escalates. Examining “moderate”
events that are lower in intensity but occur more frequently helps establish key thresholds above which notable impacts
are expected based on empirical insights from sector and stakeholder experiences, including past-events where impacts
were observed and impact thresholds were therefore exceeded (e.g. the March 1989 event [Allen, 1989] and the 2003
Halloween Storm [Lopez et al., 2004]. Since impact thresholds may increase or decrease alongside changes in

2
technologies, policies, and societal processes, studying the impacts of “moderate” events is also essential for anticipating
how impacts may change in the future. The impacts of “moderate” events may also seem small when considered in
isolation and/or when compared to more “extreme” event scenarios. However, since they occur more frequently, they
may nonetheless add up and be significant over time. Considering more “extreme” events that are higher in intensity
but occur less frequently is important for exploring more devastating and costly scenarios. To analyze a more “extreme”
event, we considered both scientific and engineering expertise within each technological sector and different working
definitions for “extreme” events such as the 1-in-100 year storm parameters set by the U.S. SWAP Phase I Benchmarks
[Executive Office of the President, 2017] and “reasonable worst-case events” established by efforts in the United
Kingdom (UK) [Cannon et al., 2013; Hapgood et al., 2016]. It is important to note that our “extreme” estimates do not
necessarily reflect a Carrington-like event or the theoretical maximum level event. This topic was beyond the scope of
our project since there is no scientific consensus on how large the Carrington event was or how big of an event is even
possible. It is also important to note that there are inconsistencies (e.g. different event durations) with our space weather
event scenarios for moderate and extreme events between sectors. This results from our approach that considers impacts
on a sector by sector basis and captures stakeholder perspectives from different industries. Such inconsistences are not
necessarily problematic but they should be further scrutinized and resolved with future efforts. Although we anticipate
strong interest in our cost estimates, we emphasize that our numbers represent first pass estimates that should not be
taken out of context or quoted without the appropriate caveats since they need to be critically reviewed and refined with
future efforts. We therefore urge the reader to consider the qualitative information that we synthesize and the quantitative
framework that we establish to be equally informative and perhaps the more substantive contribution of our effort.
The following sections include an overview of the study methodology and framework (Chapter 2) followed by
the findings for the four technology sectors (Chapters 3 – 6). Specifically, the sector chapters are organized into impact
mechanisms, stakeholder perspectives, and cost estimates. Each sector chapter begins with the impact mechanisms,
which outlines the major causal pathways from solar events to physical effects and then to societal impacts. The
stakeholder perspectives provide an overview of our outreach findings and also more detailed notes. The cost estimates
provide a tractable description of our quantification approach, including how we used key insights and assumptions from
additional stakeholder outreach to build these estimates for both moderate and more extreme storm scenarios. Finally,
Chapters 7 and 8 provide a summary of key findings and recommended next steps.
1.1 References
Allen, J., H. Sauer, L. Frank, P. Reiff. 1989. Effects of the March 1989 Solar Activity. Eos, Vol. 70, No. 46.
The cost estimates provided in this report represent a first pass, and should not be taken out of
context or quoted without appropriate caveats since they need to be critically reviewed and
refined with future efforts. Readers are urged to consider the qualitative information
synthesized from stakeholder outreach and peer reviewed sources and the quantitative
framework established from this information as the more important contribution of this effort.

3
Baker, D. N. (2009), What Does Space Weather Cost Modern Societies?, Space Weather, 7, S02003,
doi:10.1029/2009SW000465.
Baker, D.N. and L.J. Lanzerotti. 2016. Resource Letter SW1: Space Weather. American Journal of Physics. Vol.
84, No. 3.
Biffis, E. and C. Burnett. 2017. Report on the UKSA-funded IPSP SWx/SWe socio-economic study. Report on the
ESA Space-Weather Socio-Economic Study L5 in Tandem with L1: Future Space-Weather Missions
Workshop. March 6-9, 2017
Cannon, P.; Angling, M., Barclay, L., Curry, C., Dyer, C., Edwards, R., et al., 2013. Extreme space weather: impacts
on engineered systems and infrastructure, UK Royal Academy of Engineering, London, ISBN 1-903496-95-0.
Eastwood, J.P., E. Biffis, M.A. Hapgood, L. Green, M.M. Bisi, R.D. Bently, R. Wicks, L.A. McKinnel, M. Gibbs, and
C. Burnett. 2017. The Economic Impact of Space Weather: Where Do We Stand? Rick Analysis, Vol. 37,
No. 2
Executive Office of the President, 2015a, National Space Weather Strategy.
Executive Office of the President, 2015b, National Space Weather Action Plan. Product of the National Science And
Technology Council.
Executive Office of the President, 2017. Space Weather Phase I Benchmarks. Product of the Space Weather
Operations, Research, and Mitigation Committee of The National Science and Technology Council.
Hapgood, M., Angling, M., Attrill, G., Burnett, C., Cannon, P., Gibbs, M., et al., 2016. Summary of space weather
worst-case environments. Revised edition. RAL Technical Report RAL-TR-2016-06.
National Research Council. 2008 Severe Space Weather Events – Understanding Societal and Economic Impacts: A
Workshop Report. National Academies Press.
Lopez, R.E., D.N. Baker, and J.H. Allen. 2004. Sun unleashes Halloween Storm, Eos, Vol. 85, No. 11
Luntama, J.P, N. Bobrinsky, and S. Kfraft. 2017. Report on the ESA Space-Weather Socio-Economic Study L5 in
Tandem with L1: Future Space-Weather Missions Workshop. March 6-9, 2017
Oughton, E. 2017. Report on the Cambridge SWx/SWe Socio-Economic Study, Report on the ESA Space-Weather
Socio-Economic Study L5 in Tandem with L1: Future Space-Weather Missions Workshop. March 6-9, 2017
4
2. Approach
This study began with an extensive literature review; however, similar to a
concurrent and recently published study, we also found a limited number of previous
studies on the social and economic impacts of space weather [Eastwood et al., 2017].
We also quickly recognized that this topic represented a formidable research problem at
the intersection of science, engineering, economics, and the social sciences [Baker,
2009]. For example, modern society’s fortunate lack of direct experience of “extreme”
events, and either limited or rather largely undocumented/unshared experiences of
“moderate” events, pose a number of theoretical and analytical challenges that require
many assumptions, simplifications, extrapolations, and inferences. In addition, there is
no standard definition nor scientific agreement on what constitutes either an “extreme” [e.g. Executive Office of the
President, 2017] or “moderate” event, and when studying impacts, will furthermore be dependent on and relative to the
specific technology and impact pathway of interest [e.g. Cannon et al., 2013; Hapgood et al., 2016]. The response of
various technologies (e.g. power grid, satellites, airplanes, GNSS) to “extreme” events is furthermore largely unknown
since they fall beyond engineering standards and operational experiences. Although the response of different
technologies to “moderate” events may be relatively better understood, such information is often not readily available
since publically disclosing potential vulnerabilities can be devastating for businesses. Moreover, impacts are not simply
directly proportional to event sizes but are also affected by a number of other important factors like geography, the time
of day, or season of the year which, for example, affect the demand on the electric power grid [e.g. Forbes and St. Cyr,
2012]. Further complications arise from economic and social processes that are complex, interconnected, and rapidly
evolving. These early study findings therefore shaped our approach, in which we aimed to develop a comprehensive
and coherent framework in order to help this become a more tractable research problem that others across industries,
institutions, and disciplines can build off and contribute their knowledge and expertise to.
Our review of existing information included findings of peer-reviewed literature, government reports, industry
organizations, and other publically available documents. Given the lack of previous impact studies, we focused our
efforts on dissecting the far more extensive scientific and engineering literature addressing the physical effects of space
weather across our four focal sectors (electric power, satellites, GNSS users, and aviation) [see Baker and Lanzerotti,
2016 for a recent and comprehensive overview]. Although effects and impacts are often used interchangeably, here we
consider physical effects to be fundamentally different than impacts in the sense that the former represents effects on
systems or system performance caused by natural phenomenon and processes. Effects are what, if not appropriately
addressed by design and engineering decisions or managed with operator actions, will ultimately cause impacts (in the
case of space weather, negative consequences) and therefore represent different potential impact mechanisms and
pathways. Focusing on physical effects furthermore helped us establish a technically sound link between space weather
events and their downstream social and economic impacts on a sector by sector basis. Although not widely studied, we
found that the impacts of space weather are somewhat well documented in historic accounts of notable space weather
events [Allen et al., 1989; Lopez et al., 2004] and also often highlighted in technical work as a research motivation. To
synthesize our findings for each sector, we established a discrete list that included 17 known physical effects across the
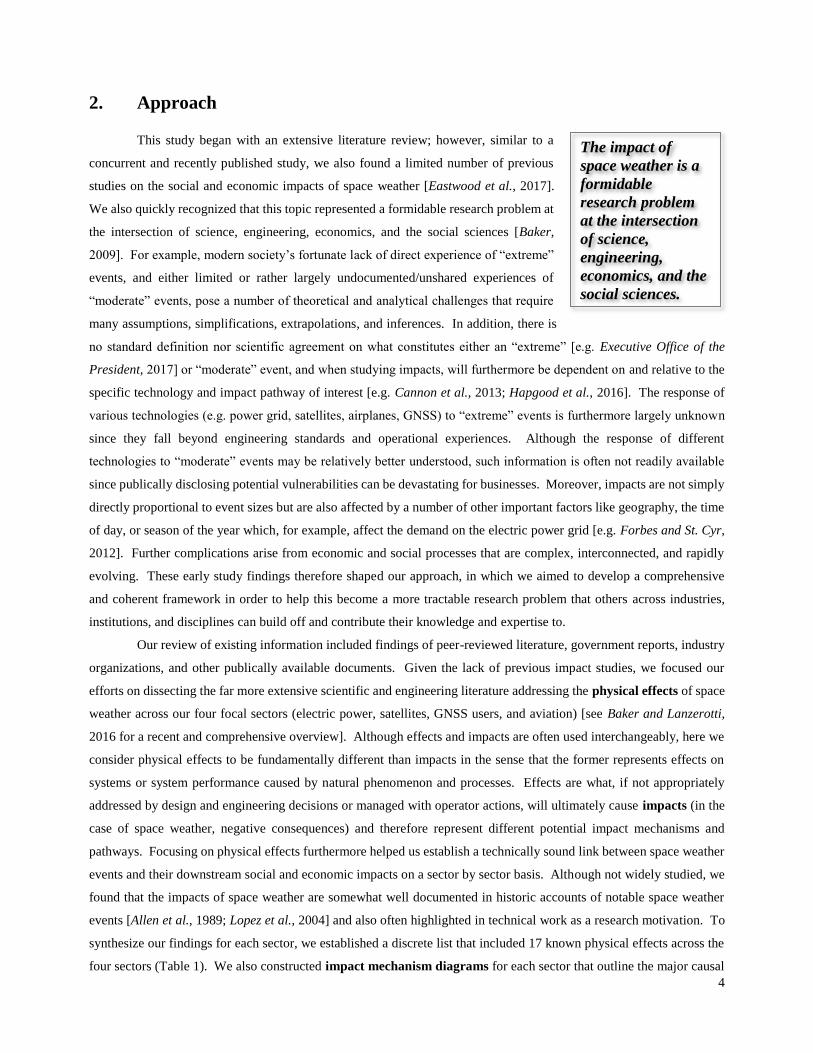
four sectors (Table 1). We also constructed impact mechanism diagrams for each sector that outline the major causal
The impact of
space weather is a
formidable
research problem
at the intersection
of science,
engineering,
economics, and the
social sciences.

5
pathways from solar events to physical effects and then impacts. These diagrams represent a first attempt to help simplify
many of the complexities surrounding this interdisciplinary problem, allowing for a clear illustration of key processes
and relationships. They should be refined and vetted with additional input from stakeholders and experts.
Table 1. The physical effects of space weather on different technological sectors, as identified and defined in the
report, include a range of natural processes and phenomenon that are relatively well studied by scientists and
engineers. If these physical effects (defined and discussed throughout the remainder of report) are not appropriately
addressed by design and engineering decisions or managed with operator actions, they will ultimately cause impacts
(“negative consequences”) and therefore represent different potential impact mechanisms and pathways. Impacts
caused by these effects can furthermore be organized into different impact categories (see Figure 1 and Table 2).
Technological Sector
Electric Power Satellites GNSS Users Aviation
● Reactive Power Consumption
● Transformer Heating
● Improper Operation of
Protective Relaying Equipment
● Real Power Imbalances
● Generator Tripping
● Loss of Precision Timing
● Loss of Altitude
● Link Disruptions
● Anomalies
● Cumulative Dosage
● Ranging Errors
● Loss of Lock
● Communication
Degradation
● Navigation
Degradation
● Avionic Upsets
● Effective Dose
After noting a wide range of socioeconomic impacts from the literature, we organized our analysis by creating
five broad but interrelated impact categories (see Figure 1 and Table 2 for more details). Our first category, Defensive
Investments, captures expenditures that help protect technologies against potential vulnerabilities such as on engineering
designs or on situational awareness. Mitigating Actions covers real-time decisions made by system operators to reduce
the consequences of an event that is anticipated or underway. Asset Damages refers to any physical damage to sector
equipment that may result either suddenly (“acute”) or slowly over time (“chronic”). Service Interruptions addresses
impacts seen by end users of technologies such as changes in provision, quality, and/or pricing. The final impact category
is Health Effects, which covers any direct potential hazard to human well-being or life such as from elevated radiation.
Focusing on direct health effects from events in this last category does not include any of the health effects that would
result indirectly via our other impact categories (e.g. health effects from an extended power outage would be captured
under Service Interruptions). In addition to showing how these different categories relate to one another, Figure 1 also
shows the different types of space weather products and services, such as those provided by NOAA’s Space Weather
Prediction Center (SWPC), that can add value to society by lessening these impacts. Note that the first two of these
impact categories capture proactive approaches to managing space weather impacts whereas the last three capture the
impacts that could be realized in the advent that such proactive strategies are insufficient for absorbing the full magnitude
of the event. Although a rigorous consideration of how the impacts categories are interrelated is beyond the scope of
this current body of work, it is important to note that there are costs associated with all of these impact categories and
this is apt to represent an optimization problem in which one must consider the costs, benefits, and trade-offs associated
with each.

6
Figure 1. The range of potential economic and societal impacts of space weather to different technological sectors can
be organized into five different but interrelated categories (red boxes). A range of space weather products and services,
such as those offered by NOAA’s SWPC (blue boxes), are valuable at different points in time and have the potential
to reduce specific types of impacts.
We then conducted an initial round of stakeholder outreach to better understand these physical effects and the
different categories of impacts associated with each. Although we use the word stakeholder generally to describe any
individual with relevant knowledge from industry, government, or academics, our outreach was aimed most directly at
engineers and operators working within our different focal sectors. We used a Delphi-like approach [Helmer, 1967] to
solicit feedback on our literature review findings (e.g. physical effects and example impacts organized by impact
category) from more than 30 stakeholders of diverse expertise. To facilitate these conversations, we constructed a simple
matrix for each sector that connected our identified physical effects to our five different impact categories (for additional
details, see sections on Stakeholder Perspective on Impacts within different chapters of this report). These matrices were
initially populated with specific examples culled from the literature, shown to stakeholders for reactions and thoughts,
and then expanded or revised based on information they provided. An updated matrix was iteratively shown to
subsequent stakeholders so the next stakeholder could offer critical input on our current understanding and fill in any
remaining gaps. We iterated this process until further input yielded few substantive changes but also took advantage of
any additional opportunities to further discuss our matrices with other stakeholders even after they had solidified.
Iterating this process allowed us to: (1) refine our list and descriptions of the physical effects; (2) gauge the relative
frequency and severity of their occurrence, including information on impact thresholds; (3) identify likely future trends
due to changing technologies, policies, and/or economics; (4) recognize consensus or disagreement between
stakeholders; (5) contextualize space weather with other sector hazards; (6) gain insights on how the impacts may change
as storm size escalates from “moderate” to “extreme”; and (7) understand how current applications of space weather
information reduce sector vulnerabilities. We took detailed notes on each conversation but given that this can be a
sensitive and largely private subject within various industries, our notes are organized and reported generally in tables
and throughout this document without attribution to particular individuals.

7
Table 2. Definitions of the five impact categories created to organize the vast number and wide range of potential social
and economic impacts that could potentially result from space weather events across different technological sectors.
Descriptions also address how the different categories may relate to one another and where space weather products and
services, such as those provided by NOAA’s Space Weather Prediction Center, can add value by lessening these impacts.
These impacts are presented in chronological order in relationship to a particular space weather event (see Figure 1 for
additional information).
Impact
Category Definition
Defensive
Investments
This impact category captures expenditures made in advance of any particular space weather event that help protect
technological systems against potential impacts of an event. In general, such investments tend to be capital
intensive and are therefore financially justifiable if they help make systems more robust to “all-hazards” as well
(e.g. severe weather, earthquakes, floods, terrorism, etc.). Examples include the devotion of resources to
engineering at both the component and system level, to enhancing real-time situational awareness, and to
developing plans and operational procedures for different space weather scenarios. Space weather products and
services, such as those provided by NOAA’s Space Weather Prediction Center (SWPC) add value to different
sectors by providing scientific information necessary to properly understand their risks and vulnerabilities.
Mitigating
Actions
This refers to the undertaking of a specific action or suite of actions in preparation for an anticipated space weather
event or in response to one that is underway in order to reduce or limit potential impacts. The ability to mitigate
requires timely and accurate information about the space weather environment and operators must further be able
to understand and act upon it. The mitigating actions enacted by operators involve different levels of
resources/costs and may or may not impact the services they provide. Space weather products and services add
value to different sectors by providing a range of information about the space weather environment that offer
different lead times (e.g. forecasts, warnings, alerts, now casts) for different types of events (e.g. geomagnetic
storms, radiation storms, and radio blackouts).
Asset
Damages
This impact category refers to any degree of physical damage to sector assets that may result from space weather
either suddenly (“acute”) or slowly over time (“chronic”). Examples of acute damage include partial or complete
destruction of an asset that may cause it to become temporarily or permanently inoperable. Acute damage may in
turn lead to Service Interruptions if it is widespread or if it occurs to assets that are unique or else critically located.
Chronic damage represents additional wear and tear on assets that accelerate their aging and reduce their lifespan.
Chronic damage represents operational or maintenance costs to a sector as parts then have to be fixed or replaced
more frequently. Space weather products and services, such as those provided by NOAA’s SWPC add value to
different sectors by providing the scientific information necessary to conduct post-event analysis. Better
understanding what caused a specific incident of asset damage can feed into various Defensive Investments (e.g.
design and engineering or situational awareness) that help reduce future losses. Asset Damages caused to any
downstream industry, due to Service Interruptions of the directly impacted sector, would be covered in the
following category.
Service
Interruptions
This category captures the range of potential impacts seen by the end users of the services provided by a sector
such as adverse changes in the quality, price, or provision. In general, Service Interruptions have direct economic
consequences to service providers within each sector either by harming their reputation or due to losses in revenue
during service outages. There are also economic and societal impacts on end users that vary depending on how
the disturbance propagates and trickles through different businesses. It is through Service Interruptions that the
sectors studied in this report are coupled to each other and to wider society. SWPC products and services add
value to different sectors by allowing service providers within different sectors to better communicate with their
clients about the potential and probability for Service Interruptions so they can be informed of potential threats to
their businesses and have more options available to them. Also, there can be indirect impacts to upstream and
downstream businesses due to Service Interruptions with the directly impacted sector.
Health
Effects
This addresses direct health hazards such as radiation exposure and therefore is most applicable to humans flying
at airplane altitudes at the time of a space weather event. Astronauts in space during severe space weather are also
at great risk. The medical research linking aviation related exposure and adverse human health risks is tenuous but
if established would imply economic impacts such as direct treatment costs (e.g., hospital bills), the costs of pain
and suffering, the costs of lost life-years, and lost earnings. Space weather products and services, such as those
provided by NOAA’s SWPC add value through the provision of scientific information that can be used to study
and explore these potential linkages and by providing information about potential exposure environment so
airlines, aircrew, and astronauts can be precautionary and track their total exposure or take actions to reduce their
exposure.
This initial round of stakeholder outreach allowed us to gather key insights and information that we then used
8
to begin developing cost estimates for both our “moderate” and more “extreme” event scenarios. However, to ensure
that we correctly understood and carefully interpreted these conversations and the various highly technical issues
embedded within this topic, we continued to interact with these stakeholders intermittently and more informally as we
proceeded with our research (e.g. quick emails, impromptu calls, in person meetings). This additional outreach helped
us better understand the (1) key physical effects of concern for each sector, (2) most relevant impact category(s) and
plausible impacts, (3) assumptions, nuances, and caveats surrounding these effects and their potential impacts, and (4)
available information and data. Since estimating the total costs associated with both a “moderate” and more “extreme”
event would involve considering impacts stemming from our 17 different physical effects across four sectors and all five
social and economic impact categories, we needed to establish priorities for our quantitative effort. We decided to
develop cost estimates most reflective of stakeholder concerns and for the impact categories that were also apt to reflect
the largest potential impacts. Where possible (all sectors except GNSS users), we also tried to establish cost estimates
for one of our proactive impact categories (either defensive investments or mitigation actions) and also one for our
realized impact categories (asset damages, service interruptions, or health effects). Although tangential to our main
study goals, we found it interesting and insightful to consider the different potential costs associated with these different
approaches to managing space weather impacts.
Stakeholders were very vocal about the challenges associated with trying to develop potential cost estimates
and cautioned us about the many complexities and large uncertainties involved. Although we began our effort wanting
to model the impacts of space weather, we simply could not justify such an approach since the stakeholders we spoke to
emphasized how it is intractable at this point in time to rigorously connect the magnitude of a space weather event to our
list of physical effects and ultimately to the types and sizes of the impacts that may result. Recognizing the importance
and need to develop a better quantitative understanding of this topic, many of our stakeholders expressed their
willingness to help guide our effort as their availability allowed (which in quite a few instances involved weekend emails
and phone calls). In their opinion, it was essential to capture and codify certain industry realities and nuances that are
essential to this problem. We therefore opted to formulate cost estimates that capture and translate stakeholder insights
on key aspects of this research problem into logical and quantitative statements. This involved, for example, initial
discussions about what is reasonable to expect under “moderate” compared to more “extreme” space weather conditions.
After further researching and considering such input, we put together initial equations with numbers and then shared
them with our stakeholders. In addition to receiving feedback, this allowed us to obtain additional stakeholder insights
including their gut reactions to assumptions we made and their best guesses to help constrain key variables even if they
could only provide order of magnitudes or rough ranges. Our approach allowed us to establish a robust and novel
understanding for what needs to be known in order to quantify space weather impacts and where the outstanding
knowledge gaps lay. Proposing transparent, tractable cost estimates that are easy to follow and reproduce is additionally
advantageous as it will allow others to readily critique, question, and improve our initial effort. It also provides
flexibility, enabling our cost estimates to be updated as technologies and our societies evolve and additional knowledge
is acquired. To clearly emphasize the large uncertainties surrounding the cost estimates presented herein, many of which
were derived using placeholder numbers and all of which should be critically and widely reviewed, we provide lower
and upper range estimates and also round all final estimates to one significant figure.
2.1. References

9
Allen, J., H. Sauer, L. Frank, P. Reiff. 1989. Effects of the March 1989 Solar Activity. Eos, Vol. 70, No. 46.
Baker, D. N. (2009), What Does Space Weather Cost Modern Societies?, Space Weather, 7, S02003,
doi:10.1029/2009SW000465.
Baker, D.N. and L.J. Lanzerotti. 2016. Resource Letter SW1: Space Weather. American Journal of Physics. Vol.
84, No. 3.
Cannon, P.; Angling, M., Barclay, L., Curry, C., Dyer, C., Edwards, R., et al., 2013. Extreme space weather: impacts
on engineered systems and infrastructure, UK Royal Academy of Engineering, London, ISBN 1-903496-95-0.
Eastwood, J.P., E. Biffis, M.A. Hapgood, L. Green, M.M. Bisi, R.D. Bently, R. Wicks, L.A. McKinnel, M. Gibbs, and
C. Burnett. 2017. The Economic Impact of Space Weather: Where Do We Stand? Rick Analysis, Vol. 37,
No. 2
Forbes, K. F., and O. C. St. Cyr (2012), Did geomagnetic activity challenge electric power reliability during solar cycle
23? Evidence from the PJM regional transmission organization in North America, Space Weather, 10,
S05001, doi:10.1029/2011SW000752.
Executive Office of the President, 2017. Space Weather Phase I Benchmarks. Product of the Space Weather
Operations, Research, and Mitigation Committee of The National Science and Technology Council.
Hapgood, M., Angling, M., Attrill, G., Burnett, C., Cannon, P., Gibbs, M., et al., 2016. Summary of space weather
worst-case environments. Revised edition. RAL Technical Report RAL-TR-2016-06.
Helmer, O. 1967. Analysis of the Future: The Delphi Method. The RAND Corporation, Santa Monica, California.
Lopez, R.E., D.N. Baker, and J.H. Allen. 2004. Sun unleashes Halloween Storm, Eos, Vol. 85, No. 11

10
3. Electric Power
3.1 Impact Mechanisms
A space weather event can produce Geomagnetically Induced Currents (GICs) that may be transmitted by
effective conductors on the Earth’s surface such as the electric-power grid. When GICs enter the power grid, they act
as direct current (DC) sources that flow alongside the normal alternating currents (AC) produced at power plants and
transferred along power lines to electrical substations. Basic incompatibilities between DC and AC currents may
interfere with the normal functioning and performance of Extra High Voltage (EHV) transformers. The interaction of
GICs with these transformers can result in a number of physical effects that, if sufficiently large and not properly
managed, may adversely impact the power system [Cannon et al., 2013; Pulkkinen et al., 2017]. For example, GIC-
transformer interactions can increase reactive power consumption [Tay and Swift, 1985; Price, 2002], contributing to
voltage instabilities and potentially leading to power outages. They can also generate harmonics that can disconnect
parts of the grid by causing the improper operation of protective relay equipment (e.g. static compensators) [e.g.
Bolduc, 2002; Pulkkinen et al., 2005] and/or the tripping offline of generators [e.g. Rezaei-Zare and Marti, 2013]. It
is important to note that this impact pathway is the only one that has to-date been known to trigger space weather-related
blackouts. Specifically, it was the underlying cause of the 1989 Hydro-Québec outage [Bolduc, 2002] and the Swedish
outage during the 2003 Halloween storm [Pulkkinen et al., 2005]. GIC-related degradations in transformer performance
may also challenge electric power reliability as suggested by statistically significant empirical correlations between real
power imbalances and GIC data [Forbes and St. Cyr, 2010; 2012]. And lastly, GIC-transformer interactions can cause
transformer heating and if sustained over a sufficient period of time (e.g. tens of minutes ) may become problematic
(e.g. hot-spot heating). This physical effect can in turn lead to various degrees of transformer damage from incremental
degradation of transformer components [Tay and Swift, 1985; Gaunt and Coetzee, 2007] to more severe physical damage,
such as the melting of copper windings, that may require repairs or removal from service [e.g. Kappenman, 2010]. Space
weather impacts on GNSS users, covered in a later chapter of this report, may also be consequential to the power grid.
GNSS/GPS precision timing enables key components of the grid to be synchronized (e.g. generation, transmission, and
distribution) and if interrupted during a space weather event, may become problematic.
11
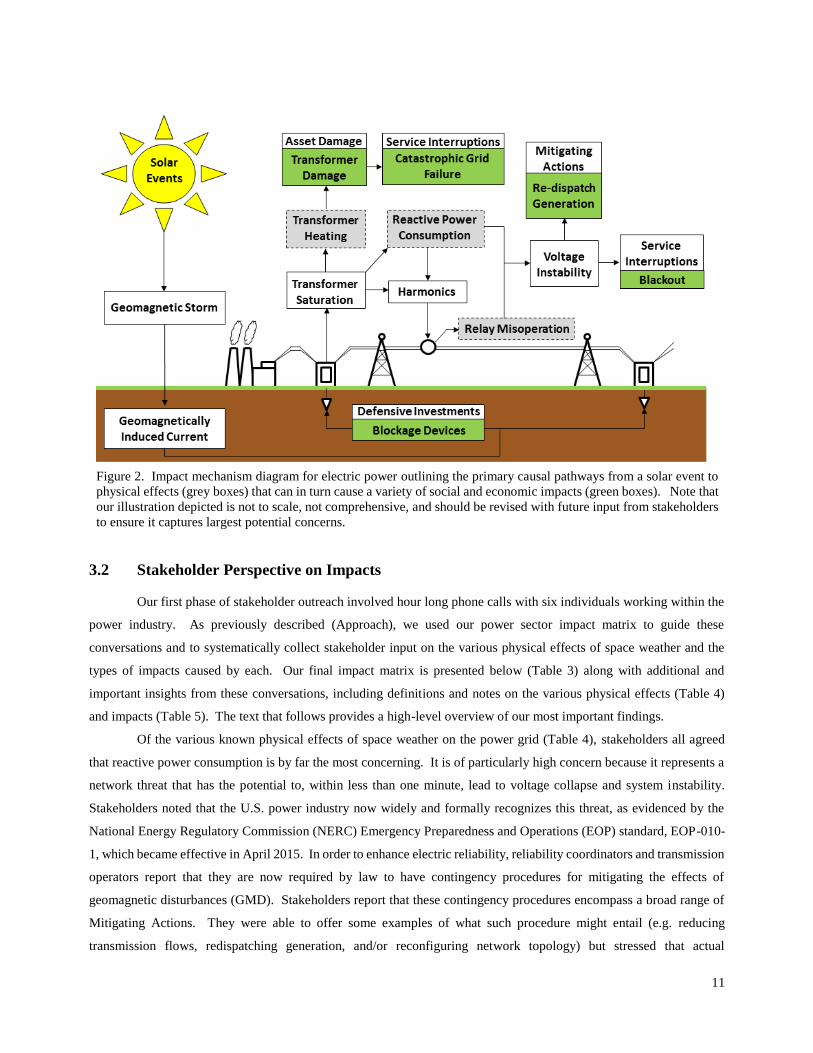
Figure 2. Impact mechanism diagram for electric power outlining the primary causal pathways from a solar event to
physical effects (grey boxes) that can in turn cause a variety of social and economic impacts (green boxes). Note that
our illustration depicted is not to scale, not comprehensive, and should be revised with future input from stakeholders
to ensure it captures largest potential concerns.
3.2 Stakeholder Perspective on Impacts
Our first phase of stakeholder outreach involved hour long phone calls with six individuals working within the
power industry. As previously described (Approach), we used our power sector impact matrix to guide these
conversations and to systematically collect stakeholder input on the various physical effects of space weather and the
types of impacts caused by each. Our final impact matrix is presented below (Table 3) along with additional and
important insights from these conversations, including definitions and notes on the various physical effects (Table 4)
and impacts (Table 5). The text that follows provides a high-level overview of our most important findings.
Of the various known physical effects of space weather on the power grid (Table 4), stakeholders all agreed
that reactive power consumption is by far the most concerning. It is of particularly high concern because it represents a
network threat that has the potential to, within less than one minute, lead to voltage collapse and system instability.
Stakeholders noted that the U.S. power industry now widely and formally recognizes this threat, as evidenced by the
National Energy Regulatory Commission (NERC) Emergency Preparedness and Operations (EOP) standard, EOP-010-
1, which became effective in April 2015. In order to enhance electric reliability, reliability coordinators and transmission
operators report that they are now required by law to have contingency procedures for mitigating the effects of
geomagnetic disturbances (GMD). Stakeholders report that these contingency procedures encompass a broad range of
Mitigating Actions. They were able to offer some examples of what such procedure might entail (e.g. reducing
transmission flows, redispatching generation, and/or reconfiguring network topology) but stressed that actual

12
contingency procedure that might be enacted during any particular GMD event would vary from operator-to-operator
and inevitably depend on many real-time power system details. It was further noted, however, that most if not all of the
Mitigating Actions that might be enacted during a space weather event are routinely enacted for other non-space weather
reasons (e.g. terrestrial weather) so their costs, while potentially significant on a per event basis, may be relatively small
in the context of their annualized operational costs.
Stakeholders noted that if such procedures are not enacted or are unable to boost reactive power to a sufficient
level, far more costly wide-area blackouts could in theory result. Recovering the power system from such an occurrence
might in turn take the industry ~6 to 9 hours, representing the time required to coordinate and synchronize the large
number of individual system components. The industry stakeholders that we talked to also expressed less concern about
transformer heating leading to damage (i.e. over-heating) which was the focus of early social and economic impact
assessments. Although this impact pathway underpins such early scenarios envisioning catastrophic transformer damage
that causes prolonged power outages (e.g. months to years) [Kappenman, 2010], stakeholders noted that this physical
effect is only worrisome if it is substantial and sustained. It is currently thought that reactive power consumption will
quickly disconnect these transformers, cutting off the heating source that could potentially cause damage. In 2016,
FERC mandated (TPL-007-1) that infrastructure owners conduct rigorous analyses in order to better understand how
vulnerable our nation’s transformers may be to a severe, 1-in-100 years GMD benchmark event. Stakeholders report
that these analyses will ultimately support decisions about what Defensive Investments (e.g. blocking capacitors,
replacement transformers, etc.) the industry needs to make to increase reliability by hardening their infrastructure and
assets against this benchmark event. They furthermore communicated that this mandate will likely impose one-time
costs that are more substantial than the costs imposed by EOP-010-1.

13
Table 3. Impact matrix populated during stakeholder outreach to better understand how the well-studied physical effects of space weather on electric power
can cause different types of Social and Economic Impacts. Items in matrix reflect example impacts for moderate (normal text) and extreme (italic text) storms.
Question marks denote instances where the physical effect may in theory be able to cause this impact but empirical support is lacking. *Additional details
pertaining to a select set of these impacts can be found in Table 5.
Physical Effects
Impact Categories
Defensive
Investments
Mitigating
Actions
Asset
Damage
Service
Interruptions
Health
Effects
Reactive Power
Consumption
• Infrastructure hardening*
• Situational awareness &
Preparedness*
• Reduce transmission flows
• Redispatch generation
• Network reconfiguration
• Emergency procedures*
• Degradation in
power quality*
• Price fluctuations
• Blackouts?
Transformer Heating
• Infrastructure hardening*
• Situational awareness &
Preparedness*
• Spare transformers
• Reduce transmission flows
• Redispatch generation
• Network reconfiguration
• Emergency procedures*
• Transformer aging
• Partial damage
• Transformer Failure
• Price fluctuations
• Blackouts?
• Catastrophic grid
failure
Improper Operation
of Protective
Relaying Equipment
• Infrastructure hardening*
• Situational awareness &
Preparedness*
• Reduce transmission flows
• Redispatch generation
• Network reconfiguration
• Emergency procedures*
• Damaged equipment • Blackouts*
Real Power
Imbalances
• Reduce transmission flows
• Redispatch generation
• Network reconfiguration
• Emergency procedures*
• Degradation in
power quality
• Price fluctuations
• Blackouts?
Generator Tripping • Infrastructure hardening* • Protective relay settings • Loss of generation
Loss of Precision
Timing • Backup technologies

14
Table 4. Space weather can cause a variety of physical effects to the power grid. These physical effects, defined
below, are relatively well-studied in the scientific and engineering literature. These physical effects were discussed
with industry stakeholders in order to better understand their potential for causing different types of social and
economic impacts.
Physical
Effects Definition Notes from Stakeholder Outreach
Reactive
Power
Consumption
Reduction in amount of
reactive power flowing through grid due to the
increased consumption of
reactive power by transformers.
• This is problematic because it depresses the system voltage and may lead to voltage
collapse. It occurs at transformers but is a grid-scale threat.
• Voltages are controlled within tight bands. When system gets to ~10-20% of normal
voltage, this triggers a concern for blackouts.
• Reactive power does not like to travel so highest vulnerability in areas farthest away from generation and highest loads. Managing reactive power issue may be most
challenging in the spring and fall, where generation is modest but there are economic
incentives for moving electricity long distances.
• Increasing problem as we rely on higher voltage power lines (long distance transfers). Relying more heavily on local generation can help mitigate, but trend is
for it to be shut down in favor of long distance transfers. Certain renewables (e.g.
Solar), which tend to be local and more distributed, may be helpful for these reasons.
Transformer
Heating
Substantial heating of internal
transformer components that
can cause accelerated asset aging and perhaps even
transformer damage.
• Probability of damage depends on design, age, use history, etc. NERC’s recently approved threshold based on potential transformer heating is 75
amps/phase. Transformers can take more than this but this is the trigger to pay
attention. The relationship between heating and damage is transformer specific so FERC standard is conservative in order to cover potential differences across nation
in transformer designs.
• Certain stakeholders expressed dissatisfaction with early economic analyses and feel
the potential for failure is overstated. Before failure occurs, it is likely that transformers will be disconnected. This negative feedback could cause a blackout
that may also protect against catastrophic failures. Utility perspective on probability
of transformer damage will be known when studies related to TPL-007-1 are complete, in ~2 to 4 years from now (2017).
• Transformer overheating may have implications for real-power imbalances too.
Improper
Operation of
Protective
Relaying
Equipment
Improper functioning of relay
systems that are designed to
protect grid by detecting
electrical aberrations (e.g.
faults, surges, over/under voltages) and then isolating
the impacted area from the
rest of the network.
• Infrequently observed but it does happen and when it does, the cause is not clear. It
will likely be attributed to space weather only if they know an event is expected or
underway.
• Older relays generally more susceptible to harmonics, modern relays less so.
• Most often trip capacitors banks offline. This increases reactive power losses, depressing system voltage and introduces blackout threat. This is what triggered the
1989 Quebec blackout and the outage in Sweden during the Halloween 2003 storm.
Real Power
Imbalances
Difference in real-time supply
and demand for power that
must be managed by operators to maintain grid stability.
• Caused by many things in addition to space weather such as hot weather, etc.
• Industry is aware of statistical relationship but unclear about physical basis. Degradation in transformer performance may cause issue (via generation control
errors and high voltage electricity flows) or may result due to operator actions.
Generator
Tripping
Space weather related
harmonics can also send erroneous commands to
generators, tripping them offline.
• One stakeholder brought this to our attention, a more niche topic compared to other
physical effects but is nonetheless an important additional issue.
Loss of
Precision
Timing
Loss of satellite enabled
technology that provides
precise timing information that is used to improve grid
synchronization.
• When satellite signals are lost, substation clocks will continue to operate and remain accurate for several hours.
• Not clear how space weather threat compares to spoofing threat but addressing
spoofing concerns makes grid less vulnerable to space weather interruptions. The
spoofing threat has been well studied by the industry and they find the threat to be small.
• This could become more problematic in the future if we over rely on these systems.
• Dependence on precision timing may be bigger trend in U.S. power sector than
abroad. Other countries are required to maintain traditional timing devices at substations.

15
Table 5. Additional details on a select set of space weather impacts identified and organized in our impact matrix (Table
3).
Impact
Category Examples Definition Notes from Stakeholder Outreach
Defensive
Investments
Infrastructure
hardening
A range of engineering and design
modifications that reduce grid
vulnerability such as installing GIC
absorbing or blocking devices (e.g.
neutral ground connections, series
line capacitors) or replacing aging or
vulnerable transformers.
Understanding what to do requires many analyses.
Installing a blocking device, for example, can reroute
current in unexpected and devastating ways.
This is the subject of the new FERC regulations. The
types of investments that need to be made are
understood but unclear how widely or where they will
be required.
Situational
Awareness &
Preparedness
Utilizing a range of data and tools to
stay aware of current and anticipated
future conditions. Data and products
can come from the government (e.g.
NOAA’s Space Weather Prediction
Center), GIC monitoring networks
(e.g. magnetometers, internal-
instruments within transformers) or
transformer monitors and be fed into
grid simulators and management
systems. This information can then
be used to inform what operational
procedures should be enacted as
various situations arise.
This Defensive Investment is critical to being able to
implement real-time Mitigating Actions. Operators have training to prevent key downstream
impacts but they need to be made aware of the
situation, day ahead space weather warnings are most
important. Operators monitor space weather products and pay
extra attention to own data when they receive alerts at
the upper end of scales (K7 or greater). Diagnostic equipment is being installed on
transformers in order to optimize maintenance cycle.
Although not installed for space weather events per
say, it will allow any transformer heating to be rapidly
assessed.
Mitigating
Actions
Redispatch
Generation
Deciding to utilize generators that
will enhance grid stability rather
than those that will maximize profits.
Relatively low cost action. One stakeholder
mentioned that one space weather event may cost
~$1s million but redispatching costs them ~$100s
million per year.
This is a relatively easy action for operators and
almost always impacts the price of electricity.
Emergency
Procedures
A set of operating procedures that
can be enacted in extreme cases and
might include, for example,
generator or equipment curtailment,
voltage reductions, and load
shedding as a last resort.
Different grid operators have different sets of
emergency procedures and different triggers for
enacting them in place.
Asset
Damages
Transformer
Aging
Accelerated aging of transformer
caused, for example, by degradation
and gas generation within insulation
materials.
Logic of argument makes sense but the empirical data
is not significant enough for industry to believe that
moderate events “add up” and, among all else, play a
big role in transformer aging.
Data currently being compiled by industry and
academics is essential for better resolving this issue.
Transformer
Failure
Any damage to a transformer that
renders it permanently inoperable
and cannot be repaired and so
requires a replacement transformer.
Probability and extent of damage requires long GIC
durations and scale with duration of GIC.
Most likely to happen to older transformer that are
near the end of their lifetime.
Service
Interruptions
Blackouts Loss of power to electricity users.
Storms have to be particularly extreme for this to
happen (K8 or K9). NOAA scales need refinement to
better discriminate between large events.
More permanent loss of service that would result if a
large number or certain critical transformers
permanently fail, but probability of this occurring is
thought to be very low.
Costs of outages depend on where and when an outage
occurs, something that is almost impossible to know
in advance of an event occur.

16
3.3 Cost Estimates
In order to translate our findings into quantitative cost estimates that capture the most concerning and potentially
largest impacts, we conducted a second round of stakeholder outreach. After discussing the various possibilities and
better understanding some of the challenges inherent to quantifying many of the impacts we identified (Table 3), we
ultimately decided to develop power sector cost estimates for (1) Defensive Investments (~$50 million to ~$1 billion)
and (2) Service Interruptions (~$400 million to ~$10 billion for a moderate event and ~$1 billion to ~$20 billion for
more extreme conditions respectively). Our cost estimate for Defensive Investments focuses on the potential financial
impacts of hardening the grid to comply with NERC’s recently enacted, TPL-007-1 standard. Our cost estimate for
Service Interruptions explores the potential impacts to the end users of electricity from potential power outages. Our
quantification process involved an iterative series of discussions with particularly helpful and committed stakeholders,
combined with quantitative analyses based on the Value of Lost Load [London Economic International LLC, 2013]. Key
insights gleaned from these conversations are provided below alongside a description of how they influenced the
derivation of our cost estimates.
Table 6. Simplified impact matrix with the focus of our quantitative analysis highlighted in yellow. The presence
(or absence) of a circle denotes where we were able to connect a given physical effect to a particular impact category
based on outreach (see Table 3 to better understand items these circles represent). Black circles denote that a physical
effect is known, from direct past experience, to cause a particular category of societal impact. Open circles indicate
that a given physical effect may cause a particular category of societal impact but lacks empirical support.
Physical Effects
Impact Categories
Defensive
Investments
Mitigating
Actions
Asset
Damages
Service
Interruptions
Health
Effects
Reactive Power
Consumption ● ● ○
Transformer Heating ● ● ● ○
Improper Operation of
Protective Relaying
Equipment ● ● ● ●
Real Power Imbalances ● ○
Generator Tripping ● ●
Loss of Precision Timing ● ○
3.3.1 Defensive Investments
We estimate that the one-time cost of hardening the U.S. power grid against potential space weather impacts
may be ~$50 million to ~$1 billion. This estimate focuses on NERC’s recently approved TPL-007-1 standard requiring
that our national power infrastructure be capable of withstanding a benchmark GMD event. In order to achieve this goal,
TPL-007-1 (approved by FERC on September 22, 2016) requires infrastructure owners to analyze and then address the
vulnerabilities of their system to NERC’s established benchmark. Stakeholders report that these analyses are just
beginning and it will be ~2 to 4 years until they have their results. Although they already understand the available design
and engineering options for addressing potential issues such analyses uncover, they do not yet know where or how
extensively they will need to implement such measures. Our cost estimate presented below therefore aims to incorporate
present industry perspectives on this topic and should be revisited as more information is acquired.

17
We base our estimate on (1) the type and number of industry assets that may be vulnerable to NERC’s
benchmark event and therefore may require hardening and (2) lower and upper boundaries on potential asset hardening
costs. Although many specifics are lacking, such as where or how extensively hardening measures will need to be
implemented, it is Extra-High Voltage (EHV) (e.g. 765-345 kV) transformers that are currently of the largest concern.
Stakeholders note, however, that assets with voltages down to 220 kV are also undergoing assessment. In addition to
well-established and studied vulnerabilities of these assets to space weather events, EHV transformers range in price
from ~$4.5 million to ~$7.5 million (NERC, 2011) and therefore also represent one of the most expensive infrastructural
components. At this point in time, stakeholders therefore think that EHV transformers will constitute the majority of all
TPL-007-1 related hardening costs (as opposed to Corrective Action Plans (CAPs) that address operational procedures
or Mitigating Actions). Although stakeholders were able to point us to various documents containing general information
about the U.S.’s fleet of ~2,000 EHV transformers [DOE, 2014], they were quite hesitant to even venture a guess as to
how many of these transformers might be vulnerable. They emphasized the complexity of the issue and why providing
even rough numbers is hard in advance of them finishing their rigorous analysis. Specifically, vulnerability depends on
many factors including transformer design, location, age, use history, network typology, and current system load. Most
stakeholders further shared a similar hunch that the recently started studies will ultimately find a small number of
vulnerable assets. A few were willing to go out on a limb and speculate that maybe ~1 to 10% of the total U.S. fleet,
equating to ~20 to 200 EHV transformers, might be found vulnerable to NERC’s benchmark event. Although we were
unable to find readily available data on many of the important variables to further explore what stakeholders already
know about variations in vulnerability (e.g. vulnerability may be largest in transformers near the system edges or nearing
the end of their operational lifetimes), stakeholders were able to offer some rough numbers on transformer design: ~85%
(or 1700) of all EHV transformer might be single-phase transformers with the remaining ~15% (or 300) being three-
phase transformers. Noting that single-phase transformers are in general more vulnerable than three-phase transformers,
we assign the lower portion of the potential vulnerability range (~1 to 10% of the total U.S. fleet) to more robust, three-
phase transformers (~1 to 5%) and the higher range to more susceptible, single-phase transformers (~6 to 10%). This
suggests that in total, ~102 to ~170 single-phase and ~3 to ~15 three-phase EHV transformers may require hardening in
order to meet NERC’s TPL-007-1 standard (Table 7).
The second part of our estimate considers the wide range of costs that could be associated with hardening these
potentially vulnerable transformers. Stakeholders inform us that the least expensive option is usually to install GIC
blocking devices which can cost at least ~$500,000 per EHV transformer. If this engineering measure is implemented
at all vulnerable transformers, total costs would be ~$50 million to ~$100 million (Table 7). Although relatively
inexpensive, stakeholders also noted that blocking devices may not be a universal solution in all locations since their
installation typically pushes the GIC, and therefore the problem, elsewhere in the network. Moreover, they are generally
disliked across industry because they add complexity to the system that requires additional management and
maintenance. Stakeholders also discussed that the most expensive option is to replace vulnerable transformers but noted
that such replacements would be warranted because of many additional, non-space weather reasons such as because they
are near or have exceeded their design lifetime. If all vulnerable transformers are replaced though, costs to the industry
would instead total ~$500 million to ~$1 billion (Table 7). These low and high end-member possibilities suggest a final
cost estimate for Defensive Investments of ~$50 million and ~$1 billion. We emphasize that this is a rough estimate

18
that is intended to be illustrative yet informative and should be revisited periodically as TPL-007-1 studies progress.
Table 7. Potential cost estimate of NERC TPL-007-1 standard to harden the U.S. Extra High Voltage (EHV)
transmission system against space weather.
Transformer
Type1
F.O.B
Price1
Installed
Cost2
Total
Number
in U.S.3
Number (%) that
may require
hardening4
Cost Estimate
Lowest Cost
Option (Blocking)
High Cost Option
(Replacement)
Single-Phase ~$4.5 m ~$5.7 m ~1700 ~102-170
(6 to 10%) ~$50-90 m
~$0.5-1 b
Three-Phase ~$7.5 m ~$9.6 m ~300 ~3-15
(1 to 5%) ~$2-8 m
~$30-100 m
Total ~2000 ~105-185 ~$50-100 m ~$0.5-1 b 1Information directly from p. 3 (Table 1) in NERC, 2011
2Derived from NERC, 2011 which notes that taxes, transportation, installation, testing, and other associated
expenses which generally add an additional ~25 to 30% to F.O.B. (“Factory on Board”) price. We therefore
calculate the installed cost by multiplying F.O.B. prices by 1.275. 3The U.S. transmission system has ~2,000 EHV transformers (DOE, 2014). Estimates for the number of single-
and three-phase transformers was derived based on stakeholder input that they might ~15% and ~85% of entire
U.S. fleet respectively. 4Based on stakeholder input. 5Low cost option assumes that the system will be hardened by installing a blocking device (~$500,000 per
transformer) at every vulnerable transformer. 6High cost option assumes that the system will be hardened by replaced all vulnerable transformer (e.g.
Replacement costs = Installed cost).
3.3.2 Service Interruptions
If a space weather event causes a power outage, we estimate costs to U.S. electricity consumers that may be
~$400 million to ~$10 billion for a moderate event and ~$1 billion to ~$20 billion for a more extreme event. Although
this potential impact has to date generated the most concern and attention, stakeholders were relentless in emphasizing
the number of significant uncertainties surrounding this issue. Many stressed that there are currently so many unknowns
that cost estimates should be carefully caveated. After closely reviewing the technical literature and discussing previous
cost estimates with stakeholders [e.g. Kappenman, 2010; Oughton et al., 2016; 2017], we better understood the inherent
challenges but nonetheless proceeded to construct an estimate that would at the very least complement the existing work
by more closely reflecting where the power industry stands on the issue. Constructing a cost estimate, for example,
requires making some assertion about which of the various physical effects will cause the power outage. This is
necessary in order to make appropriate and realistic statements concerning the likely spatial and temporal scales of the
outage which are both first-order controls on costs. Other important assumptions fundamental to assessing the costs of
potential outages include the location, time of day, season of year, and the real-time information about the grid (e.g.
generation location/sources, load, etc.). Moreover, stakeholders emphasize that the U.S. has not yet directly experienced
a space weather related power outage. Our moderate event estimate of ~$400 million to ~$10 billion is therefore based
on a hypothetical event that causes protective relays to mis-operate and in turn leads to a power outage that is
commensurate in duration and scale with the Quebec 1989 storm. Our extreme event estimate of ~$1 billion to ~$20
billion is based on a series of iterative conversations we had with stakeholders and scientists. We relied on this input to
make the best possible assumptions about the most important controlling factors on the potential cost of this impact

19
including, (1) which physical effect might cause the impact (reactive power consumption) and (2) the most likely scale
(cascades across energy market) and duration (~9 hours) of the power outage. Note that ~9 hours corresponds to the
length of time necessary to recover power once it is lost and assuming no equipment damage. If a space weather event
causes a prolonged disturbance or causes extensive equipment damage that delays the recovery effort, the outage could
be longer in duration. Note that there is no established protocol to follow when attempting to construct such estimates
and the most appropriate methodology to use ultimately depends on the goal of a study. We emphasize that our estimates
are intended to illustrate the power industry perspective and therefore complement the few other existing works which,
for example, were instead driven by the insurance industry’s desire to explore the upper-most catastrophic outages
scenario in order to better understand what financial responsibilities might fall under their purview [Oughton et al.,
2016].
3.3.2.a. Moderate Event Scenario
We estimate that a moderate space weather event may cost U.S. consumers of electricity ~$400 million to ~$10
billion depending on where within the US it occurs. This estimate assumes a power outage that lasts ~6 hours, reflecting
one similar in duration to the one occurring as a result of the Quebec 1989 storm [Oughton et al., 2017]. It reflects two
independent estimates that are each based on a different metric describing the scale of this historic outage: (1) The
amount of power lost (~14.5 to 19 GW) and (2) the number of customers left without electricity (~6 million) [Oughton
et al., 2017]. We chose to develop two independent cost estimates because we were unable to find detailed studies or
original references to better understand the scale of this historic outage. Our first estimate is based on the amount of lost
power which yields a lower cost estimate of ~$400 million to ~$2 billion, whereas our second estimate based on the
number of impacted customers yield a higher estimate of ~$4 billion to ~$10 billion.
For our first estimate, we assume that a moderate space weather event causes a power loss of ~14.5 to 19 GW
for ~6 hours so the resulting energy loss totals ~87 to 114 GWh. Multiplying this energy loss by the U.S. national range
for the Value of Lost Load (VOLL), $5,000 to $10,000 per MWh (London Economic International LLC, 2013), suggests
a cost that is ~$400 million to ~$2 billion. Although using the national range for VOLL allows for a tractable and
straightforward estimate, the cost of a given duration outage (e.g. 6 hours) varies dramatically with geography since
different areas have different customers bases (e.g. commercial, industrial, and residential users). We nonetheless
present this simple VOLL-based estimate because it represents a standard and transparent approach for quantifying how
electricity customers may be impacted by a power supply interruption of a given duration [London Economic
International LLC, 2013].
For our second estimate, we instead assume that the event causes ~6 million electricity users to lose power. To
explore stakeholder concerns that cost estimates are sensitive to assumptions about where in the nation the outage occurs,
we calculated costs estimates for individual states and different regions of the country (Table 8) using state-level data
provided by the Energy Information Agency and the Department of Energy’s Interruption Cost Estimate (ICE) Calculator
(for additional details, see footnotes in Table 8). We found that an outage impacting ~6 million U.S. electricity customers
could cost anywhere from ~$4 billion if it occurred in New England to ~$6 billion if it occurred in the West North
Central region (Iowa, Kansas, Minnesota, Montana, Nebraska, North Dakota, and South Dakota). Since stakeholders
emphasize that it is not possible to know where exactly an outage may occur, we use the full range of U.S. values for a
20
cost estimate for the event that is ~$4 billion to ~$10 billion. At this point in time, we are unable to integrate important
but not yet known information about the probability of space weather events causing outage in these different locations.
Our estimate therefore only reflects the consequences of an outage (impacts) in these different locations based on the
assumption that one occurs. In addition to this geographic variability, these potential Service Interruptions
asymmetrically impact different types of electricity users. Across the nation, impacts to commercial and industrial users
would range from ~$1 to ~$10 billion whereas impacts to residential users would only be ~$10 to ~$100 million (Figure
4). This key result emphasizes the importance of economic valuation studies that use input-output modeling to explore
how these direct impacts on power users can in turn impact (“indirect impacts”) upstream and downstream industries
[Oughton et al., 2017].
Table 8. Costs of outage that could occur during a moderate event will depend on where it occurs.
Region1 States1
Total # of
Customers
(in 2015)1
% of Customers
Impacted2 Cost to
Customers
New England CT, ME, MA, NH, RI, VT 7,224,700 83% ~$4 b
Middle Atlantic NJ, NY, PA 18,174,969 33% ~$4 b
East North Central IL, IN, MI, OH, WI 22,310,236 27% ~$4 b
West North Central IA, KS, MN, MO, NE, ND, SD 10,817,289 55% ~$6 b
South Atlantic DE, DC, FL, GA, MD, NC, SC, VA, WV 30,532,365 20% ~$4 b
East South Central AL, KY, MS, TN 9,580,016 63% ~$5 b
West South Central AR, LA, OK, TX 17,811,548 34% ~$5 b
Mountain AZ, CO, ID, MT, NV, NM, UT, WY 10,862,155 55% ~$5 b
Pacific Contiguous CA, OR, WA 20,495,811 29% ~$5 b
Pacific
Noncontiguous AK, HI 823,933 100% ~$2s b
Total 148,633,002 4 % ~$5 b 1Information from the 2015 Total Electric Industry Customers, reported in Table 1 by the Energy Information Agency (Summary
of data form EIA-861-schedules 4A, 4B, EIA-861S and EIA-861U), available at https://www.eia.gov/electricity/data.php#sales 2Percentage of region impacted is calculated by dividing the total number of people assumed to be impacted by the outage (6
million customers) by the total number of customers within the region. 3Cost of outage calculated by first using the U.S. Department of Energy’s (DOE) Interruption Cost Estimate (ICE) Calculator
(available at http://www.icecalculator.com/ ) to estimate the costs of a 6 hour outage to all states within each region (100% of
customers) and then multiplying results by the % of customers within the region that would actually be impacted.

21
Figure 3. Cost estimates of a ~6 hour outage vary dramatically from state-to-state. Numbers in below figure derived
by using state-level data provided by the Energy Information Agency and the Department of Energy’s Interruption
Cost Estimate (ICE) Calculator (for additional details, see footnotes in Table 8). The below results demonstrate that
the costs of a ~6 hour power outage to different U.S. states depends on where the outage occurs and may ranges from
~$100s of millions to ~$10 billion.

22
Figure 4. Costs of 6 hour outage (100% of customers) to different regions of the U.S. Note that Service Interruptions
disproportionately impact different types of electricity users. Impacts to Commercial and Industrial users are $1 to $10
billion whereas impacts to Residential users are ~$10 to $100 million.
Figure 5. Cost estimate for moderate event that causes a ~6 hour outage impacting ~6 million customers in different
regions of the country. Estimates derived using state-level data provided by the Energy Information Agency and the
Department of Energy’s Interruption Cost Estimate (ICE) Calculator (see Table 8).

23
3.3.2.b. More Extreme Event Scenario
We estimate that an extreme space weather event may cost U.S. consumers of electricity ~$1 billion to $20
billion. This reflects the costs of a ~9 hour blackout to an entire U.S. energy market during peak demand. Stakeholder
conversations helped inform our assumptions about how long the outage might last and how large of an area it might
affect. Although too early to incorporate insights from the currently ongoing U.S. SWAP extreme benchmark effort
[Love et al., 2016; Executive Office of the President, 2017], we discuss how insights from SWAP results will help
bridge some of the many knowledge gaps surrounding the geography of potential power outages caused by space
weather. Such information, as it becomes available, should be included in cost estimates to build a more robust
understanding that includes many of the important variables (e.g. geo-electric hazards, network typology, system
configuration, system load, time of day) necessary for developing more refined cost estimates.
Although more than one of the physical effects of space weather on the power grid could in theory cause an
outage during an extreme event, stakeholders note that the most probable outage scenario would be one driven by
reactive power consumption. This industry insight is important since different assumptions about what triggers the
outage are necessary to know what statements can be made regarding two first-order controls on potential costs: (1)
How long the outage might last and (2) how large of an area it may affect. Stakeholders all generally agreed that a
particularly extreme space weather storm, such as one analogous in size to the Carrington event, might quickly elevate
reactive power consumption to a level that, if not properly managed by grid operators, could trigger a cascading
outage. Although a cascading outage could potentially impact an entire U.S. electricity market, they noted that it is
very unlikely that it would be able to cross grid interconnections to impact neighboring markets. Specifically, grid
interconnections in the U.S. are typically separated by a set of direct DC tie lines and therefore are not synchronously
tied together with the AC transmission lines where the reactive power consumption effect would be occurring (this
may not be true in certain regions of the U.S. or in other countries). Stakeholders furthermore anticipate that the
envisioned outage might last at most ~9 hours. The duration of this Service Interruption is commensurate with other
recent examples of cascading outages that have impacted large areas (e.g. the Hydro-Quebec outage in 1989, the
Western North American outages in 1996, and the Northeast outage in 2003) but that have not involved significant
infrastructural damage. Although the last two of these outages were not caused by space weather, considering them
as analogous events is appropriate since they require similar recovery efforts and procedures and therefore share
similar outage durations. To translate these stakeholder insights on duration and scale into monetary terms, we
calculated the costs of a 9 hour outage across the different U.S. electricity markets using the national range for the
VOLL (Table 9). We found cost estimates that vary by over an order of magnitude. Estimated costs are lowest if the
extreme event impacts New England (~$1 billion to ~$3 billion) and highest if the event instead impacts the Southeast
(~$7 billion to ~$20 billion). As for our moderate event, we were unable to integrate into our analysis important but
not yet known information about the probability of space weather events causing outage in these different locations.
Our estimate therefore only reflects the consequences of an outage (impacts) in these different locations based on the
assumption that one occurs. Note that these numbers reflect an upper limit on our extreme scenario since we assume
that the event occurs during that market’s peak demand. Note that we were unable to use the ICE in this scenario
because electricity markets are not organized along discrete state boundaries, the fundamental unit of analysis for this
online tool (both methods are similar in that they use the VOLL methodology).

24
Although it is hard to predict where within the U.S. an extreme event may be most likely to cause an outage,
early results of an initial effort to systematically explore this hazard at the national scale have recently been published
[Love et al., 2016]. It is important to note, however, that the geo-electric hazard is only loosely related to the actual
GIC flow in the power system and is but one of the many other variables that needs to be known in order to rigorously
assess if an outage will occur and with what level of associated costs. Therefore our initial estimate should be revisited
and updated as more information is acquired.
Table 9. The upper limit on the potential cost of a nine hour power outage that cascades across all electric power
markets. The worst-case estimate assumes that the event causes a power outage that coincides with peak energy
demand in each of the electric power markets. Given that the highest geo-electric hazard associated with the 1-in-
100 year benchmark scenario occurs within MISO, we use the cost of the outage in MISO as our worst-case extreme
estimate.
Electric Power Market1 Peak Demand (MW)1 Cost of 9 hr outage2
California (CAISO) 50,000 ~$2-5 b
Midcontinent ISO (MISO) 127,125 ~$6-10 b
New England (ISO-NE) 28,130 ~$1-3 b
New York (NYISO) 33,956 ~$1- 3 b
Northwest 69,621 ~$3-6 b
PJM 165,492 ~$8-10 b
Southeast 170,000 ~$8-20 b
Southwest 42,000 ~$2-4 b
SPP 45,279 ~$2-4 b
Texas 69,621 ~$3-6 b
1Peak-demand for each Electric Power Market provided by FERC (https://www.ferc.gov/market-oversight/mkt-
electric/overview.asp) 2Costs of worst case outage calculated by multiplying peak demand by 9 hours (to estimate total MWh lost) and
using the national range for the VOLL of $5,000 to $10,000 per MWh).
3.4. Power References
Cannon, P., Angling, M., Barclay, L., Curry, C., Dyer, C., Edwards, R., et al., 2013. Extreme space weather: impacts
on engineered systems and infrastructure, UK Royal Academy of Engineering, London, ISBN 1-903496-95-0.
Forbes, K. F., and O. C. St. Cyr (2010), An anatomy of space weather’s electricity market impact: Case of the PJM
power grid and the performance of its 500 kV transformers, Space Weather, 8, S09004,
doi:10.1029/2009SW000498.
Forbes, K. F., and O. C. St. Cyr (2012), Did geomagnetic activity challenge electric power reliability
during solar cycle 23? Evidence from the PJM regional transmission organization in North America, Space
Weather, 10, S05001, doi:10.1029/2011SW000752.
Gaunt, C.T. and G. Coetzee. 2007. Transformer failures in regions incorrectly considered to have low GIC-risk. 2007
IEEE Lausanne Power Tech.
Kappenman, J. 2010. Geomagnetic Storms and Their Impacts on the U.S. Power Grid. Metatech Corporation.
London Economic International LLC, 2014, Estimating the Value of Lost Load: Briefing paper prepared for the
Electric Reliability Council of Texas, Inc.

25
Love, J. J., Pulkkinen, A., Bedrosian, P. A., Jonas, S., Kelbert, A., Rigler, E. J., Finn, C. A., Balch, C. C., Rutledge, R.,
Waggel, R. M., Sabata, A. T., Kozyra, J. U. & Black, C. E., 2016. Geoelectric hazard maps for the continental
United States, Geophys. Res. Lett., 43(18), 9415-9424, doi:10.1002/2016GL070469.
Oughton, E., J. Copic, A. Skelton, V. Kesaite, Z.Y. Yeo, S.J. Ruffle, M. Tuveson, A.W. Coburn, and D. Ralph. 2016.
Helios Solar Storm Scenario. Cambridge Risk Framework series. Centre for Risk Studies, University of
Cambridge.
Price, P. R. (2002), Geomagnetically induced current effects on transformers,
IEEE Trans. Power Delivery, 17, 1002–1008, doi:10.1109/TPWRD.2002.803710.
Pulkkinen, A., S. Lindahl, A. Viljanen, and R. Pirjola (2005), Geomagnetic storm of 29–31 October 2003:
Geomagnetically induced currents and their relation to problems in the Swedish high-voltage power
transmission system, Space Weather, 3, S08C03, doi:10.1029/2004SW000123.
Pulkkinen, A., Bernabeu, E., Thomson, A., Viljanen, A., Pirjola, R., Boteler, D., Eichner, J., Cilliers, P. J., Welling,
D., Savani, N. P., Weigel, R. S., Love, J. J., Balch, C., Ngwira, C. M., Crowley, G., Schultz, A., Kataoka,
R., Anderson, B., Fugate, D., Simpson, J. J. & MacAlester M., 2017. Geomagnetically induced currents:
Science, engineering and applications readiness, Space Weather, 15, doi:10.1002/2016SW001501.
Rezaei-Zare, A., and L. Marti, 2013. Generator thermal stress during a Geomagnetic Disturbance," 2013 IEEE Power
& Energy Society General Meeting, Vancouver, BC. pp. 1-5.
doi: 10.1109/PESMG.2013.6672072
Tay, H.C., and G. W. Swift, 1985. On the problem of transformer overheating due to geomagnetically induced
currents, IEEE Trans. Power Appar. Syst., PAS‐104(1), 212–219, doi:10.1109/TPAS.1985.318916.

26
4. Satellites
4.1 Impact Mechanisms
Enhanced radiation resulting from space weather events can affect satellites in different ways and vary in
response to many factors such as orbit, design, and age. Space weather induced increase in particulate radiation affects
satellites and can cause a range of anomalous satellite behaviors. Anomalies may result if charges gradually
accumulate and then suddenly discharge on either spacecraft surfaces (“surface charging”) or in some of their interior
components (“internal charging”) [Garrett, 1981; Baker et al., 1994; Fennell et al., 2001; Baker and Lanzerotti, 2016].
Anomalies may also result when single particles deposit charge near sensitive microelectronics. Examples of anomalous
satellite behaviors potentially attributable to space weather range in severity and can include software glitches such as
bit flips or phantom commands to partial or complete damage of critical hardware components such as those related to
power, navigation, and/or communication [Bedingfield et al., 1996; Lohmeyer et al., 2015; Baker and Lanzerotti, 2016].
In addition to satellite anomalies, which are acute in the sense that they tend to occur at the time of a space weather
event, enhanced levels of particulate radiation can also represent a chronic problem by increasing the cumulative dosage
of radiation received by a satellite. This can accelerate physical processes such as material embrittlement, displacement
damage (e.g. damage to lattice structure of satellite materials), and surface erosion that may prematurely age and shorten
the functional capacity and/or lifetime of satellites [Cannon et al., 2013; Baker and Lanzerotti, 2016]. Increases in
ultraviolet radiation can also affect satellites, by heating the atmosphere and increasing the ambient density of the
thermosphere. This is known to increase the drag force on satellites in Low Earth Orbits (LEO) (altitudes <~800km)
which may in turn accelerate altitude losses [Jacchia, 1963; Nwankwo et al., 2015]. Increases in other types of
electromagnetic radiation may lead to link disruptions, by interfering with the transmission and reception of the signals
used to send information to and from satellites. Impacts from link disruptions in turn depend on many specifics including
the criticality of the disrupted information and is considered in detailed in our GNSS user section.
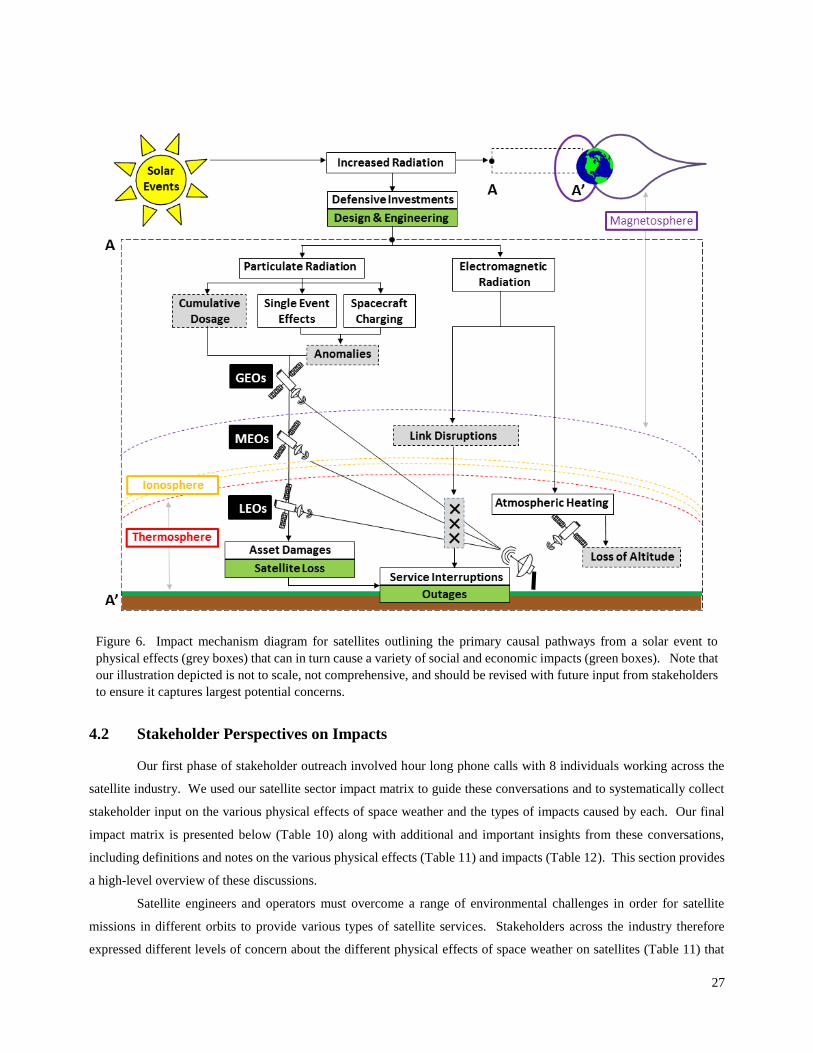
27
Figure 6. Impact mechanism diagram for satellites outlining the primary causal pathways from a solar event to
physical effects (grey boxes) that can in turn cause a variety of social and economic impacts (green boxes). Note that
our illustration depicted is not to scale, not comprehensive, and should be revised with future input from stakeholders
to ensure it captures largest potential concerns.
4.2 Stakeholder Perspectives on Impacts
Our first phase of stakeholder outreach involved hour long phone calls with 8 individuals working across the
satellite industry. We used our satellite sector impact matrix to guide these conversations and to systematically collect
stakeholder input on the various physical effects of space weather and the types of impacts caused by each. Our final
impact matrix is presented below (Table 10) along with additional and important insights from these conversations,
including definitions and notes on the various physical effects (Table 11) and impacts (Table 12). This section provides
a high-level overview of these discussions.
Satellite engineers and operators must overcome a range of environmental challenges in order for satellite
missions in different orbits to provide various types of satellite services. Stakeholders across the industry therefore
expressed different levels of concern about the different physical effects of space weather on satellites (Table 11) that
28
tended to reflect fundamental differences between satellite orbits [e.g. Geostationary Earth Orbit (GEO) vs. Medium
Earth Orbit (MEO) vs. Low Earth Orbit (LEO)] and missions [e.g. commercial communications, navigation, earth
observations, military surveillance, research & development, meteorology, scientific, civil/military communications].
For example, building communication satellites to operate in GEO and Global Navigation Satellite System (GNSS)
satellites to operate in MEO, where the radiation environment is relatively harsh, involves substantial Defensive
Investments such as hardened components, shielding, or extra generous design margins to protect the integrity of
satellites from high cumulative radiation dosages and from anomalous satellite behaviors that can be caused by surface-
and deep-dielectric charging. LEO engineers and operators explained that their assets are comparatively more shielded
by the atmosphere but nonetheless are concerned about radiation especially under more severe conditions when it
penetrates further into the atmosphere than normal. They also expressed an additional concern about an extreme space
weather event and the large number of LEO spacecraft that could potentially lose altitude from excessive atmospheric
heating. Specifically, the growing orbital population is approaching a level where one accidental collision could trigger
cascading collisions [e.g. “Kessler Syndrome” (Kessler et al., 2010)] to potentially devastate many critical societal
services such as earth observations and meteorology.
Although stakeholders emphasized that space weather impacts will be customer and mission dependent,
stakeholders tended to agree that the largest impact category is Defensive Investments due to the very high costs of
satellites and high value of their services. Satellite manufactures also noted that they tend to combine information from
standard industry models and their own experiences when making many different decisions about design and
engineering. They also noted that spare satellites add redundancy that may be inexpensive if the spare is a
decommissioned satellite with some remaining capacity or costly if the spare is a new satellite. Stakeholders
knowledgeable about satellite operations described different Mitigating Actions. Certain operators reported having
procedures in place for space weather events, however, noted that such actions are infrequently enacted since the
probability of any particular event impacting a satellite is considered low and the costs and risks of such procedures are
too high (e.g. losses of revenue or potential problems recovering satellites once switched into safe mode). The preferred
option at present is to instead observe what happens during an event and respond accordingly. Although not publically
reported, this may involve non-routine operations and additional workload. Stakeholders noted that this represents an
insignificant expense under normal conditions since companies have trained personnel on hand for such instances which
can also result from other, non-space weather related issues (e.g. manufacturing glitches, terrestrial weather). Despite
these concerns, most industry stakeholders emphasized that the satellite population is rather robust and that the challenges
posed by space weather events are manageable, with some operational inconveniences but without any impacts to the
end users of satellite services. Although the possibility of an event leading to Asset Damages and Service Interruptions
is highly unlikely from their perspective, they noted that it cannot be ruled out and would furthermore be devastating if
it occurred.

29
Table 10. Impact matrix populated during stakeholder outreach to better understand how the known physical effects of space weather on satellites can
cause different types of impacts. Items in the matrix reflect example impacts and we tried to capture stakeholder thoughts on differences between impacts
that might occur during moderate (normal text) compared to more extreme (italic text) space weather conditions. Question marks denote instances where
the physical effect may in theory be able to cause this impact but empirical support is lacking. *Additional details pertaining to a select set of these
impacts can be found in Table 12.
Physical Effects
Impact Categories
Defensive
Investments Mitigating Actions Asset Damage Service Interruptions Health Effects
Loss of Altitude
(LEO only)
• Design &
Engineering*
• Situational awareness
• Insurance
• Spares*
• Unplanned
operations*
• Fire thrusters
• Accelerated aging*
• Asset loss?*
• Quality degradation*
• Outages?*
Link Disruptions
• Design &
Engineering*
• Situational awareness
• Diversification
• Unplanned operations*
• Schedule changes
• Quality degradation*
• Outages?*
Anomalies
• Insurance
• Design &
Engineering*
• Situational awareness
• Environmental
testing
• Spares*
• Diversification
• Anomaly
investigations*
• Safe mode
• Accelerated aging*
• Asset loss*
• Quality degradation*
• Outages?*
Cumulative Dosage
• Design &
Engineering*
• Situation awareness
• Environmental
testing
• Accelerated Aging*
• Asset loss?*
• Quality degradation*
• Outages?*

30
Table 11. Space weather can cause a variety of physical effects to satellites. These physical effects, defined below,
are relatively well-studied in the scientific and engineering literature. These physical effects were discussed with
industry stakeholders in order to better understand their potential for causing different types of impacts. These
physical effects are connected to impacts in Table 10, with details on impacts provided in Table 12.
Physical Effect Definition Notes from Stakeholder Outreach
Cumulative
Dosage
Total amount of
ionizing or non-ionizing
radiation that a satellite
is exposed to over its
lifetime.
• Very dependent on mission profile, standards are relaxed for LEOs and highest for
MEOs and GEOs.
• Physical effect is a natural and accepted process within the industry that causes slow and steady wear and tear. Conservatively accounted for with engineering and design.
• Over engineering (x2-3 margin is typical) is costly but less costly than trying to
perfectly design a satellite (lifetime ends with planned mission) or losing one early.
• Experience suggests that solar minimum may be more damaging to satellites since strong solar activity shields them from really damaging heavy ions in cosmic rays.
• Increasing usage of Commercial Off-the-Shelf Technologies with lower cumulative
dosage specifications currently represents an unknown risk since satellites using these
parts have not been tested in recent years by space weather.
• Degrade all components on the satellite, including payload and bus.
Anomalies Any malfunction in the
normal, anticipated
behavior of a satellite or
satellite sub-system (e.g.
power, attitude,
stability, orientation)
that is not readily
explainable.
• A range of malfunctions are possible and require increased workload for operators to troubleshoot and restore nominal operations. Anomalies are rarely severe enough to
impact the provision of satellite services and can be non-space weather related.
• A large portion of anomalies are recurring, novel ones are more resource intensive
and resolving them can carry significant expense.
• Some designs are more susceptible than others and resolving anomalies requires contingency procedures that have operational costs.
• Only anomalies that decrease the capability of the satellite are key concern.
• Impact depends on technology satellite utilizes, its function, and how event impacts
that specific technology (e.g. momentum wheels, star trackers, etc.).
Link
Disruptions
Any degradation or
interruption in the
propagation or reception
of signals used to
transmit information to
or from a satellite.
• Reliability of a particular satellite linkage is more often diminished due to a variety
of non-space weather reasons (e.g. rain, weather).
• Probability of occurring depends on what bands are being used to send/receive signals and how space whether affects these bands. Satellites use different signal frequencies
for Telemetry, Tracking, and Control (TT&C) and for providing services.
• Costs escalate quickly in order to attain high levels of reliability and therefore depend
on value of service to end user and also their budget.
• For commercial satellites that have to send and receive signals 24/7 so any interruption in the signal (even one minute) is problematic. Time is money and costs
scale non-linearly with the length of time a signal problem lasts.
• Of large concern to satellite operators because they can directly impact revenues.
Loss of Altitude Lowering of satellite
velocity and in turn
altitude, due to
increased atmospheric
drag.
• Normal process that space weather can simply accelerate.
• Loss of altitude due to increase in drag force relevant for LEO satellites only. Small
losses (~10s-100s m) only trigger action if they introduce collision hazards but larger losses (~1-10s km) may trigger repositioning. Events where thrusters have to be
fired are of special concern since it depletes fuel and fuel ends up being key constraint
on mission lifetime. • Effect may become more problematic as airspace becomes more crowded: One
collision initiated by space weather could trigger cascading collisions (e.g. “Kessler
Syndrome”).

31
Table 12. Additional details on a select set of space weather impacts in our impact matrix (Table 10) identified during
stakeholder outreach.
Impact
Category Examples Definition Notes from Stakeholder Outreach
Defensive
Investments
Design and
engineering
A range of engineering
solutions that protect against space weather impacts such as
component redundancies,
physical shielding, radiation hardening, factors of safety,
groundings/coatings, error
detection/correction software, and end of lifetime designs.
Many decisions that all vary with satellite mission profile (e.g. orbit,
performance, lifetime) and differ between manufacturers and customer. Engineers start at end of mission lifetime and work backwards, building
in margins that are ~10-50% at the end of life. Can include spare capacity and cold vs. hot redundant systems.
Diversity also helps: dissimilar units can provide a replacement capability when the other fails (e.g. Telecommand using different
frequency receivers).
Spares
Operators may have extra
satellites to replace satellites
that are temporarily inoperable or permanently lost. Note that
onboard spare capacity (e.g.
redundant units) is part of Design & Engineering.
Spares can be in space (“on-orbit”) and simply moved into necessary
slot or stored on the ground and can be launched. On-orbit spares can be new or old, decommissioned satellites that still
function. More typical for satellites that belong to constellations (e.g. LEOs and MEOs) but GEO spares may also be invested in.
New spares, either on-orbit on the ground, are big economic
investments.
Mitigating
Actions
Unplanned
operations
Any unplanned operational
procedure that results in non-nominal operations. Example
may be recalibrating orientation
equipment or firing thrusters to regain lost altitude or velocity.
Maintenance to bring sub-systems back into range. Operators report no or rare incidences when they have had to fire
thrusters but a concerning event would be one that consumes a significant % of fuel reserve.
Operations that consume fuel (e.g. fire thrusters) are biggest deal as fuel
is key constraint on mission lifetime.
Anomaly investigations
Assessment conducted after any anomalous satellite behavior is
observed to understand likely
cause and potential solutions. Note that most anomalies are
not related to space weather but
rate of anomalies is known to increase during events.
Diagnosing the origin of an anomaly is important because the concern
is that an anomaly could (but often does not) decrease capability.
Minor investigations can require couple of hours to days and be done
by one person. Major investigations can require weeks to years and
may require a team of people that have to consult with manufactures, troubleshoot extensively, and run many computational simulations.
Societal implications are potentially large. Need quick diagnosis if
anomaly cause is from space weather or humans (e.g. terrorists).
Asset
Damages
Accelerated
aging
Any reduction in the capacity of
satellite sub-systems (e.g.
power, power storage,
transponders) that is faster than anticipated and could shorten
the lifetime of a satellite.
A 4-5% reduction in capacity of satellite sub-systems is assumed and
planned for. Power systems often have higher margins, ~10-20%.
Accelerated aging is only problematic if it reduces satellite lifetime or
causes prime unit failures.
Ionizing vs. non-ionizing radiation causes different type of aging
effects.
Asset Loss
Permanent discontinuation of a
satellite’s functionality that can
occur either before or after it has exceeded its planned
mission lifetime.
If lost after planned lifetime, the loss in functionality and revenue is
unfortunate but the satellite has already exceeded planned life.
If lost before planned lifetime, economic loss can be devastating since
service revenue has not yet paid for invested costs. Stakeholders note that satellites are rarely lost prematurely and usually last longer than
mission lifetime.
Service
Interruptions
Quality
degradation
Any reduction in the quality of satellite services provided
including noisy data, bad
images, and dropped calls.
Impact depends on many end user specifics.
Although they would be biggest for those dependent on immediate,
accurate, and continuous provision of satellite services, such users tend to have bigger budgets and invest more in quality assurance.
Outages Temporary or permanent loss of satellite services.
Impact depends on many end user specifics. Impact highest for those
relying on capabilities for primary rather than backup services.
When an LEO satellite malfunctions, service disruptions will be
intermittent and global. When a GEO satellite malfunctions, service disruption will be continuous and localized to the satellite footprint.
Service options. End users may not be impacted because they could
change service providers or service provides multiple satellites. Most
likely to impact smaller businesses.
Can be triggered by false commands from space weather. Could result
if a critical satellite is permanently lost. Critical satellites tend to be
those in GEO that are expensive and unique.
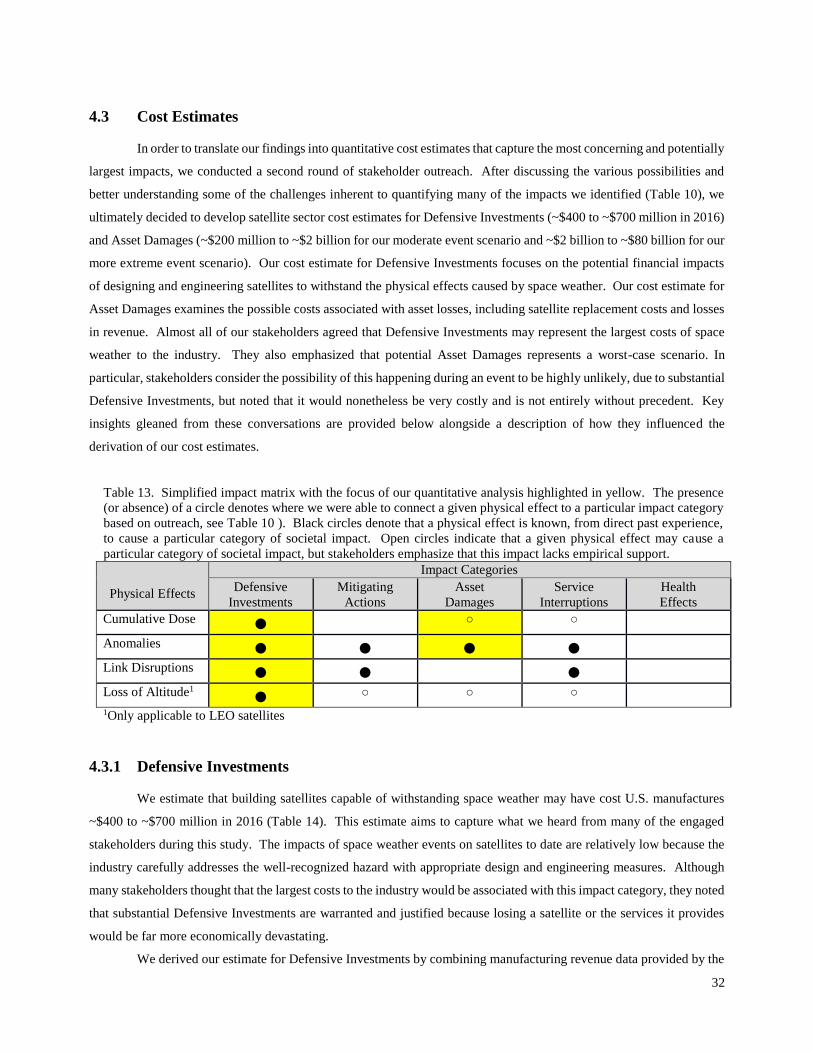
32
4.3 Cost Estimates
In order to translate our findings into quantitative cost estimates that capture the most concerning and potentially
largest impacts, we conducted a second round of stakeholder outreach. After discussing the various possibilities and
better understanding some of the challenges inherent to quantifying many of the impacts we identified (Table 10), we
ultimately decided to develop satellite sector cost estimates for Defensive Investments (~$400 to ~$700 million in 2016)
and Asset Damages (~$200 million to ~$2 billion for our moderate event scenario and ~$2 billion to ~$80 billion for our
more extreme event scenario). Our cost estimate for Defensive Investments focuses on the potential financial impacts
of designing and engineering satellites to withstand the physical effects caused by space weather. Our cost estimate for
Asset Damages examines the possible costs associated with asset losses, including satellite replacement costs and losses
in revenue. Almost all of our stakeholders agreed that Defensive Investments may represent the largest costs of space
weather to the industry. They also emphasized that potential Asset Damages represents a worst-case scenario. In
particular, stakeholders consider the possibility of this happening during an event to be highly unlikely, due to substantial
Defensive Investments, but noted that it would nonetheless be very costly and is not entirely without precedent. Key
insights gleaned from these conversations are provided below alongside a description of how they influenced the
derivation of our cost estimates.
Table 13. Simplified impact matrix with the focus of our quantitative analysis highlighted in yellow. The presence
(or absence) of a circle denotes where we were able to connect a given physical effect to a particular impact category
based on outreach, see Table 10 ). Black circles denote that a physical effect is known, from direct past experience,
to cause a particular category of societal impact. Open circles indicate that a given physical effect may cause a
particular category of societal impact, but stakeholders emphasize that this impact lacks empirical support.
Physical Effects
Impact Categories
Defensive
Investments
Mitigating
Actions
Asset
Damages
Service
Interruptions
Health
Effects
Cumulative Dose ● ○ ○
Anomalies ● ● ● ●
Link Disruptions ● ● ●
Loss of Altitude1 ● ○ ○ ○
1Only applicable to LEO satellites
4.3.1 Defensive Investments
We estimate that building satellites capable of withstanding space weather may have cost U.S. manufactures
~$400 to ~$700 million in 2016 (Table 14). This estimate aims to capture what we heard from many of the engaged
stakeholders during this study. The impacts of space weather events on satellites to date are relatively low because the
industry carefully addresses the well-recognized hazard with appropriate design and engineering measures. Although
many stakeholders thought that the largest costs to the industry would be associated with this impact category, they noted
that substantial Defensive Investments are warranted and justified because losing a satellite or the services it provides
would be far more economically devastating.
We derived our estimate for Defensive Investments by combining manufacturing revenue data provided by the

33
Satellite Industry Association [SIA, 2017] with stakeholder best judgement on the proportion of satellite manufacturing
costs that may be attributable to defense from space weather. Although many specific satellite details on both topics
represent well-kept trade secrets, stakeholders were able to offer general but important insights on the manufacturing
process and its related costs. They discussed, for example, the complexity of various design and engineering decisions
and the considerable variation between mission types (e.g. orbital regime and planned lifetime), manufacturers (e.g.
experience and business strategy), and customers (e.g. service requirements, budget and risk aversion). For the best
financial data, they pointed us to publically available information that is collected, aggregated, and reported annually by
the Satellite Industry Association (SIA). According to the most recent SIA report [SIA, 2017], manufacturing revenues
from satellites launched in 2016 totaled ~$13.9 billion globally. Global revenue is further broken down in the report by
mission type, allowing us to calculate how much was spent on different types of satellite missions in 2016 (Table 14).
Since stakeholders were unable to discuss specific design and engineering details, we instead probed for
estimates of how much space weather might add to the manufacturing costs of a satellite. Stakeholders had a hard time
answering this question despite finding it relatively easy to list many examples of Defensive Investments and knowing
that each involved significant expenses (for details, see Table 12). One stakeholder, for example, noted that a radiation
hardened component may cost orders of magnitude more than an analogous, non-radiation hardened component.
However another noted that the physical parts of a satellite represent a very small percentage of a satellite’s total cost:
The majority of a satellite’s costs is instead attributable to the painstaking design, engineering, and testing efforts (e.g.
environmental simulations, space qualifying, performance testing and reviews etc.) that goes into ensuring that it will
reliably operate and provide the planned services in the harsh space environment throughout its planned mission lifetime.
Although hard to quantify what percentage of this total effort might be attributable specifically to space weather, a few
stakeholders independently provided similar estimates that it might represent somewhere between ~1% and ~10% of a
satellite’s manufacturing costs. These individuals further noted that the lower end of this range (~1-5%) would apply to
satellites with recurring engineering (RE) while the higher end (~6-10%) to those with non-recurring engineering (NRE)
due to one-time production costs (e.g. research, development, design, and testing)1. To estimate how much might have
been spent across the global satellite industry in 2016, we multiplied our previously derived manufacturing revenues
[SIA, 2017] by these percentages based on whether a mission type typically involves RE or NRE (Table 14). Global
revenues associated with the manufacturing of satellites for military surveillance, for example, were $6.1 billion in 2016.
Since these satellites typically entail NRE, Defensive Investments were estimated to be 6 percent to 10 percent of total
revenues, or ~$400 million to ~$600 million. Similar computations were performed for each mission type, yielding an
estimated Defensive Investment cost of ~$600 million to ~$1 billion globally in 2016. U.S. firms account for 64 percent
of the market globally (for all mission types), so the Defensive Investment cost for the U.S. was estimated to range from
~$400 million to ~$700 million in 2016 (64 percent of the global cost) (Table 14). Note that the aggregated data provided
by the SIA [2017] does not allow us to provide a more granular cost estimate (broken down by mission type) of U.S.
Defensive Investments.
1 Recurring Engineering (RE) refers to an engineering effort that has been previously researched, tested, and
successfully implemented. Non-Recurring Engineering (NRE) refers to the novel engineering effort required to bring
a new product or innovation to market and therefore tends to be more costly.
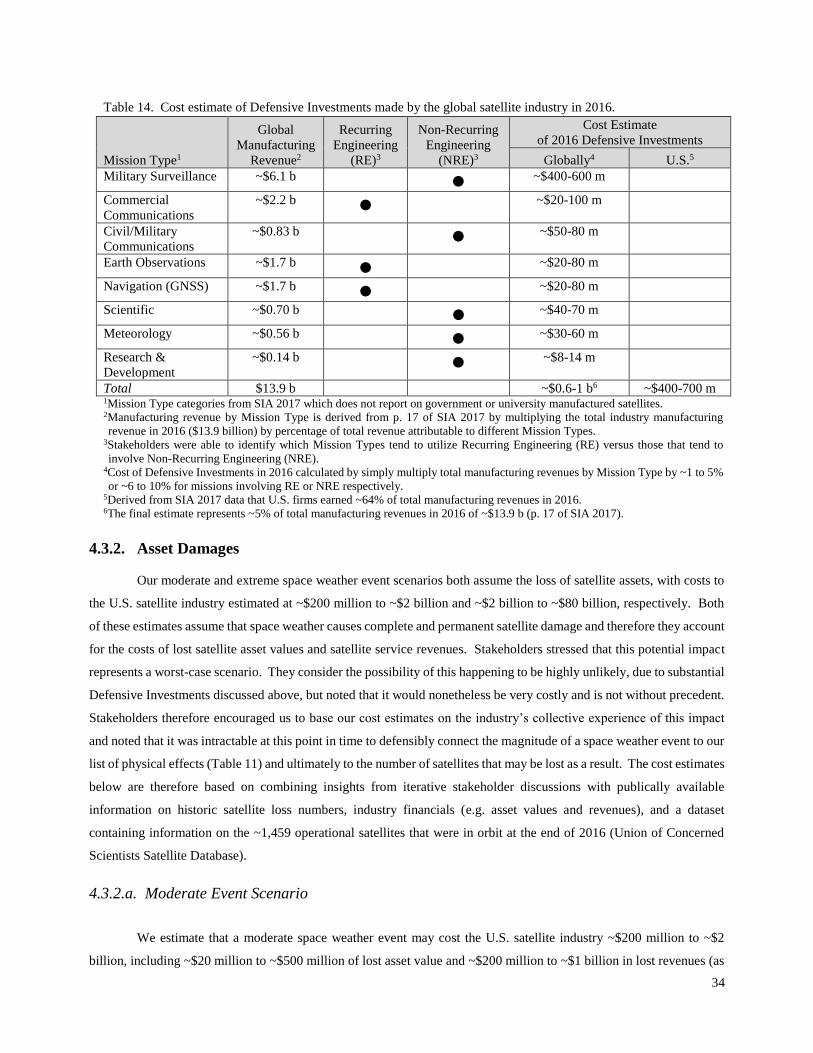
34
Table 14. Cost estimate of Defensive Investments made by the global satellite industry in 2016.
Mission Type1
Global
Manufacturing
Revenue2
Recurring
Engineering
(RE)3
Non-Recurring
Engineering
(NRE)3
Cost Estimate
of 2016 Defensive Investments
Globally4 U.S.5
Military Surveillance ~$6.1 b ● ~$400-600 m
Commercial
Communications
~$2.2 b ● ~$20-100 m
Civil/Military
Communications
~$0.83 b ● ~$50-80 m
Earth Observations ~$1.7 b ● ~$20-80 m
Navigation (GNSS) ~$1.7 b ● ~$20-80 m
Scientific ~$0.70 b ● ~$40-70 m
Meteorology ~$0.56 b ● ~$30-60 m
Research &
Development
~$0.14 b ● ~$8-14 m
Total $13.9 b ~$0.6-1 b6 ~$400-700 m 1Mission Type categories from SIA 2017 which does not report on government or university manufactured satellites. 2Manufacturing revenue by Mission Type is derived from p. 17 of SIA 2017 by multiplying the total industry manufacturing
revenue in 2016 ($13.9 billion) by percentage of total revenue attributable to different Mission Types. 3Stakeholders were able to identify which Mission Types tend to utilize Recurring Engineering (RE) versus those that tend to
involve Non-Recurring Engineering (NRE). 4Cost of Defensive Investments in 2016 calculated by simply multiply total manufacturing revenues by Mission Type by ~1 to 5%
or ~6 to 10% for missions involving RE or NRE respectively. 5Derived from SIA 2017 data that U.S. firms earned ~64% of total manufacturing revenues in 2016.
6The final estimate represents ~5% of total manufacturing revenues in 2016 of ~$13.9 b (p. 17 of SIA 2017).
4.3.2. Asset Damages
Our moderate and extreme space weather event scenarios both assume the loss of satellite assets, with costs to
the U.S. satellite industry estimated at ~$200 million to ~$2 billion and ~$2 billion to ~$80 billion, respectively. Both
of these estimates assume that space weather causes complete and permanent satellite damage and therefore they account
for the costs of lost satellite asset values and satellite service revenues. Stakeholders stressed that this potential impact
represents a worst-case scenario. They consider the possibility of this happening to be highly unlikely, due to substantial
Defensive Investments discussed above, but noted that it would nonetheless be very costly and is not without precedent.
Stakeholders therefore encouraged us to base our cost estimates on the industry’s collective experience of this impact
and noted that it was intractable at this point in time to defensibly connect the magnitude of a space weather event to our
list of physical effects (Table 11) and ultimately to the number of satellites that may be lost as a result. The cost estimates
below are therefore based on combining insights from iterative stakeholder discussions with publically available
information on historic satellite loss numbers, industry financials (e.g. asset values and revenues), and a dataset
containing information on the ~1,459 operational satellites that were in orbit at the end of 2016 (Union of Concerned
Scientists Satellite Database).
4.3.2.a. Moderate Event Scenario
We estimate that a moderate space weather event may cost the U.S. satellite industry ~$200 million to ~$2
billion, including ~$20 million to ~$500 million of lost asset value and ~$200 million to ~$1 billion in lost revenues (as

35
discussed in our approach, all numbers are rounded to one significant figure). In order to construct this estimate,
stakeholders encouraged us to start by reviewing the industry’s collective experience of this impact (Table 15). In the
last ~20 years, there have been a handful of complete and permanent satellite losses from space weather with only one
loss observed during any specific event (Table 15) [Cannon et al., 2013]. Our moderate event scenario therefore begins
by assuming the loss of one satellite. Although this reflects industry’s experience to date, one stakeholder further
emphasized that this historic loss record is actually quite ambiguous since attributing an observed satellite loss to space
weather is not straightforward. In certain cases, for example, subsequent investigations have concluded that at least one
of these losses was not from space weather (e.g. Bodeau, 2007). A different stakeholder also noted that insurance
companies typically cover space weather related losses in their standard packages, further supporting the low-probability
nature of this impact.
Table 15. Historic examples of complete and permanent Asset Damages caused by space weather.
Event Date1
(Event Name) Satellite1 Orbit1 Cause1 Satellite Type Launch date2 Age at Loss
(yr)3
01/11/97 Telstar 401 GEO Anomaly Commercial
Communications 12/16/93 4
05/19/98 Galaxy IV GEO Anomaly4 Commercial
Communications 06/24/93 5
07/15/00
(Bastille Day)
Astro-D
(ASCA) LEO
Loss of
Altitude Scientific 02/20/93 8
10/24/03
(Halloween Storm)
MIDORI 2
(ADEOS) LEO Anomaly Scientific 12/14/02 7
01/14/05 Intelsat 804 GEO Anomaly Commercial
Communications 12/22/97 8
1Information reported by Cannon et al. 2013 2Information from http://space.skyrocket.de/ 3Derived by comparing event/loss date with launch date. 4Note that further investigations by Bodeau 2007 suggests that this loss was not attributable to space weather.
In order to quantify the total financial impact of this lost satellite, we assume the loss of one U.S. satellite and
examine the potential loss of its value. As discussed previously, satellite financial data is proprietary information. Our
stakeholders could only generally discuss satellite asset values by explaining, for example, that costs vary widely
depending on the mission profile, manufacturer, and customer. To solicit more specific information, we asked
stakeholder if they could at least provide their best guess on the asset values for different satellite missions. A few were
willing to offer rough estimates but expressed many hesitations given the wide ranges and large uncertainties (Table 16).
Therefore we also derived an independent estimate for typical asset values of different satellite missions by combining
aggregated financial data on satellite manufacturing with satellite launch numbers (both provided in SIA [2017] with
methodology details provided in Table 16 footnotes). Consistent with stakeholder sentiments, we derived a wide range
of asset values. Research and Development missions are on the lower end of the spectrum, with costs that may be ~$20
million per satellite, and Military Surveillance missions are on the upper end with costs that may be ~$500 million per
satellite. Although we use these derived values in our analysis, future efforts may want to focus on clarifying these
uncertainties. Since it is not possible to know in advance of the event which satellite type will be the one that will be
lost, we simply assume this lost satellite might cost anywhere between ~$20 million and $500 million. Note that

36
individual satellites lost in historical, moderate space weather events have been either a commercial communication
satellite (estimated here at ~$100 million per satellite) or a scientific satellite (estimated here at ~$200 million per
satellite) (Table 16).
In addition to the costs of this lost asset, additional impacts may result from the loss of this satellite’s services.
Many types of satellite missions provide valuable societal services that are not straightforward to quantify (e.g. military
surveillance, meteorology, navigation). We therefore assume that the lost satellite was generating revenue (e.g.
commercial satellites). In order to estimate how much revenue the satellite may have been generating, we combined
aggregated industry data on satellite service revenues with information from the Union of Concern Science’s (UCS)
database on operational satellites. At the end of 2016, there were 1,459 operating satellites in orbit (UCS database) that
globally generated a total of $260.5 billion in satellite services revenue [SIA, 2017]. This suggests that the average
service revenue generated by an average satellite in 2016 was ~$200 million/satellite per year (=$260.5 billion/1,459
satellites). We derived a similar value of ~$200 million/satellite per year by noting that 594 of these 1,459 operational
satellite were U.S. assets (UCS database) that collectively generated ~$110.3 billion in revenue in 2016 [SIA, 2017]
(=$110.3 billion/594 satellites). Note that this reflects a conservative value for the services provided by each satellite
since it does not account for any non-market, societal benefits generated by satellites. In order to assess how many years
of revenue may be lost as a result of the event, we returned to the historical loss record (Table 15). Stakeholders noted
that Scientific Satellites do not generate “revenue” for their owners and have large ranges in planned lifetimes whereas
Commercial Communication satellites do generate revenue and typically have planned mission lifetimes that are ~10
years. Based on publically available information (for details, see footnotes in Table 15), we were able to estimate that
the two Commercial Communication satellites that may have been lost due to space weather, Telstar 401 in 1997 and
Intelsat 804 in 2005, were ~4 and ~8 years old when lost (Table 15). These historic events therefore resulted in ~6 and
~2 years of lost revenue for each satellite owner respectively. Combining ~2 to 6 years of lost revenue with our previous
estimate of the amount of revenue the satellite may have been generating (~$200 million/year) suggests a financial impact
that may be ~$200 million to ~$1 billion. Note that this loss only applies if the lost asset in this scenario fails prior to
the end of its planned life. Loss of revenue from any satellites that have already exceeded their planned lifetimes would
be unfortunate but not devastating.

37
Table 16. Typical costs of different types of satellite assets vary my mission type.
Mission Type1
Typical Asset Values (per satellite)
Stakeholder
Estimate2
Derived Estimate3
Manufacturing
Revenue4
2016 Launches
(% of total)5
Final Derived
Estimate3
Earth Observations $300,000 ~$1.7 b 64 (51%) $30 m
Commercial Communications $200-250 m ~$2.2 b 20 (16%) $100 m
Navigation (GNSS) $200 m ~$1.7 b 13 (10%) $100 m
Military Surveillance $1-2 b ~$6.1 b 13 (10%) $500 m
Research & Development $10-20 m ~$0.14 b 8 (6%) $20 m
Meteorology $150 m ~$0.56 b 4 (3%) $100 m
Scientific $500-750 m ~$0.70 b 4 (3%) $200 m
Civil/Military
Communications $200-250 m ~$0.83 b 2 (2%) $400 m
Total $13.9 b 126 (100%) ~$20-500 m 1Mission Type list consistent with SIA annual reports (e.g. SIA 2017). 2Stakeholders were able to provide rough estimates of typical asset values for different Mission Types but noted wide ranges
and large uncertainties. 3Given uncertainties surrounding stakeholder estimates, we derived an independent estimate of typical asset values using
industry data provided in SIA 2017. 4For additional details, see Table 14 5Lauch numbers derived from p. 7 of SIA 2017, by multiplying percentages by 126 total launches. 6Derived estimate divides reported manufacturing revenues by number of satellites launched for all Mission Types in 2016.
4.3.2.b. More Extreme Event Scenario
We estimate that a more extreme event may cost the U.S. satellite industry ~$2 billion to ~$80 billion,
accounting for both lost asset values and potential losses in satellite revenue. Our extreme scenario follows the
methodology outlined for our moderate scenario and the only difference is in the assumed number of satellite losses. In
discussing with industry stakeholders the potential number of satellites that could be lost in an extreme event, for which
we have no historical experience, most noted that this is very uncertain but nonetheless expect the total number to be
small. Our extreme scenario therefore assumes the loss of 10 to 100 satellites globally, representing one to two orders
of magnitude more asset losses than assumed in our moderate event scenario. Note that this level of loss is unprecedented
to date and would represent ~0.7-7% of all currently operational satellites (1,459 satellites as of the end of 2016). We
calculate the value of these lost satellite assets at ~$200 million to ~$50 billion (= 10-100 satellites x ~$20-500 million
per satellite) and the value of their lost service revenues at ~$4 billion to ~$120 billion (= 10-100 satellites x ~$200
million per satellite per year x 2-6 years). Summing together these estimates suggests a total, global economic impact
of ~$4 billion to ~$200 billion. As previously discussed, 594 of the 1,459 satellites (~40%) globally are currently
owned/operated by the U.S. so we assume this portion of our global costs impacts the U.S. for a final estimate of ~$2
billion to ~$80 billion.
4.4 Satellite References
Baker, D.N., S. Kanekal, J. B. Blake, B. Klecker, and G. Rostoker. 1994. Satellite anomalies linked to electron
increase in the magnetosphere. Eos. Volume 75, Issue 35. Page 401-405.

38
Baker, D.N. and L.J. Lanzerotti. 2016. Resource Letter SW1: Space Weather. American Journal of Physics. Vol.
84, No. 3.
Bedingfield, K.L., R.D. Leach, and M.B. Alexander. 1996. Spacecraft System Failures and Anomalies Attributed to
the Natural Space Environment. NASA Reference Publication 1390.
Bodeau, M. Killer electrons from the angry Sun did not stop the pagers. Space Weather. Vol.5, S03006m 2007.
doi:10.1029/2006SW000266
Fennell, J. F., H. C. Koons, J. L. Roeder, and J. B. Blake (2001), Spacecraft Charging: Observations and Relationship
to Satellite Anomalies, in Proceedings of 7th Spacecraft Charging Technology Conference, 476, pp. 279–285,
European Space Agency, Noordwijk, Netherlands.
Garrett, Henry Berry. 1981. The charging of spacecraft surfaces. Reviews of Geophysics. Volume 19, Issue 4. Page
577-616
Jacchia, L. G. (1964), Influence of solar activity on the Earth’s upper atmosphere, Planet. Space Sci., 12, 355–378,
doi:10.1016/0032-0633(64)
90032-7.
Kessler, D.J., N.L. Johnson, J.-C. Liou, and M. Matney. 2010. The Kessler Syndrome: Implications to Future Space
Operations. American Astronautical Society: 33rd Annual AAS Guidance and Control Conference. 6-10
February 2010
Lohmeyer, Whitney, Ashley Carlton, Frankie Wong, Michael Bodeau, Andrew Kennedy, and Kerri Cahoy. 2015.
Response of geostationary communications satellite solid-state power amplifiers to high-energy electron
fluence. Space Weather. Volume 13, Issue 5. Page 298-315.
Nwankwo, Victor U.J., Sandip K. Chakrabarti, and Robert S. Weigel. 2015. Effects of plasma drag on low Earth
orbiting satellites due to solar forcing induced perturbations and heating. Advances in Space Research.
Volume 56, Issue 1. Pages 47-56.

39
5. Global Navigation Satellite Systems (GNSS) Users
5.1 Impact Mechanisms
A space weather event can potentially impact GNSS users by either directly affecting GNSS satellites and/or
by interfering with the transmission of the broadcasted GNSS signal. This section focuses on potential impacts resulting
from how space weather is known to physically affect the transmission of GNSS signals (For more information about
potential impacts to satellites, please see previous section (Satellites) of this report). GNSS signals are sent from GNSS
satellites via low power radio waves to different GNSS receivers and end users around the globe. These radio waves
must transit the ionosphere, a region of our Earth’s upper atmosphere (extending from ~70 to 1000 km above sea level)
comprised of enough ionized molecules and free electrons to significantly alter their propagation [Hernández-Pajares et
al., 2011]. The nature and extent of this alteration depends largely on the number of electrons encountered by these
radio waves. This varies dramatically under background or non-space weather conditions, since electron density in the
ionosphere varies spatially (e.g. vertically and horizontally, small- and large-scale variations) and temporally (e.g. solar
cycle variations (~11 years), seasonal changes, dawn/dusk instabilities, rolling disturbances) [for an overview, see
Hernández-Pajares et al., 2011 and references therein]. Space weather events can cause additional variations to the
electron density of the ionosphere and therefore alterations to the propagation of GNSS signals, introducing additional
complexities that are not yet fully understood but are known to affect GNSS users in at least two ways [e.g. Kintner et
al., 2007; Tsurutani et al., 2009; Cannon et al., 2013; Baker and Lanzerotti, 2016]. First, when space weather events
sufficiently disturb the ionosphere from background (modeled) conditions, unaccounted for changes in the propagation
speed of the GNSS signal can lead to ranging errors. Second, they can modify signal-to-noise ratios, preventing GNSS
users from tracking or “locking” onto GNSS satellites. This can degrade or even prevent GNSS signal reception (e.g.
Loss of lock). For example, small-scale variations in electron densities (ionospheric scintillations) are known to cause
significant variations in both the phase and amplitude of GNSS signals [e.g. Kintner et. al., 2007]. Enhanced levels of
solar radio noise emitted by solar flares can also overwhelm the GNSS signal, by increasing the total amount of noise in
the system to also result in loss of lock [Cerruti et al., 2006; Cerruti et al., 2008; Tsurutani et al., 2009]. The physical
effects can impact different GNSS users in different ways, depending on their utilization and reliance on the Positioning,
Navigation, and Timing (PNT) information provided by GNSS satellites.

40
Figure 7. Impact mechanism diagram for GNSS users outlining the primary causal pathways from a solar event to
physical effects (grey boxes) that can in turn cause a variety of social and economic impacts (green boxes). Note that
our illustration depicted is not to scale, not comprehensive, and should be revised with future input from stakeholders
to ensure it captures largest potential concerns.
5.2 Stakeholder Perspectives on Impacts
Our first phase of stakeholder outreach involved hour long phone calls with four individuals with expertise on
space weather and GNSS. We used our impact matrix to guide these conversations and to systematically collect input
on the known physical effects of space weather on the GNSS signal and the types of end user impacts that each may
cause. Our final impact matrix is presented below (Table 17) along with additional and important insights from these
conversations, including definitions and notes on the various physical effects (Table 18) and impacts (Table 19). The
remainder of this section provides a high-level overview of what we learned from these stakeholder discussions.
Of the two known physical effects (Table 18), the stakeholders we spoke to all agreed that loss of lock is more
concerning than ranging errors. “Lock” means that a GNSS receiver has an established connection with a GNSS satellite
and can therefore acquire its Position Navigation, and Timing (PNT) information. Loss of lock therefore describes a
situation where the GNSS user is not receiving a usable GNSS signal from a GNSS satellite. Stakeholders emphasized
that the likelihood of this physical effect occurring varies dramatically from receiver-to-receiver, depending on many

41
internal (e.g. design) and external (e.g. geography, time of day) specifics. The possibility that it will ultimately lead to
an actual GNSS outage for the user also depends on which PNT service the end user needs. A GNSS receiver needs to
be locked onto at least four satellites for positioning and/or navigation information but only one for timing. Stakeholders
also noted that overall susceptibilities to this effect may or may not be in process of decreasing due to the increasing
number of operational (e.g. the U.S.’s Global Positioning System and Russia’s GLONASS) and planned (e.g. the E.U.’s
Galileo and China’s BeiDou) GNSS constellations. Stakeholders explained that ranging errors are less concerning
because they can be largely eliminated with dual-frequency receivers. One stakeholder, however, noted that a fairly
large portion of GNSS users remain reliant on single-frequency receivers. There may therefore be a subset of GNSS
applications in which ranging errors remain a potentially large issue.
Stakeholders offered a number of general insights about our social and economic impact categories and
emphasized the large number of important, user specific details that need to be considered when trying to understand
potential space weather impacts. They were able to readily discuss different Defensive Investments, Service
Interruptions (Table 17 and Table 19), and the direct relationship between these impact categories. Specifically, there is
an extraordinarily wide variety of GNSS receivers on the market, which range in price (and therefore quality of GNSS
service) from ~$10 to upwards of $100,000 each. In addition to end user decisions about what type of GNSS receiver
to purchase, which involves individual cost-benefit considerations, stakeholders discussed how entities and/or industries
using GNSS for safety-critical applications typically build external systems to enhance the overall performance of the
standard GNSS service. These augmentation systems can be either space- or ground-based and tend to be quite costly
since they require additional hardware and software that needs to be bought, deployed, and maintained. In addition to
decreasing the potential for impacts during a space weather event, these expensive systems are justified because they
increase the overall performance of GNSS across a broad spectrum of potential issues (e.g. terrestrial weather,
intentional/non-intentional interference, multipath problems). Stakeholders also noted that these safety-critical
applications (e.g. aviation) are not yet exclusively reliant upon GNSS and have retained or developed backup
technologies and procedures in place to use in situations where GNSS becomes unavailable.
Our stakeholders found it difficult to populate our impact matrix for Mitigating Actions and Asset Damages.
They noted that it was theoretically possible to enact different Mitigating Actions in response to a specific space weather
event, for example by post-processing GNSS derived data or by making schedule changes, but were uncertain if these
options were standard practice. One individual further speculated that such Mitigating Actions might be evoked and be
particularly effective for reducing potential impacts of an extreme event. Stakeholders were also unable to identify any
potential Asset Damages to GNSS users but noted that they could potentially occur more indirectly via Service
Interruptions. The degradation or disruption of navigation information could, in theory and for example, cause moving
vehicles such as cars or airplanes to collide with one another or immobile objects. They were unaware, however, of any
incidences where this potential impact has occurred to date.
Although these general insights were informative, our stakeholders emphasized that there are many
complexities and uncertainties surrounding this topic. They stressed, for example, that the probability of the physical
effects (e.g. ranging errors and loss of lock) leading to a Service Interruption and their resulting consequences both vary
as widely, and are changing as rapidly, as GNSS use itself. Stakeholders also expressed uncertainties about how these
impacts have or will change with time. On one hand, GNSS users may be becoming less susceptible to potential space

42
weather events due to increased understanding and more robust Defensive Investments (e.g. GNSS modernization,
enhanced receiver design and engineering). On the other hand, the potential consequences of Service Interruptions may
be simultaneously increasing due to the growing number of GNSS uses and users. As the PNT information provided by
GNSS technology becomes increasingly relied upon and further embedded into more complex, interdependent systems
and processes, a better understanding of the potential impacts will become more challenging and also more pressing.

43
Table 17. Impact matrix populated during our first round of stakeholder outreach to better understand how the well-studied physical effects of space weather on GNSS
users may lead to different categories of social and economic impacts. Bulleted items inside matrix reflect example impacts identified by space weather for both
moderate and extreme storms. Question marks denote instances where the physical effect may in theory be able to cause this impact but empirical support is lacking.
Additional notes about each of these impacts from our discussions can be found in Table 18 and Table 19.
Physical
Effects
Impact Categories
Defensive Investments Mitigating
Actions
Asset
Damage
Service Interruptions Health
Effects
Ranging
Errors
• Receiver Design &
Engineering
• Additional constellations
• Augmentation Systems
• Differential Correction? • Quality Degradation
Loss of Lock
• Receiver Design &
Engineering
• Additional constellations
• Augmentation Systems
• Schedule Changes? • Quality Degradation
• Outage
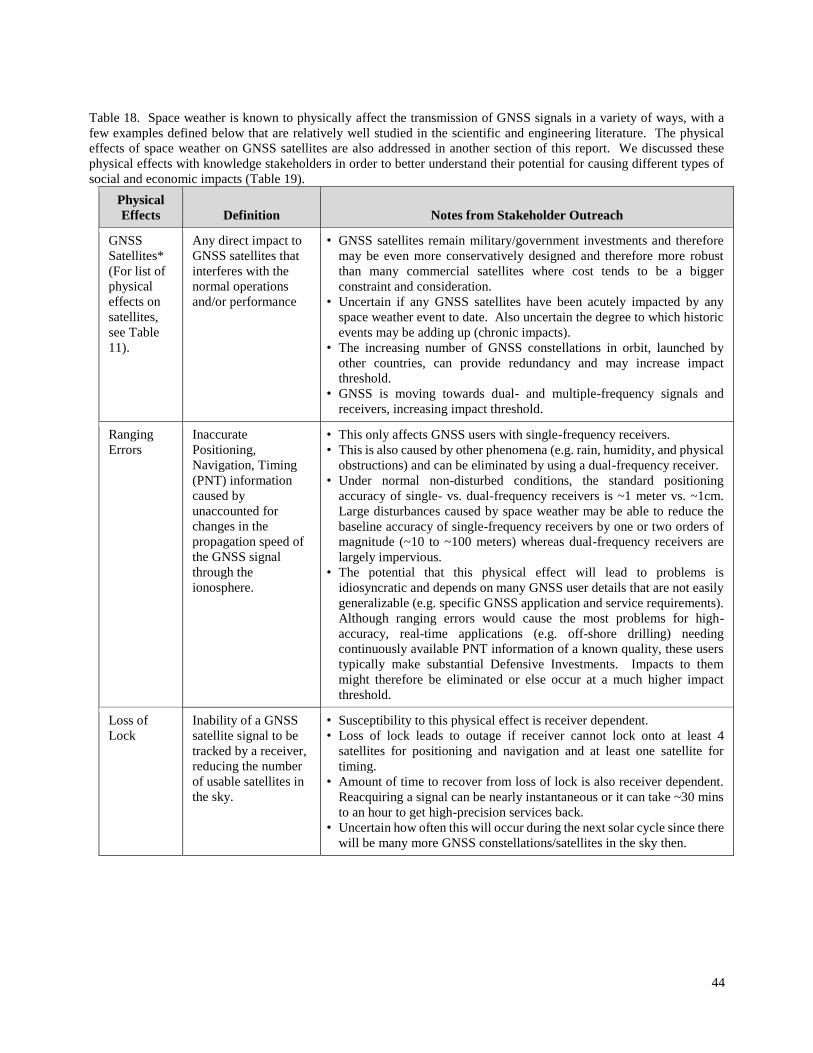
44
Table 18. Space weather is known to physically affect the transmission of GNSS signals in a variety of ways, with a
few examples defined below that are relatively well studied in the scientific and engineering literature. The physical
effects of space weather on GNSS satellites are also addressed in another section of this report. We discussed these
physical effects with knowledge stakeholders in order to better understand their potential for causing different types of
social and economic impacts (Table 19).
Physical
Effects Definition Notes from Stakeholder Outreach
GNSS
Satellites*
(For list of
physical
effects on
satellites,
see Table
11).
Any direct impact to
GNSS satellites that
interferes with the
normal operations
and/or performance
• GNSS satellites remain military/government investments and therefore
may be even more conservatively designed and therefore more robust
than many commercial satellites where cost tends to be a bigger
constraint and consideration.
• Uncertain if any GNSS satellites have been acutely impacted by any
space weather event to date. Also uncertain the degree to which historic
events may be adding up (chronic impacts).
• The increasing number of GNSS constellations in orbit, launched by
other countries, can provide redundancy and may increase impact
threshold.
• GNSS is moving towards dual- and multiple-frequency signals and
receivers, increasing impact threshold.
Ranging
Errors
Inaccurate
Positioning,
Navigation, Timing
(PNT) information
caused by
unaccounted for
changes in the
propagation speed of
the GNSS signal
through the
ionosphere.
• This only affects GNSS users with single-frequency receivers.
• This is also caused by other phenomena (e.g. rain, humidity, and physical
obstructions) and can be eliminated by using a dual-frequency receiver.
• Under normal non-disturbed conditions, the standard positioning
accuracy of single- vs. dual-frequency receivers is ~1 meter vs. ~1cm.
Large disturbances caused by space weather may be able to reduce the
baseline accuracy of single-frequency receivers by one or two orders of
magnitude (~10 to ~100 meters) whereas dual-frequency receivers are
largely impervious.
• The potential that this physical effect will lead to problems is
idiosyncratic and depends on many GNSS user details that are not easily
generalizable (e.g. specific GNSS application and service requirements).
Although ranging errors would cause the most problems for high-
accuracy, real-time applications (e.g. off-shore drilling) needing
continuously available PNT information of a known quality, these users
typically make substantial Defensive Investments. Impacts to them
might therefore be eliminated or else occur at a much higher impact
threshold.
Loss of
Lock
Inability of a GNSS
satellite signal to be
tracked by a receiver,
reducing the number
of usable satellites in
the sky.
• Susceptibility to this physical effect is receiver dependent.
• Loss of lock leads to outage if receiver cannot lock onto at least 4
satellites for positioning and navigation and at least one satellite for
timing.
• Amount of time to recover from loss of lock is also receiver dependent.
Reacquiring a signal can be nearly instantaneous or it can take ~30 mins
to an hour to get high-precision services back.
• Uncertain how often this will occur during the next solar cycle since there
will be many more GNSS constellations/satellites in the sky then.

45
Table 19. Additional notes from stakeholder discussions on items listed in our final GNSS impact matrix (Table 17)
Impact
Category Examples Definition Notes from Stakeholder Outreach
Defensive
Investments
Receiver
Design and
Engineering
A variety of techniques used by
GNSS receiver manufacturers to
increase GNSS service quality including, for example, special
computer algorithms, holdover
technologies (e.g. highly accurate internal
synchronization devices),
increasing the maximum age of corrections, and inertial
navigation systems.
Depends on user needs.
Also varies with geography and becomes especially important in
areas where reliability of GNSS signal is a chronic problem (e.g.
high-latitudes, equatorial regions).
Holdover capacity is application specific but can range from
hours to days. Holdover is invested in for other reasons besides
space weather and can be costly. To maintain accuracy for 5 minutes without GNSS signal, for example, may cost ~$100,000.
Additional
constellations
Utilizing GNSS signals
broadcasted by more than one GNSS constellation (e.g. GPS
built by the U.S., GLONASS
built by Russia, DBS built by China, Galileo built by the
European Union) to solve
positioning calculations.
Impacts to GNSS signals tend to be more “local” so if satellite
signals are used, the impacted signal will have less weight in the GNSS solution.
Less likely for receivers to lose lock since more satellites can be
seen at any one time.
Augmentation
Systems
Supplemental systems external to GNSS systems that provide
additional data to GNSS users to
improve quality of GNSS service. Systems can be ground
or space based and can provide a variety of data, for example,
GNSS error information and
corrections.
Ground based augmentation services are more local in nature.
They also tend to be resource intensive to operate and maintain so some are starting to be decommissioned.
Satellite based augmentation services are more expensive but
provide regional coverage (e.g. the Wide Area Augmentation System (WAAS) in U.S. and the European Geostationary
Navigation Overlay Service (EGNOS) in Europe). They can also
be affected by space weather (e.g. December 2006) but unclear extent to which it may compromise operations.
Corrections sent by satellites can be interrupted for ~5-10 minutes
but this can be addressed by increasing the holdover capacity of
receivers.
Mitigating
Actions
Differential
Correction
Decision made to post-process
GNSS data to increase its
accuracy by comparing measurements taken by more
than one GNSS receiver.
Theoretically possible, but not clear if or under what
circumstances this may be done. Users typically worried about
having highly-accurate information to inform the appropriate
Defensive Investments. Any automatic, real-time applications of this are covered in our
Defensive Investment category (e.g. Receiver Design & Engineering).
Schedule
Changes
In anticipation of possible
service degradation and/or service outages, GNSS users
may decide to change timing of
operations that may be sensitive to potential problems.
Decision hinges on how costly schedule changes are to end users
and may rarely occur, especially if costs are high (e.g. off-shore drilling).
Some third-party GNSS service providers offer their own
forecasts of anticipated disruptions to end users to make them
aware of risks.
Service
Interruptions
Quality
Degradation
Any reductions in the quality of
information provided by the standard GNSS service.
There are many different ways to think about the “quality” of
GNSS service (e.g. availability, accuracy, continuity, integrity).
Quality needs and therefore impacts from quality vary
dramatically from user to user.
Outage Inability of GNSS user to
receive usable PNT information
from GNSS satellites.
Impact occurs most frequently in high-latitudes and equatorial
region.
Uncertain if it has been observed in mid-latitudes regions but this
could certainly happen during an extreme event.

46
5.3 Cost Estimates
In order to translate our findings into quantitative cost estimates that capture the most concerning and potentially
largest impacts, we conducted a second round of stakeholder outreach. Although this additional input helped us quantify
the potential impacts from Service Interruptions (~$4 million to ~$8 million for the moderate event scenario and ~$100
million to ~$600 million for the extreme event scenario), we received much less guidance from our stakeholders on this
sector compared to others. The input gained from our additional outreach is nonetheless provided below alongside a
description of how it influenced the derivation of our cost estimates. Note that our estimate are conservative since they
only capture how GNSS outages may reduce the economic benefits provided by GNSS to a sub-set of applications where
there has been a relative large penetration of the technology. Although the potential costs would certainly be much
higher if we included other types of impacts from GNSS outages (e.g. health and safety, environment, etc.), we were
unable to find adequate information on these topics to propose defensible estimates [Leveson, 2015a]. Our cost estimates
are also preliminary and rely upon an early quantitative analysis of this topic and data from 2013 [Leveson, 2015a].
There was not enough publically available information on this study to be able to use updated and current numbers for
2016. Given the rapid increase in GNSS usage in the intervening years, impacts estimated herein may therefore be
understated.
Table 20. Simplified GNSS impact matrix, with the focus of our cost estimate highlighted in yellow. The presence
(or absence) of a circle denotes where we were able to connect a given physical effect to a particular impact category
during our first round of stakeholder outreach (see Table 17 for a list of items represented by each circle). Closed
circles denote that the physical effect is known, from direct past experience, to cause impacts of that particular
category. Open circles indicate that the physical effect may cause that particular type of impact but the linkage
presently lacks empirical support.
Physical Effects
Impact Categories
Defensive
Investments
Mitigating
Actions
Asset
Damages
Service
Interruptions
Health
Effects
Ranging Errors ● ○ ●
Loss of Lock ● ○ ●
5.3.1 Service Interruptions
We estimate that a moderate event may cost GNSS users ~$4 to ~$8 million (Table 21) whereas a more extreme
event may cost ~$100 million to $600 million (Table 22). Our stakeholders emphasized that the potential impacts from
a GNSS Service Interruption varies as widely and changes as rapidly as GNSS use itself. Our cost estimate therefore
builds off a recent study that quantifies the benefits of GNSS (GPS) to the U.S. [Levenson et al., 2015a; 2015b]. We
assume that a moderate and extreme space weather event both lead to a GNSS outage that imposes costs to end users by
reducing these economic benefits. Note that GNSS provides additional, non-market benefits (e.g. health and safety,
environment) that we were unable to capture due to insufficient quantitative information of this topic [Leveson et al.,
2015]. We were also unable to find enough information to capture any societal costs resulting from potential impacts to
our nation’s critical infrastructure (e.g. chemical, communications, energy, financial services, informational technology,
water and waste water, etc.) (for the complete list of 16, as defined by the Department of Homeland Security (DHS), see

47
Table 23). Our cost estimates are therefore incomplete and should be updated when such pertinent information becomes
available. At present, our numbers should therefore be interpreted as conservative estimates of potential costs.
5.3.1.a. Moderate Event Scenario
We estimate that a moderate space weather event may cost end users of GNSS in the U.S. ~$4 to ~$8 million.
This estimate captures the costs of an event that is able to cause a ~1 hour GNSS outage across the U.S. and that impacts
different types of end users to various degrees. It is based on a historic consideration of past events that have impacted
GNSS users, important differences between users in their susceptibilities to an event, and the economic benefits of GNSS
to a representative set of applications.
Our first step involved considering past historic space weather events in order to develop a moderate scenario
for the duration and extent of the GNSS signal disruption. Stakeholders pointed us to the Halloween storm in 2003 and
the December 2006 event as key events with notable impacts to GNSS users. Although we located a number of detailed
scientific analyses of these events [e.g. Chen et al., 2005; Cerruti et al., 2006; Cerruti et al., 2008], we found limited
and anecdotal documentation about their actual impacts. During the 2003 Halloween storm, for example, one report
states that surveying activities on land, in the air, and at sea were delayed and drilling operations were either postponed
or cancelled [e.g. NOAA, 2004]. Although our stakeholders provided order of magnitude cost estimates of these impacts
of ~$10,000 to ~$100,000 per day, it is unclear how long these delays and cancellations lasted and how widespread they
were (or could be). We therefore reviewed the more detailed scientific analyses of these events to develop a GNSS
outage scenario for our moderate event. Specifically, during the 2003 Halloween Storm, a series of solar radio bursts
caused GNSS receivers worldwide to intermittently lose lock for periods of time from minutes [Chen et al., 2005] up to
hours [Astafyeva et al., 2014]. Airlines were also unable to use the Federal Aviation Administration’s (FAA) Wide Area
Augmentation System (WAAS) for precision approaches for a total of ~25 hours over two days during the Halloween
2003 storm (e.g. for ~15 hours on October 29 and ~11 hours on October 30) [e.g. NOAA, 2004; Doherty et al., 2004].
We were unable to determine, however, if this ~1 day long interruption caused substantive impacts (e.g. flights were
delayed) or if it was more of a nuisance (e.g. pilots reverted to alternate landing procedures). During the December 2006
event, GNSS receivers on the sunlit side of the Earth were disrupted for tens of minutes [Cerruti et al., 2008] up to ~1
hour [e.g. Carrano et al., 2009]. Similar to the Halloween 2003 storm, however, we found limited documentation on
how this event in turn impacted GNSS users. To reflect these historical observations, our moderate scenario therefore
envisions a space weather event that disrupts GNSS signals across the entire U.S. for ~1 hour. Note that this assumes
that the GNSS service ceases and resumes with the space weather disruption. Moreover, it seems as if we have not
experienced a “moderate” storm that has significantly impacts GNSS users since the U.S. made GNSS [Global
Positioning Service (GPS)] freely available in 2000. It is therefore hard to establish potential impact thresholds if we
have not yet experienced significant impacts.
Our next step was to determine what percentage of GNSS users within the U.S. may incur an outage as a result
of this disruption. Stakeholders emphasized that the susceptibility of different GNSS users to any given space weather
event varies dramatically from user-to-user and for a given user, from location-to-location. There are at least nine types
of GNSS applications at present with substantial economic benefits including precision agriculture, construction,
surveying, transportation (including air, rail, maritime, and road), timing, and consumer location-based services (LBS)

48
[Levenson, 2015a]. Although each of these applications is comprised of a diverse GNSS user base, it is possible to make
some generalization about typical users susceptibilities within each application. We classified users within each of these
applications as having either low, medium, or high quality GNSS service needs by reviewing key GNSS performance
parameters listed for different GNSS market receivers [European GNSS Agency, 2016]. These parameters include
accuracy, availability, continuity, integrity, robustness, continuity, indoor penetration, time to first fix, latency, and
power consumption [see Annex I in European GNSS Agency, 2016]. We used accuracy and continuity as our quality
indicators since they most directly correspond to the effects of space weather on the GNSS signal (Table 18).
Specifically, ranging errors and loss of lock can both degrade accuracy whereas loss of lock can interfere with continuity.
We then mapped our nine different types of GNSS applications of focus to their mass markets and noted whether user
priorities for both accuracy and continuity are either lower or higher (Table 21). Recall that our stakeholders also
reported a large range in GNSS receiver price and quality, from ~$10 to more than ~$100,000 per receiver. To reflect
the fact that users needing different quality services generally purchase receivers of different qualities that will vary in
their susceptibilities to a given disturbance, we assume that the disruption occurring in our moderate event scenario
causes as outage impacted ~100% of users with the low quality GNSS needs, 10% of users with medium quality GNSS
needs, and 1% of users with high quality GNSS needs (e.g. users with lower quality needs purchase less expensive
receivers that are more vulnerable to events whereas those with higher quality needs purchase more expensive receivers
that are less vulnerable to disruptions).
Our final step is to compute the costs of this outage scenario to different GNSS applications. Levenson et al.,
[2015a] estimate that the economic benefit of GNSS enabled technologies across these nine different applications may
total ~$37.1 to ~$74.5 billion per year (Table 21). We assume that our moderate event imposes costs to these GNSS
users by reducing these total annual benefits by an amount that is proportional to the length of the outage (~1 hour) and
the percentage of application users within the U.S. that are impacted. Our calculations assume that the event happens
during working hours and these benefits, and therefore costs, accrue during the eight hour working day rather than over
a full 24 hour day. Summing our results across all applications suggests a cost to these applications that varies by
multiple orders of magnitude but may collectively total ~$4 to $8 million, with largest costs (~$3 to $6 million) for mass
market users of GNSS enabled Consumer Location Based Services (for additional details, see Table 21). Note that this
approach ignores the potentially important insight that some of these applications may be able to absorb a ~1 hour
disruption without being impacted by it. Certain applications may be impacted by GNSS outages of any non-zero
duration whereas other may not be impacted until it exceeds some threshold length. It is unclear, for example, if a ~1
hour outage would or would not reduce the annual economic benefits of GNSS across all of these applications (e.g. a ~1
hour outage that results in a delay for air transportation may prove large whereas the same ~1 hour outage that results in
a delay of fertilizing, watering, or seeding for precision agriculture may be inconsequential). We were unable to find
enough information about this topic to incorporate this potentially important point into our current cost estimate. As
mentioned in the beginning of this section, this approach produces a conservative estimate of the potential economic
impact of the event since it only captures how an outages may reduce the economic benefits provided by GNSS to a sub-
set of applications where there is enough information to quantify and there has been a relative large penetration of the
technology. It is furthermore conservative because it is built off a study that assesses only a subset of users within each
application (e.g. estimate of precision agriculture only considers benefits to grain farming). Although the costs may be

49
much higher if we include other types of impacts from GNSS outages (e.g. health and safety, environment, etc.), we
were unable to find enough information on these topics to propose defensible numbers.
Table 21. Cost estimates reflecting a GNSS outage, as envisioned in our moderate event scenario, that lasts ~1 hour
and impacts a broad spectrum but different percentage of GNSS users across the U.S.
GNSS
Application1
Receiver
Market2
User Priorities2
Quality
Needs3
% of Users
with
Outage4
Range of
Benefits
(Billions/yr)1
Estimated Costs
Accuracy Continuity
To
Application
To
Market
Consumer
Location-
Based
Services
Mass Market Low Low Low 100% $7.3-18.9 $3-6 m $3-6 m
Timing High
precision,
timing &
asset
management
solutions
High Low
Medium
10%
$0.025-0.050 $900-2000
$1-2 m
Precision
Agriculture High Low $10-17.7 $0.3-0.6 m
Surveying High Low $9.8-13.4 $0.3-0.5 m
Construction High Low $2.2-7.7 $0.08-0.3 m
Fleet Vehicle
Telematics High Low $7.6-16.3 $0.3-0.6 m
Maritime
Transport Transport &
Safety
Liability
Critical
Solutions
High High
High
1%
$0.106-0.263 $400-900
$800-
2000 Air Transport High High $0.119-0.168 $400-$600
Rail
Transport High High $0.010-0.100 $30-$300
Total $37.1-74.5 ~$4-8 m 1Information provided in Leveson, 2015a unless otherwise noted. Annual benefits represent mid-range values. 2Information derived from GNSS User Technology Report [European GNSS Agency, 2016], which describes different
GNSS receiver markets and identifies their user priorities in terms of key performance parameters. Here, these three
mass markets are mapped to different applications [Leveson, 2015a] and note whether the most relevant performance
parameters for space weather impacts, accuracy and continuity, are of high or low priority to these users. For
information on Mass Markets see p. 31, on Transportation & Safety Liability Critical Solutions see p. 40, and on High
Precision, Timing & Asset Management Solutions see p.53. 3Applications where users have accuracy/continuity needs that are low/low, high/low, and high/high are assumed to
need low, medium, and high quality GNSS services respectively. 4Stakeholders reported a large range in GNSS receiver price and quality, from ~$10 to ~$100,000 per receiver. To
reflect the fact that users needing different quality services generally purchase receivers of different qualities that will
vary in their susceptibilities to a given disturbance, we assume that the event causes an outage to 100%, 10%, and 1%
of users with low, medium, and high service quality needs respectively.
5.3.1.b. More Extreme Event Scenario
Under more extreme conditions, we estimate space weather impacts that could cost GNSS users within the U.S.
~$100 million to ~$600 million. Our extreme scenario follows the methodology outlined for our moderate event scenario
but assumes that the outage will instead last for ~1-3 days [Cannon et al., 2013; Hapgood et al., 2016] and impacts an
order of magnitude more users than in our moderate event scenario (Table 1).
Table 22. Cost estimates reflecting a GNSS outage, as envisioned in for the extreme event scenario, that lasts ~1-3 days
and impacts a broad spectrum but different percentage of GNSS users across the U.S.
GNSS
Application
Receiver
Market
Quality
Needs
% of Users
with Outage
Range of Benefits
(Billions/yr)
Estimated Costs
To Application To Market

50
Consumer
Location-Based
Services
Mass Market Low 100% $7.3-18.9 $20-200 m $20-200 m
Timing High
Precision,
Timing &
Asset
Management
Solutions
Medium 100%
$0.025-0.050 $0.07-0.4 m
$80-500 m
Precision
Agriculture $10-17.7 $30-100 m
Surveying $9.8-13.4 $30-100 m
Construction $2.2-7.7 $6-60 m
Fleet Vehicle
Telematics $7.6-16.3 $20-100 m
Maritime
Transport
Transport &
Safety
Liability
Critical
Solutions
High 10%
$0.106-0.263 $0.03-0.2 m
$0.06-$0.4 m Air Transport $0.119-0.168 $0.02-0.1 m
Rail Transport $0.010-0.100 $3,000-$80,000
Total ~$100-600 m
In addition to being a conservative estimate for all previously mentioned reasons, note that GNSS enabled
technologies are becoming more and more integral to our nation’s Critical Infrastructure [e.g. Caverly, 2011]. For
example, we found a preliminary report stating that 11 out of 16 components of our nation’s Critical Infrastructure were,
as of 2011, reliant upon GNSS technologies (Table 23) (e.g. internal systems that allow them to run for a specific length
of time without GNSS) [e.g. Caverly, 2011]. However, we were unable to find information describing these
dependencies in sufficient detail to analyze potential impacts of an event. Note that this report also provides information
of different holdover capacities (e.g. internal systems that allow them to run for a specific length of time without GNSS),
which are all commensurate in length with the low-end of our outage duration (~1 day) and smaller than our high-end
(~3 days). Although this suggests the potential for societal impacts, we were unable to find more information on how
these holdover capacities may have changed over the last 6 years [i.e. since Caverly, 2011]. SWAP efforts to establish
benchmark GNSS outage scenarios are not yet complete [Executive Office of the President, 2017] but will be followed
by a comprehensive vulnerability assessment of our nation’s Critical Infrastructure to such benchmarks [Space Weather
Action Plan, 2015]. While there is not currently enough information to assess the impacts of potential GNSS outages
via effects on Critical Infrastructure, it will be important to estimate the costs when these other studies conclude and in
light of their light findings.
Table 23. U.S. Critical Infrastructure is reliant on GNSS technologies so the potential societal impacts of an
extreme event on the U.S. may be large but is currently unknown.

51
Critical Infrastructure (CI) Sector1 Reliant on GNSS2? Holdover Capacity
(Hours)2
Chemical Yes 1
Commercial Facilities
Communications Yes 24+
Critical Manufacturing Yes 1.7
Dams Yes 1
Defense Industrial Base Yes 1.7
Emergency Services Yes 24+
Energy Yes 1
Financial Services Yes <0.24-1.7
Food and Agriculture
Government Facilities
Healthcare and Public Health
Information Technology Yes 1
Nuclear Sector Yes 1
Transportation Systems Yes 24+
Water and Wastewater Systems 1https://www.dhs.gov/critical-infrastructure-sectors 2Assessment of reliance is based on sectors where GNSS timing information was identified by DHS as essential (Caverly,
2011) 3In order to determine if a Critical Infrastructure (CI) sector is impacted by a moderate and extreme event, the sector must (1)
be reliant on GNSS and (2) the outage duration for the moderate (1 hour) and extreme (1 day) space weather scenarios must be
greater than the sector’s holdover capacity.
5.4 GNSS References
Astafyeva, E, Yu. Yasyukevich, A. Maksikov, and I. Zhivetiev. 2014. Geomagnetic storms, super-storms, and their
impacts on GPS-based navigation systems. Space Weather. Volume 12, Issue 7. Pages 508-525.
Baker, D.N. and L.J. Lanzerotti. 2016. Resource Letter SW1: Space Weather. American Journal of Physics. Vol.
84, No. 3.
Cannon, P.; Angling, M., Barclay, L., Curry, C., Dyer, C., Edwards, R., et al., 2013. Extreme space weather: impacts
on engineered systems and infrastructure, UK Royal Academy of Engineering, London, ISBN 1-903496-95-0.
Caverly, J.R. 2011 GPS Critical Infrastructure (Usage/Loss Impacts/Backups/Mitigation). Space Weather Workshop.
Boulder Colorado. April 26-29. April 27, 2011.
Cerruti, Alessandro P., Paul M. Kintner, Dale E. Gary, Louis J. Lanzerotti, Eurico R. de Paula, and Hien B. Vo. 2006.
Observed solar radio burst effects on GPS/Wide Area Augmentation System carrier-to-noise ratio. Space
Weather. Volume 4, Issue 10.
Cerruti, Alessandro P., Paul M. Kintner Jr., Dale E. Gary, Anthony J. Mannucci, Robert F. Meyer, Patricia Doherty,
and Anthea J, Coster. 2008. Effect of intense December 2006 solar radio bursts on GPS receivers. Space
Weather. Volume 6, Issue 10. doi:10.1029/2007SW000375.
Chen, Z., Y. Gao, and Z. Liu (2005), Evaluation of solar radio bursts’ effect on GPS receiver signal tracking within
International GPS Service network, Radio Sci., 40, RS3012, doi:10.1029/2004RS003066.
Doherty, P., A.J. Coster, and W. Murtagh. 2004. Space weather effects of October-November 2003.” GPS Solutions.
Vol. 8, Issue 4. P. 267-271. Doi:10.1007/s10291-004-0109-3
European GNSS Agency, GNSS User Technology Report, Issue 1, copyright c 2016
Hernández-Pajares, M., J. M. Juan, J. Sanz, À. Aragón-Àngel, A. García-Rigo, D. Salazar, and M. Escudero

52
(2011), The ionosphere: effects, GPS modeling and the benefits for space geodetic techniques, JGeod, doi:
10.1007/s00190-011-0508-5.
Kintner, P. M., B. M. Ledvina, and E. R. de Paula (2007), GPS and ionospheric scintillations, Space Weather, 5,
S09003, doi:10.1029/2006SW000260.
Leveson, I., 2015a. The Economic Benefits of GPS. GPS World. September 2015.
Leveson, I., 2015b. The Economic Value of GPS: Preliminary Assessment. National Space-Based Positioning,
Navigation and Timing Advisory Board Meeting, June 11, 2015. Downloaded from:
http://www.gps.gov/governance/advisory/meetings/2015-06/leveson.pdf
National Oceanic and Atmospheric Agency (NOAA). 2004. Service Assessment: Intense Space Weather Storms
October 19-November 7, 2003.
Tsurutani, B. T., O. P. Verkhoglyadova, A. J. Mannucci, G. S. Lakhina, G. Li, and G. P. Zank (2009), A brief review
of ‘‘solar flare effects’’ on the ionosphere, Radio Sci., 44, RS0A17, doi:10.1029/2008RS004029.

53
6. Aviation
6.1 Impact Mechanisms
During space weather events, increases in both electromagnetic and particulate radiation may affect aviation in
various ways [Jones et al., 2005; Cannon et al., 2013; Baker and Lanzerotti, 2016]. Increases in electromagnetic
radiation may diminish the capabilities of various aircraft communication and navigation systems that are fundamental
to airplane operations. This may occur, for example, if the ionosphere becomes highly ionized and attenuates rather than
reflects the High Frequency (HF) radio waves that airborne planes use to send and receive critical information.
Communication and navigation capacities may similarly be diminished when electromagnetic radiation from a space
weather event introduces sufficient noise to significant lower signal-to-noise ratios [Jones et al., 2005; Cannon et al.,
2013; Baker and Lanzerotti, 2016]. Effects may also result from enhanced levels of particulate radiation given its ability
to penetrate matter and deposit energy. Neutrons, for example, are thought to be particularly effective at penetrating and
depositing energy inside the silicon microchips that control a growing number of airplane electronic (“avionic”)
equipment. Such effects involve an individual incident neutron and are therefore referred to as Single Event Upsets
(SEUs) or avionic upsets [Dyer et al., 2000; Normand, 2001; Campbell et al., 2002; Dyer, 2002]. SEUs may cause
either soft or hard errors such as bit flips or circuit latch-ups and burn-outs. Particulate radiation can also penetrate
human cells and may directly break down deoxyribonucleic acid (DNA) strands in tissue or produce free radicles in
biological tissues that may alter cellular functions. Space weather is therefore also potentially hazardous to those onboard
aircraft where potential radiation exposure at high dose rates received at airplane altitudes may be significant [Butikofer
et al., 2008; Dyer et al., 2003; Langtos and Fuller, 2003; Getley et al., 2005; Getley et al., 2010], potentially leading to
adverse health outcomes such as increases in the risk of cancer and lower cognitive ability of unborn fetuses.

54
Figure 8. Impact mechanism diagram for aviation outlining the primary causal pathways from a solar event to physical
effects (grey boxes) that can in turn cause a variety of social and economic impacts (green boxes). Note that our
illustration depicted is not to scale, not comprehensive, and should be revised with future input from stakeholders to
ensure it captures largest potential concerns.
6.2 Stakeholder Perspectives on Impacts
Our first phase of stakeholder outreach involved hour long phone calls with 6 individuals with expertise on
space weather and aviation. We used our impact matrix to guide these conversations and to systematically collect input
on the known physical effects of space weather on aviation and the types of impacts that each may cause. Our final
impact matrix is presented below (Table 24) along with additional and important insights from these conversations,
including definitions and notes on the various physical effects (Table 25) and impacts (Table 26). The remainder of this
section provides a high-level overview of what we learned from these stakeholder discussions.
Depending on roles and responsibilities, industry stakeholders emphasized different concerns about the known
physical effects of space weather on aviation (Table 25). Airplane manufactures, for example, were most concerned
about safeguarding airplane electronics (“avionics”) against Single Event Upsets (SEUs). Although critical avionic
equipment and circuits are rigorously designed and tested to minimize the potential problems that SEUs can cause, they
explained how this hazard is continuously evolving in complexity alongside other industry trends such as the increasing

55
dependence on aircraft computers, shrinking chip sizes, and increasing flight altitudes. Airplane operators on the other
hand were primarily concerned about space weather’s potential to disrupt different communication technologies,
especially High Frequency (HF) radio which to date remains an important mode of communication especially along
polar and oceanic routes. Many stakeholders noted that the nature of this effect may change in the future, as satellite
communication technology which has different vulnerabilities to space weather (e.g. see Link Disruptions in the Satellite
section) is increasingly adopted across the industry. Stakeholders working more directly on a range of aircraft safety
issues expressed unknown but potentially growing risks from the increasing role of GNSS in airplane navigation
combined with the decommissioning of ground based navigation aids around the world. And lastly pilots, flight
attendants, and representatives throughout the industry also expressed concerns about exposure to enhanced level of
radiation that could occur if flying at altitude during a space weather event.
Stakeholders were able to readily populate our impact matrix with many examples across the different impact
categories (Table 26). Stakeholders spoke at length about the substantial number of Defensive Investments made across
the industry that protect against the impacts of space weather events but also stressed that such investments are made to
ensure and enhance the safety and efficiency of airplane services against all-hazards (e.g. terrestrial weather, bird strikes,
terrorists, etc.). Stakeholders with experience working in polar-regions were most familiar with space weather and noted
that potential disruptions to HF radio often prevent airlines from flying planned schedules or routes since the inability of
an aircraft to be in continuous contact with Air Traffic Control (ATC) violates Federal Aviation Administration (FAA)
law. Although rerouting airplanes around regions where HF radio may be disrupted can be considered an effective
Mitigating Action, stakeholders noted that it tends to be costly to airlines in terms of additional fuel, reduced cargo,
landing fees, and employee workloads. They also reported a drop in the number of occasions of this occurring in the
recent past, due to the relatively calm recent solar conditions. Depending on the circumstances, airlines may also opt to
delay or cancel flights depending on where and how long the disturbance lasts. Although infrequently enacted for space
weather reasons, all Mitigating Actions are a routine part of the business and are frequently enacted for a variety of
reasons and directly cause Service Interruptions for passengers who will then arrive late at their destinations. Although
many stakeholders were concerned about potential Health Effects, they stressed that the scientific connection between
radiation exposure and health outcomes (e.g. cancer) remain heavily debated and largely uncertain. Many airlines
nonetheless take simple precautionary actions such as temporarily lowering cruising altitude if it does not jeopardize
aircraft safety for other reasons (e.g. surrounding airspace is uncrowded and sufficient fuel is aboard to compensate for
decreased fuel efficiency).

56
Table 24. Impact matrix populated during stakeholder outreach to better understand how the known physical effects of space weather (Table 25) on
aviation can cause different types of impacts. Items in the matrix reflect example impacts and stakeholder perspectives on the differences between
impacts that might occur during moderate (normal text) compared to more extreme (italic text) space weather conditions. Question marks denote
instances where the physical effect may in theory be able to cause this impact but empirical support is lacking. *Additional details pertaining to a
select set of these impacts can be found in Table 26.
Physical Effects Impact Categories
Defensive Investments Mitigating Actions Asset Damage Service
Interruptions Health Effects
Communication
• Personnel training
• Maintenance of
alternative procedures*
• Redundant technologies*
• Situational Awareness
• Preflight planning
• Aircraft
schedule/route
changes*
• Accidents?* • Delays*
Navigation
• Personnel training
• Maintenance of
alternative procedures*
• Redundant technologies*
• Augmentation systems
• Alternative
procedures
• Accidents?* • Delays*
Avionic Upsets
(SEUs)
• Design & Engineering
• Avionic testing
• Redundant technologies*
• Equipment
inspections
• Alternative
procedures
• Equipment
failure
• Accidents?*
Effective Dose • Situation awareness
• Inflight measurements
• Preflight planning
• Reduce altitude
• Post-event analysis
• Aircrew schedule
changes
• Delays*
• Cancer*
• Lower Cognitive
Ability*

57
Table 25. Definitions of key effects of space weather on aviation that includes notes from stakeholder interviews on
current status and future of each specific impact.
Physical
Effects Definition Notes from Stakeholder Outreach
Communication Any degradation or
interruption in the signal used
to transmit information to/from an aircraft and
therefore can potentially cause
the degradation or disruption of communication systems.
• Most frequently a problem for routes still reliant on High-Frequency (HF) radio (e.g. polar, high-latitude, and oceanic). These routes are also some of the most
profitable in an industry with small margins.
• Importance of effects in the polar region is relatively recent, starting after Russian
airspace opened in 2001 and after long-haul aircraft with sufficient ranges were built.
• Communication problems could decrease in future if more airlines move away
from HF radio to usage of satellite communications. Currently, these services (e.g.
IRIDIUM or INMARSAT) are proving beneficial.
• Communication problems could also decrease if industry adopts technologies with Ka-frequencies. Ka-frequencies are not currently utilized due to problems with
rain fade but the industry is actively working to overcome issues due to their higher
bandwidths.
• Potential decreases could be offset by increase in air travel. Impacts in future could still increase if a larger number of airplanes/people are impacted by an event.
Navigation Any degradation or
interruption in the signal used to transmit information
to/from an aircraft that can
potentially cause the degradation or disruption, or
failure of navigation systems.
• A number of navigation systems utilized by an airline can be impacted (e.g. Radar,
Satcom) but main concern is interruption to GPS-based navigation (e.g. WAAS).
• Impact largely unknown due to recent increase in GNSS over recent years. It may
cause a real problem or just be nuisance creating more workload for pilots.
• Although less frequently observed in mid-latitude areas, problems have most potential to be problematic here given the higher volume and density of air traffic.
Navigation problems only apply to approaches/landings and may be growing issue due to decommissioning of ground based navigation aids.
Avionic Upsets
(SEUs)
A random, non-permanent
soft error in the digital
systems that are the foundation of airplane
electronic (“avionic”)
equipment.
• SEUs are a well-studied and understood phenomenon that engineers expect to happen and therefore design accordingly (e.g. radiation hardened microchips,
voting systems in circuits, and error detection/correction software).
• SEUs have potential to cause problems in digital electronics but infrequently do.
• The more critical a system is, the more engineering goes into it. Avionic equipment
must surpass tight standards and often undergo testing and accreditation by third
parties to ensure the integrity of their performance at inflight conditions. Unclear
the degree to which space weather events are addressed by industry design standards.
• Problem is likely to increase in future due to technological trends including
increased usage of electronics, the miniaturization of silicon chips, and use of
commercial off-the-shelf technologies.
• SEUs are also caused by internal processes (e.g. interconnect coupling) so determining precise cause of any given SEU is hard.
• Cabin equipment manufacturers are starting to put time and effort into SEUs
because glitches in performance of entertainment equipment can degrade airline
brand.
Effective Dose Absorbed ionizing radiation
dose weighted for the radio-
sensitivity of each organ and the type/energy of radiation.
• Largest exposure in polar/high-latitude regions and on long haul flights.
• Very sensitive topic, empirical evidence linking exposure to effects is lacking. Uncertainties lead to wide variety of responses within industry.
• Stewardesses and pilots have mixed concerns, caring about potential health issues
but also potential loss of work (e.g. restricted hours or early retirement) if
regulations were established.
• Problem is likely to remain and be key concern in future since, unlike other impacts, there is no foreseeable technological fix (e.g. shielding thickness required
would be uneconomical).
• Unlikely that the scientific uncertainties will be resolved in near future. Certain
airlines nonetheless take issue serious even though there are no regulations in place about annual dose limits.
• Exposure levels may increase in future if airlines continue trend of offering longer
and higher altitude flights. On the other hand, exposure levels may decrease if more airlines start considering exposure in route and schedule planning for flights
or key personnel (e.g. pilots, stewardesses).

58
Table 26. Additional details on a select set of space weather impacts in our impact matrix (Table 10) identified
during stakeholder outreach.
Impact
Category Examples Definition Notes from Stakeholder Outreach
Defensive
Investments
Maintenance
of alternative
procedures
Retaining the capacity for
a range of alternative procedures (e.g. non-
precision approaches)
under sub-optimal operating conditions
requires infrastructure,
published information (e.g. book, maps, etc.),
and trained personnel.
Very expensive but invested in due to range of hazards faced by industry. Space weather events are more likely to change take-off and landing
procedures rather than inflight procedures. Key personnel are trained to follow specific procedures if a given
condition arises. Although helpful against potential problems caused by
single event effects, tends to be more relevant for communication/navigation problems. For example, fall back on
traditional navigation aids if space weather renders GNSS navigation
unavailable. On an event-by-event basis, the additional workload for personnel may be more of a nuisance than costly.
Redundant
technologies
Airlines are required by
law to have multiple
systems that can be used to maintain continuous
communication and
navigation capabilities.
Very expensive but invested in due to range of hazards faced by industry
and fundamental importance of safety. Capabilities of redundant (e.g. backup) technologies are still very high and
automatically enacted so their utilization is typically seamless.
Mitigating
Actions
Aircraft schedule and
route changes
Deciding to delay an
aircraft from taking off or to fly a different route
than planned in
anticipation or reaction to a space weather event.
Most often a precautionary decision based on information provided by
SWPC or other commercial providers. Delays are usually minor since many events tend to be short lived. Most common for polar routes and high-latitude routes where it may occur
a couple to a handful of times per year. May happen more frequently in future as we transition from solar minimum to maximum.
A variety of factors need to be considered and downstream logistics need
to be coordinated. Economic consequences become non-linear if changes
cause crew to run out of workable hours.
Asset
Damages Accidents
Any incident resulting in physical damage to an
aircraft due to space
weather.
Could in theory happen due to physical effects (inability to communicate,
failure of critical equipment, or erroneous positioning/navigation
information). Not clear that this has ever happened to industry.
Would be a hard to attribute to space weather, especially for moderate
sized events.
Service
Interruptions Delays
Passengers on aircraft
arrive late to destinations
when airlines make various Mitigating
Actions (e.g. delays,
reroute changes) to reduce risk of space weather
impacts.
Not clear how often it happens, especially outside polar-regions.
Notable example was a relatively recent event in Sweden. Airspace was
shut down since due to solar interference with radar systems.
Costs increase quickly for rerouting if crew runs out of time and there are
no replacements (e.g. in remote areas)
Health
Effects
Cancer
Increase in risk of cancer
due to elevated exposure received while at airplane
altitudes. Potentially
relevant components of health cost include direct
treatment costs (e.g., hospital bills), the costs of
pain and suffering, the
costs of lost life-years,
and lost earnings.
Most relevant for those spending a lot of time in air (e.g. pilots,
stewardesses, frequent flyers) or those in the air during a severe event.
Now that internet services are offered in flight, informed passengers may
access space weather alerts and advocate from cabin that pilots reduce
altitudes. It is not clear how frequently this happens but it is a concern.
Health concerns may not outweigh lost income concerns if limits were set
(e.g. early retirement).
Large uncertainties about actual exposure (e.g. not measured onboard
aircraft but estimated/modeled) and linkages lead to diverse opinions.
Could lead to class action lawsuits although not clear if currently
happening for this reason.
Lower
Cognitive
Ability
Increase in risk that
unborn children in utero
will have lower cognitive ability due to exposure
received while at airplane
altitudes.
Large uncertainties about linkages lead to diverse opinions.
Could lead to class action lawsuits although not clear if currently
happening for this reason.

59
6.3 Cost Estimates
In order to translate our findings into quantitative cost estimates reflective of the most concerning and
potentially largest impacts, we conducted a second round of stakeholder outreach. Most stakeholders suggested that we
focus our quantification on impacts stemming from how space weather events affect High Frequency (HF) radio
communication. This effect therefore underpins the costs estimates we developed for Mitigating Actions (~$400,000 to
~$5 million for our moderate event scenario and ~$1 million to ~$30 million for our more extreme event scenario) and
Service Interruptions (~$900,000 to ~$5 million for our moderate event scenario and ~$6 million to ~$200 million for
our more extreme event scenario). The cost estimates for Mitigating Actions capture the costs of rerouting planes away
from polar-regions during a moderate event and canceling flights in the continental U.S. under a more extreme scenario.
Since these Mitigating Actions disrupt normal air traffic, our cost estimates of Service Interruptions therefore consider
how these decisions in turn impact airline passengers in terms of their lost time. Although we examine the impacts
stemming from potential disruptions to High Frequency (HF) Radio, note that this impact may decrease in the future as
the industry continues to lessen its reliance on this communication technology. Key insights gleaned from our second
round of stakeholder conversations are provided below alongside a description of how they influenced the derivation of
our cost estimates.
Table 27. Simplified aviation impact matrix with the focus of our cost estimates highlighted in yellow. The presence
(or absence) of a circle denotes where we were able to connect a given physical effect to a particular impact category
during our first round of stakeholder outreach (see Table 25 for a list of items represented by each circle). Closed
circles denote that the physical effect is known, from direct past experience, to cause impacts of that particular
category. Open circles indicate that the physical effect may cause that particular type of impact but the linkage
presently lacks empirical support.
Physical Effects
Impact Categories
Defensive
Investments
Mitigating
Actions
Asset
Damages
Service
Interruptions
Health
Effects
Communication
Degradation ● ● ○ ●
Navigation
Degradation ● ● ○ ○ ○
Human Exposure ● ○ ○
Avionic Upsets ● ○ ○ ○ ○
6.3.1. Mitigating Actions
We estimate that a moderate space weather event may cost the U.S. airlines ~$400,000 to ~$5 million, with a
more extreme scenario that may cost ~$1 million to ~$30 million. Our estimates reflect how airlines are apt to respond
to the potential loss of HF communication capabilities, and are therefore based on some initial assumptions about the
duration and location of potential HF Radio disruptions. In our moderate scenario, a HF Radio outage in the polar-region
causes operators to reroute their polar-flights for 1 day. The outage in our more extreme scenarios lasts for 1-3 days and
results in the cancellation of ~1-10% of all domestic flights. Our stakeholders emphasized that rerouting or cancelling
flights in anticipation or in reaction to an ongoing a space weather event are precautionary measures. They reduce the

60
risk of more serious impacts that could in theory occur, for example accidents or collisions, if airplanes are unable to
communicate important information with one another and/or with ground control. However, there is not enough
information at this time to defensibly quantify the potential impacts that could results if such Mitigating Actions are not
enacted.
6.3.1.a. Moderate Event Scenario
We estimate that a moderate space weather event may cost U.S. airline operators ~$400,000 to ~$5 million.
This estimate is based on a series of stakeholder discussions about moderate events, which are known to affect HF
communications in polar-regions and therefore only impact airline carriers flying polar routes. According to polar
operators, there is a standard industry response to moderate space weather events. When NOAA’s Space Weather
Prediction Center issues a storm watch that is S3 or greater, they reroute all of their planned polar flights to lower
latitudes. They further noted that the pre-flight decision-making process typically occurs in daily increments so it is
appropriate to assume that an anticipated event will impact a full day of flights even if the HF disturbance created by a
moderate event only lasts for a small fraction of a day. Our cost estimate outlined below therefore involves combining
information on the costs of polar rerouting, the number of flights rerouted, and the percentage of polar flights operated
by U.S. carriers.
We need to first understand the costs associated with polar rerouting. The most widely cited figure for this
Mitigating Action is ~$10,000 to $100,000 per flight [NOAA, 2004]. Although it in unclear where this estimate came
from, our stakeholders were also somewhat uncertain about the actual costs involved. They reacted to this cited number
favorably while noting that ~$100,000 is not typical but is reasonable as an upper limit. They further noted that the
reported range captures the increased and variable costs of flying non-polar routes. Longer distances between
destinations increases fuel consumption, travel time, and can often require additional stops plus landing fees for refueling
and crew changes. This range is also consistent with reported costs savings of example polar flights (Table 28). One
stakeholder noted that there are currently ~16 polar-routes, so this table includes a small sample of all polar routes flown
by different airlines. We therefore assume the reported range for the costs of polar rerouting of ~$10,000 to $100,000
per flight [NOAA, 2004].
Table 28. Example time and cost savings of polar routes for a set of example city pairs.
City Pair1 Time Savings1 Cost Savings (Canadian $)1 Cost Savings (USD)2
Atlanta to Seoul 124 minutes $44,000 ~$41,000
Boston to Hong Kong 138 minutes $33,000 ~$31,000
Los Angeles to Bangkok 142 minutes $33,000 ~$31,000
New York to Singapore 209 minutes $44,000 ~$41,000 1Source: AMS, 2007 2Values converted to 2016 USD based on the mid-year 2004 currency conversion of 0.74605 USD per CAD
(www.xe.com) and the U.S. BEA’s GDP price deflator value of 1.2505 to adjust from 2004 to 2016 (www.bea.gov).
Our next step involved an assessment of the number of polar flights that would be rerouted. We were able to
find a publically available document reporting that there were over 15,000 polar flights in 2015 [Nav Canada, 2016].
This suggests that a moderate event impacting polar operations for one day might result in the rerouting of ~41 flights

61
(=~15,000 flights per year/365 days per year). Our stakeholders noted that polar air traffic is steadily increasing but that
such information is not captured and cannot be derived from publically available flight data. The US Bureau of
Transportation Statistics dataset, for example, only provides flight counts into and out of airports but does not provide
information about the route that these planes took. Such information is logged, however, by different entities responsible
for monitoring and controlling polar airspace. Stakeholders at the FAA and those affiliated with the Cross Polar Working
Group were able to provide us with more recent and detailed polar flight statistics data by month. In 2016, there were a
total of 15,815 polar flights with an average of 40.2-48 flights per day depending on the month (Table 29). Data available
for 2017 suggests a slightly higher daily average that ranges from 44.6-50.4 flights per day. To capture the lower and
higher end of these recent summary statistics, we simply assume that our moderate event involves the rerouting ~40-50
flights (Table 29). One stakeholder further noted that ~100% of airlines operating polar routes remain reliant on HF
communications (they are not equipped with polar satellite communications [e.g. IRIDIUM]) and that ~90% of all polar
flights are operated by U.S. carriers. Combining all this information together, suggest rerouting costs to U.S. airlines
that may be ~$0.4-$5 million (=$10,000-$100,000 per flight x 40.2-50.4 flights per day x 1 day x 0.90 U.S. flights).
Our estimate does not consider the Southern Polar Region given the absence of U.S. carriers and the smaller
volume of air traffic. We also do not consider the costs of rerouting flights away from High-Latitude Regions (e.g. those
along the North Atlantic Oceanic Track (NAT OTS) and the Pacific Oceanic Tracks [PACOTS]) since stakeholders note
that polar flights constitute the vast majority (>95%) of space weather related rerouting.
Table 29. Statistics of polar flight numbers provided by a stakeholder. Note that these numbers are preliminary and
should be critically reviewed and examined for consensus among the different entities that collect polar flight data.
2016 2017
Month Total Average Daily Total Average Daily
January 1,256 40.5 1,470 47.4
February 1,126 40.2 1,268 45.3
March 1,312 42.3 1,401 45.2
April 1,228 40.9 1,337 44.6
May 1,291 41.6 1,562 50.4
June 1,300 43.3 1,410 47.0
July 1,350 43.5
August 1,441 46.5
September 1,447 48.2
October 1,329 42.9
November 1,274 42.5
December 1,461 47.1
Yearly 15,815 40.2-48.2 44.6-50.4
6.3.1.b. More Extreme Event Scenario
Under more extreme conditions, we estimate that a space weather event may cost airline operators ~$1 million
to ~$30 million. This estimate assumes disruptions to HF communications that are longer-lasting (e.g. ~1-3 days) and
also more widespread, extending to lower-latitudes and impacting ~1-10% of all U.S. domestic flights. Our cost estimate
also assumes flight cancellations, rather than rerouting as in our moderate scenario, and is therefore based on the number
of cancelled flights and the average per flight costs of cancellations.

62
In our extreme scenario, we assume disruptions to HF communications that are longer-lasting (~1-3 days) and
that extend over a larger geographical area that encompasses the continental US. Airlines may therefore be unable to
reroute flights around the disturbed area, as in our moderate scenario, and instead need to prevent flights from taking off
until the event and the disturbance pattern it created within the atmosphere and ionosphere have both passed. We assume
airlines cancel rather than delay flights because stakeholders note that the former is usually the less costly option, and
therefore the preferred Mitigating Action, for more prolonged and more extensive air traffic interruptions as envisioned
here. We furthermore assume that the outage only impacts ~1-10% of all U.S. domestic flights. This scenario
assumption could be interpreted as the total portion of U.S. airspace that may be disturbed or else the percentage of
airlines across the U.S. actually impacted by the disturbance which would depend, for example, on the backup
communications onboard individual aircraft (e.g. Satellite communications) and their ability to perform under the
disturbed conditions. In 2016, the average number of domestic flights in the U.S. was ~21,000-24,000 flights per day
(Table 30). Note that we only consider domestic flights since we were unable to find a cost estimate that considers the
cost of canceling international flights. This furthermore suggests that our final cost estimate may be conservative. An
event that results in the cancellation of ~1-10% of domestic flights for ~1-3 days would therefore impact ~200-7,000
flights (=0.01-0.10 x 1-3 days x 21,000-24,000 flights per day). According to a recent report, there is no generally
accepted cost of cancellations for use in government cost-benefit studies but a reasonable estimate of the fixed cost to
aircraft operators is ~$5,000 per flight cancellation [FAA, 2016]. This suggests that our extreme scenario might cost
U.S. airlines ~$1 million to ~$30 million.
Table 30. Monthly statistics describing U.S. Domestic air traffic in 2016.
2016
Month Total Number of
Domestic Flight1
Daily Average2 Total Number of
Passengers1
Passengers per
Flight3
January 636,907 ~21,000 52,474,764 ~80
February 612,287 ~21,000 51,112,202 ~80
March 697,968 ~23,000 61,593,910 ~90
April 675,765 ~23,000 58,894,484 ~90
May 702,507 ~23,000 62,751,668 ~90
June 713,120 ~24,000 64,757,139 ~90
July 730,481 ~24,000 66,133,058 ~90
August 731,594 ~24,000 63,497,082 ~90
September 672,886 ~22,000 58,618,920 ~90
October 688,246 ~22,000 61,709,276 ~90
November 658,300 ~22,000 59,270,072 ~90
December 662,304 ~21,000 59,178,742 ~90
Yearly 8,182,365 ~21,000-24,000 719,991,317 ~80-90 1Bureau of Transportation Statistics T-100 Segment data for All Carriers and All Airports. Available at:
https://www.transtats.bts.gov/Data_Elements.aspx?Data=1 (flights and passenger data tabs) 2Derived by dividing monthly BTS flights numbers by number of days in each month.
3Derived by dividing monthly BTS flight numbers by monthly BTS passenger numbers.
6.3.2. Service Interruptions
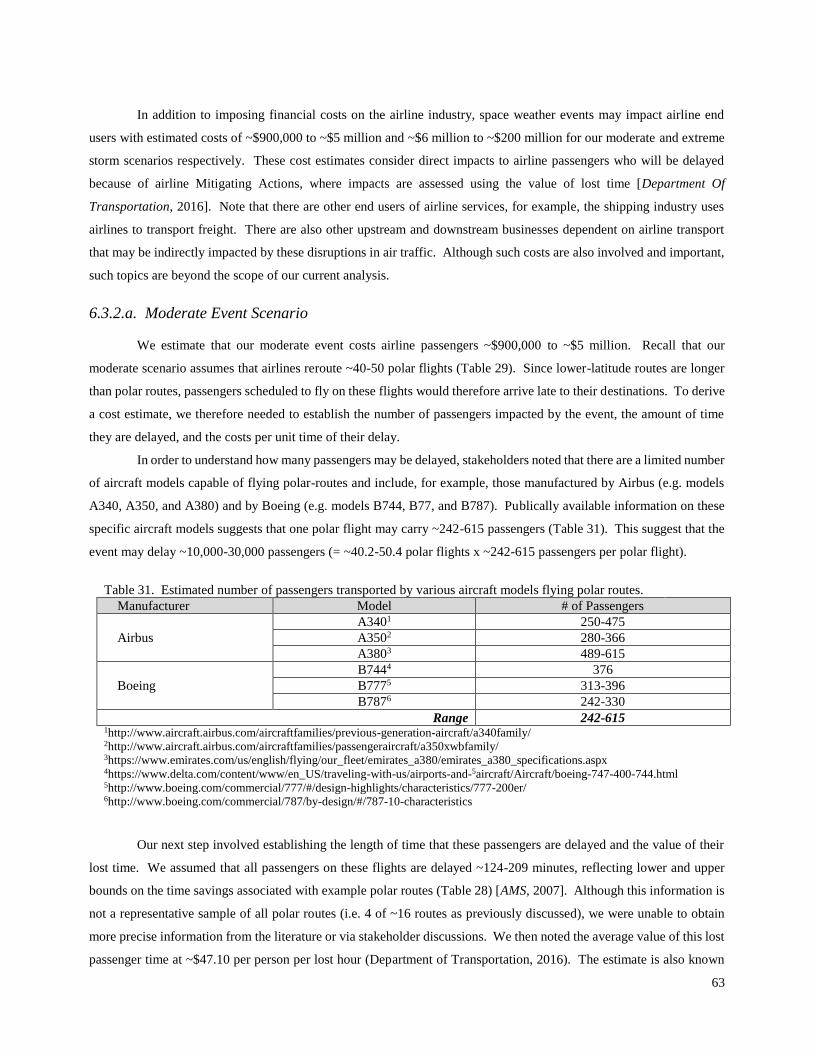
63
In addition to imposing financial costs on the airline industry, space weather events may impact airline end
users with estimated costs of ~$900,000 to ~$5 million and ~$6 million to ~$200 million for our moderate and extreme
storm scenarios respectively. These cost estimates consider direct impacts to airline passengers who will be delayed
because of airline Mitigating Actions, where impacts are assessed using the value of lost time [Department Of
Transportation, 2016]. Note that there are other end users of airline services, for example, the shipping industry uses
airlines to transport freight. There are also other upstream and downstream businesses dependent on airline transport
that may be indirectly impacted by these disruptions in air traffic. Although such costs are also involved and important,
such topics are beyond the scope of our current analysis.
6.3.2.a. Moderate Event Scenario
We estimate that our moderate event costs airline passengers ~$900,000 to ~$5 million. Recall that our
moderate scenario assumes that airlines reroute ~40-50 polar flights (Table 29). Since lower-latitude routes are longer
than polar routes, passengers scheduled to fly on these flights would therefore arrive late to their destinations. To derive
a cost estimate, we therefore needed to establish the number of passengers impacted by the event, the amount of time
they are delayed, and the costs per unit time of their delay.
In order to understand how many passengers may be delayed, stakeholders noted that there are a limited number
of aircraft models capable of flying polar-routes and include, for example, those manufactured by Airbus (e.g. models
A340, A350, and A380) and by Boeing (e.g. models B744, B77, and B787). Publically available information on these
specific aircraft models suggests that one polar flight may carry ~242-615 passengers (Table 31). This suggest that the
event may delay ~10,000-30,000 passengers (= ~40.2-50.4 polar flights x ~242-615 passengers per polar flight).
Table 31. Estimated number of passengers transported by various aircraft models flying polar routes.
Manufacturer Model # of Passengers
Airbus
A3401 250-475
A3502 280-366
A3803 489-615
Boeing
B7444 376
B7775 313-396
B7876 242-330
Range 242-615 1http://www.aircraft.airbus.com/aircraftfamilies/previous-generation-aircraft/a340family/ 2http://www.aircraft.airbus.com/aircraftfamilies/passengeraircraft/a350xwbfamily/ 3https://www.emirates.com/us/english/flying/our_fleet/emirates_a380/emirates_a380_specifications.aspx 4https://www.delta.com/content/www/en_US/traveling-with-us/airports-and-5aircraft/Aircraft/boeing-747-400-744.html 5http://www.boeing.com/commercial/777/#/design-highlights/characteristics/777-200er/ 6http://www.boeing.com/commercial/787/by-design/#/787-10-characteristics
Our next step involved establishing the length of time that these passengers are delayed and the value of their
lost time. We assumed that all passengers on these flights are delayed ~124-209 minutes, reflecting lower and upper
bounds on the time savings associated with example polar routes (Table 28) [AMS, 2007]. Although this information is
not a representative sample of all polar routes (i.e. 4 of ~16 routes as previously discussed), we were unable to obtain
more precise information from the literature or via stakeholder discussions. We then noted the average value of this lost
passenger time at ~$47.10 per person per lost hour (Department of Transportation, 2016). The estimate is also known
64
as the Value of Travel Time Savings (VTTS) and values lost travel time for intercity flights at $36.10 per person per
hour for personal travel and at $63.20 per person per hour for business trips. Noting a distribution between personal and
business travel that is 59.6% to 40.4%, the weighted average value equates to ~$47.10 per person per lost hour (or $0.785
per minute). Note that the vast majority of polar routes connect the US Eastern seaboard to Asia. If polar routes involve
a larger proportion of business-related travel relative to all flights on average, using the average value of lost time may
understate the economic impact. Moreover, it is unclear what percentage of people on these flights are U.S. citizens.
We therefore simply assume ~90%, to be consistent with our previous assumption about the percentage of polar flights
operated by U.S. carriers. Multiplying these estimates together, we arrived at a cost to passengers of $0.9-5 million
(=~10,000-30,000 passengers x ~124-209 minutes delayed x ~$0.785 per minute x 0.9 U.S. citizens).
6.3.2.b. More Extreme Event Scenario
Under more extreme conditions, we estimate space weather impacts that could cost U.S. airline passengers ~$6-
200 million. This estimate is also based on the value of lost passenger time of ~$47.10 per hour (~$0.785 per minute),
as outlined in our moderate event scenario. Recall that our extreme scenario assumes that ~200-6,000 domestic flights
are cancelled in the US. This may in turn potentially impact ~80-90 passengers per flight (see Table 30 and footnotes
for details). Note that the average lost time per cancellation (e.g. rebooking process, etc.) has been estimated at ~457
minutes per passenger [FAA, 2016]. This suggest total costs to passengers of our extreme event that may be ~$6-200
million (=200-6,000 cancelled flights x ~80-90 passengers per flight x 457 minutes per passenger x $0.785 per minute).
6.4 Aviation References
American Meteorological Society, 2007. Integrating Space Weather Observations & Forecasts into Aviation
Operations. American Meteorological Society & Solar Metrics Policy Workshop Report
Baker, D.N. and L.J. Lanzerotti. 2016. Resource Letter SW1: Space Weather. American Journal of Physics. Vol.
84, No. 3.
Bütikofer, R., E.O. Flückiger, L. Desorgher, and M.R. Moser. 2008. “The extreme solar cosmic ray particle event on
20 January 2005 and its influence on the radiation dose rate at aircraft altitude.” Science of the Total
Environment. Volume 391, Issues 2-3. Pages 177-183.
Campbell, A., S. Buchner, E. Petersen, J. B. Blake, J. Mazur, and C. S. Dyer (2002), SEU measurements and
predictions on MPTB for a large energetic solar particle event, IEEE Trans. Nucl. Sci., 49, 6, 1340-1344.
Cannon, P.; Angling, M., Barclay, L., Curry, C., Dyer, C., Edwards, R., et al., 2013. Extreme space weather: impacts
on engineered systems and infrastructure, UK Royal Academy of Engineering, London, ISBN 1-903496-95-0.
Department of Transportation, 2016. The Value of Travel Time Savings:
Departmental Guidance for Conducting Economic Evaluations.
Dyer, C. S., F. Lei, S. N. Clucas, D. F. Smart, and M. A. Shea (2003), Solar particle enhancements of single event
effect rates at aircraft altitudes IEEE Trans. Nucl. Sci., 50, 6, 2038-2045, doi: 10.1109/TNS.2003.821375.

65
Dyer, C.S., Truscott, P., Sanderson, C., et al. 2000. Cosmic radiation effects on avionics, an increasing hazard in the
new millennium, in: Presented at 22nd International Congress on Aeronautical Sciences, Harrogate, UK,
September 2000.
Federal Aviation Administration (FAA), 2016. Update to the Business Case for the Next Generation Air
Transportation System (NextGEN) based on the Future of the NAS Report. Available at:
https://www.faa.gov/nextgen/media/BusinessCaseForNextGen-2016.pdf
Getley, I. L., M. L. Duldig, D. F. Smart, and M. A. Shea (2005), Radiation dose along North American
transcontinental flight paths during quiescent and disturbed geomagnetic conditions, Space Weather, 3, 1,
S01004, doi: 10.1029/2004sw000110.
Getley, I. L., L. G. I. Bennett, B. J. Lewis, B. Bennett, C. S. Dyer, A. D. P. Hands, and M. L. Duldig (2010),
Evaluation of new cosmic radiation monitors designed for aircrew exposure assessment, Space Weather, 8, 1,
S01001, doi: 10.1029/2009sw000492.
Jones, J.B.L., R.D. Bentley, R. Hunter, R.H.A. Iles, G.C. Taylor, and D.J. Thomas. 2005. “Space weather and
commercial airlines.” Advances in Space Research. Volume 36, Issue 12. Pages 2258-2267.
Lantos, P., and N. Fuller (2003), History of the solar particle event radiation doses on-board aeroplanes using a semi-
empirical model and Concorde measurements Radiation Protection Dosimetry, 104, 3, 199-210.
NavCanada, 2016. The Next Level. 2016 Annual Report.
National Oceanic and Atmospheric Agency (NOAA). 2004. Service Assessment: Intense Space Weather Storms
October 19-November 7, 2003.
Normand, E. (2001), Correlation of In-flight Neutron Dosimeter and SEU Measurements with Atmospheric Neutron
Model, IEEE Trans. Nucl. Sci., 48, 6, 1996-2003, doi: 10.1109/23.983162.
7. Key Findings and Conclusions
This study advances our overall understanding of the potential impacts of space weather and in addition to
stimulating timely discussions, provides a solid, tractable foundation for future work. The systematic approach
developed for exploring and synthesizing the many qualitative and quantitative complexities of this topic can also be
readily applied to other sectors known to be impacted by space weather (e.g. trains, pipelines). Further, this study is
based on scientific and engineering literature addressing space weather events, and expert stakeholder understanding of
the physical effects and key concerns. Below we summarize several initial key findings from this study:
1. Space weather impacts are a real concern
The concept of “space weather” has advanced over the past decade from something mostly known to space
researchers to a topic of concern to policy specialists, public officials, and many in the general public. Specifically, three
key policy efforts were recently issued regarding space weather: the October 2016 Executive Order entitled
“Coordinating Efforts to Prepare the Nation for Space Weather Events,” the “Space Weather Action Plan” issued by the
Office of Science and Technology Policy in October 2015, and the “Space Weather Research and Forecasting Act”
introduced as Senate Bill 2817 in April 2016. There is also traction internationally, with a handful of other
socioeconomic impact studies underway, as well as a United Nations and US workshop on the International Space

66
Weather Initiative held August 2017. Industry stakeholders contacted for this study demonstrated evidence that space
weather has the potential to cause significant impacts and support the development of improved understanding of the
hazards, risks, and costs.
2. Stakeholders are interested and committed to helping
Contrary to popular belief, industry stakeholders have been very forthcoming with information; this may be in
part related to the fact that they have a vested interest in the quality of the research that is being done. Stakeholders were
very responsive to our inquiries. They emphasized the importance and challenges involved and generously provided
their time, insights, and feedback to help guide and strengthen our endeavor. Stakeholders were also able to readily
discuss and connect the physical effects identified for their sector to our five different impact categories. Many
emphasized, however, that almost all of the impacts we identified also apply to other non-space weather hazards.
Overall, stakeholders helped shape our ultimate approach and inform our assumptions, and were thrilled that this effort
aimed to capture their understanding and perspective on the issue.
3. Impacts are complex and not well understood
The social and economic impacts of space weather intersect the fields of physics, engineering, industry
operations, and economics. A limited number of previous studies have assessed the social and economic impacts of
space weather. Some of the complexities include modern society’s lack of a direct experience of a severe space weather
event, the rapidly evolving technological advances, and impacts that are not directly proportional with storm magnitude.
Though our study initiated as an economic-centric approach, it was quickly evident that the problem first requires
analytical mapping of space weather events and the physical effects by sector to the downstream social and economic
impacts. Additionally, stakeholders engaged in this study emphasized that it is intractable at this point in time to
rigorously connect the magnitude of a space weather event to our list of physical effects and ultimately to the types and
sizes of the impacts that may result. To this end, we developed an analytical framework that accounts for much of the
complexity and can accommodate additional information as it is acquired. Our study produced cost estimates using
expert opinion and existing data and identified additional research needed to further refines these estimates including the
estimation technique.
4. Demonstrated value of defensive investments and SWPC science
The estimated costs of proactive measures that prevent impacts are low compared to the impacts that could be
realized during space weather events. Our cost estimates suggest that preventative expenditures associated with
Defensive Investments and Mitigating Actions tend to be small relative to the much larger potential costs that result from
the other impact categories including Asset Damage, Service Interruptions, and Health Effects. These proactive costs
are an indication that such investments might payoff, though we did not explore the reduction in economic impacts
enabled by Defensive Investments or Mitigating Actions. Scientific research on space weather contributes knowledge
that is essential for designing and engineering robust and safeguarded systems Stakeholders discussed the central
importance of space weather products and services as trigger points for Mitigating Actions such as the forecasts and
67
alerts provided by NOAA’s SWPC (Figure 1). Many stakeholders also noted that a severe event may cause
disproportionate impacts in regions that do not experience more moderate space weather events since they lack the
familiarity, training, and preparedness that accompanies more frequent exposure to potentially hazardous conditions.
5. Applicability of study to the value of NOAA’s investments and to inform program planning
This study has implications to help inform the value of science and forecasting investments and to improve the
focus of investments relevant to societal outcomes (e.g. areas subject to significant impacts). A necessary first step in
assessing the value of improving NOAA’s forecasting capabilities is the ability to estimate the economic impacts. These
economic impacts cannot be estimated without understanding the impact of space weather across key technological
sectors. Only after these impacts are understood, a value chain linking research and forecast investments to societal
outcomes can then be produced and used to make decisions about where to invest. Specifically, NOAA can prioritize
investments in new products and services that demonstrate a clear linkage to improving societal outcomes. This effort
is the critical first step towards developing an approach for transparently establishing priorities that maximize societal
value.
Additionally, the analytical framework developed in this study identifies some initial information on who uses
NOAA’s products, services, data and science; how they use it; and how they benefit from it. While specific NOAA staff
might have access to this information, a concerted effort should be made to identify the information that is being
collected, how it can be used in programmatic evaluation and planning, and how to make it accessible. One possible
approach discussed amongst the study team and relevant for this study is to release the final report with a request and
mechanism that will allow anyone to respond to the findings. This might entail, for example, the establishment of a
dedicated email account or Google Form inviting feedback and comments. This would allow a wider variety of
individuals to constructively contribute their knowledge and thoughts to this effort. This repository of input could help
establish future collaborates and also provide a wealth of ideas for future work to pursue.

68
8. Recommended Next Steps
The goals of this initial NOAA effort were to capture, synthesize, and share what is currently known about the
social and economic impacts of space weather. In order to advance our collective understanding of this important but
not well studied topic [Eastwood et al., 2007], we encourage others to challenge, expand, and refine what is presented
herein. We furthermore recommend the following next steps that we think are essential for this is to become a more
tractable research problem that others can productively contribute their knowledge and expertise to. Next steps are listed
in order of priority, with short-term steps requiring relatively less effort that escalate into longer-term steps requiring
more substantial effort.
Critical Review
This interdisciplinary study spans a large number of scientific, engineering, and economic topics. We tried our
best to carefully include essential technical details and key concepts from each of these fields into our analysis. Although
our effort was guided by extensive input and iterative feedback from stakeholders and experts, it is important for this
report to be further critically reviewed by knowledgeable individuals not yet engaged. To this end, the study team will
be submitting this work to a journal for publication at the conclusion of this project. In addition to the critiques and
revisions that will accompany the peer-review process, contributing our analysis to the literature is essential for
stimulating much needed research interest and attention on this topic.
Discuss Findings
This initial effort attempts to fill a large knowledge gap that is essential to other ongoing efforts and timely
discussions within the U.S. and abroad. The contents of this report should be considered preliminary and this document
viewed as a tool for stimulating critical discussions that need to occur within and across different technological sectors,
institutions, and disciplines. To this end, we recommend that NOAA and/or other entities use this document as a
mechanism for soliciting input, fostering dialogue, and building the working relationships necessary for advancing our
understanding of this important but challenging real-world issue. This could occur, for example, via round table
discussions, the establishment of a dedicated email account, and/or an online community forum. It is essential to create
a variety of easy opportunities for a wider variety of individuals to contribute their knowledge and this would also help
foster future collaborations.
Establish Best Practices
The growing recognition of space weather’s ability to cause social and economic impacts has led to a handful
of recent and concurrent studies on the topic by other countries and research institutions [e.g. National Research Council,
2008; Biffis and Burnett, 2017; Oughton, 2017; Luntama et al., 2017]. Our study team has had limited but insightful
interactions with representatives of these other efforts. At the 2017 Space Weather Workshop, for example, we came
together for a day-long exchange to better understand similarities and differences in terms of project scopes, challenges,
and methodologies. We collectively agreed that at the conclusions of our independent efforts, it would be fruitful to
more thoroughly debrief and discuss our experiences as well as compare and contrast our different studies including
approaches and findings. This could, for example, lead to a clear articulation of the various challenges inherent to this
69
type of an analysis and the establishment of best practices for studying space weather impacts. This can help guide those
wishing to conduct similar studies, allowing them to learn and build from these early efforts. This is also important since
some of these efforts are not yet, and may not become, publically available.
Conduct Case Studies
This study establishes an initial, transparent methodology for deriving quantitative estimates of various
categories of impacts across our four different sectors of interest. Our effort was in part restricted by our inability to find
well documented, detailed accounts of impacts observed during historic space weather events. A more extensive
consideration, application, and verification of our estimation techniques to the impacts that we have collectively observed
as a society, in the form of case studies, should be central to future efforts. At this point in time, for example, it is unclear
whether or not the information necessary for this recommended next step exists and/or is publically available. Clearly
establishing what needs to be known in the advent of an event will enable the rapid collection, rigorous assessment, and
quantitative reporting of impacts associated with any future events. This has been essential for strategically managing
and responding to other natural hazards (e.g. hurricanes, tornados, earthquakes, tsunamis, etc.). This is especially timely
since we are entering a new solar cycle, with an anticipated upswing in solar activity.
Analyze Sensitivity
This study identifies key variables and parameters that need to be known in order to estimate impacts. In many
instances, we were unable to find the appropriate data for constraining these inputs and therefore relied upon expert best
judgement or used order of magnitude assumptions based on available but coarse information sources. A more robust
exploration of estimate sensitivity and parameter space would help diagnose where more detailed information is
necessary for reducing the uncertainties in our cost estimates. For example, it would be helpful to at the very least
understand which inputs change our cost estimates by factors versus by orders of magnitudes.
Add Context
This study explored the full spectrum of potential impacts and then, considered in more depth those that seemed
to be the most significant as identified by stakeholder discussions. Before refining these estimates or proposing
additional estimates for impacts not quantitatively covered in our report, we recommend adding context to the numbers
presented herein. This could include an assessment of how potential costs compare to other costs within the industry
including those imposed by other natural hazards and also how these costs may be increasing or decreasing with time to
better understand what issues may be growing or diminishing within these industries. Such context is essential for truly
understanding the importance of these impacts and can help establish clear priorities for future research.
Update Estimates
Research on this topic requires a sustained attention and iterative effort for it to advance and keep pace with our
growing technical understanding of space weather and our modern society’s rapidly evolving dependence on potentially
vulnerable technologies. Impacts not only depend on technologies but also on various business and governmental
changes. The opening of Russian airspace for polar flights, for example, introduced new airline vulnerabilities to

70
moderate space weather events. Policies instated across the power sector, including those by Federal Energy Regulatory
Commission (FERC) and National Energy Regulatory Commission (NERC), may soon reduce the probability of impacts
to electricity across all sized space weather events. A better understanding of impacts will occur through many different
U.S. Space Weather Action Plan (SWAP) efforts including the finalization of benchmarks for an extreme event
[Executive Office of the President, 2017] and the vulnerability assessments of our nation’s Critical Infrastructure
[Executive Office of the President, 2015a,b]. Keeping pace with change and incorporating the results of concurrent
efforts is essential if this work is to stay current and relevant to decision making and policies.
Explore Interdependencies
This study independently considers impacts to the U.S. of space weather events resulting from four different
technological sectors. We did not consider impacts that may result, for example, due to the known effects of space
weather on other important sectors (e.g. trains, pipelines, etc.). We also did not consider potentially more catastrophic
scenarios due to the known coupling between different sectors and also different space weather phenomena. Nor did we
explore any of the international dimensions of this problem, including impacts that may result abroad as a result of U.S.
impacts or else impacts that may result in the U.S. due to the impacts of space weather on other countries. These
additional considerations and complexities should be carefully examined and considered as we begin to better understand
impacts across different sectors and across different countries.
8.1 References
Biffis, E. and C. Burnett. 2017. Report on the UKSA-funded IPSP SWx/SWe socio-economic study. Report on the
ESA Space-Weather Socio-Economic Study L5 in Tandem with L1: Future Space-Weather Missions
Workshop. March 6-9, 2017
Eastwood, J.P., E. Biffis, M.A. Hapgood, L. Green, M.M. Bisi, R.D. Bently, R. Wicks, L.A. McKinnel, M. Gibbs, and
C. Burnett. 2017. The Economic Impact of Space Weather: Where Do We Stand? Rick Analysis, Vol. 37,
No. 2
Executive Office of the President, 2015a, National Space Weather Strategy.
Executive Office of the President, 2015b, National Space Weather Action Plan. Product of the National Science and
Technology Council.
Executive Office of the President, 2017. Space Weather Phase I Benchmarks. Product of the Space Weather
Operations, Research, and Mitigation Committee of The National Science and Technology Council.
Luntama, J.P, N. Bobrinsky, and S. Kfraft. 2017. Report on the ESA Space-Weather Socio-Economic Study L5 in
Tandem with L1: Future Space-Weather Missions Workshop. March 6-9, 2017
National Research Council. 2008 Severe Space Weather Events – Understanding Societal and Economic Impacts: A
Workshop Report. National Academies Press.
Oughton, E. 2017. Report on the Cambridge SWx/SWe Socio-Economic Study, Report on the ESA Space-Weather
Socio-Economic Study L5 in Tandem with L1: Future Space-Weather Missions Workshop. March 6-9, 2017