social advertising using facebook - agecon search · 1 . social advertising using facebook: some...
TRANSCRIPT

1
Social Advertising Using Facebook:
Some Experimental Results Using Duck Dynasty Ads to Promote Rural Tourism in Mississippi Working Paper 2323-14 Department of Agricultural Economics Mississippi State University
Selected Paper for presentation at the 2014 Southern Agricultural Economics Association Annual Meeting, February 1-4, 2013, Dallas, TX
James Barnes, Ph.D. Assistant Extension Professor Department of Agricultural Economics Mississippi State University Email: [email protected] (662) 325-1796
Kalyn Coatney, Ph.D. Assistant Professor Department of Agricultural Economics Mississippi State University Email: [email protected] (662) 325-7983

2
Social Advertising Using Facebook:
Some Experimental Results Using Duck Dynasty Ads to Promote Rural Tourism in Mississippi
Abstract:
In this paper, we explain how the Mississippi Bricks to Clicks Extension
Program assisted in the promotion of a rural tourism event using Facebook
paid advertisements. We estimate a binomial regression model to explore
the factors that affect business page likes. Implications for future research
and Extension programming are discussed.
Key Words: Facebook economics, rural tourism, social advertising,
Mississippi Bricks to Clicks, rural business
JEL: L26, M31, M37
Selected Paper for presentation at the 2014 Southern Agricultural Economics Association Annual Meeting, February 1-4, 2013, Dallas, TX

3
Introduction
Social advertising has received significant attention since the introduction of innovations
such as Facebook, Twitter, and other social media platforms. For example, Facebook now has
over 1.1 billion followers so it stands to reason that social advertising could be beneficial to
many organizations, institutions, and businesses of any type. And with the increase in mobile
users via smartphones (e.g. iPhones, Android and Windows), many mobile advertising options
also exist. For example, Facebook offers advertising aimed at the type of device a user may be
using, both desktop and mobile platforms. This has provided access to an enormous, online
market of potential customers that can be reached through paid advertisements.
But much remains unknown about the use of social media platforms and what we call
“the profit gap.” The profit gap is the gap between engaging with fans on social media and actual
sales of products or services. For example, Facebook businesses can establish a page for their
respective businesses. They can also use paid advertisement campaigns to boost their posts,
increase the number of page likes, and much more. But how does the acquisition of more likes
translate into more sales? This is a critical assumption about using social media; by connecting
with potential customers, the probability of selling a product or service increases, other things
equal. This is a testable hypothesis provided a business owner has data regarding page likes and
sales. However, to our knowledge, that kind of study has not been conducted yet.
However, the first step in understanding more about the profit gap is to understand the
factors that drive the acquisition of more Facebook page likes. Two options exist. First, a
business owner can do his/her own engagement with fans through promotions to provide
incentives for fans to share and like posts with their respective friends. This increases the
probability of a business owner’s produce/service being seen by others in these friend networks.

4
Second, a business owner can choose to pay Facebook for marketing assistance through the
promotion of posts, promotion of his/her website, etc. One paid advertisement option is
increasing the number of likes for a business page. In this paper, we focus on this last option and
use data from a natural experiment to understand the relationship between page likes and other
factors we believe to be economically important. The paid advertisement campaign was
conducted from September 12 to October 12, 2013 for the Woodville Deer and Wildlife Festival
Facebook page. The annual event was held in Woodville, Mississippi starting on October 12.
The Wilkinson/Woodville County Chamber of Commerce inquired about using Facebook
advertising after participating in a new Extension program called Mississippi Bricks to Clicks.
We worked with chamber and Facebook to craft four advertisements. The 2013 event was
different than past events in a special way: The chamber had decided to bring A&E’s Duck
Dynasty Star John Godwin to the event from 11 a.m. to 2 p.m. on the day of the event. As a
result, each of the four advertisements created within Facebook were structured using some
information about the presence of Duck Dynasty.
This paper has six parts. First, we review the literature on social advertising and focus on
its growth in the larger social media networks such as Facebook, Twitter, and others. Within this
literature, we examine the types of social advertisement experiments conducted and highlight the
lessons learned from recent studies. Next, we explain the natural experiment that took place
within Facebook to market the presence of Duck Dynasty at the annual Deer and Wildlife
Festival in Woodville, Mississippi. We provide summary statistics and effectiveness measures
collected by Facebook during each of the campaigns. We unearth the most successful mobile and
desktop campaigns used to gain more likes. Next, we describe the conceptual model we
developed to understand the relationship between page likes and other important factors. We

5
then explain the data, empirical model, and results. We conclude by discussing future research
plans and how this empirical process can inform about the design and redesign of Extension
programs, and in this case, the Mississippi Bricks to Clicks Program. To our knowledge, this
represents the first paid advertising experiment conducted in Facebook with the promotion of a
rural event in mind where the goal was to model page likes across natural experiments and
considering both paid and organic advertisement effects. We suggest several lessons learned that
can be used by business owners conducting Facebook advertisements, social media consultants,
researchers and Extension economists conducting social media Extension programs around the
country.
The Social Advertising Literature
The social advertising literature is vast and it is well beyond the scope of this paper to
summarize all the literature. Instead, we focused on social networks, Facebook experiments and
any related studies in the field of agricultural food systems, value-added businesses and small
business development. Using Mississippi State University’s online library, we located 35
articles, reports and industry studies that related to one of our three areas of interest. MSU’s
library aggregates its databases, digital collections, and online catalog, and also has EBSCO as
its discovery search tool, which contains more than 300 full text and secondary aggregated
databases. Additional queries using the key terms were also carried out using the search engines
“Google,” “Google Scholar,” and “Bing.” The results dated in range from 1997-2013.
The initial category of searches were for a concept we defined as “social media
marketing” and aimed to supplement the introduction to the research topic; it provided articles
that could serve as a general overview of advertisements through the use of social media. These
searches were conducted using key words such as “social media advertising,” “online social

6
advertising,” “social media marketing industry,” “social media advertising and business,” “social
media effectiveness,” and “online advertising.” 9 of the 35 titles found were included in this
category.
For the second category of searches, we limited our focus strictly to social media
advertising and/or marketing through Facebook. This concept was deemed as “Facebook
advertising,” and the targeted terms used in searching were: “Facebook advertising and
effectiveness,” “Facebook and social network advertising,” “Facebook and small business”
“company targeted advertising with Facebook,” “Facebook and business,” and “Facebook
experiment.” Particular attention was given to studies involving experiments with ads in
Facebook. In total, 16 of the 35 titled articles were included under this concept.
In an effort to refine the topic of this synthesis even further, the third category of searches
carried out was exclusive to the use of Facebook as it relates to the food marketing and/or
tourism industries. This concept was termed with the phrase “Facebook advertising and food
marketing.” Keywords included in the searches for literature relevant to this topic include:
“Facebook food marketing,” “Facebook and food,” “social media and tourism,” “social media
and event promotion,” and “Facebook and tourism.” Of the 35 titled articles found, 10 were
contained within this categorical concept. These 10 studies are the most relevant to our work
within Facebook advertising, rural tourism, and small business development.
Facebook advertising experimentation may be required for each organization, institution
and business to learn what works within Facebook. That was the conclusion drawn by Chan
(2012) after conducting an experiment for an academic library in Hong Kong. He also concluded
that the use of social messaging was an effective component of successfully marketing an
academic library. He noted that while he only studied a Facebook advertising experiment from

7
one institution’s perspective, his work provided a basis for future research as other academic
libraries may consider using Facebook for marketing purposes. But other studies have been more
business focused and have answered some part of the “profit gap” issue.
For example, studies by Wang and Chang (2013), Forrester (2012), Haigh et al (2012)
and Lee et al (2012) explore the connection between Facebook page engagement with users and
the impact those engagements have on the intent to purchase products or services. Wang and
Chang (2013) found that production information shared with customers who had strong
friendships (ties) increased the probability of purchasing the product or service. Forrester (2012)
points to the fact that fans of brand on Facebook are far more likely to purchase the product or
service offered as compared to non-fans. Haigh et al (2012) concluded an organization should
employ the corporate social responsibility communication strategy when engaging with fans to
boost public value of an organization. Further, regardless of the strategy employed, interacting
with fans contributes to an enhanced value associated with organizational-public relationships,
corporate responsibility, attitudes, and purchase intent. Finally, Lee et al (2012) found that when
fans have an emotional attachment or interaction with an event Facebook page, fans perceive
greater value from social marketing.
In concert, these studies have attempted to bridge the gap between the use of social media
and its usefulness in business to make profits. Although these early studies point to the fact that
greater engagement on a Facebook page increases the probability of purchase intent, much
remains unknown about the use of social media marketing and business prosperity because of it.
Simply put, we lack empirical evidence of the connection. In this paper, we take an initial step to
bridge this gap by developing a conceptual model that explains the factors that drive the
acquisition of Facebook likes, a necessary step that is a must if actual purchases of products

8
and/or services are to occur at a later time period. In what follows, we identify the role of organic
and paid advertisement engagements in a Facebook advertising conceptual model, explain the
natural experiment involving Duck Dynasty in Woodville, Mississippi, and estimate a binomial
regression model that identifies the key factors that drove the acquisition of likes during this
natural experiment.
The Duck Dynasty Experiment
Starting in the fall of 2013, we launched a new community and economic development
Extension program at Mississippi State called Mississippi Bricks to Clicks. The purpose of the
program is take a group of small businesses and assist them with launching their own social
media strategies which typically requires the creation of new social media accounts and learning
how to use each social media platform. The program also teaches business owners how to use
iPads and productivity applications to manage their businesses more efficiently. In concert, the
program provides a dose of technology and knowledge about how to use social media to increase
business profits.
From mid-June until the first of September 2013, six businesses in Woodville,
Mississippi participated after the Wilkinson/Woodville County Chamber of Commerce took the
lead to have the program implemented in Woodville. The Executive Director Polly Rosenblatt
played an important part in having the pilot program in Woodville. During the next several
weeks, business owners learned about iPad applications and how to manage their newfound
social media tools, namely Facebook. We decided to focus exclusively on Facebook at the
request of the businesses. Each business received technical assistance to develop a new Facebook
page. At the end of the classes, Polly Rosenblatt requested that we also assist with using

9
Facebook advertising to help promote their annual Deer and Wildlife Festival (DWF) held in
Woodville. We agreed. Admittedly so, this was the first time we had engaged directly with
Facebook to create specific advertisements that would feature the main attraction for 2013’s
festival: A&E Duck Dynasty star John Godwin. In what follows, we describe the advertisements
created and document various aspects which might be useful for other business owners to learn.
Duck Dynasty’s John Godwin and the Deer Festival
We began by educating the chamber about the various options to promote their DWF
Facebook business page: https://www.facebook.com/WoodvilleFest. With input from the
chamber, we decided to promote the page to increase its number of likes. We consulted
Facebook’s website and learned of a new program, Start to Success. The program provides direct
technical assistance four times over the course of a thirty day campaign. The minimum
advertisement investment recommended equaled $1,500 for a thirty day period. The chamber
approved. The next step was to create specific advertisement messages.
To create messages, we consulted the social advertising literature and located a paper by
Tucker (2010). We followed some of the structure for advertisements found in Tucker (2010).
Other details were provided by an advertising agent at Facebook. Figures 1-3 shows the images
of John Godwin that were used across four campaigns for mobile and desktop advertisements.
Figures 4-6 show the actual advertisements created using the various images. But this was not a
typical experiment where a set of advertisements were selected and then the advertisements were
allowed to run to a completed state over some time period. Instead, this process represented a
natural experiment. At the end of week one, we had our first phone conference call with
Facebook to optimize our ads across both platforms. We did this each week. In some cases, we

10
were recommended to change photo images to increase the number of impressions gained for the
advertisements. Facebook defines impressions as number of times an ad was viewed. We
changed the desktop campaign as noted in the figures. The mobile campaign was very successful
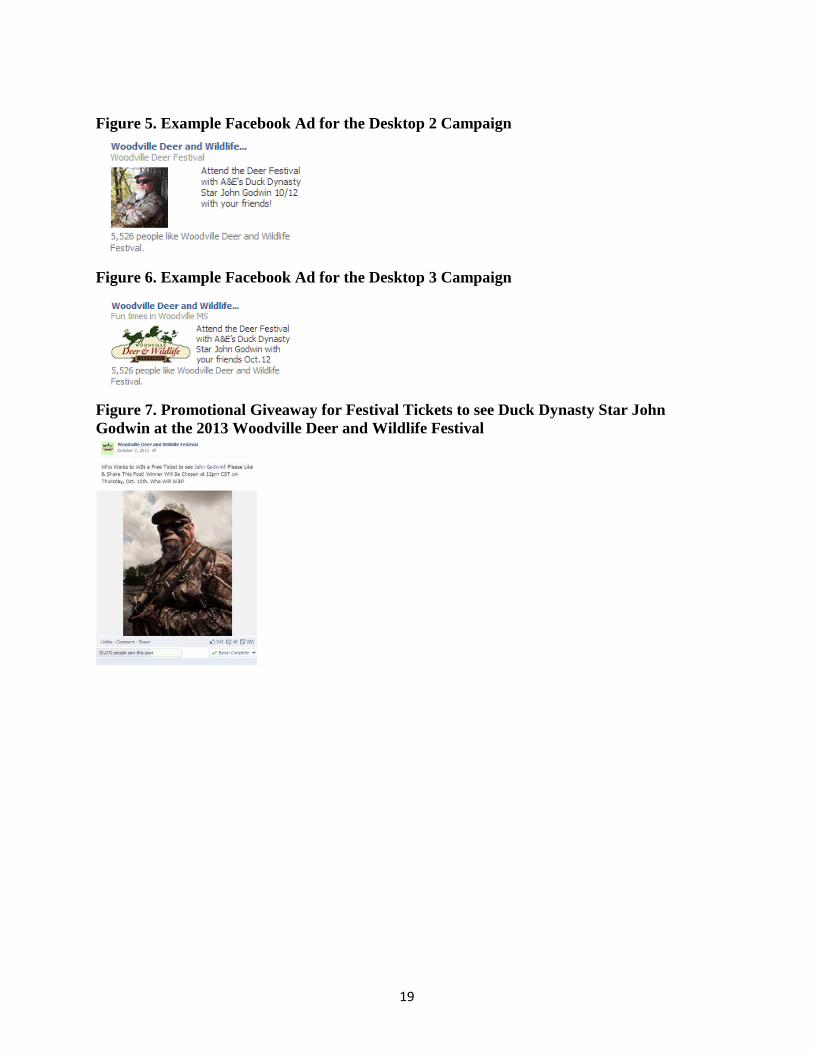
and was never changed throughout the thirty days. Finally, we conducted a promotional
giveaway on October 7th: We gave away two free tickets to see John Godwin at the event. Fans
were asked to share and like the post. The post reached more than 20,000 people, 40 comments,
280 shares and 345 likes within nine hours of posting (Figure 7).
Table 2 shows the messages and targeted area for the DWF page advertisements. The
target region was selected as those individuals 18 and older, living within 150 miles of
Woodville, Mississippi, who had a strong affinity for having liked similar pages were discussing
various topics on Facebook related to the DWF event (targeted using hashtags). We used four
similar, yet slightly different messages. We used the words “Don’t Miss”, “Fun Times”, “Eat
Alligator” and “Attend” as the call to action wording in our advertisements. Each of the first
three advertisements associated “Don’t Miss”, “Fun Times”, and “Eat Alligator” with Duck
Dynasty’s John Godwin (Table 3). Only one advertisement used the statement “with your
friends”: the fourth advertisement in Table 2.
With these advertisements in place, we began this natural experiment on September 12th
with an ending date of October 12th, the day of the DWF event in Woodville. At the end of week
one, we visited via conference call with our Facebook ad agent. She recommended that, based on
early performance, we stop running some ads and keep the high performing ones and run them
another week. At the end of each week, we would “optimize” advertisements – the process of
removing advertisements that were underperforming and shifting our daily budget of $25 for
mobile and $25 to the remaining advertisements. This process required that we change the
11
desktop image twice from the original image of John Godwin. Mobile remained in place
throughout the entire thirty days because of its high performance.
Table 3 shows the experimental results for each advertisement. Desktop 1, 2 and 3 and
mobile results are provided. Desktop 2 gained the highest number of impressions and social
impressions among desktop advertisements. And although mobile only had 100,366 impressions,
it led all advertisements in the number of clicks, yet trailed all others in the number of social
clicks (see table 4 for a detailed definitions for Facebook advertisement performance metrics
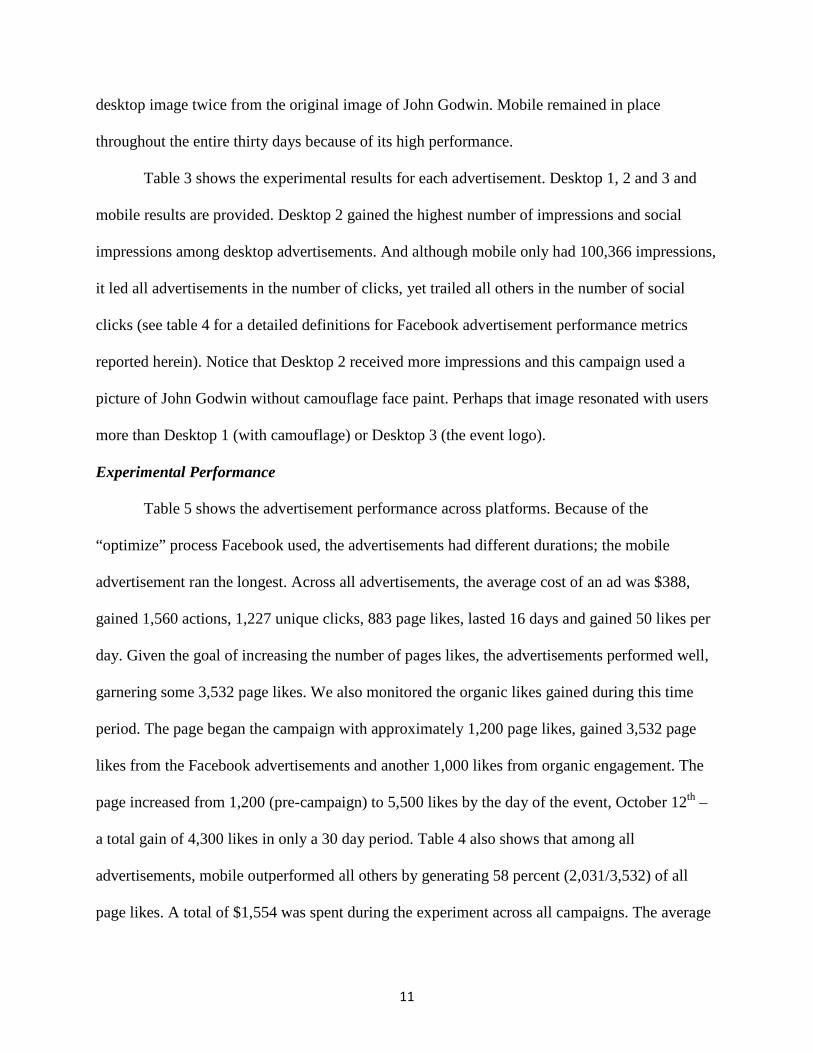
reported herein). Notice that Desktop 2 received more impressions and this campaign used a
picture of John Godwin without camouflage face paint. Perhaps that image resonated with users
more than Desktop 1 (with camouflage) or Desktop 3 (the event logo).
Experimental Performance
Table 5 shows the advertisement performance across platforms. Because of the
“optimize” process Facebook used, the advertisements had different durations; the mobile
advertisement ran the longest. Across all advertisements, the average cost of an ad was $388,
gained 1,560 actions, 1,227 unique clicks, 883 page likes, lasted 16 days and gained 50 likes per
day. Given the goal of increasing the number of pages likes, the advertisements performed well,
garnering some 3,532 page likes. We also monitored the organic likes gained during this time
period. The page began the campaign with approximately 1,200 page likes, gained 3,532 page
likes from the Facebook advertisements and another 1,000 likes from organic engagement. The
page increased from 1,200 (pre-campaign) to 5,500 likes by the day of the event, October 12th –
a total gain of 4,300 likes in only a 30 day period. Table 4 also shows that among all
advertisements, mobile outperformed all others by generating 58 percent (2,031/3,532) of all
page likes. A total of $1,554 was spent during the experiment across all campaigns. The average

12
cost per campaign ranged from $0.37 (Mobile) to $0.62 (Desktop 3) (Figure 8). Figures 9 and 10
showed again that mobile was king of all advertisements. Finally, we show the actions across all
ads by city. Woodville led all cities with more than 8,000 actions of engagement during the
campaign. Other cities within the 150 mile radius are also shown.
Conceptual Model
The goal of the Facebook advertisement campaign was to increase the number of page
likes for the DWF Facebook page. To that end, page likes certainly did increase. But which
factors contributed to this process of gaining likes? If average cost ranged from $0.37 to $0.62,
then what was the marginal cost of acquiring an additional like? In what follows, we identify a
conceptual model that begins to answer some of these questions. As we noted before, we believe
the first step in understanding the “profit gap” is to first understand the relationship between
page likes gained during a paid advertisement campaign (or multiple campaigns) and intuitive
factors that affect those acquisitions.
We hypothesize that the following relationship holds for the key factors driving page
likes:
Page Likes = F (Campaigns, Organic advertising, Paid advertising, time) (1).
We hypothesis that various campaigns will have either adverse or a stimulating effect on page
likes. For instance, mobile devices are used more during leisure than work hours. Therefore, we
expect impressions of the Deer Festival to be higher with mobile devices and subsequently page
likes.
Generally speaking, we hypothesis that organic and paid advertising are significant
factors that drive the acquisition of page likes. Organic advertising is what a business owner does

13
with his/her own engagement with fans through making posts and status updates which include
tagging fans in posts and pictures, and also reciprocating likes and comments on all post
engagements. Often, business owners provide a giveaway of some coupon or some prize to gain
greater access to people within Facebook. The rules of the game are simple: Share and like this
status to be entered into the contest drawing for two free tickets – the very thing we did in the
Duck Dynasty event in Woodville. An increase in shares also increases the probability of friends
seeing friends engaged with the DWF page, for example. And that bodes well for greater
impressions, actions, clicks and eventually page likes, perhaps.
Paid advertisements can be targeted to gain new page likes, which first materialize as
greater impressions, social impressions, actions, and eventually, page likes. Both actions by a
business owner are supposed to increase the probability of gaining more page likes, other things
equal. Hence, both organic and paid advertising are hypothesized to have a positive relationship
with page likes, other things equal.
Data Analyzed
The data for this natural experiment represented four treatments that were conducted
during a 30 day period when Facebook advertisements were used to promote the DWF page by
way of gaining new likes from non-fans. From September 12th to October 12th, four campaigns
were conducted (Desktop 1, Desktop 2, Desktop 3, and Mobile). This provided 63 observations
of daily Facebook advertisement performance for analysis (Table 6). Daily page likes ranged
from 4 to 117. Daily shares of posts made on the DWF Facebook page ranged from 0 to 169. The
average daily amount spent was $24.66; the range was between $6 and $25. The four campaigns
were structured as T1DeskCamo (Desktop 1), T2DeskNoCamo (Desktop 2), T3 Event Logo

14
(Desktop 3) and T4Mobile (Mobile) to represent four alternative treatments in the natural
experiment.
Empirical Model and Estimation
The empirical model we estimate is generally described as:
Page Likes = F (Campaign treatment, Daily Shares, Spent, time) (2).
The basis of comparison for the campaign treatment impacts is the mobile device. We use daily
shares as a variable to proxy organic advertisement and the spent variable to proxy paid
advertisement. In both cases, as people share (daily) we would expect that because of increased
impressions and subsequent actions on the business page (social networking) that the probability
of acquiring page likes would also increase, other things equal. Also, the spent variable was
chosen to represent the investment into paid Facebook advertisement; the more a business owner
spends, the more he/she expects to gain Facebook page likes, other things equal. Spent squared
and daily shares squared were variables included to test for non-linearity regarding organic and
paid advertisement marketing. The time variable is included to account for any unexplained
trends.
The assumptions of ordinary least squares estimation require the dependent variable to be
continuous and normally distributed (McCullagh and Nelder, 1989). Page Likes, the dependent
variable of the model, is discrete count data. Therefore, our strategy is to estimate model (2)
using a generalized linear model. There are many choices of general linearized models such as
normal, gamma, Poisson and negative binomial. We elect to estimate the negative binomial as it
can be derived from the Poisson when the mean parameters are not equal for all members within
the sample population. In our case, the mean population of Page Likes is not identical across the

15
treatments (figure 10). Furthermore, the negative binomial naturally accounts for overdispersion.
Overdispersion is greater than expected volatility than would otherwise be expected given the
assumed distribution. Overdispersion arises, among other things, when i) the counts are not
independent, and ii) the experimental conditions are not perfectly under the control of the
experimenter. Though parameter estimates are unaffected, inference tests are less reliable.
Accounting for overdispersion requires the covariance matrix to be inflated by the degree of
overdispersion. Given the data are collected across time and not conducted in a laboratory
setting, overdispersion is expected.
Results
The results are provided in table 7. The model as a whole is significant in explaining the
variation of page likes. The parameter related to overdispersion was nearly zero indicating the
counts were nearly independent, and the apparent lack of control of the experimental conditions
were fairly adequate. Finally, when interpreting the model parameters it must be kept in mind
that count regression techniques estimate the log of the dependent variable.
Of major interest is the impact of the various advertising campaigns. We find that in
relation to the mobile campaign, page likes are significantly less for all desktop campaigns.
These results indicate that targeting mobile devices are more efficient at garnering page likes at
the same cost.
We find that daily shares significantly impact page likes in a nonlinear fashion. The
signs of the coefficients suggest a U-shaped relationship with an estimated minimum of roughly
50 daily shares. In other words, decreasing/increasing number of page likes are associated with a

16
low/high number of daily shares. Therefore, it appears that increasing page likes requires a
certain level of inertia from people sharing their information.
Given these results, increasing the amount spent significantly increases page likes in a
linear fashion. This result is indicative of positive returns to investment, if and only if, the
probability of later sale is increased. Finally, page likes tend to diminish with time regardless of
changing campaigns,
Concluding Remarks
In this paper, we have attempted to understand the conceptual and empirical nature of the
factors that drive the acquisition of more page likes by examining a natural experiment that took
place in the fall of 2013 in Woodville, Mississippi. From our analysis, we have unearthed the
importance of organic and paid advertisement factors as key to driving the acquisition of page
likes. Practically speaking, a business owner would be better off targeting engagement using
both types of marketing within Facebook. Further, mobile advertisements were a better
investment than desktop advertisements. Incorporating organic engagement that promotes fans
sharing information combined with paid mobile advertisements would seem to bode well for
business owners who are looking to increase the size of their potential market. Other factors may
also drive page likes. We tested only one measure of organic engagement. How do other organic
engagement strategies impact page likes? Do organic engagement strategies differ in their
effectiveness to gain page likes? Future research will attempt to answer these questions and
more.

17
References
Dholakia, U. M. & Durham, E. (2010). One cafe’s chain’s facebook experiment. Harvard
Business Review, 88 (3), p. 26.
Forrester. (2012). The facebook factor: quantifying the impact of a facebook fan on brand
interactions. For Marketing Insights Professionals. [report] Cambridge: Forrester Research,
Inc., pp. 1-15.
Haigh, M. M., Brubaker, P. J. & Whiteside, E. (2012). Facebook: examining the information
presented and its impact on stakeholders. Corporate Communications: An International
Journal, 18 (1), pp. 3--3.
Lee, W., Xiong, L. & Hu, C. (2012). The effect of facebook users’ arousal and valence on
intention to go to the festival: applying an extension of the technology acceptance model.
International Journal of Hospitality Management, 31 (3), pp. 819--827.
Lohse, B. (2013). Facebook is an effective strategy to recruit low-income women to online
nutrition education. Journal of Nutrition Education and Behavior, 45 (1), pp. 69--76.
Mayer, A. B. & Harrison, J. A. (2012). Safe eats: an evaluation of the use of social media for
food safety education. Journal of Food Protection, 75 (8), pp. 1453--1463.
Tucker, Catherine, Social Advertising (February 15, 2012). Available at SSRN:
http://ssrn.com/abstract=1975897 or http://dx.doi.org/10.2139/ssrn.1975897
Wang, J. & Chang, C. (2013). How online social ties and product-related risks influence
purchase intentions: a facebook experiment. Electronic Commerce Research and
Applications.

18
Figure 1. Desktop 1 and Mobile Campaign Image for the Woodville Deer and Wildlife Festival Facebook Advertisement Program, 2013
Figure 2. Desktop 2 Image for the Woodville Deer and Wildlife Festival Facebook Advertisement Program, 2013
Figure 3. Desktop 3 Campaign Image for the Woodville Deer and Wildlife Festival Facebook Advertisement Program, 2013
Figure 4. Example Facebook Ad for Desktop 1 and Mobile Campaigns
19
Figure 5. Example Facebook Ad for the Desktop 2 Campaign
Figure 6. Example Facebook Ad for the Desktop 3 Campaign
Figure 7. Promotional Giveaway for Festival Tickets to see Duck Dynasty Star John Godwin at the 2013 Woodville Deer and Wildlife Festival

20
Table 1. Literature Review Search Process
Search Category Number of
Articles Search Terms
Social Media Marketing 9
Social media advertising, online social advertising, social media marketing industry, social media advertising and business, social media effectiveness, and online advertising
Facebook Advertising 16
Facebook advertising and effectiveness, Facebook and social network advertising, Facebook and small business, company targeted advertising with Facebook, Facebook and business, and Facebook experiments
Facebook Advertising and Food Marketing 10
Facebook food marketing, Facebook and food, social media and tourism, social media and event promotion, and Facebook and tourism.
TOTAL 35 Table 2. Advertisement Messages used for Mobile and Desktop Campaigns Advertisement
Description Social
Message ? Targeted Group Similar Page
Interests Similar
Conversations (#)
Don't Miss the 2013 Woodville
Deer and Wildlife Festival featuring A&E's Duck Dynasty
Star John Godwin
No All people living within a 100
mile radius of Woodville, MS over the age of
18 who are NOT fans of the Deer and Wildlife Fan
Page.
Duck Dynasty, Willie Robertson, Swamp People,
Gander Mountain, Ducks Unlimited, Cabelas, BassPro
#Willie Robertson, #Cabelas, #Ducks
Unlimited, #National Wild Turkey
Federation, #Duck Dynasty
Fun times at the Woodville Deer
and Wildlife Festival featuring
A&E's Duck Dynasty Star John Godwin
No Same Same Same

21
Eat Alligator at the Woodville Deer Festival with A&E's
Duck Dynasty Star John Godwin
No Same Same Same
Attend the Deer Festival featuring
A&E's Duck Dynasty Star John Godwin
with your friends
Yes Same Same Same
Table 3. Woodville Deer and Wildlife Festival Facebook Paid Advertisement Campaign Performance, 2013
Campaign Image Impressions Social Impressions
Clicks Social Clicks
Desktop 1 John Godwin with camouflage face
paint
219,676 99,771 892 75
Desktop 2 John Godwin without camouflage
face paint
259,092 181,830 1,192 55
Desktop 3 Event logo 77,448 37,498 518 13 Mobile John Godwin with
camouflage face paint
100,366 18 2,883 3
Table. 4. Facebook Advertisement Terms and Definitions Variable Name Definition Impressions The number of times a post from your Page is displayed, whether the post
is clicked on or not. Reach is the number of unique people who received impressions of a Page post.
Social Impressions The number of times your ad was viewed with social information. For example, if 3 people see an ad 2 times each and it includes information about a friend liking your Page, it counts as 6 social impressions.
Social Percent The percent of impressions where the ad was shown with social context (i.e. with information about a viewer's friend(s) who connected with your Page, Place, Event, or App).
Clicks Clicks are the total number of clicks on your ad. Depending on what

22
you're promoting, this can include Page likes, event responses or app installs.
Social Clicks The number of clicks your ad receives when it's shown with social information (ex: Jane Doe likes this).
Click Through Rate (CTR)
Click-through rate (CTR) is the number of clicks you received divided by the number of times an ad was shown (impressions) on Facebook.
Social CTR The Social Click Rate is Social Clicks divided by Social Impressions
CPC Cost Per Click is the average cost per click for these ads, calculated as the amount spent divided by the number of clicks received.
CPM CPM is the average cost you've paid to have 1,000 impressions on your ad.
Spent The total dollar amount spend during the campaign across all ads.
Reach Post reach is the number of people who have seen your post.
Frequency Frequency is the average number of times each person saw your ad.
Social Reach Social Reach is the number of unique people who saw an ad with social information. For example, if 3 people see an ad 2 times each that says a friend likes your Page, it counts as 3 social reaches.
Actions The number of unique people who took an action such as liking your Page or installing your app as a result of your ad. For example, if the same person likes and comments on a post, they will be counted as 1 unique person. People's actions are counted within 1 day of someone viewing your ad or 28 days after clicking on it.
Page Likes The number of likes on your Page as result of your ad. Actions occurred within 1 day of someone viewing or 28 days after clicking on your ad
Unique Clicks The total number of unique people who have clicked on your ad. For example, if 3 people click on the same ad 5 times, it will count as 3 unique people who clicked.
Unique CTR The number of unique clicks as result of your ad divided by the number
of unique people you reached. For example, if you received 20 unique clicks and 1,000 unique people saw your ad, your unique click-through rate will be 2%.

23
Table 5. Woodville Deer and Wildlife Festival Facebook Paid Advertisement Experimental Results, 2013
Campaign Dollars Spent
Actions Unique Clicks
Page Likes
Duration of Ad
Likes/Day Ad Frequency
Desktop 1 $306 2,078 737 543 13 41.77 5.34 Desktop 2 $298 1,011 1,092 636 12 53.00 5.23 Desktop 3 $200 433 474 322 8 40.25 2.53
Mobile $750 2,717 2,603 2,031 30 65.52 2.08 Total $1,554 6,239 4,906 3,532 N/A 201 N/A
Average $388 1,560 1,227 883 16 50 4 Figure 8. Woodville Deer and Wildlife Festival Facebook Campaign Average Cost, 2013
Figure 9. Woodville Deer and Wildlife Festival Facebook Campaign Overall Performance, 2013
$0.56 $0.47
$0.62
$0.37
$0.00$0.10$0.20$0.30$0.40$0.50$0.60$0.70
Desk 1 Desk 2 Desk 3 Mobile
Average Cost Per Like
Average Cost Per Like
$306
2078
737
543 $298
1011 1092
636 $200 433 474 322
$750
2717 2603
2031
$0
$500
$1,000
$1,500
$2,000
$2,500
$3,000
Dollars Spent Actions UniqueClicks PageLikes
Desktop 1
Desktop 2
Desktop 3
Mobile

24
Figure 10. Woodville Deer and Wildlife Festival Facebook Likes Summary, 2013
Figure 11. Top 20 Engagement Results by Towns/Cities Near Woodville, MS, 2013
13 12 8
31
42
53
40
66
5.3 5.2 2.5 2.1 0
10
20
30
40
50
60
70
Desk 1 Desk 2 Desk 3 Mobile
Ad Durations (days)
Likes Per Day
Ad Frequency
0100020003000400050006000700080009000
Woo
dvill
e, M
S
Bato
n Ro
uge,
LA
Nat
chez
, MS
Denh
am S
prin
gs, L
A
Sain
t Fra
ncisv
ille,
LA
Cent
revi
lle, M
S
Broo
khav
en, M
S
New
Orle
ans,
LA
Lafa
yett
e, L
A
Hatt
iesb
urg,
MS
McC
omb,
MS
Zach
ary,
LA
Jack
son,
MS
Bran
don,
MS
New
Iber
ia, L
A
Vick
sbur
g, M
S
Ponc
hato
ula,
LA
Gon
zale
s, L
A
Libe
rty,
MS
Vida
lia, L
A
Engagement Among the Top 20 Towns Near Woodville, MS
Actions Per City

25
Table 6. Experimental Data
Variable Mean Std. Dev. Min Max
Page Likes 56.06 21.97 4 117 Daily Shares 7.62 25.69 0 169 Daily Shares Squared 707.76 3,891.15 0 28,426 Time 10.63 8.03 1 30 T1 DeskCamo 0.21 0.41 0 1 T2 DeskNoCamo 0.19 0.40 0 1 T3 Event Logo 0.13 0.34 0 1 T4 Mobile 0.48 0.50 0 1 Spent 24.66 2.39 6 25 Spent Squared 613.84 75.13 38 625
Table 7. Negative Binomial Regression Model for Page Likes
Page Likes^ Coefficient Robust Std.
Error^^ z P>z [95% Conf. Interval] Constant 1.83 0.26 7.19 0 1.33 2.34 T1DeskCamo* -0.67 0.07 -9.29 0 -0.81 -0.53 T2DeskNoCamo* -0.47 0.08 -5.7 0 -0.63 -0.31 T3EventLogo* -0.83 0.14 -5.97 0 -1.10 -0.56 Daily Shares** -0.01 0.004 -2.36 0.018 -0.01780 -0.00166 Daily Shares Squared* 0.0001 0.00003 2.99 0.003 0.00003 0.0001 Spent*** 0.10 0.05 1.84 0.07 -0.01 0.21 Spent Squared 0.001 0.002 0.34 0.74 -0.003 0.004 Time* -0.03 0.005 -6.64 0 -0.04 -0.02 Overdispersion 0.03 0.01 0.02 0.06 Psuedo R2 0.14
^Page Likes is the dependent variable. ^^Negative Binomial regression model used with corrected standard errors for heteroskedasticity.
*Significant at the 1% level; ** Significant at the 5% level; and ***Significant at the 10% level.